black currant en
TRANSCRIPT

8/2/2019 Black Currant En
http://slidepdf.com/reader/full/black-currant-en 1/36
The sector of blackcurrant in the EU
Olive Oil and Horticultural Products
DG for Agriculture and Rural Development
European Commission
Marc Duponcel

8/2/2019 Black Currant En
http://slidepdf.com/reader/full/black-currant-en 2/36
ENESAD 26 January 2007 2
Organisation of the presentation
1. Soft fruits for processing in the EU
2. Soft fruit production in Poland
3. Blackcurrants

8/2/2019 Black Currant En
http://slidepdf.com/reader/full/black-currant-en 3/36
ENESAD 26 January 2007 3
1
The soft fruit sector in the EU

8/2/2019 Black Currant En
http://slidepdf.com/reader/full/black-currant-en 4/36
ENESAD 26 January 2007 4
Significance in EU agriculture: % of utilised agricultural area (soft fruits and sour cherries)
0,00
0,20
0,40
0,60
0,80
1,00
1,20
A U
B E
C Y
C Z
D K
E E F
I
F R
D E
E L
H U I T
L V
L T
L U
N L
P L
P T
S K
S V
E S
S E
U K
E U - 2 5

8/2/2019 Black Currant En
http://slidepdf.com/reader/full/black-currant-en 5/36
ENESAD 26 January 2007 5
Few production figures on the sector for the EU- 25, average 2002-2004 (‘000 tonnes and percents)
66.1%44643.9%6751 538Total
61.5%14274.5%231310Sour cherries
68.1%4779.3%6987Raspberries
58.4%9082.4%154187Blackcurrants
75.6%16723.2%221954Strawberries
Share ofPoland in EUproductionforprocessing
Productiondirected toprocessingin Poland
Share ofprocessingin total EUproduction
Estimates ofEU productiondirected toprocessing
Total EUproduction

8/2/2019 Black Currant En
http://slidepdf.com/reader/full/black-currant-en 6/36
ENESAD 26 January 2007 6
High growth rate of the sector as measured by total EU imports (intra + extra) of frozen soft fruits
(except cherries)
0
100.000
200.000
300.000
400.000
500.000
600.000
1988 1989 1990 1991 1992 1993 1994 1995 1996 1997 1998 1999 2000 2001 2002 2003 2004 2005
V o l u m e ( t o n n e
s )
0
100.000
200.000
300.000
400.000
500.000
600.000
700.000
800.000
V a l u e ( ' 0 0 0 € )
Volume Value
Average annual growth rate in volume: 6.0%

8/2/2019 Black Currant En
http://slidepdf.com/reader/full/black-currant-en 7/36
ENESAD 26 January 2007 7
Industry dependence on EU-25 imports from third
countries in total supply of raw material
0
10
20
30
40
50
60
Blackcurrants Raspberries Sour cherries Strawberries
% in volume, av. 2002-2004, av. 2002/2003 and 2003/2004 for strawberries

8/2/2019 Black Currant En
http://slidepdf.com/reader/full/black-currant-en 8/36
ENESAD 26 January 2007 8
Breeding research Breeding research is an important asset to maintain the
competitiveness of the soft fruit sector, both on fresh and
processing markets Several factors are becoming increasingly important that imply
breeding research: necessity to adapt to the trend of reductionof use of active substances for pesticides; necessity to paymore attention to consumer and industry preferences;
emerging issues such as global warming which is starting toaffect some areas of production (e.g. for blackcurrants) Examples of recent cultivars that have impacted the economy
of the sector in recent years: Ben types for blackcurrants(released in the last two decades) used in most European
countries, Polka and Polana for raspberries in Poland(released in the 1990s), Camarosa for strawberries (releasedin 1993)
Breeding research is a long term effort, therefore breedingprogrammes need stable sources of funding.

8/2/2019 Black Currant En
http://slidepdf.com/reader/full/black-currant-en 9/36
ENESAD 26 January 2007 9
2
The soft fruit sector in Poland

8/2/2019 Black Currant En
http://slidepdf.com/reader/full/black-currant-en 10/36
ENESAD 26 January 2007 10
Soft fruits and sour cherries represent 5% of totalplant production value and 35% of all fruit production
value Soft fruit bushes and sour cherries represent 25% of
all orchard area
Three voivodships produce 55% of all soft fruits and
sour cherries: Lubelskie (21.1%), Mazowieckie(20.9%) and Łódzkie (11.4%)
The soft fruit sector would provide around 80 000 fulltime jobs
Fragmented production structures: severalthousands of producers, few Producer Organisations(POs) / Producer Groups (PGs)

8/2/2019 Black Currant En
http://slidepdf.com/reader/full/black-currant-en 11/36
ENESAD 26 January 2007 11
Fragmented marketing to the industry: collection centres, fewcontracts
Frozen fruits and vegetables and fruit juices account for
almost 25% of the sales of the fruit and vegetable industry More than 100 plants freeze fruits and vegetables, only
around ten process 20 000 tonnes or more
Considerable storage capacity (allowing exports under spread
delivery contracts) More than 40 plants can produce juice concentrate, some 12
companies focus on coloured juice and two have a 60%market share
Excellent breeding research in currants, raspberries,strawberries and sour cherries (Institute of Pomology andFloriculture of Skierniewice and Experimental Station ofBrzezna)

8/2/2019 Black Currant En
http://slidepdf.com/reader/full/black-currant-en 12/36
ENESAD 26 January 2007 12
3
The blackcurrant sector

8/2/2019 Black Currant En
http://slidepdf.com/reader/full/black-currant-en 13/36
ENESAD 26 January 2007 13
Issues covered on the sector of blackcurrants
I. General considerations
II. Economic cycle of production
III. Recent increase in production and pricecrisis
IV. Structures and marketing to industry
V. Utilisation of blackcurrant by industry andevolution of consumption
VI. Conclusions on the sector

8/2/2019 Black Currant En
http://slidepdf.com/reader/full/black-currant-en 14/36
ENESAD 26 January 2007 14
General considerations
Ribes nigrum is a bushy perennial shrub growing1.5 m in height and develops mainly in colderregions of Europe
Plant maintained for 9-12 years, start production
from 3rd year. Plantations need constant care(pruning, pest and diseases) otherwise productionfalls
Fruit hardly consumed fresh (tart and strong flavour,
astringent), full of C vitamin and other antioxydants Few countries outside Europe produce
blackcurrant: hardly grown in the USA, developingin NZ and reported to develop in China as well
8/2/2019 Black Currant En
http://slidepdf.com/reader/full/black-currant-en 15/36
ENESAD 26 January 2007 15
Specific features of the economy of the blackcurrant sector
Fresh market marginal. Juice industryaccounts for two-thirds of the utilisations
Blackcurrant is a European product. EUtrade with third countries plays no role
Mechanisation (pruning, harvesting) highly
developed. Labour is not critical in cost andcompetitiveness issues.
8/2/2019 Black Currant En
http://slidepdf.com/reader/full/black-currant-en 16/36
ENESAD 26 January 2007 16
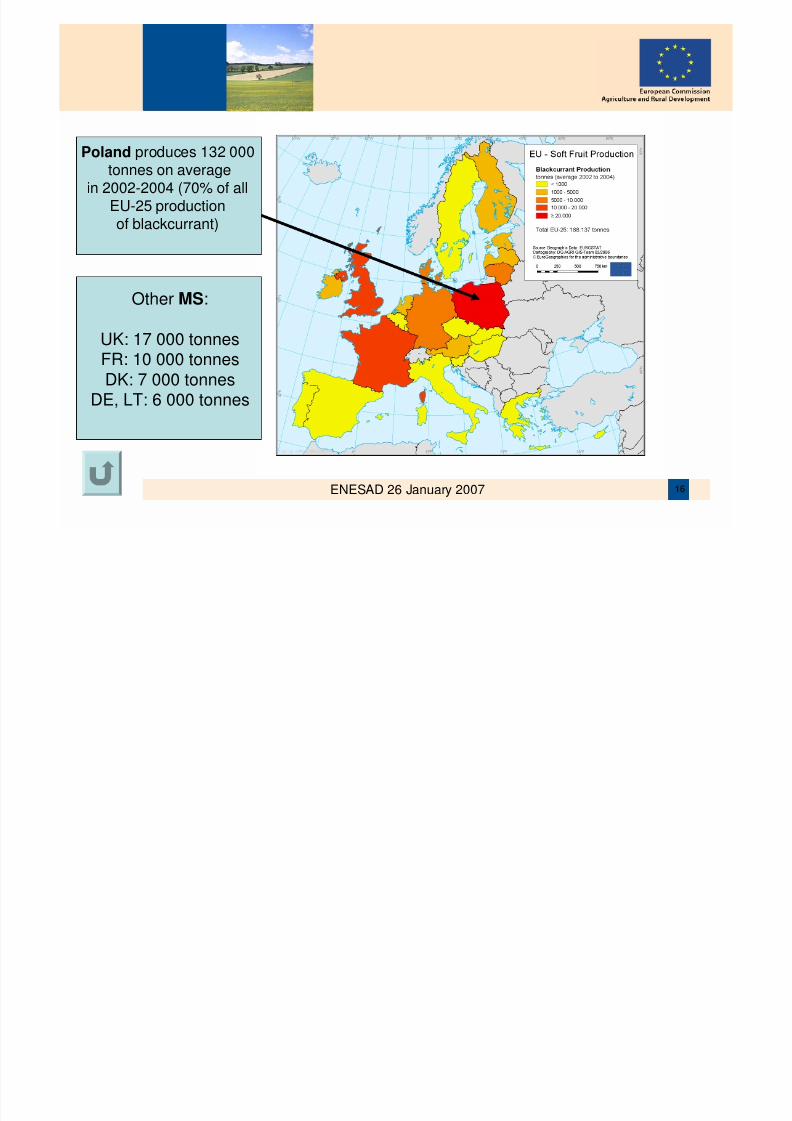
Poland produces 132 000tonnes on average
in 2002-2004 (70% of allEU-25 productionof blackcurrant)
Other MS:
UK: 17 000 tonnesFR: 10 000 tonnes
DK: 7 000 tonnes
DE, LT: 6 000 tonnes

8/2/2019 Black Currant En
http://slidepdf.com/reader/full/black-currant-en 17/36
ENESAD 26 January 2007 17
The blackcurrant production cycle
0
200
400
600
800
1.000
1.200
1.400
1.600
1.800
2.000
76 77 78 79 80 81 82 83 84 85 86 87 88 89 90 91 92 93 94 95 96 97 98 99 00 01 02 03 04 05
Poland Intra EC/EU
Unit values of EC/EU imports of pre-cooled blackcurrants from intra-EC/EU andPoland (ECU/€ per tonne) in period 1976-2005
8/2/2019 Black Currant En
http://slidepdf.com/reader/full/black-currant-en 18/36
ENESAD 26 January 2007 18
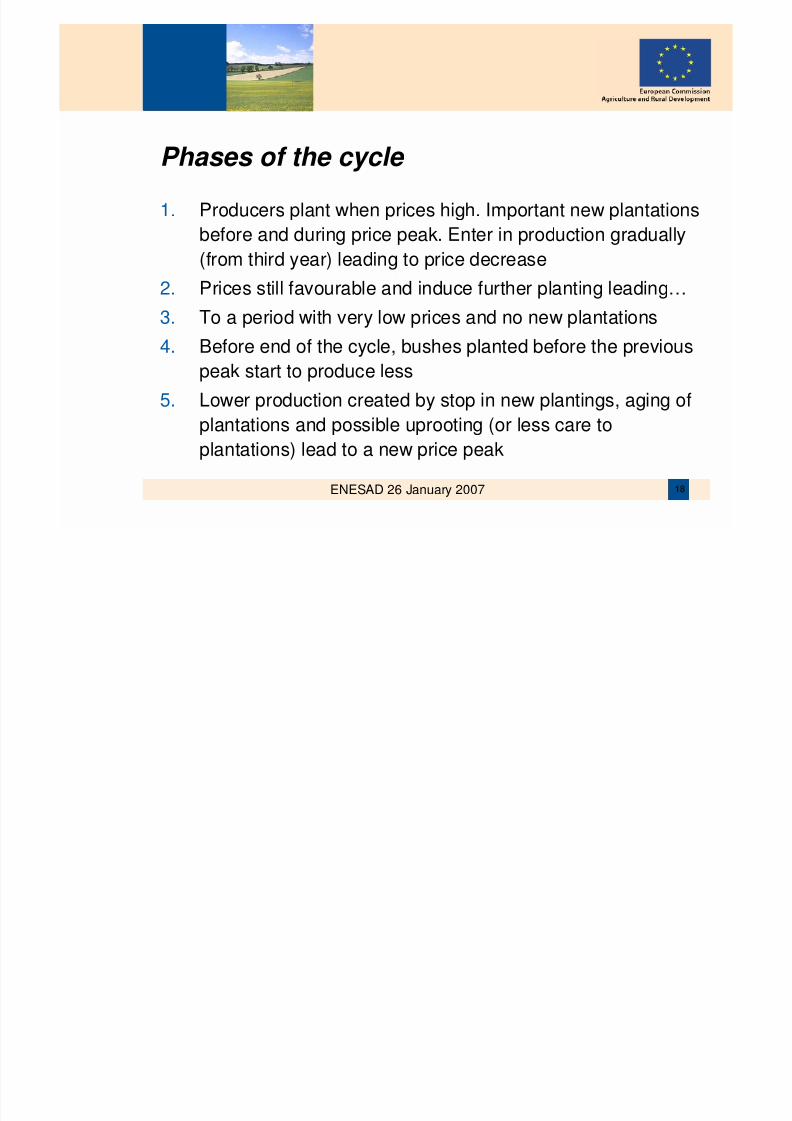
Phases of the cycle
1. Producers plant when prices high. Important new plantations
before and during price peak. Enter in production gradually
(from third year) leading to price decrease
2. Prices still favourable and induce further planting leading…3. To a period with very low prices and no new plantations
4. Before end of the cycle, bushes planted before the previous
peak start to produce less
5. Lower production created by stop in new plantings, aging of
plantations and possible uprooting (or less care to
plantations) lead to a new price peak

8/2/2019 Black Currant En
http://slidepdf.com/reader/full/black-currant-en 19/36
ENESAD 26 January 2007 19
Major causes of the blackcurrant cycle
Fruits only utilised by the industry, fresh market(that could smooth evolutions) barely exists
Delays for new plantations to enter into production
and decline at the end of plantation life accentuatethe cycle
Sector of limited size: variations in areas, that wouldbe considered modest in other sectors, have large
impact Mechanisation in Poland would be responsible for
the shortening of the cycle in the 1990s

8/2/2019 Black Currant En
http://slidepdf.com/reader/full/black-currant-en 20/36
ENESAD 26 January 2007 20
Crisis situation
The crisis is an EU matter since there are noimports from third countries
Increase in area (EU wide) andmodernisation of production (Poland) haverecently boosted production
In 2003 and 2004 overproduction of around40-60 000 tonnes in comparison withindustry needs

8/2/2019 Black Currant En
http://slidepdf.com/reader/full/black-currant-en 21/36
ENESAD 26 January 2007 21
Production and area of blackcurrants
0
50.000
100.000
150.000
200.000
250.000
1996 1997 1998 1999 2000 2001 2002 2003 2004
EU-25 Poland
0
10.000
20.000
30.000
40.000
50.000
60.000
2001 2002 2003 2004
EU-25 Poland
Production(tonnes)
Area (hectares)

8/2/2019 Black Currant En
http://slidepdf.com/reader/full/black-currant-en 22/36
ENESAD 26 January 2007 22
Estimates of supply in blackcurrants
0
50
100
150
200
250
1998 1999 2000 2001 2002 2003 2004
' 0 0 0
t o n n e s
Total supply Total supply to industry Freezing
Concentrate Other processing

8/2/2019 Black Currant En
http://slidepdf.com/reader/full/black-currant-en 23/36
ENESAD 26 January 2007 23
Farm structures: Poland
Small scale production (15 000 ha in 2002 < 1 ha)
Fruit farms with up to several ha of BC (10 000 hawith farms 1-10 ha)
Large specialised farms (up to 400-500 ha of BC): 5000 ha with farms larger than 10 ha
Until 1990 BC developed in small farms, since then
modernisation of the sector and large farms havedeveloped. Farms with less than 1 ha of BC wouldstill produce 40-50 000 tonnes

8/2/2019 Black Currant En
http://slidepdf.com/reader/full/black-currant-en 24/36
ENESAD 26 January 2007 24
Farm structures: other Member States
Denmark: fruit farms
France: farms with other crops such as fruits inRhone valley, vineyards or grains in Burgundy,
grains or fruits in Val de Loire Germany: BC minor crop on farms beside annual
crops (diversification)
Lithuania: rather large farms
United Kingdom: large specialised farms that growalso other crops such as soft fruits, industrial crops,etc. Sector concentrated around about 50 farms

8/2/2019 Black Currant En
http://slidepdf.com/reader/full/black-currant-en 25/36
ENESAD 26 January 2007 25
Marketing to the industry
Level of organisation of the sector: 60-70% in DK,50-70% in FR, two-thirds in DE, 50% in LT, >90% inNL, very low in PL
In the UK individual producers directly contracted tothe industry
DK: mosts sales at market price (2/3 juiceconcentrate, rest IQF and purees). Future of
concentrate in DK? DE: major part concentrate. 2/3 through contracts
without guaranteed price, rest spot market

8/2/2019 Black Currant En
http://slidepdf.com/reader/full/black-currant-en 26/36
ENESAD 26 January 2007 26
Marketing to the industry (cont.): France
Three major uses: a) for liqueur industry; b) juice concentrate; c) preparation of purees(ice-creams) and bit of IQF
AFIDEM annual and pluriannual contractswhich apply to 25-35% of total production.Exports of pre-cooled BC at market price
Contracted quantities have diminished in2005 due to the crisis in the sector

8/2/2019 Black Currant En
http://slidepdf.com/reader/full/black-currant-en 27/36
ENESAD 26 January 2007 27
Marketing to the industry (cont.)
LT: freezing main destination (80%), 50% ofproduction is semi-processed by four cooperatives
NL: All production concentrated in one cooperative.2/3 concentrate, 1/3 IQF. Most production
contracted. Contract with juice industry willterminate in 2008 and not be renewed (concentrateline closed in NL)
UK: largest part processed into concentrate and
contracted to a single processor. Multi-annualcontracts area- and tonnage-based with guaranteedprice. Non contracted areas have diminished
8/2/2019 Black Currant En
http://slidepdf.com/reader/full/black-currant-en 28/36
ENESAD 26 January 200728
Marketing to the industry (cont.): Poland
Small farmers sell through collection points
Sector not organised
Large farmers sell directly to industry
Always market prices
Around 30 000 tonnes semi-processed intoIQF. Use of BC for oroduction ofconcentrate has more than doubled: from 25000 to 65 000 tonnes

8/2/2019 Black Currant En
http://slidepdf.com/reader/full/black-currant-en 29/36
ENESAD 26 January 200729
Location of the semi-processing at European level and implications
Traditionally BC grown in different MS with semi-processing industry in same or neighbouring MS
However significant evolution of the industry since
the 1990s: semi-processing capacity has increasedtremendously in Poland and some firms haveclosed plants in EU-15 MS
In addition, current low prices make it unprofitableto export pre-cooled blackcurrant for semi-processing in another MS

8/2/2019 Black Currant En
http://slidepdf.com/reader/full/black-currant-en 30/36
ENESAD 26 January 200730
Levels of industry needs
Balanced production at EU level with 140-160 000 tonnes and total supply to industryat around 120-130 000 tonnes: 35 000
tonnes to freezing and 80 000 tonnes toconcentrate
In 2003 and 2004 over-supply of around 40-
60 000 tonnes

8/2/2019 Black Currant En
http://slidepdf.com/reader/full/black-currant-en 31/36
ENESAD 26 January 200731
Industrial utilisations
Fruit juices, drinks, syrups, soft fruits utilising BCconcentrate (65°brix), single-strength and purees.around 80 000 tonnes
Jam and jellies, utilising IQF BC 15 000 tonnes?
Alcoholic drinks and liqueurs. Few ‘000 tonnes
Fruit preparations for incoroporation in ice creams
(and little in fresh dairy products): 5 000 tonnes? Minor part of IQF BC utilised by households and
catering industry

8/2/2019 Black Currant En
http://slidepdf.com/reader/full/black-currant-en 32/36
ENESAD 26 January 200732
Evolution of products: drinks
BC juice consumption (UK, DE, PL)stagnant of decreasing to the benefit ofother drinks (e.g. orange juice in Poland,
cranberry juice and others in the UnitedKingdom)
Large product innovation in the fruit-based
drinks industry: smoothies, etc. BC-based drinks appear as old products
(« of my GrandMa »)

8/2/2019 Black Currant En
http://slidepdf.com/reader/full/black-currant-en 33/36
ENESAD 26 January 200733
Evolution of products: crème de cassis
Production of crème de cassis down from165 000 hl in 2000 to 145 000 in 2003
Around 4-5 000 tonnes of BC (Noir de
Bourgogne and Blackdown )
Moderate declining trend of the market
Increase of competition and hard discountwould entail lower levels of use of BC as araw material

8/2/2019 Black Currant En
http://slidepdf.com/reader/full/black-currant-en 34/36
ENESAD 26 January 200734
The major cause of the difficulties faced bythe blackcurrant sector in the last years isclearly overproduction (since 2003)
Crisis amplified by dynamism of Polishproduction
Fragmented supply chain in Poland plays
also a role Sluggish consumer demand
Product innovation reported low in the sector
Summary of major problems of the sector
8/2/2019 Black Currant En
http://slidepdf.com/reader/full/black-currant-en 35/36
ENESAD 26 January 200735
Possible solutions?
Better organisation of the sector in Polandwould improve its command on the growthof production and contribute to a better
stability of the sector at EU level
Product innovation / fostering consumptionbetter communication on positive features of
the fruits

8/2/2019 Black Currant En
http://slidepdf.com/reader/full/black-currant-en 36/36
ENESAD 26 January 200736
Existing tools:
– Support to Producer
Organisations/Producer Groups – Rural development measures
EU promotional programmes
Better monitoring of markets at EU level(regular expert meetings)
EU tools for strengthening the supply chains and supporting consumption