identification of flavonoid and phenolic antioxidants in...
TRANSCRIPT
pubs.acs.org/JAFCPublished on Web 12/15/2009© 2009 American Chemical Society
J. Agric. Food Chem. 2010, 58, 3901–3909 3901
DOI:10.1021/jf902263n
Identification of Flavonoid and Phenolic Antioxidants in BlackCurrants, Blueberries, Raspberries, Red Currants, and
Cranberries†
GINA BORGES, ALEXANDRA DEGENEVE, WILLIAM MULLEN, AND ALAN CROZIER*
Plant Products and Human Nutrition Group, Graham Kerr Building, Division of Ecology andEnvironmental Biology, Faculty of Biomedical and Life Sciences, University of Glasgow,
Glasgow G12 8QQ, United Kingdom
The antioxidant capacity (AOC) of black currant, blueberry, raspberry, red currant, and cranberry
extracts was determined using the FRAP assay. In addition, the vitamin C content of the berries was
determined and phenolic and polyphenolic compounds in the extracts were analyze by reversed-
phase HPLC-PDA-MS3 and by reversed-phase HPLC-PDA with an online antioxidant detection
system. A complex spectrum of anthocyanins was the major contributor to the AOC of black
currants and blueberries, whereas the lower AOC of red currants and cranberries was due mainly to
a reduced anthocyanin content. Raspberries also had a lower anthocyanin content than black
currants and blueberries, but there was only a slight decline in the AOC because of the presence of
the ellagitannins sanguin H-6 and lambertianin C, which were responsible for 58% of the HPLC-
AOC of the berries. Vitamin C was responsible for 18-23% of the HPLC-AOC of black currants, red
currants, and cranberries and for 11% of that of raspberries but did not contribute to the AOC of the
blueberry extract that was examined. Seven percent of the HPLC-AOC of the cranberry extract was
attributable to procyanidin dimers. However, the contribution of polymeric proanthocyanidins to the
AOC of the five berries was not determined as when analyzed by reversed-phase HPLC these high
molecular weight flavan-3-ols are either retained by the column or eluted as a broad unresolved
band.
KEYWORDS: Berries; flavonoids; phenolics; HPLC-MS3 and online antioxidant detection
INTRODUCTION
Dietary patterns characterized by relatively high intakes offruits and vegetables are consistently associated with reductionsin the incidence of noncommunicable diseases such as coronaryheart disease, stroke, cancer, and various chronic disease (1). LawandMorris (2), for instance, carried out a meta-analysis combin-ing the results of 11 prospective cohort studies and found thatpeople eating ∼5 or more 80 g servings/day of fruits andvegetables had a reduced risk of myocardial infarction that wasabout 15% lower than that of those consuming<5servings daily.A further study reported that consumption of 600 g of fruits andvegetables per day can decrease the risk of coronary heart diseaseby 31% and ischemic stroke by 19% (3).
Fruits and vegetables contain several health-promoting factorsincluding fiber and high concentrations of phenolic acids, flavo-noids, vitamins, and minerals. Phenolic acids and flavonoids arephytochemicals that, although not essential for survival, mayover the long term be one of the factors that contribute to theprotective effects of a fruit- and vegetable-rich diet. The phenolicacids potentially involved in these beneficial effects include gallic
acid and hydroxycinnamates including coumaric acid, caffeicacid, and derivatives such as chlorogenic acid (4). The mainflavonoids of interest are anthocyanins, flavan-3-ols, and theirpolymeric condensation products, flavanones, flavonols, andflavones (4). To varying degrees these compounds are potentantioxidants in vitro (5), being able to inhibit lipid peroxida-tion (6) andprotect low-density lipoproteinsagainst oxidation (7).They can also reduce platelet aggregation (8) and enhancevasodilation (9).
There is only extremely limited evidence on the relative
protective efficacy of specific fruits and vegetables. However, in
this context, berries are of interest as a result of a study in FinlandbyKnekt et al. (10) in which the intake of berries, alongside other
factors, was associated with a 60% decline in heart disease
and stroke. A high consumption of berries is a particular featureof the Finnish diet (11). Berries, including raspberries, blue-
berries, black currants, red currants, and cranberries, are a rich
source of dietary antioxidants (12,13). In this paper we report the
total antioxidant capacity (AOC) of these berries and, throughthe use of HPLC-PDA-MS3 and HPLC-PDA with an online
antioxidant detection system, the extent to which vitamin C,
phenolic compounds, and flavonoids contribute to the AOC ofthe different fruits.
†Part of the Berry Health Symposium 2009.*Corresponding author (telephone þ44-141-330-4613; fax þ44-
141-330-5394; e-mail [email protected]).
3902 J. Agric. Food Chem., Vol. 58, No. 7, 2010 Borges et al.
MATERIALS AND METHODS
Berries. Blueberries (Vaccinium corymbosum), cranberries (Vacciniumoxycoccus), raspberries (Rubus idaeus), black currants (Ribes nigrum), andred currants (Ribes rubrum) were purchased from supermarkets in the westend of Glasgow. Samples weighing 5 g were extracted with 10 mL ofmethanol/formic acid (99:1, v/v) using an Ultra-Turrax T25 homogenizer(IKA Werke, Staufen, Germany) for 1 min and centrifuged for 20 min at4000g. The pellets were re-extracted, and supernatants were pooled beforebeing reduced todryness in vacuo. The residueswere resuspended in 10mLof methanol/formic acid (99:1, v/v). Aliquots were stored at-80 �C priorto analysis.
Chemicals. Methanol and acetonitrile were obtained from RathburnChemicals (Walkerburn, Scotland). Anthocyanins, (þ)-catechin, (-)-epicatechin, quercetin-3-glucoside, myricetin, ellagic acid, kaempferol-3-glucoside, hydroxybenzoic acid, β-carotene, R-tocopherol, Trolox, andgallic acid were purchased from Extrasynthese (Genay, France), whereasascorbic acid,metaphosporic acid, ferrous sulfate, ferrous chloride, TPTZ,Folin reagent, homocysteine, sodium acetate, myristyltrimethylammo-nium bromide, sodium hydroxide, and ferric ammonium sulfate wereobtained from Sigma (Poole, Dorset, U.K.). ABTS diammonium salt wasprovided by Merck (Darmstadt, Germany). EDTA and acetic acid werefrom BDH Chemicals Ltd. (Poole, U.K.), sodium carbonate was fromRiedel de Haehn GmbH (Seelze, Germany), and formic and acetic acidwere obtained from Fisher Scientific (Loughborough, U.K.).
Antioxidant Assays. The AOC of the berry extracts was measuredusing the ferric reducing antioxidant power (FRAP) assay (14).
HPLC-PDA-MS2. Samples were analyzed on a Surveyor HPLCsystem comprising a HPLC pump, a PDA detector, scanning from 250 to700 nm, and an autosampler cooled to 4 �C (Thermo Fisher Corp., SanJose, CA). Analyses were carried out at 40 �C using a 250� 4.6 mm i.d., 4μm, Synergi RP-Max column (Phenomenex, Macclesfield, U.K.) elutedwith a 60min gradient of 5-25%acetonitrile in 1%aqueous formic acid ata flow rate of 1.0 mL/min. After passing through the flow cell of the PDAdetector, the column eluate split and 0.2 mL/min was directed to an LCQ
Advantage ion trapmass spectrometer fittedwith an electrospray interface(Thermo Fisher Corp.). Analyses utilized both the negative and positiveionmodes. Samples were analyzed in themass spectrometer using full-scandata-dependent MS2 scanning from m/z 100 to 2000. Capillary tempera-ture was 150 �C, sheath gas and auxiliary gas were 40 and 20 units,respectively, and the source voltage was 3 kV. Compounds that could notbe identified byMS2were further fragmented to produceMS3 spectra. Thesystem was controlled by Xcalibur software (Thermo Fisher Corp.).
For quantification purposes, all phenolic acids were expressed as4-hydroxybenzoic acid, caffeic acid, or 5-O-caffeoylquinic acid equiva-lents; all flavan-3-ols and their polymers as (-)-epicatechin equivalents;anthocyanins conjugates as cyanidin-3-glucoside equivalents, quercetinconjugates as quercetin-3-glucoside or quercetin-3-rutinoside equivalents;kaempferol conjugates as kaempferol-3-glucoside equivalents; myricetinconjugates as myricetin equivalents; ellagic acid conjugates as ellagic acidequivalents; and ellagitannins as gallic acid equivalents.
HPLC-PDA-with Online Antioxidant Detection. The antioxidantactivity of individual HPLC peaks was measured using an online HPLCantioxidant detector system (15) based on theTEACassay ofRe et al. (16).Antioxidants in the HPLC eluate react postcolumn with preformedABTS•þ, and the induced bleaching is measured as a negative peak at720 nm. The stock solution ofABTS•þwasmade by adding 0.5mL of a 70mM K2S2O8 solution to 50 mL of 2 mM ABTS. The mixture was storedovernight in the darkness at room temperature to convert ABTS to
Table 1. Total Antioxidant Activity of Berries Measured by FRAP Assaysa
berry FRAP (μmol of Fe2þ/g)
black currants 51.6( 1.2
blueberries 30.0( 1.9
raspberries 27.7( 1.1
red currants 24.6( 0.5
cranberries 18.6( 0.3
aData presented as mean values ( SE (n = 3) per gram of fresh weight.
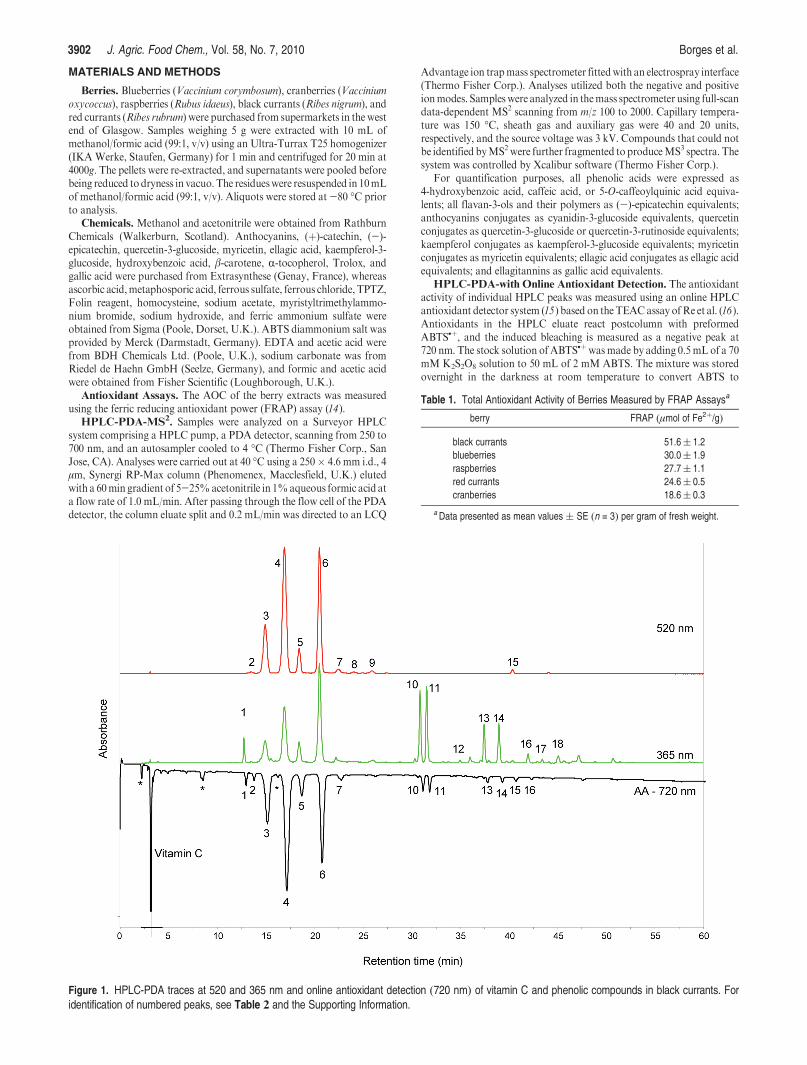
Figure 1. HPLC-PDA traces at 520 and 365 nm and online antioxidant detection (720 nm) of vitamin C and phenolic compounds in black currants. Foridentification of numbered peaks, see Table 2 and the Supporting Information.
Article J. Agric. Food Chem., Vol. 58, No. 7, 2010 3903
ABTS•þ. This ABTS•þ stock solution was then mixed with 0.1 Mphosphate buffer (1:8, v/v) and adjusted to pH 8.0. The HPLC-PDAsystemusedwas as described in the previous section.After passing throughthe flow cell of the PDA detector, column mobile phase was directed to a“T”, where it was mixed with the ABTS•þ solution delivered at a flow rateof 0.5 mL/min by a LC-10-ADVP pump connected to a vacuum degasser(Shimadzu, Kyoto, Japan). The mixture then passed through a 1.5 m �0.4 mm loop, after which absorbance was measured at 720 nm (NemphlarBioscience, Lanark, U.K.). The antioxidant potential of HPLC peaks,expressed as Trolox equivalent antioxidant capacity (TEAC), was quanti-fied by reference to a 10-400 μmol of Trolox standard calibration curve.
Analysis of Vitamin C. Vitamin C was analyzed by HPLC using aNucleosil ODS 5mm, 250� 4.6 mm (i.d.), column eluted isocratically at aflow rate of 0.6 mL/min with amobile phase at 30 �C comprising 0.05mMsodium hydroxide, 25 mM myristyltrimethylammonium bromide, and60 mM acetic acid in 7.5% aqueous acetonitrile containing 100 mg/Lhomocysteine and 200 mg/L EDTA. Detection was at 262 nm (17).
RESULTS
Total FRAP Antioxidant Activities. The total AOCs were highfor all five berries (Table 1). Overall, black currants, blueberries, andraspberries had the highest AOCwith lower values obtained for redcurrants and cranberries. Moyer et al. (18) report FRAP valuesranging from18.5 to 61.4μmolofFe2þ/g and from13.1 to45.2μmolof Fe2þ/g for blueberries and raspberries, respectively. The levelsobtained by FRAP assay for blueberries and raspberries presentedinTable 1, 30.0 and 27.7 μmol of Fe2þ/g, respectively, are in keepingwith these figures, although the overall AOC of individual producewill undoubtedly vary due to numerous factors including variety,degree of ripeness, season, and storage conditions.
Black Currants. HPLC-PDA analysis at 520 and 365 nm(Figure 1) revealed 18 peaks in the black currant extract, whichwere identified on the basis of their MS fragmentation profiles(Table 2, also see Supporting Information). Eleven delphinidin-,cyanidin-, malvidin-, petunidin-, and peonidin-based anthocya-nins were detected, with the main components being delphinidin-3-O-glucoside (peak3, 839 nmol/g of freshweight), delphinidin-3-O-rutinoside (peak 4, 2233 nmol/g), and cyanidin-3-O-rutinose(peak 6, 1693 nmol/g). In addition to anthocyanins, the blackcurrants contained vitamin C (2328 nmol/g) and smaller quan-tities of a caffeic acid-O-glucoside and several kaempferol andquercetin conjugates (Table 2). HPLC with online antioxidant
detection revealed that the three main anthocyanins, along withvitamin C, were the major contributors to the AOC of the extractwith delphinidin-3-O-rutinoside accounting for 32.8% of thetotal activity (Figure 1; Table 2). The flavonols myricetin-3-O-rutinoside (peak 10) and myricetin-3-O-glucuronide (peak 11)were each responsible for 1.9% of the total AOC, with thequercetin and kaempferol and quercetin conjugates making, atbest, a minimal contribution (Table 2).
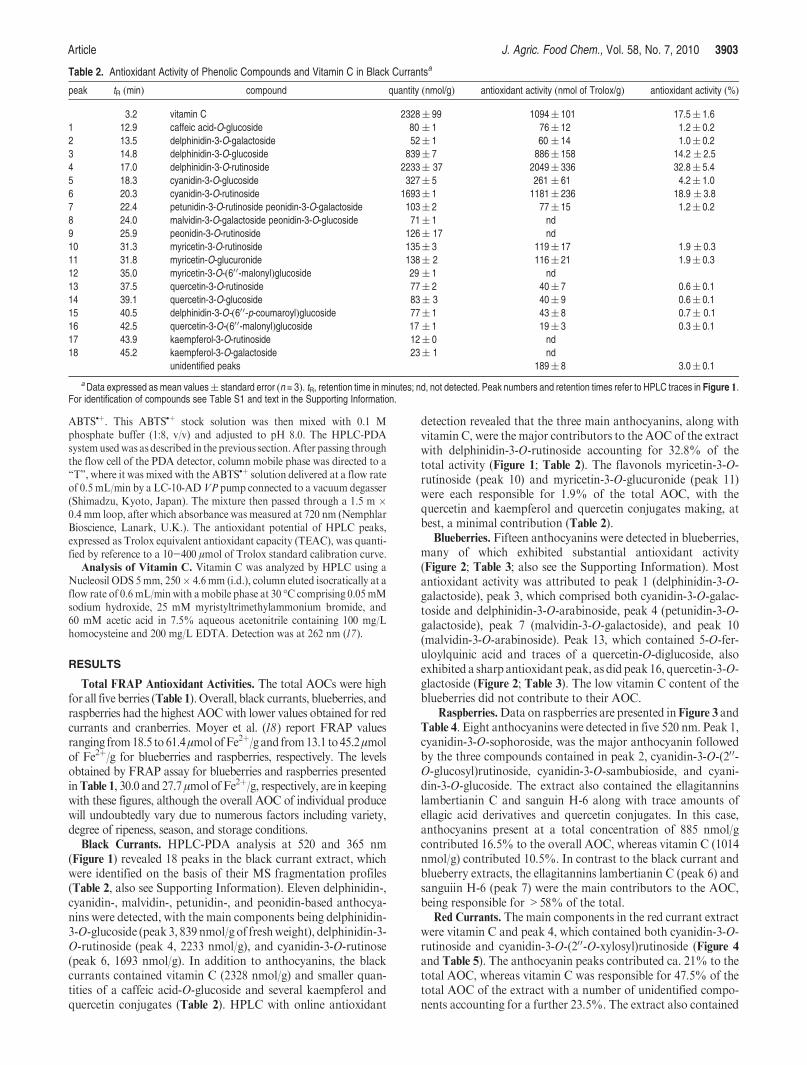
Blueberries. Fifteen anthocyanins were detected in blueberries,many of which exhibited substantial antioxidant activity(Figure 2; Table 3; also see the Supporting Information). Mostantioxidant activity was attributed to peak 1 (delphinidin-3-O-galactoside), peak 3, which comprised both cyanidin-3-O-galac-toside and delphinidin-3-O-arabinoside, peak 4 (petunidin-3-O-galactoside), peak 7 (malvidin-3-O-galactoside), and peak 10(malvidin-3-O-arabinoside). Peak 13, which contained 5-O-fer-uloylquinic acid and traces of a quercetin-O-diglucoside, alsoexhibited a sharp antioxidant peak, as did peak16, quercetin-3-O-glactoside (Figure 2; Table 3). The low vitamin C content of theblueberries did not contribute to their AOC.
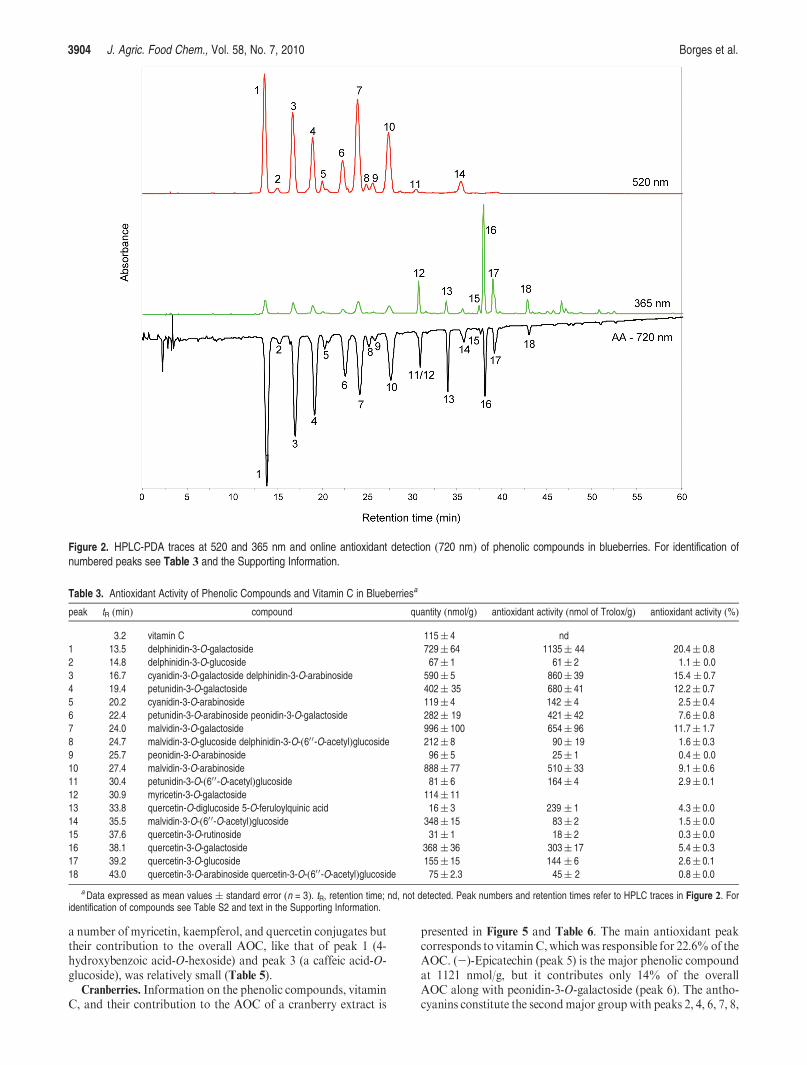
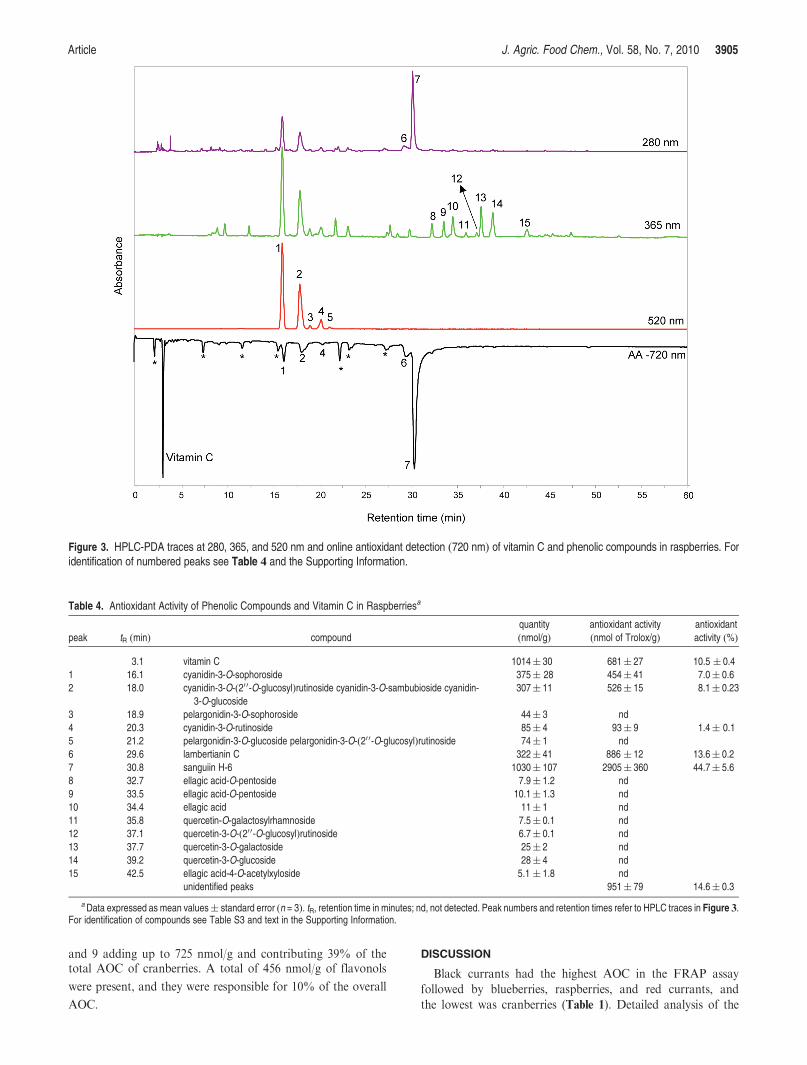
Raspberries.Data on raspberries are presented inFigure 3 andTable 4. Eight anthocyanins were detected in five 520 nm. Peak 1,cyanidin-3-O-sophoroside, was the major anthocyanin followedby the three compounds contained in peak 2, cyanidin-3-O-(20 0-O-glucosyl)rutinoside, cyanidin-3-O-sambubioside, and cyani-din-3-O-glucoside. The extract also contained the ellagitanninslambertianin C and sanguin H-6 along with trace amounts ofellagic acid derivatives and quercetin conjugates. In this case,anthocyanins present at a total concentration of 885 nmol/gcontributed 16.5% to the overall AOC, whereas vitamin C (1014nmol/g) contributed 10.5%. In contrast to the black currant andblueberry extracts, the ellagitannins lambertianin C (peak 6) andsanguiin H-6 (peak 7) were the main contributors to the AOC,being responsible for >58% of the total.
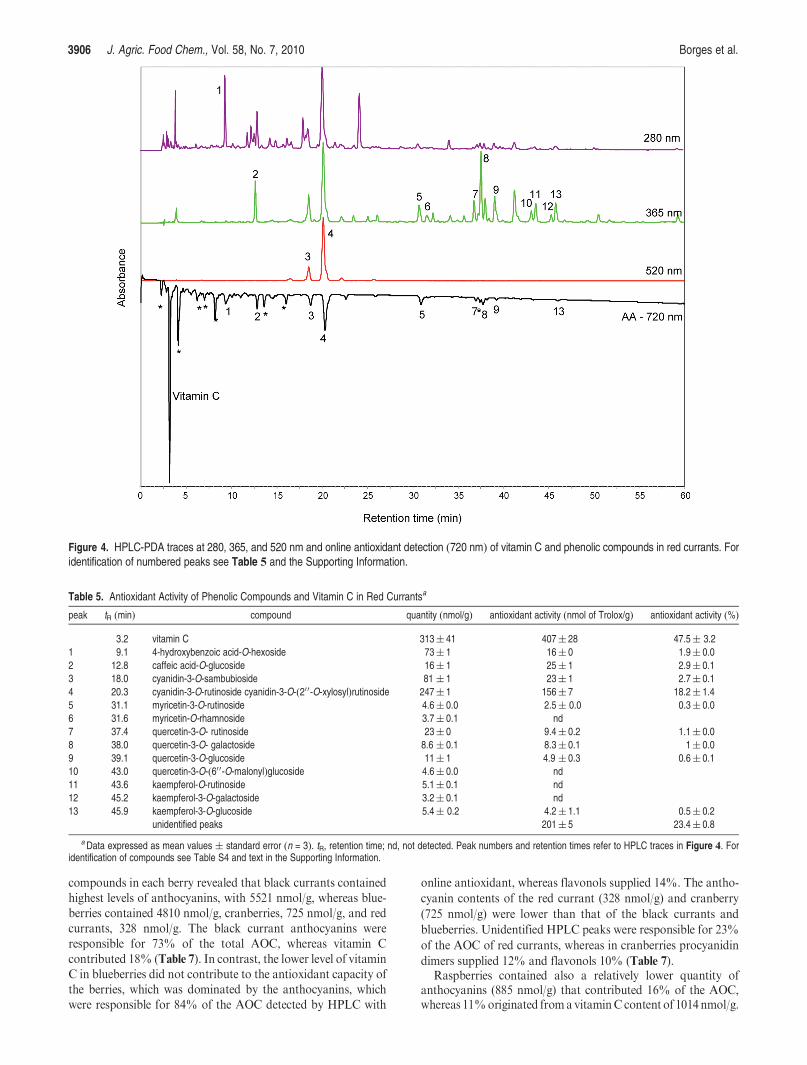
Red Currants. The main components in the red currant extractwere vitamin C and peak 4, which contained both cyanidin-3-O-rutinoside and cyanidin-3-O-(200-O-xylosyl)rutinoside (Figure 4
and Table 5). The anthocyanin peaks contributed ca. 21% to thetotal AOC, whereas vitamin C was responsible for 47.5% of thetotal AOC of the extract with a number of unidentified compo-nents accounting for a further 23.5%. The extract also contained
Table 2. Antioxidant Activity of Phenolic Compounds and Vitamin C in Black Currantsa
peak tR (min) compound quantity (nmol/g) antioxidant activity (nmol of Trolox/g) antioxidant activity (%)
3.2 vitamin C 2328( 99 1094( 101 17.5( 1.6
1 12.9 caffeic acid-O-glucoside 80 ( 1 76( 12 1.2( 0.2
2 13.5 delphinidin-3-O-galactoside 52( 1 60 ( 14 1.0( 0.2
3 14.8 delphinidin-3-O-glucoside 839( 7 886( 158 14.2 ( 2.5
4 17.0 delphinidin-3-O-rutinoside 2233( 37 2049( 336 32.8( 5.4
5 18.3 cyanidin-3-O-glucoside 327( 5 261 ( 61 4.2( 1.0
6 20.3 cyanidin-3-O-rutinoside 1693( 1 1181( 236 18.9 ( 3.8
7 22.4 petunidin-3-O-rutinoside peonidin-3-O-galactoside 103( 2 77( 15 1.2( 0.2
8 24.0 malvidin-3-O-galactoside peonidin-3-O-glucoside 71( 1 nd
9 25.9 peonidin-3-O-rutinoside 126( 17 nd
10 31.3 myricetin-3-O-rutinoside 135( 3 119( 17 1.9 ( 0.3
11 31.8 myricetin-O-glucuronide 138( 2 116( 21 1.9( 0.3
12 35.0 myricetin-3-O-(60 0-malonyl)glucoside 29 ( 1 nd
13 37.5 quercetin-3-O-rutinoside 77( 2 40( 7 0.6( 0.1
14 39.1 quercetin-3-O-glucoside 83( 3 40( 9 0.6( 0.1
15 40.5 delphinidin-3-O-(60 0-p-coumaroyl)glucoside 77( 1 43( 8 0.7( 0.1
16 42.5 quercetin-3-O-(60 0-malonyl)glucoside 17 ( 1 19( 3 0.3( 0.1
17 43.9 kaempferol-3-O-rutinoside 12( 0 nd
18 45.2 kaempferol-3-O-galactoside 23( 1 nd
unidentified peaks 189( 8 3.0( 0.1
aData expressed as mean values( standard error (n = 3). tR, retention time in minutes; nd, not detected. Peak numbers and retention times refer to HPLC traces in Figure 1.For identification of compounds see Table S1 and text in the Supporting Information.
3904 J. Agric. Food Chem., Vol. 58, No. 7, 2010 Borges et al.
a number of myricetin, kaempferol, and quercetin conjugates buttheir contribution to the overall AOC, like that of peak 1 (4-hydroxybenzoic acid-O-hexoside) and peak 3 (a caffeic acid-O-glucoside), was relatively small (Table 5).
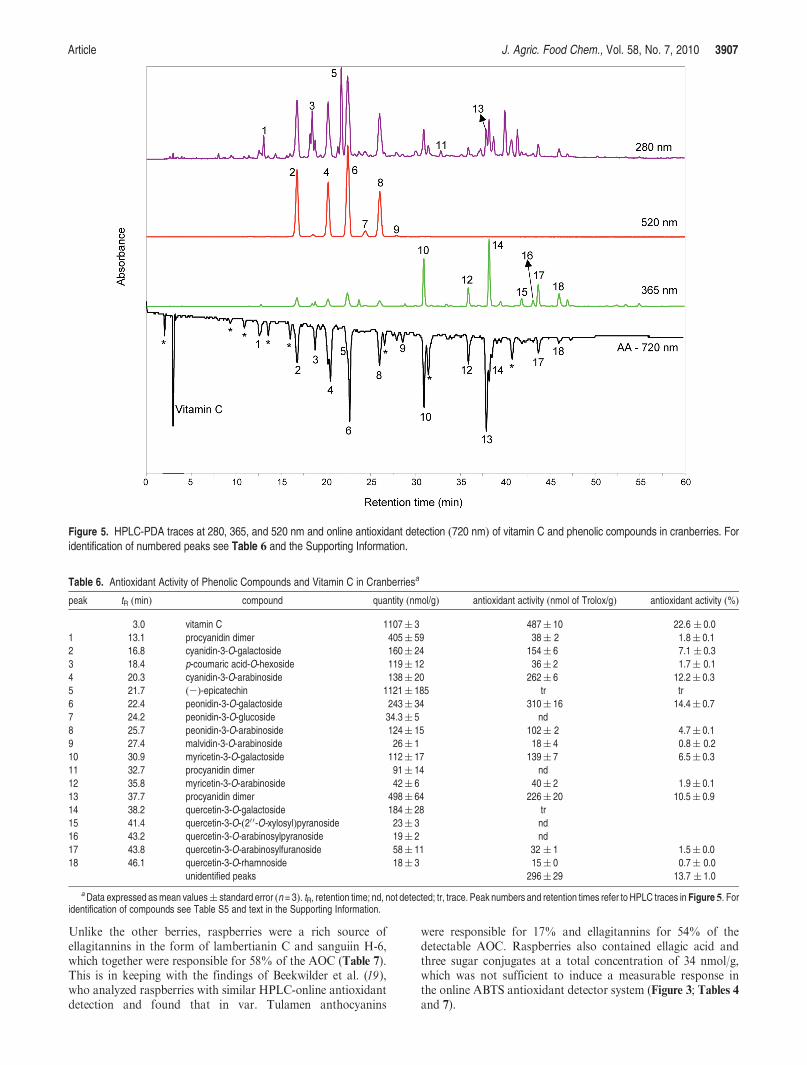
Cranberries. Information on the phenolic compounds, vitaminC, and their contribution to the AOC of a cranberry extract is
presented in Figure 5 and Table 6. The main antioxidant peakcorresponds to vitaminC,whichwas responsible for 22.6%of theAOC. (-)-Epicatechin (peak 5) is the major phenolic compoundat 1121 nmol/g, but it contributes only 14% of the overallAOC along with peonidin-3-O-galactoside (peak 6). The antho-cyanins constitute the secondmajor group with peaks 2, 4, 6, 7, 8,
Figure 2. HPLC-PDA traces at 520 and 365 nm and online antioxidant detection (720 nm) of phenolic compounds in blueberries. For identification ofnumbered peaks see Table 3 and the Supporting Information.
Table 3. Antioxidant Activity of Phenolic Compounds and Vitamin C in Blueberriesa
peak tR (min) compound quantity (nmol/g) antioxidant activity (nmol of Trolox/g) antioxidant activity (%)
3.2 vitamin C 115( 4 nd
1 13.5 delphinidin-3-O-galactoside 729( 64 1135( 44 20.4( 0.8
2 14.8 delphinidin-3-O-glucoside 67( 1 61( 2 1.1( 0.0
3 16.7 cyanidin-3-O-galactoside delphinidin-3-O-arabinoside 590( 5 860( 39 15.4 ( 0.7
4 19.4 petunidin-3-O-galactoside 402( 35 680( 41 12.2( 0.7
5 20.2 cyanidin-3-O-arabinoside 119( 4 142 ( 4 2.5( 0.4
6 22.4 petunidin-3-O-arabinoside peonidin-3-O-galactoside 282( 19 421( 42 7.6( 0.8
7 24.0 malvidin-3-O-galactoside 996( 100 654( 96 11.7( 1.7
8 24.7 malvidin-3-O-glucoside delphinidin-3-O-(60 0-O-acetyl)glucoside 212( 8 90( 19 1.6( 0.3
9 25.7 peonidin-3-O-arabinoside 96( 5 25( 1 0.4( 0.0
10 27.4 malvidin-3-O-arabinoside 888( 77 510( 33 9.1( 0.6
11 30.4 petunidin-3-O-(60 0-O-acetyl)glucoside 81( 6 164( 4 2.9( 0.1
12 30.9 myricetin-3-O-galactoside 114( 11
13 33.8 quercetin-O-diglucoside 5-O-feruloylquinic acid 16( 3 239 ( 1 4.3( 0.0
14 35.5 malvidin-3-O-(60 0-O-acetyl)glucoside 348( 15 83( 2 1.5( 0.0
15 37.6 quercetin-3-O-rutinoside 31( 1 18( 2 0.3( 0.0
16 38.1 quercetin-3-O-galactoside 368 ( 36 303( 17 5.4( 0.3
17 39.2 quercetin-3-O-glucoside 155( 15 144 ( 6 2.6( 0.1
18 43.0 quercetin-3-O-arabinoside quercetin-3-O-(60 0-O-acetyl)glucoside 75( 2.3 45( 2 0.8( 0.0
aData expressed as mean values ( standard error (n = 3). tR, retention time; nd, not detected. Peak numbers and retention times refer to HPLC traces in Figure 2. Foridentification of compounds see Table S2 and text in the Supporting Information.
Article J. Agric. Food Chem., Vol. 58, No. 7, 2010 3905
and 9 adding up to 725 nmol/g and contributing 39% of thetotal AOC of cranberries. A total of 456 nmol/g of flavonols
were present, and they were responsible for 10% of the overall
AOC.
DISCUSSION
Black currants had the highest AOC in the FRAP assay
followed by blueberries, raspberries, and red currants, and
the lowest was cranberries (Table 1). Detailed analysis of the
Figure 3. HPLC-PDA traces at 280, 365, and 520 nm and online antioxidant detection (720 nm) of vitamin C and phenolic compounds in raspberries. Foridentification of numbered peaks see Table 4 and the Supporting Information.
Table 4. Antioxidant Activity of Phenolic Compounds and Vitamin C in Raspberriesa
peak tR (min) compound
quantity
(nmol/g)
antioxidant activity
(nmol of Trolox/g)
antioxidant
activity (%)
3.1 vitamin C 1014( 30 681( 27 10.5 ( 0.4
1 16.1 cyanidin-3-O-sophoroside 375( 28 454( 41 7.0( 0.6
2 18.0 cyanidin-3-O-(20 0-O-glucosyl)rutinoside cyanidin-3-O-sambubioside cyanidin-3-O-glucoside
307( 11 526( 15 8.1( 0.23
3 18.9 pelargonidin-3-O-sophoroside 44( 3 nd
4 20.3 cyanidin-3-O-rutinoside 85( 4 93( 9 1.4( 0.1
5 21.2 pelargonidin-3-O-glucoside pelargonidin-3-O-(20 0-O-glucosyl)rutinoside 74( 1 nd
6 29.6 lambertianin C 322( 41 886 ( 12 13.6( 0.2
7 30.8 sanguiin H-6 1030( 107 2905( 360 44.7( 5.6
8 32.7 ellagic acid-O-pentoside 7.9( 1.2 nd
9 33.5 ellagic acid-O-pentoside 10.1( 1.3 nd
10 34.4 ellagic acid 11( 1 nd
11 35.8 quercetin-O-galactosylrhamnoside 7.5( 0.1 nd
12 37.1 quercetin-3-O-(20 0-O-glucosyl)rutinoside 6.7( 0.1 nd
13 37.7 quercetin-3-O-galactoside 25( 2 nd
14 39.2 quercetin-3-O-glucoside 28( 4 nd
15 42.5 ellagic acid-4-O-acetylxyloside 5.1 ( 1.8 nd
unidentified peaks 951( 79 14.6( 0.3
aData expressed as mean values( standard error (n = 3). tR, retention time in minutes; nd, not detected. Peak numbers and retention times refer to HPLC traces in Figure 3.For identification of compounds see Table S3 and text in the Supporting Information.
3906 J. Agric. Food Chem., Vol. 58, No. 7, 2010 Borges et al.
compounds in each berry revealed that black currants contained
highest levels of anthocyanins, with 5521 nmol/g, whereas blue-
berries contained 4810 nmol/g, cranberries, 725 nmol/g, and red
currants, 328 nmol/g. The black currant anthocyanins were
responsible for 73% of the total AOC, whereas vitamin C
contributed 18% (Table 7). In contrast, the lower level of vitamin
C in blueberries did not contribute to the antioxidant capacity of
the berries, which was dominated by the anthocyanins, which
were responsible for 84% of the AOC detected by HPLC with
online antioxidant, whereas flavonols supplied 14%. The antho-
cyanin contents of the red currant (328 nmol/g) and cranberry
(725 nmol/g) were lower than that of the black currants and
blueberries. Unidentified HPLC peaks were responsible for 23%
of the AOC of red currants, whereas in cranberries procyanidin
dimers supplied 12% and flavonols 10% (Table 7).Raspberries contained also a relatively lower quantity of
anthocyanins (885 nmol/g) that contributed 16% of the AOC,whereas 11%originated fromavitaminC content of 1014 nmol/g.
Figure 4. HPLC-PDA traces at 280, 365, and 520 nm and online antioxidant detection (720 nm) of vitamin C and phenolic compounds in red currants. Foridentification of numbered peaks see Table 5 and the Supporting Information.
Table 5. Antioxidant Activity of Phenolic Compounds and Vitamin C in Red Currantsa
peak tR (min) compound quantity (nmol/g) antioxidant activity (nmol of Trolox/g) antioxidant activity (%)
3.2 vitamin C 313( 41 407( 28 47.5( 3.2
1 9.1 4-hydroxybenzoic acid-O-hexoside 73( 1 16( 0 1.9( 0.0
2 12.8 caffeic acid-O-glucoside 16( 1 25( 1 2.9( 0.1
3 18.0 cyanidin-3-O-sambubioside 81 ( 1 23( 1 2.7( 0.1
4 20.3 cyanidin-3-O-rutinoside cyanidin-3-O-(20 0-O-xylosyl)rutinoside 247( 1 156( 7 18.2( 1.4
5 31.1 myricetin-3-O-rutinoside 4.6( 0.0 2.5( 0.0 0.3( 0.0
6 31.6 myricetin-O-rhamnoside 3.7( 0.1 nd
7 37.4 quercetin-3-O- rutinoside 23( 0 9.4( 0.2 1.1( 0.0
8 38.0 quercetin-3-O- galactoside 8.6 ( 0.1 8.3( 0.1 1( 0.0
9 39.1 quercetin-3-O-glucoside 11( 1 4.9 ( 0.3 0.6( 0.1
10 43.0 quercetin-3-O-(60 0-O-malonyl)glucoside 4.6( 0.0 nd
11 43.6 kaempferol-O-rutinoside 5.1( 0.1 nd
12 45.2 kaempferol-3-O-galactoside 3.2( 0.1 nd
13 45.9 kaempferol-3-O-glucoside 5.4( 0.2 4.2( 1.1 0.5( 0.2
unidentified peaks 201( 5 23.4( 0.8
aData expressed as mean values ( standard error (n = 3). tR, retention time; nd, not detected. Peak numbers and retention times refer to HPLC traces in Figure 4. Foridentification of compounds see Table S4 and text in the Supporting Information.
Article J. Agric. Food Chem., Vol. 58, No. 7, 2010 3907
Unlike the other berries, raspberries were a rich source ofellagitannins in the form of lambertianin C and sanguiin H-6,which together were responsible for 58% of the AOC (Table 7).This is in keeping with the findings of Beekwilder et al. (19),who analyzed raspberries with similar HPLC-online antioxidantdetection and found that in var. Tulamen anthocyanins
were responsible for 17% and ellagitannins for 54% of thedetectable AOC. Raspberries also contained ellagic acid andthree sugar conjugates at a total concentration of 34 nmol/g,which was not sufficient to induce a measurable response inthe online ABTS antioxidant detector system (Figure 3; Tables 4and 7).
Figure 5. HPLC-PDA traces at 280, 365, and 520 nm and online antioxidant detection (720 nm) of vitamin C and phenolic compounds in cranberries. Foridentification of numbered peaks see Table 6 and the Supporting Information.
Table 6. Antioxidant Activity of Phenolic Compounds and Vitamin C in Cranberriesa
peak tR (min) compound quantity (nmol/g) antioxidant activity (nmol of Trolox/g) antioxidant activity (%)
3.0 vitamin C 1107( 3 487( 10 22.6 ( 0.0
1 13.1 procyanidin dimer 405( 59 38( 2 1.8( 0.1
2 16.8 cyanidin-3-O-galactoside 160( 24 154( 6 7.1 ( 0.3
3 18.4 p-coumaric acid-O-hexoside 119( 12 36( 2 1.7( 0.1
4 20.3 cyanidin-3-O-arabinoside 138( 20 262( 6 12.2( 0.3
5 21.7 (-)-epicatechin 1121( 185 tr tr
6 22.4 peonidin-3-O-galactoside 243( 34 310( 16 14.4( 0.7
7 24.2 peonidin-3-O-glucoside 34.3( 5 nd
8 25.7 peonidin-3-O-arabinoside 124( 15 102( 2 4.7( 0.1
9 27.4 malvidin-3-O-arabinoside 26( 1 18( 4 0.8( 0.2
10 30.9 myricetin-3-O-galactoside 112( 17 139( 7 6.5( 0.3
11 32.7 procyanidin dimer 91( 14 nd
12 35.8 myricetin-3-O-arabinoside 42( 6 40( 2 1.9( 0.1
13 37.7 procyanidin dimer 498( 64 226( 20 10.5( 0.9
14 38.2 quercetin-3-O-galactoside 184( 28 tr
15 41.4 quercetin-3-O-(20 0-O-xylosyl)pyranoside 23( 3 nd
16 43.2 quercetin-3-O-arabinosylpyranoside 19( 2 nd
17 43.8 quercetin-3-O-arabinosylfuranoside 58( 11 32 ( 1 1.5( 0.0
18 46.1 quercetin-3-O-rhamnoside 18( 3 15( 0 0.7( 0.0
unidentified peaks 296( 29 13.7 ( 1.0
aData expressed asmean values( standard error (n = 3). tR, retention time; nd, not detected; tr, trace. Peak numbers and retention times refer to HPLC traces in Figure 5. Foridentification of compounds see Table S5 and text in the Supporting Information.
3908 J. Agric. Food Chem., Vol. 58, No. 7, 2010 Borges et al.
(-)-Epicatechin and procyanidin dimers were detected incranberries (Figure 5; Table 6), and the dimers, but not themonomer, made a contribution to the AOC of the berries(Table 7). Higher molecular weight polymeric procyanidins mostprobably will have contributed to the FRAP AOC of theunchromatographed berry extracts (Table 1). According to Guet al. (20) raspberries contain 0.3 mg/g polymeric procyanidinsand cranberries, 4.2 mg/g. They will not, however, have con-tributed to the AOC determined by HPLC as when analyzed byreversed-phase HPLC polymeric proanthocyanidins are eitherretained by the columnor eluted as a broad unresolved band. Theanalysis of proanthocyanidins comprising up to 10 flavan-3-olunits can be achieved using normal-phase HPLC (21); however,the dichloromethane/methanol/aqueous acetic acid mobile phaseemployed with this system is not compatible with the ABTSreagent used with the online HPLC system. A further potentialsource of error with analysis of proanthocyanidins is thatestimates can vary substantially depending upon the method ofextraction (20, 22, 23).
Although the berries analyzed in this study were unknownvarieties and no details were available about their postharvestregimen, they each contained a characteristic qualititativeprofile of flavonoids and phenolic compounds in keeping withpreviously published research (4). The berries were purchasedfrom a local supermarket and, therefore, reflect what is availablefor consumption by a local population. It would have beenuseful to know the cultivars and where the berries were grown.However, this in itself would not provide information on theextent to which the levels of flavonoids and phenolic compoundsvary from year to year, depending upon annual variationsin climate. Also, in any growing season, these levels are likelyto be influenced by the prevailing environmental conditionsencountered within a time window of weeks, if not days, priorto harvest.
Supporting Information Available: Identification of com-
pounds. This material is available free of charge via the Internet
at http://pubs.acs.org.
LITERATURE CITED
(1) Margetts, B.; Buttriss, J. Epidemiology linking consumption of plantfoods and their constituents with health. In Plants: Diet and Health;Goldberg, G., Ed.; Blackwell Publishing: Oxford, U.K., 2003; pp 49-64.
(2) Law, M. R.; Morris, J. K. By how much does fruit and vegetableconsumption reduce the risk of ischemic heart disease. Eur. J. Clin.Nutr. 1998, 52, 549–556.
(3) Lock, K.; Pomerleau, J.; Causer, L; Altmann, D. R.;McKee,M. Theglobal burden of disease attributable to low consumption of fruit andvegetables: implications for a global strategy on diet. Bull. WHO2005, 83, 100–108.
(4) Crozier, A.; Yokota, T.; Jaganath, I. B.;Marks, S. C.; Saltmarsh,M.;Clifford, M. N. Secondary metabolites in fruits, vegetables,
beverages and other plant based dietary components. In PlantSecondaryMetabolites: Occurrence, Structure and Role in the HumanDiet; Crozier, A., Clifford, M. N., Ashihara, H., Eds.; Blackwell: Oxford,U.K., 2006; pp 208-302.
(5) van Acker, S. A. B. E.; de Groot, M. J.; van den Berg, D. J.; Tromp,M. N. J. L.; den Kelder, G.; van der Vijgh, W. J. F.; Bast, A. Aquantum chemical explanation of the antioxidant activity of flavo-noids. Chem. Res. Toxicol. 1996, 9, 1305–1312.
(6) Vinson, J. A.; Dabbagh, Y. A. Effect of green and black teasupplementation on lipids, lipid oxidation and fibrinogen in thehamster: mechanisms for the epidemiological benefits of tea drink-ing. FEBS Lett. 1998, 433, 44–46.
(7) Fuhrman, B.; Lavy, A.; Aviram, M. Consumption of red wine withmeals reduces the susceptibility of human plasma and low-density-lipoprotein to lipid-peroxidation. Am. J. Clin. Nutr. 1995, 61, 549–554.
(8) Renaud, S.; Delorgeril, M. Wine, alcohol, platelets, and the Frenchparadox for coronary heart-disease. Lancet 1992, 339, 1523–1526.
(9) Fitzpatrick, D. F.; Hirschfield, S. L.; Coffey, R. G. Endothelium-dependent vasorelaxing activity of wine and other grape products.Am. J. Physiol. 1993, 265, H774–H778.
(10) Knegt, P.; Jarvinen, R.; Reunanen, A.; Maatela, J. Flavonoid intakeand coronary heart disease in Finland: a cohort study. Br. Med. J.1996, 312, 478–481.
(11) Kahkonen, M. P.; Hopla, A. I.; Heinonen, M. Berry phenolicsand their antioxidant activity. J. Agric. Food Chem. 2001, 494076–4082.
(12) Halvorsen, B. L.; Carlsen, M. H.; Phillips, K. M.; Bohn, H. K.;Holte, K.; Jacobs, D. R.; Blomhoff, R. Content of redox-activecompounds (i.e. antioxidants) in food consumed in the UnitedStates. Am. J. Clin. Nutr. 2006, 84, 95–135.
(13) Haleem, M. K.; Barton, K. L.; Borges, G.; Crozier, A.; Anderson,A. S. Increasing antioxidant intake from fruits and vegetables:practical strategies for the Scottish population. J. Hum. Nutr. Diet.2008, 21, 539–546.
(14) Benzie, I. F. F.; Strain, J. J. Ferric reducing/antioxidant power assay:direct measure of total antioxidant activity of biological fluids andmodified version for simultaneous measurement of total antioxidantpower and ascorbic acid concentration.Methods Enzymol. 1999, 299,15–27.
(15) Stewart, A. J.; Mullen, W.; Crozier, A. On-line HPLC analysis of theantioxidant activity of phenolic compounds in green and black tea.Mol. Nutr. Food Res. 2005, 49, 52–60.
(16) Re, R.; Pellegrini, N.; Proteggente, A.; Pannala, A.; Yang, M.;Rice-Evans, C. Antioxidant activity applying an improved ABTSradical cation decolorization assay. Free Radical Biol. Med. 1999, 26,1231–1237.
(17) Ross, M. A. Determination of ascorbic acid and uric acid in plasmaby high-performance liquid chromatography. J. Chromatogr., B1994, 657, 197–200.
(18) Moyer, R. A.; Hummer, K. E.; Finn, C. E.; Frei, B.; Wrolstad, R. E.Anthocyanins, phenolics and antioxidant capacity in diverse smallfruits: Vaccinium, Rubus, and Ribes. J. Agric. Food Chem. 2002, 50,519-525.
(19) Beekwilder, J.; Jonker, H.; Meesters, P.; Hall, R. D.; van der Meer,I.; de Vos, R. Antioxidants in raspberry: on-line analysis links
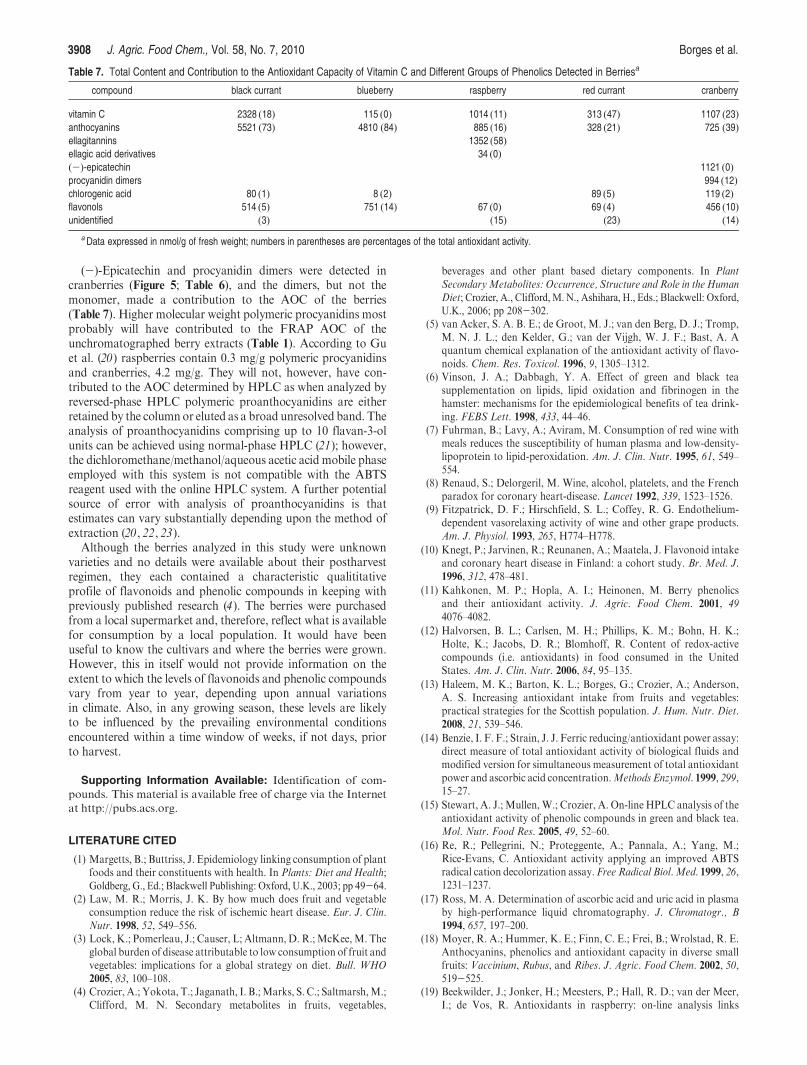
Table 7. Total Content and Contribution to the Antioxidant Capacity of Vitamin C and Different Groups of Phenolics Detected in Berriesa
compound black currant blueberry raspberry red currant cranberry
vitamin C 2328 (18) 115 (0) 1014 (11) 313 (47) 1107 (23)
anthocyanins 5521 (73) 4810 (84) 885 (16) 328 (21) 725 (39)
ellagitannins 1352 (58)
ellagic acid derivatives 34 (0)
(-)-epicatechin 1121 (0)
procyanidin dimers 994 (12)
chlorogenic acid 80 (1) 8 (2) 89 (5) 119 (2)
flavonols 514 (5) 751 (14) 67 (0) 69 (4) 456 (10)
unidentified (3) (15) (23) (14)
aData expressed in nmol/g of fresh weight; numbers in parentheses are percentages of the total antioxidant activity.
Article J. Agric. Food Chem., Vol. 58, No. 7, 2010 3909
antioxidant activity of a diversity of individual metabolites. J. Agric.Food Chem. 2005, 53, 3313–3320.
(20) Gu, L.; Hammerstone, J. F.; Beecher, G.; Holden, J.; Haytowitz, D.;Gebhardt, S.; Prior, R. L. Concentration of proanthocyanidins incommon foods and estimates of consumption. J. Nutr. 2004, 134,613–617.
(21) Hammerstone, J. F.; Lazarus, S. A.; Mitchell, A. E.; Rucker, R.;Schmitz, H. H. Identification of procyanidins in cocoa (Theobromacacao) and chocolate using high-performance liquid chromatogra-phy/mass spectrometry. J. Agric. Food Chem. 1999, 47, 490–496.
(22) Hellstr€om, J. K.; T€orr€oen, A. R.; Mattila, P. H. Proanthocyanidinsin common food products of plant origin. J. Agric. Food Chem. 2009,56, 7617–7624.
(23) Khanal, R. C.; Howard, L. R.; Prior, R. L. Procyanidin compositionof selected fruits and fruit byproducts is affected by extractionmethod and variety. J. Agric. Food Chem. 2010, DOI: 10.1021/jf9015398.
Received for review July 1, 2009. Revised manuscript received October
23, 2009. Accepted November 19, 2009.