bme (311) electric circuits lab - jordan university of ... · bme (311) electric circuits lab...
TRANSCRIPT

Facility of Engineering
Department of Biomedical Engineering
BME (311)
Electric Circuits lab
Prepared By: Eng. Hala Amari Supervised By: Dr. Areen AL-Bashir
Summer
2016

1
Table of Contents
Page Title Experiment #
2
Exp#1: Introduction to Basic Laboratory Test and
Measurement Equipment
1
9 Exp#2: Resistors, Potentiometers, and Rheostats 2
14 Pre-Report#1 18 Post-Report#1
23 Exp#3: DC Circuit Measurements
3
27 Pre-Report#2 31 Post-Report#2
38 Exp#4: laboratory Instrument Loading Effect Part-A
4
43 Pre-Report#3 46 Post-Report#3 50 Exp#5: DC Circuit Analysis 5
59 Pre-Report#4 65 Post-Report#4 74 Exp#6: laboratory Instrument Loading Effect Part-B
6
77 Pre-Report#5 80 Post-Report#5
84
Exp#7: Inductance, Capacitance I-V Relations and
Transients in RL and RC Circuits
7
92 Pre-Report#6 96 Post-Report#6 105 Exp#8: Transients in RLC Circuits 8
111 Pre-Report#7 116 Post-Report#7 122 Exp#9: Sinusoidal AC Circuit Measurements 9
128 Pre-Report#8
133 Post-Report#8
139 References 10

2
: Introduction to Basic Laboratory Test and Exp#1
Measurement Equipment
This experiment is intended to give the student a quick exposure to the laboratory equipment which
will be used in this course.
The DC Power Supply: 1.2.1
Generally, this is a dual power supply with (+) and (-) voltage terminals,
and a ground (common) terminal. a dual-output laboratory power supplies
voltage and current are indicated on three-digit display, can be operated in
parallel or in series, and can be operated as constant voltage source or as
constant current source.
The main attributes of this device is:
1. Voltage and current are indicated on separate LED-meters.
2. The output voltages are available through safety sockets on the front panel.
3. Dual Tracking (Serial and parallel operation) Both lab-outputs can be connected in parallel or in
series by means of a switch on the front panel. The left hand unit is then operating as the master
control unit.
4. The output values are indicated on the meters of the master unit (left side).
5. The units are equipped with a third output supplying a fixed voltage of 3...6 Volts and a max.
Current of 2 A. This output is located on the right side with safety sockets.
6. output on/off switch.(see Figure1-1)
Figure 1-1:The DC Power Supply

3
The Digital Multimeter: 1.2.2
Most digital multimeters are designed to measure DC resistance, direct current and voltage, and
the RMS value of sinusoidal current and voltage. Some meters measure the true RMS (TRMS)
value of any waveform.
Note: At this laboratory we will use two different type of DMM (see Figure1-2.), because one of
the DMM tolerate higher current than the other DMM as listed below:
1. GWINSTEK (GDM-8034) DMM : tolerate 2A maximum current at the lower range, and 20A
maximum current at the higher range.
2. MASTECH (M9803R) DMM: : tolerate 400mA maximum current at the lower range, and 10A
maximum current at the higher range.
The Function Generator: 1.2.3
A FG provides voltages of different forms. These may include: sinusoidal, triangular, and square.
An adjustable level of DC off set (+ or -) may also be available. In addition, a control may be present
to vary the waveform symmetry. Output-voltage frequency and amplitude may have a wide dynamic
range. (see Figure1-3)
Figure 1-2 : The Digital Multimeter
Figure 1-3 : The Function generator

4
The Oscilloscope: 1.2.4
This is one of the most important pieces of laboratory test equipment. It is basically a voltage
sensing and display device; it cannot measure current directly. However, it can be used to measure a
voltage proportional to a desired current, e.g., across a small sampling resistance.
Most modern Scopes have two input channels with adjustable, calibrated, gain. Two signals can
thus be viewed separately, or simultaneously if they are synchronized. Calibrated gain settings
enable the measurement of voltage amplitude.
A horizontal Time axis is provided by an internal generator. This generator produces a
calibrated variable-frequency voltage the amplitude of which varies linearly with time. Thus, a
voltage waveform applied to either input channel can be viewed as a function of time. And a plot of
the relation ship between two signals at both chanels cab be berformed also.
An important Scope function is the Trigger. Circuits in this subsection enable the selection of
the amplitude of the input signal at t = 0 relative to its peaks. This corresponds to having a
selectable phase angle. Another important Scope function is applying a mathematical operation on
the signal, such as inverting, add the two signals, and subtract them.
(see Figure1-4)
Figure(1-5) represents the front panel of the function generator, each part of the panel listed at
the below table.
Figure 1-5: Oscilloscope (GWINSTEK) GDS-1152A-U Digital
Scope Front panel.
Figure 1-4 : The Oscilloscope
5
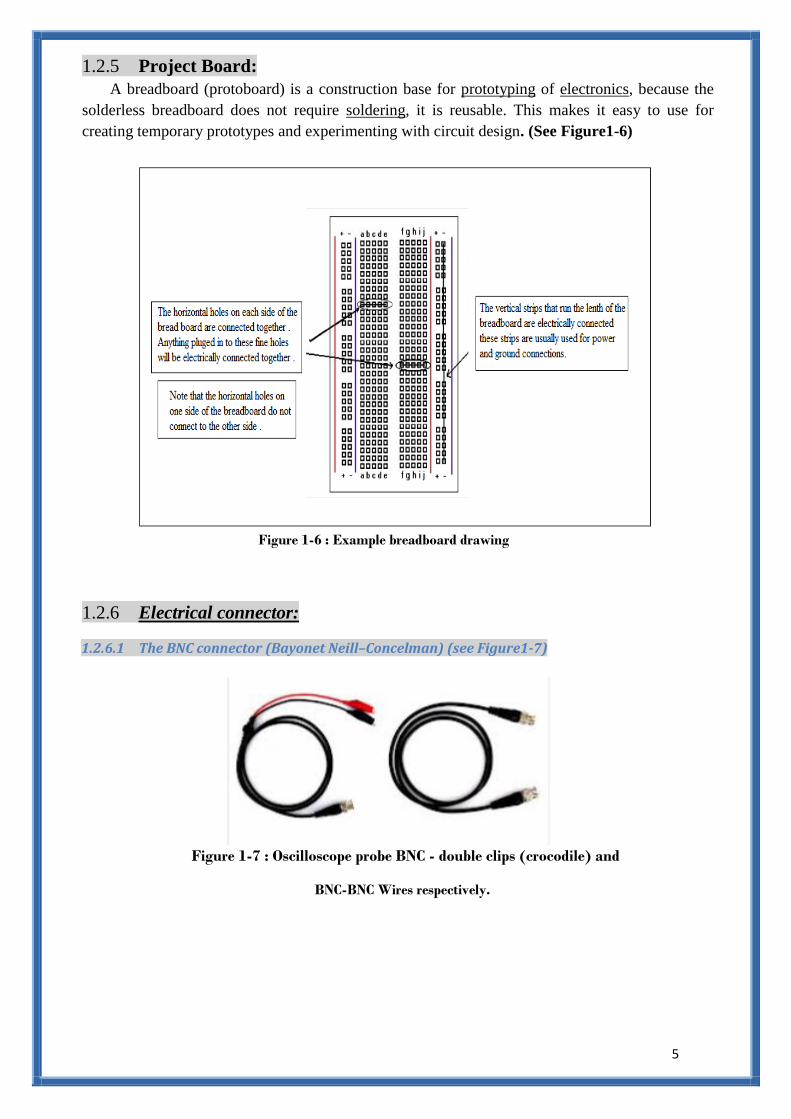
Project Board: 1.2.5
A breadboard (protoboard) is a construction base for prototyping of electronics, because the
solderless breadboard does not require soldering, it is reusable. This makes it easy to use for
creating temporary prototypes and experimenting with circuit design. (See Figure1-6)
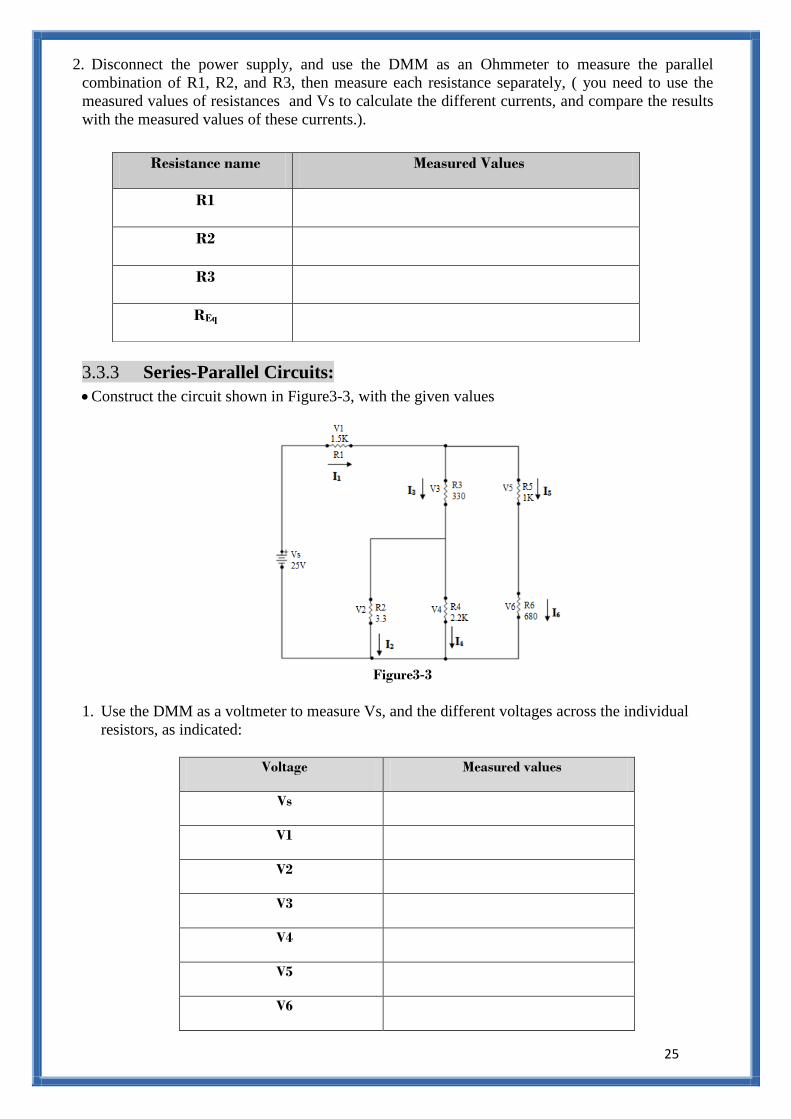
Electrical connector: 1.2.6
1.2.6.1 The BNC connector (Bayonet Neill–Concelman) (see Figure1-7)
Figure 1-6 : Example breadboard drawing
Figure 1-7 : Oscilloscope probe BNC - double clips (crocodile) and
BNC-BNC Wires respectively.

6
1.2.6.2 Banana connectors. (See Figure1-8)
1.2.6.3 Banana Plug to Alligator (crocodile) Clip wire. (See Figure1-9)
Figure 1-8 : Banana plug to Banana plug wire
Figure 1-9: Banana to crocodile connector

7
The DC Power Supply: 1.3.1
1- Apply input power.
2- Turn the Voltage limit control from the Minimum to Maximum, and then record both values of
the Minimum to Maximum voltage.
Vminimum= ………………
Vmaximum=………………………
3- Turn the Current limit control from the Minimum to Maximum, and observe the effect on the
Voltage value.
Q1: Does the Voltage value change when the Current controls are turned up or down?
………………………………………………………………………………
4- Turn the Voltage limit control to set the voltage value to 5V.
5- Place short circuit (S.C) between (+) & (-) output terminals.
6- Turn the Current control from the Minimum to Maximum, and then record both values of the
Minimum to Maximum current.
Iminimum= ………………
Imaximum=………………………
7- Turn the Voltage limit control from the Minimum to Maximum and observe the effect on the
Current value.
Q2: Does the Current value change when the Current controls are turned up or down?
………………………………………………………………………………
8- Disconnect the S.C
The Digital Multimeter: 1.3.2
1.3.2.1 (A) Resistance Measurements:
1-Obtain a resistance.
2-Prepare the DMM for resistance (Ω) measurements.
3-Connect the DMM probes to the two terminals of the resistor.
4-Select the DMM auto range and record its reading.
5- Repeat with the smallest range setting.
Also you can measure:

8
1.3.2.2 Direct Current Measurements.
1.3.2.3 Alternating Current Measurements.
1.3.2.4 Direct Voltage Measurements.
1.3.2.5 Alternating-voltage measurements.
Oscilloscope and Function Generator : 1.3.3
1-Turn the function generator and the Oscilloscope power on.
2- Set the frequency of the function generator to 1000 Hz.
3- Set the function Selector to sinusoidal output.
4- Set the amplitude to Maximum value.
Maximum value= …………..
5- Measure the rms value of the output with DMM.
6- Set the output amplitude to Minimum.
7 -Measure the output with DMM.
Minimum value= …………..
Oscilloscope: 1.3.4
1-Turn the function generator and the Oscilloscope power on.
2- Set the frequency of the function generator to 1000 Hz.
3- Set the function Selector to sinusoidal output.
4- Set the amplitude to 5Vp-p.
5- Connect the circuit shown at Figure1-10 .
6- measure Vo using channel 2 of the
Oscilloscope .
Vo= …………………..
Figure 1-10

9
: Resistors, Potentiometers, and Rheostats Exp#2
1. Gain familiarity with available types of resistors, potentiometers, and rheostats.
2. Determine the nominal value of resistance using the color code, and the actual value using
different types of measurement.
3. Determine the linearity of a potentiometer, and use it as a voltage divider or control element.
Resistors: 2.2.1
As discrete components, resistors come in various sizes and shapes depending on their power
rating and use. The resistive element material may also vary, e.g., metallic wire, carbon, etc.
the resistor most commonly used in the laboratory is made of carbon encased in a tubular form with
axial leads as shown in Figure2-1.
Some resistors may have their nominal ohmic value stamped on the body of the resistor, e.g.,
1100 or 2.2M. More often, however, color code is used to indicate the nominal value. Three color
bands are used for this purpose, each having a numerical value between 0 and 9, as shown in
Table1.
Table 1: Numerical Values of Color Codes
Black Brown Red Orange Yellow Green Blue Violet Gray White
0 1 2 3 4 5 6 7 8 9
Starting with the band closest to one end of the resistor, as shown in Figure2-1, the three
represented numbers, n1 , n2, and n3 mean: R= ( 10*n1 +n2 )*10^n3
ohms. For example, Orange-
Blue-Black means 36*10^0
=36 ohms, and Gray-Red-Yellow means 82*10^4
= 820 Kohm.
The percent tolerance around the nominal value is indicated by a fourth band according to Table#2.
Table 2: Percent-Tolerance Color Code
Gold Silver No Color
± 5 ± 10 ± 20
Figure 2-1: Axial-Lead Resistor, Color-Coded

11
The physical size of a resistor depends on its power rating, and vice versa . To keep its temperature
at a safe level, a resistor must be large enough to dissipate its rated power into the surrounding
design environment.
Potentiometer: 2.2.2
Potentiometers provide an adjustable resistance between two points as shown in Figure2-2. The
arrowhead represents a movable contact point. Thus the resistance between the terminals a and b (or
c and b) can be varied from 0 to 100 percent of the total resistance between a and c. If this variation
is proportional to the physical length of the resistive element, the potentiometer is said to be linear.
Otherwise, it is nonlinear, e.g., logarithmic.
Two popular shapes of potentiometers are: circular and straight- line, as shown in Figure2-3.
A potentiometer is used as a voltage control device to obtain a variable fraction of the potential
between two points as shown in Figure2-4. Here Vo can be varied between zero and Vs.
*http://fddrsn.net/pcomp/examples/potentiometers.html
Figure2-2: Potentiometer Schematic Diagram
Figure 2-3: Circular and Straight line Potentiometers.*
Figure 2-4: Potentiometer Voltage Control

11
Rheostat: 2.2.3
A rheostat is similar to a potentiometer in structure. However, it differs in its intended use. It is
used as a series element to control current as shown in Figure2-7. Thus, it is usually a higher-power
device.
Resistance Measurements: 2.3.1
Several methods will be used to measure resistance. Their results will be compared with each
other and with nominal color-code value.
1-obtain two resistors having arbitrary values between 100 ohms and 100 K ohms and arbitrary
power ratings.
2-Tabulate their color codes, nominal values, percent tolerances, and power ratings.
2.3.1.1 Ohmmeter Measurements:
1-Use the DMM to measure the value of each resistor directly on the most sensitive
range.
R1 (measured)……………………………………………..
R2 (measured) …………………………………………….
2-As an aside, measure and record your body resistance by holding the probes firmly One
with each hand …………………………………..
2.3.1.2 Voltage and Current Measurements:
Construct a measurement circuit as shown in Figure2-5, where Rx is the
resistance to be determined by Ohm’s law:
Note: 1. While using the DMM as a voltmeter, you must connect it in parallel with the
component you need to measure the voltage across it.
2. While using the DMM as an ammeter, you must connect it in series with the
component you need to measure the current passing through it.
Color-code Nominal value
(Calculated)
Tolerance Power
rating
(R1)
Brown-black-brown -Gold
(R2)
Red-red-red-Gold
Rx=Vx/Ix.
Figure2-5

12
1- Increase Vs from 0 to near the highest responsible value.(Within limits that are safe for the
resistor Rx )
2- Record the measure value of Vx, Ix.
3-Calculate the value of Rx by the Ohm’s law.
2.3.1.3 Bridge Measurements:
A Wheatstone bridge for measuring resistance is shown in Figure2-6. When the Bridge is
balanced, i.e.,Ib=0,
Figure 2-6
The following relation holds:
Rx=R2*R3/R1
*Derive this formula in your report.
*Generally, a good measurement is obtained when all Resistors values are
not too far from each other; for example, within a factor of 3 or less.
1-Select reasonable values for R1and R2, and measure them with the DMM before placing them in
the Circuit.
2- Use decade box for the adjustable resistor R3.Use approximately 10 V for Vs.
3- Set the DMM initially to the highest Current range. and adjust R3 to make Ib approach 0, Stop
adjusting when a minimum value of Ib is obtained on the lowest possible range. Record this value
for reference only.
4- Disconnect R3 and measure it directly with the DMM………………………..
5-Calculate the value of unknown Rx using above formula.
6- Compare with the nominal values.
Vs (V) 3 5 10
Ix
Vx
Rx=Vx/Ix

13
Potentiometers and Rheostat Measurements: 2.3.2
1. To demonstrate the rheostat principle, one of the Potentiometer you tested may be used in the
following measurements.
Figure2-7
2. For the circuit shown in Figure2-7. Obtain a Potentiometer, Select Ro such that the maximum
variation in the Current Io is 5 to 1.Measure and record the value of Ro.
3. Construct the circuit using 10 v for vs. Measure Io on the lowest possible range using the 4 marked
sections of the potentiometer for Rs, i.e, 0,25,50,75.and 100 percent.
Ro=……………………….
Rs (K ) Io
5
4
3
2
1

14
Biomedical Engineering Department
Electric Circuits lab
BME )311(
#1 rtRepo lab-Pre
Experiment# 2
heostatRResistors, potentiometers, and
Student Name ………………………………………………………………………
Student ID…………………………………………………………………………..

15
Objectives: 1.
2.
3.
: 8 answer the below questions-shown in figure2 For the resistor Q#1:
A) Calculate the nominal value of the resistor using color-code rule.
Figure 2-8
B) Which color is indicating the tolerance, and what is the tolerance value?

16
Q#2: For the Wheatstone bridge circuit shown in figure2-9 derive this formula:
Rx=R2*R3/R1
Figure2-9

17
Q#3: For the circuit shown in figure2-10 Select Ro such that the maximum variation in the Current Io
is 5 to 1.
Note: 1. Rs is a rheostat.
2. Show all your calculation.
Figure2-10

18
Biomedical Engineering Department
Electric Circuits lab
BME (311)
Post lab #1
Experiment# 2
heostatRResistors, potentiometers, and
1. Student Name ………………………………………………………………………
Student ID…………………………………………………………………………..
2. Student Name ………………………………………………………………………
Student ID…………………………………………………………………………..
3. Student Name ………………………………………………………………………
Student ID…………………………………………………………………………..

19
1. Resistance measurements:
(A) Ohmmeter Measurements:
Fill the below table according to what you measured at the laboratory:
Note: you should show your calculations.
(B) Voltage and Current Measurements :( Ohm’s law)
Fill the below table:
Vs (V) 3 5 10
Ix
Vx
Rx=Vx/Ix
Color-code Nominal value
(Calculate using Rule)
Measured value
(DMM)
Tolerance Power
rating
Brown-black-brown –Gold
Red-red-red-Gold
Your body resistance is …………………………………………………………
Rx=Vx/Ix.

21
*Plot Ix vs Vx
Bridge Measurements: ( C )
For the bridge circuit shown below the following formula should be satisfied.
Rx=1
3*2
R
RR only when Ib=0
1. R3= ………..
2. Calculate the value of unknown Rx using above formula,
Compare with the nominal values.

21
2. Rheostat Measurements:
The selected Ro=……………………….
Fill the below table:
Plot Io Vs Rs.
What functional relation does this plot indicate?
Rs (K ) Io
5
4
3
2
1

22
Conclusion and discussion:
List your Conclusion about all parts of this experiment, and discuss the results as
points:

23
: DC Circuit Measurements Exp#3
At this experement the objective is to verify Kirchhof’s voltage and current laws and some of
their consequences by measurements on dc circuits.
Series Circuits: 3.2.1
Kirchhof’s Voltage Law (KVL) states that the sum of voltages around a closed path is zero. This
can be verified by measurements on simple series circuits as circuit shown at Figure3-1.
Parallel Circuits: 3.2.2
Kirchhof’s Current Law (KCL) states that the sum of all currents at any node in a circuit is zero.
This ca n be verified by measurements on a simple parallel circuit as shown at Figure3-2.
Series-Parallel Circuits: 3.2.3
Both KVL and KCL are now verified by measurements in a rather arbitrary circuit containing
series and parallel combinations of resistors as shown at Figure3-3.
Series Circuits: 3.3.1
Use R1=330 Ω,R2=1 K Ω,R3=2.2K Ω, then connect the circuit in Figure3-1
Figure 3-1

24
1. Measure the value of Is by using the DMM as an ammeter.
Is=……………………………………….
2. Move the connection of the voltmeter around the circuit to measure the voltages:
3. Disconnect the power supply from the circuit, and use the DMM as an ohmmeter to measure the
resistances values; (you need to use the measured values of resistances and Vs to calculate
the different voltages, and compare the results with the measured values of these voltages.)
Parallel Circuits: 3.3.2
Construct the circuit shown in Figure3-2 below with the given values:
Measure the value of Is by using the DMM as an ammeter,
Is=………………………………………………..
1. Now place the ammeter in series with R1, R2, and R3 to measure the values of the different
currents:
Vs/Parameter Name I1 I2 I3
Vs=15V
Vs/ Parameter Name Vab Vbc Vcd Is
Vs=15V
Resistance name Measured Values
R1
R2
R3
Figure3-2
25
2. Disconnect the power supply, and use the DMM as an Ohmmeter to measure the parallel
combination of R1, R2, and R3, then measure each resistance separately, ( you need to use the
measured values of resistances and Vs to calculate the different currents, and compare the results
with the measured values of these currents.).
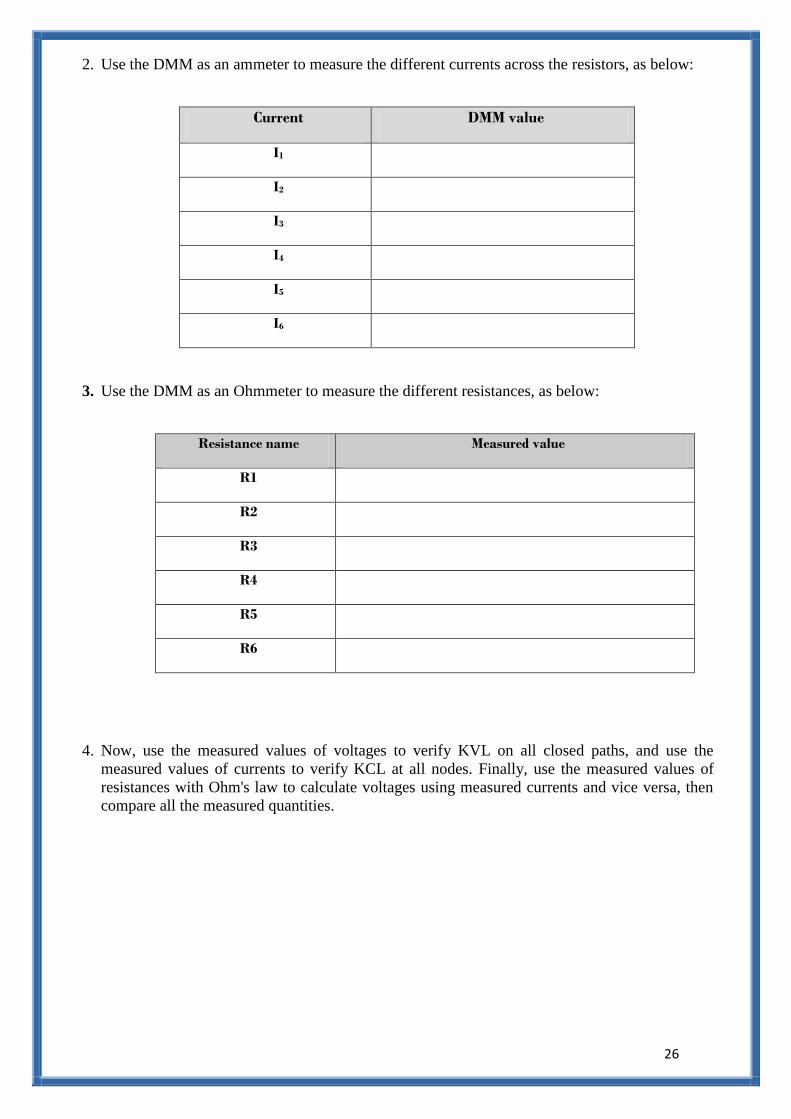
Series-Parallel Circuits: 3.3.3
Construct the circuit shown in Figure3-3, with the given values
1. Use the DMM as a voltmeter to measure Vs, and the different voltages across the individual
resistors, as indicated:
Voltage Measured values
Vs
V1
V2
V3
V4
V5
V6
Resistance name Measured Values
R1
R2
R3
REq
Figure3-3
26
2. Use the DMM as an ammeter to measure the different currents across the resistors, as below:
Current DMM value
I1
I2
I3
I4
I5
I6
3. Use the DMM as an Ohmmeter to measure the different resistances, as below:
Resistance name Measured value
R1
R2
R3
R4
R5
R6
4. Now, use the measured values of voltages to verify KVL on all closed paths, and use the
measured values of currents to verify KCL at all nodes. Finally, use the measured values of
resistances with Ohm's law to calculate voltages using measured currents and vice versa, then
compare all the measured quantities.

27
Biomedical Engineering Department
Electric Circuits lab
BME(311)
#2 Report lab-Pre
3nt#Experime
Part A -Dc Circuit Measurements
Student Name ………………………………………………………………………
Student ID…………………………………………………………………………..
28
Objectives:
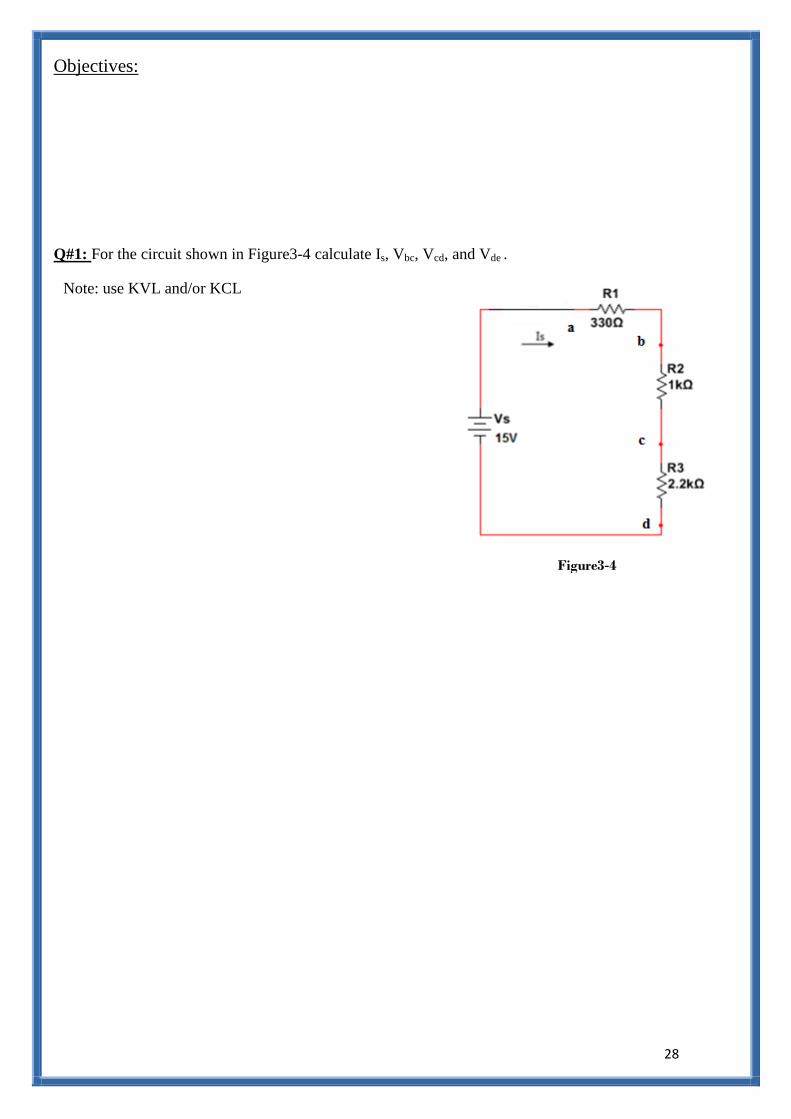
Q#1: For the circuit shown in Figure3-4 calculate Is, Vbc, Vcd, and Vde .
Note: use KVL and/or KCL
Figure3-4

29
Q#2: For the circuit shown in Figure3-5 calculate IS, I1, I2, and I3.
Note: use KVL and/or KCL
Figure3-5

31
Q#3: For the circuit shown in Figure3-6 calculate all the currents and voltages signed at the circuit.
KVL and/or KCLuse Note:
Figure 3-6

31
Biomedical Engineering Department
Electric Circuits lab
BME(311)
Post Report #2
3Experiment#
Part A -Dc Circuit Measurements
1. Student Name ………………………………………………………………………
Student ID…………………………………………………………………………..
2. Student Name ………………………………………………………………………
Student ID…………………………………………………………………………..
3. Student Name ………………………………………………………………………
Student ID…………………………………………………………………………..

32
1. Series Circuits:
After connect the circuit shown in Figure3-1 fill the below tables and answer the following
questions:
Vs/Parameter Name Vab Vbc Vcd Is
Vs=15V
Compare the sum of these voltages to Vs??
Use the above values and the measured value of Is to calculate different voltages by Ohm's law, and
compare them with the values obtained previously.
Voltage name
Measured value
Calculated values using Ohm's law
Vbc
Vcd
Vde
Resistance name Measured Values
R1
R2
R3

33
Now, use voltage division to calculate different voltages, and compare your results with the measured
values.
2. Parallel Circuits:
After connect the circuit in Figure3-2 fill the table below and answer the following questions:
Vs/Parameter
Name
I1 I2 I3
Vs=15V
1. measure the value of Is as indicated by DMM2
Is=………………………………………………..
2. Compare the sum of the above currents with Is?
Voltage name Calculated value Measured value
Vab
Vbc
Vcd

34
3. A consequence of KCL is that the current through one conductance
Gk =1/Rk in a parallel circuit can be calculated using the current division Rule ,
Ik = (Gk /Gt ) It
Gt: the sum of all conductance in parallel, including Gk
It: the current in to the circuit
Calculate I1, I2, and I3 using this rule, and compare the results with the measured values.

35
3. Series-Parallel Circuits:
After connect the circuit in Figure3-3 record the following results:-
Voltage Measured values
Vs
V1
V2
V3
V4
V5
V6
Current DMM value
I1
I2
I3
I4
I5
I6
Resistance name Measured value
R1
R2
R3
R4
R5
R6

36
Now, use the measured values of voltages to verify KVL on all closed paths, and use the measured
values of currents to verify KCL at all nodes. Finally, use the measured values of resistances with
Ohm's law to calculate voltages using measured currents and vice versa, then compare all the
measured quantities.

37
Conclusion and discussion:
List your Conclusion about all parts of this experiment, and discuss the results as
points:
38
: Laboratory Instrument Loading Effect Exp#4
Part A
The objectives in this experiment are:
1. Measure the current-voltage (I-V) characteristic of a dc power supply with current limit.
2. Measure circuit loading caused by test equipment, viz, the Digital Multimeter (DMM) and the
Oscilloscope (Scope).
3. Determine the output (source) resistance of the Function Generator (FG).
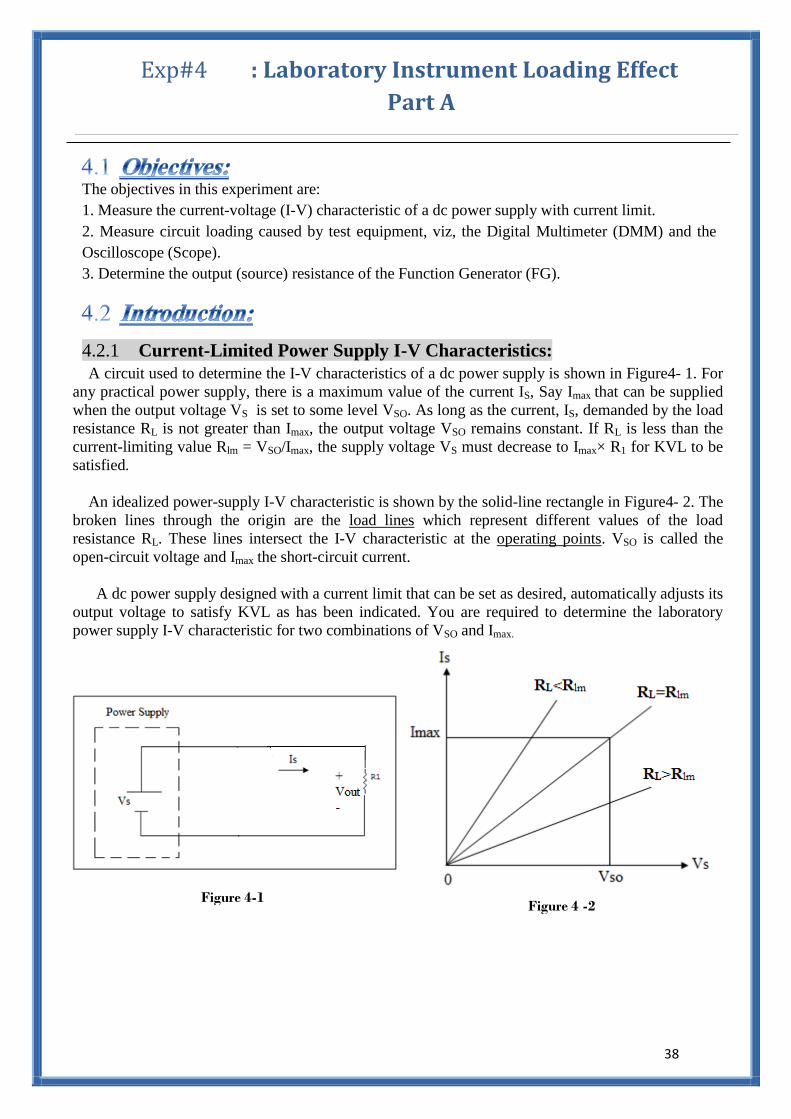
Current-Limited Power Supply I-V Characteristics: 4.2.1
A circuit used to determine the I-V characteristics of a dc power supply is shown in Figure4- 1. For
any practical power supply, there is a maximum value of the current IS, Say Imax that can be supplied
when the output voltage VS is set to some level VSO. As long as the current, IS, demanded by the load
resistance RL is not greater than Imax, the output voltage VSO remains constant. If RL is less than the
current-limiting value Rlm = VSO/Imax, the supply voltage VS must decrease to Imax× R1 for KVL to be
satisfied.
An idealized power-supply I-V characteristic is shown by the solid-line rectangle in Figure4- 2. The
broken lines through the origin are the load lines which represent different values of the load
resistance RL. These lines intersect the I-V characteristic at the operating points. VSO is called the
open-circuit voltage and Imax the short-circuit current.
A dc power supply designed with a current limit that can be set as desired, automatically adjusts its
output voltage to satisfy KVL as has been indicated. You are required to determine the laboratory
power supply I-V characteristic for two combinations of VSO and Imax.
Figure 4-1 Figure 4 -2

39
Circuit Loading by Measuring Instruments: 4.2.2
Ideally, a measuring instrument should have no effect on the quantity being measured. However,
any practical instrument affects the quantity it measures to a certain degree. A voltmeter, for
example, has a finite input resistance, although it may be very large. Therefore, it can change the
measured circuit significantly if the equivalent circuit resistance is also very high. This is called
circuit loading. Subsequent measurements are designed to demonstrate circuit loading caused by the
ammeter, the voltmeter, and the oscilloscope. The equivalent resistance of each instrument will be
calculated from measurement data.
4.2.2.1 Ammeter Loading:
When the DMM used as an ammeter, the equivalent resistance of the DMM may be different for
each measurement range. The circuit shown in Figure4-3(a) is used to measure the equivalent
resistance of the ammeter. *
4.2.2.2 Voltmeter Loading:
Measurements are now made to determine the equivalent resistance of the DM M when used as a
voltmeter, and how it affects the accuracy of experimental results. The circuit shown in Figure4-3(b)
is used to measure the equivalent resistance of the ammeter.**
Like any other practical voltage source, the FG has a nonzero equivalent resistance, Rg
Therefore, at any fixed amplitude setting, its output voltage changes with load. The extent of this
change depends on the value of load resistance relative to that of Rg .The circuit shown in Figure 4-3
(d) is used to measure the equivalent resistance of the ammeter.
* ideally the equivalent resistance of the ammeter equal to zero
**
ideally the equivalent resistance of the voltmeter is infinity
Figure 4-3: (a) Ammeter Loading circuit (b) Voltmeter Loading circuit (c)
41
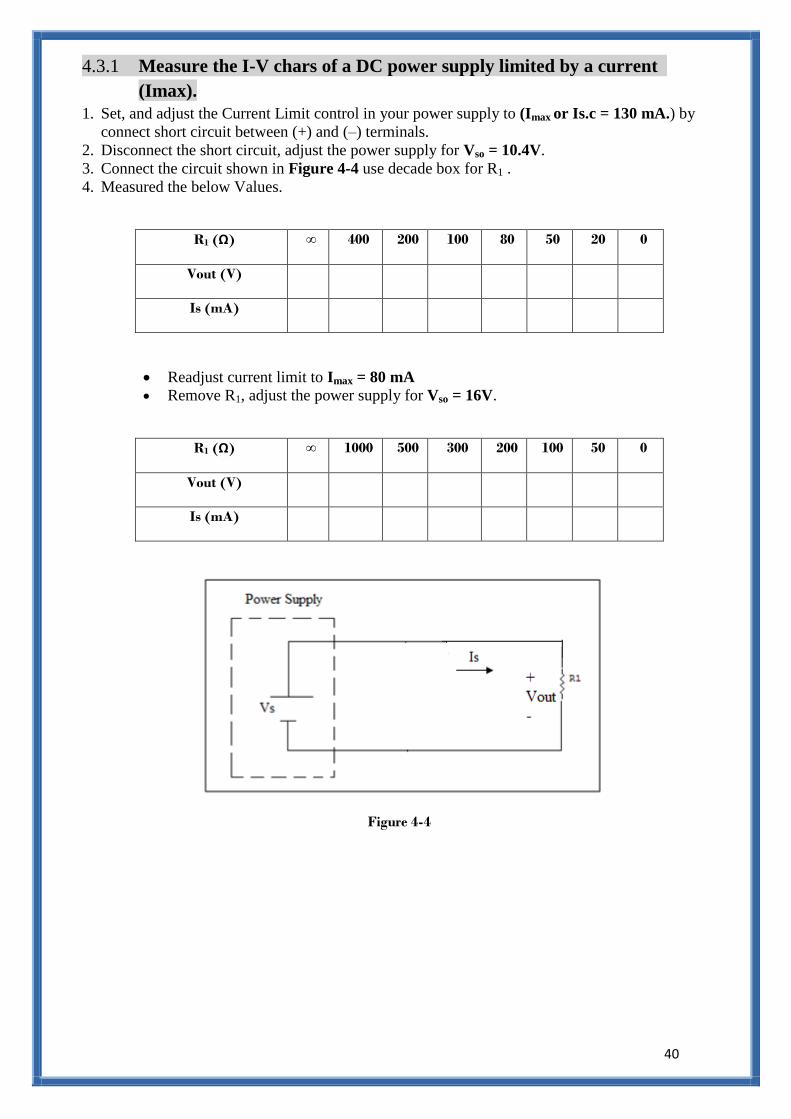
Measure the I-V chars of a DC power supply limited by a current 4.3.1
(Imax).
1. Set, and adjust the Current Limit control in your power supply to (Imax or Is.c = 130 mA.) by
connect short circuit between (+) and (–) terminals.
2. Disconnect the short circuit, adjust the power supply for Vso = 10.4V.
3. Connect the circuit shown in Figure 4-4 use decade box for R1 .
4. Measured the below Values.
R1 (Ω) ∞ 400 200 100 80 50 20 0
Vout (V)
Is (mA)
Readjust current limit to Imax = 80 mA
Remove R1, adjust the power supply for Vso = 16V.
R1 (Ω) ∞ 1000 500 300 200 100 50 0
Vout (V)
Is (mA)
Figure 4-4

41
Circuit Loading By Measurement Instruments: 4.3.2
4.3.2.1 Ammeter Loading:
8034 ) to measure current -Note use the bench top multimeter (GDM
1. Construct the circuit shown in Figure4-5.
2. Choose R=2.2K
3. Measure R Using DMM.
R=……………………..
range. possible Using lowestMM .. Record Current by D4
5. Move the voltmeter to measure:
Va =……………………………….
Vr =………………………………
Ammeter Range
(A)
20m 200m 2000m
Calculate ra (Ω)
Va/I
4.3.2.2 Voltmeter Loading:
Note use the bench top multimeter (M 9803 R ) to measure voltage
Measurements are now made to determine the equivalent resistance of the DMM when used at
voltmeter, and how it affects the accuracy of results.
1. Construct the Circuit shown in Figure4-6,
R1= 470KΩ; R2 = 1 MΩ , Vs = 30 V.
2. Record DMM Mode number……………………………………………………..
3. Measure R1 and R2 Using ohmmeter
I=………………..
Figure4-5
Figure4-6

42
R1=…………………….
R2=…………………….
4. Measure V2.
V2 =……………..
5. Calculate the equivalent resistance of the DMM using the measured values of R1 and R2..
Hint Assume:
(RDMM//R2)=Req
(Req/(Req+R1))*Vs=V2

43
Biomedical Engineering Department
Electric Circuits lab
BME (311)
3 Report lab-Pre
4Experiment#
BPart -Dc Circuit Measurements
Student Name ………………………………………………………………………
Student ID…………………………………………………………………………..

44
Objectives:
1.
2.
3.
Q#1: The circuit shown in Figure4-9 is used to determine the I-V characteristics of DC power supply.
sI both = 100Ω at 1= 16V: Demonstrate the effect of using Rso= 100mA, and VmaxIf you Know that: I
. sand V
Q#2: 1. Use the circuit shown in Figure4-01 to calculate the equivalent resistance of the ammeter.
Figure 4-9
Figure 4-10

45
2. Does the equivalent resistance of the ammeter affected by changing the range of the ammeter?
Explain?
Q#3: Use the circuit shown in Figure 4-10 to calculate the equivalent resistance of the voltmeter.
Figure 4-11

46
Biomedical Engineering Department
Electric Circuits lab
BME (311)
Post Report #3
4Experiment#
BPart -Dc Circuit Measurements
1. Student Name ………………………………………………………………………
Student ID…………………………………………………………………………..
2. Student Name ………………………………………………………………………
Student ID…………………………………………………………………………..
3. Student Name ………………………………………………………………………
Student ID…………………………………………………………………………..

47
1. Measure the I-V characteristics of DC power supply limited by a current (Imax):
After connecting the circuit shown in Figure4-4 fill the tables below and answer the following
question:
For Imax=130mA, Vso=10.4V:
R1 (Ω) ∞ 400 200 100 80 50 20 0
Vout (V)
Is (mA)
For Imax=80mA, Vso=16V:
R1 (Ω) ∞ 1000 500 300 200 100 50 0
Vout (V)
Is (mA)
For the First table, Plot the I-V characteristics from the taken measurements. Show the load lines
and the operating points For Rl= 400, 80 and 40 Ω.

48
2. Circuit Loading By Measurement Instruments.
1.Ammeter Loading:
After connecting the circuit shown in Figure 4-5 fill the below Values and answer the following
questions:
Measure R Using DMM……………………………………………………..
Record Current By DMM2.Using lowest range.
Move the voltmeter to measure:
Va =……………………………….
Vr =………………………………
Calculate ra (Ω)……………………………..
Ammeter Range
(A)
20m 200m 2000m
Calculate ra (Ω)
Va/I
Write your observations:-
…………………………………………………………………………………………………………….
…………………………………………………………………………………………………………….
2. Voltmeter Loading:-
After connecting the circuit shown in Figure 4-6 fill the below Values and answer the following
questions:
V2= …………..
R1(measured)=……………….
R2(measured)=……………….
I=………….

49
Calculate the equivalent resistance of the voltmeter using the measured values of R1 and R2 ..
How does this value affect the accuracy of experimental results?
Conclusion and discussion:
List your Conclusion about all parts of this experiment, and discuss the results as
points:
Hint Assume:
(RDMM//R2)=Req
(Req/(Req+R1))*Vs=V2

51
: DC Circuit Analysis Exp#5
1. Verify the Mesh Analysis and the Nodal Analysis methods.
2. Verify the Superposition Principle.
3. Verify Thevenin’s and Maximum Power Transfer theorems.
4. Verify voltage-current Source Transformations.
Mesh and Nodal Analyses: 5.2.1
Mesh and Nodal equations are verified using experimental data. Figure5-1 shows the circuit
used for this purpose, where the indicated resistances are in kΩ.
Before coming to the laboratory, the student is required to write these equations using Rl =150Ω.
The equations should be solved for the mesh currents I1, I2, and I3 and the node voltages Va and Vb
indicated in the figure.
Superposition Principle: 5.2.2
The circuit of Figure5-1 is also used to verify the superposition principle , by following the
below steps:
1. Replace the first voltage source(Vb1) with short circuit, but leave the second one (Vb2) applied.
Then measure I1', I2', I3', Va' and Vb'.
2. Repeat the previous step with the first source reapplied(Vb1), but the second source (Vb2) replaced
with short circuit. Denote these measurements by I1'', I2'', I3'', Va'' and Vb''.
3. Compare the sum of each two measurement components with the corresponding total quantity
measured.
Figure5-1

51
Thevenin Equivalent and Maximum Power Transfer: 5.2.3
Again, the circuit of Figure 5-1 will be used to verify Thevenin’s and the Maximum Power
Transfer theorems experimentally.
5.2.3.1 Thevenin Equivalent:
Thevenin equivalent circuit wanted is that seen by the load resistance RL. Different methods
will be used to determine this circuit, as follows:
1. With both voltage source applied, remove RL and measure the open-circuit voltage Vao(o.c). This
is the equivalent Thevenin VTh.
2. Measure the short-circuit current Iao(s.c.).
3. Determine an experimental value for RTh as Vao(o.c)/ Iao(s.c.).
4. Replace voltage sources with short circuits, and measure the Thevenin equivalent resistance, RTh,
between node a and the reference node 0 with an ohmmeter.
The Thevenin circuit will be represented by a voltage source equal to (VTh) in series with resistor
equal to (RTh) see figure5-2.
5.2.3.2 Maximum Power Transfer:
The value of RL that will receive maximum power is determined experimentally as following:
1. Use decade box for RLin Figure5-1.
2. Measure the voltage VL across each RL value you select using voltmeter.
3. Calculate the power ⁄ .
4. Plot PL vs RL, and VL vs RL .
5. Form the plot determine Rmp and Vmp as following : see Figure5-3
a. Rmp= RTh.
b. Vmp=VTh/2
(a) (b)
Figure5-3: (a) PL vs RL curve (b) VL vs RL curve
Figure 5-2: Thevenin equivalent circuit

52
Source Transformations : 5.2.4
As we learned from the previous experiment , there is no ideal sources(The voltage source has
a series internal resistor, whereas the current source has a parallel internal resistor ) .
Therefore the goal of Source Transformations is to simplify the circuit and end up with all the
sources in the circuit as voltage sources or current sources.
The voltage source with a resistor in series is equal to a current source in parallel with the same
resistor. See Figure5-4
Mesh and Nodal Analysis: 5.3.1
Connect the circuit shown in Figure5-5:
Note: Note: R1, R2. R3, and R4 are in KΩ
1-Measure the actual resistance values used with DMM.
2- Use a nominal 150Ω for RL.
3-Adjust the two outputs of the dual power supply to 16V & 24V.
4- Measure the currents I1, I2, and I3 using the ammeter on the lowest possible range. similarly, use the
voltmeter to measure the node voltage Va, Vb.
Figure5-5
Figure 5-4

53
Superposition Principle: 5.3.2
The circuit in the Figure5-5 is also used to verify the superposition principle using the following
procedure.
1-Replace the 24-v source with S.C, but leave the 16-vsource applied measure the mesh current and
voltages:
Current Measured value
I'1
I'2
I'3
Voltage Measured Value
V'a
V'b
2- Replace the 16-v source with S.C, but leave the 24-vsource applied measure the mesh current and
voltages:
Current Measured Value
I1
I2
I3
Voltage Measured Value
Va
Vb
Current Measured value
I"1
I"2
I"3
Voltage Measured Value
V"a
V"b

54
Thevenin Equivalent: 5.3.3The circuit of Figure 5-5 will be used to verify Thevenin’s and the maximum power transfer
theorems.
1-With 16-v and 24-v sources applied, remove RL and measure the open-circuit voltage Vao (O.C) this
is the equivalent voltage Vth .
2- Measure the S.C current Iao.
Voltage Measured Value
Vth
Current Measured Value
Iao
3-Replace both voltage sources with S.C and measure the Thevenin Equivalent resistance RTh
between node a and the reference node.
Resistance Measured Value
RTH
Determine the Experimental values for RTH :
Vao (O.C) / I ao (S.C) =
Maximum Power Transfer Theory: 5.3.4
1- Use the Decade box for RL in Figure 5-5.
2- Measure the voltage VL across RL and fill the below table.
Resistance Voltage Power
200 Ω
300 Ω
400 Ω
500 Ω
600 Ω
800 Ω
1000 Ω
1500 Ω

55
3- Calculate the power:
PL = (VL)2 / RL
4- Plot PL & VL Vs RL:
5- From the plot determine the value Rmp of RL where PL is the Maximum
6- Find the Corresponding value Vmp of VL:
RTH = Rmp Difference
VTH / 2 = Vmp Difference
Source Transformations: 5.3.5
1- Connect the circuit shown at Figure5-6:
Figure 5-6
2- Set the short circuit current limit on each supply to about 200mA, And then set the open circuit
voltages Vs1 = 20V and Vs2 = 10V.

56
3- Construct the above circuit using 2-Watt resistors R1 = 330Ω and R2 = 100Ω. And use a decade box
for Ro.
4- Now use two DMM to measure Vo and Io for different values of Ro
Ro Measured Vo Measured Io
0 Ω
20 Ω
50 Ω
100 Ω
200 Ω
500 Ω
1 K Ω
5 K Ω
5- For the Circuit Shown at Figure5-7:
IS1 = VS1 / R1 =
IS2 = VS2 / R2 =
Ise = Is1 + Is2
6- For Ise use a short-circuit-current limited supply
7- Set the open-circuit voltage of the power supply to a value slightly above say 10% above, the value
Req = R1//R2 = R1R2/(R1 + R2) =
Ise.[R1.R2/(R1+R2)], the value is:
Vse = Ise * Req =
Vse +10% Vse =
Figure5-7

57
8- Now measure Vo and Io for this circuit, for the values of Ro as shown in the following table.
Ro Measured Vo Measured Io
0 Ω
20 Ω
50 Ω
100 Ω
200 Ω
500 Ω
1 K Ω
5 K Ω
9- We now construct the equivalent (transformed) circuit shown below with one voltage source as
shown in Figure5-8
10- set the open-circuit output voltage to the value Ise.[R1.R2/(R1+R2)] exactly.
Vse =
Figure5-8

58
11- With Vse calculated from previous part Vse = 12, measure Vo and Io for this circuit, for the values
of Ro as shown in the following table.
Ro Measured Vo Measured Io
0 Ω
20 Ω
50 Ω
100 Ω
200 Ω
500 Ω
1 K Ω
5 K Ω
By comparing the results of the three experiments we can see that the values are equal
with small differences. So we can simplify the circuit by transforming it into another form
to simplify the measurements and calculations.

59
Biomedical Engineering Department
Electric Circuits lab
BME (311)
Report #4-Pre
5Experiment#
DC Circuit Analysis
Student Name ………………………………………………………………………
Student ID…………………………………………………………………………..

61
Objectives:
1.
2.
3.
4.
Q#1: For the circuit shown in figure5-9 answer the following questions:
Note: R1, R2. R3, and R4 are in KΩ
Figure 5-9
1- Calculate I1 ,I2 ,I3 , Va, and Vb using mesh and nodal analysis.

61
2- For the same circuit Calculate I1 ,I3, Va, and Vb using superposition principle .

62
3- For the same circuit calculate VTH, RTh as seen by Rl.

63
Q#2: For the circuit shown in figure5-10 answer the following questions:
Figure 5-10
Note: Assume R1=330Ω, R2=100Ω, and RO=500Ω For all questions.
1- Calculate IO and VO.

64
2- Covert the circuit to a circuit has only one current source and three resistor with the previous values,
then calculate the current passing through Ro and the voltage across Ro.
3- Cover the circuit that you had at part(2) to a circuit has one voltage source and three resistor with
the previous values, then calculate the current passing Ro and the voltage across Ro.

65
Biomedical Engineering Department
Electric Circuits lab
BME (311)
Post Report #4
5Experiment#
DC Circuit Analysis
1. Student Name ………………………………………………………………………
Student ID…………………………………………………………………………..
2. Student Name ………………………………………………………………………
Student ID…………………………………………………………………………..
3. Student Name ………………………………………………………………………
Student ID…………………………………………………………………………..

66
1. Mesh and Nodal analysis:
Measure the currents I1, I2, and I3 using the ammeter on the lowest possible range. similarly, use the
voltmeter to measure the node voltage Va, Vb, then record all values at the below table.
Current Measured
Value
I1
I2
I3
Voltage Measured
Value
Va
Vb
Substitute the measured values of resistances, source voltages, and mesh currents into the mesh
equations, group all terms in every equation on one side and compare their sum with zero. Explain
any discrepancies.

67
Substitute the measured values of resistances and voltages into the nodal equations, group all terms
in every equation on one side and compare their sum with zero. Explain any discrepancies.
2. Part Two: Superposition Principle:
Replace the 24-v source with S.C, but leave the 16-vsource applied measure the mesh currents and
voltages:
Current Measured value
I'1
I'2
I'3
Voltage Measured Value
V'a
V'b

68
Replace the 16-v source with S.C, but leave the 24-vsource applied measure the mesh currents and
voltages:
Current Measured value
I''1
I''2
I''3
Voltage Measured Value
V''a
V''b
Compare the sum of each two measurement components with the corresponding total quantity
measured.
1. (I1' + I1'' = I1)
2. (I2' + I2'' = I2)
3. (I3' + I3 ''= I3)
4. (Va' + Va '' = Va)
5. (Vb' + Vb'' = Vb)

69
3. Thevenin Equivalen:.
Fill the below measurements:
Voltage Measured Value
Vth
Current Measured Value
Iao
Resistance Measured Value
RTH
Determine the Experimental values for RTH :
Vao (O.C) / I ao (S.C) =
4. Maximum Power Transfer:
Fill the below table :
Resistance (RL) Voltage Power ( PL = (VL )2 / RL )
200 Ω
300 Ω
400 Ω
500 Ω
600 Ω
800 Ω
1000 Ω
1500 Ω
71
Plot RL & VL Vs p:
From the plot determine the value Rmp of RL where PL is the Maximum.
From the plot determine the Corresponding value Vmp of VL where PL is the Maximum.
RTH Rmp Difference
VTH / 2 Vmp Difference

71
5. Source Transformations: Fill the below table with the measurement taken from the circuit at Figure5-6
Ro Measured Vo Measured Io
0 Ω
20 Ω
50 Ω
100 Ω
200 Ω
500 Ω
1 K Ω
5 K Ω
Perform the following calculations to find the value of the short circuit current at Figure5-7:
IS1 = VS1 / R1 =
IS2 = VS2 / R2 =
Ise = Is1 + Is2
Perform the following calculations to find the value of the open circuit voltage at Figure5- 4:
Ise * [R1.R2/(R1+R2)], the value is:
Req = R1//R2 = 21
R2*R1
RR =
Vse = Ise * Req =
Vse +10% Vse=

72
Fill the below table with the measurement taken from the circuit at Figure5-7:
Ro Measured Vo Measured Io
0 Ω
20 Ω
50 Ω
100 Ω
200 Ω
500 Ω
1 K Ω
5 K Ω
Calculate the open-circuit output voltage .
Vs= Ise.[R1.R2/(R1+R2)]
Fill the below table with the measurement taken from the circuit at Figure5-8:
Ro Measured Vo Measured Io
0 Ω
20 Ω
50 Ω
100 Ω
200 Ω
500 Ω
1 K Ω
5 K Ω
Compare the results of the three sets of measurements made, and explain any discrepancies.

73
Conclusion and discussion:
List your Conclusion about all parts of this experiment, and discuss the results as
points:

74
Laboratory Instrument Loading Effect Exp#6
Part-B
The objectives in this experiment are:
1. Measure circuit loading caused by Oscilloscope (Scope).
2. Determine the output (source) resistance of the Function Generator (FG).
Oscilloscope Loading: 6.2.1
A measurement procedure is now used to determine the equivalent input resistance Rin of one of
the Scope channels. The effect of this resistance on the accuracy of voltage amplitude measurements
will then be evaluated. The circuit shown in Figure 6-1(a) is used to measure the equivalent
resistance of the ammeter.
6.2.1.1 Function Generator equivalent resistance :
Like any other practical voltage source, the FG has a nonzero equivalent resistance, Rg
Therefore, at any fixed amplitude setting, its output voltage changes with load. The extent of this
change depends on the value of load resistance relative to that of Rg .The circuit shown in Figure 6-1
(b) is used to measure the equivalent resistance of the ammeter.
Figure 6-1: (a) Oscilloscope equivalent resistance circuit (b) Function generator equivalent
resistance circuit

75
Oscilloscope equivalent resistance:- 6.3.1
1. Construct the Circuit shown in Figure 6-2.
2. Use Decade box for R2.
3. Use R1 = 1MΩ.
R1 measured……………………………………………………………
of the scope 1then connect it to CH p-p1 KHz sine wave 8V Set the function generator frequency to4.
5. Connect CH2 with the voltage o/p at R2 set the scope DC coupling.
6. Measure V2:
R2 R2 measured By DMM V2
50 KΩ
1MΩ
2.2 MΩ
5 MΩ
You need to use the above results to calculate the equivalent Scope input resistance Rin using the
measured values of R1 and R2.
Figure 6-2
76
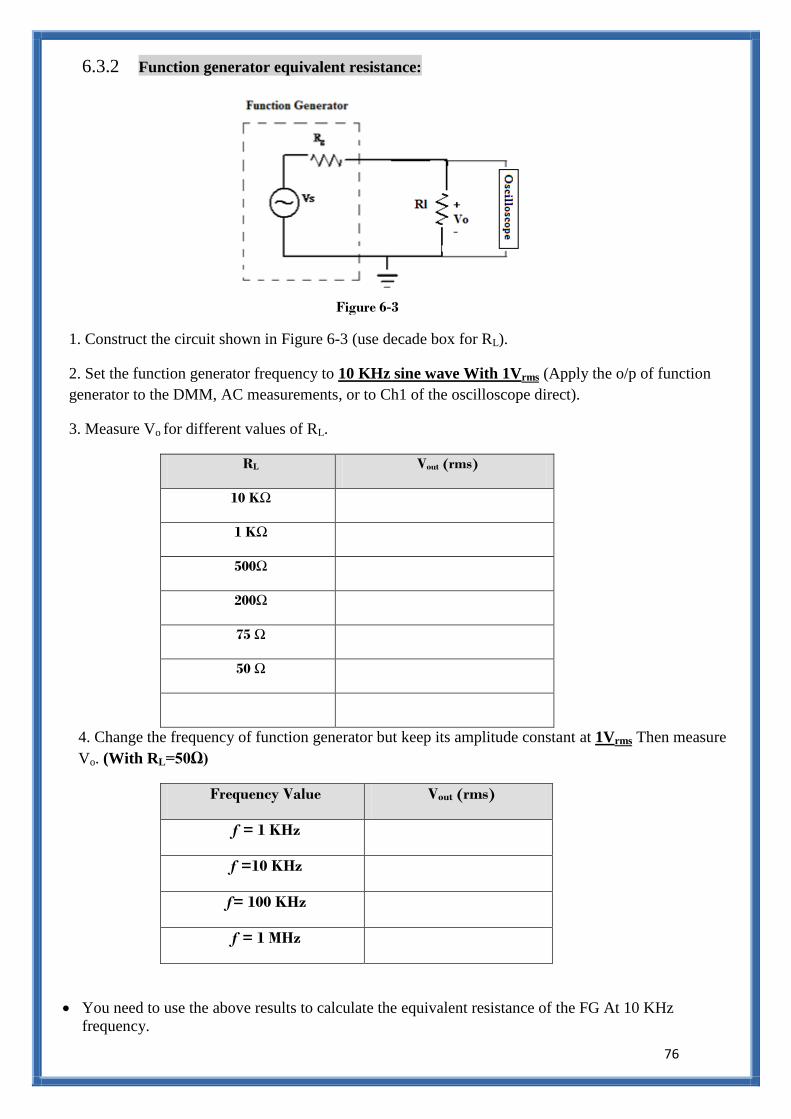
Function generator equivalent resistance: 6.3.2
1. Construct the circuit shown in Figure 6-3 (use decade box for RL).
(Apply the o/p of function rms0 KHz sine wave With 1V12. Set the function generator frequency to
generator to the DMM, AC measurements, or to Ch1 of the oscilloscope direct).
3. Measure Vo for different values of RL.
RL Vout (rms)
10 KΩ
1 KΩ
500Ω
200Ω
75 Ω
50 Ω
Then measure rms1Vat 4. Change the frequency of function generator but keep its amplitude constant
Vo. (With RL=50Ω)
Frequency Value Vout (rms)
ƒ = 1 KHz
ƒ =10 KHz
ƒ= 100 KHz
ƒ = 1 MHz
You need to use the above results to calculate the equivalent resistance of the FG At 10 KHz
frequency.
Figure 6-3

77
Biomedical Engineering Department
Electric Circuits lab
BME (311)
5 Report lab-Pre
6Experiment#
Laboratory Instrument Loading Effect Part-B
Student Name ………………………………………………………………………
Student ID…………………………………………………………………………..

78
Objectives:
1.
2.
Q#1: Use the circuit shown in Figure 6-4 to calculate the oscilloscope equivalent input resistance Rin
Note: assume Rg=0.
Figure 6-4

79
Q#2:Use the circuit shown in Figure 6-5 to calculate the equivalent resistance of the Function generator
Rg.
Figure0-5

81
Biomedical Engineering Department
Electric Circuits lab
BME (311)
Post Report #5
6Experiment#
Laboratory Instrument Loading Effect Part-B
1. Student Name ………………………………………………………………………
Student ID…………………………………………………………………………..
2. Student Name ………………………………………………………………………
Student ID…………………………………………………………………………..
3. Student Name ………………………………………………………………………
Student ID…………………………………………………………………………..

81
1.Oscilloscope equivalent resistance:-
After connecting the circuit shown in Figure 6-2 fill the below Values and answer the following
question:
R1 measured= ……………………………………………………………
Measure V2:
R2 R2 measured By DMM V2
50 KΩ
1MΩ
2 MΩ
3.3 MΩ
Use the above results to calculate the equivalent Scope input resistance Rin using the measured values
of R1 and R2 . Hint 1. Use data measured with R2= 1MΩ
1. (the same equation as voltmeter at experemant#4)

82
2. Function generator equivalent resistance:
After connecting the circuit shown in Figure4-8 fill the below tables and answer the following
questions:
RL Vout (rms)
10 KΩ
1 KΩ
500Ω
200Ω
75 Ω
50 Ω
Frequency Value Vout (rms)
F = 1 KHz
F =10 KHz
F = 100 KHz
F = 1 MHz
-What is the difference between rms value and Vo p-p?
Use the above results to calculate the equivalent resistance of the FG at 10 KHz frequency.

83
Conclusion and discussion:
List your Conclusion about all parts of this experiment, and discuss the results as
points:

84
:Inductance, Capacitance I-V Relations and Exp#7
Transients in RL and RC Circuits
2. Measurement verification of current-voltage (i-v) relations for inductance and capacitance.
3. Measurement verification of RL and RC circuit time constant.
Inductance and Capacitance: Voltage-Current Relations: 7.2.1
Ideal inductors and capacitors can store energy, but their average power loss is zero. Practical
components, however, lose a finite amount of energy. Therefore, in addition to inductance and
capacitance, their electrical circuit models include resistance as shown in Figure 7-1.
From the figure,
vt = vL + vRL = L
+ RL iL , (1)
and
it = iC + iRC = C
+ RL iL (2)
For high quality components, RL is relatively small and RC is relatively large. Thus, if diL/dt are
large enough, then VRL << VL and IRC << IC. Consequently,
≈ = L
(3)
and
≈ = C
(4)
Figure 7-1: Circuit Models for Practical Inductors and Capacitors

85
RL and RC Circuit Transients: 7.2.2
A series RL circuit with a step input voltage is shown in Figure 7-2 (a). For an initial current
iL(0) = Io, which may be positive or negative, the inductor current and voltage transient responses for
t ≥ 0 are given by:
iL(t) =
- (
)
(5)
and
( ) ( ) (6)
Where
τ = L / R (7)
is the circuit time constant. Figures 7-2 (b) and 7-2 (c) depict the responses given by equations (5)
and (6) with Vm > 0 and Io < 0.
A basic feature of the exponential function having the general form
y(t) = [ ] (8)
where yf is the final value of y and yi is its initial value, is that τ can be calculated using any two
points, y1 and y2, corresponding to t1 and t2, , respectively, viz,
τ=
( ) ( ) (9)
It is noted that yf ≈ y(t ≥ 5 τ ).
For the special case where (t2 –t1) = τ, equation (9) yields:
= ( ) ( ) = .0632 ( ) (10)
That is, about 63% of the change from y1 to yf occurs in one time constant. Likewise, one can
show that 99.3% of this change occurs in five time constants.
Figure 7-2: RL circuit and Transient Responses

86
Similarly, for the RC circuit shown in Figure 7-3(a), the transient responses VC (t) and iC(t) are
shown in Figures 7-5(b) and 7-5(c) for an initial capacitor voltage VC(0) = Vo < 0.
The applicable equations for this case are:
( ) ( ) (11)
( )
(12)
and
τ = RC (13)
Inductor Test : 7.3.1
1- Obtain an inductor decade box, and use DMM to measure the DC resistance RL at 400-mH setting.
2- Construct the circuit shown in Figure 7-4 Where Vs is 4-Vp-p, 2-KHz square wave, and Rs = 47 Ω
Figure 7-3: RC circuit and Transient Responses
Figure 7-4

87
RL (measured) = Rs = 47Ω L = 400 mH
Period of input Vs( t ) (T )=( 1/F )= ………………………….
3- Display the FG output voltage VS and V2 across Rs Make an accurate sketch of both signals
showing values of time and amplitude.
3.2. Capacitor Test:
1- Obtain a capacitor decade box and use a DMM to measure the DC resistance RC, at the 0.02 μF
setting.
2- Construct the circuit shown in the Figure 7-5 Where Vs is 8 Vp-p 200-Hz Triangular wave, and Rs=
500Ω.
3-Display the FG output Voltage V1 and V2 across RS together, uses DC coupling on both scope
channels
Figure 7-5

88
4- Sketch V1 & V2 showing values of time and amplitude.
3.3. RL-Circuit Transient Tests:
1- Construct the RL circuit of Figure 7-6, using R= 1 K ohm’s L = 1 H.
2- Measure the dc resistance of the inductor and the actual value of R with an Ohmmeter.
periment.ohm’s source resistance of the FG found in previous ex-Remember to record the 50 Note:
T/2
RRgRL
L
R(measured) RL Rg
Figure 7-6

89
3- Use a 100-Hz symmetrical square wave from the FG, with voltage = 4 Vp-p .
4- Connect the Oscilloscope to measure VL (t). See Figure 7-7
6- Make an accurate sketch of VL(t) ,then expand the time scale to make an accurate measurement of τ
using the 63% change Criterion.
Record the measured value…………………………………………………….
7- measure τ using two-point method:
t1= Y1= t2= Y2= Yf=
Figure 7-7: RL and RC Transient response

91
8- Exchange the positions of R and L in the circuit to enable the display of VR By Using a common
ground between the scope and FG, then sketch VR.
3.4. RC transient Tests:
1- For the RC circuit shown in Fig 6-8. Use Use a 100-Hz symmetrical square wave from the FG, with
voltage = 4 Vp-p .
2- Select R = 100 K Ω and C= 10 nF Measure the actual value of resistance R with an ohmmeter and
calculate theoretical value of the time τ = RC.
R( measured)=
τ = RC
3- Make an accurate sketch of VC(t) ,then expand the time scale to make an accurate measurement of τ
using the 63% change Criterion.
Record the measured value…………………………………………………….
Figure 6-8

91
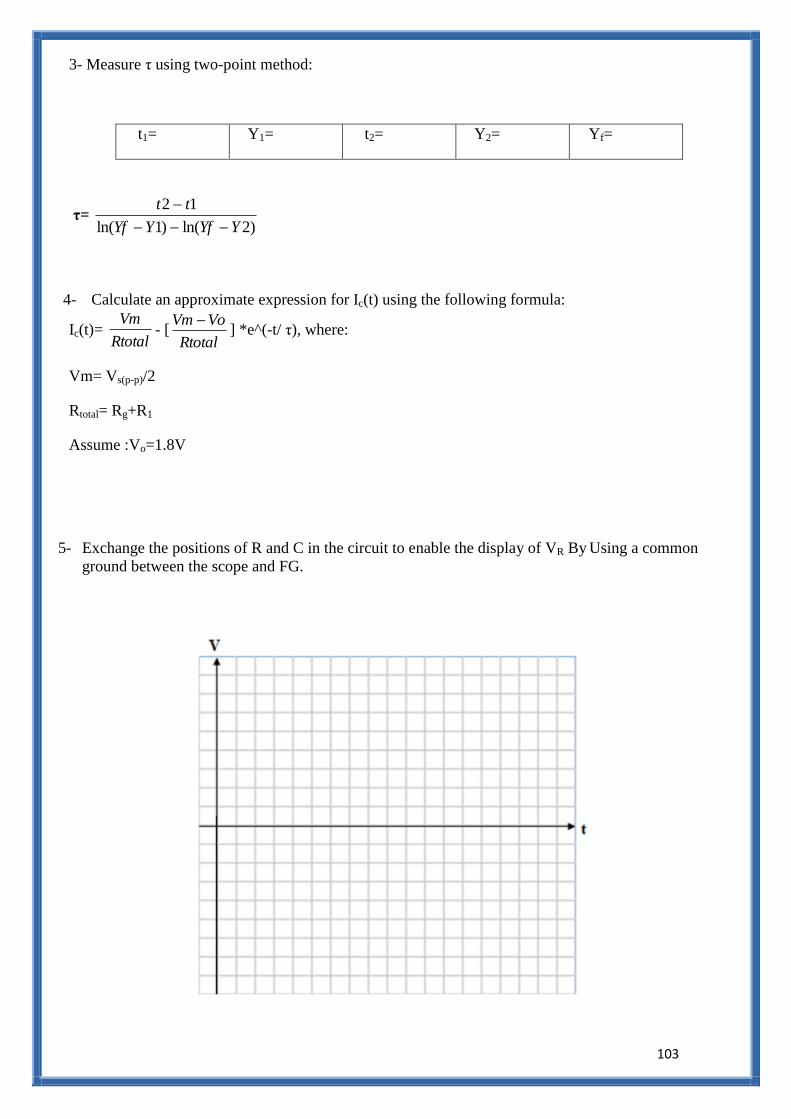
4- Measure τ using two-point method:
t1= Y1= t2= Y2= Yf=
5- Exchange the positions of R and C in the circuit to enable the display of VR by using a common
ground between the scope and FG, then sketch VR.

92
Biomedical Engineering Department
Electric Circuits lab
BME(311)
6Report #-Pre
7Experiment#
Inductance, Capacitance I-V Relations and Transients in RL and RC
Circuits
Student Name ………………………………………………………………………
Student ID…………………………………………………………………………..

93
Objectives:
1.
2.
Q#1: draw the ideal and the practical circuit model for the inductors and capacitors, then explain briefly
the reasons of the differences between ideal and piratical model.
Q#2: 1. For the RL circuit shown in Figure 7-8 plot Vin and Vout at the same sit of axis.
Note: show only the shape of both signals without the nominal values of the voltages.
Figure 7-8

94
2. Calculate the time constant (τ) for the circuit.
Q#3: 1. For the RC circuit shown in Figure 7-10 plot VS and Vout at the same sit of axis.
Note: show only the shape of both signals without the nominal values of the voltages
2. Calculate the time constant (τ) for the circuit.
Figure 7-10

95
Q#4: Derive the below equation:
Note: start from the following formula:
Q#5: use the same equation of question #4 to prove that about 63% of the change from Y1 to Yf occurs
in one time constant.

96
Biomedical Engineering Department
Electric Circuits lab
BME(311)
6Post Report #
7Experiment#
Inductance, Capacitance I-V Relations and Transients in RL and RC
Circuits
1. Student Name ………………………………………………………………………
Student ID…………………………………………………………………………..
2. Student Name ………………………………………………………………………
Student ID…………………………………………………………………………..
3. Student Name ………………………………………………………………………
Student ID…………………………………………………………………………..

97
1. Inductance and Capacitance Voltage-Current Relations.
1.1 Inductor Test:
1-Use DMM to measure the DC resistance RL at 400-mH setting…………
RL = Rs = 47Ω L = 400 mH
period of input Vs( t ) (T )=
2-Make an accurate sketch of both signals showing values of time and amplitude for (Ch1,Ch2)
3-Calculate (L / RL ), then compare with the value of (T/2).
L / RL =
T / 2 =

98
4-Calculate an approximate expression for IL = ( 1/ L) ∫ VL dt, using the 400-mH nominal value of L,
and VL ≈ Vs( t ), then Compared with measure iL (t).
iL (t)=(1/. 4) * ∫ VL.dt =
iL =V2(t) / Rs=
5. Use VL (t) = Vs (t) and diL / dt from measurements in the expression VL (t) =L* diL / dt to calculate
an approximation value for L compare with nominal value 400 mH.(Note: use only one point to
calculate L)

99
Capacitor Test: 1.2.
1- Make an accurate sketch of both signals showing values of time and amplitude for (Ch1,Ch2).
2- Calculate an approximate expression for iC (t) = C * dv / dt, By using the 0.02 μF Nominal value for C,
and dvc / dt = dvs / dt .then Compared with the measured iC(t).
ic(t) = C(dvC/dt) =
i Measured(t) = V2(t)/Rs =

111
3- In the expression VC(t)= (1/C) ∫iC(t) dt, use VC(t) ≈VS(t) and the measured iC(t) to calculate an
approximate value for C, then compare with the nominal value of .02µF.(Note: use only one point to
calculate C)
2. RL & RC Circuit Transients:
2.1.RL-Circuit Transient Tests:
1- Measure the dc resistance of the inductor and the actual value of R with an Ohmmeter and calculate
the value of ( τ ).
Rg RL R(measured)
RRgRL
L
T/2
2- Make an accurate sketch of VL(t) , then calculate ( τ ) using the 63% change criterion.
Record the measured value of τ =…………………………………………………….

111
3- measure τ using two-point method:
t1= Y1= t2= Y2= Yf=
τ= )2ln()1ln(
12
YYfYYf
tt
4- Calculate an approximate expression for IL(t) using the following formula:
IL(t)= Rtotal
Vm- [
Rtotal
Vm-Io] *e^(-t/ τ), where:
Vm= Vs(p-p)/2
Rtotal= RL+Rg+R1
Assume: Io=0A
5- Exchange the positions of R and L in the circuit to enable the display of VR By Using a common
ground between the scope and FG

112
6- Draw [VL(t)+V2(t) ]and compare the result with input voltage.
2.2.RC transient Tests:
1. Measure the actual value of resistance R with an ohmmeter and calculate theoretical value of the
time τ = RC.
R Measured =…………………………………………………
τ = RC =……………………………………………………..
2. Make an accurate sketch of Vc(t) , then calculate ( τ ) using the 63% change criterion.
Record the measured value of τ =…………………………………………………….
113
3- Measure τ using two-point method:
t1= Y1= t2= Y2= Yf=
τ=
4- Calculate an approximate expression for Ic(t) using the following formula:
Ic(t)= - [Rtotal
VoVm ] *e^(-t/ τ), where:
Vm= Vs(p-p)/2
Rtotal= Rg+R1
Assume :Vo=1.8V
5- Exchange the positions of R and C in the circuit to enable the display of VR By Using a common
ground between the scope and FG.
)2ln()1ln(
12
YYfYYf
tt
Rtotal
Vm

114
6- Draw [VC(t)+V2(t) ]and compare the result with input voltage.
Conclusion and discussion:
List your Conclusion about all parts of this experiment, and discuss the results as
points:

115
: Transients in RLC Circuits Exp#8
Measurement verification of transient parameters, in RLC circuits, viz, damping factor, and natural
frequency.
Series RLC Circuit Transients: 8.2.1
A series RLC circuit is shown in Figure8-1(a) with a step input voltage. This circuit
exhibits three types of transient responses. These are determined by the roots of the
characteristic equation (complex frequancies):
+
s+
=0 (1)
Viz,
s1,2 = -α ± √ (2)
The damping factor, α, and the resonant frequency, ωo, are given by:
α=
(3)
and
ωo=
√ (4)
circuits/072b46c4-order-https://voer.edu.vn/m/second*
Figure 8-1: (a) RLC circuit, and transient responses (b) underdamped, (c) critically damped,
(d) overdamped. *

116
8.2.1.1 The Underdamped Case:
If ωo > α the two roots s1 and s2 given by equation (2) are complex conjugate, and the response
is an exponentially decaying sinusoidal oscillation. Such a response is said to be underdamped.
Figure1(b) shows the current response with initial conditions VC(0) =VC0 and i(0)=0.
With assumed initial conditions VC(0) =VC0 and i(0) = 0, the current in Figure 8-1(b) is given by :
i (t) = Ie sin( ωd t), (5)
Where
ωd = √ (6)
is the natural frequency of the system, and
Ie = (Vm – VCO) / (ωd L) (7)
is the amplitude of the exponential envelope, ±Ie , shown by the dotted lines, at t = 0, and Vm is
the input square-wave peak. It is clear form equation (5) that the zero crossings of i(t) occur at
multiples of T/ 2, where T = 2 π/ωd is the period of oscillation. Thus, ωd , may be found from a
measurement of the period T , i.e.,
ωd= 2π/T (8)
For small damping , i.e., α << ωo, the exponential envelope in Figure8-1(b) is tangent to the i(t)
curve near the extremum points, which are also separated by T /2. Thus, may be calculated from
peak-current measurements using the relation:
α =
( ) (9)
8.2.1.2 The Critically-Damped Case:
If ωo = α, the two roots are real and equal, and the current response in this case is an exponential
pulse as shown in Figure8-1(c). This response is said to be critically damped, and settles toward its
final value considerably faster than the underdamped response.
Assuming the initial conditions are again VC(0) =VC0 and I (0) = 0, the exponential current pulse in
this case is given by:
i (t) =[(Vm - VC0)/L] t ( ) The maximum value of this current is :
Im = [2 (Vm - VC0) ] /R (11)
And occurs at
tm= 1/α (12)

117
an alternative formula to equation (12) for calculating α from experimental data is:
α = [ ln (t2/t1) / (t2 - t1)] (13)
where t2 and t1 are any two points with i(t2) = i(t2) = I12, as indicated in Figure8-1(c).
8.2.1.3 The Over-Damped Case:
If ωo < α, the two roots are real and unequal, and the current response in this case is an exponential
pulse as shown in Figure8-1(d). However, it settles toward its final value more slowly than the
critically damped response, and is said to be overdamped.
Once more assuming the initial conditions VC(0) =VC0 and I (0) = 0, the exponential current pulse in
this case is given by:
i (t) = A( ) (14)
Where
A= (Vm - VC0) / [( ) L ] (15)
+√ (16)
and
- √ ( )
The maximum value, Im, of this current occurs at:
tm = [ln( )] / ( ) (18)
In general, two distinct measurements of current, I1 = I(t1) and I2 = I(t2 ) are sufficient to determine
and . This, however, requires the numerical solution of two simultaneous transcendental
equations of the form (8).
With any appreciable overdamping, and become widely separated, i.e., << . For
example, if R = 2Rcd , then ≈14 . In this case, for two values of t appreciably greater than tm,
say t > 2 tm, the current may be well approximated by:
i (t) ≈ A ; t >2 tm. (19)
Now, is simply expressed in terms of two experimental measurements as illustrated in Figure7-1(c),
viz,
[ln ( )] / (t2 – t1) (20)
Substituting this and the previously measured value of ωo into equation (16) yields:
α ≈ ( +
) / 2 (21)
Finally, using equations (16) and (17),
= 2 α – α1 (22)

118
Parallel RLC Circuit Transients: 8.2.2
A parallel RLC circuit with a current source is the dual of a series RLC circuit with a voltage
source. Therefore, all the formulas given previously apply to the parallel circuit provided we
replace R with 1 /R, L with C, and C with L. see figure 8-2
The under damped Case: 8.3.1
Construct the circuit shown in Figure8-3 using the following R=1.5KΩ, L=500 mH, C=10 nF, and
use a square wave input with 4Vp-p at 100Hz frequency.
2-Measure the resistance of the inductor used -----------.
3-Display about 2 periods of Oscillation of voltage VR (t) which is proportional to the desired current
i(t). (See Figure 8-4).
Figure88-3
Figure8-4
Figure88-2

119
4-Measure the following data:
using equations (7), (8), (6) respectively then0 ω, ,dω, αresults to calculate need these Note: you
.compare these values with theoretical values
The Critically damped Case: 8.3.2
1- Use the same circuit as in Figure8-1, but Let R: decade Box.
2-Display VR (t) on Oscilloscope, Increase R Gradually until the oscillation just disappears. Figure8-5
3-Measure the Following data:-
Rmeasured Im: Vm/R tm t1 t2 I12: V12/R Vco
4- Interchange the physical position of Rand C in the test circuit. Display VC (t) on the oscilloscope and
measure its initial value VCO.
Note: you need the above results to calculate α using equations ( 12 ), (13) and compare these
values with theoretical value obtained using equation (16),also compare the value of Im measured
directly with the value calculated using equation (11).
T IP1 IP2
Figure 8-5

111
The over Damped Case: 8.3.3
1- Use the same circuit as in Figure8-1, but Let R=25KΩ
2-Display VR (t) on Oscilloscope, which is proportional to the desired current i(t), see Figure 8-6
3-Measure the following data:
tm t1 t2 Im I1 I2
Note: you need these results to calculate α1, α, and α2 using equations (20),(21),(22) then compare
these values with theoretical values .
Figure 8-6

111
Biomedical Engineering Department
Electric Circuits lab
BME (311)
7Report #-Pre
8Experiment#
Transients in RLC Circuits
Student Name ………………………………………………………………………
Student ID…………………………………………………………………………..
Objectives:

112
Q#1: For the circuit shown in Figure8-7:
1. Calculate the damping factor, the resonance frequency,
the complex frequencies, and the natural frequency.
2. Determine whether the response is under-damped, over-damped, or critically-damped.
Note: Show in details how you decide the answer.
3. plot i(t).
Note: show only the shape of the signals
Figure8-7

113
without the nominal values of the current.
Q#2: For the circuit shown in Figure8-8:
1. Calculate the damping factor, the resonance frequency, the complex frequencies, and the time where
the maximum value of the current occurs.
2. Determine whether the response is under-damped, over-damped, or critically-damped.
Note: Show in details how you decide the answer.
3. plot i(t).
Figure8-8

114
Note: show only the shape of the signals without the nominal values of the current.
Q#3: For the circuit shown in Figure 8-9:
1. Calculate the damping factor, the resonance
frequency, the complex frequencies, and the time
where the maximum value of the current occurs.
2. Determine whether the response is under-damped, over-damped, or critically-damped.
Note: Show in details how you decide the answer.
Figure 8-9

115
3. plot i(t).
Note: show only the shape of the signals without the nominal values of the current.

116
Biomedical Engineering Department
Electric Circuits lab
BME(311)
7Post Report #
8Experiment#
Transients in RLC Circuits
1. Student Name ………………………………………………………………………
Student ID…………………………………………………………………………..
2. Student Name ………………………………………………………………………
Student ID…………………………………………………………………………..
3. Student Name ………………………………………………………………………
Student ID…………………………………………………………………………..
1. The Under Damped Case:

117
1. Sketch VR(t):-
2. Fill the below measured values:
3. From the measured data, calculate:-
A. α from equation (9)
B. ωd from equation (8)
C. ωo from equation (6)
4. Calculate the above parameters using equations (3+4+5), then compare between the measured and
the calculated one.
T IP1 IP2

118
2. Critical damped Case:
1. The value of R (decade Box) =…………………………
2. Sketch VR(t), VC(t):
3. Fill the below measured values:
Im: Vm/R tm t1 t2 I12: V/R Vco
4. From the measured data, calculate, then compare with the theoretical values:

119
A. α from equation (12) then from equation (13)
B. Im from equation (11)
3. The Over Damped Case
1. Sketch VR(t):-
2. Fill the below measured values:
121
tm t1 t2 Im I1 I2
3. From the measured data, calculate, then compare with the theoretical values:
A. α1 from equation (20)
B. α from equation (21, 4)
C. α2 from equation (22)
Conclusion and discussion:
List your Conclusion about all parts of this experiment, and discuss the results as
points:

121
: Sinusoidal AC Circuit Measurements Exp#9

122
3. Learn phase-angle measurement techniques using the oscilloscope, and verify the
sinusoidal average power formula using the power factor.
2. Measure voltage and current phasors in a series-parallel RLC circuit to verify
Kirchhoff’s Current and Voltage Laws, KCL and KVL.
4. Determine the Thevenin equivalent of an RLC circuit by open- circuit voltage and short-
circuit current mea- surements.
5. Verify the Maximum Power Transfer Theorem for ac circuits.
Phase-Angle Measurements and Average Power: 9.2.1
There are two popular methods for measuring the phase angle between two sinusoidal functions
using the oscilloscope. These are now discussed and applied to measure the phase angle between
current and voltage in RL and RC series circuits.
9.2.1.1 Time-Difference Method:
Here, the two sinusoids are displayed on the oscilloscope together using a common trigger
signal. Figure 9-1 illustrates this for the two voltages:
( ) (1)
and
( ) ( ) (2)
Two adjacent zeros on v1(t) and v2(t) are shown at t1 and t2 as well as the common period T = 2π/ω.
Clearly, from equations (1) and (2), ωt1 = (2n + 1)π/2 = (ωt2 − θ), which gives:
radians, (3)
degree (4)
Thus, the phase angle θ is determined from the time difference ∆ t = ( ) and the period T.
*http://www.electronics-tutorials.ws/accircuits/phase-difference.html
9.2.1.2 Ellipse Method:
In this method, one of the sinusoidal functions is used to provide the oscilloscope horizontal
detection (x-axis), while the other is used to provide the vertical detection (y-axis). For example,
Figure 9-1: Time-Difference Method for phase-angle
Measurement.*
123
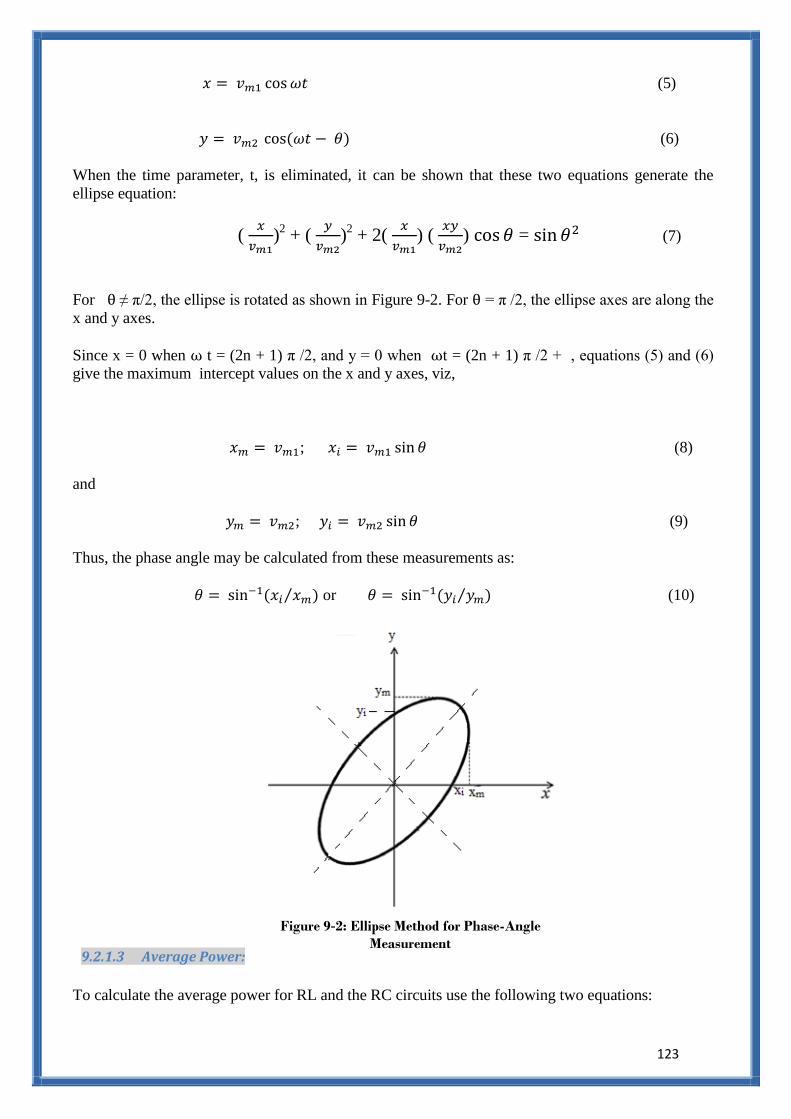
(5)
( ) (6)
When the time parameter, t, is eliminated, it can be shown that these two equations generate the
ellipse equation:
(
)
2 + (
)
2 + 2(
) (
) = (7)
For ≠ π/2, the ellipse is rotated as shown in Figure 9-2. For = π /2, the ellipse axes are along the
x and y axes.
Since x = 0 when t = (2n + 1) π /2, and y = 0 when t = (2n + 1) π /2 + , equations (5) and (6)
give the maximum intercept values on the x and y axes, viz,
; (8)
and
; (9)
Thus, the phase angle may be calculated from these measurements as:
( ⁄ ) or ( ⁄ ) (10)
9.2.1.3 Average Power:
To calculate the average power for RL and the RC circuits use the following two equations:
Figure 9-2: Ellipse Method for Phase-Angle
Measurement

124
=
, (11)
=
, (12)
where Vsm is the amplitude of Vs (t), is the power-factor angle, Im = Vm1 /R1 and R=R1 for
the RL circuit, and Im= Vm2/R2 and R= R2 for the RC circuit.
Current and Voltage Phasor Measurements: 9.2.2
A circuit containing R, L, and C elements in series and parallel combinations will be used to verify
Kirchhoff’s Current and Voltage Laws experimentally. Amplitude and phase-angle measurements
will be made to determine the phasors needed using circuit in Figure 9-3.
3. Thevenin Equivalent and Maximum Power Transfer:
Including inductors, capacitors, and linear AC sources into any linear circuit will not change the
circuit linearity, accordingly same superposition principle, source transformations, and Thevenin or
Norton , the geometry still applicable. (review expirement#5)
Phase- angle measurements. 9.3.1

125
1. Construct the circuit shown in Figure 9-3:-
2. Display the function generator output
voltage (Vs(t)) on Ch1 of the scope.
3. Display the output voltage ( VL(t)) on Ch2 of the scope.
4. With Vs as reference, measure the phase angle of VL(t) by using the time difference method.
VL=
∆t=
T=
θ = (∆t/T)*360º
VL(t)=
5. Place the scope in the XY mode to display an ellipse, Measure maximum and intercept values
along both axes to determine the phase angle ( see Figure 9-2)
Xi Xm Yi Ym
6. Repeat steps 4 and 5 above when Ch2 of scope is connected across the capacitor (VC(t)) in order
to measure the phase angle
VC=
∆t=
T=
θ = (∆t/T)*360º
VC(t)=
Xi Xm Yi Ym
Current and Voltage Phasor Measurements:- 9.3.2
1-Use the same circuit in Figure9-3:
2-Exchange the position of L and R2 and of C and R3
Figure 9-3

126
3- With Vs as reference, measure the amplitude and phase angle of V2(t) and of V3(t) and Vab(t) using
the time difference method.
Note: 1. To measure V2 Interchange the physical position of R2 and L in the test circuit.
2. To measure V3 Interchange the physical position of R3 and C in the test circuit.
Vab ∆t V2 ∆t V3 ∆t
5- Turn the function-generator connections around so that its ground is connected to point g2, then
measure the amplitude and phase angle of v1(t)
V1=
∆t=
Thevenin Equivalent and Maximum Power Transfer Theorem:- 9.3.3
Connect the circuit in Figure9-4:

127
1- Measure the amplitude and phase angle of the open- circuit voltage Vxy(oc) and the short circuit
current IXY(sc).
2- From these two measurements find ZTh= RTh+ jXTh= V xy (oc)/Ixy(sc).
Figure 9-4
128
Biomedical Engineering Department
Electric Circuits lab
BME (311)
Pre-Report #8
Experiment#9
Sinusoidal AC Circuit Measurements
Student Name ………………………………………………………………………
Student ID…………………………………………………………………………..

129
Objectives:
1.
2.
3.
4.
Q#1: convert the following phasor form into rectangular for:
3∟18o
Q#2: Figure9-5 shows Three sinusoids signal that displayed together using common trigger
signal, answer the following two questions:
1. Use V1 (t) as reference signal, then calculate the phase shift (in radian then in degree) between
the V1 (t) and V2 (t).
Figure99-5
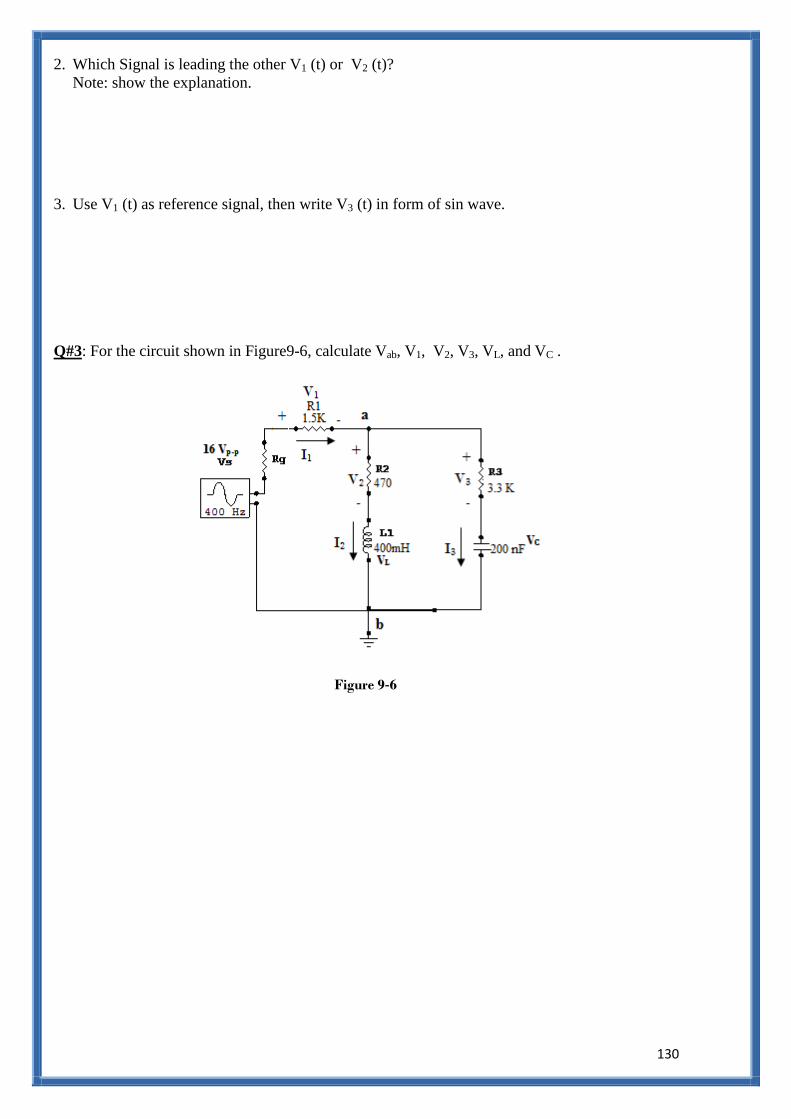
131
2. Which Signal is leading the other V1 (t) or V2 (t)?
Note: show the explanation.
3. Use V1 (t) as reference signal, then write V3 (t) in form of sin wave.
Q#3: For the circuit shown in Figure9-6, calculate Vab, V1, V2, V3, VL, and VC .
Figure 9-6

131

132
Q#4: For the circuit shown in Figure9-7, calculate VTh, and ZTh as seen by X and Y points.
Figure9-7

133
Biomedical Engineering Department
Electric Circuits lab
BME (311)
Post Report #8
Experiment#9
Sinusoidal AC Circuit Measurements
1. Student Name ………………………………………………………………………
Student ID…………………………………………………………………………..
2. Student Name ………………………………………………………………………
Student ID…………………………………………………………………………..
3. Student Name ………………………………………………………………………
Student ID…………………………………………………………………………..

134
1. Phase- angle measurements:
1. Fill the below table referring to measurement at circuit of Figure9-3:
VL ∆t θ VL(t) VC ∆t θ VC(t)
2. After place the scope in the XY mode Fill the below table, then compare the value of θ with that
from the previous part.
A. For the inductor :
Xi Xm θ =Sin
-1(
Xm
Xi)
Yi Ym θ =Sin
-1(Ym
Yi)
B. For the capacitor :
Xi Xm θ =Sin
-1(
Xm
Xi)
Yi Ym θ =Sin
-1(Ym
Yi)
2. Current and Voltage Phasor Measurements:
1. Measure the amplitude and phase angle of V3(t), V2(t), and Vab (t) using the time- difference
method.
Note: Express the phasors corresponding to the measured voltages in rectangular form.
V2 θ V3 θ Vab θ

135
V2(t)=
V3(t)=
Vab(t)=
2. Turn the function-generator connections around so that its ground is connected to point g2, then
measure the amplitude and phase angle of v1(t)
Note: Express the phasors corresponding to the measured voltages in rectangular form.
V1 Θ
V1(t) =
3. Calculate the current phasor using the previously measured value of voltage V1, V2, and V3 and
check KCL.
I1=1
1
R
V I2=
2
2
R
V I3=
3
3
R
V
I1-I2-I3

136
4. Check voltage sums and KVL. For example, Vab= VL+ V2= VC+ V3,and V1+ V2+ V L− Vs= 0.
5. Check power balance by calculating the entries of the following table:
VS*I1*cos(θ1)
(I12*R1)+ (I2
2*R2)+ (I3
2*R3)

137
3. Thevenin Equivalent and Maximum Power Transfer:-
1-Measure the amplitude and phase angle of the open- circuit voltage Vxy(oc), the short –
circuit current IXY(sc), and find ZTh= Vxy (oc)/Ixy(sc).
Voc
θOC
ISC
θSC
Zth=Isc
Voc
Zth*
2- Find ZTh= RTh+ jXTh.
3- Determine the value of L and C for the ZTh and conjugate ZTh*

138
Conclusion and discussion :
List your Conclusion about all parts of this experiment, and discuss the results as
points:

139
References :
[1] W. Hayt, J. Kemmerly, and S. Durbin, Engineering Circuit Analysis, 8 ed.: McGraw-Hill, 2011.
[2] I. Babaa, "Electrical Circuit Laboratory," Jordan University of Science and Tehnology1992.