board monitor – quarterly report
DESCRIPTION
Board Monitor – Quarterly Report. Quality and Performance Indicators. December 2007. Table of Contents. HHS Strategy Map3 Introduction4 Goal #1 - We meet or exceed our communities’ expectations5 - PowerPoint PPT PresentationTRANSCRIPT

1
Board Monitor – Quarterly ReportQuality and Performance Indicators
December 2007
2
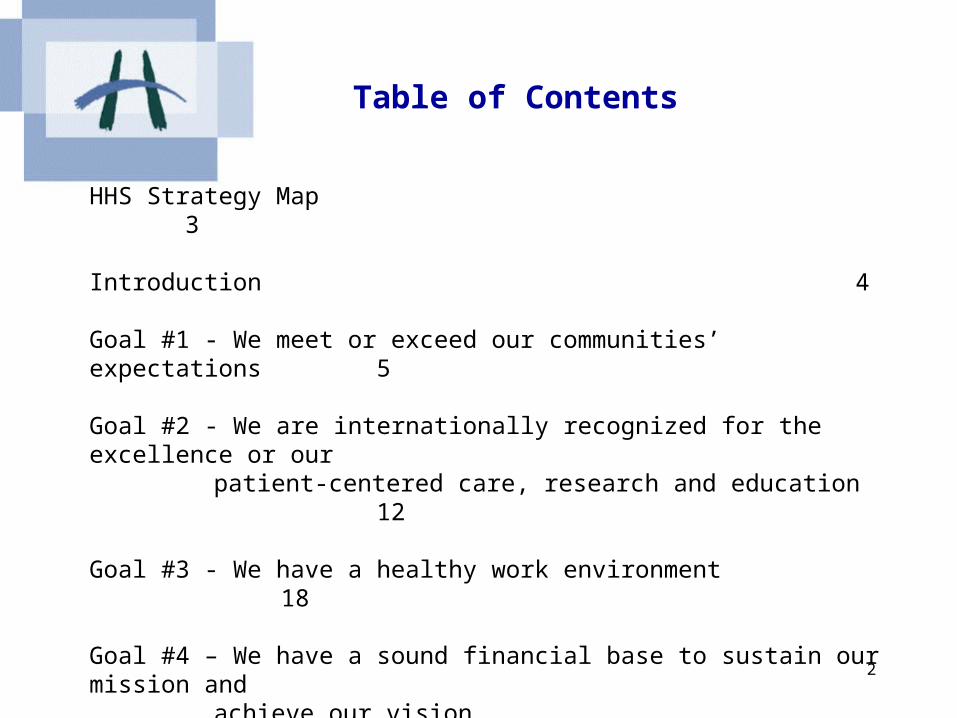
Table of Contents
HHS Strategy Map 3
Introduction 4
Goal #1 - We meet or exceed our communities’ expectations 5
Goal #2 - We are internationally recognized for the excellence or our patient-centered care, research and education 12
Goal #3 - We have a healthy work environment 18
Goal #4 – We have a sound financial base to sustain our mission and achieve our vision 22
Goal #5 –We create a sustainable and aligned system through action and leadership 26

3
HHS Strategy MapHHS Strategy MapVision:
Leaders in exemplary care, innovation and academic excellence.
Mission:To provide excellent health care for the people and communities we serve and to advance health care
through education and research.
Strategic Goals4. We have a sound financial base to
sustain our mission and achieve our vision.
5. We create a sustainable and aligned system through action and leadership
Strategic Goals1. We meet or exceed our communities’
expectations.2. We are internationally recognized for the
excellence of our patient-centred care,research and education.
3. We have a healthy work environment.
Values:RespectCaring
InnovationAccountability
Priorities to Achieve Strategic Goals
HHS 2007/08
Learning &InnovationPerspective
HumanCapital
InformationCapital
Organization Capital
Culture LeadershipCorporate Change
& AlignmentTeamwork
Internal Process Perspective
Patient, Family, Customer Perspective
Acc
ess
to C
are
Qualit
y Init
iati
ves
Opera
tional
Perf
orm
ance
Healt
hy P
eople
and
Envir
onm
ents
Syst
em
Thin
kin
g &
L
eaders
hip
Fiduciary Perspective

4
The Hamilton Health Sciences (HHS) Board Monitor provides a quarterly report on Key Quality and Performance Indicators. The latter have been identified by the Board of Trustees to reflect the Hospital’s five Strategic Goals. HHS has defined priorities to achieve these strategic goals:
1. Access to Care:
The timely access to health services is to achieve the best possible health outcomes. This includes a broad set of concerns that center
on the degree to which needed services are available in a timely manner from the health care system.
2. Quality Initiatives:
The extent to which health services for individuals and populations are provided in a manner that increases the likelihood of desired health outcomes and are consistent with current evidence and best practice. This area includes Patient Safety, Appropriateness of Care
and Application of best Practices.
3. Operational Performance:
The process of measuring, monitoring and adjusting organizational activity with the goal to optimize operational decisions and improve performance. This area includes initiatives related to efficiency and effectiveness.
4. Healthy People and Environments:
The ability to create and sustain a positive work environment. This area includes initiatives related to staff attraction, retention, motivation, culture, safety, teamwork and leadership.
5. System Thinking and Leadership:
The commitment to enhance the health care system through building and leveraging strategic relationships with other organizations and individuals in the public and private sectors (includes HHS Foundation). This area includes
integration, innovation and knowledge transfer.
The Board Monitor is organized by Strategic Goals and the Key Quality and Performance Indicators (KPI) reflect the performance within the Goals. Many of the Key Performance Indicators have benchmarks or targets assigned to them based on either industry rates, best practice and/or LHIN/Ministry targets.
Introduction

5
Strategic Goal #1
We meet or exceed our communities’ expectations
Indicators:• Emergency Department Wait Times By Site – Quality Indicator• Target volumes/actuals – Performance Indicator• ALC Rates – Quality Indicator• Wait Time Strategy by Service – Quality Indicator

6
Emergency Department Wait Times By Triage LevelQuality Indicator
Source: HHS ADT/ED Meditech System HAPS Indicator
Wait Times are based on the time fromArrival to Departure for all visits to the Emergency Department (ambulatory and inpatient) by triage category.
CTAS Codes:Triage 1: ResuscitationTriage 2: EmergentTriage 3: UrgentTriage 4: Less UrgentTriage 5: Non Urgent
E m e r g e n c y D e p t W a i t T i m e s f r o m A r r i v a l t o D e p a r t E D f o r T r i a g e 1 , 2 , 3
0 .0 0
2 .0 0
4 .0 0
6 .0 0
8 .0 0
10 .0 0
12 .0 0
14 .0 0
D e c - 0 6 J a n - 0 7 F e b - 0 7 M a r- 0 7 A p r- 0 7 M a y- 0 7 J u n - 0 7 J u l- 0 7 A u g - 0 7 S e p - 0 7 O c t - 0 7 N o v - 0 7 D e c - 0 7
Ho
ur
G e n e r a l H e n d e r s o n M c M a s te r M O H T a r g e t
E m e r g e n c y D e p t W a i t T I m e s f r o m A r r i v a l t o D e p a r t E D f o r T r i a g e 4 , 5
2 .0 0
2 .5 0
3 .0 0
3 .5 0
4 .0 0
4 .5 0
D e c - 0 6 J a n - 0 7 F e b - 0 7 M a r- 0 7 A p r- 0 7 M a y- 0 7 J u n - 0 7 J u l- 0 7 A u g - 0 7 S e p - 0 7 O c t - 0 7 N o v - 0 7 D e c - 0 7
Ho
ur
G e n e r a l H e n d e r s o n M c M a s te r M O H T a r g e t

7
Target Volumes/ActualsPerformance Indicator
Source: HHS Data Repository HAPS Indicators
H A P S V o l u m e I n d i c a t o r s D e f i n i t i o nA p r - D e c 2 0 0 7
A p r - D e c 2 0 0 7 H H S B u d g e t V a r i a n c e H H S B u d g e t M O H T a r g e t * M O H C o r r i d o r *
W e i g h t e d C a s e s C IH I D A D P A C 1 0 R IW a n d Q u a l i f y i n g S D S 5 7 , 8 6 3 5 6 , 1 2 7 1 , 7 3 6 6 9 , 6 3 0 7 0 , 9 0 1 6 7 , 5 4 1 - 7 1 , 7 1 9
A c u t e S e p a r a t i o n s 2 8 , 7 7 7 2 7 , 8 2 1 9 5 6 3 7 , 1 1 4 3 4 , 0 8 8 3 3 , 9 7 0 - 3 6 , 8 0 0A c u t e P a t i e n t D a y s 2 0 2 , 1 6 3 2 0 0 , 0 0 8 2 , 1 5 5 2 6 6 , 3 4 2 2 6 6 , 9 1 8 2 5 3 , 2 0 9 - 2 6 8 , 8 7 1R e h a b i l i t a t i o n S e p a r a t i o n s R e h a b i l i t a t i o n 9 5 8 1 , 1 6 6 - 2 0 8 1 , 5 5 6 n o t a r g e t n o t a r g e tR e h a b i l i t a t i o n P a t i e n t D a y s R e h a b i l i t a t i o n 3 0 , 6 4 5 3 4 , 3 1 6 - 3 , 6 7 1 4 5 , 6 7 3 4 3 , 4 9 2 4 2 , 7 4 2 <
E m e r g e n c y V i s i t s A l l E D V i s i t s 8 2 , 1 9 1 8 1 , 8 9 9 2 9 2 1 0 9 , 0 0 0 1 0 9 , 7 9 4 1 0 6 , 5 6 0 <
In p a t i e n t S u r g e r y C a s e s D o n e i n M a i n O R 1 0 , 6 4 1 1 0 , 9 3 3 - 2 9 2 1 4 , 7 3 9 n o t a r g e t n o t a r g e tO u t p a t i e n t S u r g e r y C a s e s D o n e i n M a i n O R 8 , 7 6 0 8 , 6 0 6 1 5 4 1 1 , 5 4 5O u t p a t i e n t S u r g e r y C a s e s S D S P r o c e d u r e R m s 3 , 9 2 9 3 , 7 5 7 1 7 2 5 , 0 0 0
A m b u l a t o r y C l i n i c s e x c l E D , D / N a n d S D S 5 1 6 , 6 1 3 4 9 7 , 6 9 0 1 8 , 9 2 3 6 6 0 , 0 0 0 6 0 1 , 6 0 0 6 0 1 , 6 0 0 <
* M O H T a r g e t b a s e d o n 3 y e a r r o l l i n g a ve r a g e a n n u a l f i g u r e a n d c o r r i d o r s e t a s a % a b o ve / b e l o w t h a t t a r g e t . T h e c o r r i d o r va r i e s d e p e n d i n g o n i n d i c a t o r ( s e e H A P S d e t a i l t e c h n i c a l s p e c i f i c a t i o n s )N o t e : C IH I d a t a i s e s t i m a t e d fo r 2 0 0 7 / 0 8 y t d S e p t e m b e r
R e d : P r o j e c t e d o u t s i d e o f M O H C o r r i d o r a n d w i l l r e s u l t i n fo r m a l r e v i e wY e l l o w a n d G r e e n : W i t h i n o r b e t t e r t h a n M O H C o r r i d o r w i t h n o fo r m a l r e v i e w
D i s c h a r g e / D e a t h s e x c l b a s s i n e t t e s
1 2 , 4 9 1 1 1 , 8 5 7 <
8
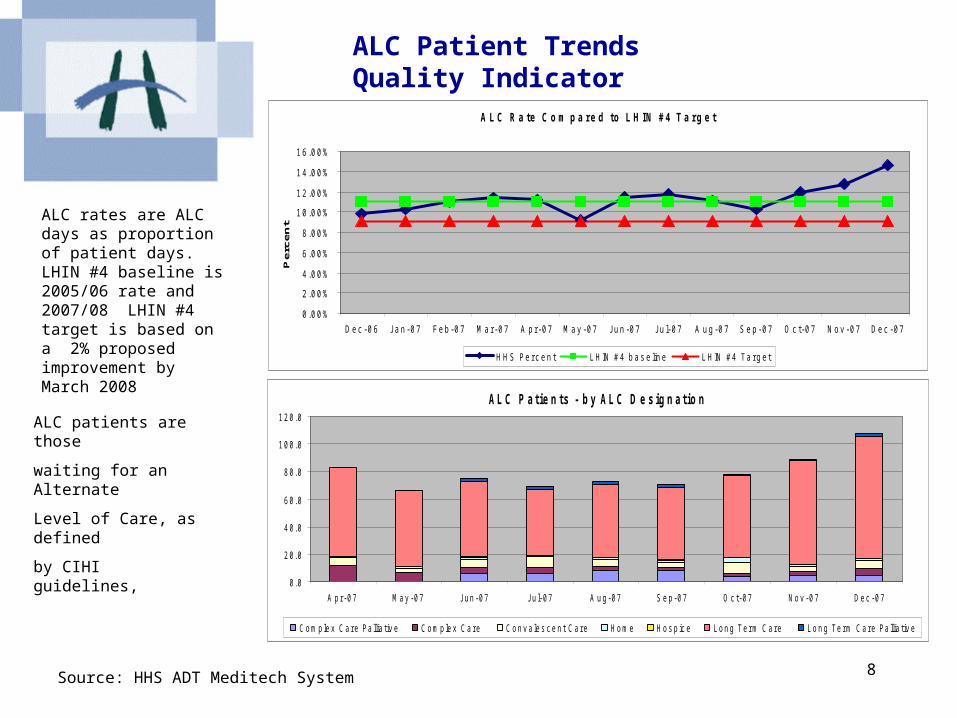
ALC Patient TrendsQuality Indicator
A L C R a t e C o m p a r e d t o L H I N # 4 T a r g e t
0 . 0 0 %
2 . 0 0 %
4 . 0 0 %
6 . 0 0 %
8 . 0 0 %
1 0 . 0 0 %
1 2 . 0 0 %
1 4 . 0 0 %
1 6 . 0 0 %
D e c - 0 6 J a n - 0 7 F e b - 0 7 M a r - 0 7 A p r - 0 7 M a y - 0 7 J u n - 0 7 J u l- 0 7 A u g - 0 7 S e p - 0 7 O c t - 0 7 N o v - 0 7 D e c - 0 7
Pe
rce
nt
H H S P e r c e n t L H IN # 4 b a s e lin e L H IN # 4 T a r g e t
A L C P a t i e n t s - b y A L C D e s i g n a t i o n
0 . 0
2 0 . 0
4 0 . 0
6 0 . 0
8 0 . 0
1 0 0 . 0
1 2 0 . 0
A p r - 0 7 M a y - 0 7 J u n - 0 7 J u l- 0 7 A u g - 0 7 S e p - 0 7 O c t - 0 7 N o v - 0 7 D e c - 0 7
C o m p le x C a r e P a llia t iv e C o m p le x C a r e C o n v a le s c e n t C a r e H o m e H o s p ic e L o n g T e r m C a r e L o n g T e r m C a r e P a llia t iv e
ALC rates are ALC days as proportion of patient days. LHIN #4 baseline is 2005/06 rate and 2007/08 LHIN #4 target is based on a 2% proposed improvement by March 2008
ALC patients are those
waiting for an Alternate
Level of Care, as defined
by CIHI guidelines,
Source: HHS ADT Meditech System
9
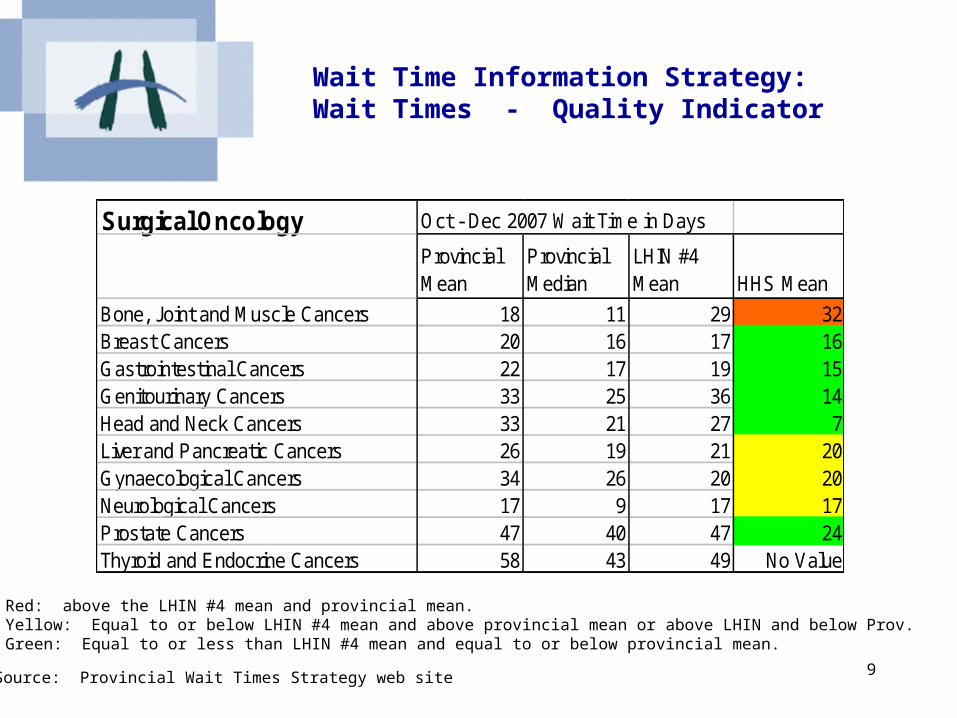
Wait Time Information Strategy: Wait Times - Quality Indicator
Source: Provincial Wait Times Strategy web site
Red: above the LHIN #4 mean and provincial mean.Yellow: Equal to or below LHIN #4 mean and above provincial mean or above LHIN and below Prov.Green: Equal to or less than LHIN #4 mean and equal to or below provincial mean.
Surgical Oncology Oct - Dec 2007 Wait Time in Days
Provincial Mean
Provincial Median
LHIN #4 Mean HHS Mean
Bone, Joint and Muscle Cancers 18 11 29 32Breast Cancers 20 16 17 16Gastrointestinal Cancers 22 17 19 15Genitourinary Cancers 33 25 36 14Head and Neck Cancers 33 21 27 7Liver and Pancreatic Cancers 26 19 21 20Gynaecological Cancers 34 26 20 20Neurological Cancers 17 9 17 17Prostate Cancers 47 40 47 24Thyroid and Endocrine Cancers 58 43 49 No Value

10
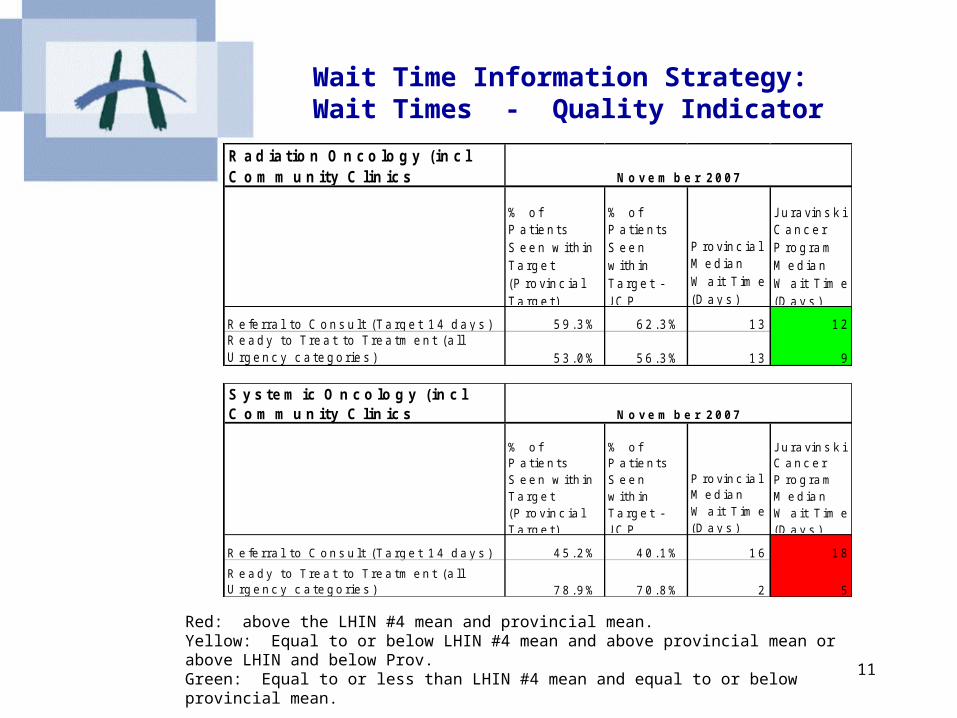
Wait Time Information Strategy: Wait Times - Quality Indicator
Source: Provincial Wait Times Strategy web site
Red: above the LHIN #4 mean and provincial mean.Yellow: Equal to or below LHIN #4 mean and above provincial mean or above LHIN and below Prov.Green: Equal to or less than LHIN #4 mean and equal to or below provincial mean.
Diagnostic Imaging Oct - Dec 2007 Wait Time in DaysProvincial Mean
Provincial Median
LHIN #4 Mean HHS Mean
Magnetic Resonance Imaging (MRI) 51 31 50 55Computerized Tomography (CT) 24 11 20 23
Orthopedic Surgery Joints Oct - Dec 2007 Wait Time in DaysProvincial Mean
Provincial Median
LHIN #4 Mean HHS Mean
Joint Hip Replacement 96 66 84 84Joinjt Knee Replacement 121 81 116 110
Cardiac Oct - Dec 2007 Wait Time in DaysProvincial Mean
Provincial Median
LHIN #4 Mean HHS Mean
Angiography 9 7 7 7Angioplasty 5 3 5 5Cardiac Bypass Surgery 21 15 15 15
11
Wait Time Information Strategy: Wait Times - Quality Indicator
Red: above the LHIN #4 mean and provincial mean.Yellow: Equal to or below LHIN #4 mean and above provincial mean or above LHIN and below Prov.Green: Equal to or less than LHIN #4 mean and equal to or below provincial mean.
R a d ia t io n O n c o lo g y ( in c l C o m m u n i t y C l in ic s
% o f P a t i e n t s S e e n w i t h i n T a r g e t ( P r o v i n c i a l T a r g e t )
% o f P a t i e n t s S e e n w i t h i n T a r g e t - J C P
P r o v i n c i a l M e d i a n W a i t T i m e ( D a y s )
J u r a v i n s k i C a n c e r P r o g r a m M e d i a n W a i t T i m e ( D a y s )
R e fe r r a l t o C o n s u l t ( T a r g e t 1 4 d a y s ) 5 9 . 3 % 6 2 . 3 % 1 3 1 2R e a d y t o T r e a t t o T r e a t m e n t ( a l l U r g e n c y c a t e g o r i e s ) 5 3 . 0 % 5 6 . 3 % 1 3 9
N o v e m b e r 2 0 0 7
S y s t e m ic O n c o lo g y ( in c l C o m m u n i t y C l in ic s
% o f P a t i e n t s S e e n w i t h i n T a r g e t ( P r o v i n c i a l T a r g e t )
% o f P a t i e n t s S e e n w i t h i n T a r g e t - J C P
P r o v i n c i a l M e d i a n W a i t T i m e ( D a y s )
J u r a v i n s k i C a n c e r P r o g r a m M e d i a n W a i t T i m e ( D a y s )
R e fe r r a l t o C o n s u l t ( T a r g e t 1 4 d a y s ) 4 5 . 2 % 4 0 . 1 % 1 6 1 8
R e a d y t o T r e a t t o T r e a t m e n t ( a l l U r g e n c y c a t e g o r i e s ) 7 8 . 9 % 7 0 . 8 % 2 5
N o v e m b e r 2 0 0 7

12
Indicators: •Infection Rates – Quality Indicator•Hospital Standardized Mortality Rates (HSMR) – Quality Indicator•Dollars Spent on Research – Performance Indicator
Strategic Goal #2
We are internationally recognized for the excellence of our patient-centered care, research and education
13
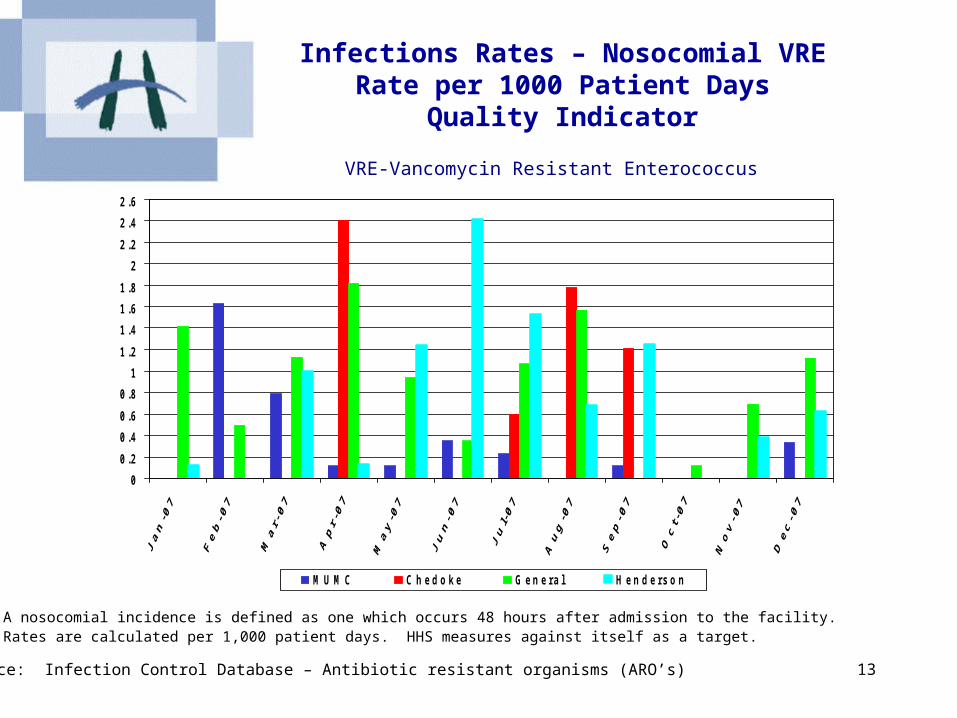
Infections Rates – Nosocomial VRERate per 1000 Patient Days
Quality Indicator
VRE-Vancomycin Resistant Enterococcus
Source: Infection Control Database – Antibiotic resistant organisms (ARO’s)
A nosocomial incidence is defined as one which occurs 48 hours after admission to the facility. Rates are calculated per 1,000 patient days. HHS measures against itself as a target.
0
0 .2
0 .4
0 .6
0 .8
1
1 .2
1 .4
1 .6
1 .8
2
2 .2
2 .4
2 .6
M U M C C h e d o k e G e n e r a l H e n d e r s o n
14
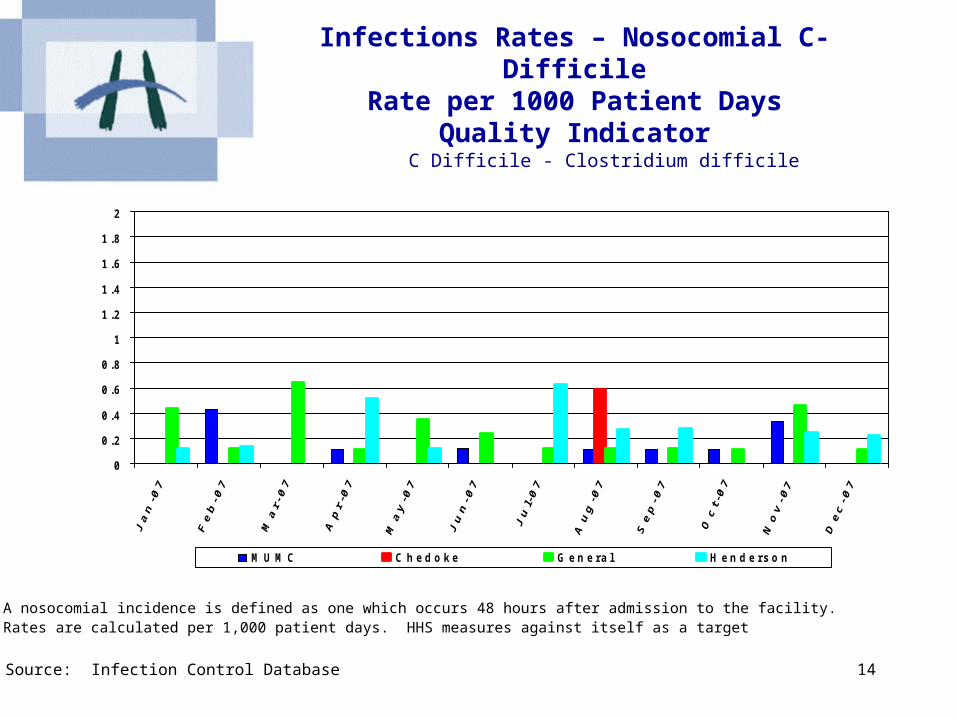
Infections Rates – Nosocomial C-DifficileRate per 1000 Patient Days
Quality Indicator
C Difficile - Clostridium difficile
Source: Infection Control Database
A nosocomial incidence is defined as one which occurs 48 hours after admission to the facility. Rates are calculated per 1,000 patient days. HHS measures against itself as a target
0
0 .2
0 .4
0 .6
0 .8
1
1 .2
1 .4
1 .6
1 .8
2
M U M C C h e d o k e G e n e r a l H e n d e r s o n
15
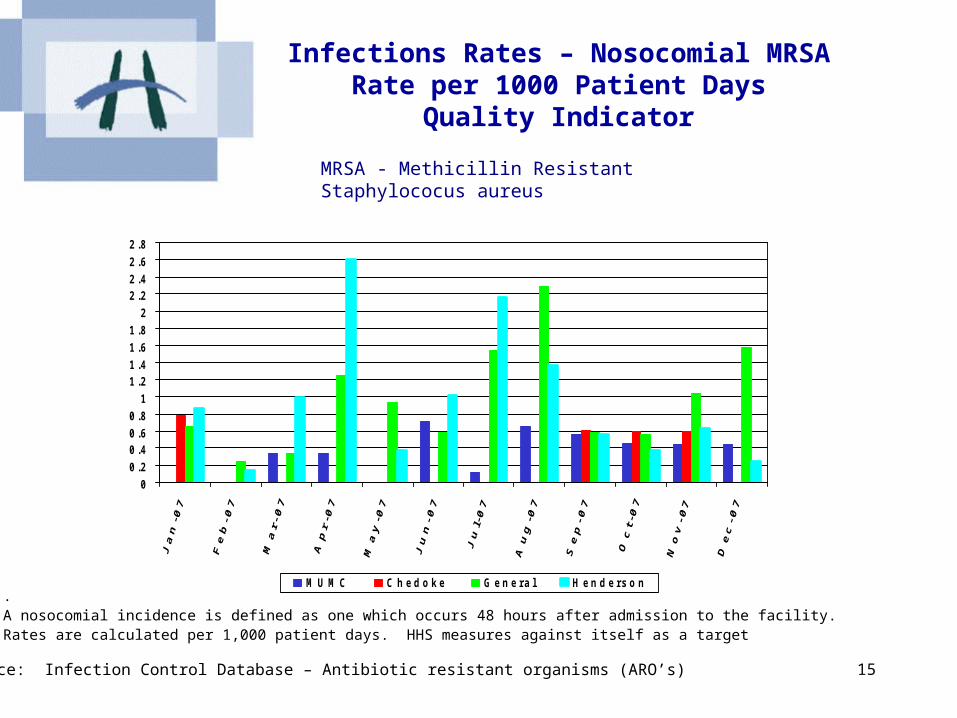
Infections Rates – Nosocomial MRSARate per 1000 Patient Days
Quality Indicator
MRSA - Methicillin Resistant Staphylococus aureus
Source: Infection Control Database – Antibiotic resistant organisms (ARO’s)
.A nosocomial incidence is defined as one which occurs 48 hours after admission to the facility. Rates are calculated per 1,000 patient days. HHS measures against itself as a target
0
0 .2
0 .40 .6
0 .8
1
1 .21 .4
1 .6
1 .8
2
2 .22 .4
2 .6
2 .8
M U M C C h e d o k e G e n e r a l H e n d e r s o n
16
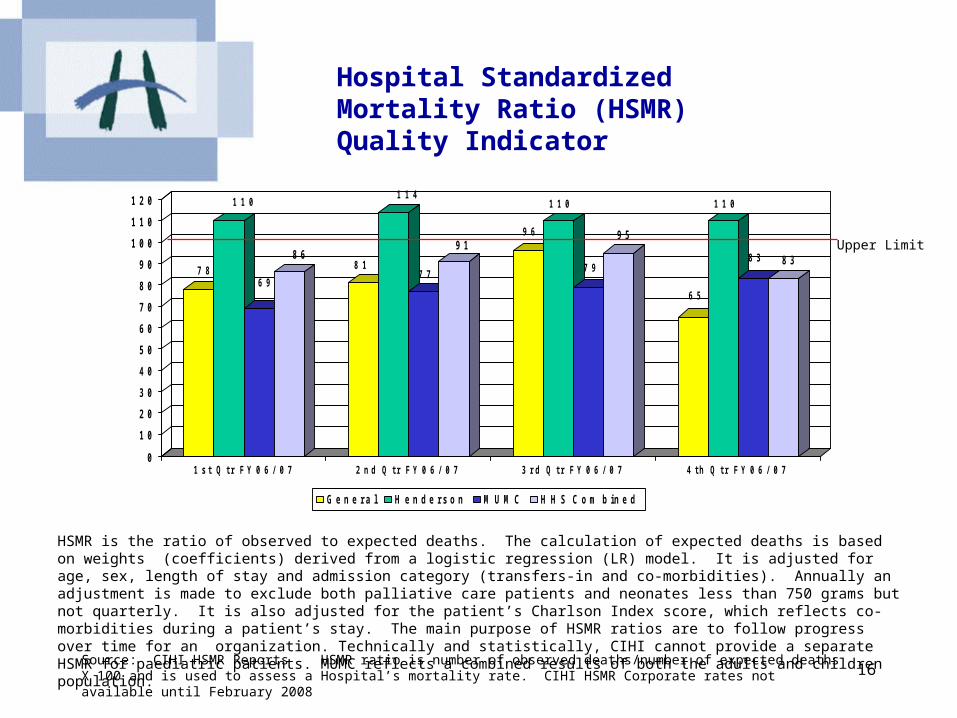
Hospital Standardized Mortality Ratio (HSMR)Quality Indicator
7 8
1 1 0
6 9
8 68 1
1 1 4
7 7
9 19 6
1 1 0
7 9
9 5
6 5
1 1 0
8 3 8 3
0
1 0
2 0
3 0
4 0
5 0
6 0
7 0
8 0
9 0
1 0 0
1 1 0
1 2 0
1 s t Q t r F Y 0 6 / 0 7 2 n d Q t r F Y 0 6 / 0 7 3 r d Q t r F Y 0 6 / 0 7 4 t h Q t r F Y 0 6 / 0 7
G e n e r a l H e n d e r s o n M U M C H H S C o m b in e d
Source: CIHI HSMR Reports HSMR ratio is number of observed deaths/number of expected deaths X 100 and is used to assess a Hospital’s mortality rate. CIHI HSMR Corporate rates not available until February 2008
Upper Limit
HSMR is the ratio of observed to expected deaths. The calculation of expected deaths is based on weights (coefficients) derived from a logistic regression (LR) model. It is adjusted for age, sex, length of stay and admission category (transfers-in and co-morbidities). Annually an adjustment is made to exclude both palliative care patients and neonates less than 750 grams but not quarterly. It is also adjusted for the patient’s Charlson Index score, which reflects co-morbidities during a patient’s stay. The main purpose of HSMR ratios are to follow progress over time for an organization. Technically and statistically, CIHI cannot provide a separate HSMR for paediatric patients. MUMC reflects a combined results of both the adults and children population.
Board Monitor 17
Research Expenditures
Presentation Pending – working with Research to determinean appropriate indicator

18
Indicators:• Vacancy Counts – Performance Indicator• External Staff Turnover – Performance Indicator•Absenteeism Rates- Performance Indicator
Strategic Goal #3
We have a healthy work environment
19
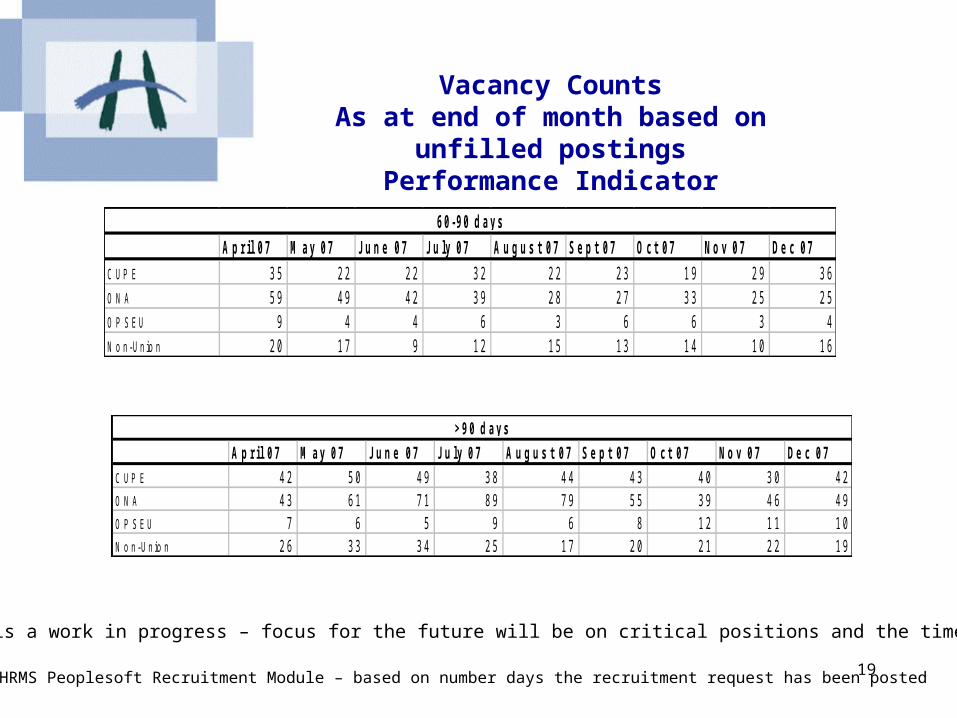
Vacancy CountsAs at end of month based on
unfilled postingsPerformance Indicator
Source: HRMS Peoplesoft Recruitment Module – based on number days the recruitment request has been posted
This indicator is a work in progress – focus for the future will be on critical positions and the time to fill them.
A p r i l 0 7 M a y 0 7 J u n e 0 7 J u l y 0 7 A u g u s t 0 7 S e p t 0 7 O c t 0 7 N o v 0 7 D e c 0 7
C U P E 3 5 2 2 2 2 3 2 2 2 2 3 1 9 2 9 3 6
O N A 5 9 4 9 4 2 3 9 2 8 2 7 3 3 2 5 2 5
O P S E U 9 4 4 6 3 6 6 3 4
N o n - U n io n 2 0 1 7 9 1 2 1 5 1 3 1 4 1 0 1 6
6 0 - 9 0 d a y s
A p r i l 0 7 M a y 0 7 J u n e 0 7 J u l y 0 7 A u g u s t 0 7 S e p t 0 7 O c t 0 7 N o v 0 7 D e c 0 7
C U P E 4 2 5 0 4 9 3 8 4 4 4 3 4 0 3 0 4 2
O N A 4 3 6 1 7 1 8 9 7 9 5 5 3 9 4 6 4 9
O P S E U 7 6 5 9 6 8 1 2 1 1 1 0
N o n - U n io n 2 6 3 3 3 4 2 5 1 7 2 0 2 1 2 2 1 9
> 9 0 d a y s
20
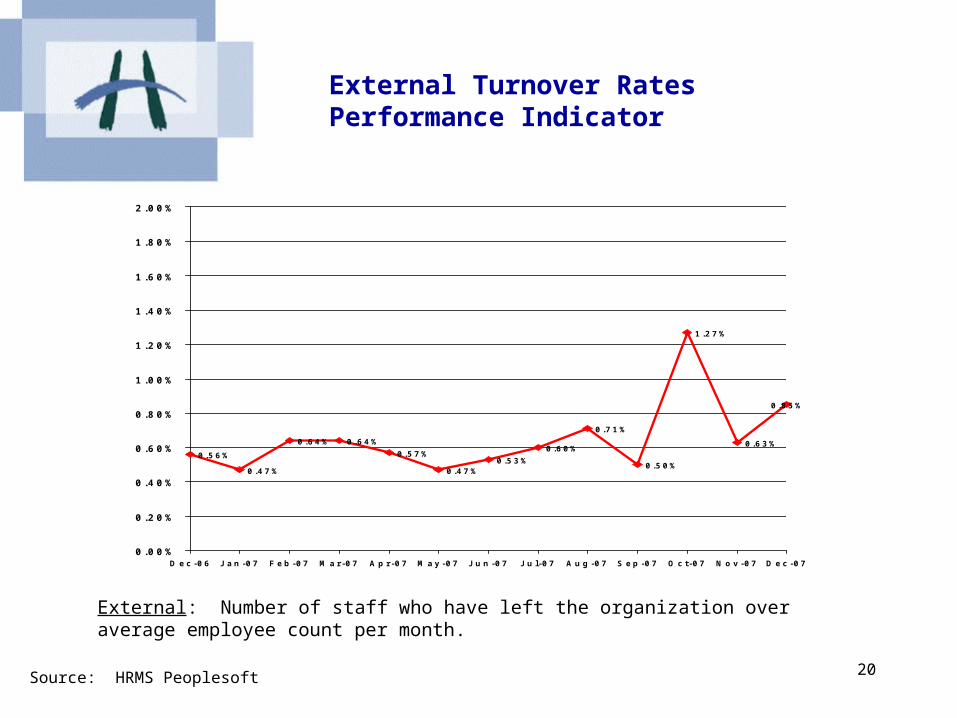
External Turnover RatesPerformance Indicator
0 .5 6 %
0 .4 7 %
0 .6 4 % 0 .6 4 %
0 .5 7 %
0 .4 7 %0 .5 3 %
0 .6 0 %
0 .7 1 %
0 .5 0 %
1 .2 7 %
0 .6 3 %
0 .8 5 %
0 . 0 0 %
0 . 2 0 %
0 . 4 0 %
0 . 6 0 %
0 . 8 0 %
1 . 0 0 %
1 . 2 0 %
1 . 4 0 %
1 . 6 0 %
1 . 8 0 %
2 . 0 0 %
D e c - 0 6 J a n - 0 7 F e b - 0 7 M a r - 0 7 A p r - 0 7 M a y - 0 7 J u n - 0 7 J u l - 0 7 A u g - 0 7 S e p - 0 7 O c t - 0 7 N o v - 0 7 D e c - 0 7
External: Number of staff who have left the organization over average employee count per month.
Source: HRMS Peoplesoft

21
Absenteeism RatePerformance Indicator
Sick Hours Paid as a Percentage of Total Paid Hours
Source: Peoplesoft Time and Labour Payroll
This indicator is a HAPS indicator and is a percentage of sick time hours to total earned hours
0 . 0 0 %
0 . 5 0 %
1 . 0 0 %
1 . 5 0 %
2 . 0 0 %
2 . 5 0 %
3 . 0 0 %
3 . 5 0 %
4 . 0 0 %
4 . 5 0 %
5 . 0 0 %
5 . 5 0 %
6 . 0 0 %
D e c - 0 6 J a n - 0 7 F e b - 0 7 M a r - 0 7 A p r - 0 7 M a y - 0 7 J u n - 0 7 J u l - 0 7 A u g - 0 7 S e p - 0 7 O c t - 0 7 N o v - 0 7 D e c - 0 7
H H S H H S T a r g e t

22
Indicators:•Total Margin and Current Ratio – Performance Indicator•Cost per Weighted Case Trend – Performance Indicator•Capital Projects (TBD) – Performance Indicator
Strategic Goal #4
We have a sound financial base to sustain our mission and achieve our vision

23
Total Margin and Current RatioPerformance Indicator
F i s c a l 0 5 / 0 6 F i s c a l 0 6 / 0 7 Y T D D e c 0 7 P r o j e c t i o n 0 7 / 0 8H H S C u r r e n t R a t i o 1 . 1 1 1 . 2 5 1 . 2 5 1 . 1 7M i n i s t r y T a r g e t 0 . 8 0 0 . 8 0 0 . 8 0 0 . 8 0
T o t a l M a r g i n 0 . 1 8 % 0 . 2 1 % 0 . 1 7 % 0 . 3 1 %M i n i s t r y T a r g e t 0 . 0 0 0 . 0 0 0 . 0 0 0 . 0 0
Summary: Calculated for HAPS definition: Current Assets/Current Liabilities (excludes deferred contributions) without adjustments for timing of MOH payments. Total Margin is Consolidated Total Surplus(Deficit)/Total Revenues (before Building depreciation, net of amortized grants and excluding recoveries).

24
Cost per Weighted Case TrendPerformance Indicator
6 ,1 3 4
5 ,5 4 6
4 ,9 7 9
5 ,5 3 95 ,8 7 5
5 ,3 5 95 ,1 7 8
4 ,9 7 9
0
1 , 0 0 0
2 , 0 0 0
3 , 0 0 0
4 , 0 0 0
5 , 0 0 0
6 , 0 0 0
7 , 0 0 0
8 , 0 0 0
2 0 0 3 / 0 4 2 0 0 4 / 0 5 2 0 0 5 / 0 6 2 0 0 6 / 0 7
A c t u a l I n fl a t i o n L i n e
Source: MOHLTC OCDM Methodology. The numerator is based on Acute Inpatient and SDS costs and the denominator isAcute Inpatient and Qualifying SDS PAC10 Weighted Cases. Trendline is 4% inflation

25
Capital Projects
Work in Progress
26
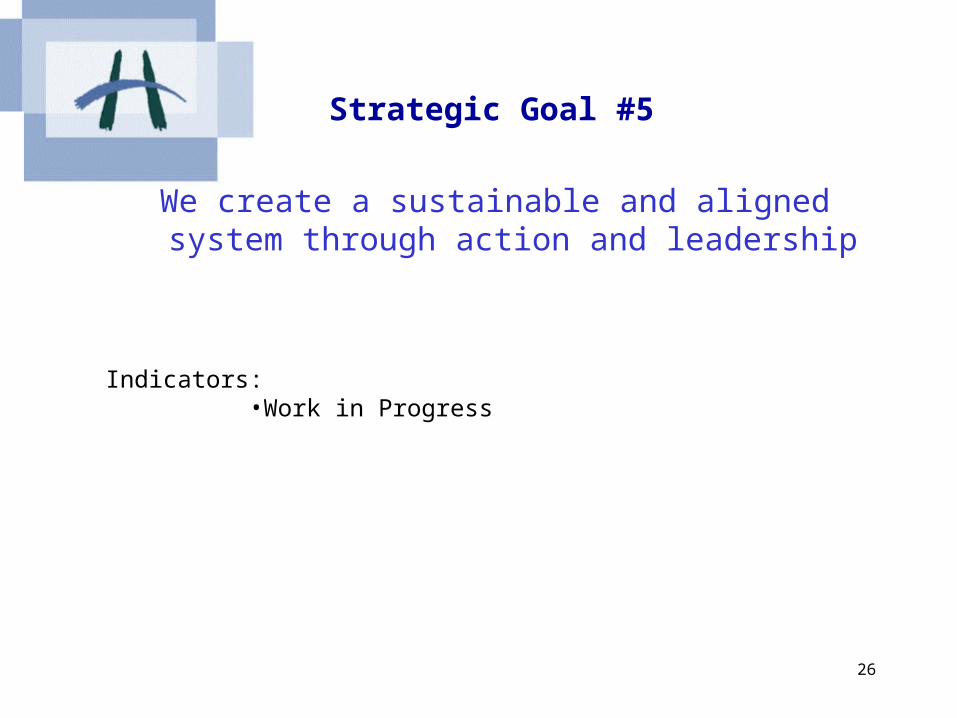
Strategic Goal #5
We create a sustainable and aligned system through action and leadership
Indicators:•Work in Progress

27