bottled water
DESCRIPTION
- final for information design.TRANSCRIPT
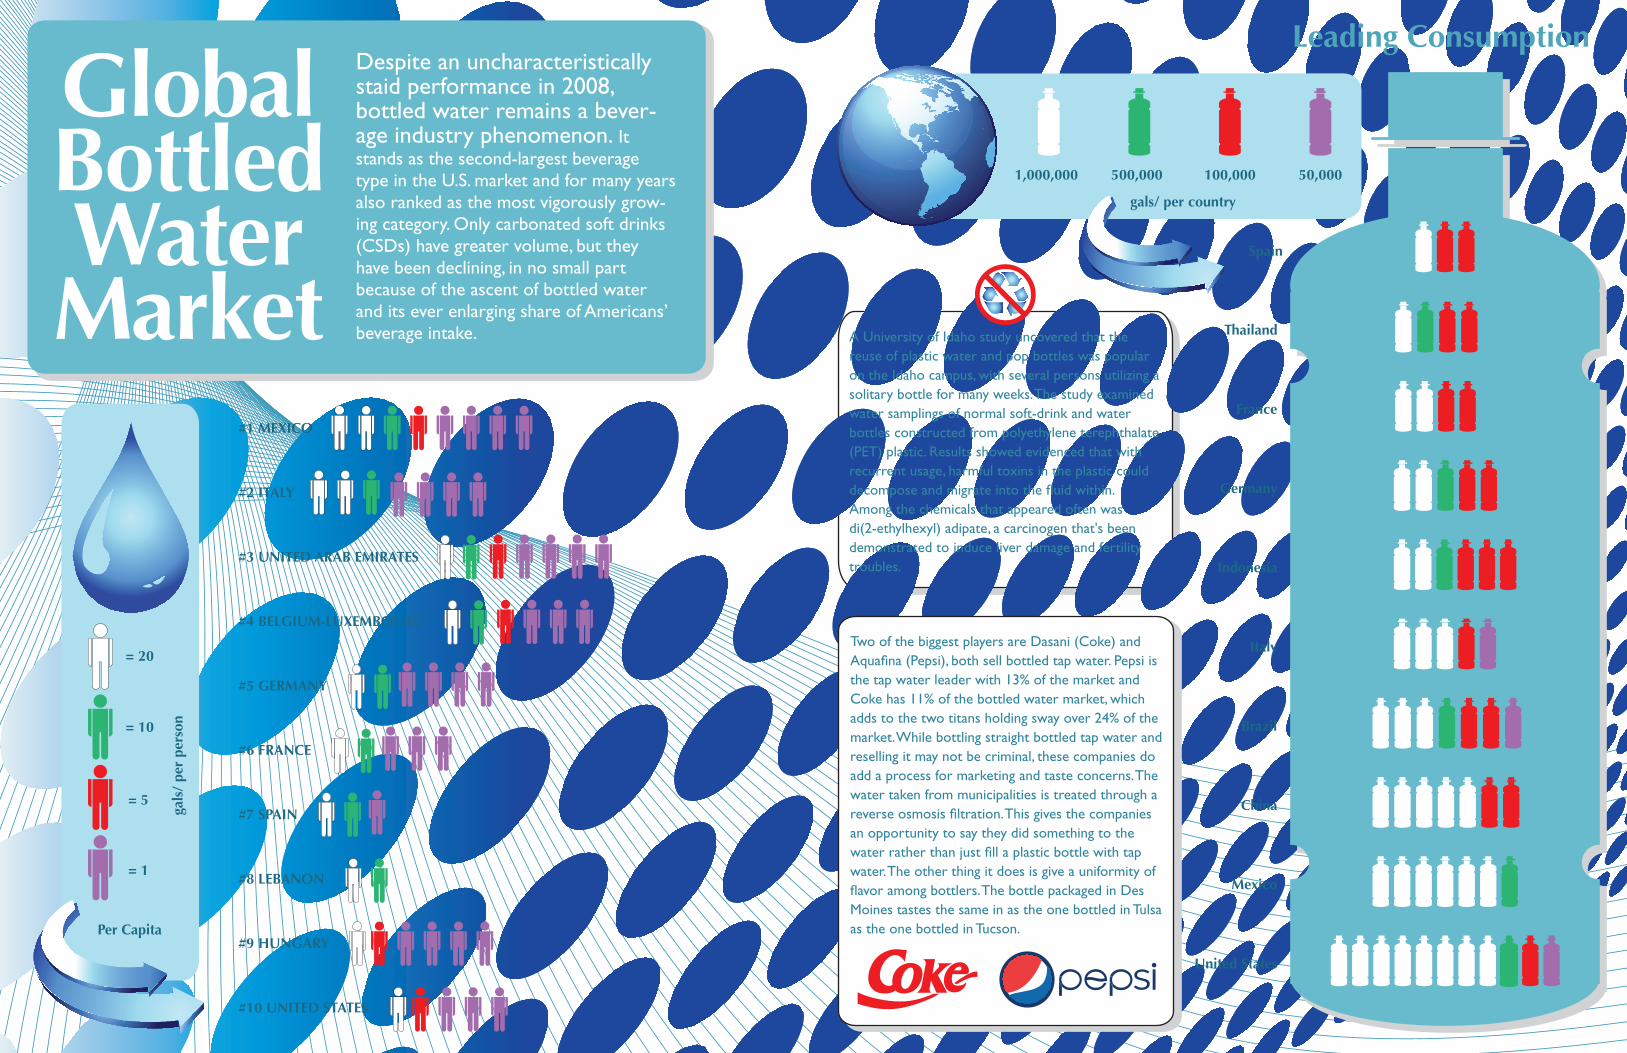
Leading Consumption
United States
Mexico
China
Brazil
Italy
Indonesia
Germany
France
Thailand
Spain
#1 MEXICO
#2 ITALY
#3 UNITED ARAB EMIRATES
#4 BELGIUM-LUXEMBOURG
#5 GERMANY
#6 FRANCE
#7 SPAIN
#8 LEBANON
#9 HUNGARY
#10 UNITED STATES
Two of the biggest players are Dasani (Coke) and Aqua�na (Pepsi), both sell bottled tap water. Pepsi is the tap water leader with 13% of the market and Coke has 11% of the bottled water market, which adds to the two titans holding sway over 24% of the market. While bottling straight bottled tap water and reselling it may not be criminal, these companies do add a process for marketing and taste concerns. The water taken from municipalities is treated through a reverse osmosis �ltration. This gives the companies an opportunity to say they did something to the water rather than just �ll a plastic bottle with tap water. The other thing it does is give a uniformity of �avor among bottlers. The bottle packaged in Des Moines tastes the same in as the one bottled in Tulsa as the one bottled in Tucson.
A University of Idaho study uncovered that the reuse of plastic water and pop bottles was popular on the Idaho campus, with several persons utilizing a solitary bottle for many weeks. The study examined water samplings of normal soft-drink and water bottles constructed from polyethylene terephthalate (PET) plastic. Results showed evidenced that with recurrent usage, harmful toxins in the plastic could decompose and migrate into the �uid within. Among the chemicals that appeared often was di(2-ethylhexyl) adipate, a carcinogen that's been demonstrated to induce liver damage and fertility troubles.
Global Bottled Water Market
Despite an uncharacteristically staid performance in 2008, bottled water remains a bever-age industry phenomenon. It stands as the second-largest beverage type in the U.S. market and for many years also ranked as the most vigorously grow-ing category. Only carbonated soft drinks (CSDs) have greater volume, but they have been declining, in no small part because of the ascent of bottled water and its ever enlarging share of Americans’ beverage intake.
Per Capita
= 20
= 10
= 5
= 1
gals
/ pe
r pe
rson
1,000,000 500,000 100,000 50,000
gals/ per country