bp sustainability review 2012 · safer bp sustainability review 2012 bp.com/sustainability ... 15...
TRANSCRIPT
Building a stronger, safer BP
Sustainability Review 2012bp.com/sustainability
HSE charting tool Filter and analyse data on BP’s health, safety and environmental performance.
Sustainability mapping tool Browse our mapping tool to find out how we are addressing sustainability issues locally.
Reporting standards We apply the Global Reporting Initiatives G3.1 guidelines to an A+ level and use IPIECA guidance.
Front cover
BP’s global deepwater well-capping and tooling package can be deployed in a matter of days to anywhere in the world in the event of a deepwater well blowout. See page 12.
Building a stronger, safer BP
Sustainability Review 2012bp.com/sustainability
Covered online
Con
cern
to s
take
hold
ers
Significance to BP strategy
Not reported Included in the print report and online
About our report
In this Sustainability Review, we look at the impacts of our business on the environment, the societies and the economies where we operate. We provide an update on the Gulf of Mexico and how we are working to enhance safety and risk management and earn back trust.
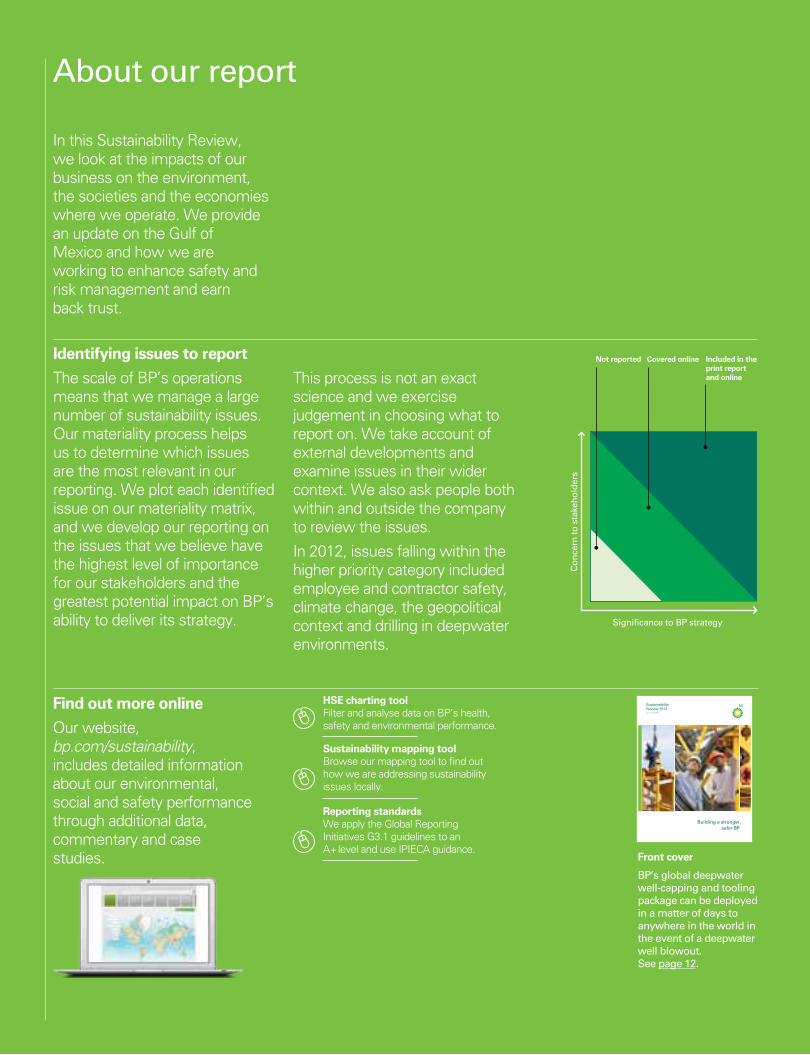
Identifying issues to report
The scale of BP’s operations means that we manage a large number of sustainability issues. Our materiality process helps us to determine which issues are the most relevant in our reporting. We plot each identified issue on our materiality matrix, and we develop our reporting on the issues that we believe have the highest level of importance for our stakeholders and the greatest potential impact on BP’s ability to deliver its strategy.
This process is not an exact science and we exercise judgement in choosing what to report on. We take account of external developments and examine issues in their wider context. We also ask people both within and outside the company to review the issues.
In 2012, issues falling within the higher priority category included employee and contractor safety, climate change, the geopolitical context and drilling in deepwater environments.
Find out more online
Our website, bp.com/sustainability, includes detailed information about our environmental, social and safety performance through additional data, commentary and case studies.

1ContentsBP Sustainability Review 2012
Contents
2 At a glanceWhat we do as a business and our key performance indicators.
4 Letter from our group chief executiveBob Dudley reviews the actions being taken to make BP a stronger, safer company.
6 How BP is changingOur programme initiated in response to the Gulf of Mexico accident in 2010.
7 Update on the Gulf of MexicoRestoring the environment and economy in the region.
10 The energy futureMeeting growing demand for energy while addressing issues such as climate change.
18 Our people and valuesBuilding the capability of our people, with a code of conduct that is based on our values.
22 How we operateOur governance framework, how we manage risk and our operating management system.
28 SafetyManaging safety and operational risk, including measures to prevent accidents and oil spills.
34 EnvironmentInformation on greenhouse gas emissions, oil spills to the environment, water, waste, biodiversity and working in the Arctic.
40 SocietyOur socio-economic impacts, including financial transparency, working with host societies and communities, and human rights.
45 Our approach to reportingEngaging with stakeholders to develop the report – what we heard and how we are responding.
48 BP in figuresData on our safety, environment, people and performance, 2008-2012.
Overview
Focus areas
Our reporting and performance data
At a glance BP Sustainability Review 2012
2
Employees Women Contractors Non UK/US
160
120
80
60
2008 2009 2010 2011 2012
50
40
30
20
10
2008 2009 2010 2011 2012
875
700
525
350
175
500
400
300
200
100
100
80
60
40
20
100
80
60
40
20
2008 2009 2010 2011 2012
30
25
20
15
10
5
2008 2009 2010 2011 2012
1.25
1.00
0.75
0.50
0.25
2008 2009 2010 2011 2012
25
20
15
10
5
2008 2009 2010 2011 2012
150
120
90
60
30
4,250
4,000
3,750
3,500
3,250
2008 2009 2010 2011 2012
100
95
90
85
80
2008 2009 2010 2011 2012
2008 2009 2010 2011 2012 2008 2009 2010 2011 2012 2008 2009 2010 2011 2012
2008 2009 2010 2011 2012
136.20
74.49
(26.17)
126.41
X,XXX
38.1
27.7
13.6
22.2X,XXX
658
537
418361
335
234261
228
61.4 65.0 64.9 61.867
21.4 20.4 21.2 20.5 121129
106 103 3,838
3,998
3,82288.8
95.0 94.8
0.5
0
0.2
3
0.2
5
0.3
1
93.6
X,XXXX,XXX
3,454
X,XXXX,XXX
0.3
5
0.4
3
0.4
1
0.2
6 0.4
3
0.8
4
292204
59.8
71
19 2
1
14
14
14
19
15
19
17
22
(34.
6)
(15.
1)
(24.
1)
(21.
4)
2.5
3.0
33.
0
27.
6
X.X
X.X
ADS Basis Ordinary share basis
Replacement cost profitthis heading is for reference only and not for file
Operating cash flowthis heading is for reference only and not for file
Gearingthis heading is for reference only and not for file
Reserves replacement ratio this heading is for reference only and not for file
Productionthis heading is for reference only and not for file
Reported recordable injurythis heading is for reference only and not for file
Loss of primary containmentthis heading is for reference only and not for file
Oil spillsthis heading is for reference only and not for file
Greenhouse gas emissionsthis heading is for reference only and not for file
Employee satisfactionthis heading is for reference only and not for file
Diversity and inclusionthis heading is for reference only and not for file
Refining availabilitythis heading is for reference only and not for file
60
40
20
0
-20
2008 2009 2010 2011 2012
Total Shareholder Returnthis heading is for reference only and not for file
Data not collected
0
5
10
15
20
25
30
Loss of primary containmenta
Oil spillsa
Employees Women Contractors Non UK/US
160
120
80
60
2008 2009 2010 2011 2012
50
40
30
20
10
2008 2009 2010 2011 2012
875
700
525
350
175
500
400
300
200
100
100
80
60
40
20
100
80
60
40
20
2008 2009 2010 2011 2012
30
25
20
15
10
5
2008 2009 2010 2011 2012
1.25
1.00
0.75
0.50
0.25
2008 2009 2010 2011 2012
25
20
15
10
5
2008 2009 2010 2011 2012
150
120
90
60
30
4,250
4,000
3,750
3,500
3,250
2008 2009 2010 2011 2012
100
95
90
85
80
2008 2009 2010 2011 2012
2008 2009 2010 2011 2012 2008 2009 2010 2011 2012 2008 2009 2010 2011 2012
2008 2009 2010 2011 2012
136.20
74.49
(26.17)
126.41
X,XXX
38.1
27.7
13.6
22.2X,XXX
658
537
418361
335
234261
228
61.4 65.0 64.9 61.867
21.4 20.4 21.2 20.5 121129
106 103 3,838
3,998
3,82288.8
95.0 94.8
0.5
0
0.2
3
0.2
5
0.3
1
93.6
X,XXXX,XXX
3,454
X,XXXX,XXX
0.3
5
0.4
3
0.4
1
0.2
6 0.4
3
0.8
4
292204
59.8
71
19 2
1
14
14
14
19
15
19
17
22
(34.
6)
(15.
1)
(24.
1)
(21.
4)
2.5
3.0
33.
0
27.
6
X.X
X.X
ADS Basis Ordinary share basis
Replacement cost profitthis heading is for reference only and not for file
Operating cash flowthis heading is for reference only and not for file
Gearingthis heading is for reference only and not for file
Reserves replacement ratio this heading is for reference only and not for file
Productionthis heading is for reference only and not for file
Reported recordable injurythis heading is for reference only and not for file
Loss of primary containmentthis heading is for reference only and not for file
Oil spillsthis heading is for reference only and not for file
Greenhouse gas emissionsthis heading is for reference only and not for file
Employee satisfactionthis heading is for reference only and not for file
Diversity and inclusionthis heading is for reference only and not for file
Refining availabilitythis heading is for reference only and not for file
60
40
20
0
-20
2008 2009 2010 2011 2012
Total Shareholder Returnthis heading is for reference only and not for file
Data not collected
0
5
10
15
20
25
30
Recordable injury frequencya
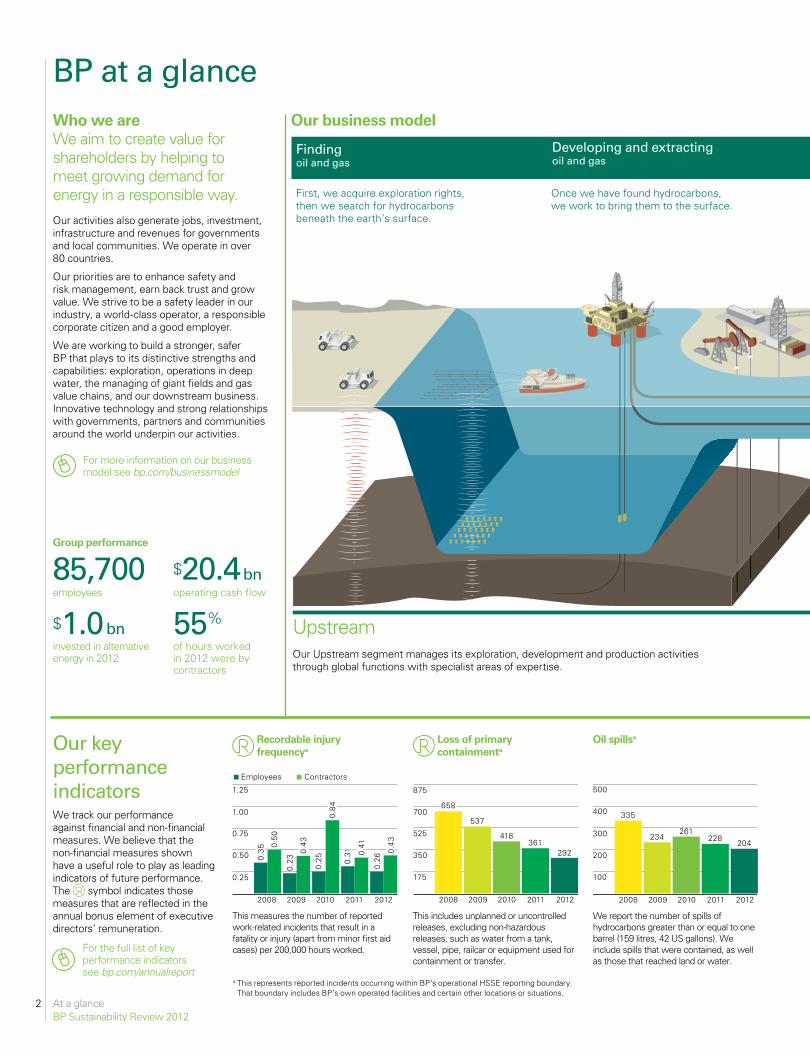
Who we areWe aim to create value for shareholders by helping to meet growing demand for energy in a responsible way.Our activities also generate jobs, investment, infrastructure and revenues for governments and local communities. We operate in over 80 countries.
Our priorities are to enhance safety and risk management, earn back trust and grow value. We strive to be a safety leader in our industry, a world-class operator, a responsible corporate citizen and a good employer.
We are working to build a stronger, safer BP that plays to its distinctive strengths and capabilities: exploration, operations in deep water, the managing of giant fields and gas value chains, and our downstream business. Innovative technology and strong relationships with governments, partners and communities around the world underpin our activities.
This measures the number of reported work-related incidents that result in a fatality or injury (apart from minor first aid cases) per 200,000 hours worked.
This includes unplanned or uncontrolled releases, excluding non-hazardous releases, such as water from a tank, vessel, pipe, railcar or equipment used for containment or transfer.
We report the number of spills of hydrocarbons greater than or equal to one barrel (159 litres, 42 US gallons). We include spills that were contained, as well as those that reached land or water.
We track our performance against financial and non-financial measures. We believe that the non-financial measures shown have a useful role to play as leading indicators of future performance. The symbol indicates those measures that are reflected in the annual bonus element of executive directors’ remuneration.
$1.0 bninvested in alternative energy in 2012
$20.4 bnoperating cash flow
55%
of hours worked in 2012 were by contractors
85,700employees
UpstreamOur Upstream segment manages its exploration, development and production activities through global functions with specialist areas of expertise.
Group performance
First, we acquire exploration rights, then we search for hydrocarbons beneath the earth’s surface.
Once we have found hydrocarbons, we work to bring them to the surface.
Our business model
Finding oil and gas
Developing and extracting oil and gas
BP at a glance
Our key performance indicators
a This represents reported incidents occurring within BP’s operational HSSE reporting boundary. That boundary includes BP’s own operated facilities and certain other locations or situations.
For more information on our business model see bp.com/businessmodel
For the full list of key performance indicators see bp.com/annualreport
At a glance BP Sustainability Review 2012
3
Employees Women Contractors Non UK/US
160
120
80
60
2008 2009 2010 2011 2012
50
40
30
20
10
2008 2009 2010 2011 2012
875
700
525
350
175
500
400
300
200
100
100
80
60
40
20
100
80
60
40
20
2008 2009 2010 2011 2012
30
25
20
15
10
5
2008 2009 2010 2011 2012
1.25
1.00
0.75
0.50
0.25
2008 2009 2010 2011 2012
25
20
15
10
5
2008 2009 2010 2011 2012
150
120
90
60
30
4,250
4,000
3,750
3,500
3,250
2008 2009 2010 2011 2012
100
95
90
85
80
2008 2009 2010 2011 2012
2008 2009 2010 2011 2012 2008 2009 2010 2011 2012 2008 2009 2010 2011 2012
2008 2009 2010 2011 2012
136.20
74.49
(26.17)
126.41
X,XXX
38.1
27.7
13.6
22.2X,XXX
658
537
418361
335
234261
228
61.4 65.0 64.9 61.867
21.4 20.4 21.2 20.5 121129
106 103 3,838
3,998
3,82288.8
95.0 94.8
0.5
0
0.2
3
0.2
5
0.3
1
93.6
X,XXXX,XXX
3,454
X,XXXX,XXX
0.3
5
0.4
3
0.4
1
0.2
6 0.4
3
0.8
4
292204
59.8
71
19 2
1
14
14
14
19
15
19
17
22
(34.
6)
(15.
1)
(24.
1)
(21.
4)
2.5
3.0
33.
0
27.
6
X.X
X.X
ADS Basis Ordinary share basis
Replacement cost profitthis heading is for reference only and not for file
Operating cash flowthis heading is for reference only and not for file
Gearingthis heading is for reference only and not for file
Reserves replacement ratio this heading is for reference only and not for file
Productionthis heading is for reference only and not for file
Reported recordable injurythis heading is for reference only and not for file
Loss of primary containmentthis heading is for reference only and not for file
Oil spillsthis heading is for reference only and not for file
Greenhouse gas emissionsthis heading is for reference only and not for file
Employee satisfactionthis heading is for reference only and not for file
Diversity and inclusionthis heading is for reference only and not for file
Refining availabilitythis heading is for reference only and not for file
60
40
20
0
-20
2008 2009 2010 2011 2012
Total Shareholder Returnthis heading is for reference only and not for file
Data not collected
0
5
10
15
20
25
30
Greenhouse gas emissions (million tonnes of CO2 equivalent)
Diversity and inclusionb (%)
Employees Women Contractors Non UK/US
160
120
80
60
2008 2009 2010 2011 2012
50
40
30
20
10
2008 2009 2010 2011 2012
875
700
525
350
175
500
400
300
200
100
100
80
60
40
20
100
80
60
40
20
2008 2009 2010 2011 2012
30
25
20
15
10
5
2008 2009 2010 2011 2012
1.25
1.00
0.75
0.50
0.25
2008 2009 2010 2011 2012
25
20
15
10
5
2008 2009 2010 2011 2012
150
120
90
60
30
4,250
4,000
3,750
3,500
3,250
2008 2009 2010 2011 2012
100
95
90
85
80
2008 2009 2010 2011 2012
2008 2009 2010 2011 2012 2008 2009 2010 2011 2012 2008 2009 2010 2011 2012
2008 2009 2010 2011 2012
136.20
74.49
(26.17)
126.41
X,XXX
38.1
27.7
13.6
22.2X,XXX
658
537
418361
335
234261
228
61.4 65.0 64.9 61.867
21.4 20.4 21.2 20.5 121129
106 103 3,838
3,998
3,82288.8
95.0 94.8
0.5
0
0.2
3
0.2
5
0.3
1
93.6
X,XXXX,XXX
3,454
X,XXXX,XXX
0.3
5
0.4
3
0.4
1
0.2
6 0.4
3
0.8
4
292204
59.8
71
19 2
1
14
14
14
19
15
19
17
22
(34.
6)
(15.
1)
(24.
1)
(21.
4)
2.5
3.0
33.
0
27.
6
X.X
X.X
ADS Basis Ordinary share basis
Replacement cost profitthis heading is for reference only and not for file
Operating cash flowthis heading is for reference only and not for file
Gearingthis heading is for reference only and not for file
Reserves replacement ratio this heading is for reference only and not for file
Productionthis heading is for reference only and not for file
Reported recordable injurythis heading is for reference only and not for file
Loss of primary containmentthis heading is for reference only and not for file
Oil spillsthis heading is for reference only and not for file
Greenhouse gas emissionsthis heading is for reference only and not for file
Employee satisfactionthis heading is for reference only and not for file
Diversity and inclusionthis heading is for reference only and not for file
Refining availabilitythis heading is for reference only and not for file
60
40
20
0
-20
2008 2009 2010 2011 2012
Total Shareholder Returnthis heading is for reference only and not for file
Data not collected
0
5
10
15
20
25
30
Group priorities engagement (%)
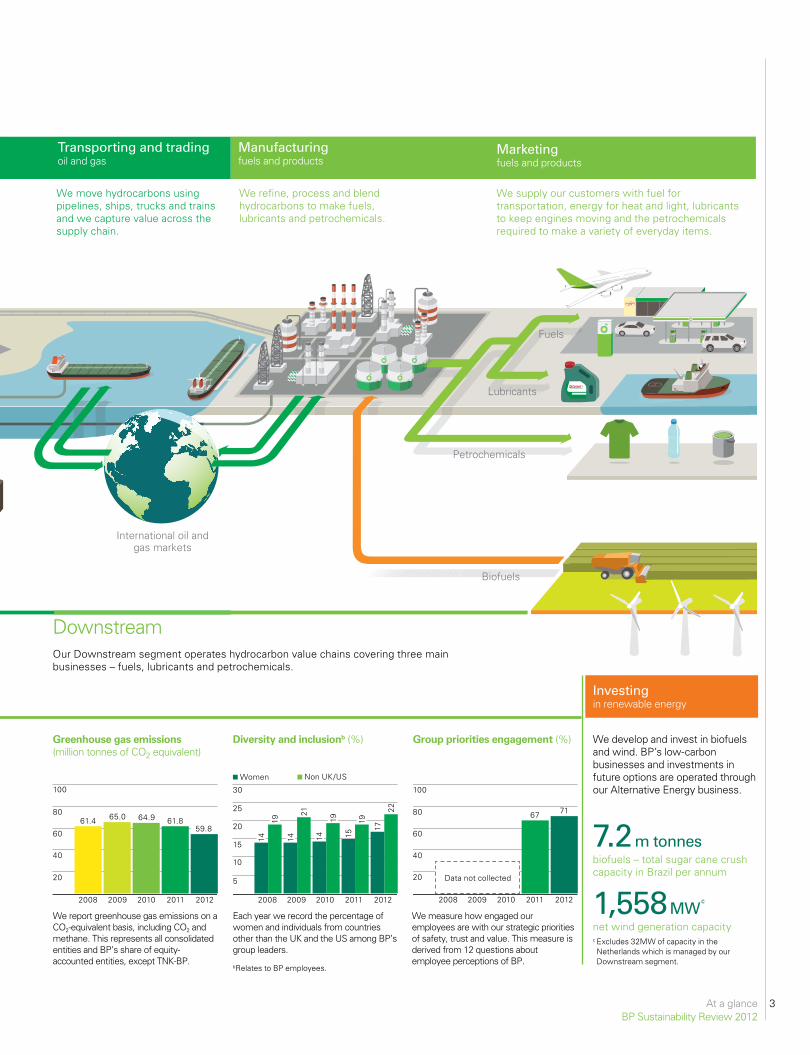
We report greenhouse gas emissions on a CO2-equivalent basis, including CO2 and methane. This represents all consolidated entities and BP’s share of equity-accounted entities, except TNK-BP.
Each year we record the percentage of women and individuals from countries other than the UK and the US among BP’s group leaders.
We measure how engaged our employees are with our strategic priorities of safety, trust and value. This measure is derived from 12 questions about employee perceptions of BP.
7.2 m tonnesbiofuels – total sugar cane crush capacity in Brazil per annum
1,558 MWc
net wind generation capacity
We develop and invest in biofuels and wind. BP’s low-carbon businesses and investments in future options are operated through our Alternative Energy business.
c Excludes 32MW of capacity in the Netherlands which is managed by our Downstream segment.
DownstreamOur Downstream segment operates hydrocarbon value chains covering three main businesses – fuels, lubricants and petrochemicals.
We move hydrocarbons using pipelines, ships, trucks and trains and we capture value across the supply chain.
We refine, process and blend hydrocarbons to make fuels, lubricants and petrochemicals.
Transporting and trading oil and gas
Marketing fuels and products
Manufacturing fuels and products
Investing in renewable energy
We supply our customers with fuel for transportation, energy for heat and light, lubricants to keep engines moving and the petrochemicals required to make a variety of everyday items.
bRelates to BP employees.
Fuels
Lubricants
Petrochemicals
International oil and gas markets
Biofuels

Letter from our group chief executiveBP Sustainability Review 2012
4
Whenever I visit a BP site, I am struck by the wide range of people involved in, and affected by, what we do. From employees, partners and suppliers to governments, investors and those who live next to one of our facilities – everyone has high expectations of this company. We must fulfil those expectations, and meet our range of responsibilities, as we work to create a stronger, safer BP.
Our responsibilities include helping to address the world’s growing need for energy. Some 100 years ago society consumed energy at a rate of around two million tonnes of oil equivalent a day. Today the figure is closer to 32 million and we expect that could rise to as much as 45 million by 2030, if current trends continue.
Behind these big numbers you find a story of human progress. Reliable and affordable sources of energy can help to improve many things, from living standards to life expectancy. Around the world, a growing supply of energy is helping to lift people out of poverty and increase opportunity.
From safety comes trustBP has an important contribution to make to the changing world I have just described. But we can only play our part if we start from the solid foundation of safe and reliable operations. Following the Deepwater Horizon incident, our employees have worked systematically to enhance safety and risk management. And we have turned the insights gained into new oil spill response plans and technologies, which we are adopting within BP and sharing with others.
As someone who has worked in the oil and gas industry for more than 30 years, I know that risk can never be entirely eliminated. But it can be managed effectively, and in increasingly sophisticated ways. The events of 2010 were a tragic reminder that trust can take years to earn and just moments to lose. I am determined this company will earn back and keep people’s trust.
We continue to meet our commitments to the people of the Gulf states in the US. In 2012 we made the final payment into the $20-billion trust fund, of which $9.5 billion has been distributed to date. We continued to support environmental research, and provided funding for the local tourism industry, with many areas having record years in 2012. We reached settlements with the Department of Justice and the Securities and Exchange Commission, and are working with the Environmental Protection Agency to resolve suspension and debarment issues. As I write, legal proceedings are ongoing in New Orleans.
The Gulf of Mexico is very important to BP. Our commitment to the restoration of affected areas and long-term investment in the region will continue.
Working around the worldWherever we operate around the world, BP keeps working to develop strong relationships with governments and local communities. The socio-economic development, environment and other issues covered in this review are important to BP and to me personally. They are essential in determining whether people trust BP to operate in their area.
2012 marked a significant change to our relationships in Russia when we agreed to sell our 50% shareholding in TNK-BP to Rosneft, and take our holding in Rosneft to 19.75%. On completion, the transaction will enable us to maintain a strong position in the world’s largest oil and gas producing country. We aim to share our expertise with the Rosneft team as they work to transform the company’s asset base, management processes and corporate governance.
I would like to reflect, with great sadness, on the terrible events that took place at the In Amenas joint venture facility in Algeria in January 2013. Our thoughts are with the families and friends of those who lost their lives in the attack. We are working with government agencies and others to determine what can be learned from this shocking incident.
Making choices for BPWe have made many changes to what we do and how we do it, turning lessons learned into action. We have reorganized and refocused. The sale of $38 billion of assets is helping us to reduce complexity and risk, and concentrate investment on our areas of distinctive strength. And we have set a new direction for the company based on a clear strategy.
Our aim is to keep building a BP that is well matched to the world’s evolving energy needs. Collaboration and systematic rigour will be increasingly important as we tackle the tough technical, environmental and social challenges ahead in areas such as deep water, giant fields and unconventional gas. In unconventional gas, for example, hydraulic fracturing can provide a safe and secure source of energy if undertaken in the right way.
Along with providing much needed energy today, BP is helping to address longer-term issues related to energy use. For example, we apply a carbon price to some of our new projects, and require existing operations to consider and implement cost-effective efficiency measures. We inform debate by conducting analysis and supporting research. We invest in biofuels and wind because we think they can play an important role in the diverse energy mix required.
Our aim is to keep building a BP that is well matched to the world’s evolving energy needs.
Bob DudleyGroup Chief Executive
Letter from our group chief executive
Letter from our group chief executiveBP Sustainability Review 2012
5
Our strategy and sustainability
BP’s objective is to create value for shareholders and supplies of energy for the world in a safe and responsible way.
We strive to be a safety leader in our industry, a world-class operator, a responsible corporate citizen and a good employer. We are working to enhance safety and risk management, earn back trust and grow value.
Keeping a relentless focus on safety is a top priority for us. Rigorous management of risk helps to protect the people at the frontline, the places in which we operate and the value we create. We understand that operating in politically complex regions and technically demanding geographies, such as deep water and oil sands, requires particular sensitivity to local environments. We continue to enhance our systems, processes and standards, including how we manage the risks that can be created by the actions of our contractors and the operators of joint ventures in which we participate.
We can only operate if we maintain the trust of people inside and outside the company. We must earn people’s trust by being fair and responsible in everything we do. We monitor our performance closely and aim to report in a transparent way. We believe good
communication and open dialogue are vital if we are to meet the expectations of our employees, customers, shareholders and the local communities in which we operate.
We are working to become a simpler business, with a clear focus on what we do best. Our distinctive capabilities include exploration, operations in deep water, managing giant fields and gas value chains, and our world-class downstream business – underpinned by technology and relationships. Strong financial performance is vital because it enables us to make the investments necessary to produce the energy that society requires, as well as to reward and maintain the support of our shareholders.
By supplying energy, we support economic development and help to improve quality of life for millions of people. Our activities also generate jobs, investment, infrastructure and revenues for governments and local communities. Our portfolio includes lower-carbon options with the potential to make a significant contribution, now and in the future.
Informing the big decisionsJust as BP is taking important decisions about its strategic priorities, so the wider world must make choices about future energy supply and use. How should a growing demand for energy be balanced with the need to address rising greenhouse gas emissions? Is there the necessary political will to set a universal price for carbon? Will the research, development and deployment of important lower-carbon energy technologies be given adequate support? These and other questions must be considered as governments, business, non-governmental organizations and the public work together to set the right direction.
There are no easy answers and there is unlikely to be agreement on all sides on every point, but it is essential that our debates and decisions are based on a deep understanding of the issues involved, not sentiment. This is why, for example, BP is funding the Energy Sustainability Challenge, a consortium of academics that is analysing the complex relationships between energy and natural resources. Energy literacy is the key to making the right choices for the future.
Moving forwardI believe a stronger and safer BP can make a vital contribution to growth and progress as the world develops over the coming decades. There is plenty to do, as we work on our priorities of enhancing safety and risk management, earning back trust and creating value. We intend to play a positive role in shaping the long-term future of energy. This Sustainability Review is part of a wider commitment to engage with the world on what we do and how we do it. We aspire to communicate openly about our responsibilities, our actions and our perspectives on global energy issues as we move forward.
Bob Dudley
Group Chief Executive20 March 2013
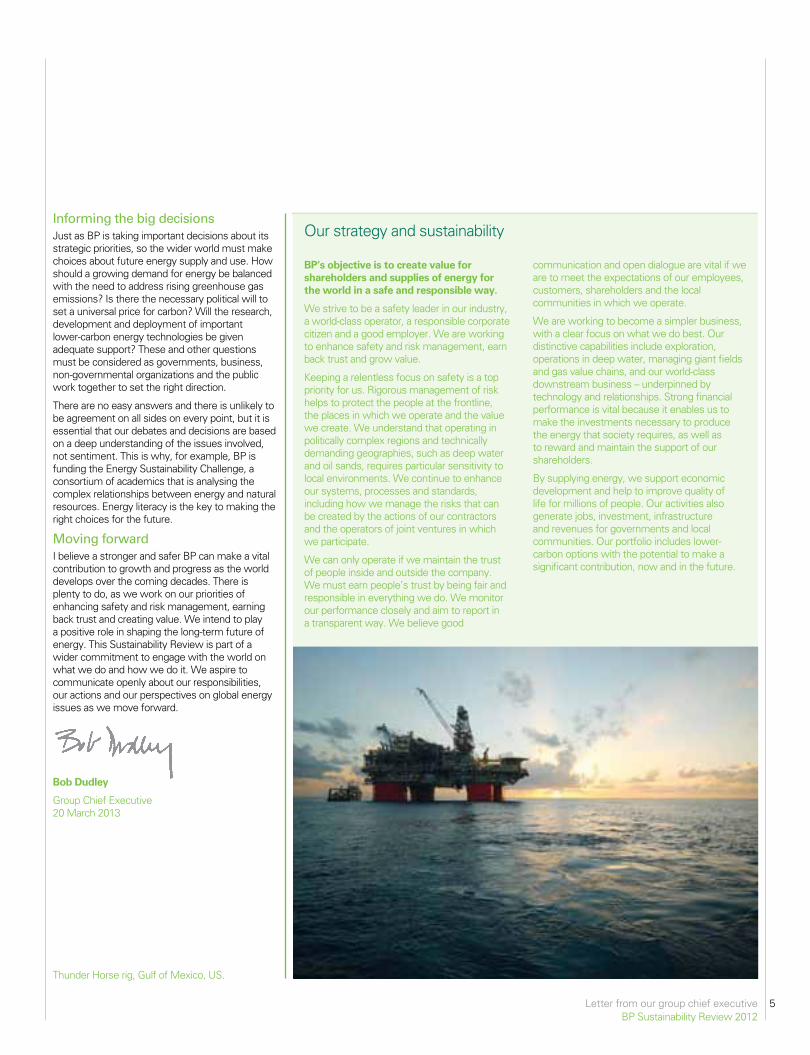
Thunder Horse rig, Gulf of Mexico, US.
6 How BP is changingBP Sustainability Review 2012
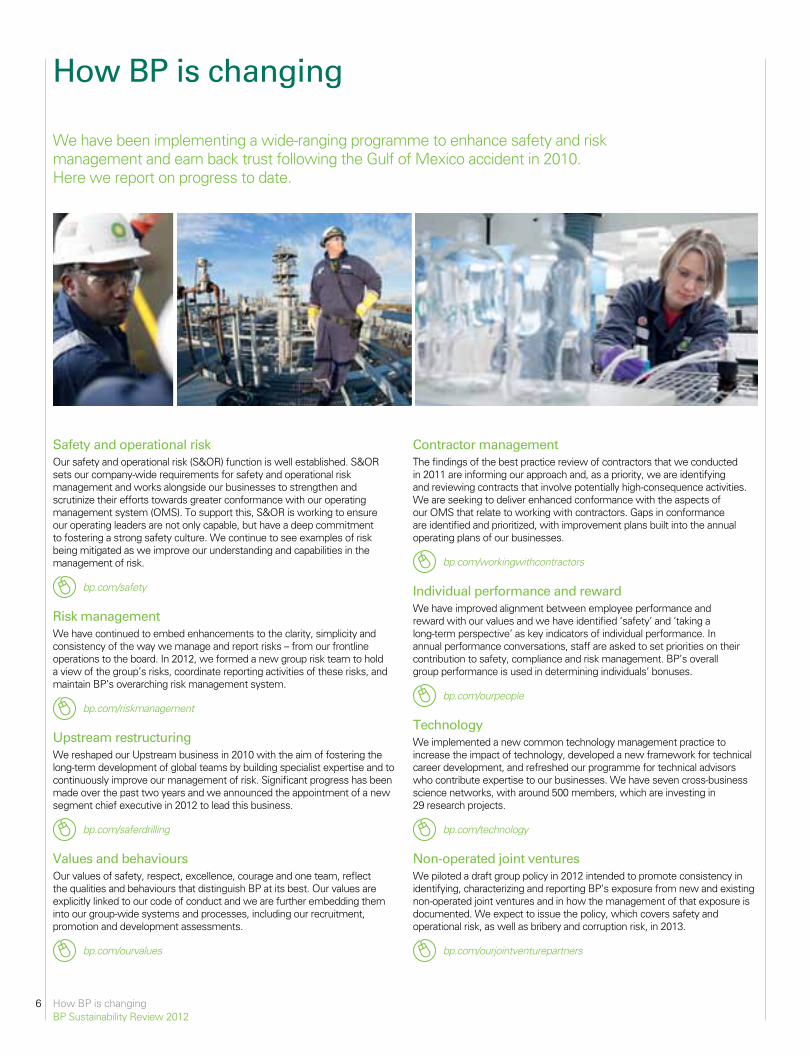
We have been implementing a wide-ranging programme to enhance safety and risk management and earn back trust following the Gulf of Mexico accident in 2010. Here we report on progress to date.
How BP is changing
Safety and operational riskOur safety and operational risk (S&OR) function is well established. S&OR sets our company-wide requirements for safety and operational risk management and works alongside our businesses to strengthen and scrutinize their efforts towards greater conformance with our operating management system (OMS). To support this, S&OR is working to ensure our operating leaders are not only capable, but have a deep commitment to fostering a strong safety culture. We continue to see examples of risk being mitigated as we improve our understanding and capabilities in the management of risk.
bp.com/safety
Risk managementWe have continued to embed enhancements to the clarity, simplicity and consistency of the way we manage and report risks – from our frontline operations to the board. In 2012, we formed a new group risk team to hold a view of the group’s risks, coordinate reporting activities of these risks, and maintain BP’s overarching risk management system.
bp.com/riskmanagement
Upstream restructuringWe reshaped our Upstream business in 2010 with the aim of fostering the long-term development of global teams by building specialist expertise and to continuously improve our management of risk. Significant progress has been made over the past two years and we announced the appointment of a new segment chief executive in 2012 to lead this business.
bp.com/saferdrilling
Values and behavioursOur values of safety, respect, excellence, courage and one team, reflect the qualities and behaviours that distinguish BP at its best. Our values are explicitly linked to our code of conduct and we are further embedding them into our group-wide systems and processes, including our recruitment, promotion and development assessments.
bp.com/ourvalues
Contractor managementThe findings of the best practice review of contractors that we conducted in 2011 are informing our approach and, as a priority, we are identifying and reviewing contracts that involve potentially high-consequence activities. We are seeking to deliver enhanced conformance with the aspects of our OMS that relate to working with contractors. Gaps in conformance are identified and prioritized, with improvement plans built into the annual operating plans of our businesses.
bp.com/workingwithcontractors
Individual performance and rewardWe have improved alignment between employee performance and reward with our values and we have identified ‘safety’ and ‘taking a long-term perspective’ as key indicators of individual performance. In annual performance conversations, staff are asked to set priorities on their contribution to safety, compliance and risk management. BP’s overall group performance is used in determining individuals’ bonuses.
bp.com/ourpeople
TechnologyWe implemented a new common technology management practice to increase the impact of technology, developed a new framework for technical career development, and refreshed our programme for technical advisors who contribute expertise to our businesses. We have seven cross-business science networks, with around 500 members, which are investing in 29 research projects.
bp.com/technology
Non-operated joint venturesWe piloted a draft group policy in 2012 intended to promote consistency in identifying, characterizing and reporting BP’s exposure from new and existing non-operated joint ventures and in how the management of that exposure is documented. We expect to issue the policy, which covers safety and operational risk, as well as bribery and corruption risk, in 2013.
bp.com/ourjointventurepartners
7Update on the Gulf of MexicoBP Sustainability Review 2012
More information online at bp.com/gulfofmexico
The Natural Resource Damage Assessment process.
Early restoration and other conservation projects.
Updates on the investigations and legal proceedings.
We continue to make significant progress cleaning the Gulf shoreline and supporting economic and environmental recovery in affected areas. We are supporting regional tourism and Gulf seafood, and investing in the local communities through educational programmes and enterprise development. Our goal is to provide a positive legacy in these coastal communities.
We have fully funded the $20-billion trust we established in 2010 to provide assurance that the resources to pay claims, settlements, natural resource damages and other costs would be available.
BP directly employs more than 2,300 people in the Gulf of Mexico and supports tens of thousands of additional jobs in the region. We expect to invest at least $4 billion a year in oil and gas development in the Gulf of Mexico over the next 10 years.
Enhancing safetyWe took significant steps to further enhance safety and risk management in our Gulf of Mexico operations in 2012, and continued to implement recommendations from our internal investigation into the Deepwater Horizon accident.
Following the settlement with the US government of all federal criminal claims related to the Gulf of Mexico, BP has agreed to appoint a process safety monitor in the US for a term of four years. The monitor will review, evaluate, and provide recommendations for the improvement of BP’s process safety and risk management procedures concerning deepwater drilling in the Gulf of Mexico. For more information on our US settlements for criminal and securities claims see bp.com/uslegalproceedings.
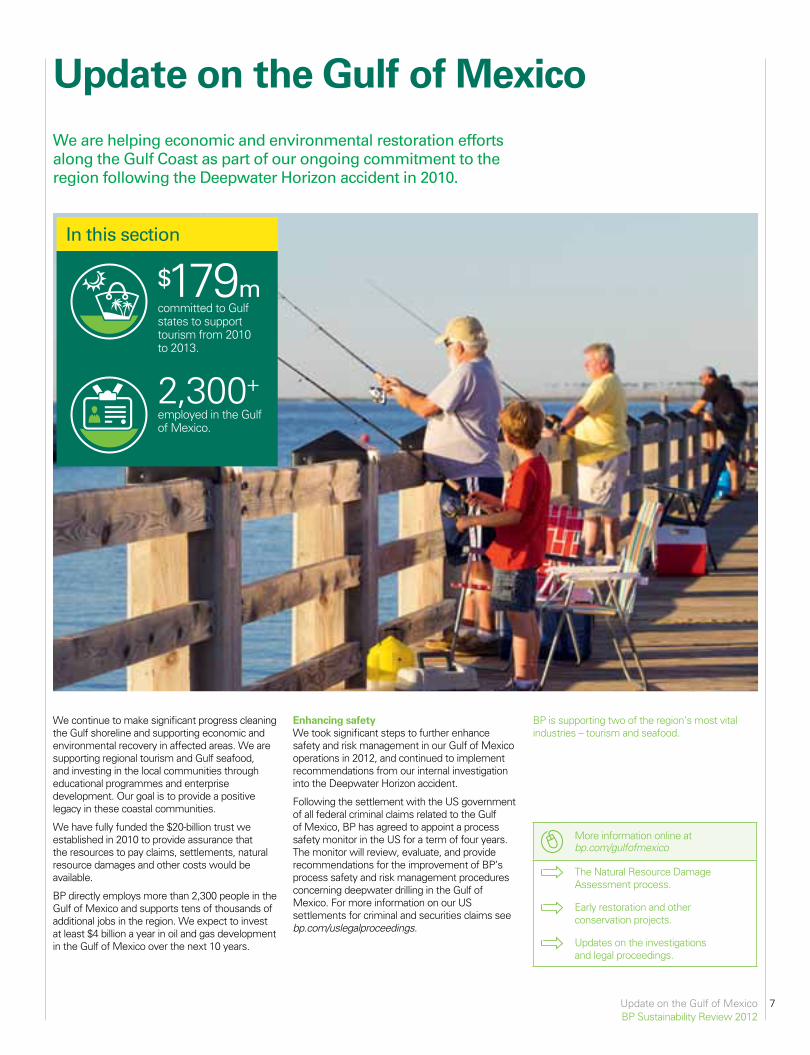
We are helping economic and environmental restoration efforts along the Gulf Coast as part of our ongoing commitment to the region following the Deepwater Horizon accident in 2010.
Update on the Gulf of Mexico
BP is supporting two of the region’s most vital industries – tourism and seafood.
In this section
$179mcommitted to Gulf states to support tourism from 2010 to 2013.
2,300+employed in the Gulf of Mexico.
Update on the Gulf of MexicoBP Sustainability Review 2012
8
Restoring the environmentIn 2012 we continued to work with state and federal trustee agencies through the Natural Resource Damage Assessment (NRDA) process to evaluate the potential for injury to wildlife and habitat, and the recreational use of these resources. The federal and state trustees have responsibility for the process and BP is a participant. The study data will inform an assessment of injury to the Gulf Coast natural resources. Detailed analysis and interpretation continue on the data that has been collected.
The trustees have already made some of the data sets from these studies available online while others are still being finalized. BP seeks to share data and information collected from the cooperative NRDA studies once these have been approved for release by the trustees.
While the injury assessment process is still ongoing, restoration has already begun. BP has funded several different types of restoration projects. In 2012 work began on the initial set of early restoration projects identified through an agreement BP signed with state and federal trustees in April 2011. The projects, expected to cost approximately $60 million, aim to collectively restore and enhance wildlife, habitats, the ecosystem services provided by those habitats, and provide additional access for fishing, boating and related recreational uses.
The trustees also approved two additional projects in December 2012, which are designed to improve nesting habitat for birds and loggerhead sea turtles. Funding comes from the $20-billion trust.
Completing the responseIn November 2011, the US Coast Guard’s federal on-scene coordinator (FOSC) approved the shoreline clean-up completion plan, which
describes the rigorous process for determining if shoreline segments can be moved out of operational activity. By the end of 2012, the FOSC had deemed removal actions complete on 4,029 miles (6,484km) of shoreline out of the 4,376 miles (7,043km) that were in the area of response. Approximately 108 miles were pending final monitoring or inspection and a determination that removal actions are complete. The remaining 239 miles are in monitoring and maintenance, which will continue until the FOSC determines that operational removal activity is complete.
Hurricane IsaacIn August 2012, Hurricane Isaac made landfall on the Gulf Coast, uncovering residual oil in some areas in Louisiana. The residual oil had been buried when tropical storms in 2010 and 2011 deposited several feet of sand. In many instances, net environmental analyses had indicated that deep cleaning at these sites could do more harm than good. But once Isaac removed this sand overburden, clean-up crews were able to clean the exposed residual material without the same degree of potential environmental impact.
Supporting long-term researchBP has committed $500 million over 10 years to fund independent scientific research through the Gulf of Mexico Research Initiative. The goal of the initiative is to improve society’s ability to understand, respond to and mitigate the potential impacts of oil spills to marine and coastal ecosystems. The BP funding will cover grant awards and administrative costs. As of the end of 2012, the Gulf of Mexico Research Initiative had awarded $184 million in grants. Grant recipients are investigating the fate of oil releases; the ecological and human health aspects of spills; and the development of new tools and technology for future spill response, mitigation and restoration.
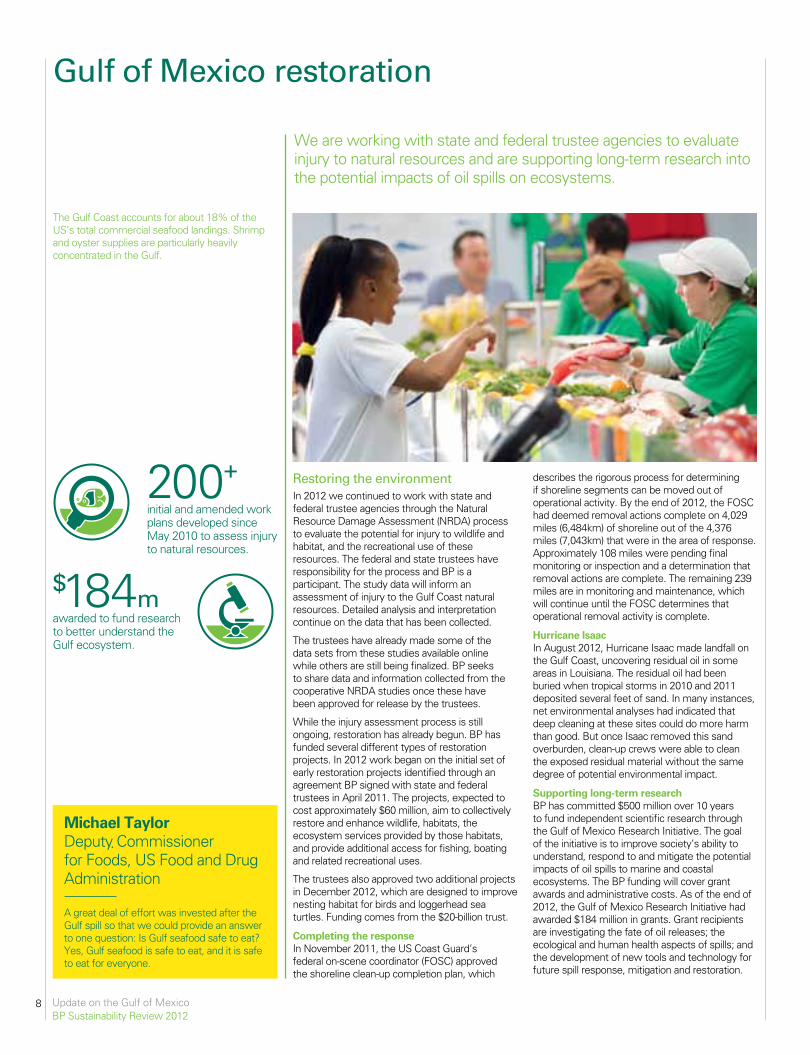
We are working with state and federal trustee agencies to evaluate injury to natural resources and are supporting long-term research into the potential impacts of oil spills on ecosystems.
Gulf of Mexico restoration
200+initial and amended work plans developed since May 2010 to assess injury to natural resources.
$184mawarded to fund research to better understand the Gulf ecosystem.
The Gulf Coast accounts for about 18% of the US’s total commercial seafood landings. Shrimp and oyster supplies are particularly heavily concentrated in the Gulf.
Michael Taylor Deputy Commissioner for Foods, US Food and Drug Administration
A great deal of effort was invested after the Gulf spill so that we could provide an answer to one question: Is Gulf seafood safe to eat? Yes, Gulf seafood is safe to eat, and it is safe to eat for everyone.
Update on the Gulf of MexicoBP Sustainability Review 2012
9
Restoring the economyOur Gulf Coast economic recovery efforts have focused on paying all legitimate claims and supporting two of the region’s most vital industries – tourism and seafood.
From 2010, BP has supported Gulf Coast tourism by committing $179 million through to 2013 to Alabama, Florida, Louisiana and Mississippi for regional and national tourism campaigns aimed at attracting visitors to the Gulf Coast. Another $57 million is being given to non-profit groups and government entities to promote the tourism and seafood industries as part of the Plaintiffs’ Steering Committee settlement. Preliminary data from the National Oceanic and Atmospheric Administration (NOAA) indicates that recreational fishing, which is an important source of tourism and a significant contributor to the Gulf economy, continued to recover in 2012, following a strong year in 2011.
BP is also supporting the seafood industry across the Gulf region. By the end of 2012, we had paid or committed to pay $82 million to Alabama, Florida, Louisiana and Mississippi for state-led seafood testing and marketing programmes. This is in addition to resolving legitimate claims made by those in the fishing and seafood processing industry.
Although research and monitoring continues, many experts believe Gulf of Mexico seafood is making a strong recovery. Based on government testing results and commercial landings information, Gulf seafood is safe to consume and available in numbers comparable to pre-accident levels. According to data from NOAA, commercial seafood landings in the Gulf in 2011 reached their highest levels since 2000, although the results varied by state and by species.
Claims payments Within weeks of the Deepwater Horizon accident, BP began paying compensation for legitimate claims for damages resulting from the accident. Since May 2010, BP has paid a total of $8.2 billion to individuals and businesses through various claims processes, with $1.9 billion being paid in 2012. BP has paid almost $1.4 billion for claims, advances and settlements with government entities.
Agreement with the US governmentBP reached an agreement with the US government in November 2012 to resolve all federal criminal claims arising out of the Gulf of Mexico incident. BP pleaded guilty to 11 felony counts of misconduct or neglect of ships officers relating to the loss of 11 lives; one misdemeanour count under the Clean Water Act; one misdemeanour count under the Migratory Bird Treaty Act; and one felony count of obstruction of Congress.
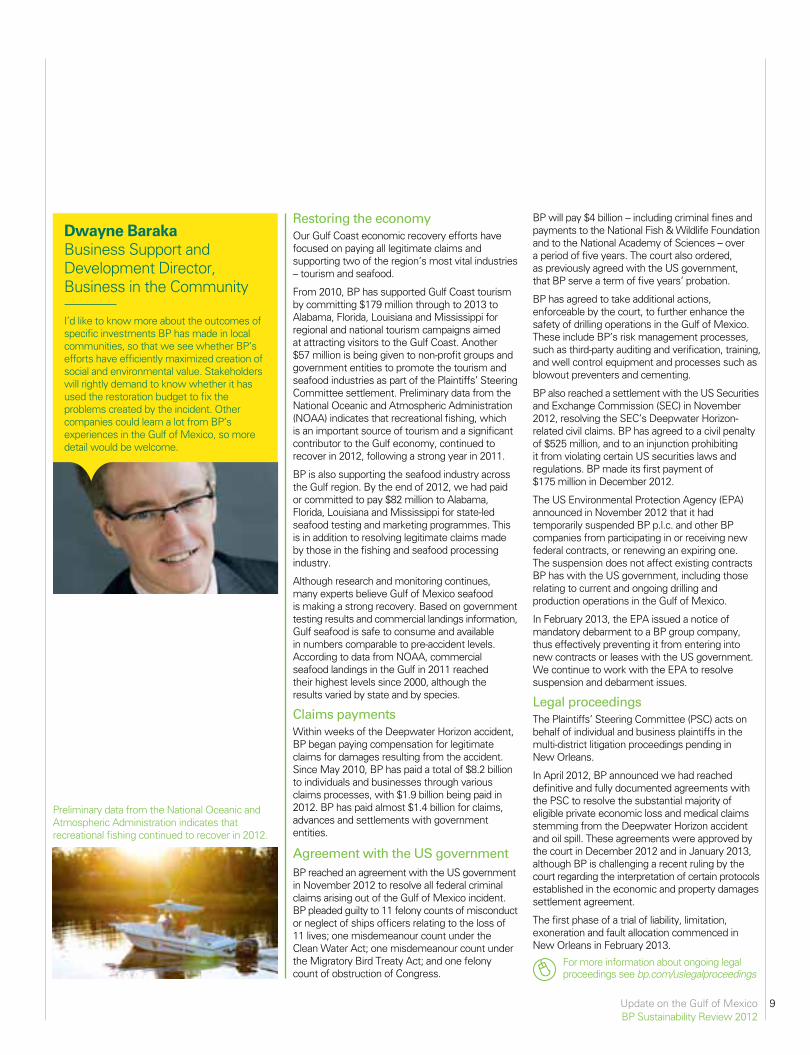
Dwayne Baraka Business Support and Development Director, Business in the Community
I’d like to know more about the outcomes of specific investments BP has made in local communities, so that we see whether BP’s efforts have efficiently maximized creation of social and environmental value. Stakeholders will rightly demand to know whether it has used the restoration budget to fix the problems created by the incident. Other companies could learn a lot from BP’s experiences in the Gulf of Mexico, so more detail would be welcome.
Preliminary data from the National Oceanic and Atmospheric Administration indicates that recreational fishing continued to recover in 2012.
BP will pay $4 billion – including criminal fines and payments to the National Fish & Wildlife Foundation and to the National Academy of Sciences – over a period of five years. The court also ordered, as previously agreed with the US government, that BP serve a term of five years’ probation.
BP has agreed to take additional actions, enforceable by the court, to further enhance the safety of drilling operations in the Gulf of Mexico. These include BP’s risk management processes, such as third-party auditing and verification, training, and well control equipment and processes such as blowout preventers and cementing.
BP also reached a settlement with the US Securities and Exchange Commission (SEC) in November 2012, resolving the SEC’s Deepwater Horizon-related civil claims. BP has agreed to a civil penalty of $525 million, and to an injunction prohibiting it from violating certain US securities laws and regulations. BP made its first payment of $175 million in December 2012.
The US Environmental Protection Agency (EPA) announced in November 2012 that it had temporarily suspended BP p.l.c. and other BP companies from participating in or receiving new federal contracts, or renewing an expiring one. The suspension does not affect existing contracts BP has with the US government, including those relating to current and ongoing drilling and production operations in the Gulf of Mexico.
In February 2013, the EPA issued a notice of mandatory debarment to a BP group company, thus effectively preventing it from entering into new contracts or leases with the US government. We continue to work with the EPA to resolve suspension and debarment issues.
Legal proceedingsThe Plaintiffs’ Steering Committee (PSC) acts on behalf of individual and business plaintiffs in the multi-district litigation proceedings pending in New Orleans.
In April 2012, BP announced we had reached definitive and fully documented agreements with the PSC to resolve the substantial majority of eligible private economic loss and medical claims stemming from the Deepwater Horizon accident and oil spill. These agreements were approved by the court in December 2012 and in January 2013, although BP is challenging a recent ruling by the court regarding the interpretation of certain protocols established in the economic and property damages settlement agreement.
The first phase of a trial of liability, limitation, exoneration and fault allocation commenced in New Orleans in February 2013.
For more information about ongoing legal proceedings see bp.com/uslegalproceedings
10 The energy futureBP Sustainability Review 2012
Today’s challenge is to manage and meet growing demand for secure, affordable energy while addressing climate change and other environmental and social issues.
The energy future
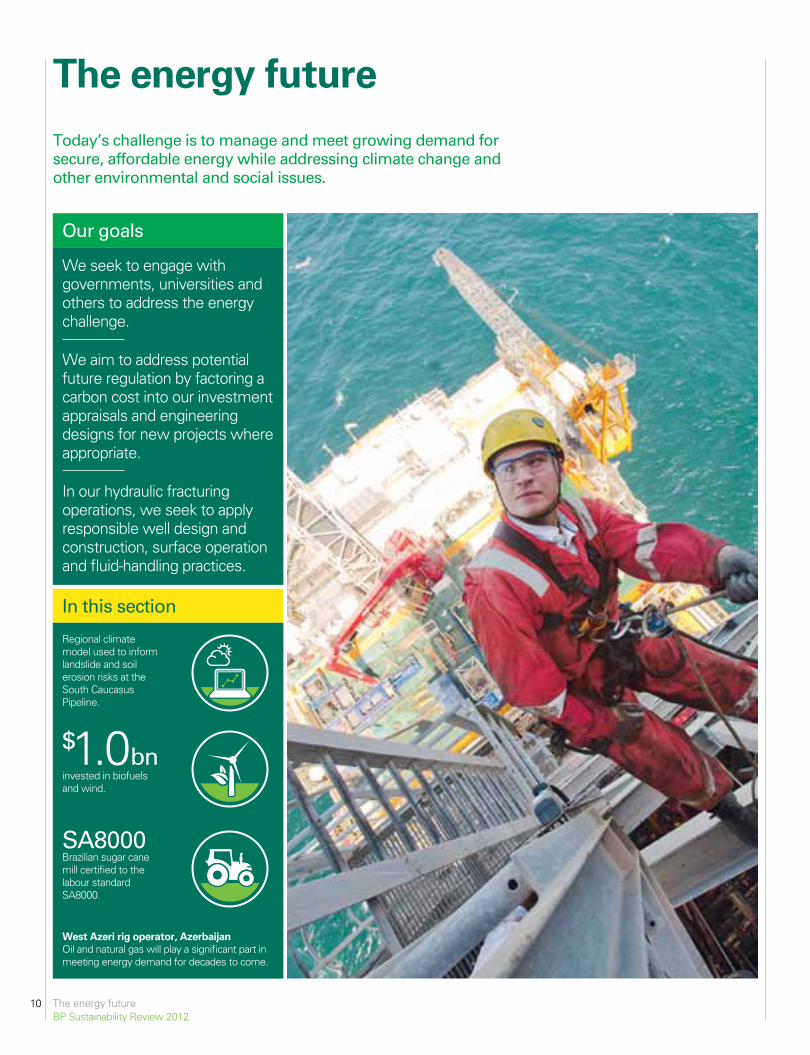
Our goals
We seek to engage with governments, universities and others to address the energy challenge.
We aim to address potential future regulation by factoring a carbon cost into our investment appraisals and engineering designs for new projects where appropriate.
In our hydraulic fracturing operations, we seek to apply responsible well design and construction, surface operation and fluid-handling practices.
In this section
Regional climate model used to inform landslide and soil erosion risks at the South Caucasus Pipeline.
$1.0bninvested in biofuels and wind.
SA8000Brazilian sugar cane mill certified to the labour standard SA8000.
West Azeri rig operator, AzerbaijanOil and natural gas will play a significant part in meeting energy demand for decades to come.
11The energy futureBP Sustainability Review 2012
Meeting the energy challenge
With population and incomes projected to rise, the global energy challenge is to manage and meet demand affordably, sustainably and securely.
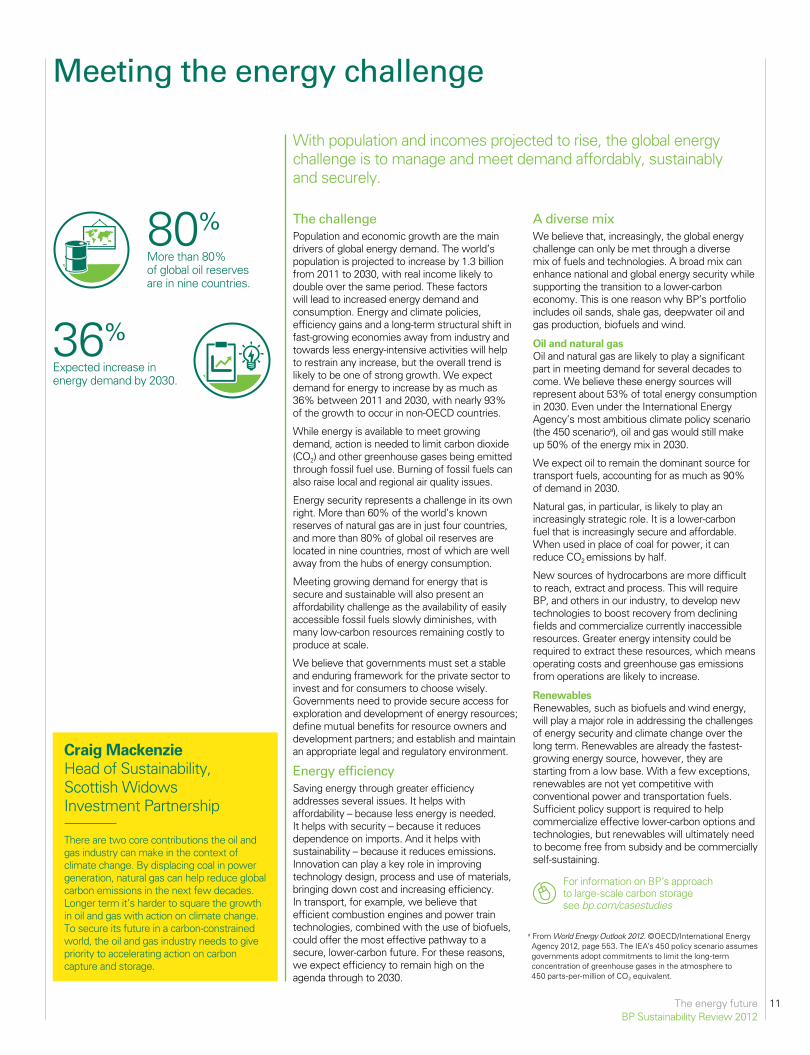
Craig Mackenzie Head of Sustainability, Scottish Widows Investment Partnership
There are two core contributions the oil and gas industry can make in the context of climate change. By displacing coal in power generation, natural gas can help reduce global carbon emissions in the next few decades. Longer term it’s harder to square the growth in oil and gas with action on climate change. To secure its future in a carbon-constrained world, the oil and gas industry needs to give priority to accelerating action on carbon capture and storage.
80%More than 80% of global oil reserves are in nine countries.
36%Expected increase in energy demand by 2030.
a From World Energy Outlook 2012. ©OECD/International Energy Agency 2012, page 553. The IEA’s 450 policy scenario assumes governments adopt commitments to limit the long-term concentration of greenhouse gases in the atmosphere to 450 parts-per-million of CO2 equivalent.
The challengePopulation and economic growth are the main drivers of global energy demand. The world’s population is projected to increase by 1.3 billion from 2011 to 2030, with real income likely to double over the same period. These factors will lead to increased energy demand and consumption. Energy and climate policies, efficiency gains and a long-term structural shift in fast-growing economies away from industry and towards less energy-intensive activities will help to restrain any increase, but the overall trend is likely to be one of strong growth. We expect demand for energy to increase by as much as 36% between 2011 and 2030, with nearly 93% of the growth to occur in non-OECD countries.
While energy is available to meet growing demand, action is needed to limit carbon dioxide (CO2) and other greenhouse gases being emitted through fossil fuel use. Burning of fossil fuels can also raise local and regional air quality issues.
Energy security represents a challenge in its own right. More than 60% of the world’s known reserves of natural gas are in just four countries, and more than 80% of global oil reserves are located in nine countries, most of which are well away from the hubs of energy consumption.
Meeting growing demand for energy that is secure and sustainable will also present an affordability challenge as the availability of easily accessible fossil fuels slowly diminishes, with many low-carbon resources remaining costly to produce at scale.
We believe that governments must set a stable and enduring framework for the private sector to invest and for consumers to choose wisely. Governments need to provide secure access for exploration and development of energy resources; define mutual benefits for resource owners and development partners; and establish and maintain an appropriate legal and regulatory environment.
Energy efficiencySaving energy through greater efficiency addresses several issues. It helps with affordability – because less energy is needed. It helps with security – because it reduces dependence on imports. And it helps with sustainability – because it reduces emissions. Innovation can play a key role in improving technology design, process and use of materials, bringing down cost and increasing efficiency. In transport, for example, we believe that efficient combustion engines and power train technologies, combined with the use of biofuels, could offer the most effective pathway to a secure, lower-carbon future. For these reasons, we expect efficiency to remain high on the agenda through to 2030.
A diverse mixWe believe that, increasingly, the global energy challenge can only be met through a diverse mix of fuels and technologies. A broad mix can enhance national and global energy security while supporting the transition to a lower-carbon economy. This is one reason why BP’s portfolio includes oil sands, shale gas, deepwater oil and gas production, biofuels and wind.
Oil and natural gasOil and natural gas are likely to play a significant part in meeting demand for several decades to come. We believe these energy sources will represent about 53% of total energy consumption in 2030. Even under the International Energy Agency’s most ambitious climate policy scenario (the 450 scenarioa), oil and gas would still make up 50% of the energy mix in 2030.
We expect oil to remain the dominant source for transport fuels, accounting for as much as 90% of demand in 2030.
Natural gas, in particular, is likely to play an increasingly strategic role. It is a lower-carbon fuel that is increasingly secure and affordable. When used in place of coal for power, it can reduce CO2 emissions by half.
New sources of hydrocarbons are more difficult to reach, extract and process. This will require BP, and others in our industry, to develop new technologies to boost recovery from declining fields and commercialize currently inaccessible resources. Greater energy intensity could be required to extract these resources, which means operating costs and greenhouse gas emissions from operations are likely to increase.
RenewablesRenewables, such as biofuels and wind energy, will play a major role in addressing the challenges of energy security and climate change over the long term. Renewables are already the fastest-growing energy source, however, they are starting from a low base. With a few exceptions, renewables are not yet competitive with conventional power and transportation fuels. Sufficient policy support is required to help commercialize effective lower-carbon options and technologies, but renewables will ultimately need to become free from subsidy and be commercially self-sustaining.
For information on BP’s approach to large-scale carbon storage see bp.com/casestudies
The energy futureBP Sustainability Review 2012
Our deepwater drilling operations and future growth opportunities
Deepwater drilling operations and opportunities
Countries where we operate
12
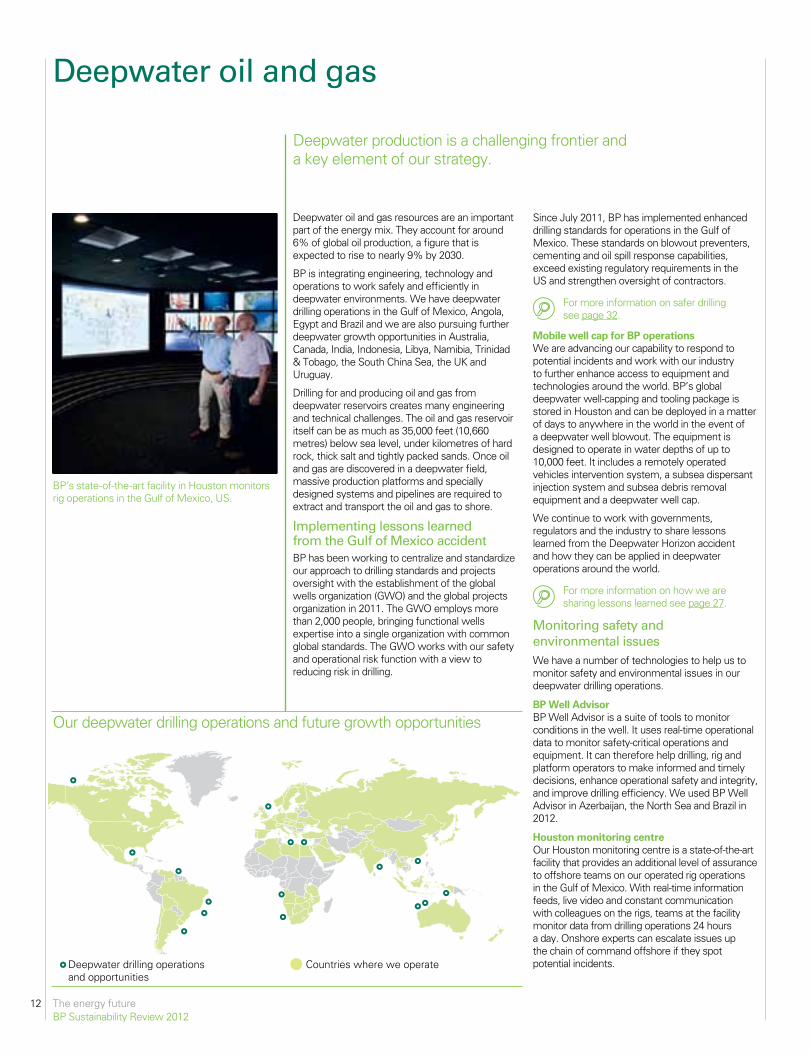
Deepwater production is a challenging frontier and a key element of our strategy.
Deepwater oil and gas
BP’s state-of-the-art facility in Houston monitors rig operations in the Gulf of Mexico, US.
Deepwater oil and gas resources are an important part of the energy mix. They account for around 6% of global oil production, a figure that is expected to rise to nearly 9% by 2030.
BP is integrating engineering, technology and operations to work safely and efficiently in deepwater environments. We have deepwater drilling operations in the Gulf of Mexico, Angola, Egypt and Brazil and we are also pursuing further deepwater growth opportunities in Australia, Canada, India, Indonesia, Libya, Namibia, Trinidad & Tobago, the South China Sea, the UK and Uruguay.
Drilling for and producing oil and gas from deepwater reservoirs creates many engineering and technical challenges. The oil and gas reservoir itself can be as much as 35,000 feet (10,660 metres) below sea level, under kilometres of hard rock, thick salt and tightly packed sands. Once oil and gas are discovered in a deepwater field, massive production platforms and specially designed systems and pipelines are required to extract and transport the oil and gas to shore.
Implementing lessons learned from the Gulf of Mexico accidentBP has been working to centralize and standardize our approach to drilling standards and projects oversight with the establishment of the global wells organization (GWO) and the global projects organization in 2011. The GWO employs more than 2,000 people, bringing functional wells expertise into a single organization with common global standards. The GWO works with our safety and operational risk function with a view to reducing risk in drilling.
Since July 2011, BP has implemented enhanced drilling standards for operations in the Gulf of Mexico. These standards on blowout preventers, cementing and oil spill response capabilities, exceed existing regulatory requirements in the US and strengthen oversight of contractors.
For more information on safer drilling see page 32.
Mobile well cap for BP operationsWe are advancing our capability to respond to potential incidents and work with our industry to further enhance access to equipment and technologies around the world. BP’s global deepwater well-capping and tooling package is stored in Houston and can be deployed in a matter of days to anywhere in the world in the event of a deepwater well blowout. The equipment is designed to operate in water depths of up to 10,000 feet. It includes a remotely operated vehicles intervention system, a subsea dispersant injection system and subsea debris removal equipment and a deepwater well cap.
We continue to work with governments, regulators and the industry to share lessons learned from the Deepwater Horizon accident and how they can be applied in deepwater operations around the world.
For more information on how we are sharing lessons learned see page 27.
Monitoring safety and environmental issues We have a number of technologies to help us to monitor safety and environmental issues in our deepwater drilling operations.
BP Well Advisor BP Well Advisor is a suite of tools to monitor conditions in the well. It uses real-time operational data to monitor safety-critical operations and equipment. It can therefore help drilling, rig and platform operators to make informed and timely decisions, enhance operational safety and integrity, and improve drilling efficiency. We used BP Well Advisor in Azerbaijan, the North Sea and Brazil in 2012.
Houston monitoring centreOur Houston monitoring centre is a state-of-the-art facility that provides an additional level of assurance to offshore teams on our operated rig operations in the Gulf of Mexico. With real-time information feeds, live video and constant communication with colleagues on the rigs, teams at the facility monitor data from drilling operations 24 hours a day. Onshore experts can escalate issues up the chain of command offshore if they spot potential incidents.
The energy futureBP Sustainability Review 2012
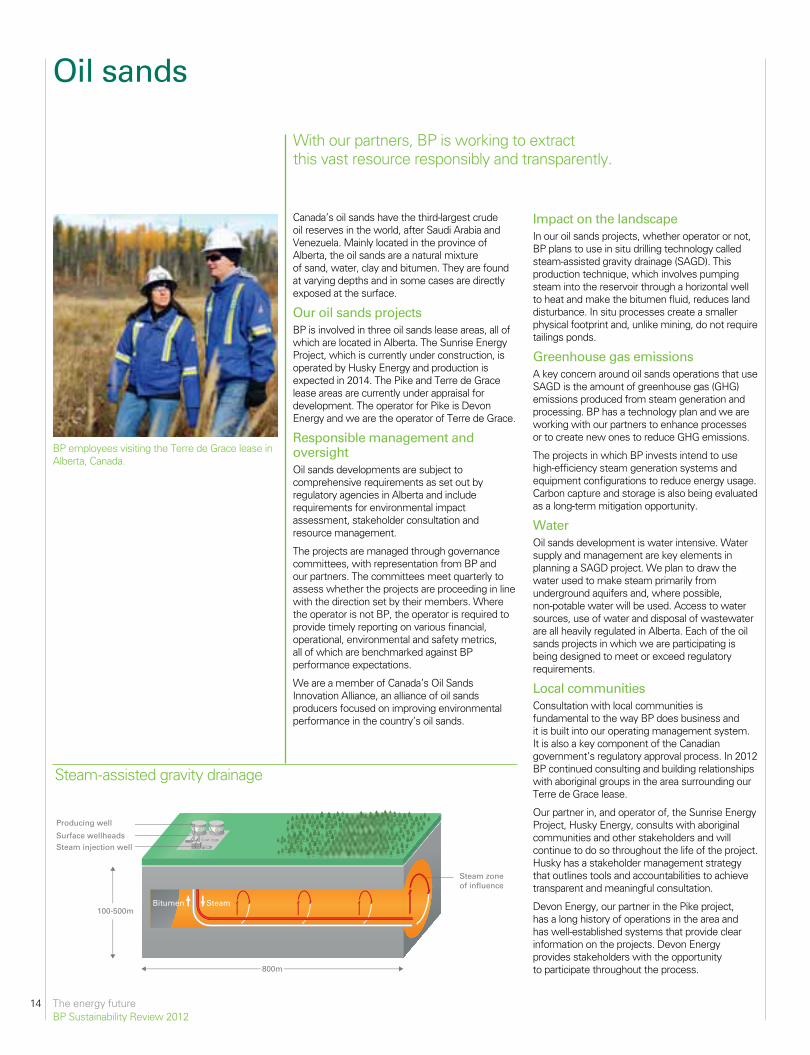
Hydraulic fracturing process
Water tankersFracturing fluid ispumped into thewell head
Water table
Well isisolatedwith cement
7,000 ft
Shale
Recovered water isstored in lined pitsand/or tanks
Wastewater is recoveredfor treatment, reuseor disposal
Storage tanks
Fissure
Well
Gas flows alongwell from fractures
13
By our estimates, natural gas will meet around 26% of total global energy demand by 2030. Unconventional gas is situated in rocks with extremely low permeability, which makes extracting it more difficult. New technologies are making it possible to extract unconventional gas resources safely, responsibly and economically. BP has unconventional gas operations in the US, Algeria, Indonesia and Oman.
Hydraulic fracturing (sometimes referred to as ‘fracking’) is the process of pumping water, mixed with a small proportion of sand and chemicals, underground at a high enough pressure to split the rock and release natural gas that would otherwise not be accessible.
Some stakeholders have raised concerns about the potential environmental and community impacts of hydraulic fracturing. BP recognizes these concerns and seeks to apply responsible well design and construction, surface operation and fluid-handling practices to mitigate these risks.
The chemicals used in the fracturing processWater and sand constitute on average 99.5% of the injection fluid. This is mixed with chemicals to create the fracturing fluid that is pumped underground at high pressure to fracture the rock with the sand propping the fractures open. Some of the chemicals used in the process are classified as hazardous materials, and each chemical used in the fracturing process is listed in the material safety data sheets at each site, which detail safe dosage limits. We submit data on chemicals used at our hydraulically fractured wells in the US at fracfocus.org.
Natural gas resources play an increasingly important role in supplying lower-carbon fuel for a growing energy demand.
Unconventional gas and hydraulic fracturing
26%Natural gas will meet around 26% of total global energy demand by 2030.
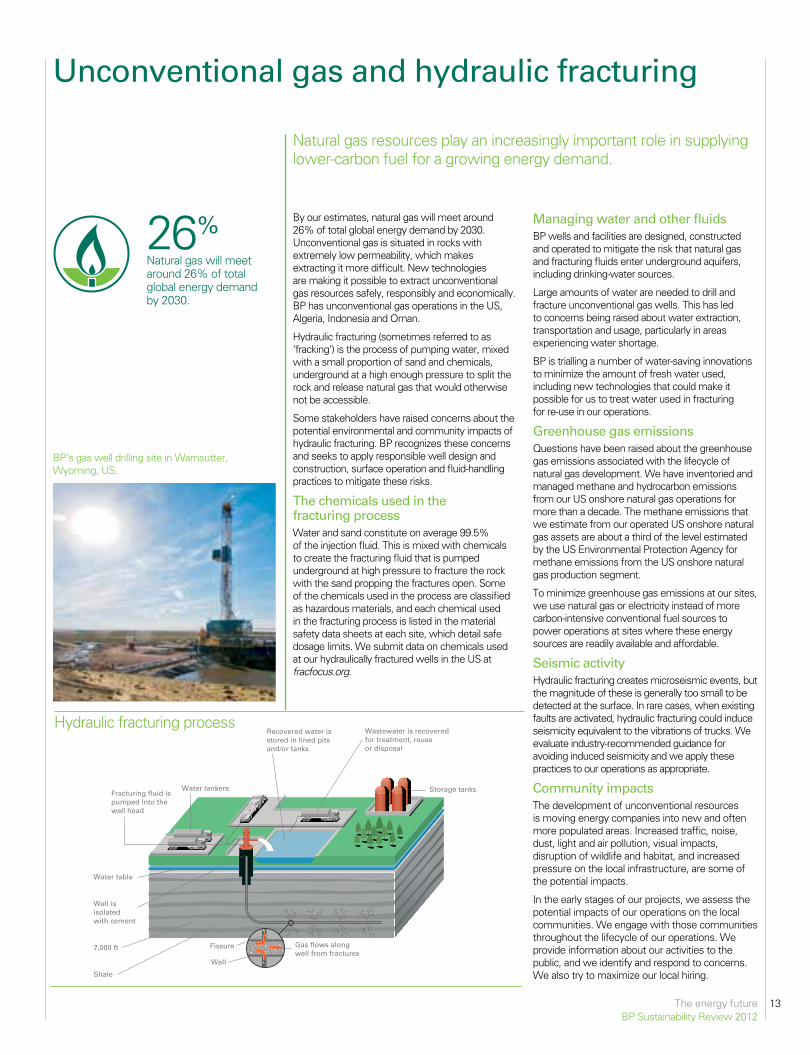
BP’s gas well drilling site in Wamsutter, Wyoming, US.
Managing water and other fluidsBP wells and facilities are designed, constructed and operated to mitigate the risk that natural gas and fracturing fluids enter underground aquifers, including drinking-water sources.
Large amounts of water are needed to drill and fracture unconventional gas wells. This has led to concerns being raised about water extraction, transportation and usage, particularly in areas experiencing water shortage.
BP is trialling a number of water-saving innovations to minimize the amount of fresh water used, including new technologies that could make it possible for us to treat water used in fracturing for re-use in our operations.
Greenhouse gas emissionsQuestions have been raised about the greenhouse gas emissions associated with the lifecycle of natural gas development. We have inventoried and managed methane and hydrocarbon emissions from our US onshore natural gas operations for more than a decade. The methane emissions that we estimate from our operated US onshore natural gas assets are about a third of the level estimated by the US Environmental Protection Agency for methane emissions from the US onshore natural gas production segment.
To minimize greenhouse gas emissions at our sites, we use natural gas or electricity instead of more carbon-intensive conventional fuel sources to power operations at sites where these energy sources are readily available and affordable.
Seismic activityHydraulic fracturing creates microseismic events, but the magnitude of these is generally too small to be detected at the surface. In rare cases, when existing faults are activated, hydraulic fracturing could induce seismicity equivalent to the vibrations of trucks. We evaluate industry-recommended guidance for avoiding induced seismicity and we apply these practices to our operations as appropriate.
Community impactsThe development of unconventional resources is moving energy companies into new and often more populated areas. Increased traffic, noise, dust, light and air pollution, visual impacts, disruption of wildlife and habitat, and increased pressure on the local infrastructure, are some of the potential impacts.
In the early stages of our projects, we assess the potential impacts of our operations on the local communities. We engage with those communities throughout the lifecycle of our operations. We provide information about our activities to the public, and we identify and respond to concerns. We also try to maximize our local hiring.
The energy futureBP Sustainability Review 2012
Surface wellheads
Producing well
Steam injection well
100-500mSteamBitumen
Steam zoneof influence
800m
14
Canada’s oil sands have the third-largest crude oil reserves in the world, after Saudi Arabia and Venezuela. Mainly located in the province of Alberta, the oil sands are a natural mixture of sand, water, clay and bitumen. They are found at varying depths and in some cases are directly exposed at the surface.
Our oil sands projectsBP is involved in three oil sands lease areas, all of which are located in Alberta. The Sunrise Energy Project, which is currently under construction, is operated by Husky Energy and production is expected in 2014. The Pike and Terre de Grace lease areas are currently under appraisal for development. The operator for Pike is Devon Energy and we are the operator of Terre de Grace.
Responsible management and oversight Oil sands developments are subject to comprehensive requirements as set out by regulatory agencies in Alberta and include requirements for environmental impact assessment, stakeholder consultation and resource management.
The projects are managed through governance committees, with representation from BP and our partners. The committees meet quarterly to assess whether the projects are proceeding in line with the direction set by their members. Where the operator is not BP, the operator is required to provide timely reporting on various financial, operational, environmental and safety metrics, all of which are benchmarked against BP performance expectations.
We are a member of Canada’s Oil Sands Innovation Alliance, an alliance of oil sands producers focused on improving environmental performance in the country’s oil sands.
With our partners, BP is working to extract this vast resource responsibly and transparently.
Oil sands
BP employees visiting the Terre de Grace lease in Alberta, Canada.
Steam-assisted gravity drainage
Impact on the landscapeIn our oil sands projects, whether operator or not, BP plans to use in situ drilling technology called steam-assisted gravity drainage (SAGD). This production technique, which involves pumping steam into the reservoir through a horizontal well to heat and make the bitumen fluid, reduces land disturbance. In situ processes create a smaller physical footprint and, unlike mining, do not require tailings ponds.
Greenhouse gas emissions A key concern around oil sands operations that use SAGD is the amount of greenhouse gas (GHG) emissions produced from steam generation and processing. BP has a technology plan and we are working with our partners to enhance processes or to create new ones to reduce GHG emissions.
The projects in which BP invests intend to use high-efficiency steam generation systems and equipment configurations to reduce energy usage. Carbon capture and storage is also being evaluated as a long-term mitigation opportunity.
WaterOil sands development is water intensive. Water supply and management are key elements in planning a SAGD project. We plan to draw the water used to make steam primarily from underground aquifers and, where possible, non-potable water will be used. Access to water sources, use of water and disposal of wastewater are all heavily regulated in Alberta. Each of the oil sands projects in which we are participating is being designed to meet or exceed regulatory requirements.
Local communitiesConsultation with local communities is fundamental to the way BP does business and it is built into our operating management system. It is also a key component of the Canadian government’s regulatory approval process. In 2012 BP continued consulting and building relationships with aboriginal groups in the area surrounding our Terre de Grace lease.
Our partner in, and operator of, the Sunrise Energy Project, Husky Energy, consults with aboriginal communities and other stakeholders and will continue to do so throughout the life of the project. Husky has a stakeholder management strategy that outlines tools and accountabilities to achieve transparent and meaningful consultation.
Devon Energy, our partner in the Pike project, has a long history of operations in the area and has well-established systems that provide clear information on the projects. Devon Energy provides stakeholders with the opportunity to participate throughout the process.
The energy future BP Sustainability Review 2012
15
Renewable energy is the fastest growing segment of the global energy industry, with BP’s forecasts showing around 7.6% growth each year between 2011 and 2030. To support this growth, we believe appropriate government policy and transitional incentives are necessary to encourage production while lowering costs.
BP is investing in biofuels and wind as well as in new technologies that could create new options for growth. In total, we invested $1 billion in our alternative energy businesses in 2012, bringing our total investment since 2005 to $7.6 billion and moving us closer to early fulfilment of the commitment we made to invest $8 billion by 2015.
Biofuels We are investing in biofuels that we deem to be affordable, low carbon, sustainable and scalable. Our three sugar cane ethanol mills in Brazil had a crushing capacity of 7.2 million tonnes of sugar cane in 2012, and we are working towards significantly expanding this business.
At our Tropical sugar cane operations in Edéia, Goiás state, we are increasing production capacity and planting more sugar cane. The expansion, which is due for completion by early 2015, is expected to double Tropical’s ethanol processing capacity and create around 7,650 direct and indirect jobs. Our biofuels joint venture in the UK, Vivergo Fuels, began production in 2012.
Our Tropical operation was one of the first such operations in the world to be certified under SA8000, the international standard for social accountability. We are working towards SA8000 at our other two operations in the country.
Advanced biofuels developmentIn 2012 we cancelled plans to build a commercial-scale cellulosic ethanol plant in Florida and refocused our cellulosic strategy on research, development and technology licensing. At our biofuels research facility in San Diego, California, our researchers are working to develop more advanced biofuels for the future. Some of their key discoveries are now moving towards commercial production. During the London 2012 Olympic and Paralympic Games we provided three cutting-edge biofuels – cellulosic ethanol, biobutanol and sugar-to-diesel – in demonstration quantities, blended with BP Ultimate, at pumps that served the official games fleet. There was no need for any modification of the vehicles’ engines.
Certifying that biofuels are sustainableAs well as producing our own biofuels, BP purchases and blends significant quantities of biocomponents produced by other operators into fuels for markets, including the US and Europe, where policies require that gasoline and diesel sold to motorists include a proportion of biofuels.
By 2030 we estimate renewable energy is likely to meet around 6% of total global energy demand.
Alternative energy
Marcos Fava Neves Professor, School of Economics and Business, University of São Paulo
The food versus fuel debate has come at a moment when several factors are working together to affect supply and demand for grains, but science is showing that the debate about ethanol and food is not the most relevant debate. Agriculture can answer the demand for food, fuel, plastics and several other types of products that require farmland. It just needs more investment and innovation from companies like BP to increase productivity and improve logistics, especially in South America and Africa where there is available land. Biofuels are important to produce empowerment for farmers, to protect the environment and to spread wealth and income in poor and emerging economies.
For purchased biofuels, BP aims to comply with all biofuel sustainability legal requirements in countries where such regulations are in place. Elsewhere, we encourage our suppliers to meet voluntary sustainability standards, such as those from the Roundtable for Sustainable Palm Oil.
BP is a member of the board of Bonsucro. The Bonsucro standard certifies the sustainable production of sugar cane and the scheme includes criteria that addresses the impact on human rights and the environment. Our Tropical biofuels operation in Brazil achieved Bonsucro certification in 2012, and we are working to achieve Bonsucro certification at all our sugar cane mills in the country.
WindBP has built up one of the leading wind businesses in the US. We have 16 wind farms in nine states and completed construction of new wind farms in 2012 in three states – Kansas, Pennsylvania and Hawaii. Together, our wind farms have the capacity to generate enough electricity to power 780,000 American homes.
Wind farms can bring tangible economic benefits to rural communities. So far, BP’s wind projects have created more than 4,200 construction jobs and around 200 permanent jobs. Our wind projects also support local economies through royalty payments to landowners and tax payments to local authorities.
Wind energy policy in the USTechnological advances spurred by policy support and private investment have helped to bring down the costs of wind electricity production significantly in recent years.
The production tax credit for wind projects in the US has helped to fuel this boom, creating a whole new supply chain and encouraging companies to innovate. BP believes that the recent extension of this tax credit was necessary to underpin the continued development of the US wind industry, and supports a structured expiration of this credit.
Emerging business and venturesBP is partnering with technology start-ups and venture capital firms with a goal of speeding up breakthrough innovations in areas of strategic importance to our company.
These ventures span a range of specialized innovations and technologies, each with the potential to provide new business options or to enhance BP’s existing oil and gas operations. For example, we have invested in Skyonic, a company whose innovative carbon-capture technology can be retrofitted onto power plants and other industrial facilities.
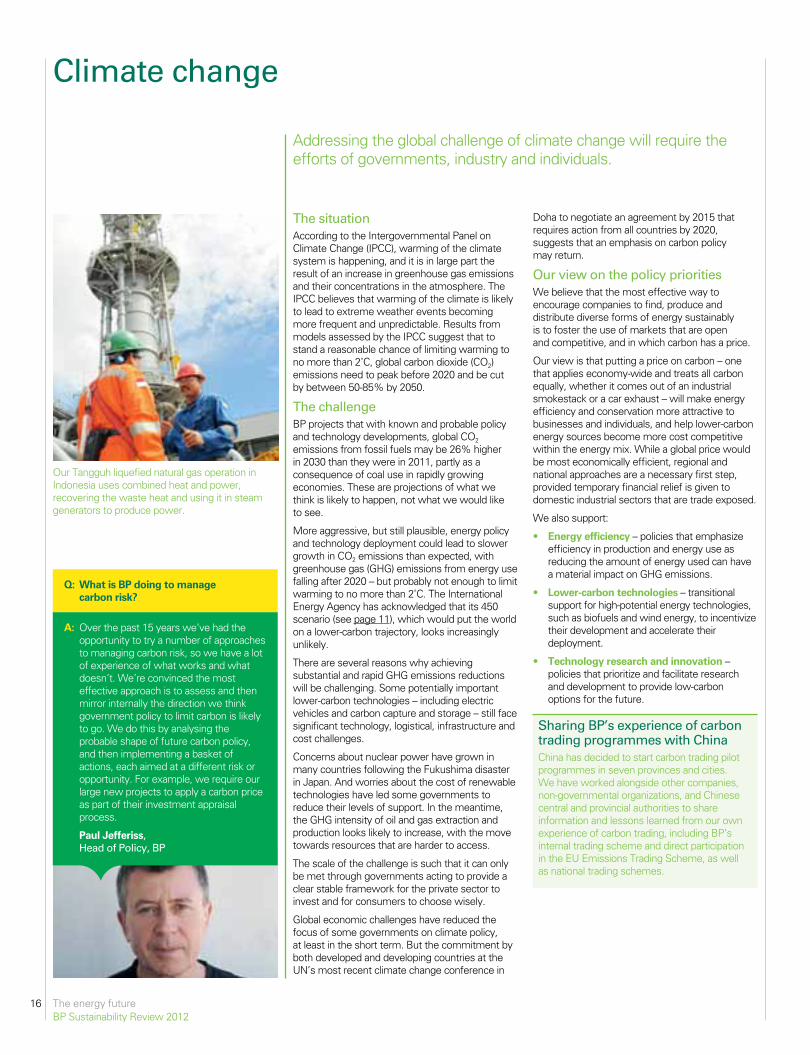
The energy futureBP Sustainability Review 2012
16
The situationAccording to the Intergovernmental Panel on Climate Change (IPCC), warming of the climate system is happening, and it is in large part the result of an increase in greenhouse gas emissions and their concentrations in the atmosphere. The IPCC believes that warming of the climate is likely to lead to extreme weather events becoming more frequent and unpredictable. Results from models assessed by the IPCC suggest that to stand a reasonable chance of limiting warming to no more than 2˚C, global carbon dioxide (CO2) emissions need to peak before 2020 and be cut by between 50-85% by 2050.
The challengeBP projects that with known and probable policy and technology developments, global CO2
emissions from fossil fuels may be 26% higher in 2030 than they were in 2011, partly as a consequence of coal use in rapidly growing economies. These are projections of what we think is likely to happen, not what we would like to see.
More aggressive, but still plausible, energy policy and technology deployment could lead to slower growth in CO2 emissions than expected, with greenhouse gas (GHG) emissions from energy use falling after 2020 – but probably not enough to limit warming to no more than 2˚C. The International Energy Agency has acknowledged that its 450 scenario (see page 11), which would put the world on a lower-carbon trajectory, looks increasingly unlikely.
There are several reasons why achieving substantial and rapid GHG emissions reductions will be challenging. Some potentially important lower-carbon technologies – including electric vehicles and carbon capture and storage – still face significant technology, logistical, infrastructure and cost challenges.
Concerns about nuclear power have grown in many countries following the Fukushima disaster in Japan. And worries about the cost of renewable technologies have led some governments to reduce their levels of support. In the meantime, the GHG intensity of oil and gas extraction and production looks likely to increase, with the move towards resources that are harder to access.
The scale of the challenge is such that it can only be met through governments acting to provide a clear stable framework for the private sector to invest and for consumers to choose wisely.
Global economic challenges have reduced the focus of some governments on climate policy, at least in the short term. But the commitment by both developed and developing countries at the UN’s most recent climate change conference in
Doha to negotiate an agreement by 2015 that requires action from all countries by 2020, suggests that an emphasis on carbon policy may return.
Our view on the policy prioritiesWe believe that the most effective way to encourage companies to find, produce and distribute diverse forms of energy sustainably is to foster the use of markets that are open and competitive, and in which carbon has a price.
Our view is that putting a price on carbon – one that applies economy-wide and treats all carbon equally, whether it comes out of an industrial smokestack or a car exhaust – will make energy efficiency and conservation more attractive to businesses and individuals, and help lower-carbon energy sources become more cost competitive within the energy mix. While a global price would be most economically efficient, regional and national approaches are a necessary first step, provided temporary financial relief is given to domestic industrial sectors that are trade exposed.
We also support:
• Energy efficiency – policies that emphasize efficiency in production and energy use as reducing the amount of energy used can have a material impact on GHG emissions.
• Lower-carbon technologies – transitional support for high-potential energy technologies, such as biofuels and wind energy, to incentivize their development and accelerate their deployment.
• Technology research and innovation – policies that prioritize and facilitate research and development to provide low-carbon options for the future.
Sharing BP’s experience of carbon trading programmes with ChinaChina has decided to start carbon trading pilot programmes in seven provinces and cities. We have worked alongside other companies, non-governmental organizations, and Chinese central and provincial authorities to share information and lessons learned from our own experience of carbon trading, including BP’s internal trading scheme and direct participation in the EU Emissions Trading Scheme, as well as national trading schemes.
Addressing the global challenge of climate change will require the efforts of governments, industry and individuals.
Climate change
A: Over the past 15 years we’ve had the opportunity to try a number of approaches to managing carbon risk, so we have a lot of experience of what works and what doesn’t. We’re convinced the most effective approach is to assess and then mirror internally the direction we think government policy to limit carbon is likely to go. We do this by analysing the probable shape of future carbon policy, and then implementing a basket of actions, each aimed at a different risk or opportunity. For example, we require our large new projects to apply a carbon price as part of their investment appraisal process.
Paul Jefferiss, Head of Policy, BP
Q: What is BP doing to manage carbon risk?
Our Tangguh liquefied natural gas operation in Indonesia uses combined heat and power, recovering the waste heat and using it in steam generators to produce power.
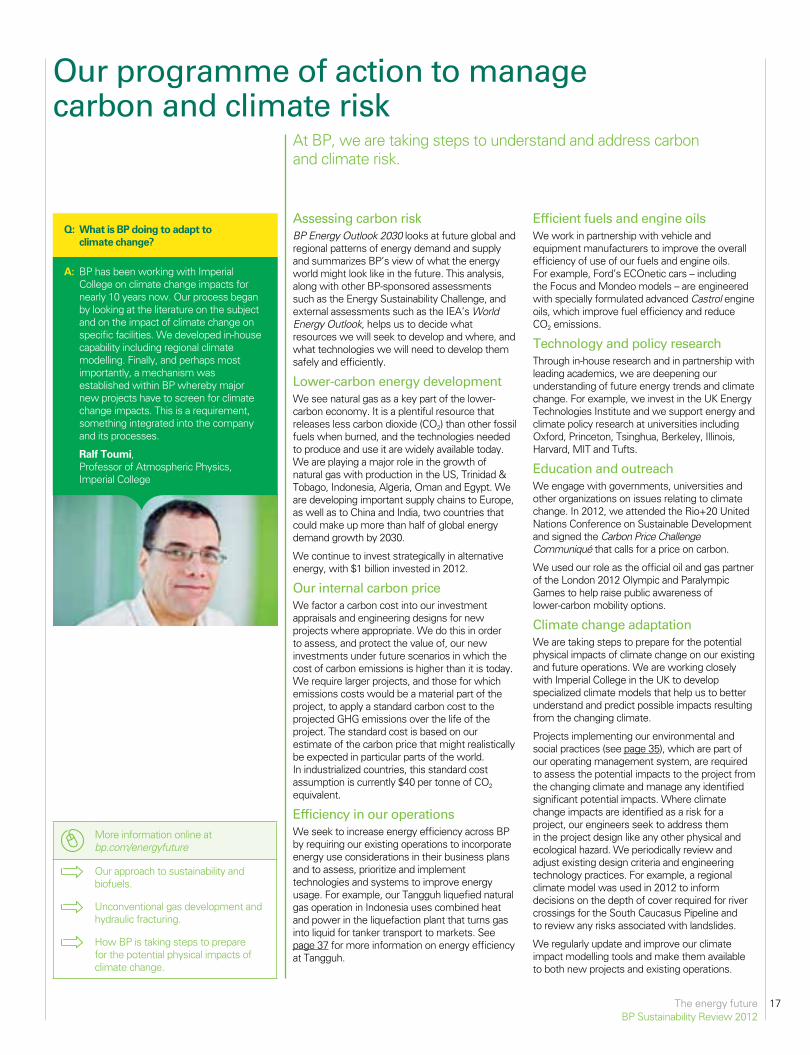
The energy futureBP Sustainability Review 2012
17
Assessing carbon risk BP Energy Outlook 2030 looks at future global and regional patterns of energy demand and supply and summarizes BP’s view of what the energy world might look like in the future. This analysis, along with other BP-sponsored assessments such as the Energy Sustainability Challenge, and external assessments such as the IEA’s World Energy Outlook, helps us to decide what resources we will seek to develop and where, and what technologies we will need to develop them safely and efficiently.
Lower-carbon energy developmentWe see natural gas as a key part of the lower-carbon economy. It is a plentiful resource that releases less carbon dioxide (CO2) than other fossil fuels when burned, and the technologies needed to produce and use it are widely available today. We are playing a major role in the growth of natural gas with production in the US, Trinidad & Tobago, Indonesia, Algeria, Oman and Egypt. We are developing important supply chains to Europe, as well as to China and India, two countries that could make up more than half of global energy demand growth by 2030.
We continue to invest strategically in alternative energy, with $1 billion invested in 2012.
Our internal carbon price We factor a carbon cost into our investment appraisals and engineering designs for new projects where appropriate. We do this in order to assess, and protect the value of, our new investments under future scenarios in which the cost of carbon emissions is higher than it is today. We require larger projects, and those for which emissions costs would be a material part of the project, to apply a standard carbon cost to the projected GHG emissions over the life of the project. The standard cost is based on our estimate of the carbon price that might realistically be expected in particular parts of the world. In industrialized countries, this standard cost assumption is currently $40 per tonne of CO2 equivalent.
Efficiency in our operations We seek to increase energy efficiency across BP by requiring our existing operations to incorporate energy use considerations in their business plans and to assess, prioritize and implement technologies and systems to improve energy usage. For example, our Tangguh liquefied natural gas operation in Indonesia uses combined heat and power in the liquefaction plant that turns gas into liquid for tanker transport to markets. See page 37 for more information on energy efficiency at Tangguh.
Efficient fuels and engine oils We work in partnership with vehicle and equipment manufacturers to improve the overall efficiency of use of our fuels and engine oils. For example, Ford’s ECOnetic cars – including the Focus and Mondeo models – are engineered with specially formulated advanced Castrol engine oils, which improve fuel efficiency and reduce CO2 emissions.
Technology and policy research Through in-house research and in partnership with leading academics, we are deepening our understanding of future energy trends and climate change. For example, we invest in the UK Energy Technologies Institute and we support energy and climate policy research at universities including Oxford, Princeton, Tsinghua, Berkeley, Illinois, Harvard, MIT and Tufts.
Education and outreachWe engage with governments, universities and other organizations on issues relating to climate change. In 2012, we attended the Rio+20 United Nations Conference on Sustainable Development and signed the Carbon Price Challenge Communiqué that calls for a price on carbon.
We used our role as the official oil and gas partner of the London 2012 Olympic and Paralympic Games to help raise public awareness of lower-carbon mobility options.
Climate change adaptationWe are taking steps to prepare for the potential physical impacts of climate change on our existing and future operations. We are working closely with Imperial College in the UK to develop specialized climate models that help us to better understand and predict possible impacts resulting from the changing climate.
Projects implementing our environmental and social practices (see page 35), which are part of our operating management system, are required to assess the potential impacts to the project from the changing climate and manage any identified significant potential impacts. Where climate change impacts are identified as a risk for a project, our engineers seek to address them in the project design like any other physical and ecological hazard. We periodically review and adjust existing design criteria and engineering technology practices. For example, a regional climate model was used in 2012 to inform decisions on the depth of cover required for river crossings for the South Caucasus Pipeline and to review any risks associated with landslides.
We regularly update and improve our climate impact modelling tools and make them available to both new projects and existing operations.
At BP, we are taking steps to understand and address carbon and climate risk.
Our programme of action to manage carbon and climate risk
A: BP has been working with Imperial College on climate change impacts for nearly 10 years now. Our process began by looking at the literature on the subject and on the impact of climate change on specific facilities. We developed in-house capability including regional climate modelling. Finally, and perhaps most importantly, a mechanism was established within BP whereby major new projects have to screen for climate change impacts. This is a requirement, something integrated into the company and its processes.
Ralf Toumi, Professor of Atmospheric Physics, Imperial College
Q: What is BP doing to adapt to climate change?
More information online at bp.com/energyfuture
Our approach to sustainability and biofuels.
Unconventional gas development and hydraulic fracturing.
How BP is taking steps to prepare for the potential physical impacts of climate change.
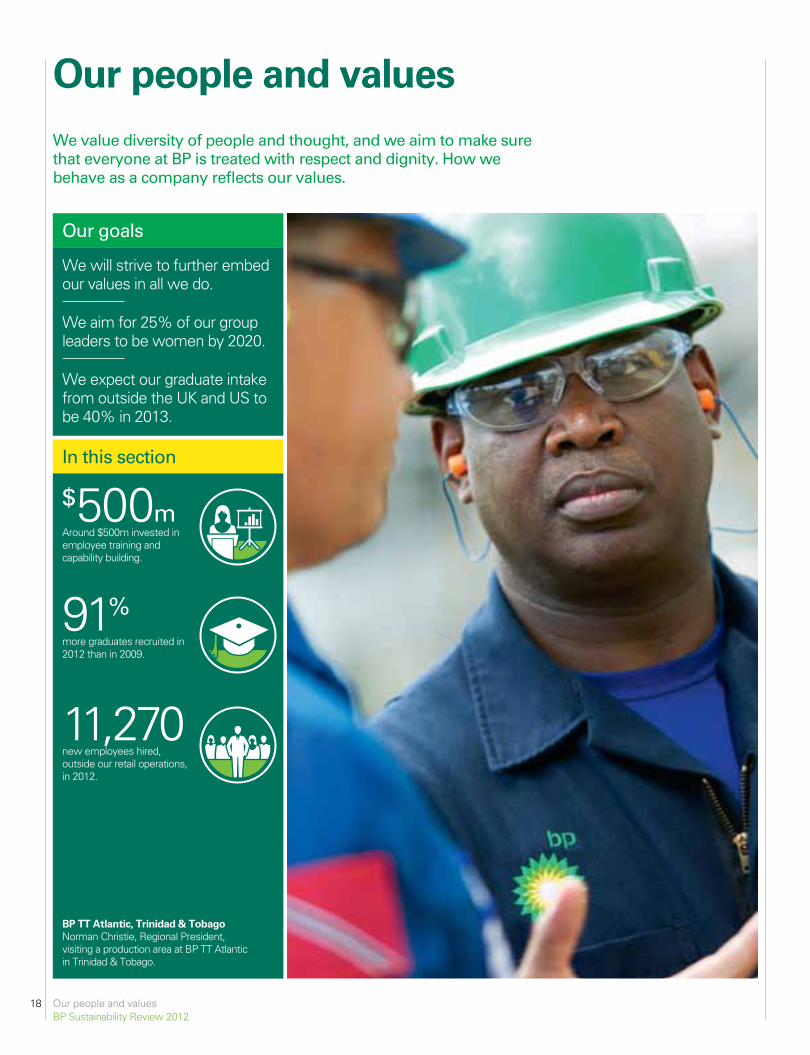
18 Our people and valuesBP Sustainability Review 2012
We value diversity of people and thought, and we aim to make sure that everyone at BP is treated with respect and dignity. How we behave as a company reflects our values.
Our people and values
Our goals
We will strive to further embed our values in all we do.
We aim for 25% of our group leaders to be women by 2020.
We expect our graduate intake from outside the UK and US to be 40% in 2013.
In this section
$500mAround $500m invested in employee training and capability building.
91%more graduates recruited in 2012 than in 2009.
11,270new employees hired, outside our retail operations, in 2012.
BP TT Atlantic, Trinidad & TobagoNorman Christie, Regional President, visiting a production area at BP TT Atlantic in Trinidad & Tobago.

19Our people and valuesBP Sustainability Review 2012
6 1
23
5
4
7
3. Asia 16,400
1. Europe 31,600
7. Russia 300
5. Middle East, North Africa 5,500
4. South and Central America 5,800
6. Sub-Saharan Africa 2,300
2. US and Canada 23,800
BP employees by region We employ nearly 86,000 people in more than 70 countries. We aim to have a good understanding of our future demand for people and where they will come from. Building our employees’ capability is a priority, as is rewarding them in a way that aligns with our goals. We focus on ensuring the safety of our employees, engaging with them, and increasing the diversity of our workforce so that it reflects the societies in which we operate.
Engaging with our people We conduct an annual survey of our employees to monitor employee engagement and identify areas where we can improve. The 2012 results show levels of engagement are up across all levels and business areas. Safety scores remain strong although there is more work for us to do in continuing to embed our operating management system as the way BP operates so people fully understand what it means for them.
We also measure how engaged our employees are with our strategic priorities of safety, trust and value. The group priorities engagement measure is derived from 12 questions about employee perceptions of BP as a company and how it is managed in terms of leadership and standards. Aggregate results for these questions showed a 4% improvement on 2011 to 71%.
Alongside engagement, a new indicator of employee and workplace satisfaction was introduced in 2012, replacing the previous employee satisfaction index (ESI). The aggregate score for employee and workplace satisfaction in 2012 was 71%. For comparison, the ESI, based on a narrower set of measures, rose by 4% to 66%.
Diversity and inclusion We work to attract, motivate, develop and retain the best talent from the diversity the world offers – our ability to be competitive and to thrive globally depends on it.
In 2012 we launched a framework to set out our ambition and drive further progress in diversity and inclusion. As part of this we are creating a network of diversity and inclusion champions who will help implement this work across the company.
BP has set goals for gender representation in leadership positions. Our goal is for 25% of group leaders and 30% of senior level leaders to be women by 2020. We are currently working on meaningful goals for minority representation.
At the end of 2012, 17% of our group leaders were female and 22% came from countries other than the UK and the US. When we started tracking this in 2000, these percentages were 9% and 14% respectively.
We supported the work of Lord Davies and his report on ‘Women on Boards.’ We have set a goal to increase the number of women on the board by two by the end of 2013. In 2012 the chairman joined the 30% Club, a group of chairmen who have voluntarily committed to bring more women onto UK corporate boards.
Rewarding performance BP employees are rewarded not just for what they deliver, but also for how they have demonstrated behaviour that reflects our values. As part of their individual performance review, employees set priorities on their contribution to safety, compliance and risk management; what they will deliver for the near and long term and how they will do their job.
Bonuses are awarded based equally on three criteria – the performance of the BP group overall, the performance of the immediate part of the company where the employee works, and the performance of the individual.
BP’s performance depends on an engaged, talented workforce, which is diverse and rewarded on merit.
Managing our people
Q: How will you achieve your goal of 25% female group leaders and 30% female senior level leaders by 2020?
Strategy Diversity and inclusion is an explicit part of our core values and strategic planning processes.
Leadership Leaders are accountable for leading diversity and inclusion, and represent the diversity of the organization.
Capability We are all responsible for growing, developing and retaining our diverse talent pool.
Culture Our working culture enables different generational, cultural and personality styles to flourish.
Improvement Consistent reporting mechanisms track progress toward diversity goals and inform our decision making.
Diversity and inclusion ambitionPlanned outcome by 2016
A: I recognize and acknowledge that this is an ambitious goal, but we are optimistic that this can be achieved and have the firm commitment from all our executives. This is underpinned by sophisticated monitoring of the senior level leader feeder pool, which has high-quality emerging talent. We are also working on detailed plans at all levels in the company. We have started introducing sustainable ways of managing support structures through our diversity and inclusion framework and quarterly reviews with the group people committee, chaired by our group chief executive.
Helmut Schuster, Group Human Resources Director, BP
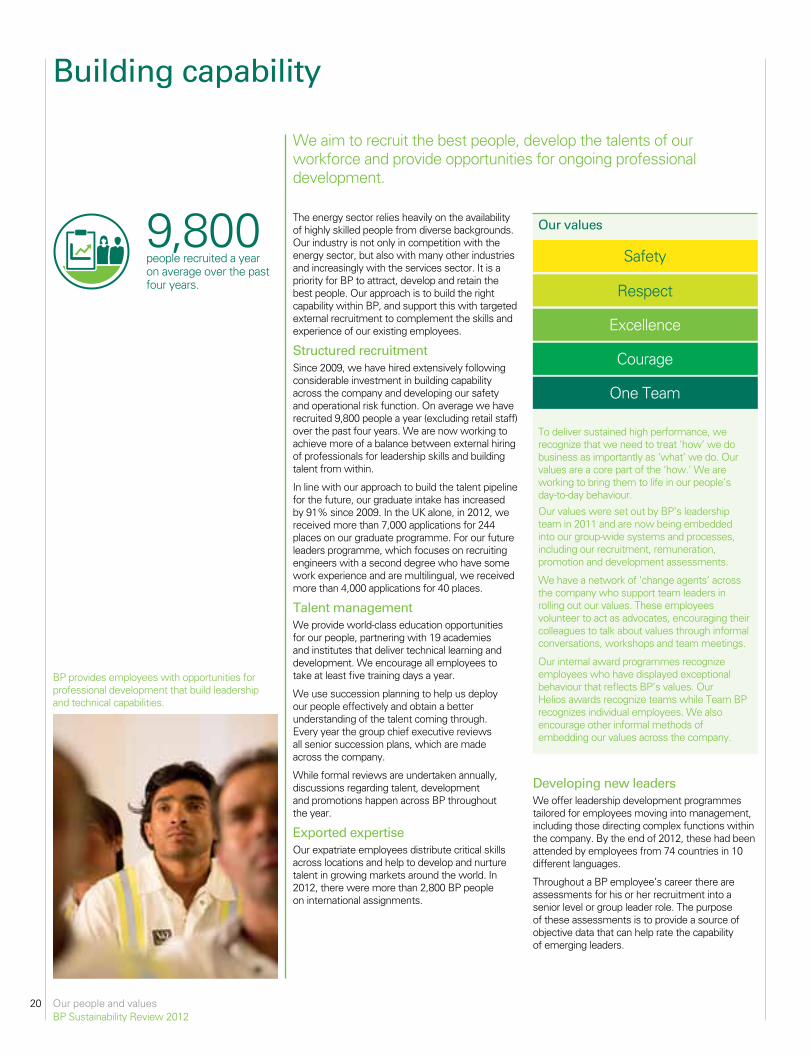
Our people and valuesBP Sustainability Review 2012
20
We aim to recruit the best people, develop the talents of our workforce and provide opportunities for ongoing professional development.
Building capability
The energy sector relies heavily on the availability of highly skilled people from diverse backgrounds. Our industry is not only in competition with the energy sector, but also with many other industries and increasingly with the services sector. It is a priority for BP to attract, develop and retain the best people. Our approach is to build the right capability within BP, and support this with targeted external recruitment to complement the skills and experience of our existing employees.
Structured recruitment Since 2009, we have hired extensively following considerable investment in building capability across the company and developing our safety and operational risk function. On average we have recruited 9,800 people a year (excluding retail staff) over the past four years. We are now working to achieve more of a balance between external hiring of professionals for leadership skills and building talent from within.
In line with our approach to build the talent pipeline for the future, our graduate intake has increased by 91% since 2009. In the UK alone, in 2012, we received more than 7,000 applications for 244 places on our graduate programme. For our future leaders programme, which focuses on recruiting engineers with a second degree who have some work experience and are multilingual, we received more than 4,000 applications for 40 places.
Talent management We provide world-class education opportunities for our people, partnering with 19 academies and institutes that deliver technical learning and development. We encourage all employees to take at least five training days a year.
We use succession planning to help us deploy our people effectively and obtain a better understanding of the talent coming through. Every year the group chief executive reviews all senior succession plans, which are made across the company.
While formal reviews are undertaken annually, discussions regarding talent, development and promotions happen across BP throughout the year.
Exported expertise Our expatriate employees distribute critical skills across locations and help to develop and nurture talent in growing markets around the world. In 2012, there were more than 2,800 BP people on international assignments.
Our values
Safety
Respect
Excellence
Courage
One Team
To deliver sustained high performance, we recognize that we need to treat ‘how’ we do business as importantly as ‘what’ we do. Our values are a core part of the ‘how.’ We are working to bring them to life in our people’s day-to-day behaviour.
Our values were set out by BP’s leadership team in 2011 and are now being embedded into our group-wide systems and processes, including our recruitment, remuneration, promotion and development assessments.
We have a network of ‘change agents’ across the company who support team leaders in rolling out our values. These employees volunteer to act as advocates, encouraging their colleagues to talk about values through informal conversations, workshops and team meetings.
Our internal award programmes recognize employees who have displayed exceptional behaviour that reflects BP’s values. Our Helios awards recognize teams while Team BP recognizes individual employees. We also encourage other informal methods of embedding our values across the company.
Developing new leaders We offer leadership development programmes tailored for employees moving into management, including those directing complex functions within the company. By the end of 2012, these had been attended by employees from 74 countries in 10 different languages.
Throughout a BP employee’s career there are assessments for his or her recruitment into a senior level or group leader role. The purpose of these assessments is to provide a source of objective data that can help rate the capability of emerging leaders.
BP provides employees with opportunities for professional development that build leadership and technical capabilities.
9,800people recruited a year on average over the past four years.
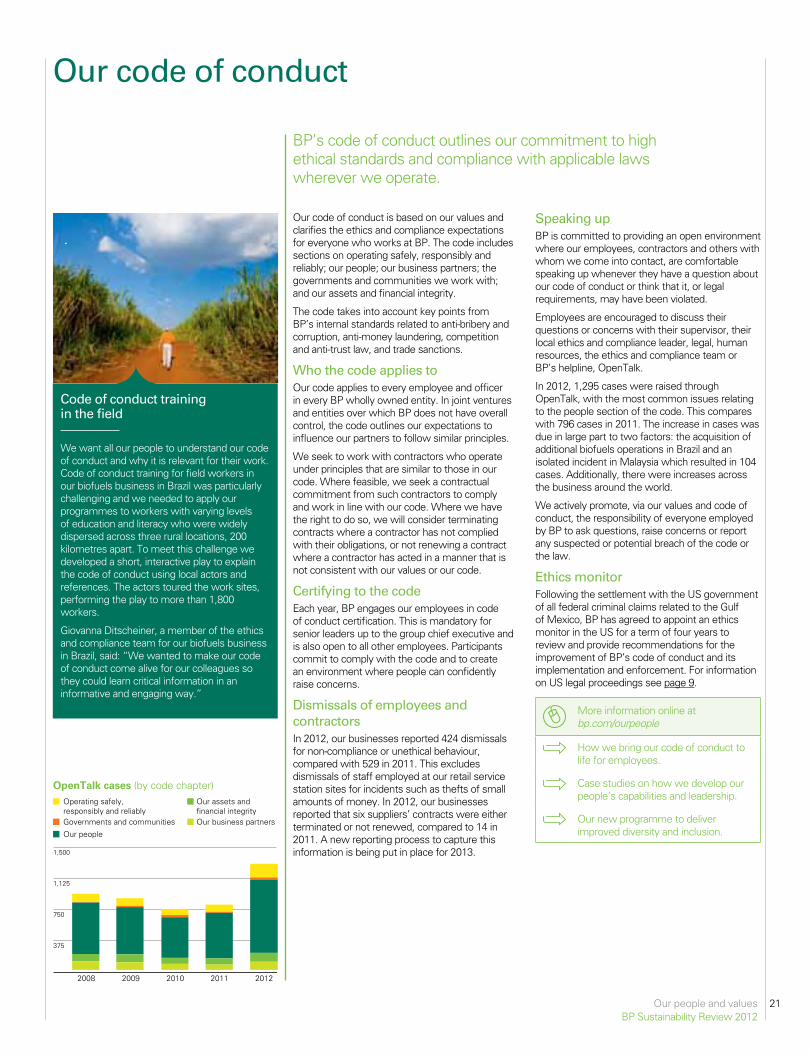
Our people and valuesBP Sustainability Review 2012
OpenTalk cases (by code chapter)
1,500
1,125
750
375
20122008 2009 2010 2011
Our assets and financial integrity
Governments and communities Our business partners
Operating safely, responsibly and reliably
Our people
21
BP’s code of conduct outlines our commitment to high ethical standards and compliance with applicable laws wherever we operate.
Our code of conduct
Our code of conduct is based on our values and clarifies the ethics and compliance expectations for everyone who works at BP. The code includes sections on operating safely, responsibly and reliably; our people; our business partners; the governments and communities we work with; and our assets and financial integrity.
The code takes into account key points from BP’s internal standards related to anti-bribery and corruption, anti-money laundering, competition and anti-trust law, and trade sanctions.
Who the code applies toOur code applies to every employee and officer in every BP wholly owned entity. In joint ventures and entities over which BP does not have overall control, the code outlines our expectations to influence our partners to follow similar principles.
We seek to work with contractors who operate under principles that are similar to those in our code. Where feasible, we seek a contractual commitment from such contractors to comply and work in line with our code. Where we have the right to do so, we will consider terminating contracts where a contractor has not complied with their obligations, or not renewing a contract where a contractor has acted in a manner that is not consistent with our values or our code.
Certifying to the codeEach year, BP engages our employees in code of conduct certification. This is mandatory for senior leaders up to the group chief executive and is also open to all other employees. Participants commit to comply with the code and to create an environment where people can confidently raise concerns.
Dismissals of employees and contractorsIn 2012, our businesses reported 424 dismissals for non-compliance or unethical behaviour, compared with 529 in 2011. This excludes dismissals of staff employed at our retail service station sites for incidents such as thefts of small amounts of money. In 2012, our businesses reported that six suppliers’ contracts were either terminated or not renewed, compared to 14 in 2011. A new reporting process to capture this information is being put in place for 2013.
Speaking up BP is committed to providing an open environment where our employees, contractors and others with whom we come into contact, are comfortable speaking up whenever they have a question about our code of conduct or think that it, or legal requirements, may have been violated.
Employees are encouraged to discuss their questions or concerns with their supervisor, their local ethics and compliance leader, legal, human resources, the ethics and compliance team or BP’s helpline, OpenTalk.
In 2012, 1,295 cases were raised through OpenTalk, with the most common issues relating to the people section of the code. This compares with 796 cases in 2011. The increase in cases was due in large part to two factors: the acquisition of additional biofuels operations in Brazil and an isolated incident in Malaysia which resulted in 104 cases. Additionally, there were increases across the business around the world.
We actively promote, via our values and code of conduct, the responsibility of everyone employed by BP to ask questions, raise concerns or report any suspected or potential breach of the code or the law.
Ethics monitorFollowing the settlement with the US government of all federal criminal claims related to the Gulf of Mexico, BP has agreed to appoint an ethics monitor in the US for a term of four years to review and provide recommendations for the improvement of BP’s code of conduct and its implementation and enforcement. For information on US legal proceedings see page 9.
More information online at bp.com/ourpeople
How we bring our code of conduct to life for employees.
Case studies on how we develop our people’s capabilities and leadership.
Our new programme to deliver improved diversity and inclusion.
Code of conduct training in the field
We want all our people to understand our code of conduct and why it is relevant for their work. Code of conduct training for field workers in our biofuels business in Brazil was particularly challenging and we needed to apply our programmes to workers with varying levels of education and literacy who were widely dispersed across three rural locations, 200 kilometres apart. To meet this challenge we developed a short, interactive play to explain the code of conduct using local actors and references. The actors toured the work sites, performing the play to more than 1,800 workers.
Giovanna Ditscheiner, a member of the ethics and compliance team for our biofuels business in Brazil, said: “We wanted to make our code of conduct come alive for our colleagues so they could learn critical information in an informative and engaging way.”
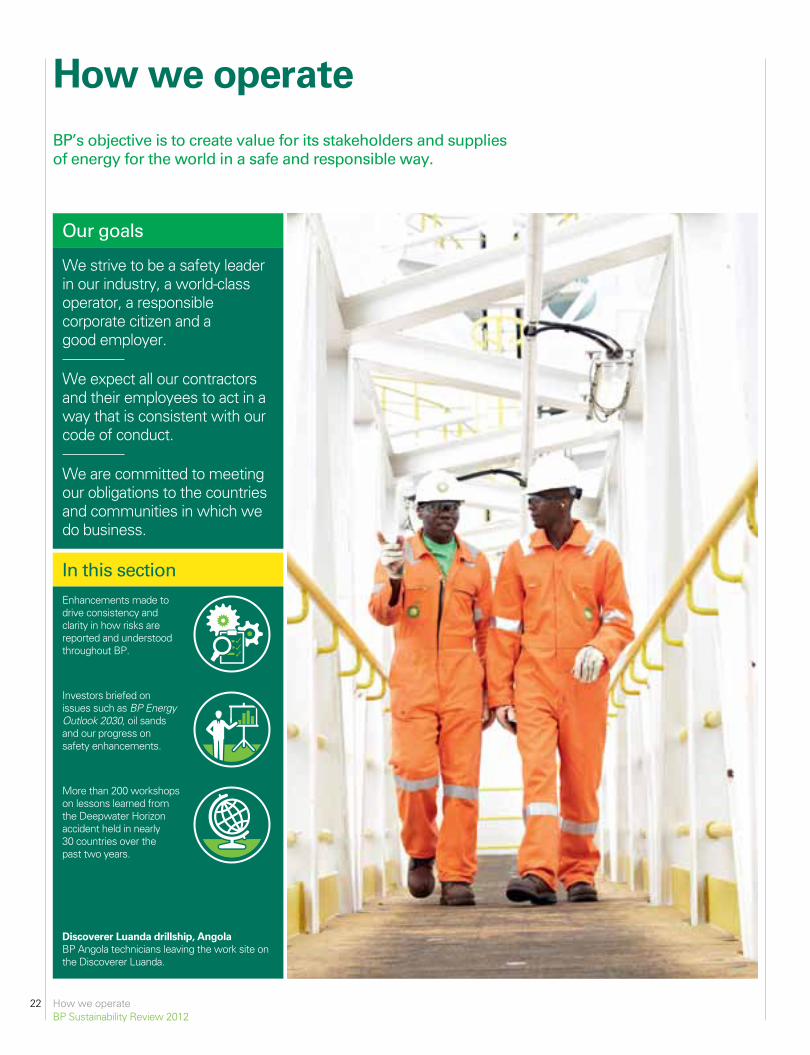
22 How we operateBP Sustainability Review 2012
BP’s objective is to create value for its stakeholders and supplies of energy for the world in a safe and responsible way.
How we operate
Our goals
We strive to be a safety leader in our industry, a world-class operator, a responsible corporate citizen and a good employer.
We expect all our contractors and their employees to act in a way that is consistent with our code of conduct.
We are committed to meeting our obligations to the countries and communities in which we do business.
In this sectionEnhancements made to drive consistency and clarity in how risks are reported and understood throughout BP.
Investors briefed on issues such as BP Energy Outlook 2030, oil sands and our progress on safety enhancements.
More than 200 workshops on lessons learned from the Deepwater Horizon accident held in nearly 30 countries over the past two years.
Discoverer Luanda drillship, AngolaBP Angola technicians leaving the work site on the Discoverer Luanda.
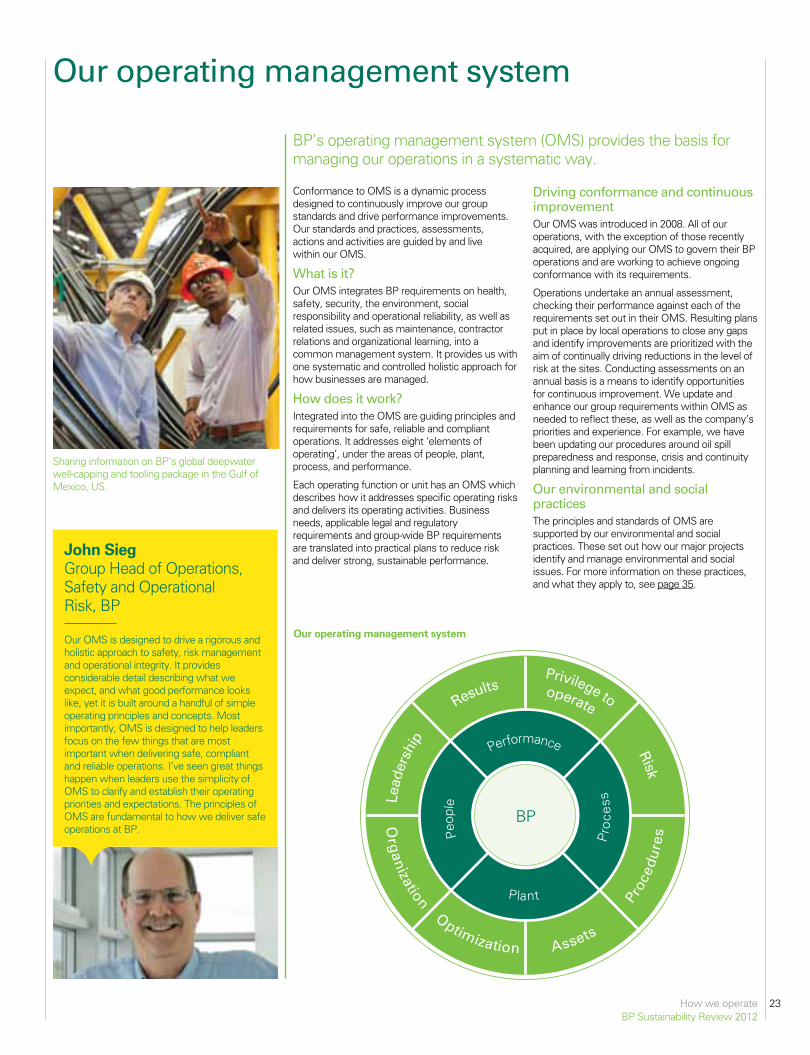
23How we operateBP Sustainability Review 2012
Optimization
Org
anization
Results
Lead
ersh
ip Risk
Proc
edu
res
Assets
Privilege to
BP
Performance
Peop
le
Plant
Pro
cess
operate
Conformance to OMS is a dynamic process designed to continuously improve our group standards and drive performance improvements. Our standards and practices, assessments, actions and activities are guided by and live within our OMS.
What is it?Our OMS integrates BP requirements on health, safety, security, the environment, social responsibility and operational reliability, as well as related issues, such as maintenance, contractor relations and organizational learning, into a common management system. It provides us with one systematic and controlled holistic approach for how businesses are managed.
How does it work? Integrated into the OMS are guiding principles and requirements for safe, reliable and compliant operations. It addresses eight ‘elements of operating’, under the areas of people, plant, process, and performance.
Each operating function or unit has an OMS which describes how it addresses specific operating risks and delivers its operating activities. Business needs, applicable legal and regulatory requirements and group-wide BP requirements are translated into practical plans to reduce risk and deliver strong, sustainable performance.
Driving conformance and continuous improvementOur OMS was introduced in 2008. All of our operations, with the exception of those recently acquired, are applying our OMS to govern their BP operations and are working to achieve ongoing conformance with its requirements.
Operations undertake an annual assessment, checking their performance against each of the requirements set out in their OMS. Resulting plans put in place by local operations to close any gaps and identify improvements are prioritized with the aim of continually driving reductions in the level of risk at the sites. Conducting assessments on an annual basis is a means to identify opportunities for continuous improvement. We update and enhance our group requirements within OMS as needed to reflect these, as well as the company’s priorities and experience. For example, we have been updating our procedures around oil spill preparedness and response, crisis and continuity planning and learning from incidents.
Our environmental and social practicesThe principles and standards of OMS are supported by our environmental and social practices. These set out how our major projects identify and manage environmental and social issues. For more information on these practices, and what they apply to, see page 35.
BP’s operating management system (OMS) provides the basis for managing our operations in a systematic way.
Our operating management system
Our operating management system
Sharing information on BP’s global deepwater well-capping and tooling package in the Gulf of Mexico, US.
John Sieg Group Head of Operations, Safety and Operational Risk, BP
Our OMS is designed to drive a rigorous and holistic approach to safety, risk management and operational integrity. It provides considerable detail describing what we expect, and what good performance looks like, yet it is built around a handful of simple operating principles and concepts. Most importantly, OMS is designed to help leaders focus on the few things that are most important when delivering safe, compliant and reliable operations. I’ve seen great things happen when leaders use the simplicity of OMS to clarify and establish their operating priorities and expectations. The principles of OMS are fundamental to how we deliver safe operations at BP.

24 How we operateBP Sustainability Review 2012
BP’s management of sustainability risks and issues
Extern
al stakeho
lders
BP board
Direction and oversight of BP on behalf of the shareholders for all aspects of BP’s business. Comprised of the chairman, four executive and 10 non-executive directors.
Safety, ethics and environment assurance committee Gulf of Mexico committee
Reviews BP’s processes to identify and mitigate significant non-financial risks and receives assurances that they are appropriate in design and effective in implementation.
Oversees the Gulf Coast Restoration Organization and various other matters related to the Deepwater Horizon incident.
Executive team
Supports the group chief executive in his accountability to the board for BP’s overall business, including sustainability performance. Comprised of the group chief executive and the heads of businesses and certain functions including safety and operational risk.
Group operations risk committee Group ethics and compliance committee Group people committee
Reviews company safety and risk management.
Provides information and assurance on the ethics and compliance programme.
Has overall responsibility for policy decisions relating to employees.
Group functions Local operations
Functions, such as safety and operational risk, define and support implementation of group-wide standards.
Specialists and line management identify risks and implement our group-wide operating management system and other standards.
Managing risk from operations to the boardOur risk management system focuses on three levels of activity:
• Day-to-day risk identification and management occurs in the group’s operations and functions, with the approach varying according to the types of risks faced. The aim is to address each different type of risk as well as we can – promoting safe, compliant and reliable operations.
• Periodic review of risks and risk management plans happens at the business and functional levels. Risk management activities are assessed and any further improvements are planned.
• Oversight and governance occurs at board, executive and function levels to help foster effective group-wide oversight, business planning and resource allocation, intervention and knowledge sharing.
In 2012, we formed a new group risk team to hold a view of the group’s risks, coordinate reporting activities of these risks, and maintain BP’s overarching risk management system.
For risk factors that could have an adverse effect on our business see BP Annual Report and Form 20-F 2012 at bp.com/annualreport
The boardBP’s board governance principles delegate management authority to the group chief executive within defined limits. These include a requirement that the group chief executive will not engage in any activity without regard to health, safety and environmental consequence.
The board reviews key group risks and how they are managed as part of its planning process. On 1 January 2013 the board was composed of the chairman, four executive directors and 10 non-executive directors. BP recognizes the importance of diversity, including gender, at all levels of the company, including the board.
The board delegates some of its oversight and monitoring activities to its six committees, composed entirely of non-executive directors.
Safety, ethics and environment assurance committee The safety, ethics and environment assurance committee (SEEAC) monitors the management of non-financial risk.
In 2012, the committee received specific reports on the company’s management of risks in shipping, wells, pipelines, explosion or release at facilities containing hydrocarbons, contractor management and non-operated joint ventures.
The committee reviewed these risks, and their management and mitigation, in detail with the relevant executive management.
BP’s risk management system is designed to help ensure that risks are identified, understood and managed so that we can deliver safe and strong operations.
Corporate governance and risk management
Paul Anderson (second from left), chair of the safety, ethics and environment assurance committee, and BP Chairman Carl-Henric Svanberg (second from right) on a board visit to BP’s North America Gas operations in east Texas, US.
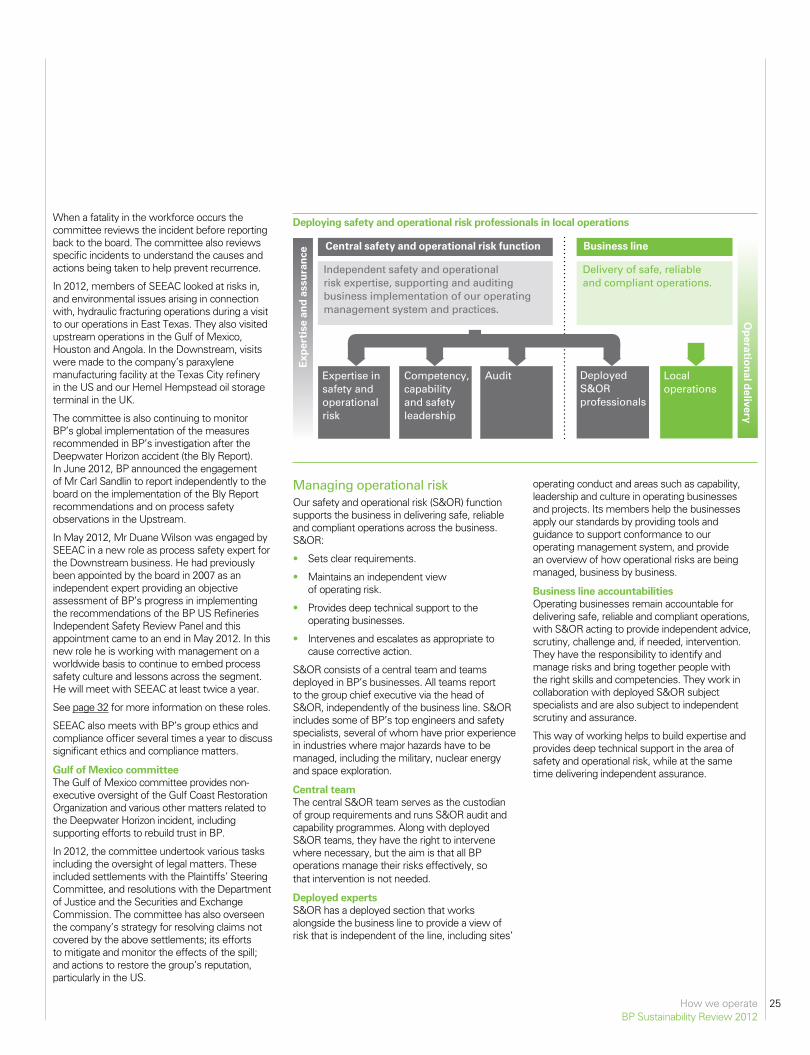
25How we operateBP Sustainability Review 2012
Deploying safety and operational risk professionals in local operations
Expertise in safety and operational risk
Competency, capability and safety leadership
Audit Deployed S&OR professionals
Local operations
Exp
erti
se a
nd
assu
ran
ce
Op
eration
al delivery
Central safety and operational risk function Business line
Independent safety and operational risk expertise, supporting and auditing business implementation of our operating management system and practices.
Delivery of safe, reliable and compliant operations.
When a fatality in the workforce occurs the committee reviews the incident before reporting back to the board. The committee also reviews specific incidents to understand the causes and actions being taken to help prevent recurrence.
In 2012, members of SEEAC looked at risks in, and environmental issues arising in connection with, hydraulic fracturing operations during a visit to our operations in East Texas. They also visited upstream operations in the Gulf of Mexico, Houston and Angola. In the Downstream, visits were made to the company’s paraxylene manufacturing facility at the Texas City refinery in the US and our Hemel Hempstead oil storage terminal in the UK.
The committee is also continuing to monitor BP’s global implementation of the measures recommended in BP’s investigation after the Deepwater Horizon accident (the Bly Report). In June 2012, BP announced the engagement of Mr Carl Sandlin to report independently to the board on the implementation of the Bly Report recommendations and on process safety observations in the Upstream.
In May 2012, Mr Duane Wilson was engaged by SEEAC in a new role as process safety expert for the Downstream business. He had previously been appointed by the board in 2007 as an independent expert providing an objective assessment of BP’s progress in implementing the recommendations of the BP US Refineries Independent Safety Review Panel and this appointment came to an end in May 2012. In this new role he is working with management on a worldwide basis to continue to embed process safety culture and lessons across the segment. He will meet with SEEAC at least twice a year.
See page 32 for more information on these roles.
SEEAC also meets with BP’s group ethics and compliance officer several times a year to discuss significant ethics and compliance matters.
Gulf of Mexico committee The Gulf of Mexico committee provides non-executive oversight of the Gulf Coast Restoration Organization and various other matters related to the Deepwater Horizon incident, including supporting efforts to rebuild trust in BP.
In 2012, the committee undertook various tasks including the oversight of legal matters. These included settlements with the Plaintiffs’ Steering Committee, and resolutions with the Department of Justice and the Securities and Exchange Commission. The committee has also overseen the company’s strategy for resolving claims not covered by the above settlements; its efforts to mitigate and monitor the effects of the spill; and actions to restore the group’s reputation, particularly in the US.
Managing operational risk Our safety and operational risk (S&OR) function supports the business in delivering safe, reliable and compliant operations across the business. S&OR:
• Sets clear requirements.
• Maintains an independent view of operating risk.
• Provides deep technical support to the operating businesses.
• Intervenes and escalates as appropriate to cause corrective action.
S&OR consists of a central team and teams deployed in BP’s businesses. All teams report to the group chief executive via the head of S&OR, independently of the business line. S&OR includes some of BP’s top engineers and safety specialists, several of whom have prior experience in industries where major hazards have to be managed, including the military, nuclear energy and space exploration.
Central teamThe central S&OR team serves as the custodian of group requirements and runs S&OR audit and capability programmes. Along with deployed S&OR teams, they have the right to intervene where necessary, but the aim is that all BP operations manage their risks effectively, so that intervention is not needed.
Deployed experts S&OR has a deployed section that works alongside the business line to provide a view of risk that is independent of the line, including sites’
operating conduct and areas such as capability, leadership and culture in operating businesses and projects. Its members help the businesses apply our standards by providing tools and guidance to support conformance to our operating management system, and provide an overview of how operational risks are being managed, business by business.
Business line accountabilitiesOperating businesses remain accountable for delivering safe, reliable and compliant operations, with S&OR acting to provide independent advice, scrutiny, challenge and, if needed, intervention. They have the responsibility to identify and manage risks and bring together people with the right skills and competencies. They work in collaboration with deployed S&OR subject specialists and are also subject to independent scrutiny and assurance.
This way of working helps to build expertise and provides deep technical support in the area of safety and operational risk, while at the same time delivering independent assurance.
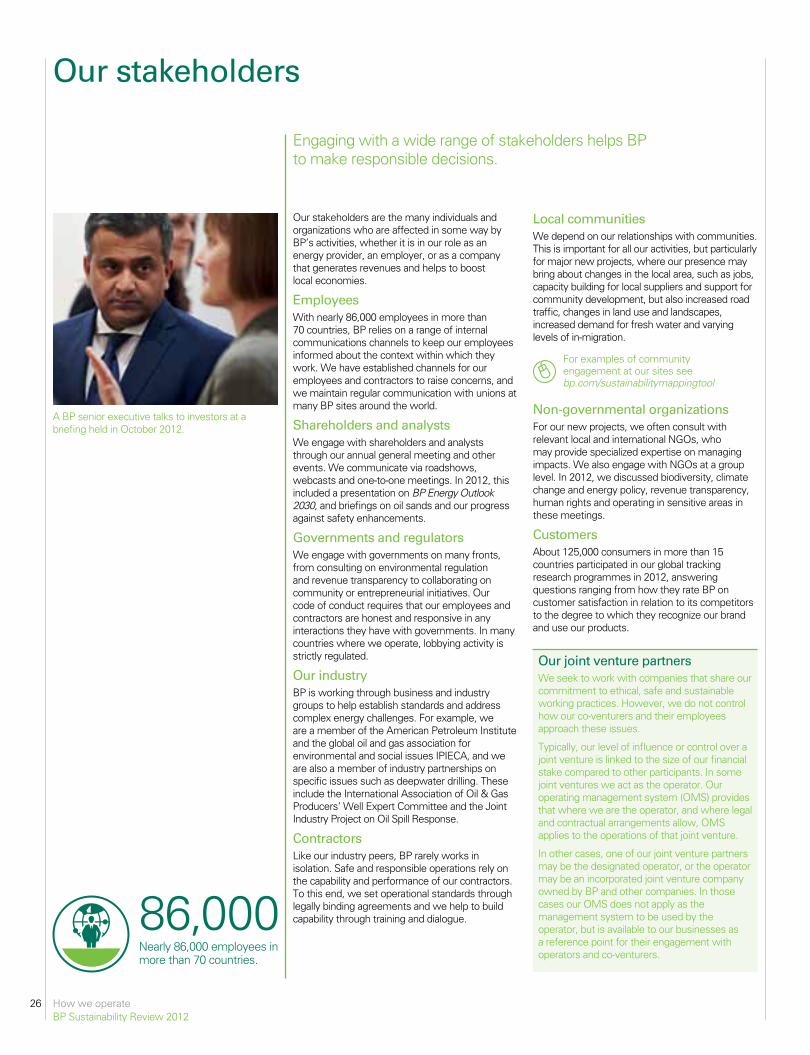
26 How we operateBP Sustainability Review 2012
Our stakeholders are the many individuals and organizations who are affected in some way by BP’s activities, whether it is in our role as an energy provider, an employer, or as a company that generates revenues and helps to boost local economies.
EmployeesWith nearly 86,000 employees in more than 70 countries, BP relies on a range of internal communications channels to keep our employees informed about the context within which they work. We have established channels for our employees and contractors to raise concerns, and we maintain regular communication with unions at many BP sites around the world.
Shareholders and analystsWe engage with shareholders and analysts through our annual general meeting and other events. We communicate via roadshows, webcasts and one-to-one meetings. In 2012, this included a presentation on BP Energy Outlook 2030, and briefings on oil sands and our progress against safety enhancements.
Governments and regulatorsWe engage with governments on many fronts, from consulting on environmental regulation and revenue transparency to collaborating on community or entrepreneurial initiatives. Our code of conduct requires that our employees and contractors are honest and responsive in any interactions they have with governments. In many countries where we operate, lobbying activity is strictly regulated.
Our industryBP is working through business and industry groups to help establish standards and address complex energy challenges. For example, we are a member of the American Petroleum Institute and the global oil and gas association for environmental and social issues IPIECA, and we are also a member of industry partnerships on specific issues such as deepwater drilling. These include the International Association of Oil & Gas Producers’ Well Expert Committee and the Joint Industry Project on Oil Spill Response.
Contractors Like our industry peers, BP rarely works in isolation. Safe and responsible operations rely on the capability and performance of our contractors. To this end, we set operational standards through legally binding agreements and we help to build capability through training and dialogue.
Engaging with a wide range of stakeholders helps BP to make responsible decisions.
Our stakeholders
86,000Nearly 86,000 employees in more than 70 countries.
A BP senior executive talks to investors at a briefing held in October 2012.
Local communitiesWe depend on our relationships with communities. This is important for all our activities, but particularly for major new projects, where our presence may bring about changes in the local area, such as jobs, capacity building for local suppliers and support for community development, but also increased road traffic, changes in land use and landscapes, increased demand for fresh water and varying levels of in-migration.
For examples of community engagement at our sites see bp.com/sustainabilitymappingtool
Non-governmental organizationsFor our new projects, we often consult with relevant local and international NGOs, who may provide specialized expertise on managing impacts. We also engage with NGOs at a group level. In 2012, we discussed biodiversity, climate change and energy policy, revenue transparency, human rights and operating in sensitive areas in these meetings.
CustomersAbout 125,000 consumers in more than 15 countries participated in our global tracking research programmes in 2012, answering questions ranging from how they rate BP on customer satisfaction in relation to its competitors to the degree to which they recognize our brand and use our products.
Our joint venture partnersWe seek to work with companies that share our commitment to ethical, safe and sustainable working practices. However, we do not control how our co-venturers and their employees approach these issues.
Typically, our level of influence or control over a joint venture is linked to the size of our financial stake compared to other participants. In some joint ventures we act as the operator. Our operating management system (OMS) provides that where we are the operator, and where legal and contractual arrangements allow, OMS applies to the operations of that joint venture.
In other cases, one of our joint venture partners may be the designated operator, or the operator may be an incorporated joint venture company owned by BP and other companies. In those cases our OMS does not apply as the management system to be used by the operator, but is available to our businesses as a reference point for their engagement with operators and co-venturers.
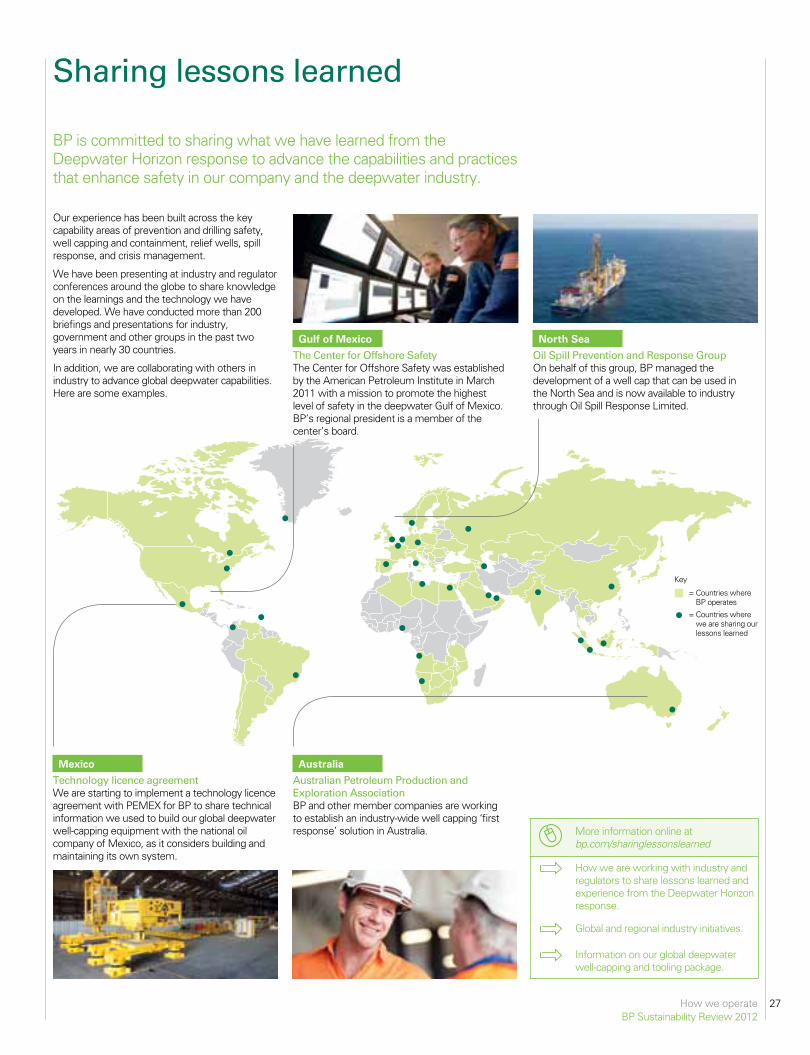
27How we operateBP Sustainability Review 2012
Sharing lessons learned
= Countries where BP operates
= Countries where we are sharing our lessons learned
Key
BP is committed to sharing what we have learned from the Deepwater Horizon response to advance the capabilities and practices that enhance safety in our company and the deepwater industry.
More information online at bp.com/sharinglessonslearned
How we are working with industry and regulators to share lessons learned and experience from the Deepwater Horizon response.
Global and regional industry initiatives.
Information on our global deepwater well-capping and tooling package.
Our experience has been built across the key capability areas of prevention and drilling safety, well capping and containment, relief wells, spill response, and crisis management.
We have been presenting at industry and regulator conferences around the globe to share knowledge on the learnings and the technology we have developed. We have conducted more than 200 briefings and presentations for industry, government and other groups in the past two years in nearly 30 countries.
In addition, we are collaborating with others in industry to advance global deepwater capabilities. Here are some examples.
Mexico
Technology licence agreement We are starting to implement a technology licence agreement with PEMEX for BP to share technical information we used to build our global deepwater well-capping equipment with the national oil company of Mexico, as it considers building and maintaining its own system.
Australia
Australian Petroleum Production and Exploration Association BP and other member companies are working to establish an industry-wide well capping ‘first response’ solution in Australia.
Gulf of Mexico
The Center for Offshore Safety The Center for Offshore Safety was established by the American Petroleum Institute in March 2011 with a mission to promote the highest level of safety in the deepwater Gulf of Mexico. BP’s regional president is a member of the center’s board.
North Sea
Oil Spill Prevention and Response Group On behalf of this group, BP managed the development of a well cap that can be used in the North Sea and is now available to industry through Oil Spill Response Limited.
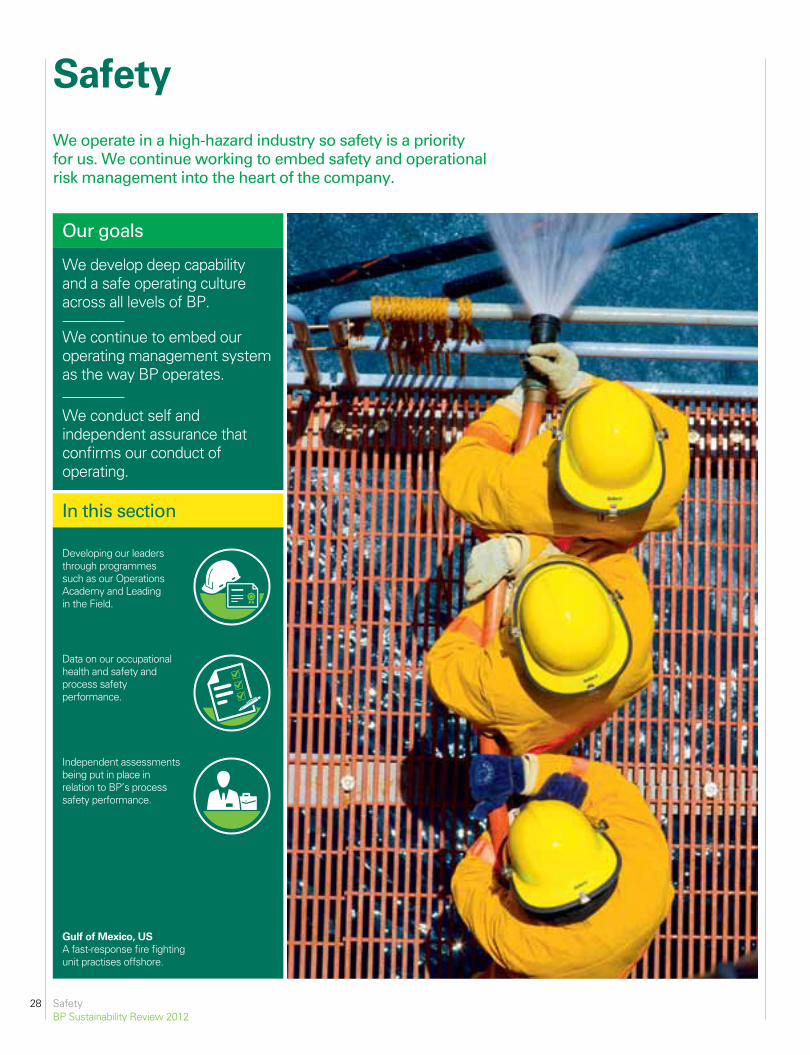
SafetyBP Sustainability Review 2012
28
We operate in a high-hazard industry so safety is a priority for us. We continue working to embed safety and operational risk management into the heart of the company.
Our goals
We develop deep capability and a safe operating culture across all levels of BP.
We continue to embed our operating management system as the way BP operates.
We conduct self and independent assurance that confirms our conduct of operating.
In this section
Developing our leaders through programmes such as our Operations Academy and Leading in the Field.
Data on our occupational health and safety and process safety performance.
Independent assessments being put in place in relation to BP’s process safety performance.
Gulf of Mexico, USA fast-response fire fighting unit practises offshore.
Safety
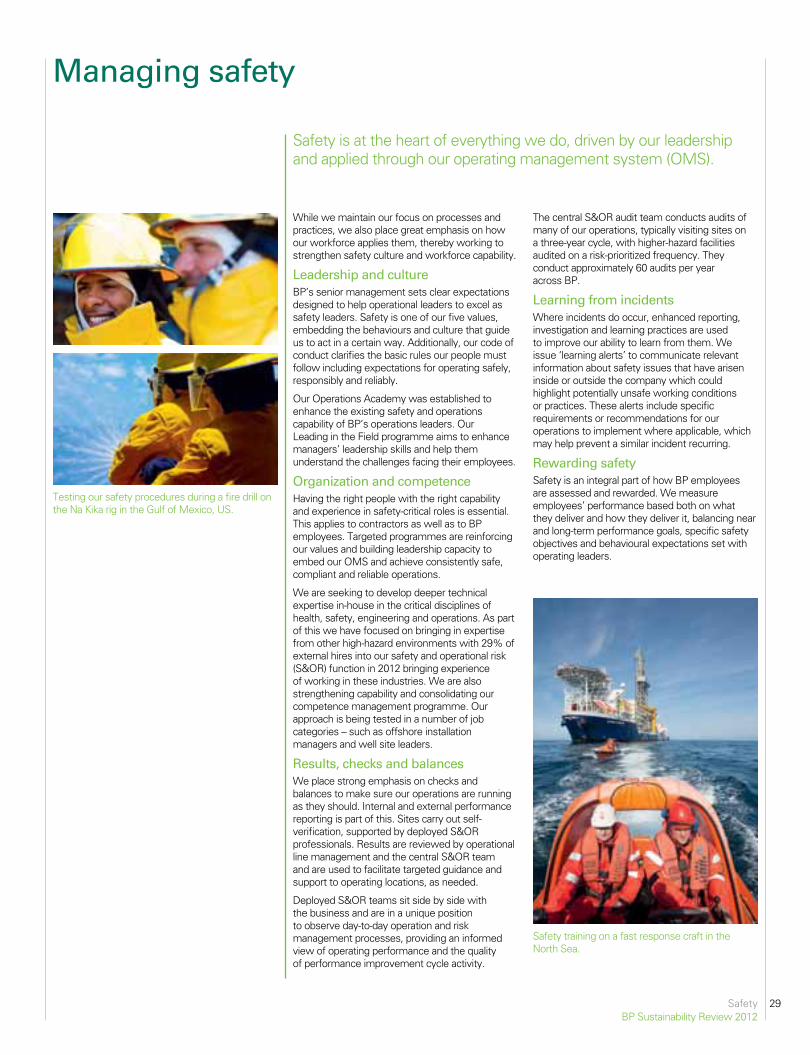
29SafetyBP Sustainability Review 2012
While we maintain our focus on processes and practices, we also place great emphasis on how our workforce applies them, thereby working to strengthen safety culture and workforce capability.
Leadership and cultureBP’s senior management sets clear expectations designed to help operational leaders to excel as safety leaders. Safety is one of our five values, embedding the behaviours and culture that guide us to act in a certain way. Additionally, our code of conduct clarifies the basic rules our people must follow including expectations for operating safely, responsibly and reliably.
Our Operations Academy was established to enhance the existing safety and operations capability of BP’s operations leaders. Our Leading in the Field programme aims to enhance managers’ leadership skills and help them understand the challenges facing their employees.
Organization and competenceHaving the right people with the right capability and experience in safety-critical roles is essential. This applies to contractors as well as to BP employees. Targeted programmes are reinforcing our values and building leadership capacity to embed our OMS and achieve consistently safe, compliant and reliable operations.
We are seeking to develop deeper technical expertise in-house in the critical disciplines of health, safety, engineering and operations. As part of this we have focused on bringing in expertise from other high-hazard environments with 29% of external hires into our safety and operational risk (S&OR) function in 2012 bringing experience of working in these industries. We are also strengthening capability and consolidating our competence management programme. Our approach is being tested in a number of job categories – such as offshore installation managers and well site leaders.
Results, checks and balancesWe place strong emphasis on checks and balances to make sure our operations are running as they should. Internal and external performance reporting is part of this. Sites carry out self-verification, supported by deployed S&OR professionals. Results are reviewed by operational line management and the central S&OR team and are used to facilitate targeted guidance and support to operating locations, as needed.
Deployed S&OR teams sit side by side with the business and are in a unique position to observe day-to-day operation and risk management processes, providing an informed view of operating performance and the quality of performance improvement cycle activity.
The central S&OR audit team conducts audits of many of our operations, typically visiting sites on a three-year cycle, with higher-hazard facilities audited on a risk-prioritized frequency. They conduct approximately 60 audits per year across BP.
Learning from incidentsWhere incidents do occur, enhanced reporting, investigation and learning practices are used to improve our ability to learn from them. We issue ‘learning alerts’ to communicate relevant information about safety issues that have arisen inside or outside the company which could highlight potentially unsafe working conditions or practices. These alerts include specific requirements or recommendations for our operations to implement where applicable, which may help prevent a similar incident recurring.
Rewarding safetySafety is an integral part of how BP employees are assessed and rewarded. We measure employees’ performance based both on what they deliver and how they deliver it, balancing near and long-term performance goals, specific safety objectives and behavioural expectations set with operating leaders.
Safety is at the heart of everything we do, driven by our leadership and applied through our operating management system (OMS).
Safety training on a fast response craft in the North Sea.
Testing our safety procedures during a fire drill on the Na Kika rig in the Gulf of Mexico, US.
Managing safety
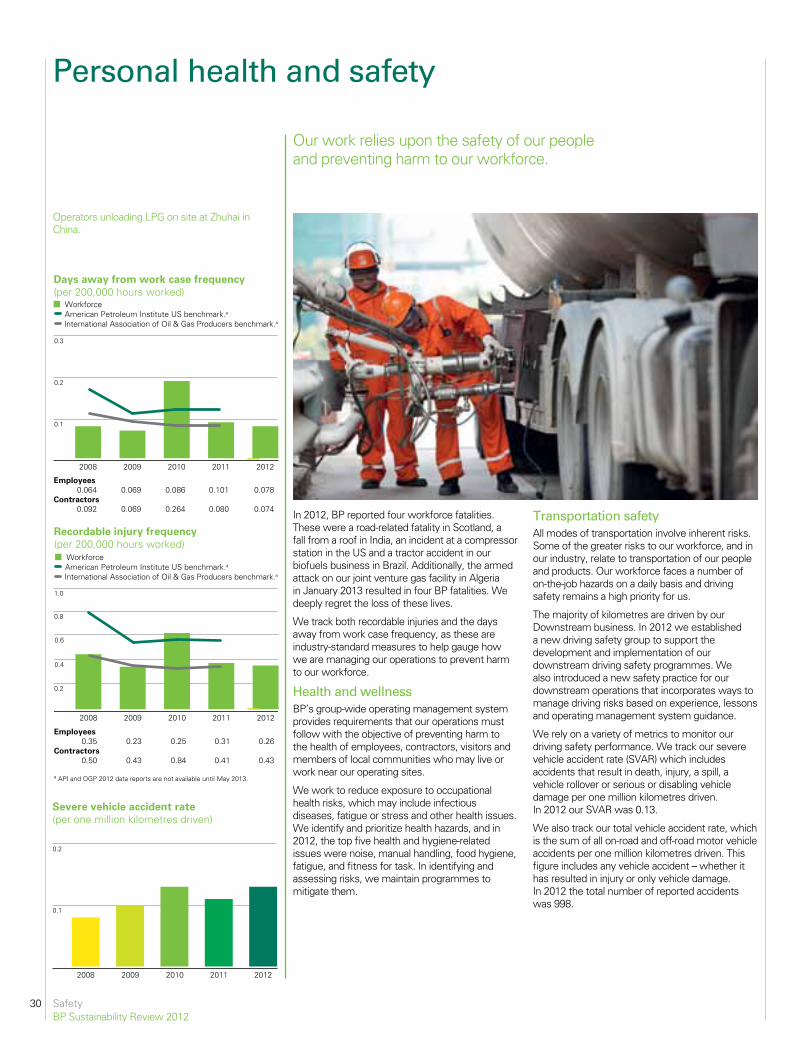
30 SafetyBP Sustainability Review 2012
Severe vehicle accident rate(per one million kilometres driven)
0.2
20122008 2009 2010 2011
0.1
1.0
0.8
0.2
0.6
0.4
Recordable injury frequency(per 200,000 hours worked)
20122008 2009
a API and OGP 2012 data reports are not available until May 2013.
2010 2011
Employees 0.35 0.23 0.25 0.31 0.26Contractors 0.50 0.43 0.84 0.41 0.43
WorkforceAmerican Petroleum Institute US benchmark. a
International Association of Oil & Gas Producers benchmark. a
Days away from work case frequency(per 200,000 hours worked)
0.3
0.2
0.1
20122008 2009 2010 2011
Employees 0.064 0.069 0.086 0.101 0.078Contractors 0.092 0.069 0.264 0.080 0.074
WorkforceAmerican Petroleum Institute US benchmark. a
International Association of Oil & Gas Producers benchmark. a
In 2012, BP reported four workforce fatalities. These were a road-related fatality in Scotland, a fall from a roof in India, an incident at a compressor station in the US and a tractor accident in our biofuels business in Brazil. Additionally, the armed attack on our joint venture gas facility in Algeria in January 2013 resulted in four BP fatalities. We deeply regret the loss of these lives.
We track both recordable injuries and the days away from work case frequency, as these are industry-standard measures to help gauge how we are managing our operations to prevent harm to our workforce.
Health and wellnessBP’s group-wide operating management system provides requirements that our operations must follow with the objective of preventing harm to the health of employees, contractors, visitors and members of local communities who may live or work near our operating sites.
We work to reduce exposure to occupational health risks, which may include infectious diseases, fatigue or stress and other health issues. We identify and prioritize health hazards, and in 2012, the top five health and hygiene-related issues were noise, manual handling, food hygiene, fatigue, and fitness for task. In identifying and assessing risks, we maintain programmes to mitigate them.
Transportation safetyAll modes of transportation involve inherent risks. Some of the greater risks to our workforce, and in our industry, relate to transportation of our people and products. Our workforce faces a number of on-the-job hazards on a daily basis and driving safety remains a high priority for us.
The majority of kilometres are driven by our Downstream business. In 2012 we established a new driving safety group to support the development and implementation of our downstream driving safety programmes. We also introduced a new safety practice for our downstream operations that incorporates ways to manage driving risks based on experience, lessons and operating management system guidance.
We rely on a variety of metrics to monitor our driving safety performance. We track our severe vehicle accident rate (SVAR) which includes accidents that result in death, injury, a spill, a vehicle rollover or serious or disabling vehicle damage per one million kilometres driven. In 2012 our SVAR was 0.13.
We also track our total vehicle accident rate, which is the sum of all on-road and off-road motor vehicle accidents per one million kilometres driven. This figure includes any vehicle accident – whether it has resulted in injury or only vehicle damage. In 2012 the total number of reported accidents was 998.
Our work relies upon the safety of our people and preventing harm to our workforce.
Operators unloading LPG on site at Zhuhai in China.
Personal health and safety
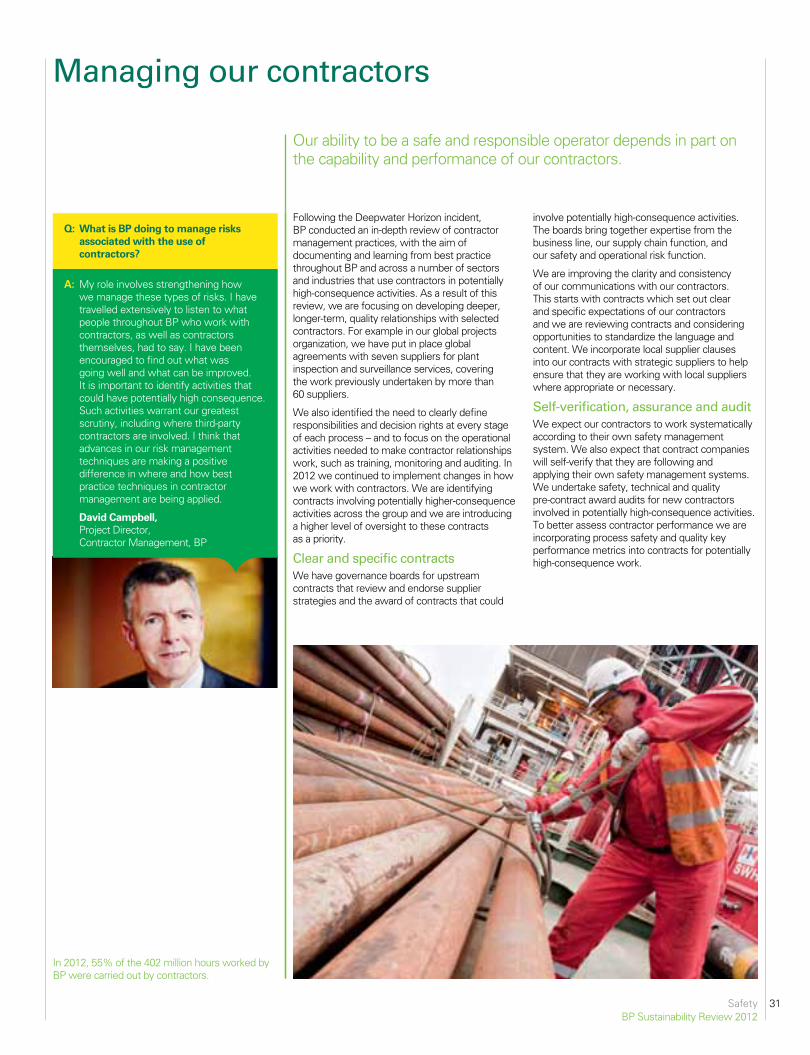
31SafetyBP Sustainability Review 2012
Following the Deepwater Horizon incident, BP conducted an in-depth review of contractor management practices, with the aim of documenting and learning from best practice throughout BP and across a number of sectors and industries that use contractors in potentially high-consequence activities. As a result of this review, we are focusing on developing deeper, longer-term, quality relationships with selected contractors. For example in our global projects organization, we have put in place global agreements with seven suppliers for plant inspection and surveillance services, covering the work previously undertaken by more than 60 suppliers.
We also identified the need to clearly define responsibilities and decision rights at every stage of each process – and to focus on the operational activities needed to make contractor relationships work, such as training, monitoring and auditing. In 2012 we continued to implement changes in how we work with contractors. We are identifying contracts involving potentially higher-consequence activities across the group and we are introducing a higher level of oversight to these contracts as a priority.
Clear and specific contractsWe have governance boards for upstream contracts that review and endorse supplier strategies and the award of contracts that could
involve potentially high-consequence activities. The boards bring together expertise from the business line, our supply chain function, and our safety and operational risk function.
We are improving the clarity and consistency of our communications with our contractors. This starts with contracts which set out clear and specific expectations of our contractors and we are reviewing contracts and considering opportunities to standardize the language and content. We incorporate local supplier clauses into our contracts with strategic suppliers to help ensure that they are working with local suppliers where appropriate or necessary.
Self-verification, assurance and auditWe expect our contractors to work systematically according to their own safety management system. We also expect that contract companies will self-verify that they are following and applying their own safety management systems. We undertake safety, technical and quality pre-contract award audits for new contractors involved in potentially high-consequence activities. To better assess contractor performance we are incorporating process safety and quality key performance metrics into contracts for potentially high-consequence work.
A: My role involves strengthening how we manage these types of risks. I have travelled extensively to listen to what people throughout BP who work with contractors, as well as contractors themselves, had to say. I have been encouraged to find out what was going well and what can be improved. It is important to identify activities that could have potentially high consequence. Such activities warrant our greatest scrutiny, including where third-party contractors are involved. I think that advances in our risk management techniques are making a positive difference in where and how best practice techniques in contractor management are being applied.
David Campbell, Project Director, Contractor Management, BP
Q: What is BP doing to manage risks associated with the use of contractors?
Our ability to be a safe and responsible operator depends in part on the capability and performance of our contractors.
In 2012, 55% of the 402 million hours worked by BP were carried out by contractors.
Managing our contractors
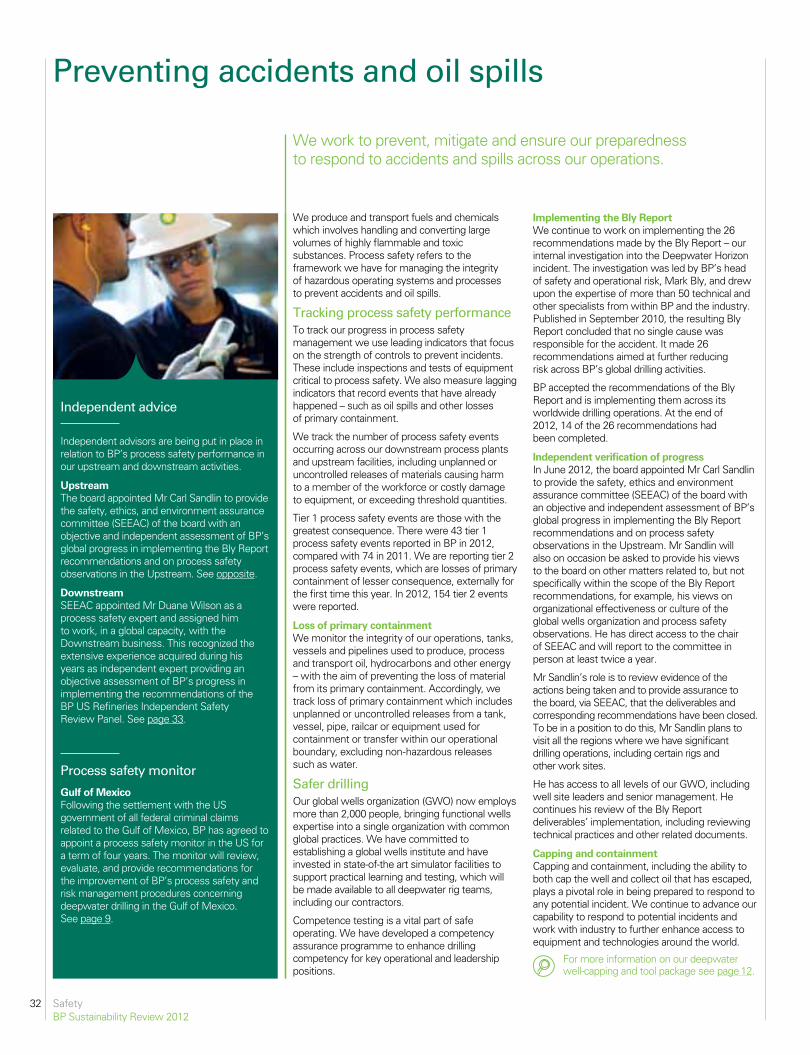
32 SafetyBP Sustainability Review 2012
We produce and transport fuels and chemicals which involves handling and converting large volumes of highly flammable and toxic substances. Process safety refers to the framework we have for managing the integrity of hazardous operating systems and processes to prevent accidents and oil spills.
Tracking process safety performanceTo track our progress in process safety management we use leading indicators that focus on the strength of controls to prevent incidents. These include inspections and tests of equipment critical to process safety. We also measure lagging indicators that record events that have already happened – such as oil spills and other losses of primary containment.
We track the number of process safety events occurring across our downstream process plants and upstream facilities, including unplanned or uncontrolled releases of materials causing harm to a member of the workforce or costly damage to equipment, or exceeding threshold quantities.
Tier 1 process safety events are those with the greatest consequence. There were 43 tier 1 process safety events reported in BP in 2012, compared with 74 in 2011. We are reporting tier 2 process safety events, which are losses of primary containment of lesser consequence, externally for the first time this year. In 2012, 154 tier 2 events were reported.
Loss of primary containment We monitor the integrity of our operations, tanks, vessels and pipelines used to produce, process and transport oil, hydrocarbons and other energy – with the aim of preventing the loss of material from its primary containment. Accordingly, we track loss of primary containment which includes unplanned or uncontrolled releases from a tank, vessel, pipe, railcar or equipment used for containment or transfer within our operational boundary, excluding non-hazardous releases such as water.
Safer drillingOur global wells organization (GWO) now employs more than 2,000 people, bringing functional wells expertise into a single organization with common global practices. We have committed to establishing a global wells institute and have invested in state-of-the art simulator facilities to support practical learning and testing, which will be made available to all deepwater rig teams, including our contractors.
Competence testing is a vital part of safe operating. We have developed a competency assurance programme to enhance drilling competency for key operational and leadership positions.
We work to prevent, mitigate and ensure our preparedness to respond to accidents and spills across our operations.
Preventing accidents and oil spills
Independent advice
Independent advisors are being put in place in relation to BP’s process safety performance in our upstream and downstream activities.
UpstreamThe board appointed Mr Carl Sandlin to provide the safety, ethics, and environment assurance committee (SEEAC) of the board with an objective and independent assessment of BP’s global progress in implementing the Bly Report recommendations and on process safety observations in the Upstream. See opposite.
DownstreamSEEAC appointed Mr Duane Wilson as a process safety expert and assigned him to work, in a global capacity, with the Downstream business. This recognized the extensive experience acquired during his years as independent expert providing an objective assessment of BP’s progress in implementing the recommendations of the BP US Refineries Independent Safety Review Panel. See page 33.
Process safety monitor
Gulf of MexicoFollowing the settlement with the US government of all federal criminal claims related to the Gulf of Mexico, BP has agreed to appoint a process safety monitor in the US for a term of four years. The monitor will review, evaluate, and provide recommendations for the improvement of BP’s process safety and risk management procedures concerning deepwater drilling in the Gulf of Mexico. See page 9.
Implementing the Bly ReportWe continue to work on implementing the 26 recommendations made by the Bly Report – our internal investigation into the Deepwater Horizon incident. The investigation was led by BP’s head of safety and operational risk, Mark Bly, and drew upon the expertise of more than 50 technical and other specialists from within BP and the industry. Published in September 2010, the resulting Bly Report concluded that no single cause was responsible for the accident. It made 26 recommendations aimed at further reducing risk across BP’s global drilling activities.
BP accepted the recommendations of the Bly Report and is implementing them across its worldwide drilling operations. At the end of 2012, 14 of the 26 recommendations had been completed.
Independent verification of progressIn June 2012, the board appointed Mr Carl Sandlin to provide the safety, ethics and environment assurance committee (SEEAC) of the board with an objective and independent assessment of BP’s global progress in implementing the Bly Report recommendations and on process safety observations in the Upstream. Mr Sandlin will also on occasion be asked to provide his views to the board on other matters related to, but not specifically within the scope of the Bly Report recommendations, for example, his views on organizational effectiveness or culture of the global wells organization and process safety observations. He has direct access to the chair of SEEAC and will report to the committee in person at least twice a year.
Mr Sandlin’s role is to review evidence of the actions being taken and to provide assurance to the board, via SEEAC, that the deliverables and corresponding recommendations have been closed. To be in a position to do this, Mr Sandlin plans to visit all the regions where we have significant drilling operations, including certain rigs and other work sites.
He has access to all levels of our GWO, including well site leaders and senior management. He continues his review of the Bly Report deliverables’ implementation, including reviewing technical practices and other related documents.
Capping and containmentCapping and containment, including the ability to both cap the well and collect oil that has escaped, plays a pivotal role in being prepared to respond to any potential incident. We continue to advance our capability to respond to potential incidents and work with industry to further enhance access to equipment and technologies around the world.
For more information on our deepwater well-capping and tool package see page 12.
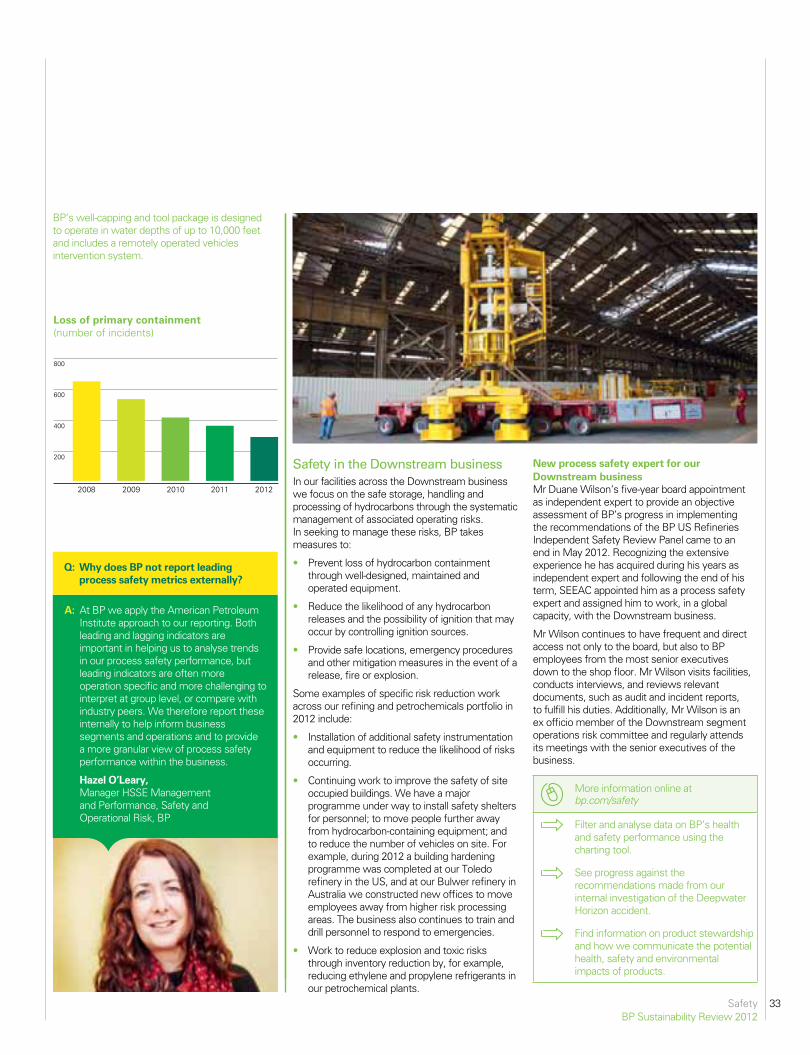
33SafetyBP Sustainability Review 2012
Loss of primary containment(number of incidents)
800
400
200
20122008 2009 2010 2011
600
Safety in the Downstream businessIn our facilities across the Downstream business we focus on the safe storage, handling and processing of hydrocarbons through the systematic management of associated operating risks. In seeking to manage these risks, BP takes measures to:
• Prevent loss of hydrocarbon containment through well-designed, maintained and operated equipment.
• Reduce the likelihood of any hydrocarbon releases and the possibility of ignition that may occur by controlling ignition sources.
• Provide safe locations, emergency procedures and other mitigation measures in the event of a release, fire or explosion.
Some examples of specific risk reduction work across our refining and petrochemicals portfolio in 2012 include:
• Installation of additional safety instrumentation and equipment to reduce the likelihood of risks occurring.
• Continuing work to improve the safety of site occupied buildings. We have a major programme under way to install safety shelters for personnel; to move people further away from hydrocarbon-containing equipment; and to reduce the number of vehicles on site. For example, during 2012 a building hardening programme was completed at our Toledo refinery in the US, and at our Bulwer refinery in Australia we constructed new offices to move employees away from higher risk processing areas. The business also continues to train and drill personnel to respond to emergencies.
• Work to reduce explosion and toxic risks through inventory reduction by, for example, reducing ethylene and propylene refrigerants in our petrochemical plants.
A: At BP we apply the American Petroleum Institute approach to our reporting. Both leading and lagging indicators are important in helping us to analyse trends in our process safety performance, but leading indicators are often more operation specific and more challenging to interpret at group level, or compare with industry peers. We therefore report these internally to help inform business segments and operations and to provide a more granular view of process safety performance within the business.
Hazel O’Leary, Manager HSSE Management and Performance, Safety and Operational Risk, BP
Q: Why does BP not report leading process safety metrics externally?
New process safety expert for our Downstream business Mr Duane Wilson’s five-year board appointment as independent expert to provide an objective assessment of BP’s progress in implementing the recommendations of the BP US Refineries Independent Safety Review Panel came to an end in May 2012. Recognizing the extensive experience he has acquired during his years as independent expert and following the end of his term, SEEAC appointed him as a process safety expert and assigned him to work, in a global capacity, with the Downstream business.
Mr Wilson continues to have frequent and direct access not only to the board, but also to BP employees from the most senior executives down to the shop floor. Mr Wilson visits facilities, conducts interviews, and reviews relevant documents, such as audit and incident reports, to fulfill his duties. Additionally, Mr Wilson is an ex officio member of the Downstream segment operations risk committee and regularly attends its meetings with the senior executives of the business.
More information online at bp.com/safety
Filter and analyse data on BP’s health and safety performance using the charting tool.
See progress against the recommendations made from our internal investigation of the Deepwater Horizon accident.
Find information on product stewardship and how we communicate the potential health, safety and environmental impacts of products.
BP’s well-capping and tool package is designed to operate in water depths of up to 10,000 feet and includes a remotely operated vehicles intervention system.
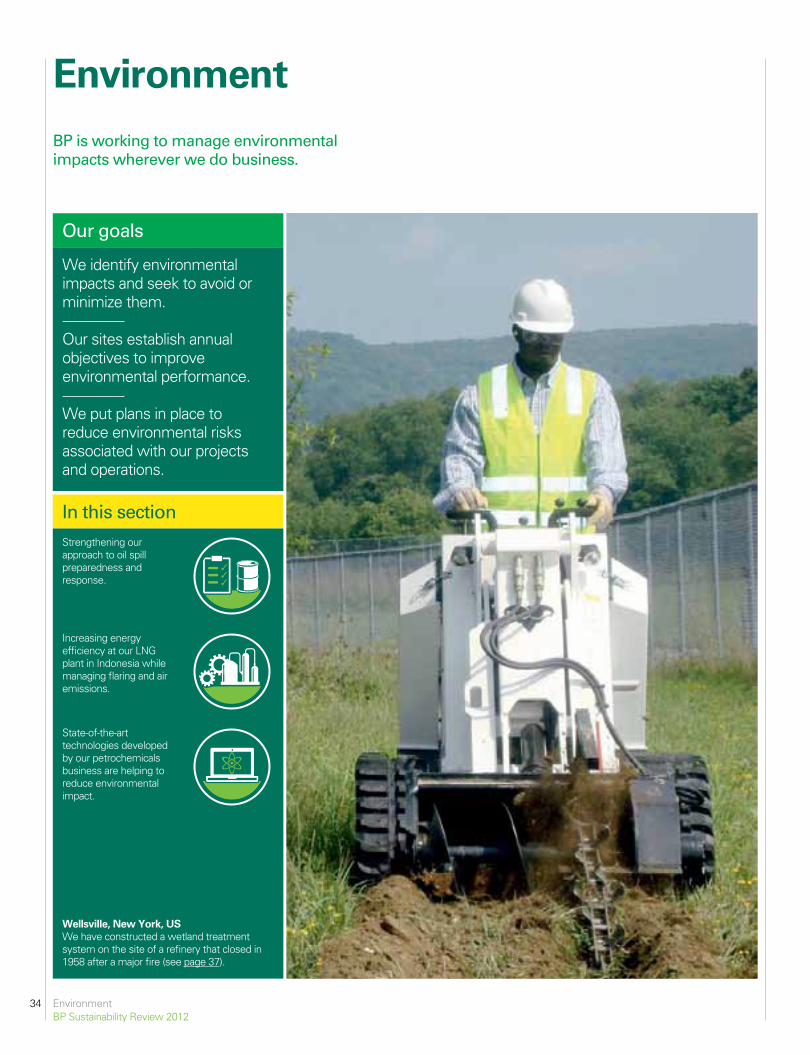
34 EnvironmentBP Sustainability Review 2012
Environment
Our goals
We identify environmental impacts and seek to avoid or minimize them.
Our sites establish annual objectives to improve environmental performance.
We put plans in place to reduce environmental risks associated with our projects and operations.
In this sectionStrengthening our approach to oil spill preparedness and response.
Increasing energy efficiency at our LNG plant in Indonesia while managing flaring and air emissions.
State-of-the-art technologies developed by our petrochemicals business are helping to reduce environmental impact.
Wellsville, New York, USWe have constructed a wetland treatment system on the site of a refinery that closed in 1958 after a major fire (see page 37).
BP is working to manage environmental impacts wherever we do business.
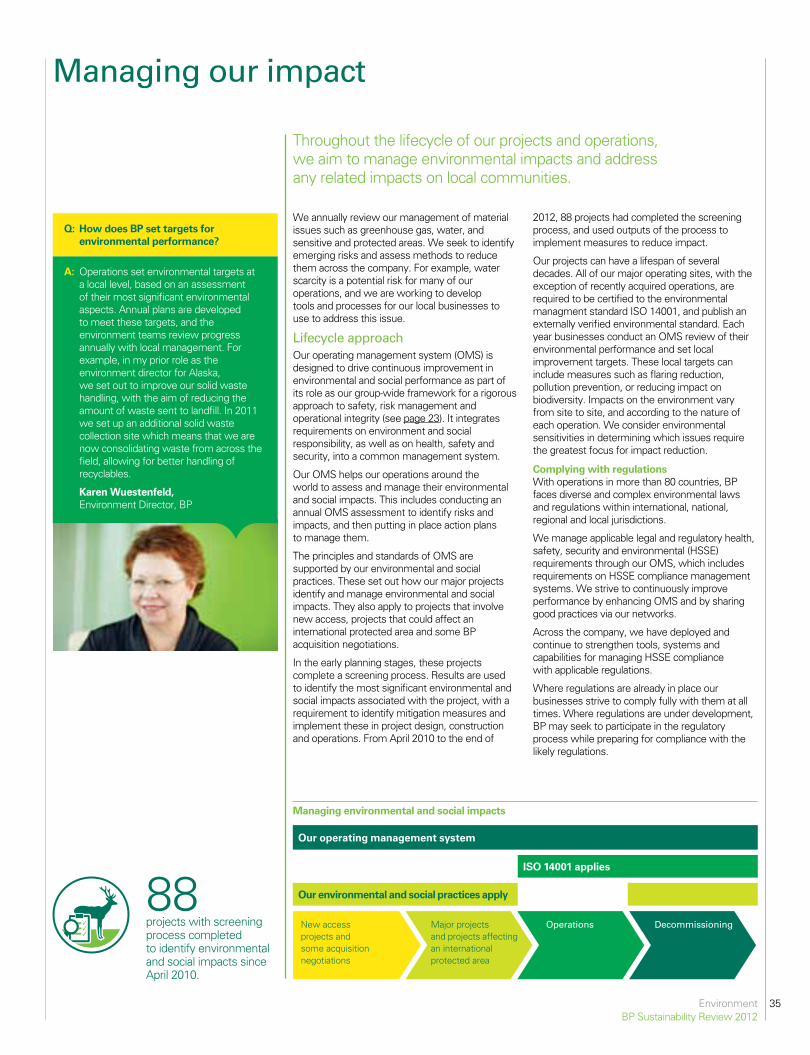
35EnvironmentBP Sustainability Review 2012
We annually review our management of material issues such as greenhouse gas, water, and sensitive and protected areas. We seek to identify emerging risks and assess methods to reduce them across the company. For example, water scarcity is a potential risk for many of our operations, and we are working to develop tools and processes for our local businesses to use to address this issue.
Lifecycle approachOur operating management system (OMS) is designed to drive continuous improvement in environmental and social performance as part of its role as our group-wide framework for a rigorous approach to safety, risk management and operational integrity (see page 23). It integrates requirements on environment and social responsibility, as well as on health, safety and security, into a common management system.
Our OMS helps our operations around the world to assess and manage their environmental and social impacts. This includes conducting an annual OMS assessment to identify risks and impacts, and then putting in place action plans to manage them.
The principles and standards of OMS are supported by our environmental and social practices. These set out how our major projects identify and manage environmental and social impacts. They also apply to projects that involve new access, projects that could affect an international protected area and some BP acquisition negotiations.
In the early planning stages, these projects complete a screening process. Results are used to identify the most significant environmental and social impacts associated with the project, with a requirement to identify mitigation measures and implement these in project design, construction and operations. From April 2010 to the end of
2012, 88 projects had completed the screening process, and used outputs of the process to implement measures to reduce impact.
Our projects can have a lifespan of several decades. All of our major operating sites, with the exception of recently acquired operations, are required to be certified to the environmental managment standard ISO 14001, and publish an externally verified environmental standard. Each year businesses conduct an OMS review of their environmental performance and set local improvement targets. These local targets can include measures such as flaring reduction, pollution prevention, or reducing impact on biodiversity. Impacts on the environment vary from site to site, and according to the nature of each operation. We consider environmental sensitivities in determining which issues require the greatest focus for impact reduction.
Complying with regulationsWith operations in more than 80 countries, BP faces diverse and complex environmental laws and regulations within international, national, regional and local jurisdictions.
We manage applicable legal and regulatory health, safety, security and environmental (HSSE) requirements through our OMS, which includes requirements on HSSE compliance management systems. We strive to continuously improve performance by enhancing OMS and by sharing good practices via our networks.
Across the company, we have deployed and continue to strengthen tools, systems and capabilities for managing HSSE compliance with applicable regulations.
Where regulations are already in place our businesses strive to comply fully with them at all times. Where regulations are under development, BP may seek to participate in the regulatory process while preparing for compliance with the likely regulations.
Throughout the lifecycle of our projects and operations, we aim to manage environmental impacts and address any related impacts on local communities.
Managing our impact
A: Operations set environmental targets at a local level, based on an assessment of their most significant environmental aspects. Annual plans are developed to meet these targets, and the environment teams review progress annually with local management. For example, in my prior role as the environment director for Alaska, we set out to improve our solid waste handling, with the aim of reducing the amount of waste sent to landfill. In 2011 we set up an additional solid waste collection site which means that we are now consolidating waste from across the field, allowing for better handling of recyclables.
Karen Wuestenfeld, Environment Director, BP
Q: How does BP set targets for environmental performance?
Our operating management system
ISO 14001 applies
Our environmental and social practices apply
New access projects and some acquisition negotiations
Major projects and projects affecting an international protected area
Operations Decommissioning
Managing environmental and social impacts
88projects with screening process completed to identify environmental and social impacts since April 2010.
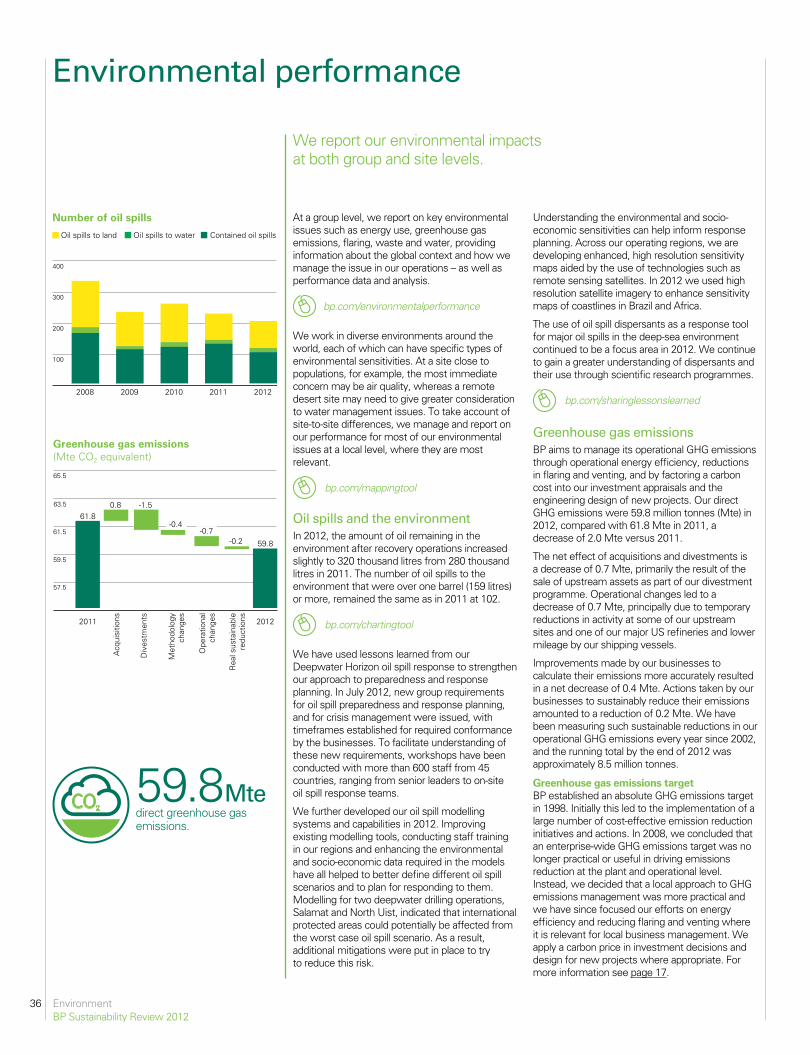
36
Environmental performance
EnvironmentBP Sustainability Review 2012
Greenhouse gas emissions (Mte CO2 equivalent)
65.5
2011
Acq
uisi
tions
Div
estm
ents
Met
hodo
logy
chan
ges
Ope
ratio
nal
chan
ges
Rea
l sus
tain
able
redu
ctio
ns 2012
63.5
59.5
57.5
61.5
59.8
61.80.8
-0.4
-1.5
-0.7-0.2
Number of oil spills
400
200
100
20122008 2009 2010 2011
300
Oil spills to water Contained oil spillsOil spills to land
At a group level, we report on key environmental issues such as energy use, greenhouse gas emissions, flaring, waste and water, providing information about the global context and how we manage the issue in our operations – as well as performance data and analysis.
bp.com/environmentalperformance
We work in diverse environments around the world, each of which can have specific types of environmental sensitivities. At a site close to populations, for example, the most immediate concern may be air quality, whereas a remote desert site may need to give greater consideration to water management issues. To take account of site-to-site differences, we manage and report on our performance for most of our environmental issues at a local level, where they are most relevant.
bp.com/mappingtool
Oil spills and the environmentIn 2012, the amount of oil remaining in the environment after recovery operations increased slightly to 320 thousand litres from 280 thousand litres in 2011. The number of oil spills to the environment that were over one barrel (159 litres) or more, remained the same as in 2011 at 102.
bp.com/chartingtool
We have used lessons learned from our Deepwater Horizon oil spill response to strengthen our approach to preparedness and response planning. In July 2012, new group requirements for oil spill preparedness and response planning, and for crisis management were issued, with timeframes established for required conformance by the businesses. To facilitate understanding of these new requirements, workshops have been conducted with more than 600 staff from 45 countries, ranging from senior leaders to on-site oil spill response teams.
We further developed our oil spill modelling systems and capabilities in 2012. Improving existing modelling tools, conducting staff training in our regions and enhancing the environmental and socio-economic data required in the models have all helped to better define different oil spill scenarios and to plan for responding to them. Modelling for two deepwater drilling operations, Salamat and North Uist, indicated that international protected areas could potentially be affected from the worst case oil spill scenario. As a result, additional mitigations were put in place to try to reduce this risk.
Understanding the environmental and socio-economic sensitivities can help inform response planning. Across our operating regions, we are developing enhanced, high resolution sensitivity maps aided by the use of technologies such as remote sensing satellites. In 2012 we used high resolution satellite imagery to enhance sensitivity maps of coastlines in Brazil and Africa.
The use of oil spill dispersants as a response tool for major oil spills in the deep-sea environment continued to be a focus area in 2012. We continue to gain a greater understanding of dispersants and their use through scientific research programmes.
bp.com/sharinglessonslearned
Greenhouse gas emissionsBP aims to manage its operational GHG emissions through operational energy efficiency, reductions in flaring and venting, and by factoring a carbon cost into our investment appraisals and the engineering design of new projects. Our direct GHG emissions were 59.8 million tonnes (Mte) in 2012, compared with 61.8 Mte in 2011, a decrease of 2.0 Mte versus 2011.
The net effect of acquisitions and divestments is a decrease of 0.7 Mte, primarily the result of the sale of upstream assets as part of our divestment programme. Operational changes led to a decrease of 0.7 Mte, principally due to temporary reductions in activity at some of our upstream sites and one of our major US refineries and lower mileage by our shipping vessels.
Improvements made by our businesses to calculate their emissions more accurately resulted in a net decrease of 0.4 Mte. Actions taken by our businesses to sustainably reduce their emissions amounted to a reduction of 0.2 Mte. We have been measuring such sustainable reductions in our operational GHG emissions every year since 2002, and the running total by the end of 2012 was approximately 8.5 million tonnes.
Greenhouse gas emissions targetBP established an absolute GHG emissions target in 1998. Initially this led to the implementation of a large number of cost-effective emission reduction initiatives and actions. In 2008, we concluded that an enterprise-wide GHG emissions target was no longer practical or useful in driving emissions reduction at the plant and operational level. Instead, we decided that a local approach to GHG emissions management was more practical and we have since focused our efforts on energy efficiency and reducing flaring and venting where it is relevant for local business management. We apply a carbon price in investment decisions and design for new projects where appropriate. For more information see page 17.
We report our environmental impacts at both group and site levels.
59.8Mtedirect greenhouse gas emissions.
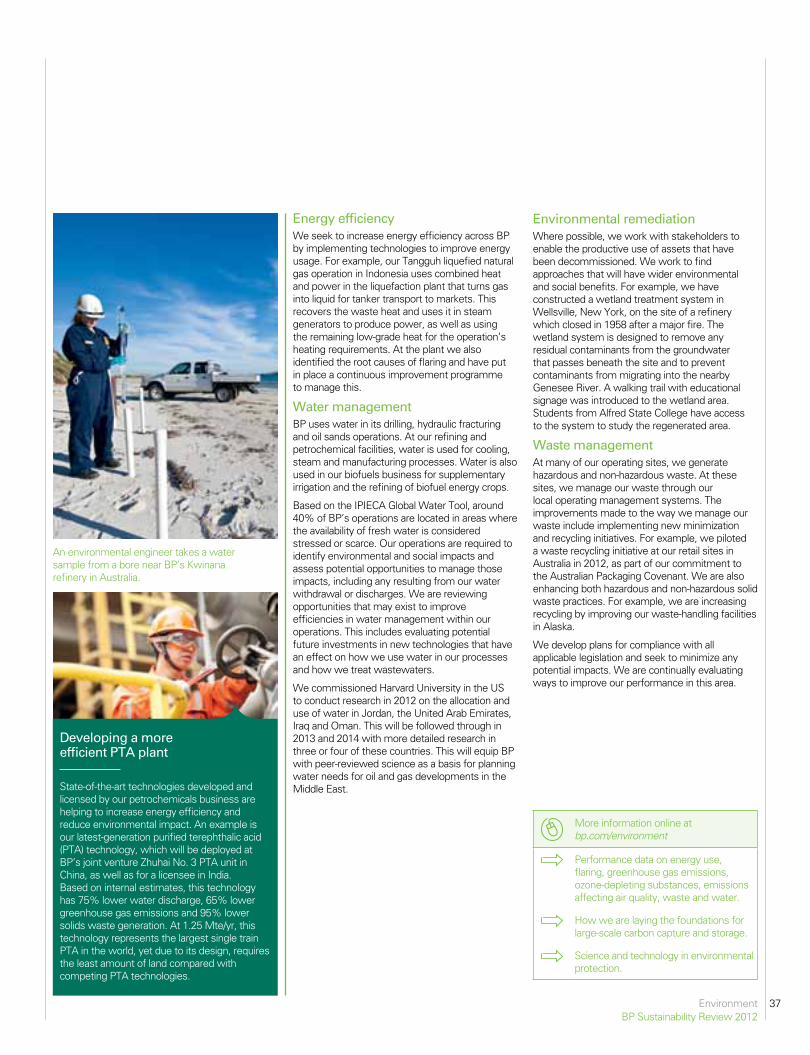
37EnvironmentBP Sustainability Review 2012
Energy efficiencyWe seek to increase energy efficiency across BP by implementing technologies to improve energy usage. For example, our Tangguh liquefied natural gas operation in Indonesia uses combined heat and power in the liquefaction plant that turns gas into liquid for tanker transport to markets. This recovers the waste heat and uses it in steam generators to produce power, as well as using the remaining low-grade heat for the operation’s heating requirements. At the plant we also identified the root causes of flaring and have put in place a continuous improvement programme to manage this.
Water managementBP uses water in its drilling, hydraulic fracturing and oil sands operations. At our refining and petrochemical facilities, water is used for cooling, steam and manufacturing processes. Water is also used in our biofuels business for supplementary irrigation and the refining of biofuel energy crops.
Based on the IPIECA Global Water Tool, around 40% of BP’s operations are located in areas where the availability of fresh water is considered stressed or scarce. Our operations are required to identify environmental and social impacts and assess potential opportunities to manage those impacts, including any resulting from our water withdrawal or discharges. We are reviewing opportunities that may exist to improve efficiencies in water management within our operations. This includes evaluating potential future investments in new technologies that have an effect on how we use water in our processes and how we treat wastewaters.
We commissioned Harvard University in the US to conduct research in 2012 on the allocation and use of water in Jordan, the United Arab Emirates, Iraq and Oman. This will be followed through in 2013 and 2014 with more detailed research in three or four of these countries. This will equip BP with peer-reviewed science as a basis for planning water needs for oil and gas developments in the Middle East.
More information online at bp.com/environment
Performance data on energy use, flaring, greenhouse gas emissions, ozone-depleting substances, emissions affecting air quality, waste and water.
How we are laying the foundations for large-scale carbon capture and storage.
Science and technology in environmental protection.
Developing a more efficient PTA plant
State-of-the-art technologies developed and licensed by our petrochemicals business are helping to increase energy efficiency and reduce environmental impact. An example is our latest-generation purified terephthalic acid (PTA) technology, which will be deployed at BP’s joint venture Zhuhai No. 3 PTA unit in China, as well as for a licensee in India. Based on internal estimates, this technology has 75% lower water discharge, 65% lower greenhouse gas emissions and 95% lower solids waste generation. At 1.25 Mte/yr, this technology represents the largest single train PTA in the world, yet due to its design, requires the least amount of land compared with competing PTA technologies.
An environmental engineer takes a water sample from a bore near BP’s Kwinana refinery in Australia.
Environmental remediationWhere possible, we work with stakeholders to enable the productive use of assets that have been decommissioned. We work to find approaches that will have wider environmental and social benefits. For example, we have constructed a wetland treatment system in Wellsville, New York, on the site of a refinery which closed in 1958 after a major fire. The wetland system is designed to remove any residual contaminants from the groundwater that passes beneath the site and to prevent contaminants from migrating into the nearby Genesee River. A walking trail with educational signage was introduced to the wetland area. Students from Alfred State College have access to the system to study the regenerated area.
Waste managementAt many of our operating sites, we generate hazardous and non-hazardous waste. At these sites, we manage our waste through our local operating management systems. The improvements made to the way we manage our waste include implementing new minimization and recycling initiatives. For example, we piloted a waste recycling initiative at our retail sites in Australia in 2012, as part of our commitment to the Australian Packaging Covenant. We are also enhancing both hazardous and non-hazardous solid waste practices. For example, we are increasing recycling by improving our waste-handling facilities in Alaska.
We develop plans for compliance with all applicable legislation and seek to minimize any potential impacts. We are continually evaluating ways to improve our performance in this area.
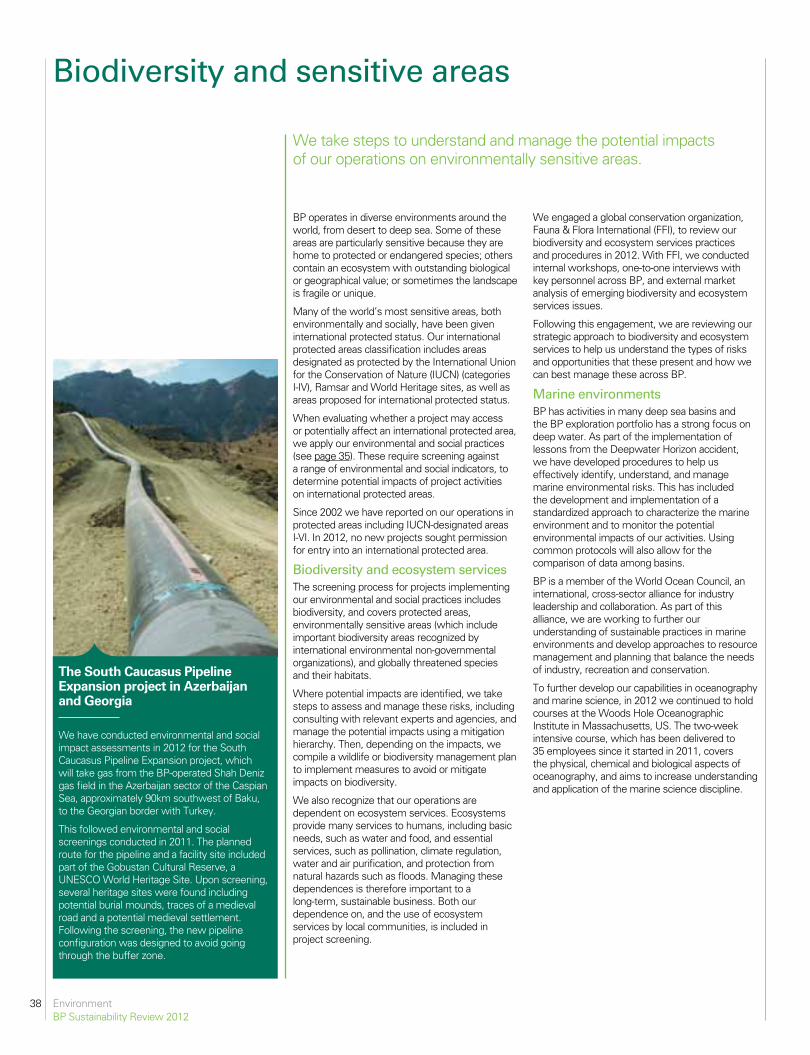
38 EnvironmentBP Sustainability Review 2012
BP operates in diverse environments around the world, from desert to deep sea. Some of these areas are particularly sensitive because they are home to protected or endangered species; others contain an ecosystem with outstanding biological or geographical value; or sometimes the landscape is fragile or unique.
Many of the world’s most sensitive areas, both environmentally and socially, have been given international protected status. Our international protected areas classification includes areas designated as protected by the International Union for the Conservation of Nature (IUCN) (categories I-IV), Ramsar and World Heritage sites, as well as areas proposed for international protected status.
When evaluating whether a project may access or potentially affect an international protected area, we apply our environmental and social practices (see page 35). These require screening against a range of environmental and social indicators, to determine potential impacts of project activities on international protected areas.
Since 2002 we have reported on our operations in protected areas including IUCN-designated areas I-VI. In 2012, no new projects sought permission for entry into an international protected area.
Biodiversity and ecosystem servicesThe screening process for projects implementing our environmental and social practices includes biodiversity, and covers protected areas, environmentally sensitive areas (which include important biodiversity areas recognized by international environmental non-governmental organizations), and globally threatened species and their habitats.
Where potential impacts are identified, we take steps to assess and manage these risks, including consulting with relevant experts and agencies, and manage the potential impacts using a mitigation hierarchy. Then, depending on the impacts, we compile a wildlife or biodiversity management plan to implement measures to avoid or mitigate impacts on biodiversity.
We also recognize that our operations are dependent on ecosystem services. Ecosystems provide many services to humans, including basic needs, such as water and food, and essential services, such as pollination, climate regulation, water and air purification, and protection from natural hazards such as floods. Managing these dependences is therefore important to a long-term, sustainable business. Both our dependence on, and the use of ecosystem services by local communities, is included in project screening.
We engaged a global conservation organization, Fauna & Flora International (FFI), to review our biodiversity and ecosystem services practices and procedures in 2012. With FFI, we conducted internal workshops, one-to-one interviews with key personnel across BP, and external market analysis of emerging biodiversity and ecosystem services issues.
Following this engagement, we are reviewing our strategic approach to biodiversity and ecosystem services to help us understand the types of risks and opportunities that these present and how we can best manage these across BP.
Marine environmentsBP has activities in many deep sea basins and the BP exploration portfolio has a strong focus on deep water. As part of the implementation of lessons from the Deepwater Horizon accident, we have developed procedures to help us effectively identify, understand, and manage marine environmental risks. This has included the development and implementation of a standardized approach to characterize the marine environment and to monitor the potential environmental impacts of our activities. Using common protocols will also allow for the comparison of data among basins.
BP is a member of the World Ocean Council, an international, cross-sector alliance for industry leadership and collaboration. As part of this alliance, we are working to further our understanding of sustainable practices in marine environments and develop approaches to resource management and planning that balance the needs of industry, recreation and conservation.
To further develop our capabilities in oceanography and marine science, in 2012 we continued to hold courses at the Woods Hole Oceanographic Institute in Massachusetts, US. The two-week intensive course, which has been delivered to 35 employees since it started in 2011, covers the physical, chemical and biological aspects of oceanography, and aims to increase understanding and application of the marine science discipline.
We take steps to understand and manage the potential impacts of our operations on environmentally sensitive areas.
Biodiversity and sensitive areas
The South Caucasus Pipeline Expansion project in Azerbaijan and Georgia
We have conducted environmental and social impact assessments in 2012 for the South Caucasus Pipeline Expansion project, which will take gas from the BP-operated Shah Deniz gas field in the Azerbaijan sector of the Caspian Sea, approximately 90km southwest of Baku, to the Georgian border with Turkey.
This followed environmental and social screenings conducted in 2011. The planned route for the pipeline and a facility site included part of the Gobustan Cultural Reserve, a UNESCO World Heritage Site. Upon screening, several heritage sites were found including potential burial mounds, traces of a medieval road and a potential medieval settlement. Following the screening, the new pipeline configuration was designed to avoid going through the buffer zone.
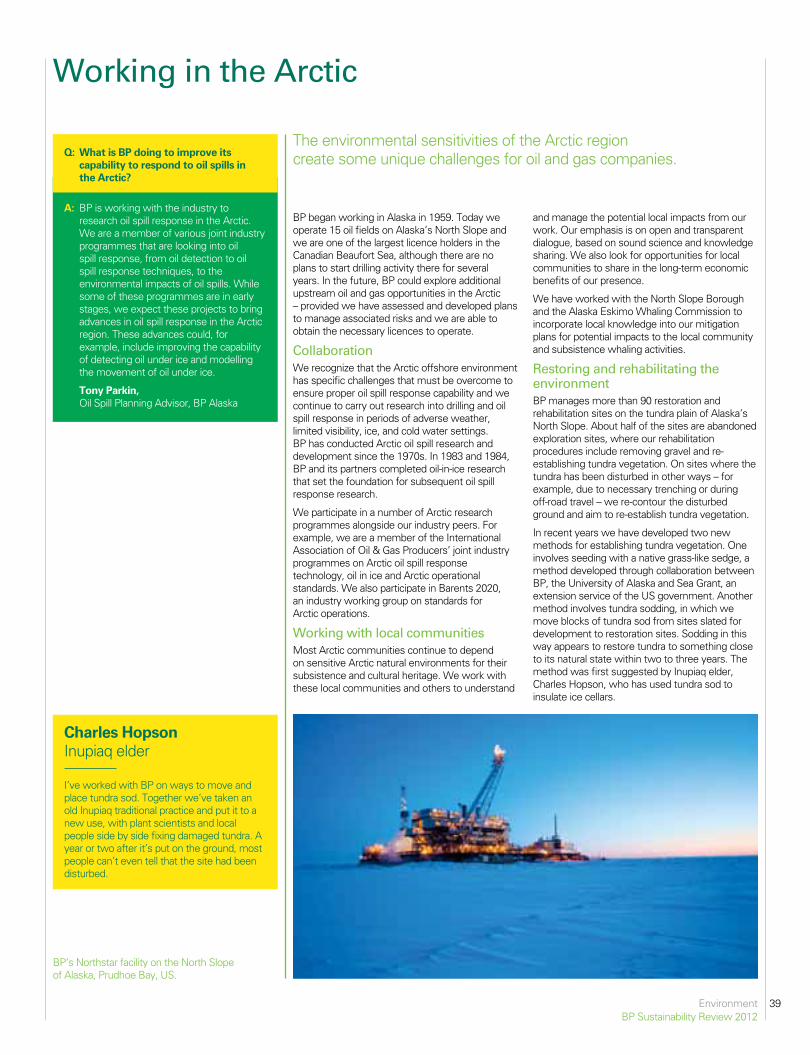
39EnvironmentBP Sustainability Review 2012
BP’s Northstar facility on the North Slope of Alaska, Prudhoe Bay, US.
BP began working in Alaska in 1959. Today we operate 15 oil fields on Alaska’s North Slope and we are one of the largest licence holders in the Canadian Beaufort Sea, although there are no plans to start drilling activity there for several years. In the future, BP could explore additional upstream oil and gas opportunities in the Arctic – provided we have assessed and developed plans to manage associated risks and we are able to obtain the necessary licences to operate.
CollaborationWe recognize that the Arctic offshore environment has specific challenges that must be overcome to ensure proper oil spill response capability and we continue to carry out research into drilling and oil spill response in periods of adverse weather, limited visibility, ice, and cold water settings. BP has conducted Arctic oil spill research and development since the 1970s. In 1983 and 1984, BP and its partners completed oil-in-ice research that set the foundation for subsequent oil spill response research.
We participate in a number of Arctic research programmes alongside our industry peers. For example, we are a member of the International Association of Oil & Gas Producers’ joint industry programmes on Arctic oil spill response technology, oil in ice and Arctic operational standards. We also participate in Barents 2020, an industry working group on standards for Arctic operations.
Working with local communitiesMost Arctic communities continue to depend on sensitive Arctic natural environments for their subsistence and cultural heritage. We work with these local communities and others to understand
and manage the potential local impacts from our work. Our emphasis is on open and transparent dialogue, based on sound science and knowledge sharing. We also look for opportunities for local communities to share in the long-term economic benefits of our presence.
We have worked with the North Slope Borough and the Alaska Eskimo Whaling Commission to incorporate local knowledge into our mitigation plans for potential impacts to the local community and subsistence whaling activities.
Restoring and rehabilitating the environmentBP manages more than 90 restoration and rehabilitation sites on the tundra plain of Alaska’s North Slope. About half of the sites are abandoned exploration sites, where our rehabilitation procedures include removing gravel and re-establishing tundra vegetation. On sites where the tundra has been disturbed in other ways – for example, due to necessary trenching or during off-road travel – we re-contour the disturbed ground and aim to re-establish tundra vegetation.
In recent years we have developed two new methods for establishing tundra vegetation. One involves seeding with a native grass-like sedge, a method developed through collaboration between BP, the University of Alaska and Sea Grant, an extension service of the US government. Another method involves tundra sodding, in which we move blocks of tundra sod from sites slated for development to restoration sites. Sodding in this way appears to restore tundra to something close to its natural state within two to three years. The method was first suggested by Inupiaq elder, Charles Hopson, who has used tundra sod to insulate ice cellars.
The environmental sensitivities of the Arctic region create some unique challenges for oil and gas companies.
Working in the Arctic
A: BP is working with the industry to research oil spill response in the Arctic. We are a member of various joint industry programmes that are looking into oil spill response, from oil detection to oil spill response techniques, to the environmental impacts of oil spills. While some of these programmes are in early stages, we expect these projects to bring advances in oil spill response in the Arctic region. These advances could, for example, include improving the capability of detecting oil under ice and modelling the movement of oil under ice.
Tony Parkin, Oil Spill Planning Advisor, BP Alaska
Q: What is BP doing to improve its capability to respond to oil spills in the Arctic?
Charles HopsonInupiaq elder
I’ve worked with BP on ways to move and place tundra sod. Together we’ve taken an old Inupiaq traditional practice and put it to a new use, with plant scientists and local people side by side fixing damaged tundra. A year or two after it’s put on the ground, most people can’t even tell that the site had been disturbed.

40 SocietyBP Sustainability Review 2012
SocietyWe care deeply about how we bring energy to the world. To BP, working responsibly means seeking to have positive impacts on the areas where we operate by managing our activities and impacts in a systematic way.
Our goals
We seek to avoid or mitigate any negative socio-economic impacts of our operations and projects.
We aim to build open and constructive relationships with our stakeholders.
We strive to respect human rights and avoid complicity in abuses.
In this section
200companies participating in supplier development programmes in Azerbaijan since 2007.
$90.6minvested in community programmes in 2012.
Human rights policy and actions developed for implementation from 2013.
Sugar cane-based biofuels operation, Edéia, BrazilBy avoiding manual harvesting wherever possible, we have improved working conditions for employees. For a case study on respecting workforce rights in Brazil see bp.com/society
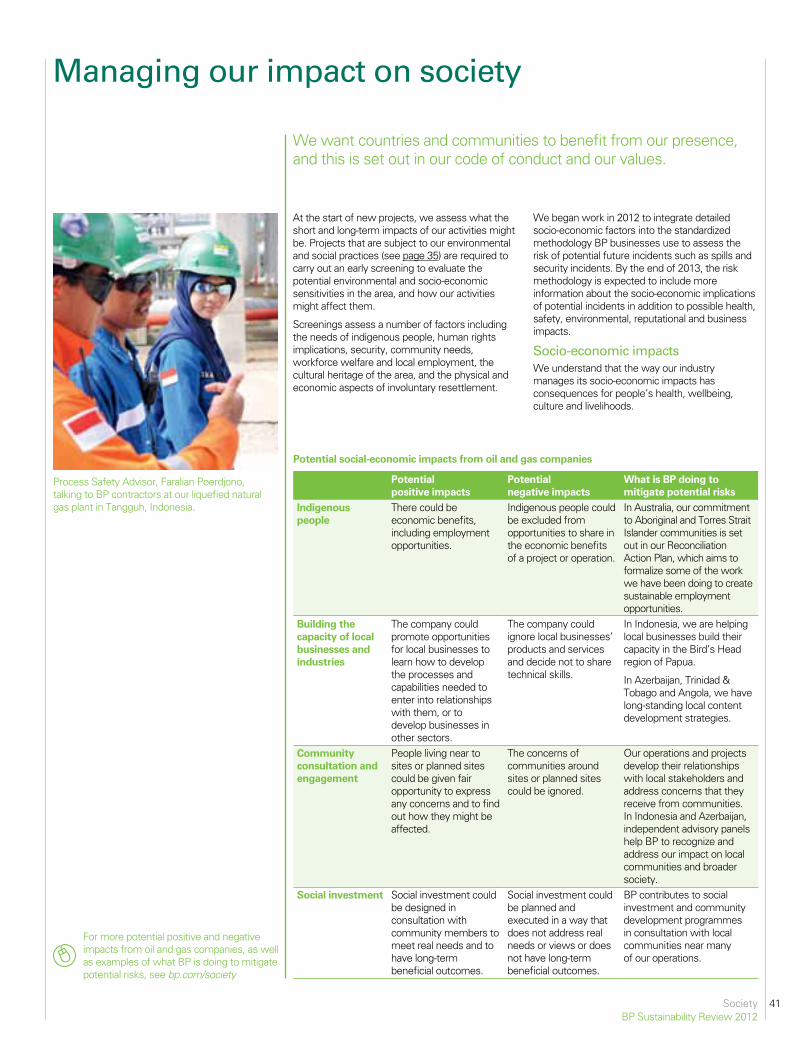
41SocietyBP Sustainability Review 2012
We want countries and communities to benefit from our presence, and this is set out in our code of conduct and our values.
Managing our impact on society
At the start of new projects, we assess what the short and long-term impacts of our activities might be. Projects that are subject to our environmental and social practices (see page 35) are required to carry out an early screening to evaluate the potential environmental and socio-economic sensitivities in the area, and how our activities might affect them.
Screenings assess a number of factors including the needs of indigenous people, human rights implications, security, community needs, workforce welfare and local employment, the cultural heritage of the area, and the physical and economic aspects of involuntary resettlement.
We began work in 2012 to integrate detailed socio-economic factors into the standardized methodology BP businesses use to assess the risk of potential future incidents such as spills and security incidents. By the end of 2013, the risk methodology is expected to include more information about the socio-economic implications of potential incidents in addition to possible health, safety, environmental, reputational and business impacts.
Socio-economic impactsWe understand that the way our industry manages its socio-economic impacts has consequences for people’s health, wellbeing, culture and livelihoods.
Potential social-economic impacts from oil and gas companies
Process Safety Advisor, Faralian Poerdjono, talking to BP contractors at our liquefied natural gas plant in Tangguh, Indonesia.
For more potential positive and negative impacts from oil and gas companies, as well as examples of what BP is doing to mitigate potential risks, see bp.com/society
Potential positive impacts
Potential negative impacts
What is BP doing to mitigate potential risks
Indigenous people
There could be economic benefits, including employment opportunities.
Indigenous people could be excluded from opportunities to share in the economic benefits of a project or operation.
In Australia, our commitment to Aboriginal and Torres Strait Islander communities is set out in our Reconciliation Action Plan, which aims to formalize some of the work we have been doing to create sustainable employment opportunities.
Building the capacity of local businesses and industries
The company could promote opportunities for local businesses to learn how to develop the processes and capabilities needed to enter into relationships with them, or to develop businesses in other sectors.
The company could ignore local businesses’ products and services and decide not to share technical skills.
In Indonesia, we are helping local businesses build their capacity in the Bird’s Head region of Papua.
In Azerbaijan, Trinidad & Tobago and Angola, we have long-standing local content development strategies.
Community consultation and engagement
People living near to sites or planned sites could be given fair opportunity to express any concerns and to find out how they might be affected.
The concerns of communities around sites or planned sites could be ignored.
Our operations and projects develop their relationships with local stakeholders and address concerns that they receive from communities. In Indonesia and Azerbaijan, independent advisory panels help BP to recognize and address our impact on local communities and broader society.
Social investment Social investment could be designed in consultation with community members to meet real needs and to have long-term beneficial outcomes.
Social investment could be planned and executed in a way that does not address real needs or views or does not have long-term beneficial outcomes.
BP contributes to social investment and community development programmes in consultation with local communities near many of our operations.
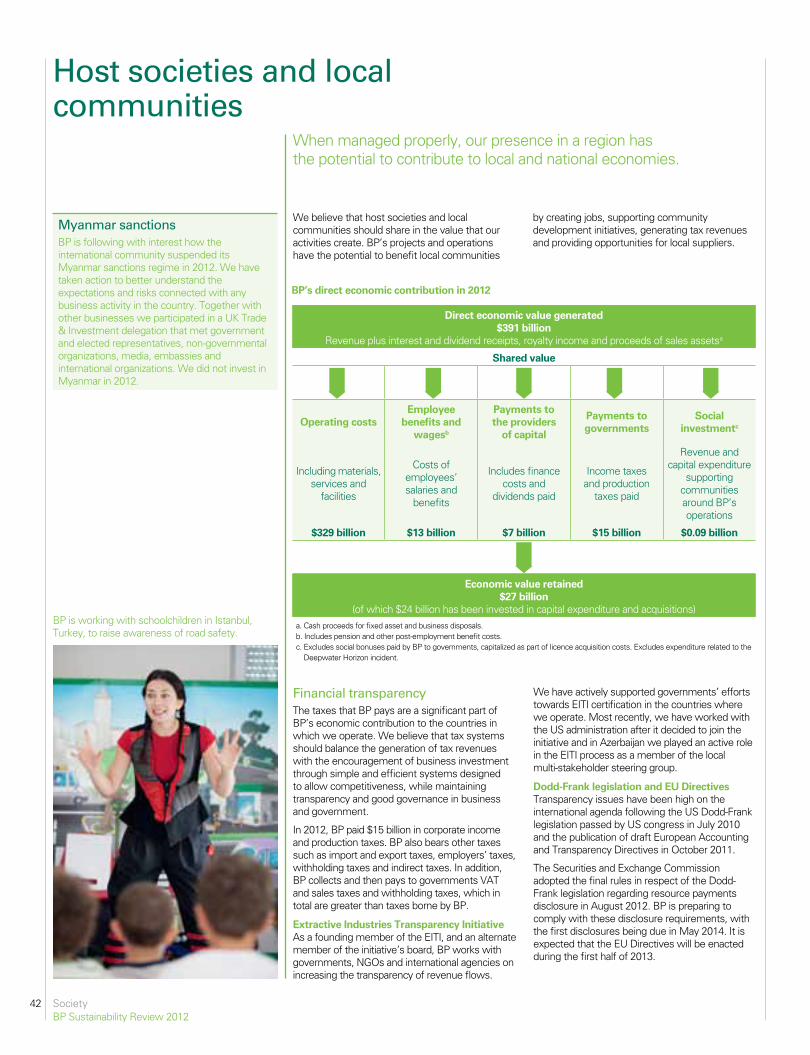
42 SocietyBP Sustainability Review 2012
We believe that host societies and local communities should share in the value that our activities create. BP’s projects and operations have the potential to benefit local communities
by creating jobs, supporting community development initiatives, generating tax revenues and providing opportunities for local suppliers.
When managed properly, our presence in a region has the potential to contribute to local and national economies.
Host societies and local communities
Financial transparencyThe taxes that BP pays are a significant part of BP’s economic contribution to the countries in which we operate. We believe that tax systems should balance the generation of tax revenues with the encouragement of business investment through simple and efficient systems designed to allow competitiveness, while maintaining transparency and good governance in business and government.
In 2012, BP paid $15 billion in corporate income and production taxes. BP also bears other taxes such as import and export taxes, employers’ taxes, withholding taxes and indirect taxes. In addition, BP collects and then pays to governments VAT and sales taxes and withholding taxes, which in total are greater than taxes borne by BP.
Extractive Industries Transparency InitiativeAs a founding member of the EITI, and an alternate member of the initiative’s board, BP works with governments, NGOs and international agencies on increasing the transparency of revenue flows.
We have actively supported governments’ efforts towards EITI certification in the countries where we operate. Most recently, we have worked with the US administration after it decided to join the initiative and in Azerbaijan we played an active role in the EITI process as a member of the local multi-stakeholder steering group.
Dodd-Frank legislation and EU DirectivesTransparency issues have been high on the international agenda following the US Dodd-Frank legislation passed by US congress in July 2010 and the publication of draft European Accounting and Transparency Directives in October 2011.
The Securities and Exchange Commission adopted the final rules in respect of the Dodd-Frank legislation regarding resource payments disclosure in August 2012. BP is preparing to comply with these disclosure requirements, with the first disclosures being due in May 2014. It is expected that the EU Directives will be enacted during the first half of 2013.
BP’s direct economic contribution in 2012
Direct economic value generated
$391 billion Revenue plus interest and dividend receipts, royalty income and proceeds of sales assets a
Shared value
Operating costsEmployee
benefits and wagesb
Payments to the providers
of capital
Payments to governments
Social investmentc
Including materials, services and
facilities
Costs of employees’ salaries and
benefits
Includes finance costs and
dividends paid
Income taxes and production
taxes paid
Revenue and capital expenditure
supporting communities around BP’s operations
$329 billion $13 billion $7 billion $15 billion $0.09 billion
Economic value retained $27 billion
(of which $24 billion has been invested in capital expenditure and acquisitions)a. Cash proceeds for fixed asset and business disposals.b. Includes pension and other post-employment benefit costs.c. Excludes social bonuses paid by BP to governments, capitalized as part of licence acquisition costs. Excludes expenditure related to the
Deepwater Horizon incident.
Myanmar sanctionsBP is following with interest how the international community suspended its Myanmar sanctions regime in 2012. We have taken action to better understand the expectations and risks connected with any business activity in the country. Together with other businesses we participated in a UK Trade & Investment delegation that met government and elected representatives, non-governmental organizations, media, embassies and international organizations. We did not invest in Myanmar in 2012.
BP is working with schoolchildren in Istanbul, Turkey, to raise awareness of road safety.
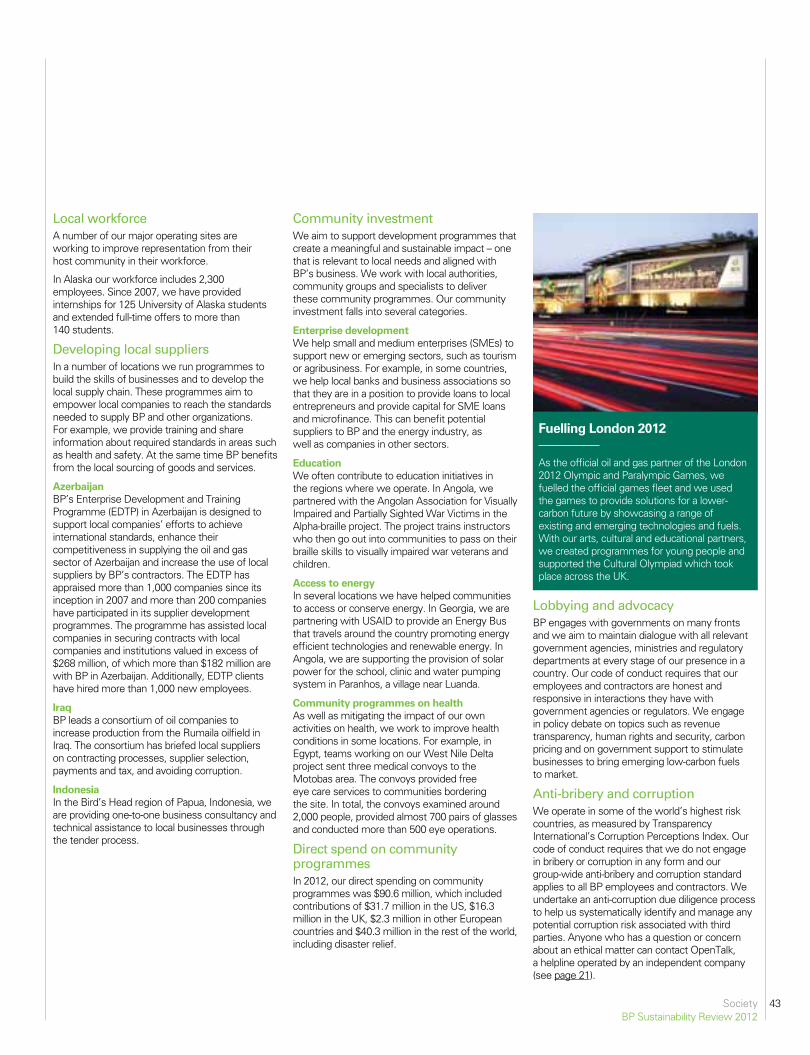
43SocietyBP Sustainability Review 2012
Local workforceA number of our major operating sites are working to improve representation from their host community in their workforce.
In Alaska our workforce includes 2,300 employees. Since 2007, we have provided internships for 125 University of Alaska students and extended full-time offers to more than 140 students.
Developing local suppliersIn a number of locations we run programmes to build the skills of businesses and to develop the local supply chain. These programmes aim to empower local companies to reach the standards needed to supply BP and other organizations. For example, we provide training and share information about required standards in areas such as health and safety. At the same time BP benefits from the local sourcing of goods and services.
AzerbaijanBP’s Enterprise Development and Training Programme (EDTP) in Azerbaijan is designed to support local companies’ efforts to achieve international standards, enhance their competitiveness in supplying the oil and gas sector of Azerbaijan and increase the use of local suppliers by BP’s contractors. The EDTP has appraised more than 1,000 companies since its inception in 2007 and more than 200 companies have participated in its supplier development programmes. The programme has assisted local companies in securing contracts with local companies and institutions valued in excess of $268 million, of which more than $182 million are with BP in Azerbaijan. Additionally, EDTP clients have hired more than 1,000 new employees.
IraqBP leads a consortium of oil companies to increase production from the Rumaila oilfield in Iraq. The consortium has briefed local suppliers on contracting processes, supplier selection, payments and tax, and avoiding corruption.
IndonesiaIn the Bird’s Head region of Papua, Indonesia, we are providing one-to-one business consultancy and technical assistance to local businesses through the tender process.
Community investmentWe aim to support development programmes that create a meaningful and sustainable impact – one that is relevant to local needs and aligned with BP’s business. We work with local authorities, community groups and specialists to deliver these community programmes. Our community investment falls into several categories.
Enterprise developmentWe help small and medium enterprises (SMEs) to support new or emerging sectors, such as tourism or agribusiness. For example, in some countries, we help local banks and business associations so that they are in a position to provide loans to local entrepreneurs and provide capital for SME loans and microfinance. This can benefit potential suppliers to BP and the energy industry, as well as companies in other sectors.
EducationWe often contribute to education initiatives in the regions where we operate. In Angola, we partnered with the Angolan Association for Visually Impaired and Partially Sighted War Victims in the Alpha-braille project. The project trains instructors who then go out into communities to pass on their braille skills to visually impaired war veterans and children.
Access to energyIn several locations we have helped communities to access or conserve energy. In Georgia, we are partnering with USAID to provide an Energy Bus that travels around the country promoting energy efficient technologies and renewable energy. In Angola, we are supporting the provision of solar power for the school, clinic and water pumping system in Paranhos, a village near Luanda.
Community programmes on healthAs well as mitigating the impact of our own activities on health, we work to improve health conditions in some locations. For example, in Egypt, teams working on our West Nile Delta project sent three medical convoys to the Motobas area. The convoys provided free eye care services to communities bordering the site. In total, the convoys examined around 2,000 people, provided almost 700 pairs of glasses and conducted more than 500 eye operations.
Direct spend on community programmesIn 2012, our direct spending on community programmes was $90.6 million, which included contributions of $31.7 million in the US, $16.3 million in the UK, $2.3 million in other European countries and $40.3 million in the rest of the world, including disaster relief.
Lobbying and advocacyBP engages with governments on many fronts and we aim to maintain dialogue with all relevant government agencies, ministries and regulatory departments at every stage of our presence in a country. Our code of conduct requires that our employees and contractors are honest and responsive in interactions they have with government agencies or regulators. We engage in policy debate on topics such as revenue transparency, human rights and security, carbon pricing and on government support to stimulate businesses to bring emerging low-carbon fuels to market.
Anti-bribery and corruptionWe operate in some of the world’s highest risk countries, as measured by Transparency International’s Corruption Perceptions Index. Our code of conduct requires that we do not engage in bribery or corruption in any form and our group-wide anti-bribery and corruption standard applies to all BP employees and contractors. We undertake an anti-corruption due diligence process to help us systematically identify and manage any potential corruption risk associated with third parties. Anyone who has a question or concern about an ethical matter can contact OpenTalk, a helpline operated by an independent company (see page 21).
Fuelling London 2012
As the official oil and gas partner of the London 2012 Olympic and Paralympic Games, we fuelled the official games fleet and we used the games to provide solutions for a lower-carbon future by showcasing a range of existing and emerging technologies and fuels. With our arts, cultural and educational partners, we created programmes for young people and supported the Cultural Olympiad which took place across the UK.
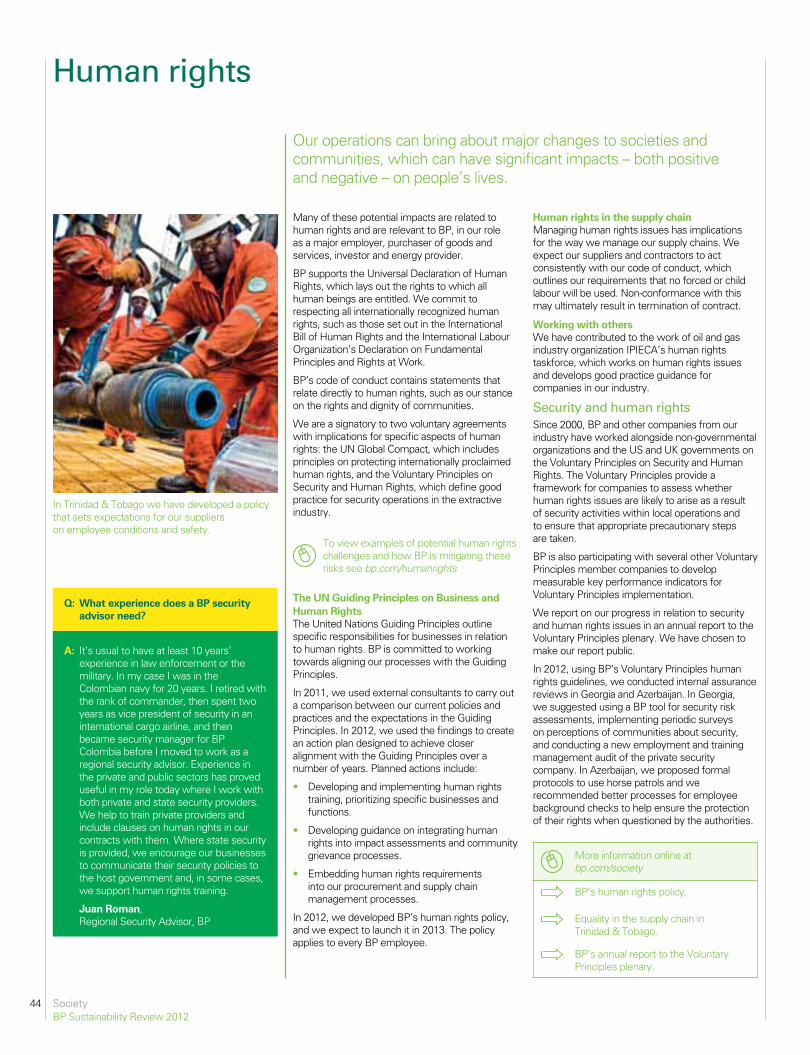
44 SocietyBP Sustainability Review 2012
Many of these potential impacts are related to human rights and are relevant to BP, in our role as a major employer, purchaser of goods and services, investor and energy provider.
BP supports the Universal Declaration of Human Rights, which lays out the rights to which all human beings are entitled. We commit to respecting all internationally recognized human rights, such as those set out in the International Bill of Human Rights and the International Labour Organization’s Declaration on Fundamental Principles and Rights at Work.
BP’s code of conduct contains statements that relate directly to human rights, such as our stance on the rights and dignity of communities.
We are a signatory to two voluntary agreements with implications for specific aspects of human rights: the UN Global Compact, which includes principles on protecting internationally proclaimed human rights, and the Voluntary Principles on Security and Human Rights, which define good practice for security operations in the extractive industry.
To view examples of potential human rights challenges and how BP is mitigating these risks see bp.com/humanrights
The UN Guiding Principles on Business and Human RightsThe United Nations Guiding Principles outline specific responsibilities for businesses in relation to human rights. BP is committed to working towards aligning our processes with the Guiding Principles.
In 2011, we used external consultants to carry out a comparison between our current policies and practices and the expectations in the Guiding Principles. In 2012, we used the findings to create an action plan designed to achieve closer alignment with the Guiding Principles over a number of years. Planned actions include:
• Developing and implementing human rights training, prioritizing specific businesses and functions.
• Developing guidance on integrating human rights into impact assessments and community grievance processes.
• Embedding human rights requirements into our procurement and supply chain management processes.
In 2012, we developed BP’s human rights policy, and we expect to launch it in 2013. The policy applies to every BP employee.
Human rights in the supply chainManaging human rights issues has implications for the way we manage our supply chains. We expect our suppliers and contractors to act consistently with our code of conduct, which outlines our requirements that no forced or child labour will be used. Non-conformance with this may ultimately result in termination of contract.
Working with othersWe have contributed to the work of oil and gas industry organization IPIECA’s human rights taskforce, which works on human rights issues and develops good practice guidance for companies in our industry.
Security and human rights Since 2000, BP and other companies from our industry have worked alongside non-governmental organizations and the US and UK governments on the Voluntary Principles on Security and Human Rights. The Voluntary Principles provide a framework for companies to assess whether human rights issues are likely to arise as a result of security activities within local operations and to ensure that appropriate precautionary steps are taken.
BP is also participating with several other Voluntary Principles member companies to develop measurable key performance indicators for Voluntary Principles implementation.
We report on our progress in relation to security and human rights issues in an annual report to the Voluntary Principles plenary. We have chosen to make our report public.
In 2012, using BP’s Voluntary Principles human rights guidelines, we conducted internal assurance reviews in Georgia and Azerbaijan. In Georgia, we suggested using a BP tool for security risk assessments, implementing periodic surveys on perceptions of communities about security, and conducting a new employment and training management audit of the private security company. In Azerbaijan, we proposed formal protocols to use horse patrols and we recommended better processes for employee background checks to help ensure the protection of their rights when questioned by the authorities.
More information online at bp.com/society
BP’s human rights policy.
Equality in the supply chain in Trinidad & Tobago.
BP’s annual report to the Voluntary Principles plenary.
Our operations can bring about major changes to societies and communities, which can have significant impacts – both positive and negative – on people’s lives.
Human rights
A: It’s usual to have at least 10 years’ experience in law enforcement or the military. In my case I was in the Colombian navy for 20 years. I retired with the rank of commander, then spent two years as vice president of security in an international cargo airline, and then became security manager for BP Colombia before I moved to work as a regional security advisor. Experience in the private and public sectors has proved useful in my role today where I work with both private and state security providers. We help to train private providers and include clauses on human rights in our contracts with them. Where state security is provided, we encourage our businesses to communicate their security policies to the host government and, in some cases, we support human rights training.
Juan Roman, Regional Security Advisor, BP
Q: What experience does a BP security advisor need?
In Trinidad & Tobago we have developed a policy that sets expectations for our suppliers on employee conditions and safety.
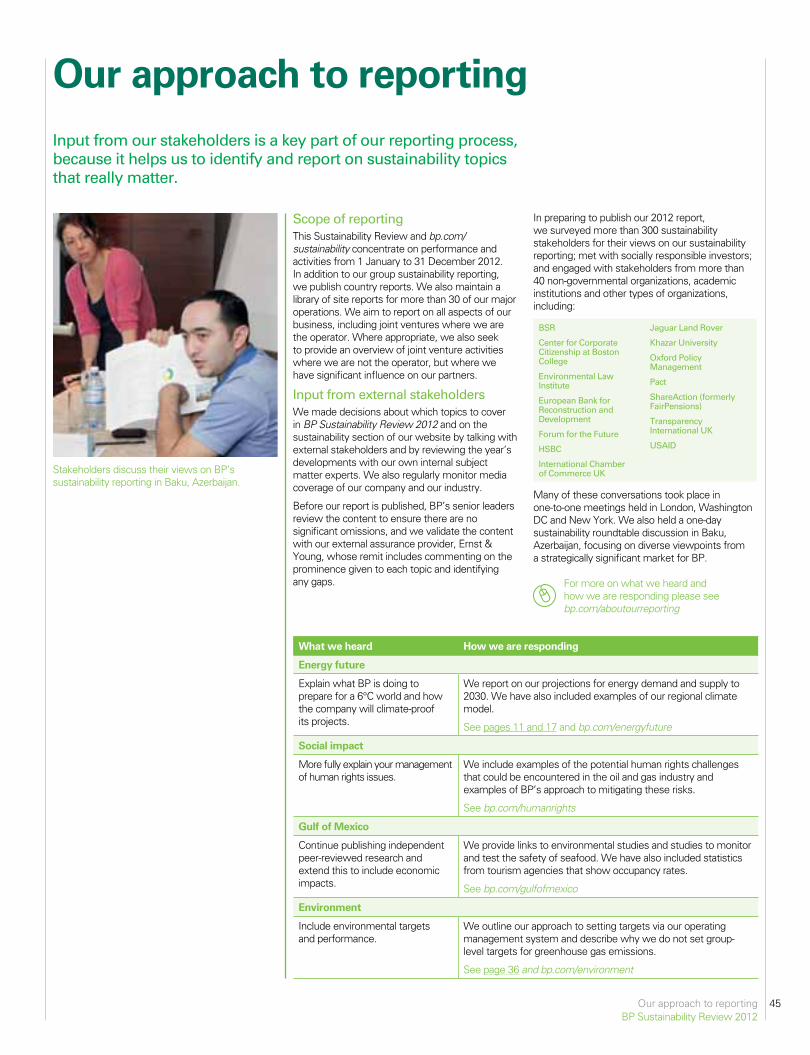
45Our approach to reportingBP Sustainability Review 2012
What we heard How we are responding
Energy future
Explain what BP is doing to prepare for a 6°C world and how the company will climate-proof its projects.
We report on our projections for energy demand and supply to 2030. We have also included examples of our regional climate model.
See pages 11 and 17 and bp.com/energyfuture
Social impact
More fully explain your management of human rights issues.
We include examples of the potential human rights challenges that could be encountered in the oil and gas industry and examples of BP’s approach to mitigating these risks.
See bp.com/humanrights
Gulf of Mexico
Continue publishing independent peer-reviewed research and extend this to include economic impacts.
We provide links to environmental studies and studies to monitor and test the safety of seafood. We have also included statistics from tourism agencies that show occupancy rates.
See bp.com/gulfofmexico
Environment
Include environmental targets and performance.
We outline our approach to setting targets via our operating management system and describe why we do not set group-level targets for greenhouse gas emissions.
See page 36 and bp.com/environment
Input from our stakeholders is a key part of our reporting process, because it helps us to identify and report on sustainability topics that really matter.
Our approach to reporting
Scope of reportingThis Sustainability Review and bp.com/sustainability concentrate on performance and activities from 1 January to 31 December 2012. In addition to our group sustainability reporting, we publish country reports. We also maintain a library of site reports for more than 30 of our major operations. We aim to report on all aspects of our business, including joint ventures where we are the operator. Where appropriate, we also seek to provide an overview of joint venture activities where we are not the operator, but where we have significant influence on our partners.
Input from external stakeholdersWe made decisions about which topics to cover in BP Sustainability Review 2012 and on the sustainability section of our website by talking with external stakeholders and by reviewing the year’s developments with our own internal subject matter experts. We also regularly monitor media coverage of our company and our industry.
Before our report is published, BP’s senior leaders review the content to ensure there are no significant omissions, and we validate the content with our external assurance provider, Ernst & Young, whose remit includes commenting on the prominence given to each topic and identifying any gaps.
In preparing to publish our 2012 report, we surveyed more than 300 sustainability stakeholders for their views on our sustainability reporting; met with socially responsible investors; and engaged with stakeholders from more than 40 non-governmental organizations, academic institutions and other types of organizations, including:
BSR
Center for Corporate Citizenship at Boston College
Environmental Law Institute
European Bank for Reconstruction and Development
Forum for the Future
HSBC
International Chamber of Commerce UK
Jaguar Land Rover
Khazar University
Oxford Policy Management
Pact
ShareAction (formerly FairPensions)
Transparency International UK
USAID
Many of these conversations took place in one-to-one meetings held in London, Washington DC and New York. We also held a one-day sustainability roundtable discussion in Baku, Azerbaijan, focusing on diverse viewpoints from a strategically significant market for BP.
For more on what we heard and how we are responding please see bp.com/aboutourreporting
Stakeholders discuss their views on BP’s sustainability reporting in Baku, Azerbaijan.
46 XxxxBP Sustainability Review 2012Independent assurance statementBP Sustainability Review 2012
Independent assurance statement
The BP Sustainability Review 2012 (the Report) has been prepared by the management of BP p.l.c., who are responsible for the collection and presentation of information within it. Our responsibility, in accordance with BP management’s instructions, is to carry out a limited assurance engagement on the Report. We do not accept or assume any responsibility for any other purpose or to any other person or organisation. Any reliance any such third party may place on the Report is entirely at its own risk.
What we did to form our conclusions Our assurance engagement has been planned and performed in accordance with ISAE30001 and to meet the requirements of a Type 2 assurance engagement as defined by AA1000AS (2008).2 The AA1000AS (2008) assurance principles of Inclusivity, Materiality and Responsiveness have been used as criteria against which to evaluate the Report.
In order to form our conclusions we undertook the steps outlined below:
1. Interviewed a selection of BP executives and senior managers to understand the current status of safety, social, ethical and environmental activities, and progress made during the reporting period.
2. Reviewed selected group level documents relating to safety, social, ethical and environmental aspects of BP’s performance to understand progress made across the organisation and test the coverage of topics within the Report.
3. Reviewed BP’s approach to stakeholder engagement through interviews with employees with responsibility for managing engagement activities at group and local businesses, and reviewed selected associated documentation.
4. Carried out the following activities to review health, safety and environment (HSE) and community investment data samples and processes:
a. Reviewed disaggregated HSE data reported by a sample of five businesses to assess whether the data had been collected, consolidated and reported accurately.
b. Reviewed and challenged supporting evidence from the sample of businesses.
c. Tested whether HSE data had been collected, consolidated and reported appropriately at group level.
d. Reviewed community investment data at group level.
5. Reviewed BP’s processes for determining material issues to be included in the Report.
6. Reviewed the coverage of material issues within the Report against the key issues raised by BP’s stakeholder engagement activities, material issues and areas of performance covered in external media reports and sustainability reports of BP’s peers, as well as and the topics discussed by BP’s SEEAC.
7. Reviewed information or explanations about selected data, statements and assertions regarding BP’s sustainability performance.
Level of assuranceOur evidence gathering procedures were designed to obtain a limited level of assurance (as set out in ISAE3000) on which to base our conclusions. The extent of evidence gathering procedures performed is less than that of a reasonable assurance engagement (such as a financial audit) and therefore a lower level of assurance is provided.
The limitations of our reviewOur work did not include physical inspections of any of BP’s operating assets.
Our conclusions Based on the scope of our review our conclusions are outlined below:
Inclusivity
Has BP been engaging with stakeholders across the business to develop its response to sustainability issues?
• Weare not aware of any key stakeholder groups that have been excluded from dialogue.
• We are not aware of any matters that would lead us to conclude that BP has not applied the inclusivity principle in developing its response to sustainability issues.
Materiality
Has BP provided a balanced representation of material issues concerning BP’s sustainability performance?
• Wearenot aware of any material aspects concerning BP’s sustainability performance which have been excluded from the Report.
• Nothing has come to our attention that causes us to believe that BP management has not applied its processes for determining material issues to be included in the Report.
Responsiveness
Has BP responded to stakeholder concerns?
• Wearenot aware of any matters that would lead us to conclude that BP has not applied the responsiveness principle in considering the matters to be reported.
Completeness and accuracy of performance informationHow complete and accurate is the HSE and community investment data in the Report?
• Withthe exception of the limitations identified in the Report on the inside back cover, we are not aware of any material reporting units that have been excluded from the group-wide data relating to HSE and community investment data.
• Nothing has come to our attention that causes us to believe that the data relating to the above topics has not been collated properly from group-wide systems.
• We are not aware of any errors that would materially affect the data as presented in the Report.
How plausible are the statements and claims within the Report?
• We have reviewed information or explanation on selected statements on BP’s sustainability activities presented in the Report and we are not aware of any misstatements in the assertions made.
Global Reporting InitiativeDoes the Report meet the requirements of the A+ application level of the GRI G3.1 Guidelines?
• Basedonourreview,includingconsideration of the Report, BP’s sustainability web content and elements of the BP Annual Report and Form 20-F 2012, nothing has come to our attention that causes us to believe that BP’s reporting has not applied the GRI G3.1 Guidelines to a level consistent with the A+ application level.
1 International Federation of the Accountants’ International Standard for Assurance Engagements Other Than Audits or Reviews of Historical Financial Information (ISAE3000).2 The 2008 edition of AccountAbility’s AA1000 assurance standard.
46
XxxxBP Sustainability Review 2012
Independent assurance statementBP Sustainability Review 2012
Our independenceAs auditors to BP p.l.c., Ernst & Young are required to comply with the requirements set out in the Auditing Practices Board’s (APB) Ethical Standards for Auditors. Ernst & Young’s independence policies apply to the firm, partners and professional staff. These policies prohibit any financial interests in our clients that would or might be seen to impair independence. Each year, partners and staff are required to confirm their compliance with the firm’s policies.
We confirm annually to BP whether there have been any events including the provision of prohibited services that could impair our independence or objectivity. There were no such events or services in 2012.
Our assurance teamOur assurance team has been drawn from our global Climate Change and Sustainability Services Practice, which undertakes engagements similar to this with a number of significant UK and international businesses. The work has been led and reviewed by a Lead Sustainability Assurance Practitioner.
Ernst & Young LLP, London
20 March 2013
Observations and areas for improvementOur observations and areas for improvement will be raised in a report to BP management. Selected observations are provided below. These observations do not affect our conclusions on the Report set out above.
• Stakeholderscontinuetorequestmoredetailon BP’s contribution to a low-carbon future, including its renewable energy strategy. The Sustainability Review sets out BP’s alternative energy investment to date within the context of ‘the energy future’. However, the contribution that these wind and biofuels assets currently make to a low-carbon future is less clear. For example, a more complete picture could be provided by comparing reported operational GHG emissions with an estimation of ‘avoided’ CO2 emissions.
• BP has highlighted its renewed focus on diversity, with a new framework and associated goals for female representation in leadership positions. During our interviews we discussed the challenges for BP in delivering against these goals and whether interim milestones should be set. BP has introduced additional structures to support
delivery and the reported increase in female leaders in the last three years shows that progress is being made. However, the fact that the same level of representation was first achieved in 2005 demonstrates the difficulty in sustaining this improvement.
• BP participates in a diverse range of joint ventures. BP acknowledges the importance of risks associated with non-operated joint ventures and the report highlights the pilot of a new group policy in this area. However, it does not explain how material these relationships are for BP, which account for an important part of BP’s portfolio and overall value chain.
• We reviewed BP’s GHG performance. BP explains that existing operations are required to incorporate energy use considerations into business planning but has also acknowledged that future upstream developments are likely to have higher CO2 emissions. Interest in the steps that oil and gas companies are taking to reduce the intensity of emissions remains high. BP will need to continue providing a clear explanation of this relative performance in the context of ongoing changes to the business structure.
• For the second year, BP has reported on its direct economic contribution, including taxes paid and social investment spend. Whilst this provides a useful summary, stakeholders are increasingly looking for detailed performance information and BP should consider providing a more detailed breakdown for certain elements of this contribution, for example a regional split of spend with local suppliers.
• BP maintains a wide programme of stakeholder engagement. This takes place both during the course of running the business and specifically in relation to sustainability reporting. This Report has more explicitly addressed how BP is responding to some of the specific concerns that have been raised during this engagement process, for example in relation to the socio-economic impacts of the oil and gas industry.
47

4848 BP in figuresBP Sustainability Review 2012
For the year ended 31 December Safety 2008 2009 2010 2011 2012Fatalities – employees 2 0 0 1 1Fatalities – contractors 3 18 14 1 3Days away from work cases – workforce 175 134 408 168 152Days away from work case frequency b (DAFWCF) – workforce 0.092 0.069 0.193 0.090 0.076Recordable injuries – workforce 951 665 1,284 677 710Recordable injury frequency b (RIF) – workforce 0.43 0.34 0.61 0.36 0.35Hours worked – employees (million hours) 195 174 168 165 182Hours worked – contractors (million hours) 245 216 255 209 220Losses of primary containment c (number) 658 537 418 361 292Tier 1 process safety events d (number) – – 74 74 43Oil spills (>–1 barrel)c 335 234 261 228 204Volume of oil spilled (million litres) 3.4 1.2 1.7e 0.6 0.8Safety and environmental fines ($ million) 1.1 66.6 52.5 77.4 22.4
Environment 2008 2009 2010 2011 2012Number of oil spills – to land and water c 170 122 142 102 102Volume of oil unrecovered (million litres) 0.9 0.2 0.8e 0.3 0.3Direct carbon dioxide (CO2)
f (million tonnes (Mte)) 57.0 60.4 60.2g 57.7 56.4Direct methanef (Mte) 0.21 0.22 0.22g 0.20 0.17Direct greenhouse gas (GHG)f (Mte CO2 equivalent (CO2e)) 61.4 65.0 64.9g 61.8 59.8Indirect carbon dioxide (CO2)
h (Mte) 9.2 9.6 10g 9.0 8.4Customer emissionsi (MteCO2) 530 554 573 539 517Flaring (Upstream) (thousand tonnes (kte) of hydrocarbons) 1,718 2,149 1,671g 1,835 1,548Environmental expenditurej ($ million)k 2,520 2,483 18,400j 8,520 7,219
People l 2008 2009 2010 2011 2012Number of employees – groupm 92,000 80,300 79,700 83,400 85,700Number of employees – group leadershipm 583 492 482 516 546Women in group leadershipm (%) 14 14 14 15 17Women at management levelm (%) 22 23 24 25 25People from UK and US racial minorities in group leadershipl (%) 6 6 7 6 6People from beyond the UK and US in group leadershipl (%) 19 21 19 19 22Employee turnover n (%) 15 15 15 14 13OpenTalk cases 927 874 742 796 1,295Dismissals for non-compliance and unethical behaviour 765 524 552 529 424Benefits to employees – including wages, salaries, share-based payments, benefits and pensions ($ million)o
12,280 12,216 11,773 12,327 13,117
Contracts terminated or not renewed due to non-compliance or unethical behaviour 22 30 14 14 6
Performance 2008 2009 2010 2011 2012Total hydrocarbons produced (thousand barrels of oil equivalent (mboe) per day) 3,838 3,998 3,822 3,454 3,331Reserves replacement ratiop (%) 121 129 106 103 77Total refinery throughputs (thousand barrels per day (mb/d)) 2,155 2,287 2,426 2,352 2,354Total petrochemicals productionq (thousand tonnes (kte)) 12,835 12,660 15,594 14,866 14,727Replacement cost profit (loss)r ($ million) 25,593 13,955 (4,914) 23,900 11,993Taxes to governments – comprising income taxes and production taxes paid ($ million) 19,690 10,309 12,071 16,339 15,033Dividends paid to shareholders ($ million) 10,342 10,483 2,627 4,072 5,294Contribution to communitiesa ($ million) 125.6 106.8 115.2 103.7 90.6
Data on our safety, environment, people and performance from 2008 to 2012.a
BP in figures
Cautionary statement BP Sustainability Review 2012 and bp.com/sustainability contain certain forward-looking statements with respect to the financial condition, results of operations and businesses of BP and certain of the plans and objectives of BP with respect to these items. In particular, among other statements, BP’s outlook on global energy trends to 2030 and beyond, are forward looking in nature. By their nature, forward-looking statements involve risks and uncertainties because they relate to events and depend on circumstances that will or may occur in the future. Actual results may differ from those expressed in such statements depending on a variety of factors, including future levels of industry product supply; demand and pricing; operational problems; general economic conditions; political stability and economic growth in relevant areas of the world; OPEC quota restrictions; changes in laws and governmental regulations;
regulatory action; exchange rate fluctuations; development and use of new technology; changes in public expectations and other changes in business conditions; the actions of competitors; natural disasters and adverse weather conditions; wars and acts of terrorism or sabotage; and other factors discussed elsewhere in this document and under ‘Risk factors’ in our Annual Report and Form 20-F 2012 as filed with the US Securities and Exchange Commission (SEC). Material is used within this document to describe issues for voluntary sustainability reporting that are considered to have the potential to significantly affect sustainability performance in the view of the company and/or are expected to be important in the eyes of internal or external stakeholders. Material for the purposes of this document should not, therefore, be read as equating to any use of the word in other BP p.l.c. reporting or filings.
BP Annual Report and Form 20-F 2012 and BP Summary Review 2012 may be downloaded from bp.com/annualreport. No material in this Sustainability Review forms any part of those documents. No part of this Sustainability Review or bp.com/sustainability constitutes, or shall be taken to constitute, an invitation or inducement to invest in BP p.l.c. or any other entity and must not be relied upon in any way in connection with any investment decisions. BP p.l.c. is the parent company of the BP group of companies. Unless otherwise stated, the text does not distinguish between the activities and operations of the parent company and those of its subsidiaries.
Notes to figures
a Quantitative performance indicators have been chosen, with external input, to reflect the most important sustainability issues for BP. Data is reported here only from operations under BP operational control, except for GHG emissions. We use consistent processes that seek to provide acceptable estimates to enable year-to-year comparisons.
b DAFWCF and RIF are the annual frequency per 200,000 hours worked.
c Oil spills are defined as any liquid hydrocarbon release of more than or equal to one barrel (159 litres, equivalent to 42 US gallons).
d Tier 1 process safety events refer to losses of primary containment, from a process, of greatest consequence – causing harm to a member of the workforce or costly damage to equipment, or exceeding defined quantities. This is as defined by the American Petroleum Institute process safety indicator pyramid.
This year we are also disclosing tier 2 process safety events for the first time. These can be found on page 32.
e This data does not include the oil spill volume from the Deepwater Horizon incident. The US government and third parties have announced various estimates of the flow rate or total volume of oil spilled from the Deepwater Horizon incident. The multi-district litigation proceedings pending in New Orleans will address the amount of oil spilled. See BP Annual Report and Form 20-F 2012 page 238 for information about the volume used to determine our estimated liabilities.
f Direct GHG emissions are the physical emissions from operations. Emissions represent all consolidated entities and BP’s share of equity-accounted entities except TNK-BP.
g In 2010, we did not report on GHG emissions or flaring associated with the incident or response. We have since estimated the gross CO2 equivalent emissions from response activities to be approximately 481,000 tonnes. We have estimated the gas flared during the response to be approximately 56,000 tonnes. We have not restated our 2010 numbers since our practice is only to restate historical emissions for material inaccuracies.
h Indirect GHG emissions are a consequence of the import by operations of steam, electricity and heat from third-party sources. Emissions represent all consolidated entities and BP’s share of equity-accounted entities except TNK-BP.
i Based on BP’s total reported production of natural gas, natural gas liquids and refinery throughputs.
j Includes $1,753 million environmental expenditure costs relating to the Gulf of Mexico oil spill.
k Minor amendments have been made to 2011.
l Employees are defined as individuals who have a contract of employment with a BP group entity.
m Employee figures as at 31 December.
n These figures relate to non-retail employees only. In 2012 voluntary turnover (resignations and retirements) was 5%.
o Minor amendments have been made to comparative periods 2010-2011.
p Combined basis of subsidiaries and equity-accounted entities, excluding acquisitions and disposals.
q Petrochemicals production reported within Downstream. Minor amendments have been made to comparative periods.
r Replacement cost profit or loss reflects the replacement cost of supplies. The replacement cost profit or loss for the year is arrived at by excluding from profit inventory holding gains and losses and their associated tax effect. Inventory holding gains and losses represent the difference between the cost of sales calculated using the average cost to BP of supplies acquired during the year and the cost of sales calculated on the first-in first-out method, after adjusting for any changes in provisions where the net realizable value of the inventory is lower than its cost. Inventory holding gains and losses, for this purpose, are calculated for all inventories except for those that are held as a part of a trading position and certain other temporary inventory positions. Replacement cost profit for the group is a non-GAAP measure.
Annual Report and Form 20-F 2012Details of our financial and operating performance in print or online. Publishes March. bp.com/annualreport
Summary Review 2012A summary of our financial and operating performance in print or online. Publishes March. bp.com/summaryreview
Energy Outlook 2030Projections for world energy markets, considering the potential evolution of global economy, population, policy and technology. Publishes January. bp.com/energyoutlook
Sustainability Review 2012A summary of our sustainability reporting or find additional information online. Publishes March. bp.com/sustainability
Financial and Operating Information 2008-2012Five-year financial and operating data in PDF or Excel format. Publishes April. bp.com/financialandoperating
Statistical Review of World Energy 2013An objective review of key global energy trends. Publishes June. bp.com/statisticalreview
Building a stronger, safer BP
Summary Review2012 bp.com/annualreport
BP p.l.c. 2013
Building a stronger, safer BP
Sustainability Review 2012bp.com/sustainability
Included in this report and online
An
nu
al Rep
ort an
d Fo
rm 20-F 2012
Building a stronger, safer BP
Annual Report and Form 20-F 2012bp.com/annualreport
BP Energy Outlook 2030January 2013
BP Statistical Review of World Energy June 2013bp.com/statisticalreview
Reporting onkey globalenergy trends
1 Introduction1 Group chief executive’s introduction2 201X in review
6 Oil6 Reserves8 Production and consumption15 Prices16 Refining18 Trade movements
20 Natural gas15 Prices16 Refining18 Trade movements
20 Coal15 Prices16 Refining
35 Nuclear energy35 Consumption
36 Hydroelectricity36 Consumption
38 Renewable energy38 Other renewable consumption39 Biofuels production
40 Primary energy40 Consumption41 Consumption by fuel
44 Appendicies44 Approximate conversion factors44 Definitions45 More information
2 BP history at a glance
5 Group informationX Financial performanceX Group income statementX Analysis of underlying replacement cost profit and
replacement cost profit before interest and tax and reconciliation to profit for the period
XX Replacement cost profit (loss) before interest and tax by business and geographical area
XX Underlying replacement cost profit before interest and tax by business and geographical area
XX Non-operating items by businessXX Non-operating items by geographical areaXX Fair value accounting effectsXX Total of non-operating items and fair value accounting
effectsXX Gulf of Mexico oil spillXX Sales and other operating revenuesXX Production and similar taxesXX TaxationXX Depreciation, depletion and amortizationXX Group balance sheetXX Operating capital employedXX Property, plant and equipmentXX Analysis of inventories, receivables and payablesXX Group cash flow statementXX Movement in net debtXX Capital expenditure, acquisitions and disposalsXX RatiosXX Employee numbersXX Information for earnings per shareXX BP shareholding informationXX BP share data
35 Group hydrocarbon dataXX Oil and natural gas exploration and production activitiesXX Movements in estimated net proved reservesXX Group production interests – liquidsXX Group production interests – natural gasXX Group production interests – oil and natural gasXX Liquefied natural gas projects
65 Upstream
73 Downstream
83 TNK-BP
87 Other businesses and corporate
90 Miscellaneous terms
92 Further information
93 Reports and publications
Financial and Operating Information 2008-2012bp.com/financialandoperating
This document is part of BP’s corporate reporting suite. We report on our financial and operating performance, sustainability performance and also on global energy trends and projections.
Acknowledgements Design Salterbaxter Typesetting Salterbaxter Printing Pureprint Group Limited, UK,
ISO 14001, FSC® certified and CarbonNeutral®
Photography Shahin Abasaliyev, Stuart Conway, Ben Gibson, Simon Kreitem, Marc Morrison, Chris Moyse, Aaron Tait, Graham Trott
You can order BP’s printed publications, free of charge, from:
US and Canada Precision IR Toll-free: +1 888 301 2505 Fax: +1 804 327 7549 [email protected]
UK and Rest of World BP Distribution Services Tel: +44 (0)870 241 3269 Fax: +44 (0)870 240 5753 [email protected]
FeedbackYour feedback is important to us. You can email the corporate reporting team at [email protected]
You can also telephone +44 (0)20 7496 4000
or write to: Corporate reporting BP p.l.c. 1 St James’s Square London SW1Y 4PD UK
Paper This document is printed on Oxygen paper and board. Oxygen is made using 100% recycled pulp, a larger percentage of which is de-inked. It is manufactured at a mill with ISO 9001 and 14001 accreditation and is FSC® (Forest Stewardship Council) certified. This document has been printed using vegetable inks.
Printed in the UK by Pureprint Group using their and printing technology.
© BP p.l.c. 2013