breakout is an epi-v initiative, delivered by transitions. dynamic financial analysis shai vyakarnam...
TRANSCRIPT

Breakout is an Epi-V initiative, delivered by Transitions.
Dynamic Financial Analysis
Shai Vyakarnam and Simon Pratten
What to Measure?
• Building KPIs• Lead/lag indicators• Business• Liquidity (risk)• Shareholder returns
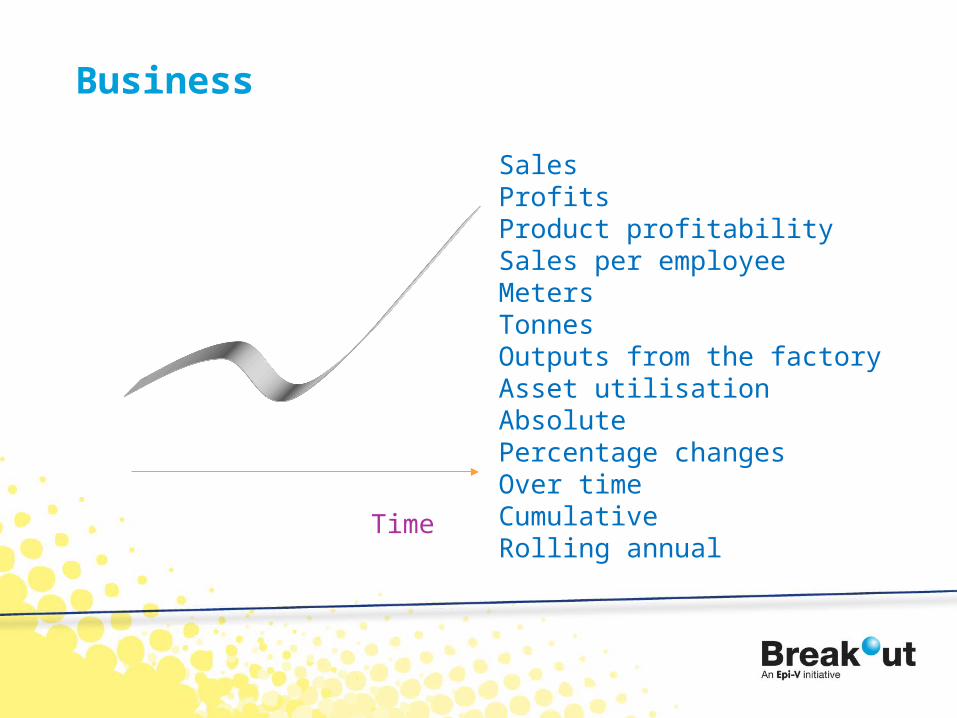
Business
SalesProfitsProduct profitabilitySales per employeeMetersTonnesOutputs from the factoryAsset utilisationAbsolutePercentage changesOver timeCumulativeRolling annual
Time
Shareholders
• Level of profit shared out among shareholders (dividends)
• Value of shares – profits and adjusted for risks and future earnings
• Level of debt against the level of shareholders money injected in the business (gearing)
Liquidity (cash)
• Amount of stock (inventory)
• Amount of money owed by customers (debtors)
• Amount of cash in the bank
• Money you owe to the tax man
• Money owed to suppliers (creditors)
• Level of overdraft
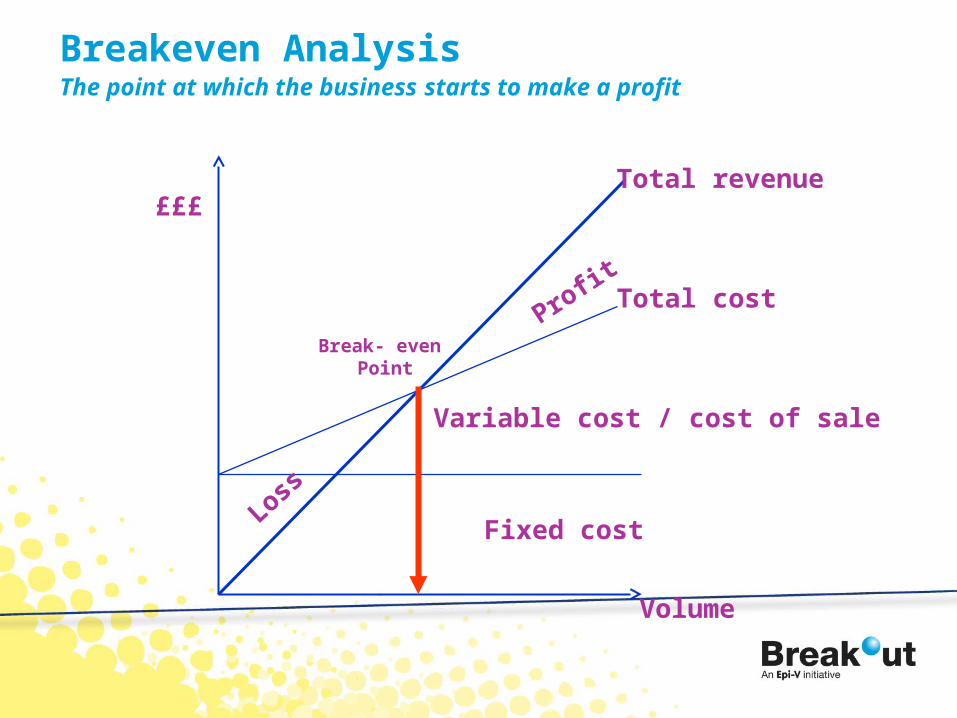
Breakeven AnalysisThe point at which the business starts to make a profit
Volume
Fixed cost
Variable cost / cost of sale
Total cost
Total revenue
Loss
Profit
£££
Break- even Point
How to use Breakeven
• Dynamic
• Calculate what-if
• Help with decisions
• Need to have gross profit figure
• Forces the right disciplines into business
• Most people can understand it in the business!
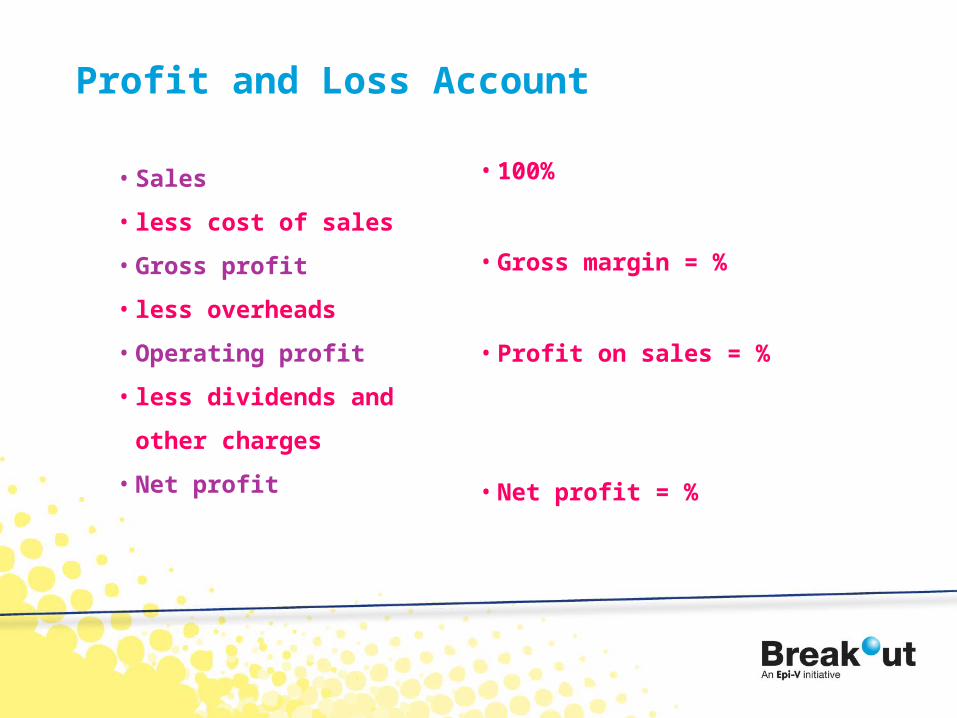
Profit and Loss Account
• Sales
• less cost of sales
• Gross profit
• less overheads
• Operating profit
• less dividends and
other charges
• Net profit
• 100%
• Gross margin = %
• Profit on sales = %
• Net profit = %

Gross (Profit) Margin
• The gap between sales and variable costs
• The real income of the business
• Expressed as a percentage of sales (Gross Margin %)
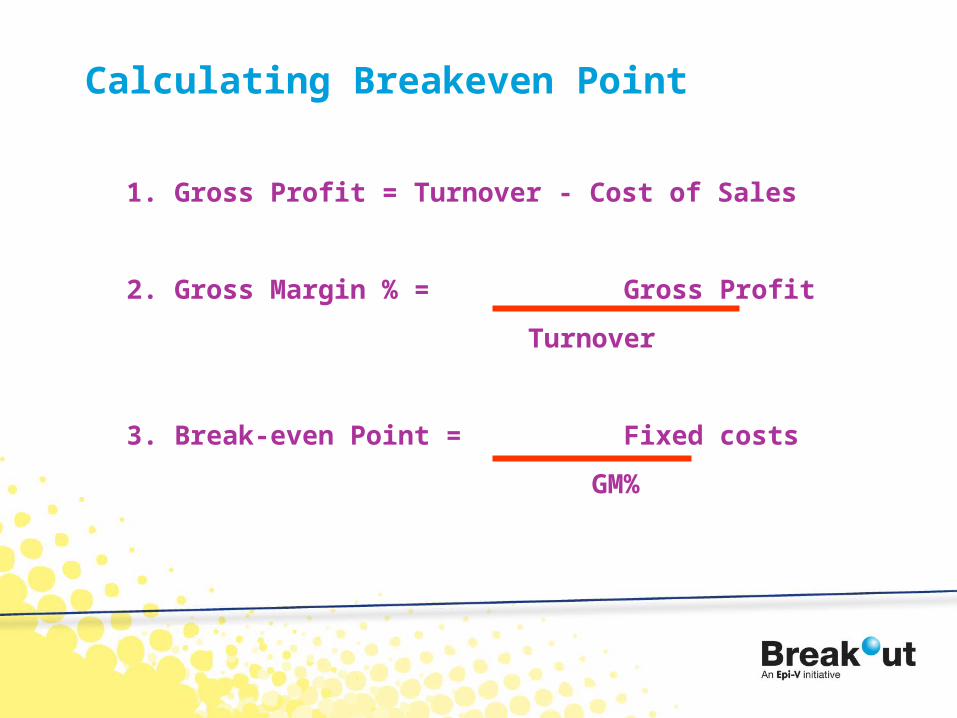
Calculating Breakeven Point
1. Gross Profit = Turnover - Cost of Sales
2. Gross Margin % = Gross Profit
Turnover
3. Break-even Point = Fixed costs
GM%
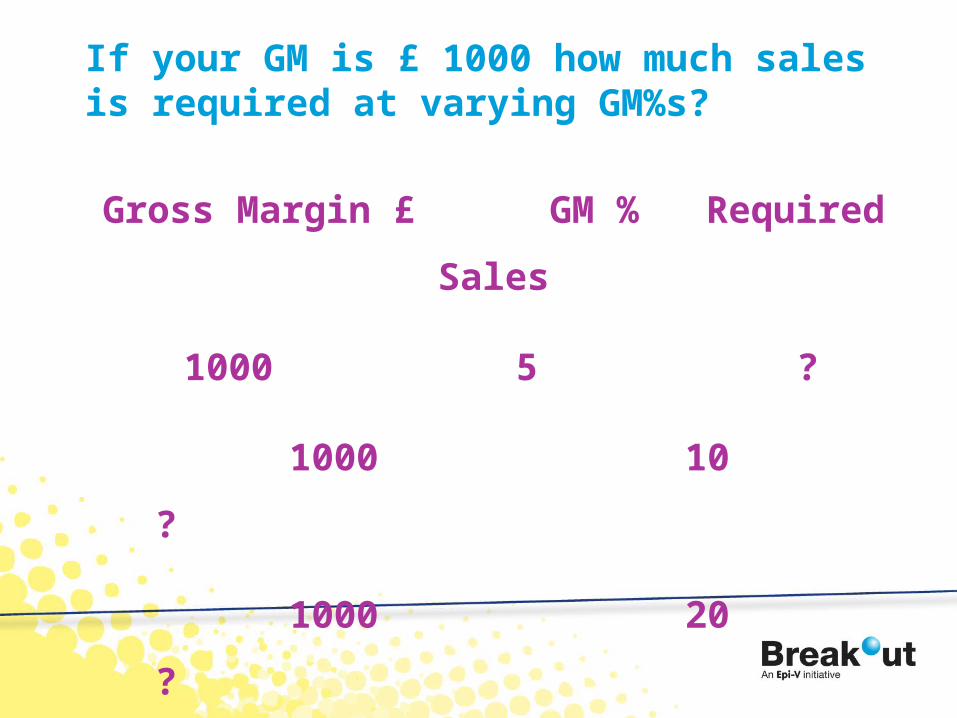
If your GM is £ 1000 how much sales is required at varying GM%s?
Gross Margin £ GM % Required Sales
1000 5 ?
1000 10 ?
1000 20 ?
1000 40 ?
Your Accounts
Calculate the Following
• Gross margin %
• Breakeven point (sales)
• Breakeven sales as % of actual sales
• Margin of safety (gap between breakeven and actual sales as %)
• Dynamic analysis - hours/units
Deliberate Movement of Break Even Point 1
• Note your GP%
• Now - increase sales (prices) 1%
• Reduce cost of sales by 1%
• What is the new GP%?
• What is the new BEP?
Movement of Break Even Point 2
• Reduce your fixed costs by 1%• Having increased sales price and reduced
both cost of sales and fixed costs what is the new NET PROFIT?
• What is the % increase in net profit?• You have just seen the magic of 1%• Suppose you can change these by more
than 1%?!
Controlling costs
• Building on the impact of flexing your breakeven point
• have a first cut at shedding costs
Cash flow
• Short term future plans and the impact on cash flow estimates
• Activity Ratios: How well do you manage your cash in the business?
Gearing and Capital Structure
• How much ‘cover’ is there in the business to meet the needs of the bank?
And
• Is there enough equity in the business to ensure the bank feels comfortable with the amount being lent?
Solvency and Liquidity
• Is there enough ‘liquidity’ in the business to meet day to day obligations?
• Are the assets of the business really being ‘sweated’?
• Can the business demonstrate that the ration of current assets and inventory to short term creditors is strong enough?
Conclusions
• What have been the key take home messages for you?
• What needs to be changed?
• What are your action points and how will you prioritise them?