bridging course - week 2 - amazon web services
TRANSCRIPT
Page 1 of 34
A-level Biology
Bridging Course - Week 2
Page 2 of 34
St Mary’s Catholic School A-level Biology Bridging Course
This bridging course will provide you with a mixture of information about A-level Biology, and what to expect from the course, as well as key work to complete. Students who are expecting to study Biology at A-level, and are likely to meet the entry requirements, must complete the bridging course fully and thoroughly, to the best of their ability. You should complete all work digitally if possible, so it is available to print and place in your file at the start of the course. You will submit it to your teacher in September. All of the work will be reviewed and selected work will be assessed, and you will be given feedback on it. This work will be signalled to you. If you do not have access to the internet, please contact the school and appropriate resources will be sent to you. If you are thinking about studying Biology at A-level you should attempt this work to see whether or not you think studying a subject like this is right for you. If you later decide to study Biology, you must ensure you complete this work in full. This work should be completed after you have read and completed the Study Skills work that all of Year 12 should complete.
Entry Requirements for Studying A-level Biology?
▪ Students who are expected to achieve at least a grade 7 in GCSE Biology Separate Science or a grade 7 in
Combined Science.
▪ Students who have enjoyed their GCSE Biology course, and who enjoy extra reading and research.
▪ Students should be competent in both Mathematics and Chemistry.
What to expect from A-level Biology.
The study of A Level Biology compliments a large number of university courses such as Medicine, Dentistry, Biomedical Science, Genetic Engineering, Environmental Science along with many others. It can also provide academic credentials for unrelated courses such as Law and Architecture. The course covers both animal, plant and environmental Biology, which will be taught through a combination of theory and practical work. This is a demanding A level, and students will need to be competent in both Maths and Chemistry.
Page 3 of 34
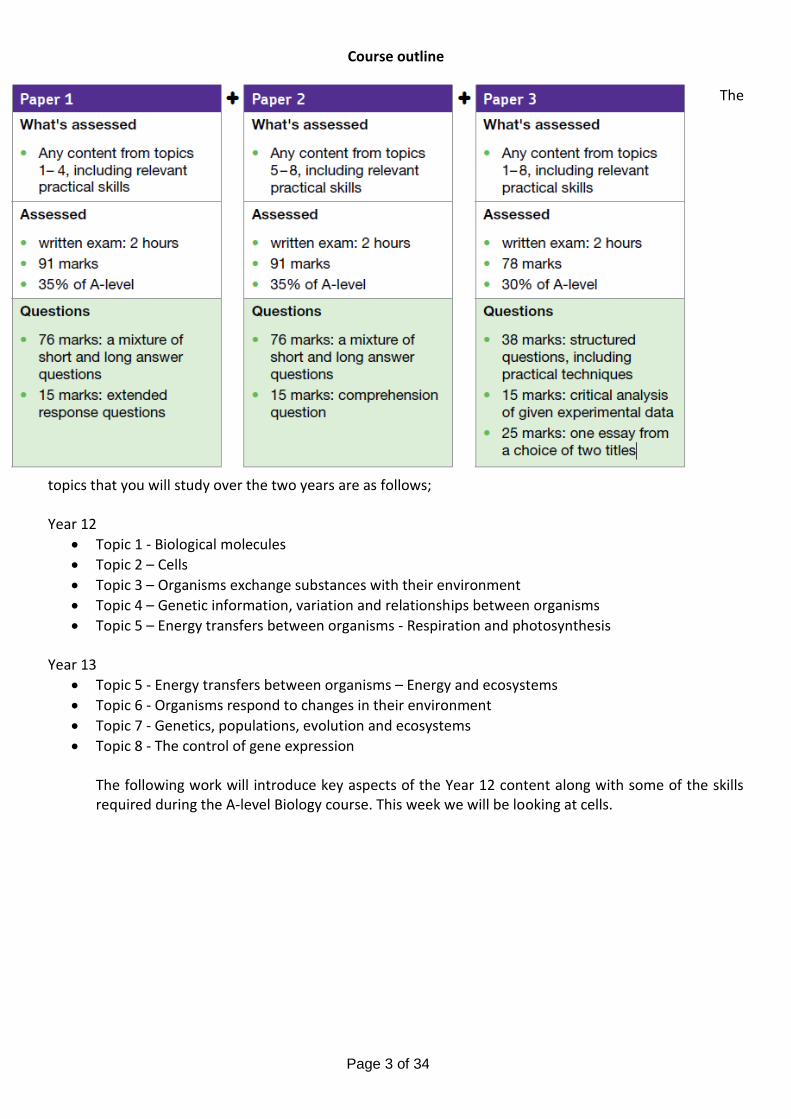
Course outline
The
topics that you will study over the two years are as follows; Year 12
• Topic 1 - Biological molecules
• Topic 2 – Cells
• Topic 3 – Organisms exchange substances with their environment
• Topic 4 – Genetic information, variation and relationships between organisms
• Topic 5 – Energy transfers between organisms - Respiration and photosynthesis
Year 13
• Topic 5 - Energy transfers between organisms – Energy and ecosystems
• Topic 6 - Organisms respond to changes in their environment
• Topic 7 - Genetics, populations, evolution and ecosystems
• Topic 8 - The control of gene expression The following work will introduce key aspects of the Year 12 content along with some of the skills required during the A-level Biology course. This week we will be looking at cells.
Page 4 of 34
Recap Task Last week we looked at the structure of the cell, and ways that this structure can be investigated.
As we move into weeks 2, 3 and 4 try to notice the common link of how proteins are vital to the
functioning of living things, how their structure is determined, and how this structure relates to
their function.
To recap and assess your knowledge answer the following questions.
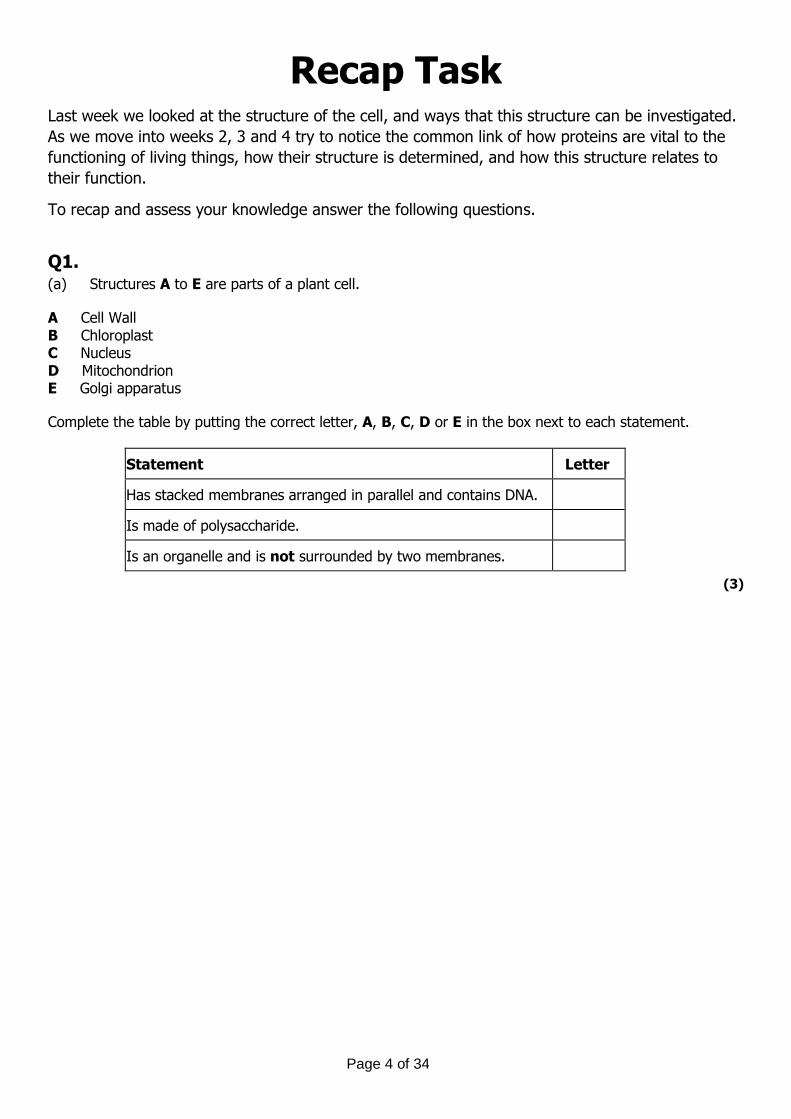
Q1. (a) Structures A to E are parts of a plant cell.
A Cell Wall B Chloroplast C Nucleus D Mitochondrion E Golgi apparatus
Complete the table by putting the correct letter, A, B, C, D or E in the box next to each statement.
Statement Letter
Has stacked membranes arranged in parallel and contains DNA.
Is made of polysaccharide.
Is an organelle and is not surrounded by two membranes.
(3)
Page 5 of 34
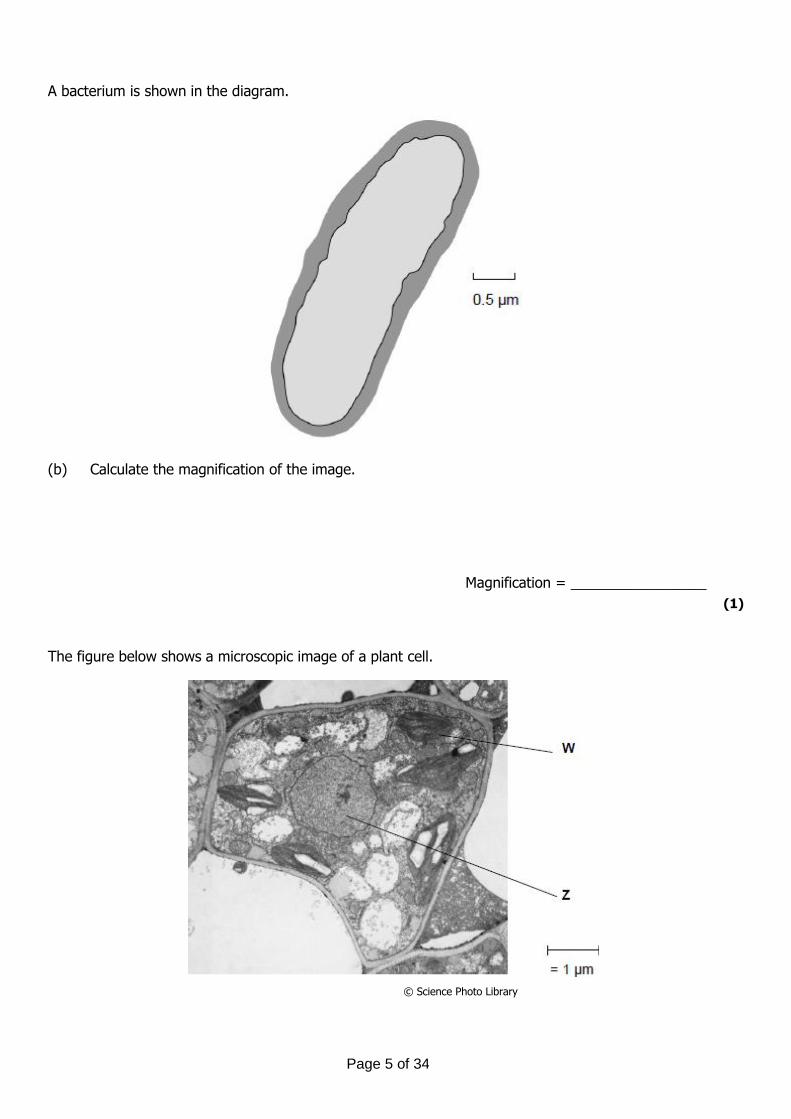
A bacterium is shown in the diagram.
(b) Calculate the magnification of the image.
Magnification = _________________
(1)
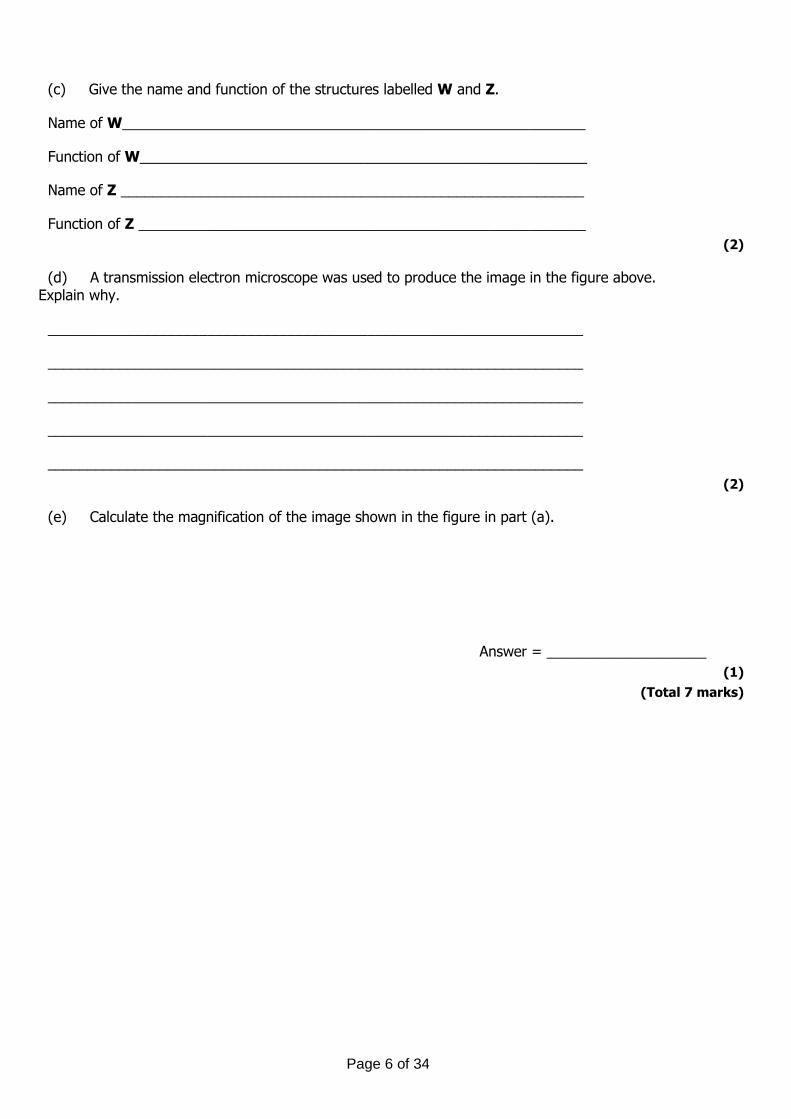
The figure below shows a microscopic image of a plant cell.
© Science Photo Library
Page 6 of 34
(c) Give the name and function of the structures labelled W and Z.
Name of W__________________________________________________________
Function of W________________________________________________________
Name of Z __________________________________________________________
Function of Z ________________________________________________________
(2)
(d) A transmission electron microscope was used to produce the image in the figure above. Explain why.
___________________________________________________________________
___________________________________________________________________
___________________________________________________________________
___________________________________________________________________
___________________________________________________________________
(2)
(e) Calculate the magnification of the image shown in the figure in part (a).
Answer = ____________________
(1)
(Total 7 marks)
Page 7 of 34
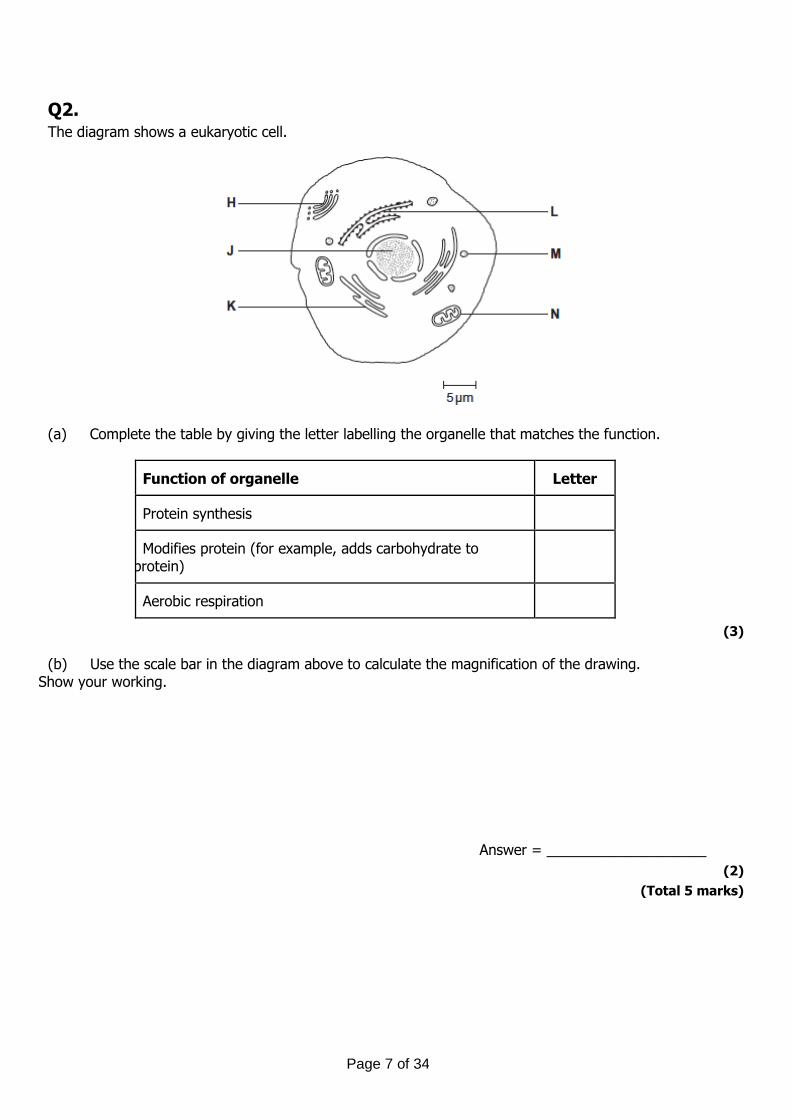
Q2. The diagram shows a eukaryotic cell.
(a) Complete the table by giving the letter labelling the organelle that matches the function.
Function of organelle Letter
Protein synthesis
Modifies protein (for example, adds carbohydrate to protein)
Aerobic respiration
(3)
(b) Use the scale bar in the diagram above to calculate the magnification of the drawing. Show your working.
Answer = ____________________
(2)
(Total 5 marks)
Page 8 of 34
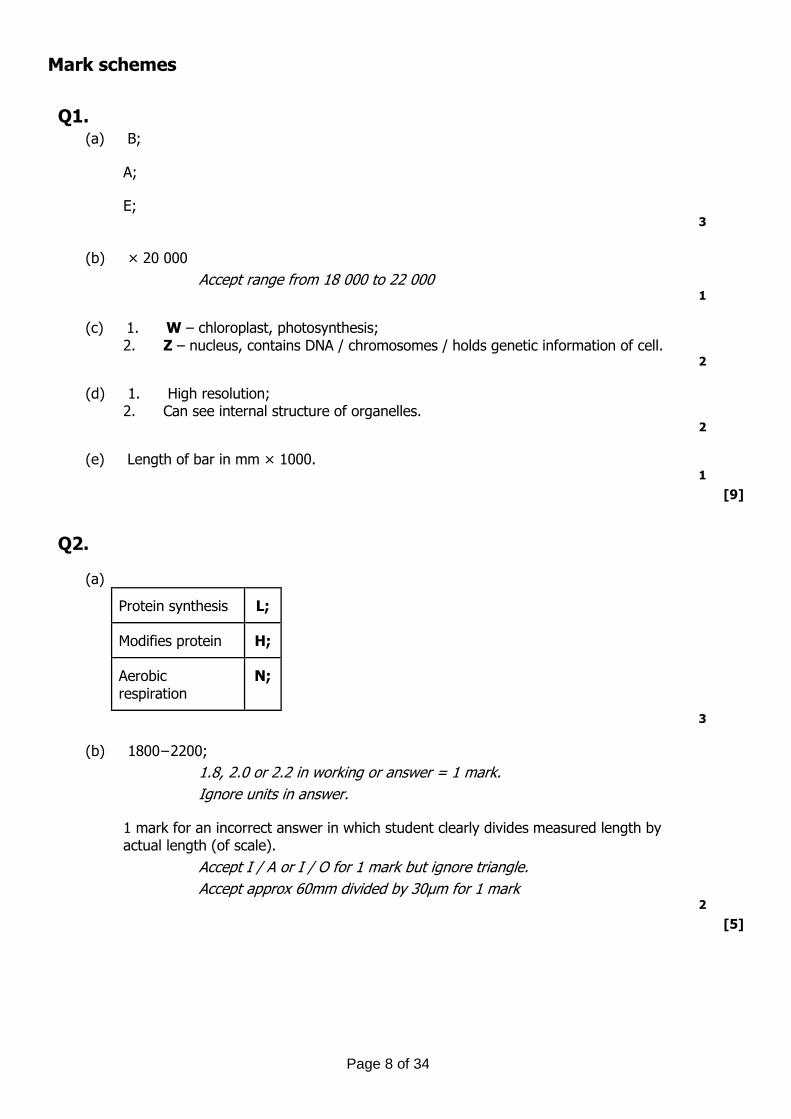
Mark schemes
Q1. (a) B;
A;
E; 3
(b) × 20 000
Accept range from 18 000 to 22 000 1
(c) 1. W – chloroplast, photosynthesis; 2. Z – nucleus, contains DNA / chromosomes / holds genetic information of cell.
2
(d) 1. High resolution; 2. Can see internal structure of organelles.
2
(e) Length of bar in mm × 1000. 1
[9]
Q2.
(a)
Protein synthesis L;
Modifies protein H;
Aerobic respiration
N;
3
(b) 1800−2200;
1.8, 2.0 or 2.2 in working or answer = 1 mark.
Ignore units in answer.
1 mark for an incorrect answer in which student clearly divides measured length by actual length (of scale).
Accept I / A or I / O for 1 mark but ignore triangle.
Accept approx 60mm divided by 30μm for 1 mark 2
[5]
Page 9 of 34
Biological Molecules • Students will recap their previous knowledge of carbohydrates, lipids and proteins. • Students will produce structural diagrams of the monomer of each type of molecule. • Students will investigate the structure of proteins in detail. • Students will analyse data on the rate of enzyme catalysed reactions.
1. Monomers and polymers
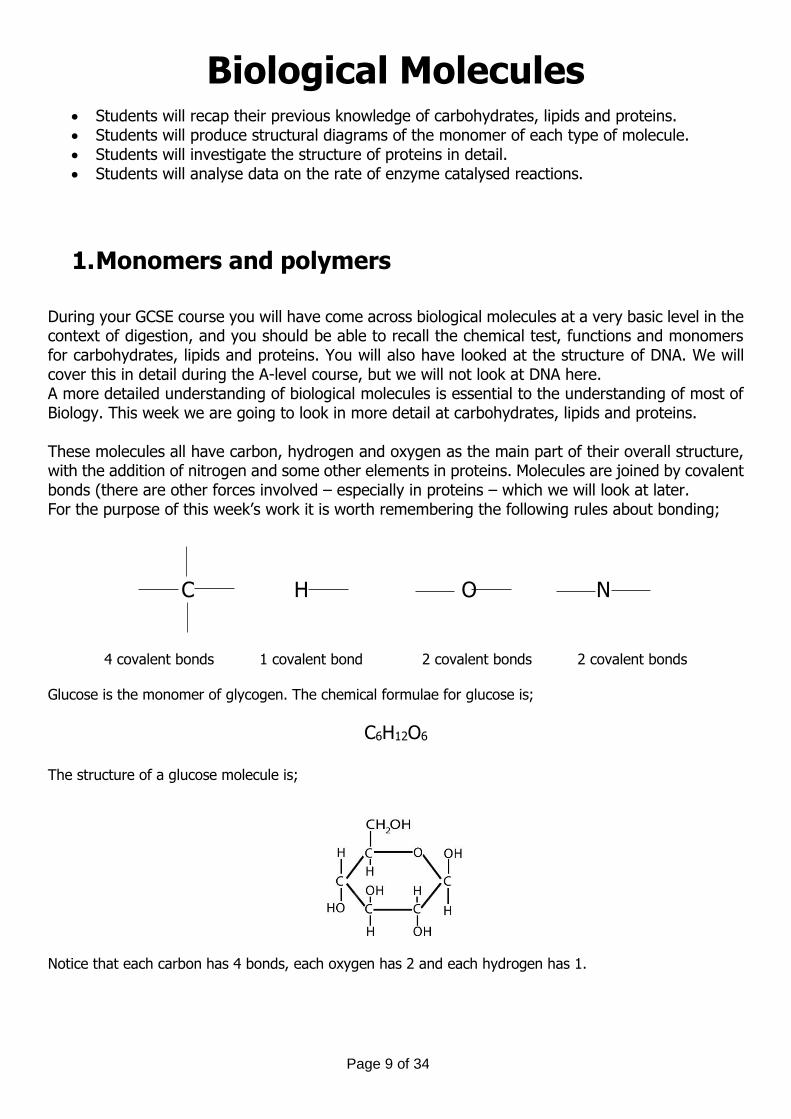
During your GCSE course you will have come across biological molecules at a very basic level in the context of digestion, and you should be able to recall the chemical test, functions and monomers for carbohydrates, lipids and proteins. You will also have looked at the structure of DNA. We will cover this in detail during the A-level course, but we will not look at DNA here. A more detailed understanding of biological molecules is essential to the understanding of most of Biology. This week we are going to look in more detail at carbohydrates, lipids and proteins. These molecules all have carbon, hydrogen and oxygen as the main part of their overall structure, with the addition of nitrogen and some other elements in proteins. Molecules are joined by covalent bonds (there are other forces involved – especially in proteins – which we will look at later. For the purpose of this week’s work it is worth remembering the following rules about bonding;
C H O N
4 covalent bonds 1 covalent bond 2 covalent bonds 2 covalent bonds
Glucose is the monomer of glycogen. The chemical formulae for glucose is;
C6H12O6
The structure of a glucose molecule is;
Notice that each carbon has 4 bonds, each oxygen has 2 and each hydrogen has 1.
Page 10 of 34
Watch the following videos
https://www.youtube.com/watch?v=_zm_DyD6FJ0 https://www.youtube.com/watch?v=VGHD9e3yRIU
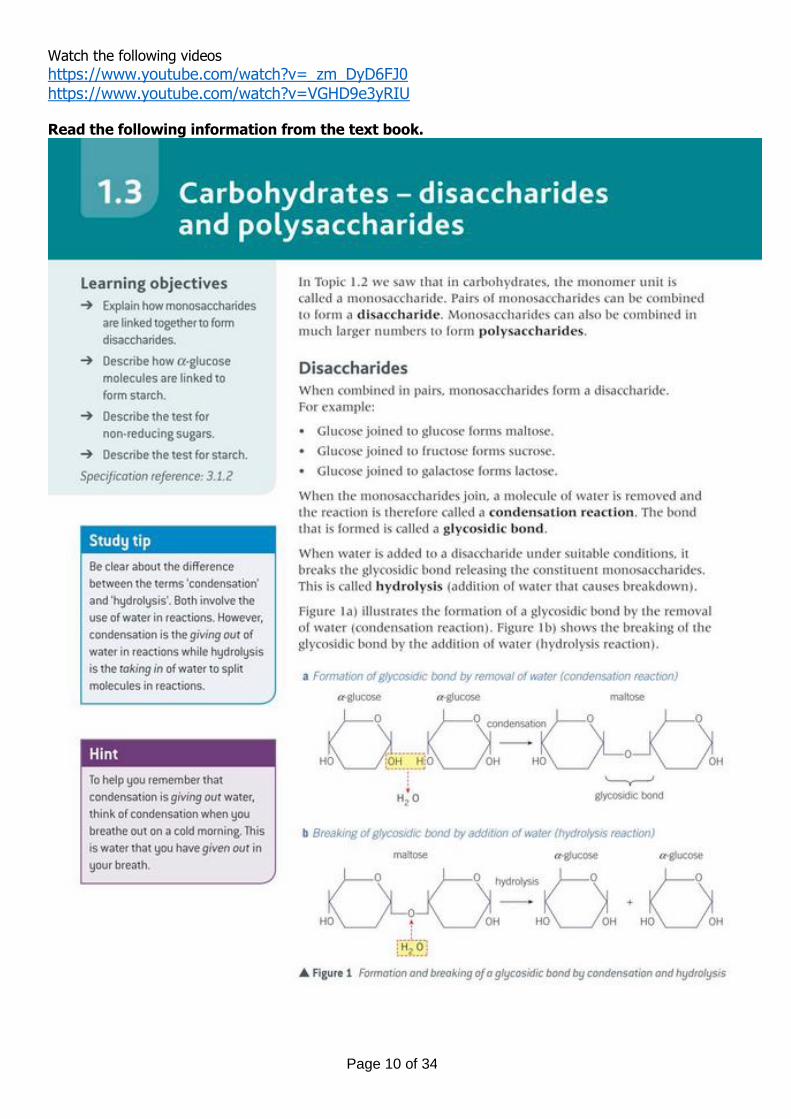
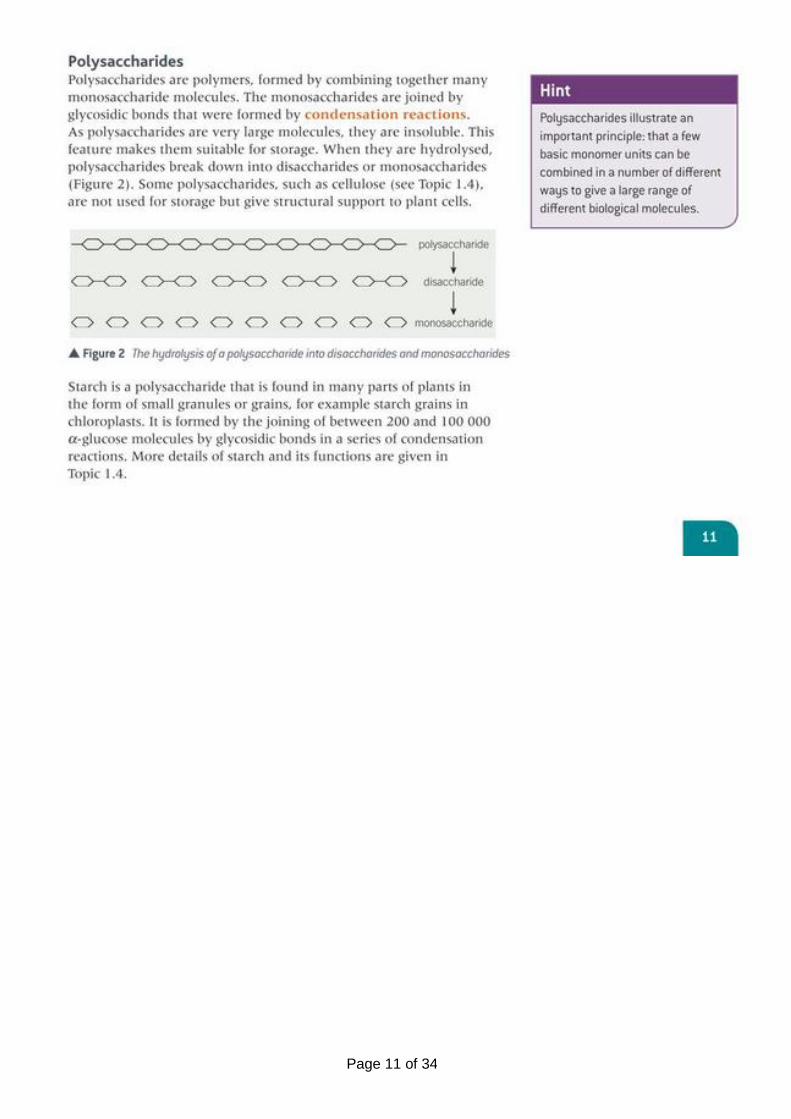
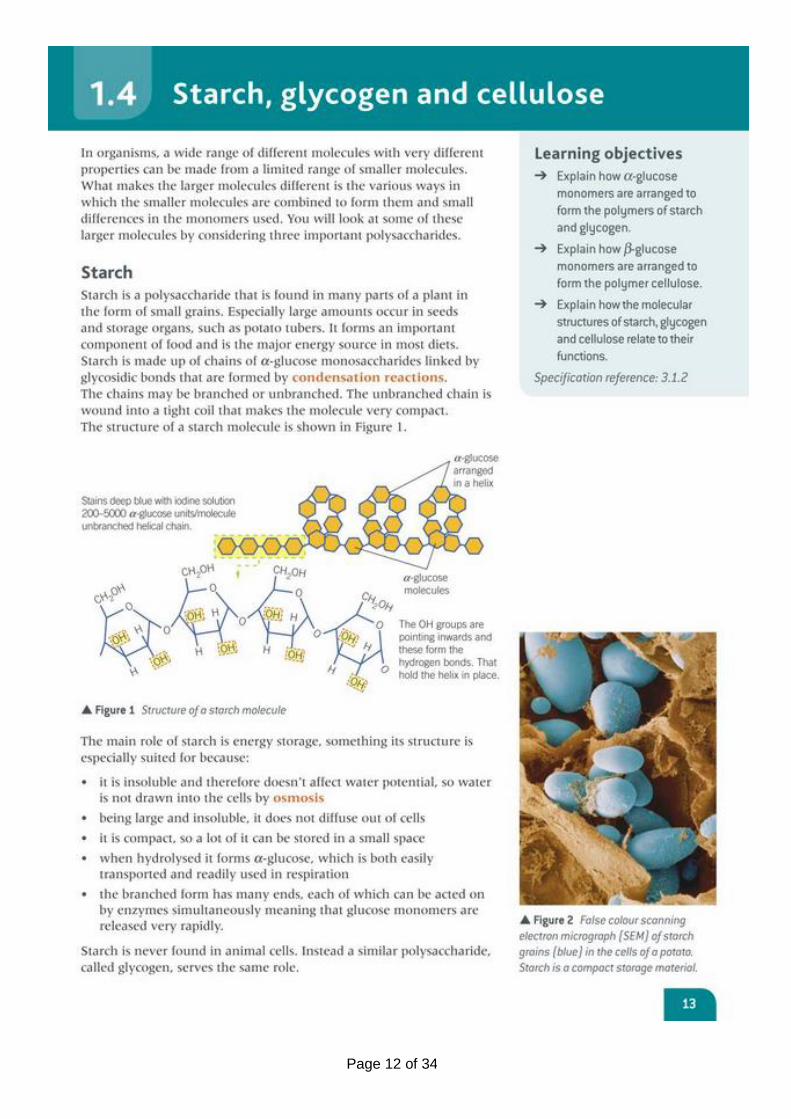
Read the following information from the text book.
Page 11 of 34
Page 12 of 34
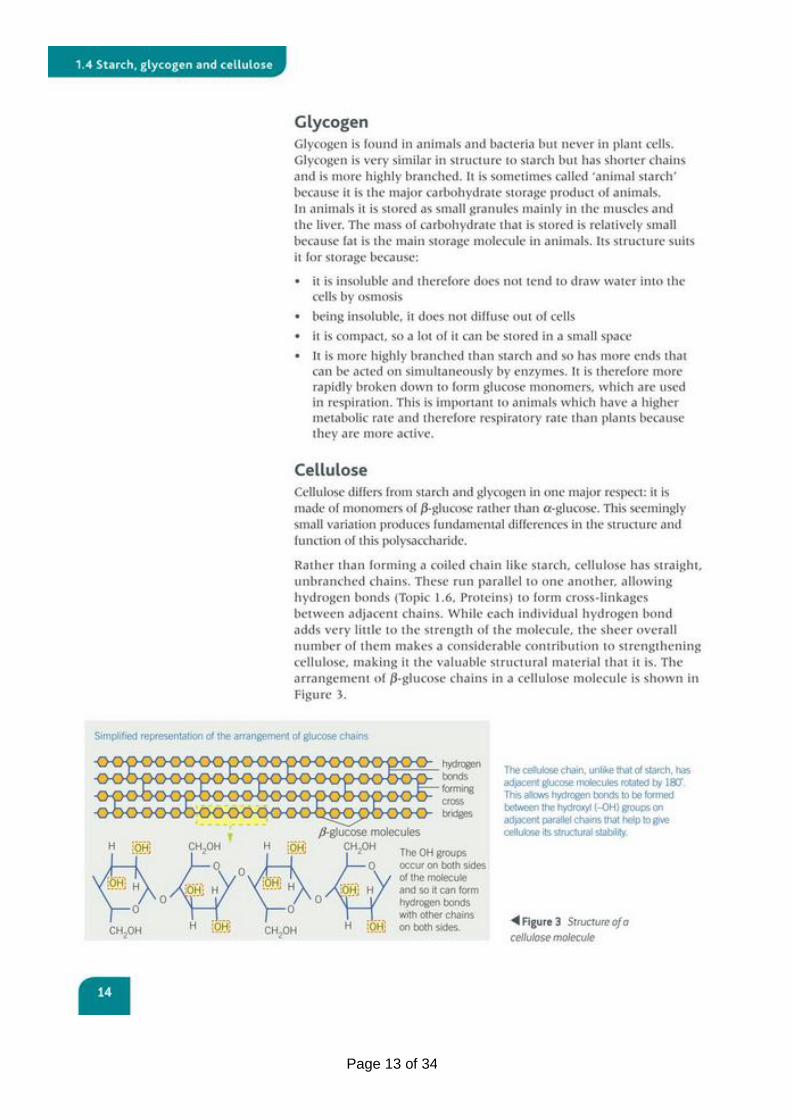
Page 13 of 34
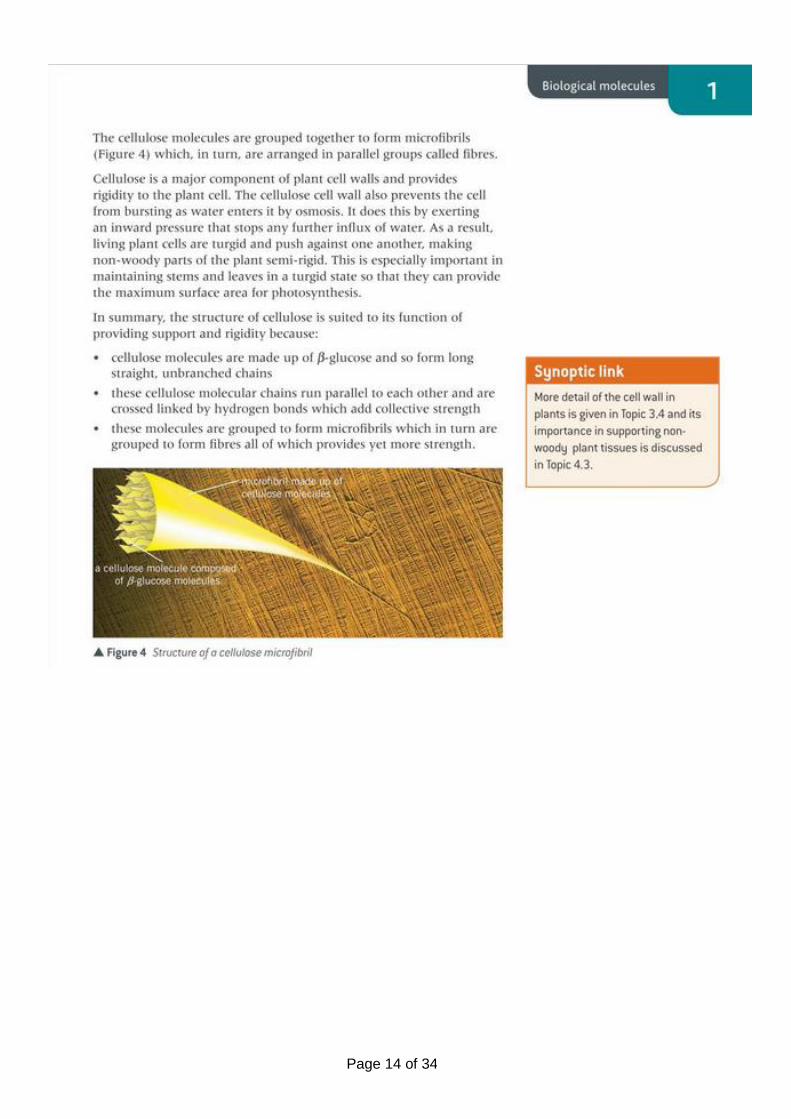
Page 14 of 34
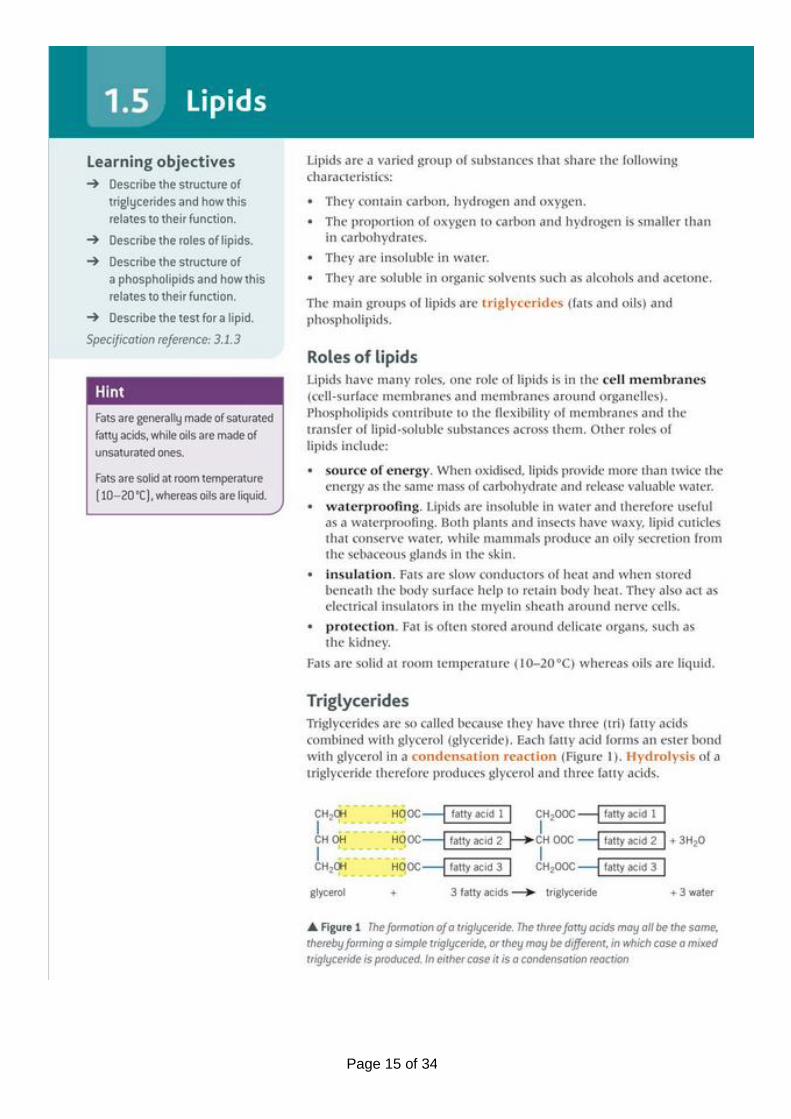
Page 15 of 34
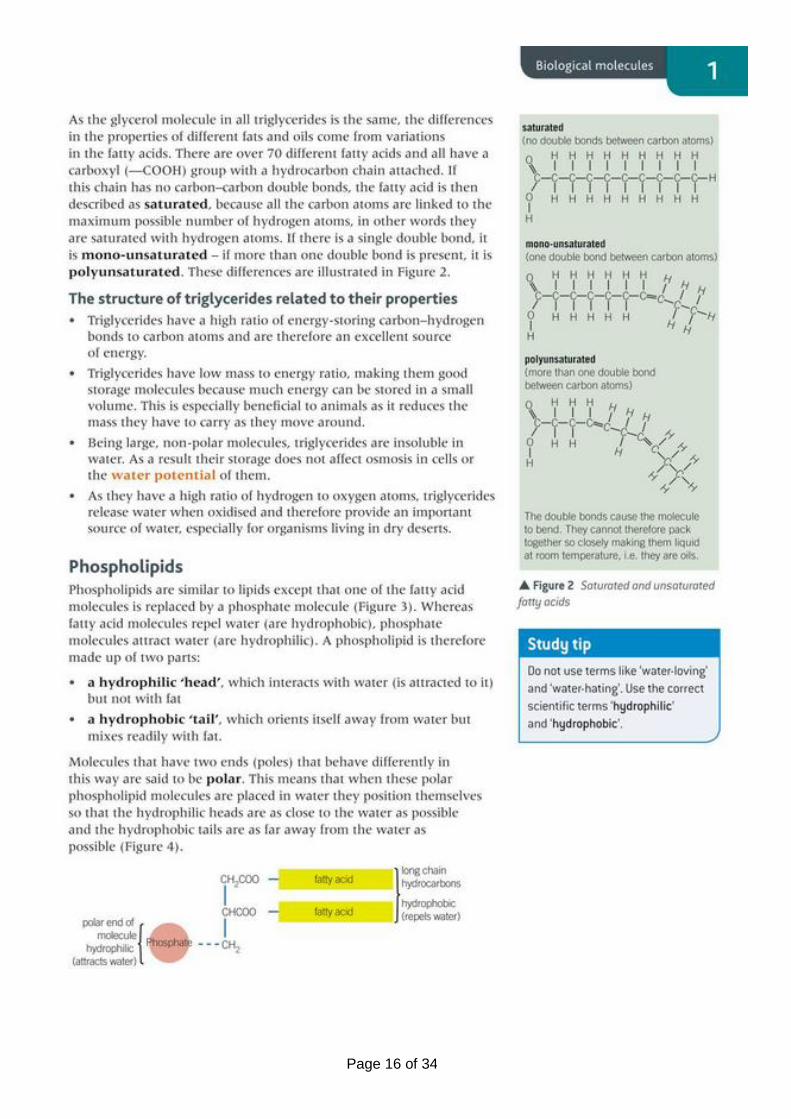
Page 16 of 34
Page 17 of 34
Carbohydrates 1. The monomers that make up all carbohydrates are glucose, fructose, and galactose.
These are known a monosaccharides. Draw/copy and paste a diagram to show the structure of each of these monomers.
2. Disaccharides are made from 2 monosaccharides joined together. These include sucrose, maltose and lactose. Draw a diagram to show the composition of each of these monosaccharides. You do not need to draw out each disaccharide in detail – just use a shape to represent each one.
3. There are a number of polysaccharides, which are made from chains of monosaccharides. Thise include starch, glycogen and cellulose. Draw a diagram to show the composition of each of these polysaccharides. You do not need to draw out each disaccharide in detail – just use a shape to represent each one.
Lipids There are a number of different lipids, but we are only going to look at triglycerides.
1. The monomers that make up a triglyceride are glycerol and fatty acids. Draw a diagram to show the structure of each of these. Include saturated and unsaturated fatty acids.
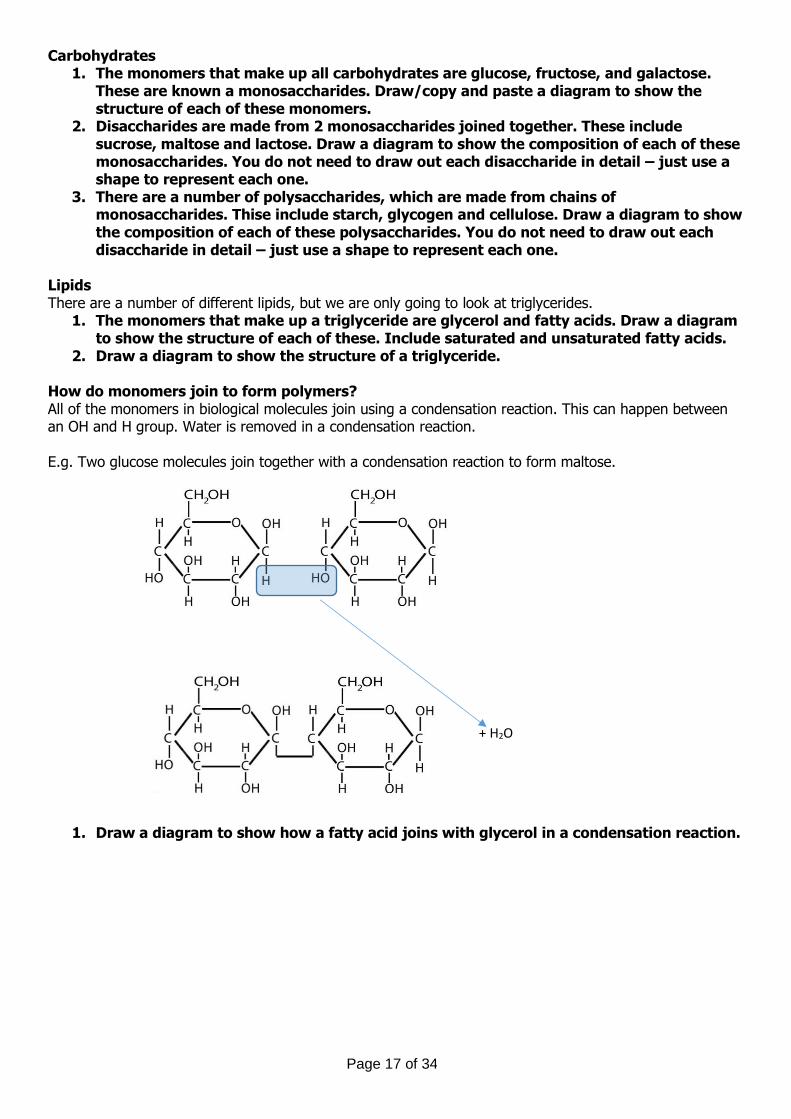
2. Draw a diagram to show the structure of a triglyceride. How do monomers join to form polymers? All of the monomers in biological molecules join using a condensation reaction. This can happen between an OH and H group. Water is removed in a condensation reaction. E.g. Two glucose molecules join together with a condensation reaction to form maltose.
1. Draw a diagram to show how a fatty acid joins with glycerol in a condensation reaction.
+ H2O
Page 18 of 34
2. Proteins
Watch the following video https://www.youtube.com/watch?v=2Jgb_DpaQhM
Read the following information from the text book.
Page 19 of 34
Page 20 of 34
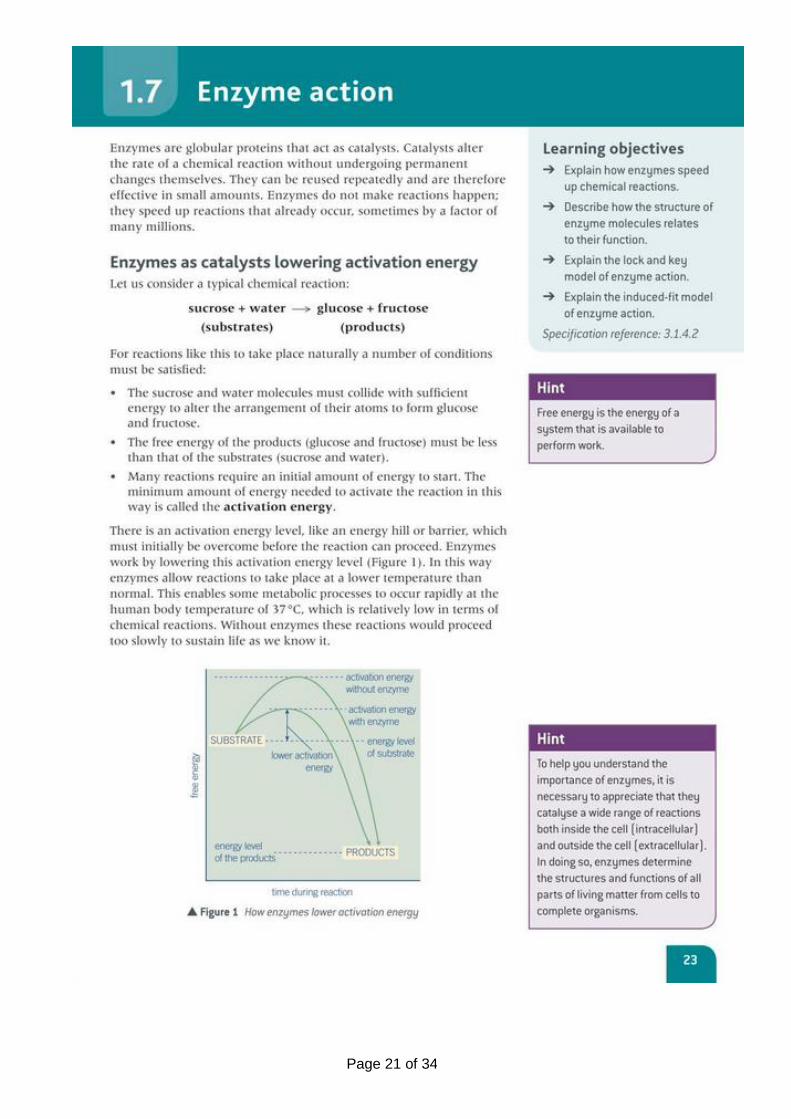
Page 21 of 34
Page 22 of 34
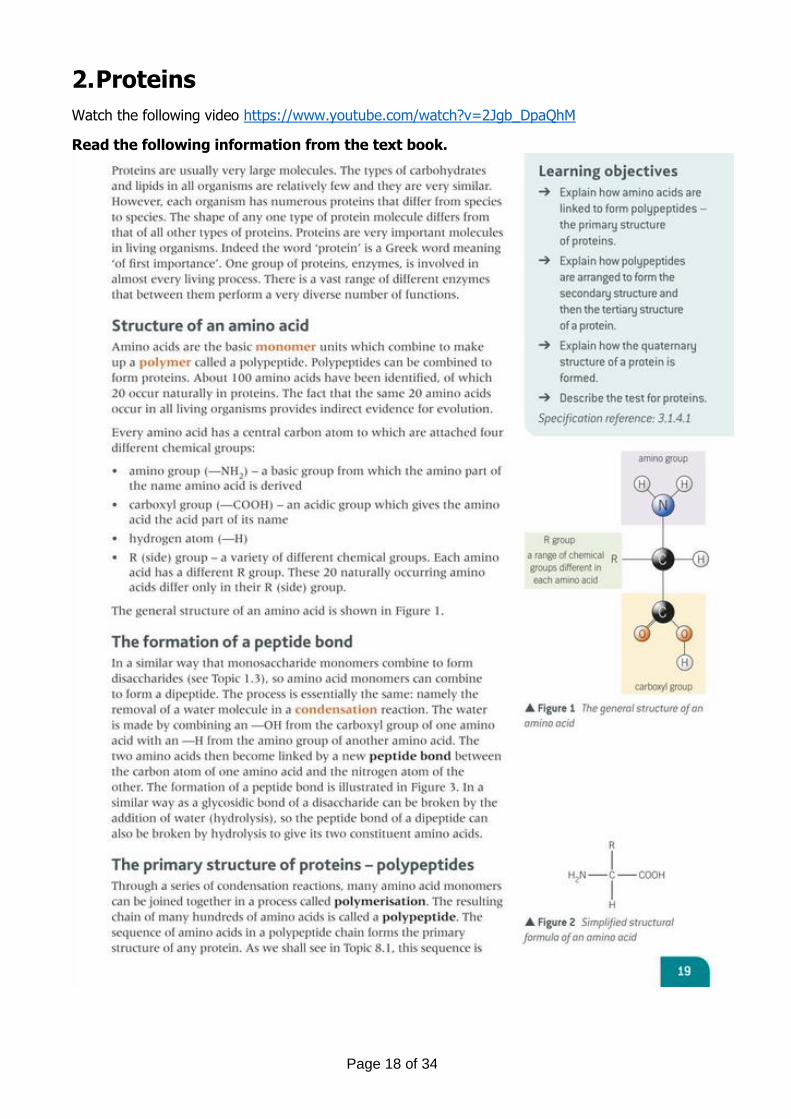
Amino Acids
Amino acids are the monomers of proteins.
1. Draw a diagram showing the general structure of an amino acid.
2. There 20 different types of amino acid that make up proteins in humans. Explain what
makes these 20 amino acids different.
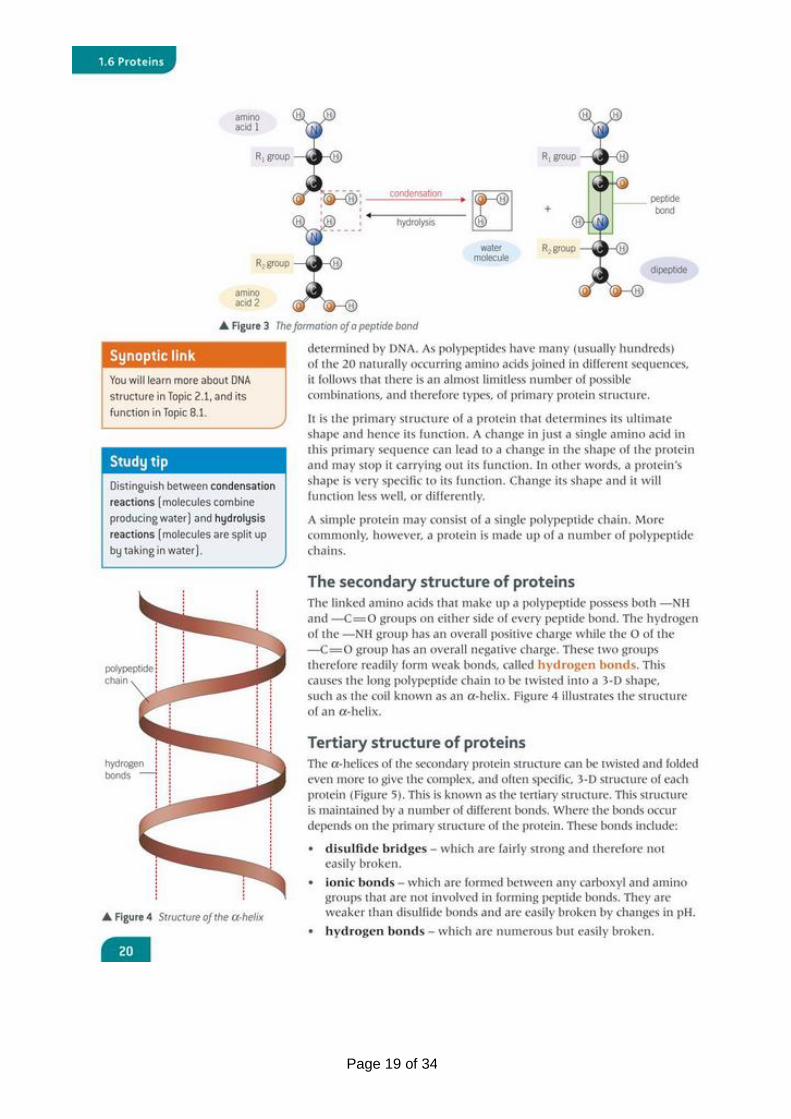
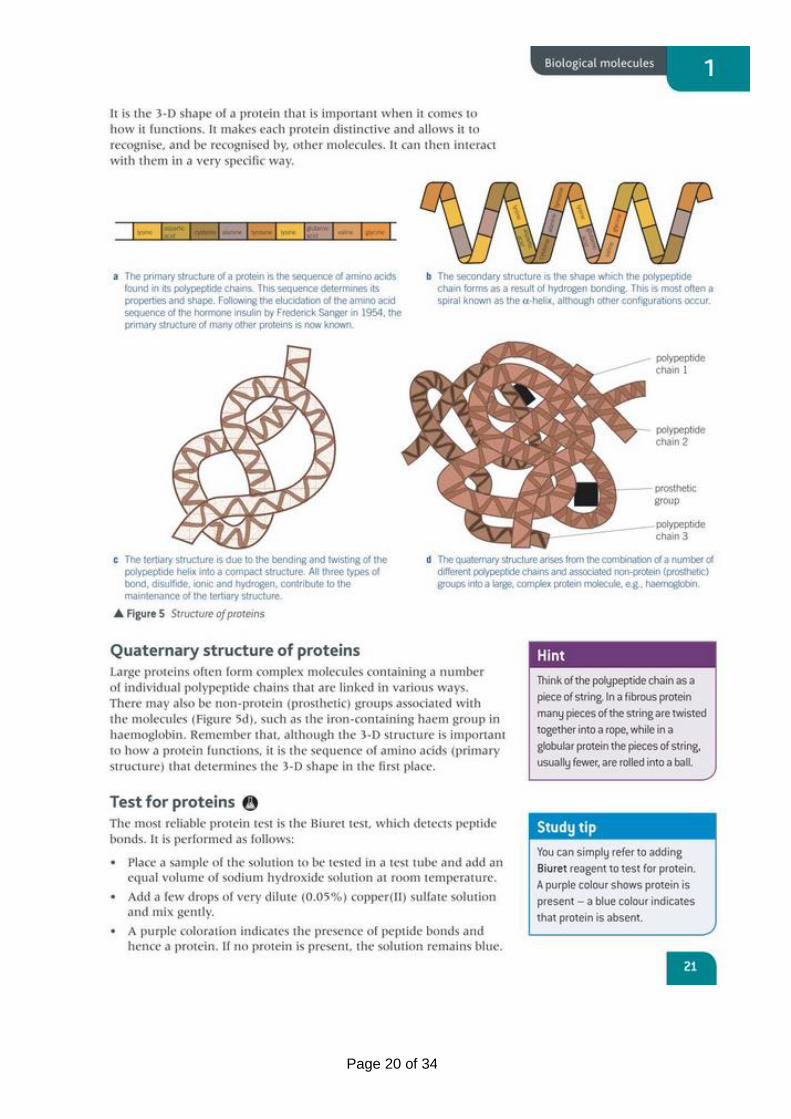
Protein structure
Proteins are built by ribosomes. The ribosomes read the sequence of RNA nucleotides, and this
determines the sequence of amino acids in the protein. The sequence or order of amino acids in the
protein is known as the primary structure. The protein is then further folded into the secondary and
then tertiary structure. This creates a very specific 3D shape. This shape allows the protein to perform
its function. If the shape of the protein changes then the protein will not be able to function properly.
1. Create a summary table showing the differences between primary, secondary and
tertiary protein structure.
Some proteins combine to form a protein with more than one chain of amino acids. This is known as a
quaternary structure. Examples of quaternary proteins are haemoglobin, antibodies, chlorophyll and
collagen. We will look at these in more detail during the A-level course.
Page 23 of 34
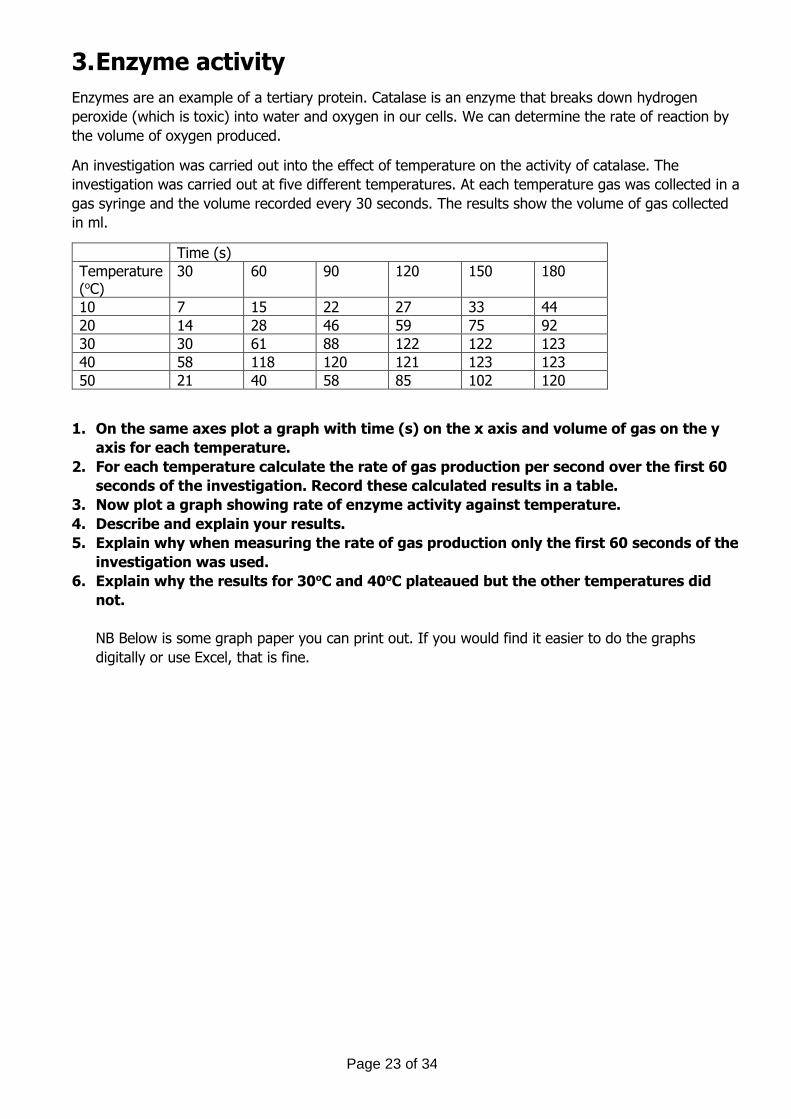
3. Enzyme activity
Enzymes are an example of a tertiary protein. Catalase is an enzyme that breaks down hydrogen
peroxide (which is toxic) into water and oxygen in our cells. We can determine the rate of reaction by
the volume of oxygen produced.
An investigation was carried out into the effect of temperature on the activity of catalase. The
investigation was carried out at five different temperatures. At each temperature gas was collected in a
gas syringe and the volume recorded every 30 seconds. The results show the volume of gas collected
in ml.
Time (s)
Temperature (oC)
30 60 90 120 150 180
10 7 15 22 27 33 44
20 14 28 46 59 75 92
30 30 61 88 122 122 123
40 58 118 120 121 123 123
50 21 40 58 85 102 120
1. On the same axes plot a graph with time (s) on the x axis and volume of gas on the y
axis for each temperature.
2. For each temperature calculate the rate of gas production per second over the first 60
seconds of the investigation. Record these calculated results in a table.
3. Now plot a graph showing rate of enzyme activity against temperature.
4. Describe and explain your results.
5. Explain why when measuring the rate of gas production only the first 60 seconds of the
investigation was used.
6. Explain why the results for 30oC and 40oC plateaued but the other temperatures did
not.
NB Below is some graph paper you can print out. If you would find it easier to do the graphs
digitally or use Excel, that is fine.

Page 24 of 34
Page 25 of 34
4. Exam Questions
The answers for Q1, Q3, Q4 and Q5 are at the end of this document.
Q2 will be marked by your teacher and feedback given.
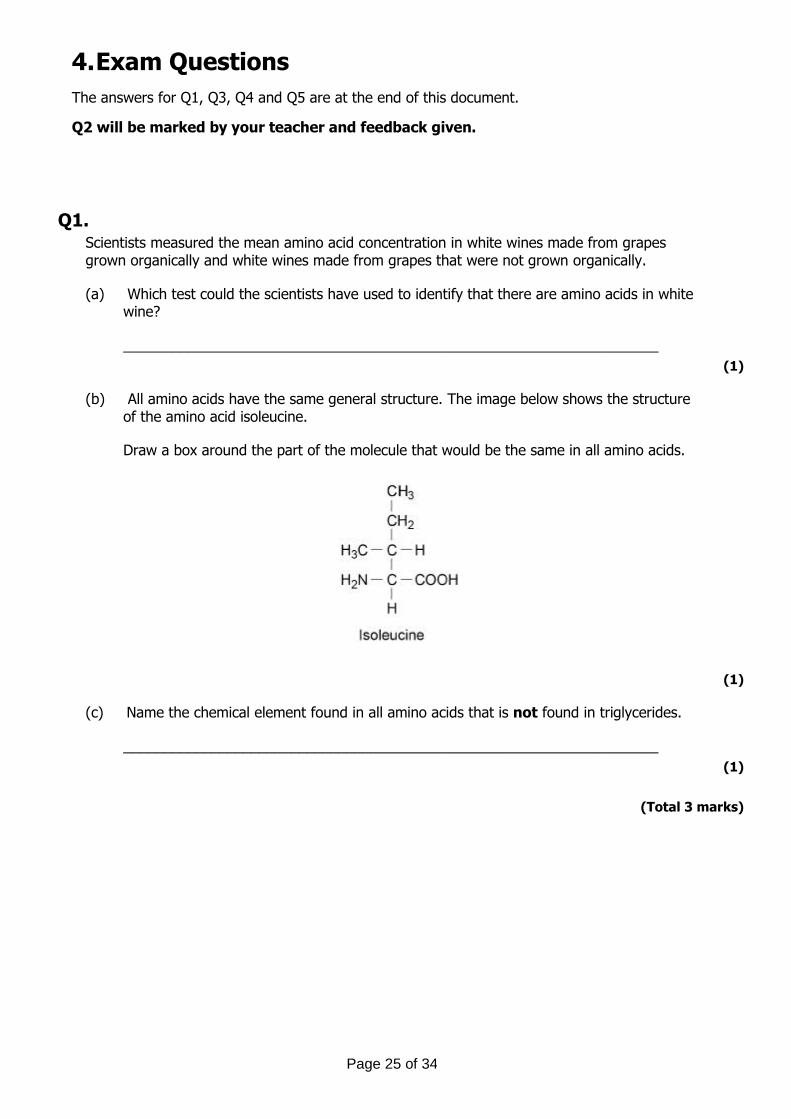
Q1. Scientists measured the mean amino acid concentration in white wines made from grapes grown organically and white wines made from grapes that were not grown organically.
(a) Which test could the scientists have used to identify that there are amino acids in white wine?
___________________________________________________________________
(1)
(b) All amino acids have the same general structure. The image below shows the structure of the amino acid isoleucine.
Draw a box around the part of the molecule that would be the same in all amino acids.
(1)
(c) Name the chemical element found in all amino acids that is not found in triglycerides.
___________________________________________________________________
(1)
(Total 3 marks)
Page 26 of 34
Q2. (a) Glycogen and cellulose are both carbohydrates.
Describe two differences between the structure of a cellulose molecule and a glycogen molecule.
1. _________________________________________________________________
___________________________________________________________________
___________________________________________________________________
2. _________________________________________________________________
___________________________________________________________________
___________________________________________________________________
(2)
(b) Starch is a carbohydrate often stored in plant cells. Describe and explain two features of starch that make it a good storage molecule.
1. _________________________________________________________________
___________________________________________________________________
___________________________________________________________________
2. _________________________________________________________________
___________________________________________________________________
___________________________________________________________________
(2)
(c) Tick (✔) the box that identifies the test which would be used to show the presence of
starch.
Acid hydrolysis test
Benedict’s test
Emulsion test
Iodine/potassium iodide test
(1)
Page 27 of 34
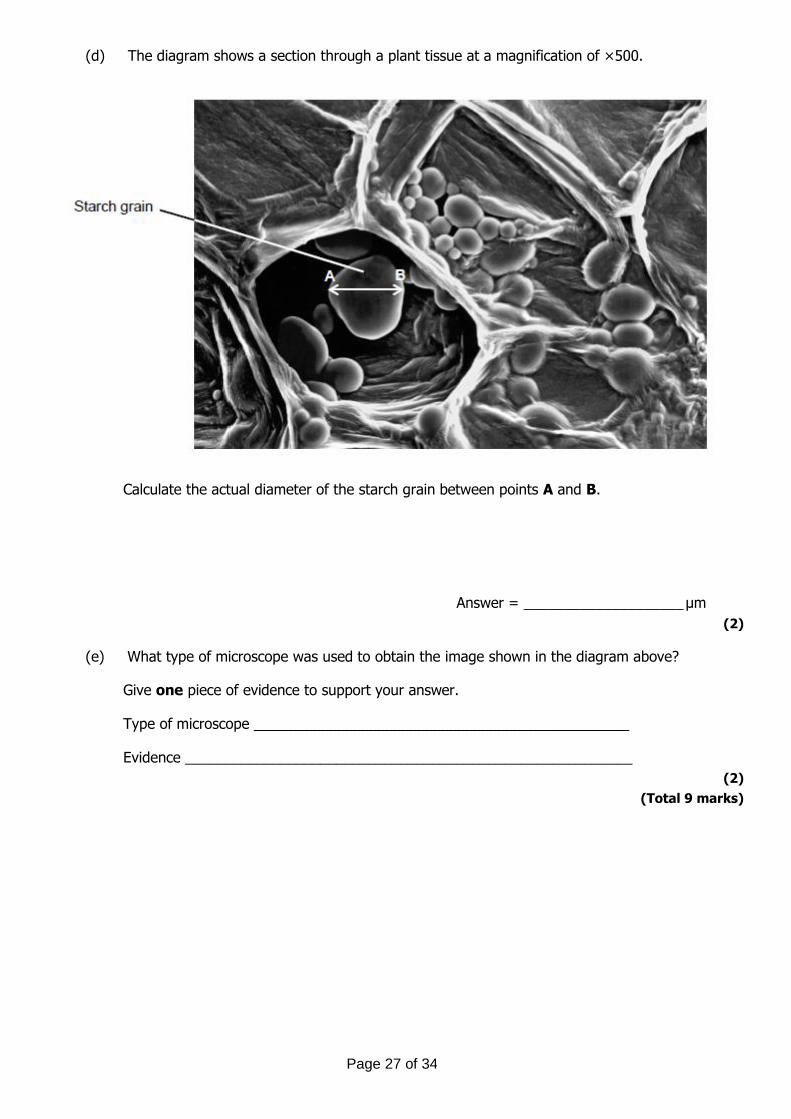
(d) The diagram shows a section through a plant tissue at a magnification of ×500.
Calculate the actual diameter of the starch grain between points A and B.
Answer = ____________________ μm
(2)
(e) What type of microscope was used to obtain the image shown in the diagram above?
Give one piece of evidence to support your answer.
Type of microscope _______________________________________________
Evidence ________________________________________________________
(2)
(Total 9 marks)
Page 28 of 34
Q3. (a) What is a monomer?
___________________________________________________________________
___________________________________________________________________
___________________________________________________________________
___________________________________________________________________
___________________________________________________________________
(1)
(b) Lactulose is a disaccharide formed from one molecule of galactose and one molecule of fructose.
Other than both being disaccharides, give one similarity and one difference between the structures of lactulose and lactose.
Similarity ___________________________________________________________
___________________________________________________________________
___________________________________________________________________
___________________________________________________________________
___________________________________________________________________
Difference __________________________________________________________
___________________________________________________________________
___________________________________________________________________
___________________________________________________________________
___________________________________________________________________
(2)
(Total 4 marks)
Page 29 of 34
Q4. (a) Name the monomers from which a maltose molecule is made.
___________________________________________________________________
(1)
(b) Name the type of chemical bond that joins the two monomers to form maltose.
___________________________________________________________________
(1)
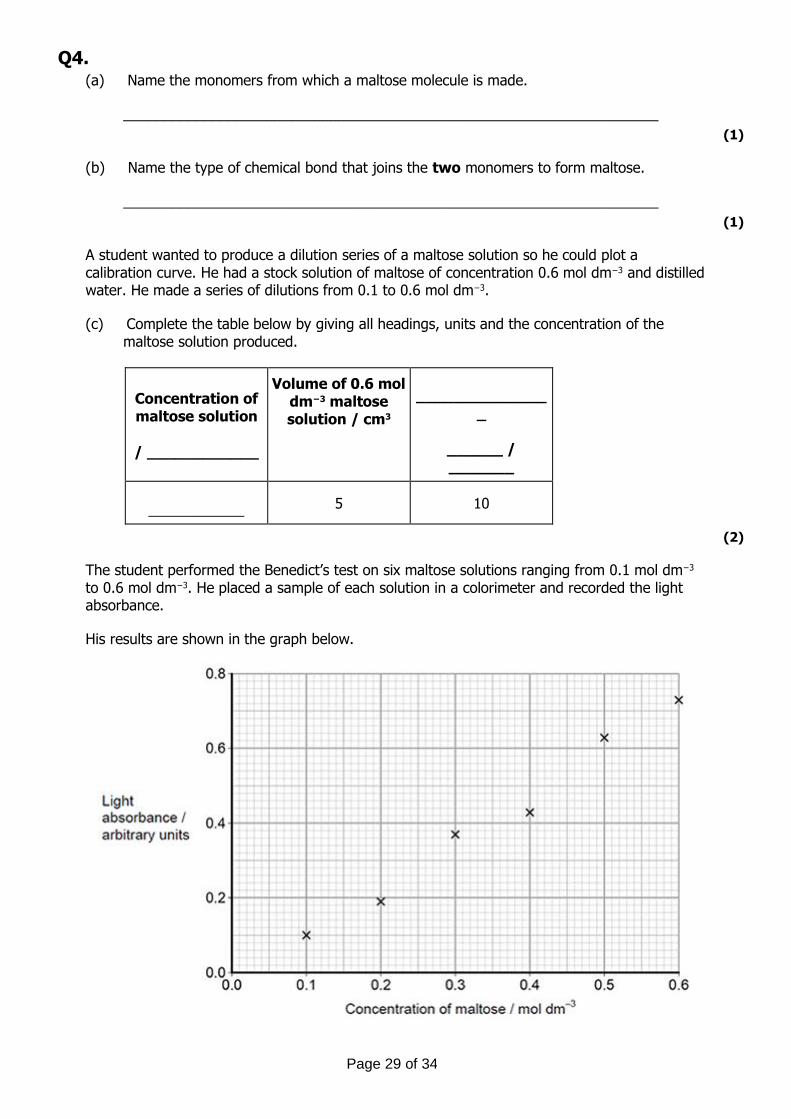
A student wanted to produce a dilution series of a maltose solution so he could plot a calibration curve. He had a stock solution of maltose of concentration 0.6 mol dm−3 and distilled water. He made a series of dilutions from 0.1 to 0.6 mol dm−3.
(c) Complete the table below by giving all headings, units and the concentration of the maltose solution produced.
Concentration of maltose solution
/ ____________
Volume of 0.6 mol dm−3 maltose solution / cm3
______________
_
______ / _______
____________ 5 10
(2)
The student performed the Benedict’s test on six maltose solutions ranging from 0.1 mol dm−3 to 0.6 mol dm−3. He placed a sample of each solution in a colorimeter and recorded the light absorbance.
His results are shown in the graph below.
Page 30 of 34
(d) Explain how you would use the graph to determine the maltose concentration with a light absorbance of 0.45 arbitrary units.
___________________________________________________________________
___________________________________________________________________
___________________________________________________________________
___________________________________________________________________
___________________________________________________________________
(2)
(Total 6 marks)
Q5. (a) Describe how a peptide bond is formed between two amino acids to form a dipeptide.
___________________________________________________________________
___________________________________________________________________
___________________________________________________________________
___________________________________________________________________
___________________________________________________________________
___________________________________________________________________
___________________________________________________________________
___________________________________________________________________
___________________________________________________________________
___________________________________________________________________
(2)
Page 31 of 34
(b) The secondary structure of a polypeptide is produced by bonds between amino acids.
Describe how.
___________________________________________________________________
___________________________________________________________________
___________________________________________________________________
___________________________________________________________________
___________________________________________________________________
___________________________________________________________________
___________________________________________________________________
___________________________________________________________________
___________________________________________________________________
___________________________________________________________________
(2)
(c) Two proteins have the same number and type of amino acids but different tertiary structures.
Explain why.
___________________________________________________________________
___________________________________________________________________
___________________________________________________________________
___________________________________________________________________
___________________________________________________________________
___________________________________________________________________
___________________________________________________________________
___________________________________________________________________
___________________________________________________________________
___________________________________________________________________
(2)
(Total 6 marks)
Page 32 of 34
5. Help and mark scheme
You should be able to find the answers to part 1 and 2 quite easily in the text.
3. Enzyme activity
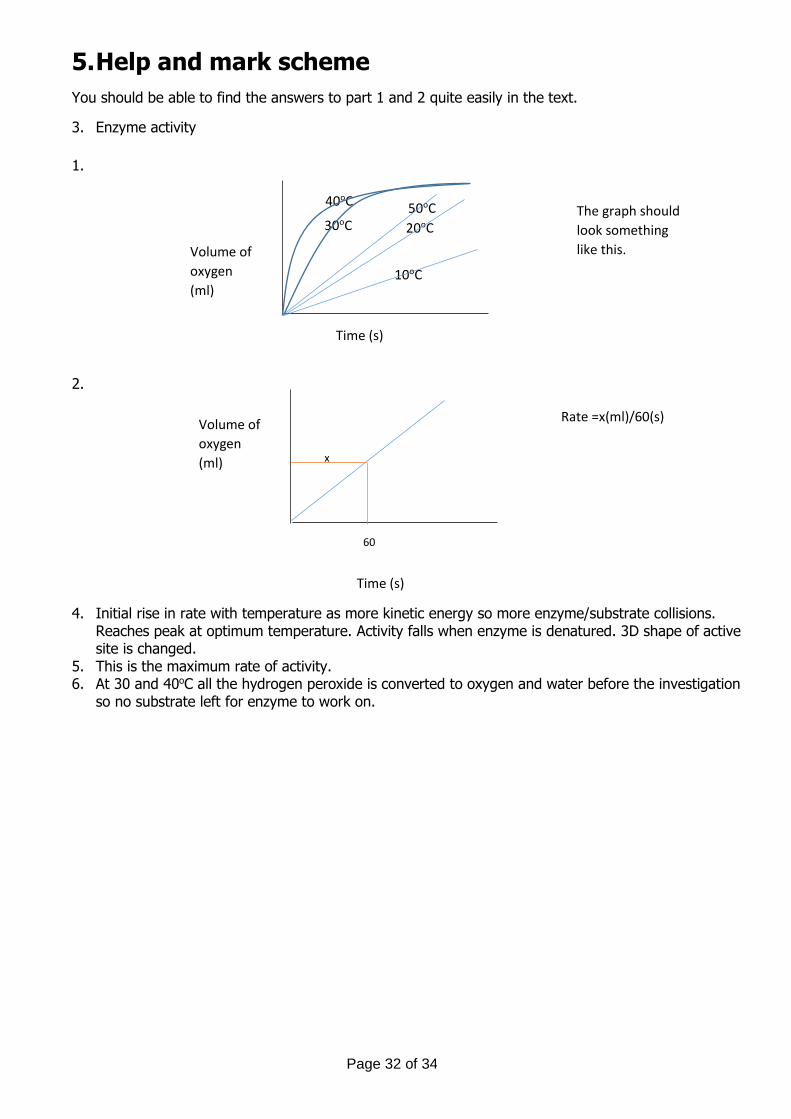
1.
2.
4. Initial rise in rate with temperature as more kinetic energy so more enzyme/substrate collisions. Reaches peak at optimum temperature. Activity falls when enzyme is denatured. 3D shape of active site is changed.
5. This is the maximum rate of activity. 6. At 30 and 40oC all the hydrogen peroxide is converted to oxygen and water before the investigation
so no substrate left for enzyme to work on.
Time (s)
Volume of
oxygen
(ml) 10oC
20oC 30oC
40oC 50oC The graph should
look something
like this.
Time (s)
60
x
Volume of
oxygen
(ml)
Rate =x(ml)/60(s)
Page 33 of 34
Mark schemes
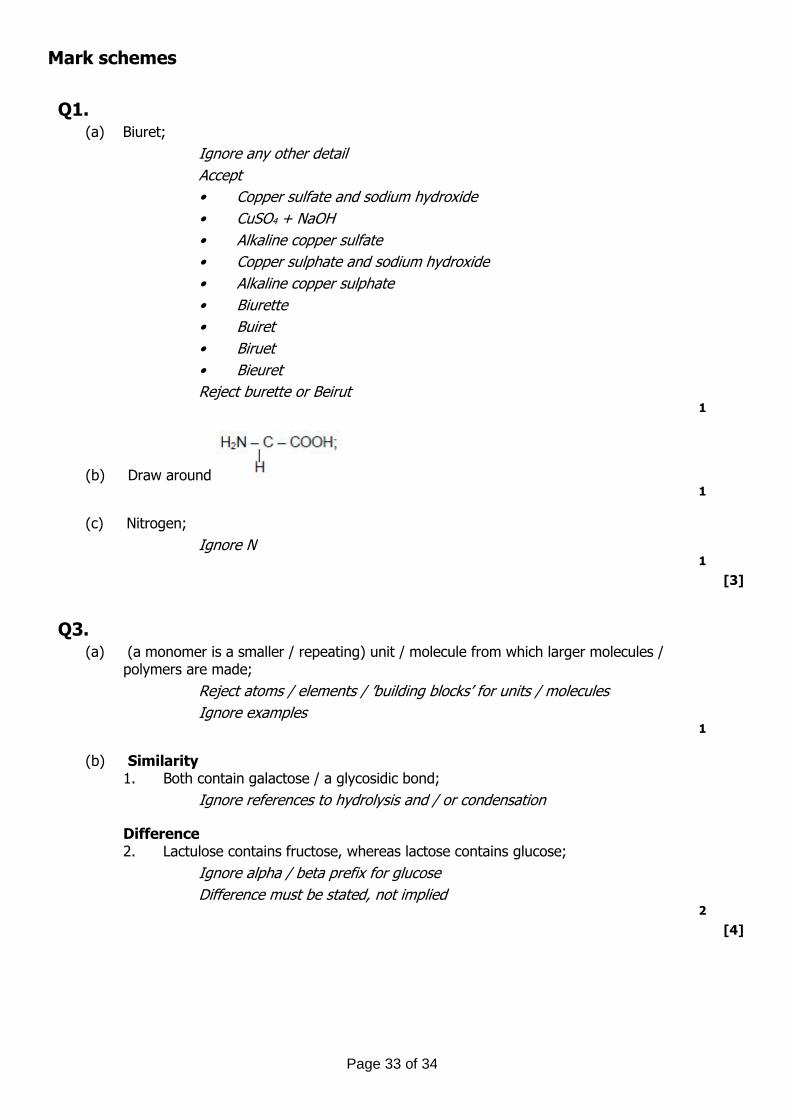
Q1. (a) Biuret;
Ignore any other detail
Accept
• Copper sulfate and sodium hydroxide
• CuSO4 + NaOH
• Alkaline copper sulfate
• Copper sulphate and sodium hydroxide
• Alkaline copper sulphate
• Biurette
• Buiret
• Biruet
• Bieuret
Reject burette or Beirut 1
(b) Draw around 1
(c) Nitrogen;
Ignore N 1
[3]
Q3. (a) (a monomer is a smaller / repeating) unit / molecule from which larger molecules /
polymers are made;
Reject atoms / elements / ’building blocks’ for units / molecules
Ignore examples 1
(b) Similarity 1. Both contain galactose / a glycosidic bond;
Ignore references to hydrolysis and / or condensation
Difference 2. Lactulose contains fructose, whereas lactose contains glucose;
Ignore alpha / beta prefix for glucose
Difference must be stated, not implied 2
[4]
Page 34 of 34
Q4. (a) Glucose (and glucose);
1
(b) (α1,4) Glycosidic; 1
(c) 1. Headings correct – mol dm–3 and volume of water / cm3;
2. Concentration correct. ie 0.2; 2
(d) Line of best fit drawn;
Read off value at 0.45. 2
[6]
Q5. (a) 1. Condensation (reaction) / loss of water;
Accept each marking point if shown clearly in diagram.
2. Between amine / NH2 and carboxyl / COOH;
Accept between amino (group) and carboxylic / acid (group) 2
(b) 1. Hydrogen bonds;
Accept as a diagram
Reject N - - - C / ionic / disulfide bridge / peptide bond
2. Between NH (group of one amino acid) and C=O (group); OR Forming β pleated sheets / α helix;
2
(c) 1. Different sequence of amino acids OR Different primary structure;
If candidate assumes proteins are the same, accept effect of different pH/ temperature
2. Forms ionic / hydrogen / disulfide bonds in different places; 2
[6]