brigade enterprises limited
TRANSCRIPT

1
BRIGADE ENTERPRISES LIMITED
Investor Presentation Q1 FY21
`
(CIN: L85110KA1995PLC019126)
Artist’s Impression of Brigade Xanadu Artist’s Impression of Brigade Xanadu

2
The World of Brigade
• Leading property developer in South Indian real estate market with over three decades of experience
• Reputation of developing Grade A properties
• Business Portfolio of Residential, Lease Rentals and Hospitality
• Consistent EBITDA margin of ~26%-28% for the past 5 years
• Ranked amongst the 100 Best Places to Work in India for 10 consecutive years
Who we are
What we stand for
Our presence
GIFT City
Bengaluru
Hyderabad
Chennai
KochiMysore
• Shared Vision:To be a World Class Organization in our Products, Processes, People & Performance
• Shared Mission:To be the Preferred Developer of Residential, Commercial & Hospitality Spaces in the market in which we operate, without compromising on our values, for the benefit of all our stakeholders
• Core Values:QC-First – Quality, Customer Centricity, Fair, Innovative, Responsible Socially, Trustworthy

3
General Outlook & COVID Impact
• Construction activity was impacted because of the intermittent lockdowns
• Lower revenue recognition in real estate segment was due to government office shutdowns
• Malls and Hotels underperformed because of the lockdown, travel restrictions and weakconsumer sentiment
• Collections, impacted due to the above reasons, were partially mitigated by prudent capitalexpenditure and reduction in overheads
Impact & response
• Rate reduction by RBI and consequent low rate of interest for housing loans is a big positive.
• Adequate liquidity in the economy has helped to restrict the damage.
• Recent announcement by RBI to allow banks to restructure loans in impacted sectors is a stepin the right direction.
• Economy is expected to rebound in the later part of the calendar year; however GDPcontraction is expected for the financial year
Macro outlook
• Construction has resumed at 30% labour strength post unlock & has now reached 50%. We expect to reach 100% by end of Q3 FY21
• Green shoots are visible in residential business with a pick up in enquiries and sales
• Office business remains stable with 95% collections, retaining a positive outlook
• Business in malls and hotels will pick up gradually along with the improvement in economy
• Brigade has strong balance sheet and is in a good position to manage operations while maintaining liquidity to meet business obligations
Company outlook
4
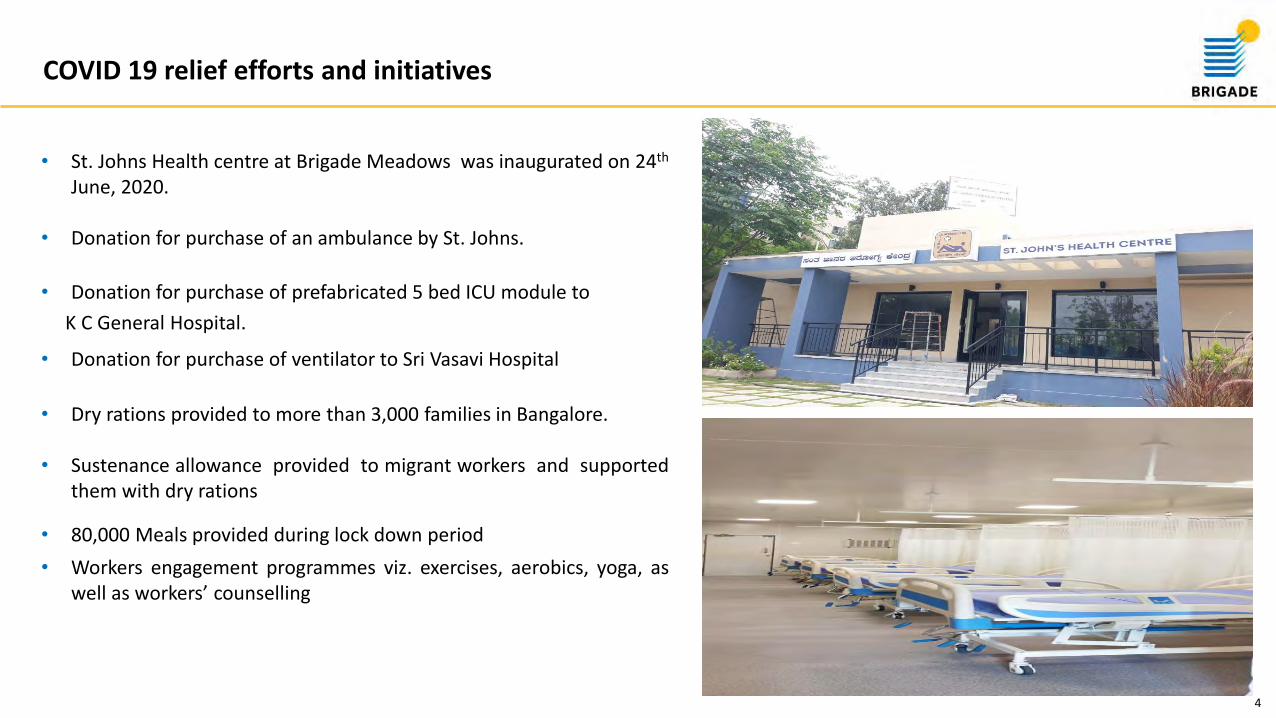
COVID 19 relief efforts and initiatives
• St. Johns Health centre at Brigade Meadows was inaugurated on 24th
June, 2020.
• Donation for purchase of an ambulance by St. Johns.
• Donation for purchase of prefabricated 5 bed ICU module to
K C General Hospital.
• Donation for purchase of ventilator to Sri Vasavi Hospital
• Dry rations provided to more than 3,000 families in Bangalore.
• Sustenance allowance provided to migrant workers and supportedthem with dry rations
• 80,000 Meals provided during lock down period
• Workers engagement programmes viz. exercises, aerobics, yoga, aswell as workers’ counselling
5
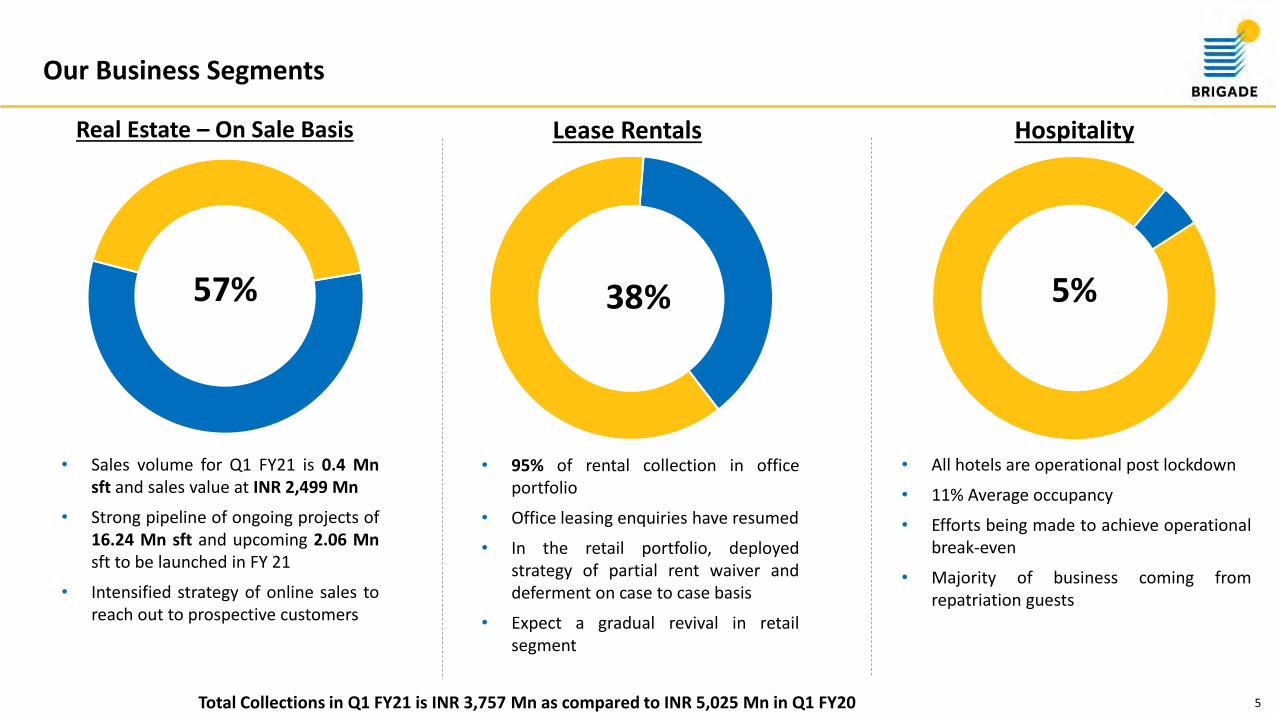
Our Business Segments
57% 38% 5%
Real Estate – On Sale Basis Lease Rentals Hospitality
• Sales volume for Q1 FY21 is 0.4 Mnsft and sales value at INR 2,499 Mn
• Strong pipeline of ongoing projects of16.24 Mn sft and upcoming 2.06 Mnsft to be launched in FY 21
• Intensified strategy of online sales toreach out to prospective customers
• 95% of rental collection in officeportfolio
• Office leasing enquiries have resumed
• In the retail portfolio, deployedstrategy of partial rent waiver anddeferment on case to case basis
• Expect a gradual revival in retailsegment
• All hotels are operational post lockdown
• 11% Average occupancy
• Efforts being made to achieve operationalbreak-even
• Majority of business coming fromrepatriation guests
Total Collections in Q1 FY21 is INR 3,757 Mn as compared to INR 5,025 Mn in Q1 FY20

6
Summary: Ongoing Projects
Projects Project Area Co Share LO/JV share
Real Estate projects for sale 8.15 6.13 2.02
Brigade Orchards * 1.82 0.91 0.91
Brigade Cornerstone Utopia* 4.00 2.66 1.34
Brigade Residences @ WTC Chennai* 0.57 0.29 0.28
Brigade El Dorado* 1.70 1.70 -
Total Real Estate (A) 16.24 11.69 4.55
Brigade Southfield 0.35 0.21 0.14
Brigade Tech Gardens*^ 3.20 1.63 1.57
WTC, Chennai* 2.00 1.02 0.98
Brigade Twin Towers* 1.30 1.30 -
Total Leasing (B) 6.85 4.16 2.69
Holiday Inn Express & Suites, Bengaluru OMR
0.09 0.09 -
Ibis Style, Mysore* 0.11 0.11 -
Total Hospitality (C) 0.20 0.20 -
Total (A+B+C) 23.29 16.05 7.24
* Projects in SPV^ 1.2 Mn sft has been completed and is operational in Brigade Tech Gardens
70%
29%
1%
Total Project Area
Real Estate
Lease Rentals
Hospitality
73%
26%
1%
Brigade’s share of the Project Area
Real Estate
Lease Rentals
Hospitality
Area in Mn sft

77
Maintain momentum in residential launches1
Positive outlook in the leasing business2
Hospitality performance in the light of COVID – 193
Financial Performance 4
Land Bank 5
Projects Launched and Upcoming Launches 6
Contents

8
Highlights: Real Estate Q1 FY 21
• Achieved pre sales 0.4 mn sft in Q1 FY21 vs 1.13 mn sftin Q1 FY20
• Average Selling price at INR 5,956 per sft in Q1 FY 21
• Projects of 0.62 mn sft launched in Q1 FY 21• Brigade El Dorado – Jasper Block
• Strong pipeline of 2.06 mn sft with key projects like• Bangalore
• Brigade Orchards – Goldspire Block• Brigade Eldorado – F Block• Brigade Northridge Phase 2
• Chennai• Brigade Xanadu Cluster 2 – E,F & L Block• Brigade Xanadu Cluster 4 (Wing 1)
• Hyderabad• Brigade Citadel Phase I
Artist’s impression of Citadel

9
Sales Performance – Real Estate
427
804 776
958
1,132
997
1,082 1,054
421
Q1 Q2 Q3 Q4 Q1 Q2 Q3 Q4 Q1
FY 2019 FY 2020 FY 2021
QoQ Sales Area ('000 sft)
2,185
4,597 4,458
5,198
5,933
5,288
6,035
6,512
2,499
Q1 Q2 Q3 Q4 Q1 Q2 Q3 Q4 Q1
FY 2019 FY 2020 FY 2021
QoQ Sales Value (INR Mn)

10
Group Sales Snapshot Q1 FY 21
Particulars Q1 FY21 Q1 FY20 Q4 FY 20Q1 FY 21 on
Q1 FY 20Q1 FY 21 on
Q4 FY 20
Area Sales (‘000 sft)
Residential 394 1,094 944 -64% -58%
Commercial 27 38 110 -29% -75%
Total 421 1,132 1,054 -63% -60%
Sale Value (INR Mn)
Residential 2,233 5,552 5,634 -60% -60%
Commercial 266 381 878 -30% -70%
Total 2,499 5,933 6,512 -58% -62%
Realization (INR/sft) 5,956 5,244 6,176 14% -4%
Decrease in average realisation due to lower commercial sales

11
Consolidated synopsis of Real Estate Projects
ParticularsOngoing BEL
Projects Ongoing SPV
Projects *Stock Sales Total
In Mn. SftBEL SPV
Total super built-up area of projects on sale basis 13.85 2.39 0.86 0.20 17.30Less: LO Share 3.36 - - - 3.36Co share of saleable area 10.49 2.39 0.86 0.20 13.94Sold till date 5.11 0.88 - - 5.99To be sold 5.38 1.51 0.86 0.20 7.95
INR MnEstimated Receipts 57,448 15,813 4,543 934 78,738From Sold units 27,622 5,129 - - 32,751From unsold units 29,826 10,684 4,543 934 45,987Collection till date on sold units 13,015 3,169 - - 16,184
Balance to be collected for the projects (From Sold Units) 14,607 1,960 - - 16,567
Balance to be collected for the projects (sold and unsold units) – A
44,433 12,644 4,543 934 62,554
Estimated Total cost to be spent 45,091 12,235 2,902 597 60,826Cost incurred till date 16,643 8,506 2,902 597 28,648Balance Cost to be incurred to finish the project- B 28,448 3,729 - - 32,177Gross Operating Cash Flows (A-B) 15,985 8,916 4,543 934 30,378Present Borrowings – C 3,965 2,043 292 615 6,915Net Operating Cash Flows projected (A-B-C) 12,020 6,873 4,251 319 23,463* Brigade Orchards and Brigade Residences at WTC Chennai

1212
Contents
Maintain momentum in residential launches1
Positive outlook in the leasing business2
Hospitality performance in the light of COVID – 193
Financial Performance 4
Land Bank 5
Projects Launched and Upcoming Launches 6

13
Our Leasing Portfolio: Operating Assets
Particulars Leasable Area Leased To be Leased
Brigade Tech Gardens Phase 1 1.24 0.75 0.49*
WTC @ Bangalore 0.62 0.62 -
Brigade Opus 0.30 0.20 0.10
Brigade Bhuwalka Icon 0.19 0.19 -
WTC @ Kochi 0.77 0.55 0.22
Brigade Financial Centre @ Gift City 0.29 0.03 0.26
Orion Mall @ Brigade Gateway 0.83 0.83 -
Orion Uptown Mall (Earlier Orion OMR) 0.27 0.19 0.08
Orion Avenue Mall (Earlier Orion East) (BEL Share only) 0.15 0.14 0.01
Brigade Vantage @ Chennai 0.06 0.06 -
Others 0.06 0.06 -
Total 4.78 3.62 1.16
* Includes 0.3 Mn sft hard option
Area in Mn sft
2.40
1.22
1.07
0.09
Office
RetailLeased Out
To Be Leased Out

14
Our Pre- Leasing Portfolio:
Particulars Leasable Area Leased Hard option To be transacted
Brigade Tech Gardens Phase 2 1.76 0.19 0.01 1.56
WTC Chennai 2.01 1.34 0.33 0.34
Total 3.77 1.53 0.34 1.90
Area in Mn sft
Actual shot at Brigade Tech Garden

15
Capex Commitment: Commercial
* Through 51% SPV^ As of June’20
Projects Est. cost Incurred Balance^
B. Commercial Lease
Brigade Southfield 1,144 759 385
Brigade Tech Gardens* 11,900 10,402 1,498
World Trade Centre, Chennai* 8,000 6,196 1,804
Brigade Twin Towers 5,999 423 5,576
Total Commercial Lease 27,403 17,780 9,263
(INR Mn)
Actual Shot of Brigade Tech GardensArtist’s impression of WTC ChennaiArtist’s impression of Brigade Southfield Actual shot at WTC Chennai

1616
Contents
Maintain momentum in residential launches1
Positive outlook in the leasing business2
Hospitality performance in the light of COVID - 193
Financial Performance 4
Land Bank 5
Projects Launched and Upcoming Launches 6

17
Hospitality performance during pandemic
• Huge negative impact on hotel business, both occupancy and
ARRs because of COVID - 19
• All hotels, except for Four Points Kochi & Holiday Inn Chennai,
remained shut for most of the lockdown and commenced
operations on 8th June, 2020
• Occupancy continues to be in single digits in most of the hotels,
averaging at 11%
• Manpower costs were reduced during the quarter by 40% and
overheads by 70% to mitigate losses
• All non-essential capex and renovation has been deferred to
reduce outflows
• Efforts are underway to achieve operational break-even
• Parent company continues to extend cash flow support from to
manage operations
Artist’s impression of Holiday Inn Express, Bengaluru, OMRActual shot at Four Points Sheraton, Kochi

18
Capex Commitment: Hospitality
Projects Estimate cost Incurred BalancePlanned Number
of KeysExpected date of Commencement
Holiday Inn Express & Suites, Bengaluru OMR*
650 290 360 134 Q3 FY21
Ibis Style Mysore* 730 192 538 151 Q1 FY22
Total Hospitality 1380 482 898 285
(INR Mn)
* Through SPV
Artist’s impression of Holiday Inn Express, Bengaluru, OMRArtist’s impression of Holiday Inn Express, Bengaluru, OMRArtist’s impression of Grand Mercure, Gift City

1919
Contents
Maintain momentum in residential launches1
Positive outlook in the leasing business2
Hospitality performance in the light of COVID – 193
Financial Performance 4
Land Bank 5
Projects Launched and Upcoming Launches 6

20
Consolidated Financials: Snapshot
Particulars Q1 FY 21 Q4 FY 20 Q1 FY 20Q1 FY 21 on
Q4 FY 20Q1 FY 21 on
Q1 FY 20
Revenue 2,138 6,443 7,170 (67%) (70%)
EBITDA 579 1,435 1,906 (60%) (70%)
Interest 891 805 797 11% 12%
Profit after Interest (312) 630 1,109 (150%) (128%)
Depreciation 556 563 383 (1%) 45%
Profit before share from Associate & Exceptional item (868) 67 726 (1396%) (220%)
Add: Profit from Associate 10 - 7 - 43%
Less: Exceptional items - 205 - -
PBT (858) (138) 733 522% (217%)
Tax charge / (credit) (219) (28) 269 682% (181%)
PAT (639) (110) 464 481% (238%)
PAT after MI (527) 27 412 (2052%) (228%)
EBITDA/Revenue 27% 22% 27%
PBT/Revenue (40%) (2%) 10%
PAT/Revenue (30%) (2%) 6%
(INR Mn)
* PAT: Profit After Tax, PBT: Profit Before Tax, EBITDA: Earnings Before Interest Tax Depreciation Amortization, MI: Minority Interest

21
Business Segment Performance: Q1 FY 21
Particulars Real Estate Hospitality Lease Rental Total % of Revenue
Revenue 1,213 105 820 2,138 100%
as % of Total 57% 5% 38% 100%
Direct Expenses 846 15 16 877 38%
Admin Expenses 65 84 134 281 13%
Selling Cost 21 4 8 33 2%
Employee cost 186 121 61 368 17%
EBITDA 95 (119) 603 579 27%
EBITDA / Revenue % 8% (114%) 74% 27%
Interest 275 130 486 891 42%
PBDT (178) (249) 118 (312) (15%)
Depreciation 10 187 359 556 26%
PBT (189) (436) (241) (868) (41%)
PBT/ Revenue % (16%) (416%) (30%) (41%)
*PAT: Profit After Tax, PBT: Profit Before Tax, EBITDA: Earnings before Interest Tax Depreciation Amortization ,MI : Minority Interest
(INR Mn)

22
Consolidated Cash Flows
Particulars Q1 FY21 Q4 FY20 Q1 FY20Operating ActivitiesTotal Collections 3,757 7,184 5,025 Direct Cost/Construction Cost (1,859) (3,037) (3,191)LO Payments (358) (495) (178)Employee and Admin Expenses (370) (653) (668)Sales & Marketing Expenses (107) (347) (172)Statutory Payments (238) (553) (517)Other Payments (3) (11) (21)Net Cash Flow from Operating Activities (A) 822 2,088 278Investment ActivitiesCash from Investment Activities (FD & MF) 499 409 788Construction Cost (CWIP/Capex Projects) (1,192) (1,907) (1,884)Investment in Land/JD/JV/TDR (70) (1) (21)Other Investments (FD & Mutual Fund) (1,392) (755) (898)Net Cash Flow from Investment Activities (B) (2,155) (2,254) (2,015)Financing ActivitiesDebt Drawdown 3,432 3,674 2,909Investment by PE - 150 600Proceeds from ESOP - 3 -Dividend Payment - (253) -Debt Repayment (2,422) (2,224) (1,735)Interest Payment (558) (948) (803)Net Cash Flow from Financing Activities (C) 452 402 971Net Cash Flows for the Period (A+B+C) (881) 236 (766)
(INR Mn)

23
Capital Allocation: Segment-wise
(INR Mn)As of June, 2020*
Segment Equity (A) Debt (B)Capital
Employed (A+B)
D/E Ratio (A/B)
PBD/Equity %
Operating Capital
Employed (OCE)
EBITDA/OCE %
Real Estate 15,586 6,915 22,501 0.44 11% 22,501 13%
Hospitality 3,284 5,434 8,718 1.65 1% 8,399 7%
Leasing 10,679 28,504 39,183 2.67 5% 17,529 13%
Less: Cash Balance
4,613
Total 29,549 36,240 70,402 1.23 3% 48,429 12%
32%
56%
12%
Capital Employed
Real Estate Lease Rentals Hospitality
* Note: PBD/Equity and EBITDA/OCE percentages are calculated based on trailing four quarter numbersPBD: Profit Before Depreciation & Tax (After Interest)

24
Consolidated Debt Profile
Particulars As on Jun-20 As on Mar-20 As on Jun-19
Real Estate 6,915 6,919 6,807
Hospitality 5,434 5,391 5,369
GOP Securitised 4,206 4,172 4,370
Capex 1,228 1,219 999
Leasing 28,504 27,246 22,567
Securitised Lease Rental 15,213 12,677 12,414
Capex 13,381 14,569 10,153
Less: Cash & Cash Equivalents 4,613 4,374 3,425
Net Debt 36,240 35,182 31,319
Less: SPV Partner’s share of debt 7,499 6,871 5,084
Exposure of BEL 28,741 28,311 26,235
Cost of Debt (Consolidated) 9.56% 9.57% 9.71%
Credit Rating CRISIL “A”; ICRA “A” CRISIL “A”; ICRA “A” CRISIL “A”; ICRA “A”
Note: The gross debt figure for June 2020 includes INR 15,258 Mn debt taken in SPV’s where BEL has INR 7,760 Mn share
(INR Mn)

25
Standalone Financial Statements
Particulars Q1 FY 21 Q4 FY 20 Q1 FY 20Q1 FY 21 on
Q4 FY 20Q1 FY 21 on
Q1 FY 20
Turnover 1,808 4,781 5,439 (62%) (67%)
EBITDA 663 1,366 1,670 (51%) (60%)
Interest 501 484 497 4% 1%
Profit after Int 162 882 1,173 (82%) (86%)
Depreciation 202 177 179 14% 13%
PBTE (40) 705 994 (106%) (104%)
Exceptional items - (145) - - -
PBT (40) 560 994 (107%) (104%)
Tax charge / (credit) (8) 154 354 (105%) (102%)
PAT (32) 406 640 (108%) (105%)
EBITDA/Revenue 37% 29% 31%
PBT/Revenue (2%) 15% 18%
PAT/Revenue (2%) 8% 12%
(INR Mn)
* PAT: Profit After Tax, PBT: Profit Before Tax, PBTE: Profit Before Tax & Exceptional items, EBITDA: Earnings Before Interest Tax Depreciation Amortization

2626
Contents
Maintain momentum in residential launches1
Positive outlook in the leasing business2
Hospitality performance in the light of COVID - 193
Financial Performance 4
Land Bank 5
Projects Launched and Upcoming Launches 6

27
Brigade’s Land Bank
GIFT City
B engaluru
Hyderabad
Chennai
KochiMysore
Thiruvananthapuram
230
42
18
1614
13 2
Land Area (in acre)
Bengaluru
Chennai
Kochi
Mysore
Thiruvananthapuram
Hyderabad
GIFT City
Total Area of 335 acres as on 30th June 2020. Total cost of Land is Rs.8,248 Mn out of which Rs.5,491 Mn is paid and balance Rs.2,757 Mn is payable
28
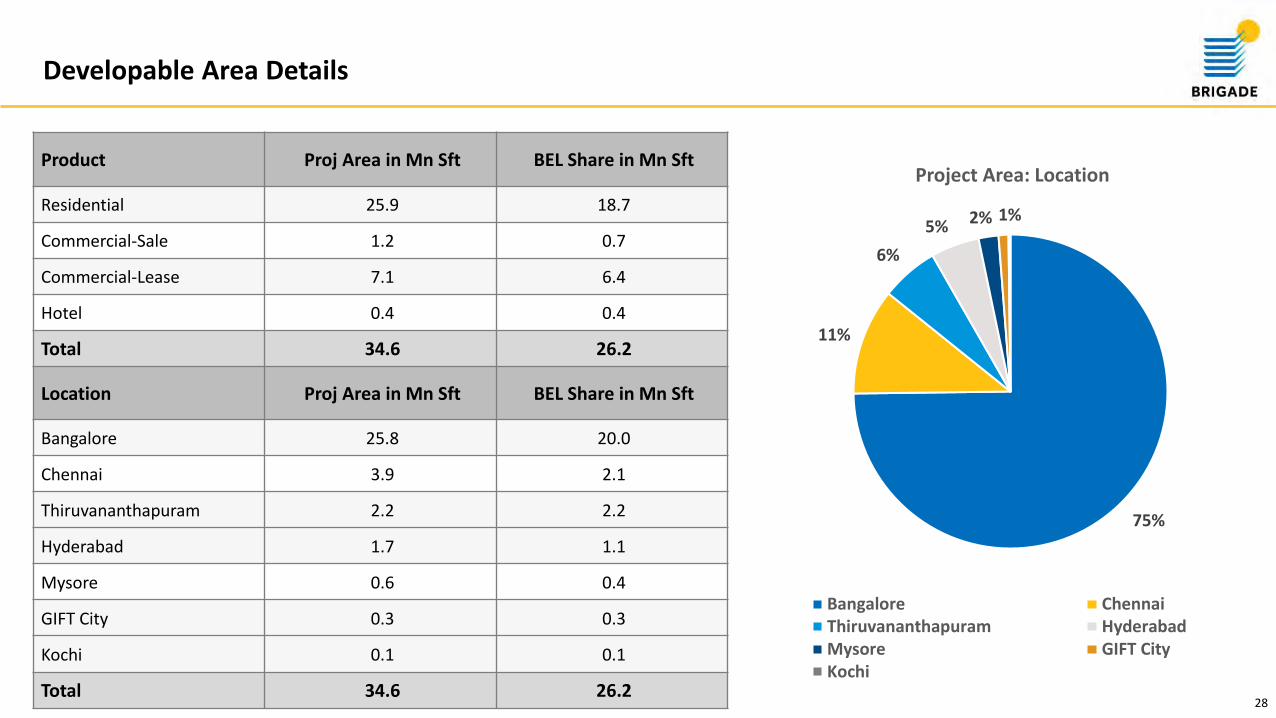
Developable Area Details
Product Proj Area in Mn Sft BEL Share in Mn Sft
Residential 25.9 18.7
Commercial-Sale 1.2 0.7
Commercial-Lease 7.1 6.4
Hotel 0.4 0.4
Total 34.6 26.2
Location Proj Area in Mn Sft BEL Share in Mn Sft
Bangalore 25.8 20.0
Chennai 3.9 2.1
Thiruvananthapuram 2.2 2.2
Hyderabad 1.7 1.1
Mysore 0.6 0.4
GIFT City 0.3 0.3
Kochi 0.1 0.1
Total 34.6 26.2
75%
11%
6%
5% 2% 1%
Project Area: Location
Bangalore ChennaiThiruvananthapuram HyderabadMysore GIFT CityKochi

2929
Agenda
Maintain momentum in residential launches1
Positive outlook in the leasing business2
Hospitality performance in the light of COVID – 193
Financial Performance 4
Land Bank 5
Projects Launched and Upcoming Launches 6

30
Projects Launched: Q1 FY 21
Project Product CityProject Area
(mn sft) Quarter Launched
Brigade El Dorado – Jasper Block * Residential Bengaluru 0.62 Q1
Brigade Twin Towers * Commercial Bengaluru 1.30 Q1
Total 1.92
• Projects in SPV
Artist’s impression of Brigade El Dorado

31
Upcoming Launches
SegmentTotal Area
(mn sft)Brigade Economic Interest
(mn sft)
Residential 2.06 1.53
Leasing 0.54 0.36
Total 2.60 1.89
Artist’s impression of Brigade El DoradoArtist’s impression of Brigade Orchards - Goldspire

32
Awards and Accolades
• Ranked 10 years in a row among India’s Top 100 Best Companies to Work for 2020, in one of India’s largest workplace studies conducted by the Great Place To Work Institute and The Economic Times
• Ranked 43 in the coveted Top 50 category across Companies in 2020
• Brigade Hospitality Services Ltd ranked 3rd amongst India’s Great Mid -Size Workplaces in 2020 by the Great Place to Work Institute and The Economic Times

33
Shareholding Pattern
Promoter Group, 47%
FIIs and FPIs, 12%
Mutual Funds, 18%
Others, 23%
As on June 30, 2020

34
Board of Directors
Chairman and Managing Director• Masters in Business
Administration• Promoter of the
Brigade Group
Independent Director• MBA from Wharton
School, University of Pennsylvania
• Author and
Entrepreneur
Independent Director• MBA from Boston
University • Retired IAS
Executive Director• CA, CWA, IIM K Alumni• Faculty at IIM B
Executive Director• MBA, Real Estate &
Finance, Columbia Business School
• Part of Promoter Group
Executive Director• Masters of Mgmt,
Hospitality from Cornell University
• Part of Promoter Group
Executive Director• B Tech and Masters’ in
Building Engineering and Management
Executive Director• Masters in Engineering
from Pennsylvania Sate University
• Part of Promoter Group
Independent Director• Masters in Science• Former MD of SBI
Independent Director• PG Diploma in Business
Management• Rich experience in Real
Estate
M. R. Jaishankar Aroon RamanLakshmi
VenkatchalamDr. Venkatesh
PanchaganesanPavitra Shankar
Nirupa Shankar Roshin Mathew Amar MysorePradeep Kumar
PanjaBijou Kurien

35
Ongoing Projects
Brigade WoodsBrigade Utopia
Artist’s impression Artist’s impression

36
Ongoing Projects
Brigade Seven Gardens WTC Residences
Artist’s impression Artist’s impression

37
Projects Launched
Brigade Twin Towers Brigade El Dordo
Artist’s impression Artist’s impression

Brigade Enterprises Limited29th & 30th Floor, World Trade CenterBrigade Gateway Campus, Dr Rajkumar Road, Malleswaram-Rajajinagar, Bangalore 560055
Thank youDisclaimer: The information in this presentation contains certain forward-looking statements. These include statements regarding outlook on future development schedules, business plans and expectations of Capital expenditures. These statements are based on current expectations that involve a number of risks and uncertainties which could cause actual results to differ from those anticipated by the Company.
Email:[email protected](CIN: L85110KA1995PLC019126)
Atul GoyalChief Financial [email protected]
Om Prakash PCompany [email protected]
Rajiv SinhaDy. General Manager - [email protected]