s.j.s. enterprises limited
TRANSCRIPT
RED HERRING PROSPECTUS
Dated: October 22, 2021
Please read Section 32 of the Companies Act, 2013
Book Built Offer
S.J.S. ENTERPRISES LIMITED
Our Company was originally incorporated as a partnership firm in the name of “SJS Enterprises” pursuant to a deed of partnership dated June 10, 1987. Subsequently, pursuant to a deed of co-partnery dated March 25, 2005 and a
certificate of incorporation dated June 21, 2005 issued by the RoC, SJS Enterprises was registered as a private limited company under the Companies Act, 1956 under Part IX of the Companies Act, 1956 in the name of “S.J.S. Enterprises Private Limited”. Subsequently, our Company was converted into a public limited company, as approved by our Shareholders pursuant to a resolution dated April 28, 2021 and a fresh certificate of incorporation dated June
4, 2021 was issued by the RoC, consequent upon conversion, recording the change in the name of our Company to “S.J.S. Enterprises Limited”. For details of change in the name and Registered and Corporate Office of our Company,
see “History and Certain Corporate Matters” on page 154.
Registered and Corporate Office: Sy No 28/P16 of Agra Village and Sy No 85/P6 of B.M Kaval Village, Kengeri Hobli, Bangalore 560 082, Karnataka, India
Contact Person: Thabraz Hushain W., Company Secretary and Compliance Officer; Tel: +91 80 6194 0777
E-mail: [email protected]; Website: www.sjsindia.com Corporate Identity Number: U51909KA2005PLC036601
OUR PROMOTERS: EVERGRAPH HOLDINGS PTE. LTD. AND K.A. JOSEPH
INITIAL PUBLIC OFFER OF UP TO [●] EQUITY SHARES OF FACE VALUE OF ₹10 EACH (“EQUITY SHARES”) OF S.J.S. ENTERPRISES LIMITED (“COMPANY”) FOR CASH AT A PRICE OF ₹[●]
PER EQUITY SHARE THROUGH AN OFFER FOR SALE OF UP TO [●] EQUITY SHARES AGGREGATING UP TO ₹8,000.00 MILLION (“OFFER” OR “OFFER FOR SALE”) BY THE SELLING
SHAREHOLDERS, COMPRISING OF UP TO [●] EQUITY SHARES AGGREGATING UP TO ₹7,100.00 MILLION BY EVERGRAPH HOLDINGS PTE. LTD. AND UP TO [●] EQUITY SHARES
AGGREGATING UP TO ₹900.00 MILLION BY K.A. JOSEPH.
THE FACE VALUE OF EQUITY SHARES IS ₹10 EACH. THE OFFER PRICE IS [●] TIMES THE FACE VALUE OF THE EQUITY SHARES. THE PRICE BAND AND THE MINIMUM BID LOT SHALL BE
DECIDED BY OUR COMPANY AND SELLING SHAREHOLDERS IN CONSULTATION WITH THE BOOK RUNNING LEAD MANAGERS AND WILL BE ADVERTISED IN ALL EDITIONS OF THE
FINANCIAL EXPRESS, AN ENGLISH NATIONAL DAILY NEWSPAPER, ALL EDITIONS OF JANSATTA, A HINDI NATIONAL DAILY NEWSPAPER AND REGIONAL EDITION OF VISHWAVANI, A
KANNADA NEWSPAPER, KANNADA BEING THE REGIONAL LANGUAGE OF KARNATAKA, WHERE OUR REGISTERED AND CORPORATE OFFICE IS LOCATED, WITH WIDE CIRCULATION,
AT LEAST TWO WORKING DAYS PRIOR TO THE BID/ OFFER OPENING DATE AND SHALL BE MADE AVAILABLE TO THE BSE LIMITED (“BSE”) AND THE NATIONAL STOCK EXCHANGE OF
INDIA LIMITED (“NSE”, AND TOGETHER WITH BSE, THE “STOCK EXCHANGES”) FOR THE PURPOSE OF UPLOADING ON THEIR RESPECTIVE WEBSITES IN ACCORDANCE WITH
SECURITIES AND EXCHANGE BOARD OF INDIA (ISSUE OF CAPITAL AND DISCLOSURE REQUIREMENTS) REGULATIONS, 2018, AS AMENDED (THE “SEBI ICDR REGULATIONS”).
In case of any revision in the Price Band, the Bid/Offer Period will be extended by at least three additional Working Days after such revision in the Price Band, subject to the Bid/Offer Period not exceeding 10 Working Days. In
cases of force majeure, banking strike or similar circumstances, our Company may, in consultation with the BRLMs, for reasons to be recorded in writing, extend the Bid/Offer Period for a minimum of three Working Days,
subject to the Bid/Offer Period not exceeding 10 Working Days. Any revision in the Price Band and the revised Bid/Offer Period, if applicable, shall be widely disseminated by notification to the Stock Exchanges, by issuing a
public notice, and also by indicating the change on the respective websites of the Book Running Lead Managers and at the terminal of the Syndicate Member and by intimation to the Designated Intermediaries and the Sponsor Bank, as applicable.
The Offer is being made through the Book Building Process, in terms of Rule 19(2)(b) of the Securities Contracts (Regulation) Rules, 1957, as amended (“SCRR”) read with Regulation 31 of the SEBI ICDR Regulations and in
compliance with Regulation 6(1) of the SEBI ICDR Regulations and through the Book Building Process, wherein not more than 50% of the Offer shall be allocated on a proportionate basis to Qualified Institutional Buyers (“QIBs”, the “QIB Portion”), provided that our Company and the Selling Shareholders may, in consultation with the Book Running Lead Managers, allocate up to 60% of the QIB Portion to Anchor Investors on a discretionary
basis in accordance with the SEBI ICDR Regulations (“Anchor Investor Portion”), of which one-third shall be reserved for domestic Mutual Funds, subject to valid Bids being received from domestic Mutual Funds at or above
the Anchor Investor Allocation Price. In the event of under-subscription, or non-allocation in the Anchor Investor Portion, the balance Equity Shares shall be added to the Net QIB Portion. Further, 5% of the Net QIB Portion shall be available for allocation on a proportionate basis only to Mutual Funds, and the remainder of the Net QIB Portion shall be available for allocation on a proportionate basis to all QIB Bidders, including Mutual Funds,
subject to valid Bids being received at or above the Offer Price. However, if the aggregate demand from Mutual Funds is less than 5% of the QIB Portion, the balance Equity Shares available for allocation in the Mutual Fund
Portion will be added to the remaining QIB Portion for proportionate allocation to QIBs. Further, not less than 15% of the Offer shall be available for allocation on a proportionate basis to Non-Institutional Bidders and not less than 35% of the Offer shall be available for allocation to Retail Individual Bidders (“RIBs”) in accordance with the SEBI ICDR Regulations, subject to valid Bids being received from them at or above the Offer Price. All potential
Bidders (except Anchor Investors) are required to mandatorily utilise the Application Supported by Blocked Amount (“ASBA”) process providing details of their respective ASBA accounts, and UPI ID in case of RIBs using the
UPI Mechanism, if applicable, in which the corresponding Bid Amounts will be blocked by the SCSBs or under the UPI Mechanism, as the case may be, to the extent of respective Bid Amounts. Anchor Investors are not permitted
to participate in the Offer through the ASBA process. For details, see “Offer Procedure” on page 326.
RISKS IN RELATION TO THE FIRST OFFER
This being the first public issue of Equity Shares of our Company, there has been no formal market for the Equity Shares of our Company. The face value of the Equity Shares is ₹10. The Floor Price, Cap Price and Offer Price
as determined and justified by our Company and the Selling Shareholder in consultation with the Book Running Lead Managers, in accordance with the SEBI ICDR Regulations should not be considered to be indicative of the market price of the Equity Shares after the Equity Shares are listed. No assurance can be given regarding an active or sustained trading in the Equity Shares nor regarding the price at which the Equity Shares will be traded after
listing.
GENERAL RISK
Investments in equity and equity-related securities involve a degree of risk and investors should not invest any funds in the Offer unless they can afford to take the risk of losing their entire investment. Investors are advised to read the risk factors carefully before taking an investment decision in the Offer. For taking an investment decision, investors must rely on their own examination of our Company and the Offer, including the risks involved. The
Equity Shares in the Offer have not been recommended or approved by the Securities and Exchange Board of India (“SEBI”), nor does SEBI guarantee the accuracy or adequacy of the contents of this Red Herring Prospectus.
Specific attention of the investors is invited to “Risk Factors” on page 25.
OUR COMPANY’S AND SELLING SHAREHOLDERS’ ABSOLUTE RESPONSIBILITY
Our Company, having made all reasonable inquiries, accepts responsibility for and confirms that this Red Herring Prospectus contains all information with regard to our Company and the Offer, which is material in the context
of the Offer, that the information contained in this Red Herring Prospectus is true and correct in all material aspects and is not misleading in any material respect, that the opinions and intentions expressed herein are honestly held
and that there are no other facts, the omission or inclusion of which makes this Red Herring Prospectus as a whole or any of such information or the expression of any such opinions or intentions misleading in any material respect. Further, each Selling Shareholder severally and not jointly accepts responsibility for and confirms the statements specifically made or confirmed by such Selling Shareholder in this Red Herring Prospectus solely in relation to
itself and the respective portion of the Offered Shares and assumes responsibility that such statements are true and correct in all material respects and not misleading in any material respect. Each of the Selling Shareholders,
severally and not jointly, assume no responsibility for any other statements, made by or relating to our Company or its business in this Red Herring Prospectus.
LISTING
The Equity Shares offered through this Red Herring Prospectus are proposed to be listed on the Stock Exchanges. Our Company has received ‘in-principle’ approvals from BSE and NSE for the listing of the Equity Shares
pursuant to their letters dated August 17, 2021 and August 16, 2021, respectively. For the purposes of the Offer, the Designated Stock Exchange shall be NSE. A copy of this Red Herring Prospectus and the Prospectus shall be delivered to the RoC in accordance with Sections 26(4) and 32 of the Companies Act, 2013. For details of the material contracts and documents available for inspection from the date of this Red Herring Prospectus up to the
Bid/Offer Closing Date, see “Material Contracts and Documents for Inspection” on page 346.
BOOK RUNNING LEAD MANAGERS REGISTRAR TO THE OFFER
Axis Capital Limited
1st floor, Axis House
C-2 Wadia International Centre P.B. Marg, Worli
Mumbai 400 025
Maharashtra, India Tel: +91 22 4325 2183
E-mail: [email protected]
Website: www.axiscapital.co.in Investor grievance e-mail: [email protected]
Contact Person: Pratik Pednekar
SEBI Registration No.: INM000012029
Edelweiss Financial Services Limited
6th
Floor, Edelweiss House
Off CST Road, Kalina Mumbai 400 098
Maharashtra, India
Tel: + 91 22 4009 4400 E-mail: [email protected]
Investor grievance e-mail:
[email protected] Website: www.edelweissfin.com
Contact Person: Malay Shah
SEBI Registration No.: INM0000010650
IIFL Securities Limited
10th
Floor, IIFL Centre
Kamala City, Senapati Bapat Marg Lower Parel (West)
Mumbai 400 013
Maharashtra, India Tel: +91 22 4646 4600
E-mail: [email protected]
Investor grievance e-mail: [email protected] Website: www.iiflcap.com
Contact Person: Ujjaval Kumar/ Dhruv Bhagwat
SEBI Registration No.: INM000010940
Link Intime India Private Limited
C 101, 247 Park
L.B.S. Marg Vikhroli (West)
Mumbai 400 083
Maharashtra, India Tel: +91 22 4918 6200
E-mail: [email protected]
Website: www.linkintime.co.in Investor grievance e-mail:
Contact Person: Shanti Gopalkrishnan
SEBI Registration No.: INR000004058
BID/OFFER PROGRAMME
BID/OFFER OPENS ON* Monday, November 1, 2021
BID/OFFER CLOSES ON Wednesday, November 3, 2021
* Our Company and the Selling Shareholders in consultation with the Book Running Lead Managers may consider participation by Anchor Investors in accordance with the SEBI ICDR Regulations. The Anchor Investor
Bid/Offer Period shall be one Working Day prior to the Bid/ Offer Opening Date.

(This page is intentionally left blank)
(i)
TABLE OF CONTENTS
SECTION I: GENERAL ........................................................................................................................................................... 1
DEFINITIONS AND ABBREVIATIONS .............................................................................................................................. 1 SUMMARY OF THIS RED HERRING PROSPECTUS ...................................................................................................... 14 CERTAIN CONVENTIONS, PRESENTATION OF FINANCIAL, INDUSTRY AND MARKET DATA AND CURRENCY
OF PRESENTATION ............................................................................................................................................................ 19 FORWARD-LOOKING STATEMENTS ............................................................................................................................. 23
SECTION II: RISK FACTORS ............................................................................................................................................. 25
SECTION III: INTRODUCTION.......................................................................................................................................... 59
THE OFFER .......................................................................................................................................................................... 59 SUMMARY OF THE RESTATED CONSOLIDATED FINANCIAL INFORMATION ..................................................... 60 SUMMARY OF PROFORMA CONDENSED CONSOLIDATED FINANCIAL INFORMATION ................................... 68 GENERAL INFORMATION ................................................................................................................................................ 71 CAPITAL STRUCTURE ...................................................................................................................................................... 78 OBJECTS OF THE OFFER ................................................................................................................................................... 88 BASIS FOR OFFER PRICE .................................................................................................................................................. 90 STATEMENT OF POSSIBLE SPECIAL TAX BENEFITS ................................................................................................. 92
SECTION IV: ABOUT OUR COMPANY ............................................................................................................................ 96
INDUSTRY OVERVIEW ..................................................................................................................................................... 96 OUR BUSINESS ................................................................................................................................................................. 120 KEY REGULATIONS AND POLICIES ............................................................................................................................. 148 HISTORY AND CERTAIN CORPORATE MATTERS ..................................................................................................... 154 OUR MANAGEMENT ....................................................................................................................................................... 160 OUR PROMOTERS AND PROMOTER GROUP .............................................................................................................. 177 OUR GROUP COMPANIES ............................................................................................................................................... 180 DIVIDEND POLICY ........................................................................................................................................................... 182
SECTION V: FINANCIAL INFORMATION .................................................................................................................... 183
RESTATED CONSOLIDATED FINANCIAL INFORMATION ....................................................................................... 183 OTHER FINANCIAL INFORMATION ............................................................................................................................. 250 FINANCIAL INDEBTEDNESS ......................................................................................................................................... 252 CAPITALISATION STATEMENT .................................................................................................................................... 254 MANAGEMENT’S DISCUSSION AND ANALYSIS OF FINANCIAL CONDITION AND RESULTS OF OPERATIONS
............................................................................................................................................................................................. 255
SECTION VI: PROFORMA CONDENSED CONSOLIDATED FINANCIAL INFORMATION ............................... 291
SECTION VII: LEGAL AND OTHER INFORMATION ................................................................................................. 300
OUTSTANDING LITIGATION AND MATERIAL DEVELOPMENTS .......................................................................... 300 GOVERNMENT AND OTHER APPROVALS .................................................................................................................. 305 OTHER REGULATORY AND STATUTORY DISCLOSURES ....................................................................................... 307
SECTION VIII: OFFER INFORMATION ........................................................................................................................ 319
TERMS OF THE OFFER .................................................................................................................................................... 319 OFFER STRUCTURE ......................................................................................................................................................... 324 OFFER PROCEDURE ........................................................................................................................................................ 326 RESTRICTIONS ON FOREIGN OWNERSHIP OF INDIAN SECURITIES ..................................................................... 340
SECTION IX: DESCRIPTION OF EQUITY SHARES AND TERMS OF ARTICLES OF ASSOCIATION ............ 342
SECTION X: OTHER INFORMATION ............................................................................................................................ 346
MATERIAL CONTRACTS AND DOCUMENTS FOR INSPECTION ............................................................................. 346
DECLARATION ................................................................................................................................................................... 348
1
SECTION I: GENERAL
DEFINITIONS AND ABBREVIATIONS
This Red Herring Prospectus uses certain definitions and abbreviations which, unless the context otherwise indicates or implies,
shall have the meaning as provided below. References to any legislation, act, regulation, rules, guidelines or policies shall be
to such legislation, act, regulation, rules, guidelines or policies as amended, supplemented or re-enacted from time to time, and
any reference to a statutory provision shall include any subordinate legislation made from time to time under that provision.
The words and expressions used in this Red Herring Prospectus but not defined herein shall have, to the extent applicable, the
same meaning ascribed to such terms under the SEBI ICDR Regulations, the Companies Act, the SCRA, the Depositories Act
and the rules and regulations made thereunder. Further, Offer related terms used but not defined in this Red Herring Prospectus
shall have the meaning ascribed to such terms under the General Information Document. Notwithstanding the foregoing, the
terms used in “Industry Overview”, “Key Regulations and Policies”, “Statement of Possible Special Tax Benefits”, “Restated
Consolidated Financial Information”, “Proforma Condensed Consolidated Financial Information”, “Basis for Offer Price”,
“Outstanding Litigation and Material Developments”, “Description of Equity Shares and Terms of Articles of Association”
and“Offer Procedure”on pages 96, 148, 92, 183, 291, 90, 300, 342 and 326, respectively, shall have the meaning ascribed
to them in the relevant section.
General Terms
Term Description
“our Company” or “the
Company”
S.J.S. Enterprises Limited, a public limited company incorporated under the Companies Act, 1956 and
having its Registered and Corporate Office at Sy No 28/P16 of Agra village and Sy No 85/P6 of B.M
Kaval Village, Kengeri Hobli, Bangalore 560 082, Karnataka, India
“we”, “us” or “our” Unless the context otherwise indicates or implies, refers to our Company together with our Subsidiary, on
a consolidated basis
Company Related Terms
Term Description
“Articles of Association” or
“AoA”
Articles of association of our Company, as amended from time to time
Audit Committee Audit Committee of our Board, constituted in accordance with the applicable provisions of the Companies
Act, 2013 and the SEBI Listing Regulations, and as described in “Our Management” on page 160
“Auditors” or “Statutory
Auditors”
Statutory auditor of our Company, namely, B S R & Co. LLP, Chartered Accountants
“Board” or “Board of
Directors”
Board of Directors of our Company or a duly constituted committee thereof, as described in “Our
Management” on page 160
Committee(s) Duly constituted committee(s) of our Board of Directors
“Company Secretary and
Compliance Officer” or
“Company Secretary” or
“Compliance Officer”
The company secretary and compliance officer of our Company, Thabraz Hushain W. For details, see “Our
Management” on page 160
Corporate Social
Responsibility Committee
Corporate social responsibility committee of our Board, constituted in accordance with the applicable
provisions of the Companies Act, 2013, and as described in “Our Management” on page 160
Director(s) Directors on our Board as described in “Our Management” on page 160
Equity Shares Equity shares of face value of ₹10 each of our Company
ESOP 2021 SJS Enterprises - Employee Stock Option Plan 2021
Evergraph Evergraph Holdings Pte. Ltd.
Exotech Acquisition Acquisition of our Subsidiary by our Company on April 5, 2021 pursuant to the Exotech SPA
Exotech SPA Share purchase agreement dated March 11, 2021 and as amended on April 1, 2021 entered into among our
Company, our Subsidiary, Rajiv Kothari, Umesh Kothari and Exotech Exports and Investments Private
Limited
Independent Directors Independent Directors on our Board, as described in “Our Management” on page 160
IPO Committee IPO committee of our Board, as described in “Our Management” on page 160
“Key Managerial Personnel” or
“KMP”
Key managerial personnel of our Company identified in accordance with Regulation 2(1)(bb) of the SEBI
ICDR Regulations and Section 2(51) of the Companies Act, 2013 as described in “Our Management – Key
Managerial Personnel” on page 160
Managing Director Managing Director of our Company, K.A. Joseph. For details, see “Our Management” on page 160
2
Term Description
“Memorandum of Association”
or “MoA”
Memorandum of association of our Company, as amended from time to time
Nomination and Remuneration
Committee
Nomination and Remuneration Committee of our Board, constituted in accordance with the applicable
provisions of the Companies Act, 2013 and the SEBI Listing Regulations, and as described in “Our
Management” on page 160
Non-Executive Directors Non-executive Directors on our Board, as described in “Our Management” on page 160
Proforma Condensed
Consolidated Financial
Information
The proforma condensed consolidated financial information of our Company as at and for the financial
year ended March 31, 2021 for illustrative purposes presented in “Proforma Condensed Consolidated
Financial Information” on page 291, which is meant to illustrate the impact of the Exotech Acquisition on
our Company’s financial position as at March 31, 2021 and our Company’s financial performance for the
year ended March 31, 2021, as if the acquisition had taken place at an earlier date selected in accordance
with the SEBI ICDR Regulations, and which has been prepared in accordance with Ind AS, the Guidance
Note and the relevant provisions of the SEBI ICDR Regulations
Promoter Group Persons and entities constituting the promoter group of our Company in terms of Regulation 2(1)(pp) of
the SEBI ICDR Regulations, as disclosed in “Our Promoters and Promoter Group” on page 177
“Promoters” or “Promoter
Selling Shareholders”
The promoters of our Company, namely Evergraph Holdings Pte. Ltd. and K.A. Joseph. For details, see
“Our Promoters and Promoter Group” on page 177
“Registered and Corporate
Office” or “Registered Office”
Sy No 28/P16 of Agra village and Sy No 85/P6 of B.M Kaval Village, Kengeri Hobli, Bangalore 560 082,
Karnataka, India
“Registrar of Companies” or
“RoC”
Registrar of Companies, Karnataka at Bangalore
Restated Consolidated Financial Information
Restated financial statements of our Company and our Subsidiary as at and for the three month period
ended June 30, 2021, and as at and for the financial years ended March 31, 2021, March 31, 2020, and
March 31, 2019 (proforma), comprising: (i) the restated consolidated statement of asset and liabilities as
at June 30, 2021, and March 31, 2021, March 31, 2020, and March 31, 2019 (proforma), (ii) the restated
consolidated statement of profit and loss (including other comprehensive income), the restated
consolidated statement of changes in equity and the restated consolidated statement of cash flows for the
three month period ended June 30, 2021, and for each of the financial years ended March 31, 2021, March
31, 2020, and March 31, 2019 (proforma), and (iii) notes and annexures thereto, each prepared in
accordance with Ind AS, the requirements of Section 26 of Part I of Chapter III of the Companies Act, the
SEBI ICDR Regulations and the Guidance Note, each as amended from time to time
Exotech became our Subsidiary on April 5, 2021. As a result, our Restated Consolidated Financial
Information as at and for the three month period ended June 30, 2021 (which includes the financial
performance and financial condition of Exotech) may not be comparable to our Restated Consolidated
Financial Information for prior periods
Risk Management Committee Risk Management Committee of our Board, constituted in accordance with the applicable provisions of
the Companies Act, 2013 and the SEBI Listing Regulations, and as described in “Our Management” on
page 160
SCPL or “Sanders Consulting”
or “Group Company”
Sanders Consulting Private Limited
Selling Shareholders Evergraph and K.A. Joseph
Shareholders Holders of Equity Shares of our Company from time to time
S.J.S. Shareholders’
Agreement
Shareholders’ agreement dated July 2, 2015 executed between our Company, Evergraph and K.A. Joseph,
as amended on September 21, 2015 and September 14, 2020
Stakeholders’ Relationship
Committee
Stakeholders’ Relationship Committee of our Board, constituted in accordance with the applicable
provisions of the Companies Act, 2013 and the SEBI Listing Regulations, and as described in “Our
Management” on page 160
“Subsidiary”, “Material
Subsidiary” or “Exotech”
Exotech Plastics Private Limited, a private limited company incorporated under the Companies Act, 1956
and having its registered office at Plot No. F-27 C, MIDC Ranjangaon Village Karegaon, Taluka Shirur,
Pune 412 220, Maharashtra, India
Waiver and Termination
Agreement
Waiver and termination agreement dated July 1, 2021 to the S.J.S. Shareholders’ Agreement, executed
between our Company, Evergraph and K.A. Joseph
Offer Related Terms
Term Description
Acknowledgement Slip The slip or document issued by the relevant Designated Intermediary to a Bidder as proof of registration
of the Bid cum Application Form
“Allot” or “Allotment” or
“Allotted”
Unless the context otherwise requires, the transfer of the Offered Shares to the successful Bidder pursuant
to the Offer

3
Term Description
Allotment Advice A note or advice or intimation of Allotment, sent to the successful Bidders who have been or are to be
Allotted the Equity Shares after the Basis of Allotment has been approved by the Designated Stock
Exchange
Allottee A successful Bidder to whom the Equity Shares are Allotted
Anchor Investor A Qualified Institutional Buyer, applying under the Anchor Investor Portion in accordance with the
requirements specified in the SEBI ICDR Regulations and this Red Herring Prospectus and who has Bid
for an amount of at least ₹100 million
Anchor Investor Allocation
Price
The price at which Equity Shares will be allocated to the Anchor Investors in terms of this Red Herring
Prospectus and the Prospectus, which will be decided by our Company and Selling Shareholders in
consultation with the Book Running Lead Managers during the Anchor Investor Bid/ Offer Period
Anchor Investor Application
Form
The application form used by an Anchor Investor to make a Bid in the Anchor Investor Portion and which
will be considered as an application for Allotment in terms of this Red Herring Prospectus and Prospectus
Anchor Investor Bid/Offer
Period
One Working Day prior to the Bid/ Offer Opening Date, on which Bids by Anchor Investors shall be
submitted and allocation to the Anchor Investors shall be completed
Anchor Investor Offer Price The final price at which the Equity Shares will be Allotted to the Anchor Investors in terms of this Red
Herring Prospectus and the Prospectus, which will be a price equal to or higher than the Offer Price but not
higher than the Cap Price.
The Anchor Investor Offer Price will be decided by our Company and Selling Shareholders in consultation
with the Book Running Lead Managers
Anchor Investor Portion Up to 60% of the QIB Portion which may be allocated by our Company and Selling Shareholders in
consultation with the Book Running Lead Managers, to the Anchor Investors on a discretionary basis in
accordance with the SEBI ICDR Regulations.
One-third of the Anchor Investor Portion shall be reserved for domestic Mutual Funds, subject to valid
Bids being received from domestic Mutual Funds at or above the Anchor Investor Allocation Price, in
accordance with the SEBI ICDR Regulations
“Application Supported by
Blocked Amount” or “ASBA”
An application, whether physical or electronic, used by ASBA Bidders to make a Bid and authorizing an
SCSB to block the Bid Amount in the ASBA Account and will include applications made by RIBs using
the UPI Mechanism where the Bid Amount will be blocked upon acceptance of UPI Mandate Request by
RIBs using the UPI Mechanism
ASBA Account A bank account maintained with an SCSB by an ASBA Bidder, as specified in the ASBA Form submitted
by ASBA Bidders for blocking the Bid Amount mentioned in the relevant ASBA Form and includes the
account of a RIB which is blocked upon acceptance of a UPI Mandate Request made by the RIBs using
the UPI Mechanism
ASBA Bid A Bid made by an ASBA Bidder
ASBA Bidders All Bidders except Anchor Investors
ASBA Form An application form, whether physical or electronic, used by ASBA Bidders to submit Bids, which will be
considered as the application for Allotment in terms of this Red Herring Prospectus and the Prospectus
Axis Axis Capital Limited
Banker(s) to the Offer Collectively, Escrow Collection Bank, Public Offer Bank, Sponsor Bank and Refund Bank, as the case
may be
Basis of Allotment Basis on which Equity Shares will be Allotted to successful Bidders under the Offer and which is described
in “Offer Procedure” on page 326
“Bid” or “Bidding” An indication to make an offer during the Bid/ Offer Period by an ASBA Bidder pursuant to submission
of the ASBA Form, or during the Anchor Investor Bid/ Offer Period by an Anchor Investor, pursuant to
submission of the Anchor Investor Application Form, to purchase the Equity Shares at a price within the
Price Band, including all revisions and modifications thereto as permitted under the SEBI ICDR
Regulations and in terms of this Red Herring Prospectus and the Bid cum Application Form. The term
“Bidding” shall be construed accordingly
Bid Amount The highest value of optional Bids indicated in the Bid cum Application Form and, in the case of RIBs
Bidding at the Cut off Price, the Cap Price multiplied by the number of Equity Shares Bid for by such RIBs
and mentioned in the Bid cum Application Form and payable by the Bidder or blocked in the ASBA
Account of the ASBA Bidder, as the case may be, upon submission of the Bid.
Bid cum Application Form Anchor Investor Application Form or the ASBA Form, as the context requires
Bid Lot [●] Equity Shares and in multiples of [●] Equity Shares thereafter
Bid/Offer Closing Date Except in relation to any Bids received from the Anchor Investors, the date after which the Designated
Intermediaries will not accept any Bids, being November 3, 2021, which shall be published in all editions
of The Financial Express, an English national daily newspaper, all editions of Jansatta, a Hindi national
daily newspaper and regional edition of Vishwavani, a Kannada newspaper, Kannada being the regional
language of Karnataka, where our Registered and Corporate Office is located, each with wide circulation.
4
Term Description
In case of any revision, the extended Bid/Offer Closing Date shall also be notified on the websites of the
Book Running Lead Managers and at the terminal of the Syndicate Member and communicated to the
Designated Intermediaries and the Sponsor Bank, which shall also be notified in an advertisement in the
same newspapers in which the Bid/ Offer Opening Date was published, as required under the SEBI ICDR
Regulations
Bid/ Offer Opening Date Except in relation to any Bids received from the Anchor Investors, the date on which the Designated
Intermediaries shall start accepting Bids, being November 1, 2021, which shall be published in all editions
of The Financial Express, an English national daily newspaper, all editions of Jansatta, a Hindi national
daily newspaper and regional edition of Vishvawani, a Kannada newspaper, Kannada being the regional
language of Karnataka, where our Registered and Corporate Office is located, each with wide circulation
Bid/ Offer Period Except in relation to Anchor Investors, the period between the Bid/ Offer Opening Date and the Bid/ Offer
Closing Date, inclusive of both days, during which prospective Bidders can submit their Bids, including
any revisions thereof, in accordance with the SEBI ICDR Regulations and the terms of this Red Herring
Prospectus. Provided however, that the Bidding shall be kept open for a minimum of three Working Days
for all categories of Bidders, other than Anchor Investors
Bidder Any prospective investor who makes a Bid pursuant to the terms of this Red Herring Prospectus and the
Bid cum Application Form and unless otherwise stated or implied, includes an Anchor Investor
Bidding Centres The centres at which the Designated Intermediaries shall accept the Bid cum Application Forms, i.e.,
Designated Branches for SCSBs, Specified Locations for the Syndicate, Broker Centres for Registered
Brokers, Designated RTA Locations for RTAs and Designated CDP Locations for CDPs
Book Building Process Book building process, as provided in Part A of Schedule XIII of the SEBI ICDR Regulations, in terms of
which the Offer is being made
“Book Running Lead
Managers” or “BRLMs”
The book running lead managers to the Offer, namely, Axis Capital Limited, Edelweiss Financial Services
Limited and IIFL Securities Limited
Broker Centres The broker centres notified by the Stock Exchanges where Bidders can submit the ASBA Forms to a
Registered Broker provided that Retail Individual Bidders may only submit ASBA Forms at such broker
centres if they are Bidding using the UPI Mechanism.
The details of such Broker Centres, along with the names and the contact details of the Registered Brokers
are available on the respective websites of the Stock Exchanges (www.bseindia.com and
www.nseindia.com)
“CAN” or “Confirmation of
Allocation Note”
Notice or intimation of allocation of the Equity Shares sent to Anchor Investors, who have been allocated
the Equity Shares, on or after the Anchor Investor Bid/ Offer Period
Cap Price The higher end of the Price Band, subject to any revisions thereto, above which the Offer Price and the
Anchor Investor Offer Price will not be finalised and above which no Bids will be accepted
Cash Escrow and Sponsor
Bank Agreement
Agreement dated October 21, 2021 entered amongst our Company, the Selling Shareholders, the Book
Running Lead Managers, the Bankers to the Offer and Registrar to the Offer, inter alia, for the appointment
of the Sponsor Bank in accordance with the UPI Circulars, for collection of the Bid Amounts from Anchor
Investors, transfer of funds to the Public Offer Account and where applicable, remitting refunds of the
amounts collected from Anchor Investors, on the terms and conditions thereof
Client ID The client identification number maintained with one of the Depositories in relation to the demat account
“Collecting Depository
Participant” or “CDP”
A depository participant as defined under the Depositories Act registered with SEBI and who is eligible to
procure Bids from relevant Bidders at the Designated CDP Locations in terms of the SEBI circular number
CIR/CFD/POLICYCELL/11/2015 dated November 10, 2015 issued by SEBI as per the list available on
the websites of BSE and NSE, as updated from time to time
CRIS CRISIL’s Ratings Division / CRISIL Risk and Infrastructure Solutions Limited
CRISIL CRISIL Limited
CRISIL Report A report issued in June 2021, titled “Assessment of Select Aesthetic Components” that has been prepared
by CRISIL Research. Certain data and information as of October 1, 2021 pertaining to affordable housing
progress, FY 2021 production and sales figures for passenger vehicles, two wheelers and consumer durable,
export figures for vehicle segments for FY 2021, consumer durable market insights for FY 2021,
macroeconomic parameters, near term outlook have been updated in the CRISIL Report
CRISIL Research A division of CRISIL
Cut-off Price The Offer Price, finalised by our Company and the Selling Shareholders in consultation with the Book
Running Lead Managers, which shall be any price within the Price Band.
Only Retail Individual Bidders Bidding in the Retail Portion are entitled to Bid at the Cut-off Price. QIBs
and Non-Institutional Bidders are not entitled to Bid at the Cut-off Price
Demographic Details Details of the Bidders including the Bidders’ address, name of the Bidders’ father/husband, investor status,
occupation, bank account details and UPI ID, wherever applicable
5
Term Description
Designated Branches Such branches of the SCSBs which shall collect the ASBA Forms, a list of which is available on the website
of SEBI at https://www.sebi.gov.in/sebiweb/other/OtherAction.do?doRecognised=yes or at such other
website as may be prescribed by SEBI from time to time
Designated CDP Locations Such locations of the CDPs where Bidders can submit the ASBA Forms.
The details of such Designated CDP Locations, along with names and contact details of the CDPs eligible
to accept ASBA Forms are available on the respective websites of the Stock Exchanges
(www.bseindia.com and www.nseindia.com), as updated from time to time
Designated Date The date on which the Escrow Collection Bank transfers funds from the Escrow Account to the Public
Offer Account or the Refund Account, as the case may be, and the instructions are issued to the SCSBs (in
case of RIBs using UPI Mechanism, instruction issued through the Sponsor Bank) for the transfer of
amounts blocked by the SCSBs in the ASBA Accounts to the Public Offer Account, as the case may be, in
terms of this Red Herring Prospectus and the Prospectus following which Equity Shares will be Allotted
in the Offer after finalization of the Basis of Allotment in consultation with the Designated Stock Exchange
Designated Intermediary(ies) In relation to ASBA Forms submitted by RIBs by authorising an SCSB to block the Bid Amount in the
ASBA Account, Designated Intermediaries shall mean SCSBs.
In relation to ASBA Forms submitted by RIBs where the Bid Amount will be blocked upon acceptance of
UPI Mandate Request by such RIB using the UPI Mechanism, Designated Intermediaries shall mean
Syndicate, sub-syndicate/agents, Registered Brokers, CDPs, SCSBs and RTAs.
In relation to ASBA Forms submitted by QIBs and non-institutional Bidders, Designated Intermediaries
shall mean Syndicate, sub-syndicate/ agents, SCSBs, Registered Brokers, the CDPs and RTAs
Designated RTA Locations Such locations of the RTAs where Bidders can submit the ASBA Forms to RTAs. The details of such
Designated RTA Locations, along with names and contact details of the RTAs eligible to accept ASBA
Forms are available on the respective websites of the Stock Exchanges (www.bseindia.com and
www.nseindia.com), as updated from time to time
Designated Stock Exchange NSE
“Draft Red Herring
Prospectus” or “DRHP”
The draft red herring prospectus dated July 27, 2021 issued in accordance with the SEBI ICDR Regulations,
which did not contain complete particulars of the price at which the Equity Shares will be Allotted and the
size of the Offer
Edelweiss Edelweiss Financial Services Limited
Eligible NRI(s) NRI(s) from jurisdictions outside India where it is not unlawful to make an offer or invitation under the
Offer and in relation to whom the ASBA Form and this Red Herring Prospectus will constitute an invitation
to subscribe to or to purchase the Equity Shares
Escrow Account(s) The account(s) opened with the Escrow Collection Bank and in whose favour the Anchor Investors will
transfer money through NACH/direct credit/NEFT/RTGS in respect of the Bid Amount when submitting
a Bid
Escrow Collection Bank Bank which is a clearing member and registered with SEBI as a banker to an issue under the SEBI BTI
Regulations and with whom the Escrow Account(s) have been opened, in this case being Axis Bank
Limited
First Bidder or Sole Bidder Bidder whose name shall be mentioned in the Bid cum Application Form or the Revision Form and in case
of joint Bids, whose name shall also appear as the first holder of the beneficiary account held in joint names
Floor Price The lower end of the Price Band, subject to any revision(s) thereto, not being less than the face value of
Equity Shares, at or above which the Offer Price and the Anchor Investor Offer Price will be finalised and
below which no Bids will be accepted
Fugitive Economic Offender An individual who is declared a fugitive economic offender under Section 12 of the Fugitive Economic
Offenders Act, 2018
“General Information
Document” or “GID”
The General Information Document for investing in public issues prepared and issued in accordance with
the SEBI circular no. SEBI/HO/CFD/DIL1/CIR/P/2020/37 dated March 17, 2020 and the UPI Circulars,
as amended from time to time. The General Information Document shall be available on the websites of
the Stock Exchanges and the Book Running Lead Managers
IIFL IIFL Securities Limited
Mutual Fund Portion 5% of the Net QIB Portion, or [●] Equity Shares which shall be available for allocation to Mutual Funds
only on a proportionate basis, subject to valid Bids being received at or above the Offer Price
Net QIB Portion QIB Portion less the number of Equity Shares Allotted to the Anchor Investors
Non-Institutional Bidders All Bidders that are not QIBs or Retail Individual Bidders and who have Bid for Equity Shares for an
amount of more than ₹200,000 (but not including NRIs other than Eligible NRIs)
Non-Institutional Portion The portion of the Offer being not less than 15% of the Offer consisting of [●] Equity Shares which shall
be available for allocation on a proportionate basis to Non-Institutional Bidders, subject to valid Bids being
received at or above the Offer Price
Non-Resident Person resident outside India, as defined under FEMA and includes non-resident Indians, FVCIs and FPIs

6
Term Description
“Offer” or “Offer for Sale” Initial public offer of up to [●] Equity Shares of face value of ₹10 each aggregating up to ₹8,000.00 million
of our Company for cash at a price of ₹[●] per Equity Share through an offer for sale of up to [●] Equity
Shares offered for sale, comprising of up to [●] Equity Shares by Evergraph aggregating up to ₹7,100.00
million and up to [●] Equity Shares by K.A. Joseph aggregating up to ₹900.00 million
Offer Agreement Agreement dated July 27, 2021 entered amongst our Company, Selling Shareholders and the Book Running
Lead Managers, pursuant to which certain arrangements have been agreed to in relation to the Offer
Offer Price The final price at which Equity Shares will be Allotted to ASBA Bidders in terms of this Red Herring
Prospectus and the Prospectus. Equity Shares will be Allotted to Anchor Investors at the Anchor Investor
Offer Price, which will be decided by our Company and the Selling Shareholders, in consultation with the
Book Running Lead Managers, in terms of this Red Herring Prospectus and the Prospectus.
The Offer Price will be decided by our Company and the Selling Shareholders in consultation with the
Book Running Lead Managers, on the Pricing Date in accordance with the Book Building Process and this
Red Herring Prospectus.
Offer Proceeds The proceeds of the Offer. For further information about use of the Offer Proceeds, see “Objects of the
Offer” on page 88
Offered Shares Up to [●] Equity Shares aggregating to ₹8,000.00 million offered by the Selling Shareholders in the Offer
for Sale
Price Band The price band of a minimum price of ₹ [●] per Equity Share (Floor Price) and the maximum price of ₹[●]
per Equity Share (Cap Price) including any revisions thereof.
The Price Band and the minimum Bid Lot size for the Offer will be decided by our Company and the
Selling Shareholders in consultation with the Book Running Lead Managers, and will be advertised, at
least two Working Days prior to the Bid/ Offer Opening Date, in all editions of The Financial Express, an
English national daily newspaper, all editions of Jansatta, a Hindi national daily newspaper and regional
edition of Vishwavani, a Kannada newspaper, Kannada being the regional language of Bangalore, where
our Registered and Corporate Office is located, each with wide circulation and shall be made available to
the Stock Exchanges for the purpose of uploading on their respective websites
Pricing Date The date on which our Company and the Selling Shareholders, in consultation with the Book Running Lead
Managers, will finalise the Offer Price
Prospectus The prospectus to be filed with the RoC on or after the Pricing Date in accordance with Section 26 of the
Companies Act, 2013 and the SEBI ICDR Regulations containing, inter alia, the Offer Price that is
determined at the end of the Book Building Process, the size of the Offer and certain other information,
including any addenda or corrigenda thereto
Public Offer Account Bank account to be opened with the Public Offer Bank, under Section 40(3) of the Companies Act, 2013
to receive monies from the Escrow Account and ASBA Accounts on the Designated Date
Public Offer Bank Bank which is a clearing member and registered with SEBI as a banker to an issue and with which the
Public Offer Account will be opened, in this case being Axis Bank Limited
QIB Portion The portion of the Offer (including the Anchor Investor Portion) being not more than 50% of the Offer
comprising [●] Equity Shares which shall be allocated to QIBs (including Anchor Investors), subject to
valid Bids being received at or above the Offer Price or Anchor Investor Offer Price (for Anchor Investors).
Our Company and the Selling Shareholders, in consultation with the Book Running Lead Managers may
allocate up to 60% of the QIB portion to Anchor Investors on a discretionary basis
“Qualified Institutional
Buyers”, “QIBs” or “QIB
Bidders”
Qualified institutional buyers as defined under Regulation 2(1)(ss) of the SEBI ICDR Regulations
“Red Herring Prospectus” or
“RHP”
This red herring prospectus dated October 22, 2021, issued by our Company in accordance with Section
32 of the Companies Act, 2013 and the provisions of the SEBI ICDR Regulations, which does not have
complete particulars of the Offer Price and the size of the Offer, including any addenda or corrigenda
thereto. This Red Herring Prospectus has been filed with the RoC at least three Working Days before the
Bid/ Offer Opening Date and will become the Prospectus upon filing with the RoC after the Pricing Date
Refund Account Account to be opened with the Refund Bank, from which refunds, if any, of the whole or part of the Bid
Amount to the Bidders shall be made
Refund Bank Bank which is a clearing member and registered with SEBI as a banker to an issue under the SEBI BTI
Regulations and with whom the Refund Account will be opened, in this case being Axis Bank Limited
Registered Brokers Stock brokers registered under the Securities and Exchange Board of India (Stock Brokers) Regulations,
1992, as amended with SEBI and the stock exchanges having nationwide terminals, other than the members
of the Syndicate and eligible to procure Bids in terms of the SEBI circular number CIR/CFD/14/2012 dated
October 4, 2012 issued by SEBI
Registrar Agreement Agreement dated July 23, 2021 entered by and amongst our Company, Selling Shareholders and the
Registrar to the Offer, in relation to the responsibilities and obligations of the Registrar to the Offer
pertaining to the Offer
7
Term Description
“Registrar and Share Transfer
Agents” or “RTAs”
Registrar and share transfer agents registered with SEBI and eligible to procure Bids from relevant Bidders
at the Designated RTA Locations as per the list available on the websites of BSE and NSE, and the UPI
Circulars
“Registrar to the Offer” or
“Registrar”
Link Intime India Private Limited
“Retail Individual Bidder(s)”
or “RIB(s)”
Individual Bidders, who have Bid for the Equity Shares for an amount not more than ₹200,000 in any of
the bidding options in the Offer (including HUFs applying through their Karta and Eligible NRIs)
Retail Portion Portion of the Offer being not less than 35% of the Offer consisting of [●] Equity Shares which shall be
available for allocation to Retail Individual Bidders (subject to valid Bids being received at or above the
Offer Price), which shall not be less than the minimum Bid Lot subject to availability in the Retail Portion,
and the remaining Equity Shares to be Allotted on a proportionate basis
Revision Form Form used by the Bidders to modify the quantity of the Equity Shares or the Bid Amount in any of their
Bid cum Application Forms or any previous Revision Form(s), as applicable.
QIB Bidders and Non-Institutional Bidders are not allowed to withdraw or lower their Bids (in terms of
quantity of Equity Shares or the Bid Amount) at any stage. Retail Individual Bidders can revise their Bids
during the Bid/ Offer Period and withdraw their Bids until Bid/Offer Closing Date
“Self-Certified Syndicate
Bank(s)” or “SCSB(s)”
The banks registered with SEBI, which offer the facility of ASBA services, (i) in relation to ASBA, where
the Bid Amount will be blocked by authorising an SCSB, a list of which is available on the website of
SEBI at www.sebi.gov.in/sebiweb/other/OtherAction.do?doRecognisedFpi=yes&intmId=34 and updated
from time to time and at such other websites as may be prescribed by SEBI from time to time, (ii) in relation
to RIBs using the UPI Mechanism, a list of which is available on the website of SEBI at
https://sebi.gov.in/sebiweb/other/OtherAction.do?doRecognisedFpi=yes&intmId=40 or such other
website as may be prescribed by SEBI and updated from time to time.
Applications through UPI in the Offer can be made only through the SCSBs mobile applications whose
name appears on the SEBI website. A list of SCSBs and mobile application, which, are live for applying
in public issues using UPI mechanism is provided as Annexure ‘A’ to the SEBI circular number
SEBI/HO/CFD/DIL2/CIR/P/2019/85 dated July 26, 2019. The said list is available on the website of SEBI
at https://www.sebi.gov.in/sebiweb/other/OtherAction.do?doRecognisedFpi=yes&intmId=43, as updated
from time to time
Share Escrow Agent The share escrow agent appointed pursuant to the Share Escrow Agreement, namely, Link Intime India
Private Limited
Share Escrow Agreement Share escrow agreement dated October 20, 2021 between our Company, Selling Shareholders and the Share
Escrow Agent, in connection with the transfer of the Offered Shares by the Selling Shareholders and credit
of such Equity Shares to the demat account of the Allottees in accordance with the Basis of Allotment
Specified Locations Bidding Centres where the Syndicate shall accept Bid cum Application Forms
Sponsor Bank Axis Bank Limited, being a Banker to the Offer, appointed by our Company to act as a conduit between
the Stock Exchanges and NPCI in order to push the mandate collect requests and / or payment instructions
of the RIBs using the UPI Mechanism and carry out other responsibilities, in terms of the UPI Circulars
“Syndicate” or “Members of
the Syndicate”
Collectively, the Book Running Lead Managers and the Syndicate Member
Syndicate Agreement Agreement dated October 20, 2021 entered amongst our Company, Selling Shareholders, the Book
Running Lead Managers and the Syndicate Member, in relation to collection of Bids by the Syndicate
Syndicate Member Intermediary registered with SEBI who is permitted to carry out activities as an underwriter, namely,
Edelweiss Securities Limited
Underwriters [●]
Underwriting Agreement Agreement to be entered amongst our Company and the Underwriters to be entered into on or after the
Pricing Date but prior to filing of the Prospectus with the RoC
UPI Unified payments interface which is an instant payment mechanism, developed by NPCI
UPI PIN Password to authenticate UPI transaction
UPI Circulars SEBI circular number SEBI/HO/CFD/DIL2/CIR/P/2018/138 dated November 1, 2018, SEBI circular
number SEBI/HO/CFD/DIL2/CIR/P/2019/50 dated April 3, 2019, SEBI circular number
SEBI/HO/CFD/DIL2/CIR/P/2019/76 dated June 28, 2019, SEBI circular number
SEBI/HO/CFD/DIL2/CIR/P/2019/85 dated July 26, 2019, SEBI circular number
SEBI/HO/CFD/DCR2/CIR/P/2019/133 dated November 8, 2019, SEBI circular number
SEBI/HO/CFD/DIL2/CIR/P/2020 dated March 30, 2020, SEBI circular number
SEBI/HO/CFD/DIL2/CIR/P/2021/2480/1/M dated March 16, 2021, SEBI circular no.
SEBI/HO/CFD/DIL1/CIR/P/2021/47 dated March 31, 2021, SEBI circular no.
SEBI/HO/CFD/DIL2/P/CIR/2021/570 dated June 2, 2021 and any subsequent circulars or notifications
issued by SEBI in this regard
UPI ID ID created on the UPI for single-window mobile payment system developed by the NPCI
8
Term Description
UPI Mandate Request A request (intimating the RIB by way of a notification on the UPI linked mobile application as disclosed
by SCSBs on the website of SEBI and by way of an SMS on directing the RIB to such UPI linked mobile
application) to the RIB initiated by the Sponsor Bank to authorise blocking of funds on the UPI application
equivalent to Bid Amount and subsequent debit of funds in case of Allotment
UPI Mechanism The bidding mechanism that may be used by an RIB in accordance with the UPI Circulars to make an
ASBA Bid in the Offer
Wilful Defaulter A company or person, as the case may be, categorised as a wilful defaulter by any bank or financial
institution or consortium thereof, in accordance with the guidelines on wilful defaulters issued by the RBI
and includes any company whose director or promoter is categorised as such
Working Day(s) All days on which commercial banks in Mumbai are open for business provided however, with reference
to (a) announcement of Price Band and (b) Bid/Offer Period, the term Working Day shall mean all days,
excluding Saturdays, Sundays and public holidays, on which commercial banks in Mumbai are open for
business and (c) the time period between the Bid/ Offer Closing Date and the listing of the Equity Shares
on the Stock Exchanges, “Working Day” shall mean all trading days of the Stock Exchanges, excluding
Sundays and bank holidays in India, as per circulars issued by SEBI, including the UPI Circulars
Technical/Industry Related Terms or Abbreviations
Term Description
2D Two-dimensional
3D Three-dimensional
ACMA Automotive Component Manufacturers Association of India
ASEAN Association of Southeast Asian Nations
Ashok Leyland Ashok Leyland Limited
B&M Brick and mortar
Bajaj Auto Bajaj Auto Limited
BS Bharat stage
Brembo Brembo S.P.A.
CAD Computer-aided design
CAGR Compound annual growth rate
Capital Employed Capital employed is calculated as total assets less current liabilities, cash and cash equivalents, bank
balances other than cash and cash equivalents and investments.
CTV Color televisions
EBITDA Earnings before interest, taxes, depreciation and amortization. For a brief explanation on the calculation
of EBITDA, see “Management’s Discussion and Analysis of Financial Conditional and Results of
Operations—Non-GAAP Measures—EBIT, EBITDA and EBITDA Margin” on page 255. Also see
“Certain Conventions, Presentation of Financial, Industry and Market Data and Currency of
Presentation—Non-GAAP Financial Measures” on page 19
EBITDA Margin Calculated by dividing our EBITDA during a given period by total operating revenue during that period,
and is expressed as a percentage. For a brief explanation on the calculation of EBITDA Margin, see
“Management’s Discussion and Analysis of Financial Conditional and Results of Operations—Non-
GAAP Measures—EBIT, EBITDA and EBITDA Margin” on page 255. Also see “Certain Conventions,
Presentation of Financial, Industry and Market Data and Currency of Presentation—Non-GAAP
Financial Measures” on page 19
EBIT Earnings before interest and taxes. For a brief explanation on the calculation of EBIT, see “Management’s
Discussion and Analysis of Financial Conditional and Results of Operations—Non-GAAP Measures—
EBIT, EBITDA and EBITDA Margin” on page 255. Also see “Certain Conventions, Presentation of
Financial, Industry and Market Data and Currency of Presentation—Non-GAAP Financial Measures” on
page 19
EMEA Europe, Middle East, and Africa
ERP Enterprise resource planning
Eicher VE Commercial Vehicles, a Volvo Group and Eicher Motors joint venture
Eureka Forbes Eureka Forbes Limited
EV Electric vehicle
FCFF Free cash flow to the firm. For a brief explanation on the calculation of FCFF, see “Management’s
Discussion and Analysis of Financial Conditional and Results of Operations—Non-GAAP Measures—
FCFF” on page 255
9
Term Description
FMCG Fast moving consumer goods
Geberit Geberit India Manufacturing Private Limited
Godrej Godrej & Boyce Manufacturing Company Limited
Honda Motorcycle Honda Motorcycle and Scooter India Private Limited
HUD Heads-up display
IATF International Automotive Task Force
IME In-mold electronics
IML/IMD In-mold label or in-mold decorations
ISO International Organisation for Standardisation
John Deere John Deere India Private Limited
LED Light emitting diodes
LEED Leadership in Energy and Environment Design
Liebherr Liebherr Appliances India Private Limited
Mahindra & Mahindra Mahindra & Mahindra Limited
Marelli Marelli UM Electronic Systems Private Limited
Mindarika Mindarika Private Limited, a part of the Uno Minda Group
NPD New product development
NSO National Statistics Office
OECD Organization for Economic Cooperation and Development
OEM Original equipment manufacturers
Panasonic Panasonic India Private Limited
Passenger vehicles Four-wheeler vehicles, but does not include commercial vehicles
PAT Profit for the year, as mentioned in the Restated Consolidated Financial Information
PAT Margin Calculated by dividing our PAT during a given period by revenue from operations during that period, and
is expressed as a percentage. For a brief explanation on the calculation of PAT Margin, see “Management’s
Discussion and Analysis of Financial Conditional and Results of Operations—Non-GAAP Measures—
EBIT, EBITDA and EBITDA Margin” on page 255
PC Polycarbonate
PCBA Printed circuit board assembly
PET Polyethylene therephalete
PFCE Private final consumption expenditure
PLI Production-linked incentive
PU Polyurethane
PVC Polyvinyl chloride
PV Passenger vehicles
QCFI Quality Circle Forum of India
R&D Research and development
RAC Room air conditioners
Revolt Motors Revolt Intellicorp Private Limited
RFQs Request-for-quotes
RoCE Calculated by dividing our EBIT by Capital Employed. For a brief explanation on the calculation of RoCE,
see “Management’s Discussion and Analysis of Financial Conditional and Results of Operations—Non-
GAAP Measures—RoCE” on page 255
RoE Equal to profit for the year divided by the equity during that period, and is expressed as a percentage. For
a brief explanation on the calculation of RoE, see “Management’s Discussion and Analysis of Financial
Conditional and Results of Operations—Non-GAAP Measures—RoE” on page 255
Royal Enfield Royal Enfield, a unit of Eicher Motors Limited
RPM Revolutions-per-minute
Samsung Samsung India Electronics Private Limited
SCADA Supervisory control and data acquisition
10
Term Description
Sensa Core Sensa Core Medical Instrumentation Private Limited
SKUs Stock keeping units
Suzuki Suzuki Motorcycle India Private Limited
TFT Thin-film transistor
Tier-1 A company that supplies components directly to an OEM
TVS Motors TVS Motor Company Limited
UV Ultraviolet
Visteon India Visteon Electronics India Private Limited
Visteon Subsidiaries and group companies of Visteon Corporation including, Visteon Electronics India Private
Limited, Visteon Amazonas LTDA, Visteon Planta Chihuahua, Visteon Portugesa Limited, Visteon
Systems LLC, Visteon Electronics Rus LLC, Visteon Electronics Slovakia, Visteon Automotive
Electronics Thailand Limited, Visteon Electronics Tunisia and Astra Visteon Vietnam Company Limited
Volkswagen Skoda Auto Volkswagen India Private Limited
WEO World economic outlook
Whirlpool India Whirlpool of India Limited
Whirlpool Certain entities controlled by Whirlpool Corporation located outside India
WM Washing machines
Conventional and General Terms or Abbreviations
Term Description
“₹” or “Rs.” or “Rupees”
“INR”
Indian Rupees
AIFs Alternative Investment Funds, as defined in, and registered under the SEBI AIF Regulations
Air Act Air (Prevention and Control of Pollution) Act, 1981
AGM Annual general meeting
AS or Accounting Standards Accounting standards issued by the ICAI
BSE BSE Limited
Calendar Year Unless stated otherwise, the period of 12 months ending December 31 of that particular year
Category I AIF AIFs who are registered as “Category I Alternative Investment Funds” under the SEBI AIF Regulations
Category II AIF AIFs who are registered as “Category II Alternative Investment Funds” under the SEBI AIF Regulations
Category I FPIs FPIs who are registered as “Category I Foreign Portfolio Investors” under the SEBI FPI Regulations
Category III AIF AIFs who are registered as “Category III Alternative Investment Funds” under the SEBI AIF Regulations
Category II FPIs FPIs who are registered as “Category II foreign portfolio investors” under the SEBI FPI Regulations
CDSL Central Depository Services (India) Limited
CIN Corporate Identity Number
CODM Chief Operating Decision Maker
“Companies Act” or
“Companies Act, 2013”
Companies Act, 2013, along with the relevant rules made thereunder
Companies Act, 1956 Companies Act, 1956, along with the relevant rules made thereunder
COVID-19 A novel strain of coronavirus disease, recognized by the World Health Organization as a public health
emergency of international concern on January 30, 2020, and as a pandemic on March 11, 2020
Depositories NSDL and CDSL
Depositories Act Depositories Act, 1996
DIN Director Identification Number
“DP” or “Depository
Participant”
A depository participant as defined under the Depositories Act
DP ID Depository Participant’s Identification
DPIIT Department for Promotion of Industry and Internal Trade, Ministry of Commerce and Industry,
Government of India (formerly known as the Department of Industrial Policy and Promotion)
DP ID Depository Participant Identification
11
Term Description
“DP” or “Depository
Participant”
Depository participant as defined under the Depositories Act
EBLR Eternal Benchmark based Lending Rate
EGM Extraordinary general meeting
EIA 2020 Draft Environment Impact Assessment 2020
EPS Earnings Per Share. For a brief explanation on the calculation of EPS, see “Other Financial Information”
on page 235. Also see “Certain Conventions, Presentation of Financial, Industry and Market Data and
Currency of Presentation— Non-GAAP Financial Measures” on page 19
ESG Environmental, Social and Governance
FCFF Free cash flow to the firm
FDI Foreign direct investment
FDI Policy Consolidated Foreign Direct Investment Policy notified by the DPIIT by way of circular bearing number
DPIIT file number 5(2)/2020-FDI Policy dated October 15, 2020 effective from October 15, 2020
FEMA The Foreign Exchange Management Act, 1999, read with rules and regulations thereunder
FEMA Non-debt Instruments
Rules
Foreign Exchange Management (Non-debt Instruments) Rules, 2019
FEMA Regulations The Foreign Exchange Management (Non Debt Instruments) Rules, 2019, the Foreign Exchange
Management (Mode of Payment and Reporting of Non Debt Instruments) Regulations, 2019 and the
Foreign Exchange Management (Debt Instruments) Regulations, 2019, as applicable
“Financial Year” or “Fiscal’ or
“Fiscal Year” or “FY”
Unless stated otherwise, the period of 12 months ending March 31 of that particular year
FPI(s) Foreign Portfolio Investors as defined under the SEBI FPI Regulations
FVCI(s) Foreign venture capital investors as defined and registered under the SEBI FVCI Regulations
FVTPL Fair value through profit or loss
GDP Gross Domestic Product
“GoI” or “Government or
Central Government”
Government of India
GST Goods and Services Tax
Guidance Note Guidance Note on “Reports in Company Prospectuses (Revised 2019)” issued by the ICAI
Hazardous Waste Rules Hazardous and Other Wastes (Management and Transboundary Movement) Rules, 2016
IBC The Insolvency and Bankruptcy Code, 2016
ICAI The Institute of Chartered Accountants of India
ICSI The Institute of Company Secretaries of India
HUF Hindu Undivided Family
IFRS International Financial Reporting Standards
IFSC Indian Financial System Code
IMF International Monetary Fund
IMPS Immediate Payment Service
“Ind AS” or “Indian
Accounting Standards”
Indian Accounting Standards notified under Section 133 of the Companies Act, 2013 read with the
Companies (Indian Accounting Standards) Rules, 2015
Ind AS 101 Ind AS 101 – First time adoption of Indian Accounting Standards
India Republic of India
“Indian GAAP” or “IGAAP” Generally Accepted Accounting Principles in India notified under section 133 of the Companies Act and
read together with paragraph 7 of the Companies (Accounts) Rules, 2014 and Companies (Accounting
Standards) Amendment Rules, 2016
IPO Initial public offering
IRDAI Insurance Regulatory and Development Authority of India
IST Indian Standard Time
IT Information Technology
IT Act The Income Tax Act, 1961
KIADB Karnataka Industrial Area Development Board
KYC Know your customer
12
Term Description
MAT Minimum alternative tax
MCA Ministry of Corporate Affairs
MCLR Marginal Cost of Funds Based Landing Rate
MEIS Merchandise Exports from India Scheme
MSMEs Micro, Small, and Medium Enterprises
Mutual Funds Mutual funds registered under the Securities and Exchange Board of India (Mutual Funds) Regulations,
1996
N/A Not applicable
NACH National Automated Clearing House
NAV Net asset value per equity share represents total equity as at the end of the fiscal year, as restated, divided
by the number of Equity Shares outstanding at the end of the year. For a brief explanation on the calculation
of NAV, see “Other Financial Information” on page 235. Also, see “Certain Conventions, Presentation
of Financial, Industry and Market Data and Currency of Presentation— Non-GAAP Financial Measures”
on page 19
NBFC Non-Banking Financial Company
NEFT National Electronic Funds Transfer
Net Worth Net Worth as defined under Regulation 2(1)(hh) of the SEBI ICDR Regulations, i.e., the aggregate value
of the paid-up share capital and all reserves created out of the profits and securities premium account and
debit or credit balance of profit and loss account, after deducting the aggregate value of the accumulated
losses, deferred expenditure and miscellaneous expenditure not written off, but does not include reserves
created out of revaluation of assets, write-back of depreciation and amalgamation. Also see “Certain
Conventions, Presentation of Financial, Industry and Market Data and Currency of Presentation— Non-
GAAP Financial Measures” on page 19
NPCI National Payments Corporation of India
NRI Person resident outside India, who is a citizen of India or a person of Indian origin, and shall have the
meaning ascribed to such term in the Foreign Exchange Management (Deposit) Regulations, 2016 or an
overseas citizen of India cardholder within the meaning of Section 7(A) of the Citizenship Act, 1955
NSDL National Securities Depository Limited
NSE National Stock Exchange of India Limited
“OCB” or “Overseas Corporate
Body”
A company, partnership, society or other corporate body owned directly or indirectly to the extent of at
least 60% by NRIs including overseas trusts, in which not less than 60% of beneficial interest is irrevocably
held by NRIs directly or indirectly and which was in existence on October 3, 2003 and immediately before
such date had taken benefits under the general permission granted to OCBs under FEMA. OCBs are not
allowed to invest in the Offer
p.a. Per annum
P/E Ratio Price to Earnings ratio
PAN Permanent Account Number
RBI The Reserve Bank of India
RBI Act The Reserve Bank of India Act, 1934
Regulation S Regulation S under the U.S. Securities Act
RoU Right-of-use
“RoNW” or “Return on Net
Worth”
Profit after tax attributable to equity shareholders of our Company divided by Net Worth (total equity) of
our Company for the year. For a brief explanation on the calculation of RoNW, see “Other Financial
Information” on page 235. Also see “Certain Conventions, Presentation of Financial, Industry and Market
Data and Currency of Presentation—Non-GAAP Financial Measures” on page 19
RTGS Real Time Gross Settlement
SCRA Securities Contracts (Regulation) Act, 1956
SCRR Securities Contracts (Regulation) Rules, 1957
SCORES SEBI Complaints Redress System
SEBI Securities and Exchange Board of India constituted under the SEBI Act
SEBI Act Securities and Exchange Board of India Act, 1992
SEBI AIF Regulations Securities and Exchange Board of India (Alternative Investment Funds) Regulations, 2012
SEBI BTI Regulations Securities and Exchange Board of India (Bankers to an Issue) Regulations, 1994
SEBI FPI Regulations Securities and Exchange Board of India (Foreign Portfolio Investors) Regulations, 2019
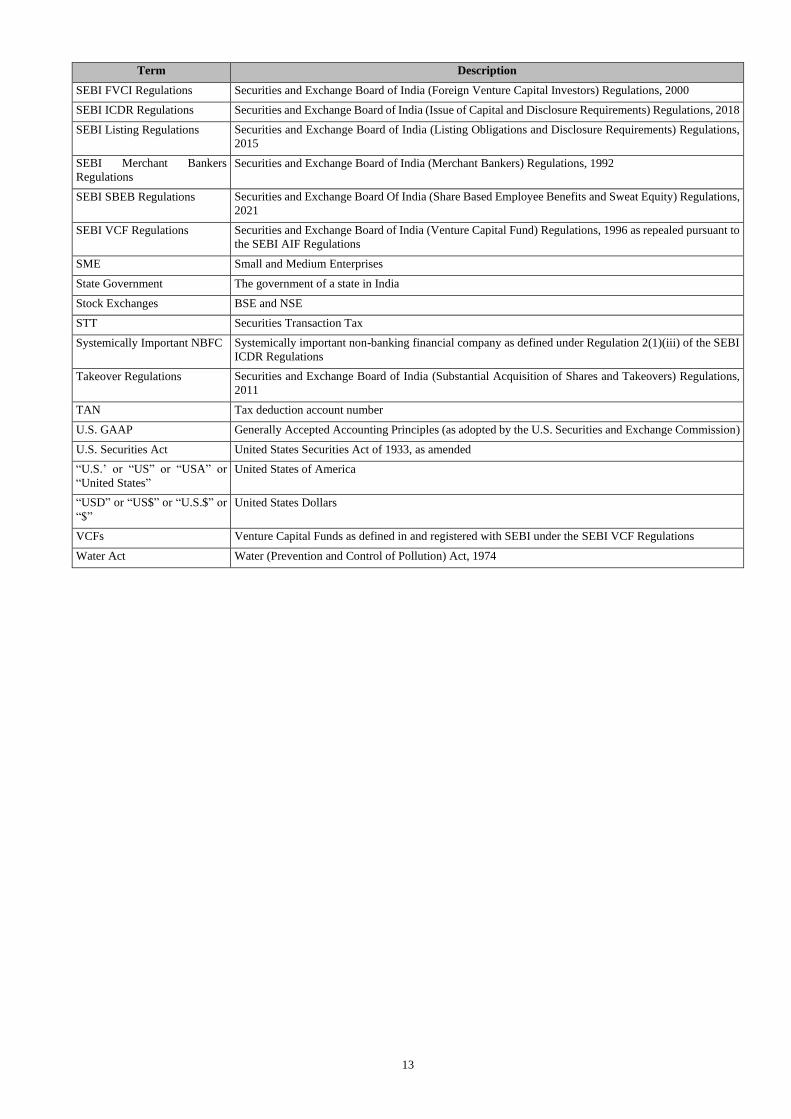
13
Term Description
SEBI FVCI Regulations Securities and Exchange Board of India (Foreign Venture Capital Investors) Regulations, 2000
SEBI ICDR Regulations Securities and Exchange Board of India (Issue of Capital and Disclosure Requirements) Regulations, 2018
SEBI Listing Regulations Securities and Exchange Board of India (Listing Obligations and Disclosure Requirements) Regulations,
2015
SEBI Merchant Bankers
Regulations
Securities and Exchange Board of India (Merchant Bankers) Regulations, 1992
SEBI SBEB Regulations Securities and Exchange Board Of India (Share Based Employee Benefits and Sweat Equity) Regulations,
2021
SEBI VCF Regulations Securities and Exchange Board of India (Venture Capital Fund) Regulations, 1996 as repealed pursuant to
the SEBI AIF Regulations
SME Small and Medium Enterprises
State Government The government of a state in India
Stock Exchanges BSE and NSE
STT Securities Transaction Tax
Systemically Important NBFC Systemically important non-banking financial company as defined under Regulation 2(1)(iii) of the SEBI
ICDR Regulations
Takeover Regulations Securities and Exchange Board of India (Substantial Acquisition of Shares and Takeovers) Regulations,
2011
TAN Tax deduction account number
U.S. GAAP Generally Accepted Accounting Principles (as adopted by the U.S. Securities and Exchange Commission)
U.S. Securities Act United States Securities Act of 1933, as amended
“U.S.’ or “US” or “USA” or
“United States”
United States of America
“USD” or “US$” or “U.S.$” or
“$”
United States Dollars
VCFs Venture Capital Funds as defined in and registered with SEBI under the SEBI VCF Regulations
Water Act Water (Prevention and Control of Pollution) Act, 1974
14
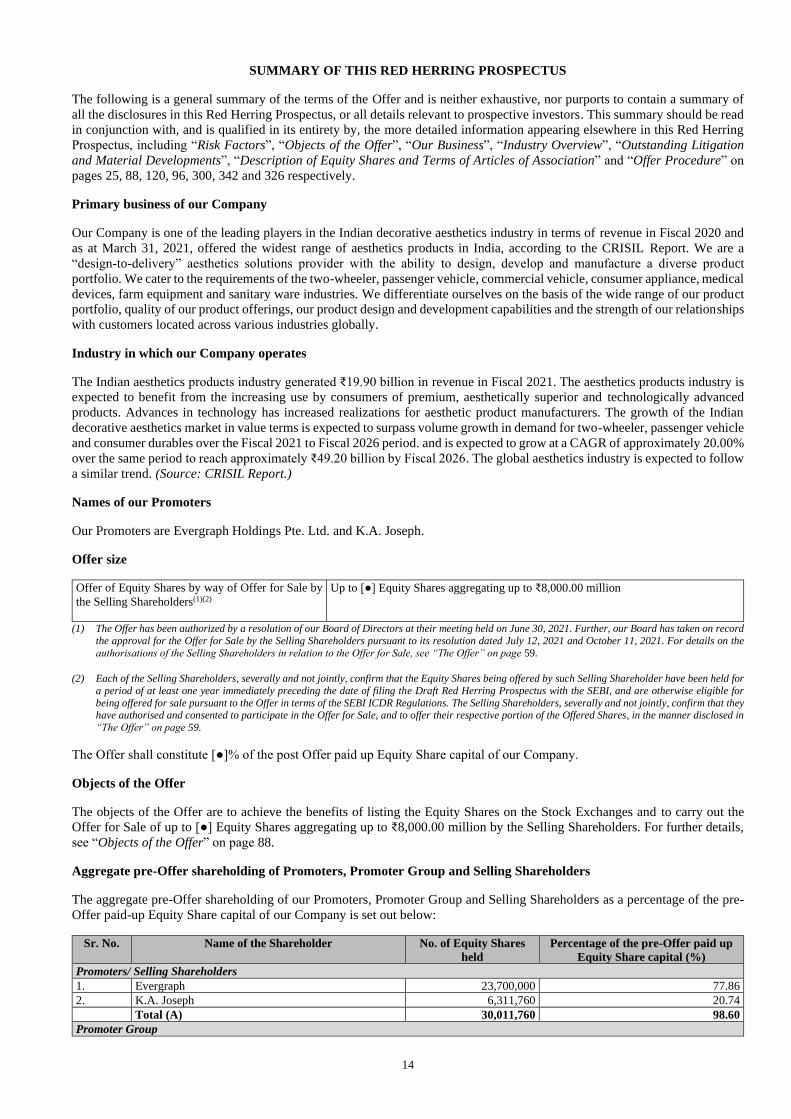
SUMMARY OF THIS RED HERRING PROSPECTUS
The following is a general summary of the terms of the Offer and is neither exhaustive, nor purports to contain a summary of
all the disclosures in this Red Herring Prospectus, or all details relevant to prospective investors. This summary should be read
in conjunction with, and is qualified in its entirety by, the more detailed information appearing elsewhere in this Red Herring
Prospectus, including “Risk Factors”, “Objects of the Offer”, “Our Business”, “Industry Overview”, “Outstanding Litigation
and Material Developments”, “Description of Equity Shares and Terms of Articles of Association” and “Offer Procedure” on
pages 25, 88, 120, 96, 300, 342 and 326 respectively.
Primary business of our Company
Our Company is one of the leading players in the Indian decorative aesthetics industry in terms of revenue in Fiscal 2020 and
as at March 31, 2021, offered the widest range of aesthetics products in India, according to the CRISIL Report. We are a
“design-to-delivery” aesthetics solutions provider with the ability to design, develop and manufacture a diverse product
portfolio. We cater to the requirements of the two-wheeler, passenger vehicle, commercial vehicle, consumer appliance, medical
devices, farm equipment and sanitary ware industries. We differentiate ourselves on the basis of the wide range of our product
portfolio, quality of our product offerings, our product design and development capabilities and the strength of our relationships
with customers located across various industries globally.
Industry in which our Company operates
The Indian aesthetics products industry generated ₹19.90 billion in revenue in Fiscal 2021. The aesthetics products industry is
expected to benefit from the increasing use by consumers of premium, aesthetically superior and technologically advanced
products. Advances in technology has increased realizations for aesthetic product manufacturers. The growth of the Indian
decorative aesthetics market in value terms is expected to surpass volume growth in demand for two-wheeler, passenger vehicle
and consumer durables over the Fiscal 2021 to Fiscal 2026 period. and is expected to grow at a CAGR of approximately 20.00%
over the same period to reach approximately ₹49.20 billion by Fiscal 2026. The global aesthetics industry is expected to follow
a similar trend. (Source: CRISIL Report.)
Names of our Promoters
Our Promoters are Evergraph Holdings Pte. Ltd. and K.A. Joseph.
Offer size
Offer of Equity Shares by way of Offer for Sale by
the Selling Shareholders(1)(2)
Up to [●] Equity Shares aggregating up to ₹8,000.00 million
(1) The Offer has been authorized by a resolution of our Board of Directors at their meeting held on June 30, 2021. Further, our Board has taken on record
the approval for the Offer for Sale by the Selling Shareholders pursuant to its resolution dated July 12, 2021 and October 11, 2021. For details on the
authorisations of the Selling Shareholders in relation to the Offer for Sale, see “The Offer” on page 59.
(2) Each of the Selling Shareholders, severally and not jointly, confirm that the Equity Shares being offered by such Selling Shareholder have been held for
a period of at least one year immediately preceding the date of filing the Draft Red Herring Prospectus with the SEBI, and are otherwise eligible for
being offered for sale pursuant to the Offer in terms of the SEBI ICDR Regulations. The Selling Shareholders, severally and not jointly, confirm that they have authorised and consented to participate in the Offer for Sale, and to offer their respective portion of the Offered Shares, in the manner disclosed in
“The Offer” on page 59.
The Offer shall constitute [●]% of the post Offer paid up Equity Share capital of our Company.
Objects of the Offer
The objects of the Offer are to achieve the benefits of listing the Equity Shares on the Stock Exchanges and to carry out the
Offer for Sale of up to [●] Equity Shares aggregating up to ₹8,000.00 million by the Selling Shareholders. For further details,
see “Objects of the Offer” on page 88.
Aggregate pre-Offer shareholding of Promoters, Promoter Group and Selling Shareholders
The aggregate pre-Offer shareholding of our Promoters, Promoter Group and Selling Shareholders as a percentage of the pre-
Offer paid-up Equity Share capital of our Company is set out below:
Sr. No. Name of the Shareholder No. of Equity Shares
held
Percentage of the pre-Offer paid up
Equity Share capital (%)
Promoters/ Selling Shareholders
1. Evergraph 23,700,000 77.86
2. K.A. Joseph 6,311,760 20.74
Total (A) 30,011,760 98.60
Promoter Group
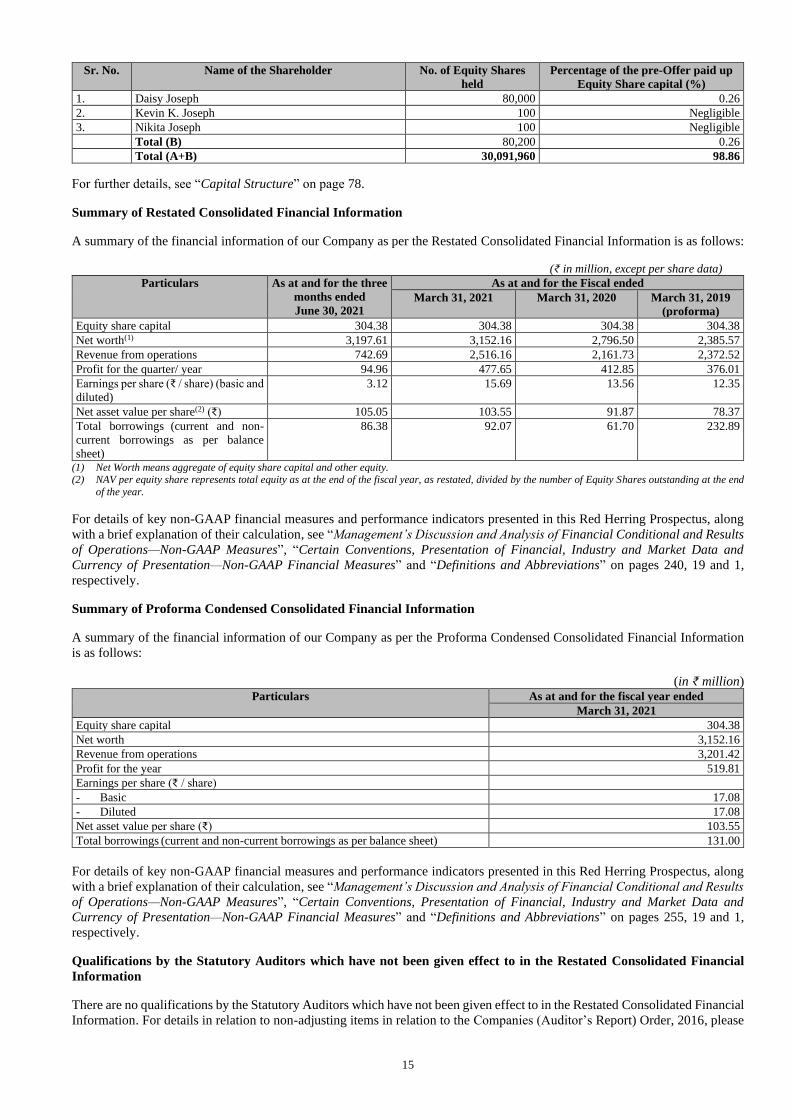
15
Sr. No. Name of the Shareholder No. of Equity Shares
held
Percentage of the pre-Offer paid up
Equity Share capital (%)
1. Daisy Joseph 80,000 0.26
2. Kevin K. Joseph 100 Negligible
3. Nikita Joseph 100 Negligible
Total (B) 80,200 0.26
Total (A+B) 30,091,960 98.86
For further details, see “Capital Structure” on page 78.
Summary of Restated Consolidated Financial Information
A summary of the financial information of our Company as per the Restated Consolidated Financial Information is as follows:
(₹ in million, except per share data)
Particulars As at and for the three
months ended
June 30, 2021
As at and for the Fiscal ended
March 31, 2021 March 31, 2020 March 31, 2019
(proforma)
Equity share capital 304.38 304.38 304.38 304.38
Net worth(1) 3,197.61 3,152.16 2,796.50 2,385.57
Revenue from operations 742.69 2,516.16 2,161.73 2,372.52
Profit for the quarter/ year 94.96 477.65 412.85 376.01
Earnings per share (₹ / share) (basic and
diluted)
3.12 15.69 13.56 12.35
Net asset value per share(2) (₹) 105.05 103.55 91.87 78.37
Total borrowings (current and non-
current borrowings as per balance
sheet)
86.38 92.07 61.70 232.89
(1) Net Worth means aggregate of equity share capital and other equity. (2) NAV per equity share represents total equity as at the end of the fiscal year, as restated, divided by the number of Equity Shares outstanding at the end
of the year.
For details of key non-GAAP financial measures and performance indicators presented in this Red Herring Prospectus, along
with a brief explanation of their calculation, see “Management’s Discussion and Analysis of Financial Conditional and Results
of Operations—Non-GAAP Measures”, “Certain Conventions, Presentation of Financial, Industry and Market Data and
Currency of Presentation—Non-GAAP Financial Measures” and “Definitions and Abbreviations” on pages 240, 19 and 1,
respectively.
Summary of Proforma Condensed Consolidated Financial Information
A summary of the financial information of our Company as per the Proforma Condensed Consolidated Financial Information
is as follows:
(in ₹ million) Particulars As at and for the fiscal year ended
March 31, 2021
Equity share capital 304.38
Net worth 3,152.16
Revenue from operations 3,201.42
Profit for the year 519.81
Earnings per share (₹ / share)
- Basic 17.08
- Diluted 17.08
Net asset value per share (₹) 103.55
Total borrowings (current and non-current borrowings as per balance sheet) 131.00
For details of key non-GAAP financial measures and performance indicators presented in this Red Herring Prospectus, along
with a brief explanation of their calculation, see “Management’s Discussion and Analysis of Financial Conditional and Results
of Operations—Non-GAAP Measures”, “Certain Conventions, Presentation of Financial, Industry and Market Data and
Currency of Presentation—Non-GAAP Financial Measures” and “Definitions and Abbreviations” on pages 255, 19 and 1,
respectively.
Qualifications by the Statutory Auditors which have not been given effect to in the Restated Consolidated Financial
Information
There are no qualifications by the Statutory Auditors which have not been given effect to in the Restated Consolidated Financial
Information. For details in relation to non-adjusting items in relation to the Companies (Auditor’s Report) Order, 2016, please
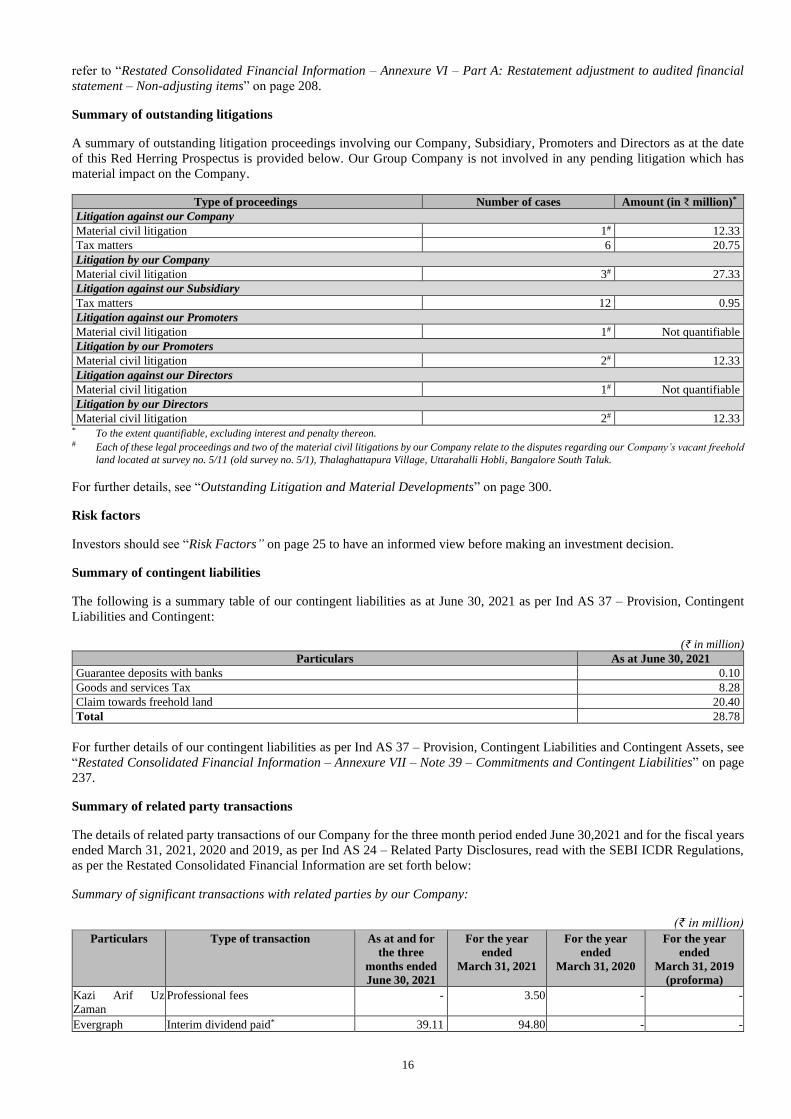
16
refer to “Restated Consolidated Financial Information – Annexure VI – Part A: Restatement adjustment to audited financial
statement – Non-adjusting items” on page 208.
Summary of outstanding litigations
A summary of outstanding litigation proceedings involving our Company, Subsidiary, Promoters and Directors as at the date
of this Red Herring Prospectus is provided below. Our Group Company is not involved in any pending litigation which has
material impact on the Company.
Type of proceedings Number of cases Amount (in ₹ million)*
Litigation against our Company
Material civil litigation 1# 12.33
Tax matters 6 20.75
Litigation by our Company
Material civil litigation 3# 27.33
Litigation against our Subsidiary
Tax matters 12 0.95
Litigation against our Promoters
Material civil litigation 1# Not quantifiable
Litigation by our Promoters
Material civil litigation 2# 12.33
Litigation against our Directors
Material civil litigation 1# Not quantifiable
Litigation by our Directors
Material civil litigation 2# 12.33 * To the extent quantifiable, excluding interest and penalty thereon. # Each of these legal proceedings and two of the material civil litigations by our Company relate to the disputes regarding our Company’s vacant freehold
land located at survey no. 5/11 (old survey no. 5/1), Thalaghattapura Village, Uttarahalli Hobli, Bangalore South Taluk.
For further details, see “Outstanding Litigation and Material Developments” on page 300.
Risk factors
Investors should see “Risk Factors” on page 25 to have an informed view before making an investment decision.
Summary of contingent liabilities
The following is a summary table of our contingent liabilities as at June 30, 2021 as per Ind AS 37 – Provision, Contingent
Liabilities and Contingent:
(₹ in million)
Particulars As at June 30, 2021
Guarantee deposits with banks 0.10
Goods and services Tax 8.28
Claim towards freehold land 20.40
Total 28.78
For further details of our contingent liabilities as per Ind AS 37 – Provision, Contingent Liabilities and Contingent Assets, see
“Restated Consolidated Financial Information – Annexure VII – Note 39 – Commitments and Contingent Liabilities” on page
237.
Summary of related party transactions
The details of related party transactions of our Company for the three month period ended June 30,2021 and for the fiscal years
ended March 31, 2021, 2020 and 2019, as per Ind AS 24 – Related Party Disclosures, read with the SEBI ICDR Regulations,
as per the Restated Consolidated Financial Information are set forth below:
Summary of significant transactions with related parties by our Company:
(₹ in million)
Particulars Type of transaction As at and for
the three
months ended
June 30, 2021
For the year
ended
March 31, 2021
For the year
ended
March 31, 2020
For the year
ended
March 31, 2019
(proforma)
Kazi Arif Uz
Zaman
Professional fees - 3.50 - -
Evergraph Interim dividend paid* 39.11 94.80 - -
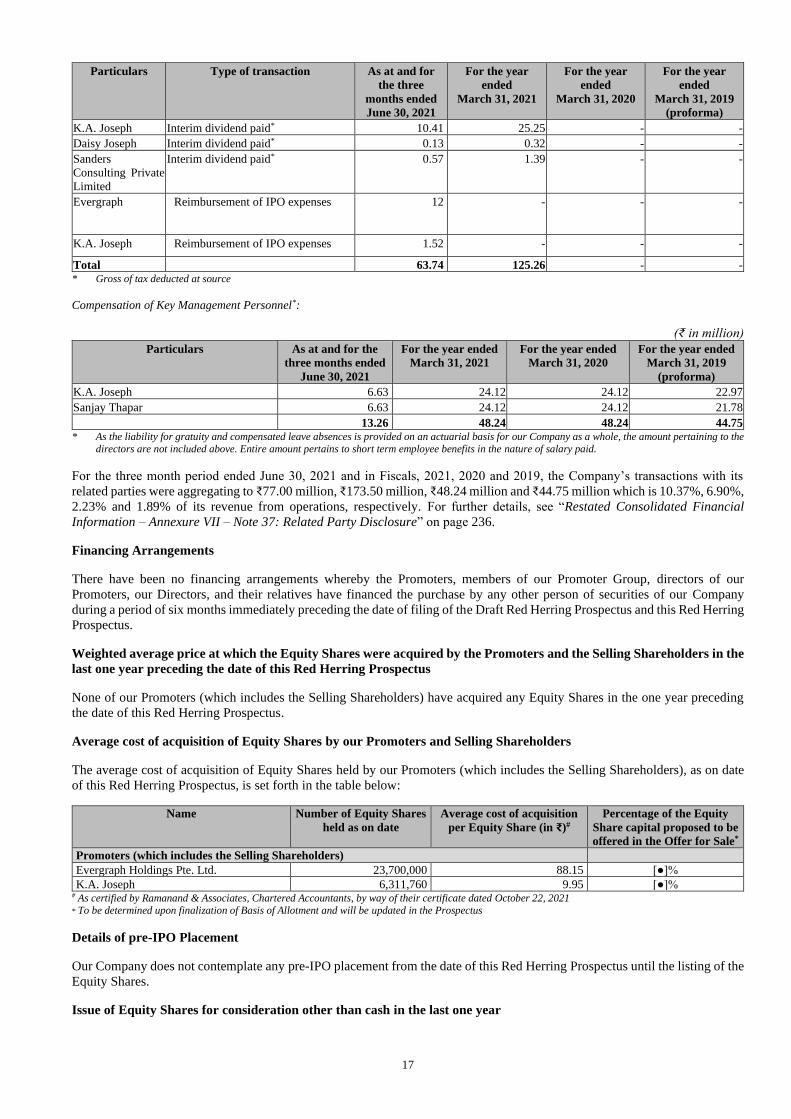
17
Particulars Type of transaction As at and for
the three
months ended
June 30, 2021
For the year
ended
March 31, 2021
For the year
ended
March 31, 2020
For the year
ended
March 31, 2019
(proforma)
K.A. Joseph Interim dividend paid* 10.41 25.25 - -
Daisy Joseph Interim dividend paid* 0.13 0.32 - -
Sanders
Consulting Private
Limited
Interim dividend paid* 0.57 1.39 - -
Evergraph Reimbursement of IPO expenses
12 - - -
K.A. Joseph Reimbursement of IPO expenses
1.52 - - -
Total 63.74 125.26 - - * Gross of tax deducted at source
Compensation of Key Management Personnel*:
(₹ in million)
Particulars As at and for the
three months ended
June 30, 2021
For the year ended
March 31, 2021
For the year ended
March 31, 2020
For the year ended
March 31, 2019
(proforma)
K.A. Joseph 6.63 24.12 24.12 22.97
Sanjay Thapar 6.63 24.12 24.12 21.78
13.26 48.24 48.24 44.75 * As the liability for gratuity and compensated leave absences is provided on an actuarial basis for our Company as a whole, the amount pertaining to the
directors are not included above. Entire amount pertains to short term employee benefits in the nature of salary paid.
For the three month period ended June 30, 2021 and in Fiscals, 2021, 2020 and 2019, the Company’s transactions with its
related parties were aggregating to ₹77.00 million, ₹173.50 million, ₹48.24 million and ₹44.75 million which is 10.37%, 6.90%,
2.23% and 1.89% of its revenue from operations, respectively. For further details, see “Restated Consolidated Financial
Information – Annexure VII – Note 37: Related Party Disclosure” on page 236.
Financing Arrangements
There have been no financing arrangements whereby the Promoters, members of our Promoter Group, directors of our
Promoters, our Directors, and their relatives have financed the purchase by any other person of securities of our Company
during a period of six months immediately preceding the date of filing of the Draft Red Herring Prospectus and this Red Herring
Prospectus.
Weighted average price at which the Equity Shares were acquired by the Promoters and the Selling Shareholders in the
last one year preceding the date of this Red Herring Prospectus
None of our Promoters (which includes the Selling Shareholders) have acquired any Equity Shares in the one year preceding
the date of this Red Herring Prospectus.
Average cost of acquisition of Equity Shares by our Promoters and Selling Shareholders
The average cost of acquisition of Equity Shares held by our Promoters (which includes the Selling Shareholders), as on date
of this Red Herring Prospectus, is set forth in the table below:
Name Number of Equity Shares
held as on date
Average cost of acquisition
per Equity Share (in ₹)#
Percentage of the Equity
Share capital proposed to be
offered in the Offer for Sale*
Promoters (which includes the Selling Shareholders)
Evergraph Holdings Pte. Ltd. 23,700,000 88.15 [●]%
K.A. Joseph 6,311,760 9.95 [●]% # As certified by Ramanand & Associates, Chartered Accountants, by way of their certificate dated October 22, 2021
* To be determined upon finalization of Basis of Allotment and will be updated in the Prospectus
Details of pre-IPO Placement
Our Company does not contemplate any pre-IPO placement from the date of this Red Herring Prospectus until the listing of the
Equity Shares.
Issue of Equity Shares for consideration other than cash in the last one year
18
Our Company has not issued any Equity Shares for consideration other than cash in the one year preceding the date of this Red
Herring Prospectus.
Split or Consolidation of Equity Shares in the last one year
Our Company has not undertaken a split or consolidation of the Equity Shares in the one year preceding the date of this Red
Herring Prospectus.
Top Seven Risk Factors
1. We may be unable to successfully integrate and manage Exotech or other strategic alliances or acquisitions that we may
undertake in the future, which may expose us to business and financial risk.
2. There are other interests of our Promoters and our Directors in our Company, other than normal remuneration or benefits
or reimbursement of expenses incurred.
3. The coronavirus disease (COVID-19) and the measures taken by the government to curb its spread could materially and
adversely affect our business, financial condition and results of operations. The extent to which the COVID-19 pandemic
will impact our business, operations and financial performance is uncertain and cannot be predicted.
4. Loss of any of our key customers or significant reduction in production and sales of, or demand for our products from,
our significant customers may materially and adversely affect our business and financial performance.
5. We depend significantly on customers in the automotive industry and consumer appliance industry and a decline in their
performance, in India or globally, could adversely affect our business and profitability.
6. Our failure to anticipate, identify, understand and respond timely to evolving technological and market trends and
preferences to develop new products to meet our customers’ demands and to adapt to major changes and shifts in the
aesthetics industry may adversely affect our business.
7. We operate in a highly competitive industry and increased competition may lead to a reduction in our revenues, reduced
profit margins or a loss of market share.
19
CERTAIN CONVENTIONS, PRESENTATION OF FINANCIAL, INDUSTRY AND MARKET DATA AND
CURRENCY OF PRESENTATION
Certain Conventions
All references in this Red Herring Prospectus to “India” are to the Republic of India and all references herein to the
“Government”, “Indian Government”, “GoI”, “Central Government” or the “State Government” are to the Government of India,
central or state, as applicable. All references to the “US”, “U.S.”, “USA” or the “United States” are to the United States of
America and its territories and possessions, including any state of the United States of America, Puerto Rico, the U.S. Virgin
Islands, Guam, American Samoa, Wake Island and the Northern Mariana Islands and the District of Columbia.
Unless otherwise specified, any time mentioned in this Red Herring Prospectus is in Indian Standard Time. Unless indicated
otherwise, all references to a year in this Red Herring Prospectus are to a calendar year. Further, unless stated otherwise, all
references to page numbers in this Red Herring Prospectus are to the page numbers of this Red Herring Prospectus.
Financial Data
Unless stated otherwise or the context otherwise requires, the financial data in this Red Herring Prospectus is derived from the
Restated Consolidated Financial Information of our Company and our Subsidiary as at and for the three month period ended
June 30, 2021, and as at and for the financial years ended March 31, 2021, March 31, 2020, and March 31, 2019 (proforma),
comprising (i) the restated consolidated statement of asset and liabilities as at June 30, 2021, March 31, 2021, March 31, 2020,
and March 31, 2019 (proforma), (ii) the restated consolidated statement of profit and loss (including other comprehensive
income), the restated consolidated statement of changes in equity and the restated consolidated statement of cash flows for the
three month period ended June 30, 2021, and for each of the financial years ended March 31, 2021, March 31, 2020, and March
31, 2019 (proforma), and (iii) notes and annexures thereto, each prepared in accordance with Ind AS, the requirements of
Section 26 of Part I of Chapter III of the Companies Act, the SEBI ICDR Regulations and the Guidance Note on Reports in
Company Prospectuses (Revised 2019) issued by the ICAI (the “Guidance Note”), each as amended from time to time.
We transitioned to the Ind AS with a transition date of April 1, 2019. Our financial statements as at and for the financial year
ended March 31, 2021 are the first that we have prepared in accordance with Ind AS. Our Restated Consolidated Financial
Information includes the financial statements of our Company as at and for the financial years ended March 31, 2019, prepared
on a proforma basis in accordance with the SEBI Circular SEBI/HO/CFD/DIL/CIR/P/2016/47 dated March 31, 2016. For
further information on our Company’s financial information, see “Financial Information” on page 183.
Exotech became our Subsidiary on April 5, 2021. As a result, our Restated Consolidated Financial Information as at and for the
three month period ended June 30, 2021 (which includes the financial performance and financial condition of Exotech) may
not be comparable to our Restated Consolidated Financial Information for prior periods.
There are significant differences between Ind AS, Indian GAAP, U.S. GAAP and IFRS. Our Company does not provide
reconciliation of its financial information to IFRS or U.S. GAAP. Our Company has not attempted to explain those differences
or quantify their impact on the financial information included in this Red Herring Prospectus and it is urged that you consult
your own advisors regarding such differences and their impact on our Company’s financial information. For details in
connection with risks involving differences between Ind AS, U.S. GAAP and IFRS, see “Risk Factors – 56. Significant
differences exist between Ind AS used to prepare our financial information and other accounting principles, such as IFRS and
U.S. GAAP, with which investors may be more familiar”. The degree to which the financial information included in this Red
Herring Prospectus will provide meaningful information is entirely dependent on the reader’s level of familiarity with Indian
accounting policies and practices, the Companies Act and the SEBI ICDR Regulations. Any reliance by persons not familiar
with Indian accounting policies and practices on the financial disclosures presented in this Red Herring Prospectus should
accordingly be limited.
Our Company acquired a subsidiary, i.e., Exotech (such acquisition, the “Exotech Acquisition”), on April 5, 2021.
Accordingly, we have included in this Red Herring Prospectus the proforma condensed consolidated financial information of
our Company (to be read in conjunction with “Management’s Discussion and Analysis of Financial Conditional and Results of
Operations—Exotech Acquisition and Basis of Preparation of the Proforma Condensed Consolidated Financial Information”
on page 255) as at and for the financial year ended March 31, 2021, to illustrate the impact of the Exotech Acquisition on our
Company’s financial position as at March 31, 2021 and our Company’s financial performance for the year ended March 31,
2021, as if the acquisition had taken place at an earlier date selected in accordance with the SEBI ICDR Regulations (the
“Proforma Condensed Consolidated Financial Information”). The Proforma Condensed Consolidated Financial
Information has been prepared in accordance with Ind AS, the Guidance Note and the relevant provisions of the SEBI ICDR
Regulations. References in this Red Herring Prospectus to “Proforma Fiscal 2021” are to financial information extracted or
derived from the Proforma Condensed Consolidated Financial Information.
For further details, see “—Proforma Condensed Consolidated Financial Information” on page 291; “History and Certain
Corporate Matters — Material acquisitions or divestments of business or undertakings, mergers, amalgamations or revaluation
of assets in the last 10 years” on page 154; and “Risk Factors — 37. The Proforma Condensed Consolidated Financial
20
Information included in this RHP to reflect the impact of the Exotech Acquisition is not indicative of our future financial
condition or financial performance.” on page 25.
Certain financial information with respect to our Subsidiary included in this Red Herring Prospectus has been extracted or
derived from our Subsidiary’s audited financial statements.
Unless the context otherwise indicates, any percentage or amounts, with respect to financial information of our Company in
this Red Herring Prospectus have been derived from the Restated Consolidated Financial Information.
Our Company’s Financial Year commences on April 1 and ends on March 31 of the next year. Accordingly, all references to a
particular Financial Year, unless stated otherwise, are to the 12 month period ended on March 31 of that year.
In this Red Herring Prospectus, any discrepancies in any table between the total and the sums of the amounts listed are due to
rounding off. All figures in decimals have been rounded off to the second decimal and all the percentage figures have been
rounded off to two decimal places. Further, any figures sourced from third-party industry sources may be rounded off to other
than two decimal points to conform to their respective sources. In certain instances, (i) the sum or percentage change of such
numbers may not conform exactly to the total figure given; and (ii) the sum of the numbers in a column or row in certain tables
may not conform exactly to the total figure given for that column or row.
Non-GAAP Financial Measures
We use certain supplemental non-GAAP measures to review and analyze our financial and operating performance from period
to period, and to evaluate our business. Although these non-GAAP measures are not a measure of performance calculated in
accordance with applicable accounting standards, our Company’s management believes that they are useful to an investor in
evaluating us because they are widely used measures to evaluate a company’s operating and financial performance.
Presentation of these non-GAAP financial measures and key performance indicators should not be considered in isolation from,
or as a substitute for, analysis of our historical financial performance, as reported and presented in our Restated Consolidated
Financial Information or the Proforma Condensed Consolidated Financial Information set out in this Red Herring Prospectus.
These non-GAAP financial measures are not defined under Ind AS, are not presented in accordance with Ind AS and have
limitations as analytical tools which indicate, among other things, that they do not reflect our cash expenditures or future
requirements for capital expenditure or contractual commitments; changes in, or cash requirements for, our working capital
needs; and the finance cost, or the cash requirements necessary to service our debt. These non-GAAP financial measures may
differ from similar titled information used by other companies, including peer companies, who may calculate such information
differently and hence their comparability with those used by us may be limited. Therefore, these non-GAAP financial measures
should not be viewed as substitutes for performance or profitability measures under Ind AS or as indicators of our operating
performance, cash flows, liquidity or profitability.
The key non-GAAP financial measures presented in this Red Herring Prospectus include FCFF, EBIT, EBITDA, EBITDA
Margin, PAT Margin, RoE, RoCE, NAV, Net Worth, Capital Employed and RoNW. For their definitions and a brief explanation
of their calculation, see “Definitions and Abbreviations”, “Other Financial Information” and “Management’s Discussion and
Analysis of Financial Conditional and Results of Operations—Non-GAAP Measures” on pages 1, 250 and 255, respectively.
Currency and Units of Presentation
All references to:
• “Rupees” or “₹” or “INR” or “Rs.” are to Indian Rupee, the official currency of the Republic of India;
• “USD” or “U.S.$” or “US$” or “$” are to United States Dollar, the official currency of the United States of America;
Except otherwise specified, our Company has presented certain numerical information in this Red Herring Prospectus in
“million” and “billion” units or in whole numbers where the numbers have been too small to represent in such units. One million
represents 1,000,000 and one billion represents 1,000,000,000.
Figures sourced from third-party industry sources may be expressed in denominations other than millions or may be rounded
off to other than two decimal points in the respective sources, and such figures have been expressed in this Red Herring
Prospectus in such denominations or rounded-off to such number of decimal points as provided in such respective sources.
Exchange Rates
This Red Herring Prospectus contains conversion of certain other currency amounts into Rupees that have been presented solely
to comply with the SEBI ICDR Regulations. These conversions should not be construed as a representation that these currency
amounts could have been, or can be converted into Indian Rupees, at any particular rate or at all.
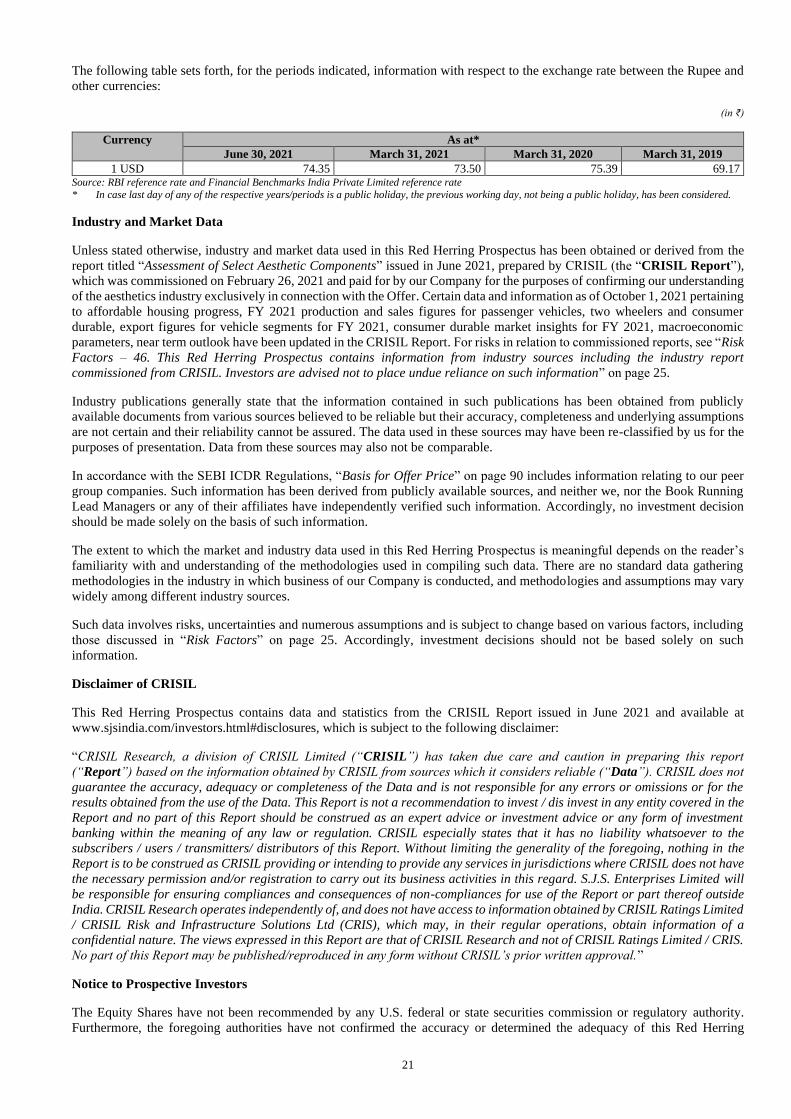
21
The following table sets forth, for the periods indicated, information with respect to the exchange rate between the Rupee and
other currencies:
(in ₹)
Currency As at*
June 30, 2021 March 31, 2021 March 31, 2020 March 31, 2019
1 USD 74.35 73.50 75.39 69.17 Source: RBI reference rate and Financial Benchmarks India Private Limited reference rate
* In case last day of any of the respective years/periods is a public holiday, the previous working day, not being a public holiday, has been considered.
Industry and Market Data
Unless stated otherwise, industry and market data used in this Red Herring Prospectus has been obtained or derived from the
report titled “Assessment of Select Aesthetic Components” issued in June 2021, prepared by CRISIL (the “CRISIL Report”),
which was commissioned on February 26, 2021 and paid for by our Company for the purposes of confirming our understanding
of the aesthetics industry exclusively in connection with the Offer. Certain data and information as of October 1, 2021 pertaining
to affordable housing progress, FY 2021 production and sales figures for passenger vehicles, two wheelers and consumer
durable, export figures for vehicle segments for FY 2021, consumer durable market insights for FY 2021, macroeconomic
parameters, near term outlook have been updated in the CRISIL Report. For risks in relation to commissioned reports, see “Risk
Factors – 46. This Red Herring Prospectus contains information from industry sources including the industry report
commissioned from CRISIL. Investors are advised not to place undue reliance on such information” on page 25.
Industry publications generally state that the information contained in such publications has been obtained from publicly
available documents from various sources believed to be reliable but their accuracy, completeness and underlying assumptions
are not certain and their reliability cannot be assured. The data used in these sources may have been re-classified by us for the
purposes of presentation. Data from these sources may also not be comparable.
In accordance with the SEBI ICDR Regulations, “Basis for Offer Price” on page 90 includes information relating to our peer
group companies. Such information has been derived from publicly available sources, and neither we, nor the Book Running
Lead Managers or any of their affiliates have independently verified such information. Accordingly, no investment decision
should be made solely on the basis of such information.
The extent to which the market and industry data used in this Red Herring Prospectus is meaningful depends on the reader’s
familiarity with and understanding of the methodologies used in compiling such data. There are no standard data gathering
methodologies in the industry in which business of our Company is conducted, and methodologies and assumptions may vary
widely among different industry sources.
Such data involves risks, uncertainties and numerous assumptions and is subject to change based on various factors, including
those discussed in “Risk Factors” on page 25. Accordingly, investment decisions should not be based solely on such
information.
Disclaimer of CRISIL
This Red Herring Prospectus contains data and statistics from the CRISIL Report issued in June 2021 and available at
www.sjsindia.com/investors.html#disclosures, which is subject to the following disclaimer:
“CRISIL Research, a division of CRISIL Limited (“CRISIL”) has taken due care and caution in preparing this report
(“Report”) based on the information obtained by CRISIL from sources which it considers reliable (“Data”). CRISIL does not
guarantee the accuracy, adequacy or completeness of the Data and is not responsible for any errors or omissions or for the
results obtained from the use of the Data. This Report is not a recommendation to invest / dis invest in any entity covered in the
Report and no part of this Report should be construed as an expert advice or investment advice or any form of investment
banking within the meaning of any law or regulation. CRISIL especially states that it has no liability whatsoever to the
subscribers / users / transmitters/ distributors of this Report. Without limiting the generality of the foregoing, nothing in the
Report is to be construed as CRISIL providing or intending to provide any services in jurisdictions where CRISIL does not have
the necessary permission and/or registration to carry out its business activities in this regard. S.J.S. Enterprises Limited will
be responsible for ensuring compliances and consequences of non-compliances for use of the Report or part thereof outside
India. CRISIL Research operates independently of, and does not have access to information obtained by CRISIL Ratings Limited
/ CRISIL Risk and Infrastructure Solutions Ltd (CRIS), which may, in their regular operations, obtain information of a
confidential nature. The views expressed in this Report are that of CRISIL Research and not of CRISIL Ratings Limited / CRIS.
No part of this Report may be published/reproduced in any form without CRISIL’s prior written approval.”
Notice to Prospective Investors
The Equity Shares have not been recommended by any U.S. federal or state securities commission or regulatory authority.
Furthermore, the foregoing authorities have not confirmed the accuracy or determined the adequacy of this Red Herring

22
Prospectus or approved or disapproved the Equity Shares. Any representation to the contrary is a criminal offence in the United
States. In making an investment decision, investors must rely on their own examination of our Company and the terms of this
Offer, including the merits and risks involved. The Equity Shares offered in the Offer have not been and will not be registered
under the U.S. Securities Act of 1933, as amended (“U.S. Securities Act”) or any state securities laws in the United States, and
unless so registered, may not be offered or sold within the United States, except pursuant to an exemption from, or in a
transaction not subject to, the registration requirements of the U.S. Securities Act and in accordance with any applicable U.S.
state securities laws. Accordingly, the Equity Shares are being offered and sold outside the United States in ‘offshore
transactions’ in compliance with Regulation S under the U.S. Securities Act and the applicable laws of the jurisdictions where
such offers and sales are made.
23
FORWARD-LOOKING STATEMENTS
This Red Herring Prospectus contains certain “forward-looking statements”. All statements contained in this Red Herring
Prospectus that are not statements of historical fact constitute “forward looking statements”. All statements regarding our
expected financial condition and results of operations, business, plans and prospects are “forward-looking statements”. These
forward-looking statements generally can be identified by words or phrases such as “aim”, “anticipate”, “believe”, “expect”,
“estimate”, “intend”, “likely to”, “seek to”, “shall”, “objective”, “plan”, “propose”, “project”, “will”, “will continue”, “will
pursue” or other words or phrases of similar import. Similarly, statements that describe our strategies, objectives, plans or goals
are also forward-looking statements. All forward-looking statements are subject to risks, uncertainties, expectations and
assumptions about us that could cause actual results to differ materially from those contemplated by the relevant forward-
looking statement.
Actual results may differ materially from those suggested by forward-looking statements due to risks or uncertainties associated
with expectations relating to and including, regulatory changes pertaining to the industries in India in which we operate and our
ability to respond to them, our ability to successfully implement our strategy, our growth and expansion, technological changes,
our exposure to market risks, general economic and political conditions in India which have an impact on its business activities
or investments, the monetary and fiscal policies of India, inflation, deflation, unanticipated turbulence in interest rates, foreign
exchange rates, equity prices or other rates or prices, the performance of the financial markets in India and globally, changes in
domestic laws, regulations and taxes and changes in competition in the industries in which we operate.
Certain important factors that could cause actual results to differ materially from our expectations include, but are not limited
to, the following:
• Failure to successfully integrate and manage Exotech or other strategic alliances or acquisitions;
• Other interests of our Promoters and our Directors in our Company, other than normal remuneration or benefits or
reimbursement of expenses incurred;
• The coronavirus disease (COVID-19) pandemic, or a similar public health threat, and the measures taken by the
government to curb its spread;
• Loss of any of our key customers or significant reduction in production and sales of, or demand for our products from,
our significant customers;
• A decline in performance, in India or globally, of the automotive industry and consumer appliance industry and cyclical
and seasonal nature of automotive sales and production;
• Failure to anticipate, identify, understand and respond timely to evolving technological and market trends and
preferences and to adapt to major changes and shifts in the aesthetics industry;
• Increased competition, lack of firm long term commitment agreements with our customers or suppliers, counterparty
credit risk, volatility in the price of raw materials and pricing pressure from customers;
• Loss of or the inability to attract and retain any of senior management and other key personnel with technical expertise;
• Dependence on skills and experience of our senior management and other key personnel with technical expertise;
• Compliance with, and changes in labor, workplace safety, health and environmental laws and regulations;
• Failure to comply with quality standards may lead to cancellation of existing and future orders, product recalls, product
liability, warranty claims and other disputes and claims; and
• Operating risks related to, and shutdown of, manufacturing and warehousing facilities
For details regarding factors that could cause actual results to differ from expectations, see “Risk Factors”, “Our Business” and
“Management’s Discussion and Analysis of Financial Condition and Results of Operations” on pages 25, 120 and 240,
respectively. By their nature, certain market risk disclosures are only estimates and could be materially different from what
actually occurs in the future. As a result, actual future gains or losses could materially differ from those that have been estimated
and are not a guarantee of future performance.
There can be no assurance to Bidders that the expectations reflected in these forward-looking statements will prove to be correct.
Given these uncertainties, Bidders are cautioned not to place undue reliance on such forward-looking statements and not to
regard such statements to be a guarantee of our future performance.

24
Forward-looking statements reflect current views as on the date of this Red Herring Prospectus and are not a guarantee of future
performance. These statements are based on our management’s beliefs and assumptions, which in turn are based on currently
available information. Although we believe the assumptions upon which these forward-looking statements are based are
reasonable, any of these assumptions could prove to be inaccurate, and the forward-looking statements based on these
assumptions could be incorrect. Given these uncertainties, investors are cautioned not to place undue reliance on such forward-
looking statements and not to regard such statements as a guarantee of future performance. Neither our Company, the Selling
Shareholders, our Directors, the Book Running Lead Managers nor any of their respective affiliates have any obligation to
update or otherwise revise any statements reflecting circumstances arising after the date hereof or to reflect the occurrence of
underlying events, even if the underlying assumptions do not come to fruition. In accordance with the SEBI ICDR Regulations,
our Company will ensure that the Bidders in India are informed of material developments until the time of the grant of listing
and trading permission by the Stock Exchanges for the Offer.
25
SECTION II: RISK FACTORS
An investment in Equity Shares involves a high degree of risk. Potential Investors should carefully consider all the information in this
Red Herring Prospectus, including the risks and uncertainties described in this section, before making an investment in the Equity
Shares. In addition, we have described the risks and uncertainties that our management believes are material to us, the Equity Shares
or the aesthetics industry, but such risks and uncertainties are not exhaustive, and additional risks and uncertainties not presently
known to us, or which we currently deem to be immaterial, may arise or may become material in the future. If one, or a combination
of any of such risks occurs, our business, financial condition, results of operations and prospects could suffer, the trading price of the
Equity Shares could decline, and you may lose all or a part of your investment. Unless specified in the relevant risk factors below, we
are not in a position to quantify the financial or other implication of any of the risks mentioned in this section. In making an investment
decision, investors must rely on their own examination of us and the terms of the Offer including the merits and the risks involved. To
obtain a complete understanding of our business, see “Our Business”, “Industry Overview”, “Financial Information” and
“Management's Discussion and Analysis of Financial Condition and Result of Operations” beginning on pages 120, 96, 183 and 255,
respectively. Any potential purchaser of the Equity Shares should pay attention to the fact that we are incorporated under the laws of
India, and are governed by a legal and regulatory environment which may differ in certain respects from that of other countries.
Our Company completed the Exotech Acquisition on April 5, 2021. Accordingly, the Proforma Condensed Consolidated Financial
Information has been included in this Red Herring Prospectus to show the impact of the Exotech Acquisition on our Company, its
financial performance and financial condition. For further information, see “Proforma Condensed Consolidated Financial
Information” on page 291. Our Restated Consolidated Financial Information as at and for the three month period ended June 30,
2021 (which includes the financial performance and financial condition of Exotech) may not be comparable to our Restated
Consolidated Financial Information for prior periods.
In this Red Herring Prospectus, unless specified otherwise, any reference to “the Company” or “our Company” refers to S.J.S.
Enterprises Limited, on a standalone basis, and a reference to “we”, “us” or “our”: (1) for any period prior to April 1, 2021 is a
reference to our Company on a standalone basis, and (2) for any period after April 1, 2021 is a reference to our Company together
with our Subsidiary, on a consolidated basis.
This Red Herring Prospectus also contains forward-looking statements that involve risks and uncertainties. Our results could differ
materially from those anticipated in these forward-looking statements as a result of certain factors, including the considerations
described below and elsewhere in this Red Herring Prospectus. For details, see “Forward-Looking Statements” on page 23.
The industry related information contained in this section is derived or extracted from the CRISIL Report which has been
commissioned, and paid for, by our Company for the purposes of confirming our understanding of the aesthetics industry exclusively
in connection with the Offer. Also see “Industry Overview” and “—47. This Red Herring Prospectus contains information from
industry sources including the industry report prepared by CRISIL which has been commissioned, and paid for, by our Company for
the purpose of this Red Herring Prospectus. Investors are advised not to place undue reliance on such information.” on pages 96 and
50, respectively.
Risks relating to our Company, our business and industry
1. We may be unable to successfully integrate and manage Exotech or other strategic alliances or acquisitions that
we may undertake in the future, which may expose us to business and financial risk.
We completed the Exotech Acquisition on April 5, 2021 pursuant to the Exotech SPA entered into by our Company
with our Subsidiary’s former shareholders (the “Exotech Former Shareholders”) and our Subsidiary. We believe
that the Exotech Acquisition will enhance our product portfolio, manufacturing capabilities and customer base and
will help us enhance our cross-selling opportunities. We have undertaken certain steps towards, and intend to continue
to complete, the integration of our Subsidiary’s business, manufacturing facilities and personnel with that of our
Company. For further details, see “Our Business—Our Business Strategy—Integrate our Subsidiary and enhance
opportunities” on page 120.
However, we cannot assure you that we will be able to successfully integrate our Subsidiary into our business and
operations, or the Exotech Acquisition will bring us the anticipated benefits. Further, our Subsidiary focuses on
manufacturing painted, printed and chrome-plated plastics. Certain customers may prefer other technologies or
processes over chrome-plating on account of their environment friendliness.
The acquisition of our Subsidiary could also expose us to unanticipated business uncertainties, unknown or undisclosed
liabilities or prior non-compliances. Pursuant to the Exotech SPA, we have assumed existing liabilities of our
Subsidiary which, if realized, may affect our financial condition and our profitability. Although we have conduced due
diligence on our Subsidiary with the objective of identifying any material existing liabilities, we may not have been
able to identify all such liabilities prior to the completion of the Exotech Acquisition. The terms of the Exotech SPA
contain limited representations and warranties, some of which are qualified by certain disclosures as well as by the
knowledge of the Exotech Former Shareholders. The Exotech SPA provides for indemnities from the Exotech Former
Shareholders, however, these are limited by monetary ceilings and time, among others, and may limit our recourse
under the Exotech SPA. Any losses or liabilities suffered by us in relation to our Subsidiary for which we are unable
to recover under the Exotech SPA may materially adversely affect our cash flows, financial condition and results of
operations.
26
We intend to continue to evaluate, and selectively pursue, inorganic opportunities where products, resources,
capabilities, operations and strategies are complementary and that will diversify our product portfolio, provide us
access to a wider customer base, help us expand into new geographies and consolidate our market position as a leading
aesthetics solution provider. These opportunities could be by way of strategic alliances, acquisitions, joint ventures,
technological collaborations, partner tie-ups and asset purchases. We cannot assure you that we will identify suitable
acquisition or investment opportunities or that if we do identify suitable opportunities, that we will complete those
transactions on terms commercially acceptable to us or at all, which may adversely affect our competitiveness and
growth prospects. Any new inorganic growth opportunities may require us to incur additional capital expenditure or
assume new debt or expose us to future funding obligations or integration risks and we cannot assure you that such
alliances or acquisitions will contribute to our profitability. If we complete such an acquisition, we could encounter
difficulties and risks in integrating the acquired operations such as:
• difficulty in assimilating the operations and personnel of the acquired businesses and maintaining uniform
standards, controls, procedures and policies;
• inability of our management to focus on our routine business operations or to realize the projected operational
and financial benefits from the acquisition; and
• impairment of relationships with employees and customers as a result of any integration of new management
personnel.
We cannot assure you that we will be able to achieve the strategic purpose of such acquisition or operational integration
or our targeted return on investment. If we fail to efficiently or completely integrate an acquired business with us, our
business, financial condition and results of operations could be adversely affected.
2. There are other interests of our Promoters and our Directors in our Company, other than normal remuneration or
benefits or reimbursement of expenses incurred.
Our Promoters are interested in our Company to the extent of their respective shareholding in our Company and the
dividends and other distributions thereon, and in the case of K.A. Joseph, he is interested in our Company to the extent
of: (i) his promotion of our Company; (ii) the shareholding of his relatives in our Company and the dividends payable,
if any, and any other distributions in respect of the Equity Shares held by them or their relatives; (ii) being the
Managing Director of our Company and the remuneration, sitting fees or reimbursement of expenses payable by our
Company to him; (iv) of being a subscriber to the Memorandum of Association; and (v) transfer of the land located at
survey no. 5/11 (old survey no. 5/1), Thalaghattapura Village, Uttarahalli Hobli, Bangalore South Taluk to the
partnership firm, S.J.S. Enterprises (erstwhile name of our Company) in 2001 (for details of the ongoing litigation
pertaining to this land, see “Outstanding Litigation and Material Developments—Litigation against K.A. Joseph” on
page 300).
Additionally, Kazi Arif Uz Zaman, our Non-Executive Nominee Director, is interested in our Company to the extent
of providing management consultancy services for a professional fee of ₹3.50 million, to assist our Company with the
Exotech Acquisition, pursuant to the engagement letter dated January 19, 2021. For more information, see “Our
Management—Interest of our Directors” on page 160.
One of our Promoters, Evergraph, does not possess significant experience in the decorative aesthetics industry.
Evergraph has entered into an arrangement with Sanders Consulting, a company jointly owned by our Executive
Director and CEO, Sanjay Thapar, pursuant to which Evergraph has agreed to make certain payments to Sanders
Consulting (linked to the profit on the sale of the Equity Shares sold by Evergraph), in exchange for non-binding
strategic and operational advice in relation to its activities and investments in the industrial graphics sector, among
others. For more information, see “Our Management—Interest of Directors” on page 160. Sanders Consulting also
owns certain Equity Shares in our Company. For more information, see “Capital Structure—Details of shareholding
of the major Shareholders of our Company” on page 78.
3. The coronavirus disease (COVID-19) and the measures taken by the government to curb its spread could materially
and adversely affect our business, financial condition and results of operations. The extent to which the COVID-
19 pandemic will impact our business, operations and financial performance is uncertain and cannot be predicted.
In response to the outbreak of a novel strain of coronavirus (COVID-19), the governments of many countries, including
India, have taken preventive or protective actions, such as prohibiting people from assembling in heavily populated
areas, instituting quarantines, issuing advisories and imposing country or state wide lockdowns, including restrictions
on travel and temporary closure of business operations, restricting the types of businesses that may continue to operate,
‘stay-at-home’ orders, and enforcing increased remote working protocols. India imposed a nationwide lockdown
beginning on March 25, 2020, which has been subject to successive extensions. Most state governments in India have
also announced state level lockdowns from time to time to curb the spread of COVID-19. While there have been
multiple relaxations and calibrated easing of lockdown measures by the government, lockdowns and other similar
27
restrictions have been reintroduced by most state governments in India from time to time. We cannot predict if stricter
lockdowns or other restrictions will not be re-introduced or extended in the future to curb the further spread of COVID-
19.
The outbreak of COVID-19 and the measures adopted by governments in various countries to curb its spread have
significantly and adversely impacted, and will likely continue to impact, economic activity. The severe disruptions
caused by them have contributed to significant volatility in global financial markets and have led to an effective
shutdown of large segments of the global economy. A number of governments and organizations have revised GDP
growth forecasts for 2021 downwards in response to the economic slowdown caused by the spread of COVID-19, and
it is possible that the COVID-19 pandemic will result in a prolonged global economic crisis, stagnation, recession or
depression, despite monetary and fiscal interventions by governments and central banks globally. As at the date of this
Red Herring Prospectus, the COVID-19 pandemic continues to impact the global economy and accordingly, our
business, financial condition and operations continue to be adversely affected.
During Fiscal 2021, on account of the government restrictions in India due to COVID-19 pandemic, our Registered
and Corporate Office and operations at our Company’s manufacturing facility in Bengaluru were closed for a period
of two weeks pursuant to the directives from the central/local authorities. On easing of restrictions imposed pursuant
to the initial lockdown and upon classification of our Company under the essential services category prescribed by the
Karnataka state government, it resumed operations in a phased manner as per the Government of India and the
Karnataka state government’s directives after making arrangements to meet the government’s requirements on
sanitization, people movement and social distancing.
The effects of the COVID-19 pandemic caused us to modify some of our business practices, including implementation
of a work from home regime for certain executives, to the extent possible, and cancellation of physical participation
in certain meetings, events and conferences, or substitution with virtual participation. During various lockdowns, we
continued paying salaries/wages to all employees and outsourced manpower. The COVID-19 pandemic resulted in a
slowdown in the automotive and consumer appliance industries as well as minor disruptions in the supply of raw
materials from our domestic and international suppliers. Such disruptions in operations impacted our business
performance during the first quarter of Fiscal 2021. While our Company was able to grow its overall business and
operations, with a growth of 16.40% in revenue from operations to ₹2,516.16 million in Fiscal 2021 from ₹2,161.73
million in Fiscal 2020, our Subsidiary was adversely impacted by the COVID-19 pandemic in Fiscal 2021. Our
Subsidiary’s revenue from operations decreased by 5.80% to ₹685.26 million in Fiscal 2021 from ₹727.57 million in
Fiscal 2020. For more details, see “Our Business—Impact of the COVID-19 pandemic” on page 120.
There has been a second wave of COVID-19 in India since April 2021, leading to certain restrictions by the
governments in various states of India, including those by the states of Karnataka and Maharashtra where our Company
and our Subsidiary operate, respectively. As a result, our business and operations, as well as the business and operations
of our customers and suppliers, have been temporarily affected during this period. The ongoing impact of the COVID-
19 pandemic and resulting government actions on our business and operations, includes, but is not limited to, the
following:
• a complete or partial closure of our operations, or disruptions or restrictions on our ability to conduct our
business and our operations;
• our inability to source key raw materials as a result of the temporary or permanent closure of the facilities of
suppliers of our key raw materials;
• implementation of staggered or altered work shifts and other social distancing efforts at our manufacturing
facilities and labour shortages, including because of travel or government restrictions such as stay-at-home
orders in connection with COVID-19, which could result in decreased productivity and a slowdown in our
operations;
• impact on our ability to travel and pursue other business opportunities, maintain existing customer
relationships and acquire new customer accounts;
• delays in order or in delivery or shipment of our products, which may negatively impact our cash conversion
cycle and ability to convert our backlog into cash;
• inability to collect full or partial payments from customers due to deterioration in customer liquidity,
including customer bankruptcies or payments to suppliers due to delay in collections or liquidity concerns;
and
• extension on credit terms offered to certain customers.
The COVID-19 pandemic may cause additional disruptions to our or our customers’ operations if our or their
workforce become affected by the pandemic, or quarantined, unable to attend in-person meetings with customers or
suppliers in other jurisdictions or are otherwise limited in their ability to travel or work. The potential negative impact

28
on the health of our employees, particularly if a significant number of them or their family members are afflicted by
COVID-19, is uncertain, which could result in a deterioration in our ability to ensure business continuity during this
disruption.
Our Company’s and our Subsidiary’s total insurance coverage of ₹1,947.49 million and ₹403.50 million, respectively,
covered 181.28% and 264.97% of our Company’s and Subsidiary’s tangible assets (excluding freehold land and
vehicles) as at June 30, 2021, respectively, and such insurance coverage may not provide protection for all costs that
may arise from all such possible events. We may require additional working capital to fund our operations and future
growth, which may or may not be available to us on commercially favourable terms, or at all. As at June 30, 2021, we
had ₹181.40 million in cash and cash equivalents and ₹176.85 million as bank balances other than cash and cash
equivalents. We also had investments in mutual funds of ₹408.93 million as at June 30, 2021. Further, our borrowings
(current and non-current), on a consolidated basis, as at June 30, 2021 aggregated to ₹86.38 million. The effects of the
COVID-19 pandemic may also adversely impact our ability to access debt and equity capital on favourable terms, or
at all, and any decline in our future cash flows could adversely impact our ability to comply with the covenants in our
credit facilities and other financing agreements and could result in events of default and the acceleration of our
indebtedness.
The scale of the COVID-19 pandemic and the speed at which the local and global community has been impacted, may
affect our annual revenue growth rates, resulting in certain differences from our historical rates, and we cannot assure
you that our future operating results will not fall below expectations if effects of the COVID-19 pandemic continue or
intensify further. It is early to assess whether our current business plan will continue to be adequate to address all the
evolving challenges arising from the impact of this pandemic to our financial condition and results of operations in
future operating periods.
The extent to which the COVID-19 pandemic will impact our business, operations and financial performance will
depend on future developments and cannot be predicted. Events beyond our control may unfold in the future, which
makes it difficult for us to predict the impact that COVID-19 will have on us, our customers or suppliers in the future
and this may affect the underlying assumptions and estimates with respect to demand for our products and services in
the future or our ability to meet demands of our customers and may increase our costs of production, which could
materially and adversely affect us and our financial performance. There have been instances of resurgence of the
COVID-19 pandemic around the world, which has brought about fresh lockdowns and caused further disruptions to
economies. Resurgence of the COVID-19 pandemic, or occurrences of other severely communicable diseases, and the
actions taken globally to contain them or treat their impact, may adversely affect our business and operations and our
ability to achieve our business plans.
4. Loss of any of our key customers or significant reduction in production and sales of, or demand for our products
from, our significant customers may materially and adversely affect our business and financial performance.
Out of customers accounting for more than 10% of the revenue from operations in Fiscal 2021, sales to our Company’s
top customer accounted for 21.49%, 23.99% and 33.59% of its revenue from operations in Fiscals 2021, 2020 and
2019, respectively. Sales to our Company’s top five customers (based on revenue in three month period ended June
30, 2021) represented 63.91% of our revenue from operations in that period. Sales to our Company’s top five customers
(based on revenue in Fiscal 2021) represented 62.66%, 59.73% and 65.90% of its revenue from operations in Fiscals
2021, 2020 and 2019, respectively, and sales to our Company’s top 10 customers (based on revenue in Fiscal 2021)
represented 87.33%, 86.40% and 85.66% of its revenue from operations in Fiscals 2021, 2020 and 2019, respectively.
Our key customers operate primarily in the two-wheeler, passenger vehicle and consumer appliance industries.
Since we are dependent on certain key customers for a significant portion of our sales, the loss of any of such customers
or a reduction in demand from such customers, for any reason, including due to loss of contracts, delay in fulfilling
existing orders, failure to negotiate acceptable terms in negotiations, disputes or a loss of market share or a downturn
in such customers’ business, if not suitably replaced with another customer, could adversely affect our business,
financial condition and results of operations.
Furthermore, the volume of our business with these customers may vary from period to period. Our business,
operations, revenues and profitability may be adversely affected if these customers demand price reductions, set-off
any payment obligations or if there is an adverse change in any of our customers’ aesthetics procurement strategies,
including one that involves moving more work in-house. Our revenues and profitability may also be adversely affected
if there’s a reduction in our customers’ production volumes or if there is a significant reduction in the volume of our
business with such customers, or if our customers prefer our competitors over us, and we may not remain the exclusive
aesthetics products and solutions provider for certain of our customers.
Our growth depends, among other factors, on the growth of our key customers and we are also exposed to fluctuations
in the performance of the industries in which our key customers operate, i.e., automotive and consumer appliances. A
decline in our customers’ business performance may also lead to a corresponding decrease in demand for our products
and services. The volume and timing of sales to our customers may vary due to variation in demand for our customers’

29
products, their attempts to manage their inventory, design changes, changes in their product mix, manufacturing and
growth strategy, and macroeconomic factors affecting the economy in general, and our customers in particular. A
sustained decline in the demand for products produced by our key customers could prompt them to cut their production
volumes, directly affecting the demand from customers for our aesthetics products and services. Unfavourable industry
conditions can also result in an increase in commercial disputes and other risks of supply disruption. It is difficult to
forecast the success or sustainability of any strategies undertaken by any of our key customers in response to the
current economic or industry environment.
Insufficient demand for new products launched by our customers may also prevent growth in demand for our products
and services. Similarly, if our key customers do not successfully enter into and retain market share in high-growth
segments, we may be prevented from capitalizing on new growth opportunities.
Additionally, as orders for certain of our products catering to the automotive industry are linked to specific models of
vehicles and may not generally be interchangeable, the discontinuation of, loss of business with respect to or a lack of
commercial success of, a particular vehicle model for which we are a significant supplier could lead to cancellation of
orders or loss of business and consequently reduce our sales and affect our estimates of anticipated sales, which could
materially and adversely affect our business, financial condition and results of operations. Further, our future growth
is also linked to the addition of new customers and failure to do so could materially and adversely affect our business,
financial condition and results of operations.
5. We depend significantly on customers in the automotive industry and consumer appliance industry and a decline
in their performance, in India or globally, could adversely affect our business and profitability.
We depend significantly on customers in the automotive industry and the consumer appliance industry.
Set forth below is a breakdown of our Company’s revenue from sale of products and services, across the industries
that our Company primarily caters to, for the periods indicated.
Industry Three month period
ended June 30, 2021
Fiscal 2021 Fiscal 2020 Fiscal 2019
Amount Percentage
of total
Amount Percentage
of total
Amount Percentage
of total
Amount Percentage
of total
(₹
million)
(%) (₹
million)
(%) (₹
million)
(%) (₹
million)
(%)
Automotive
Two-wheelers 281.12 49.49 1,459.70 58.01 1,324.93 61.29 1,660.48 69.99
Passenger vehicles 121.93 21.46 418.35 16.63 318.37 14.73 242.55 10.22
Others 0.43 0.08 9.10 0.36 8.12 0.38 3.42 0.14
Consumer durables/
appliances
164.59 28.97 629.10 25.00 510.31 23.61 466.07 19.64
Total 568.07 100 2,516.25 100.00 2,161.73 100.00 2,372.52 100.00
___________ * The aforementioned figures have been presented on a standalone basis.
The charts below set forth our Company’s revenue from sale of products and services, across the industries that our
Company primarily caters to, for the periods indicated:
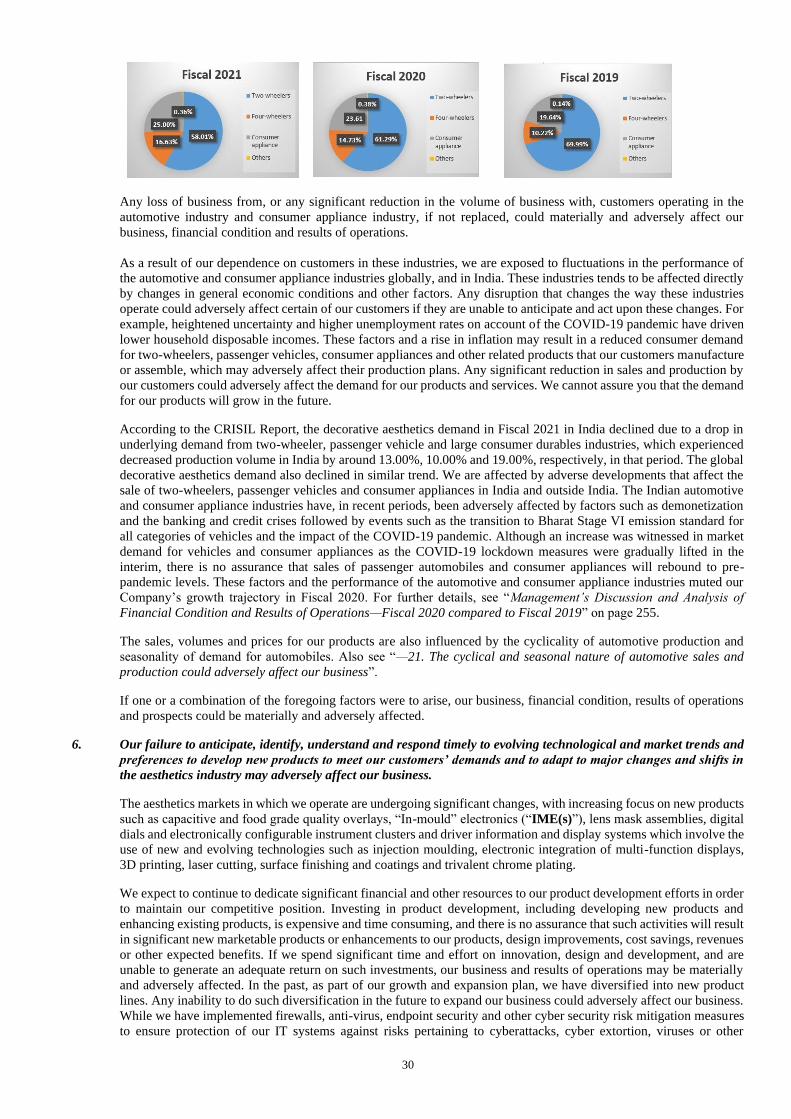
30
Any loss of business from, or any significant reduction in the volume of business with, customers operating in the
automotive industry and consumer appliance industry, if not replaced, could materially and adversely affect our
business, financial condition and results of operations.
As a result of our dependence on customers in these industries, we are exposed to fluctuations in the performance of
the automotive and consumer appliance industries globally, and in India. These industries tends to be affected directly
by changes in general economic conditions and other factors. Any disruption that changes the way these industries
operate could adversely affect certain of our customers if they are unable to anticipate and act upon these changes. For
example, heightened uncertainty and higher unemployment rates on account of the COVID-19 pandemic have driven
lower household disposable incomes. These factors and a rise in inflation may result in a reduced consumer demand
for two-wheelers, passenger vehicles, consumer appliances and other related products that our customers manufacture
or assemble, which may adversely affect their production plans. Any significant reduction in sales and production by
our customers could adversely affect the demand for our products and services. We cannot assure you that the demand
for our products will grow in the future.
According to the CRISIL Report, the decorative aesthetics demand in Fiscal 2021 in India declined due to a drop in
underlying demand from two-wheeler, passenger vehicle and large consumer durables industries, which experienced
decreased production volume in India by around 13.00%, 10.00% and 19.00%, respectively, in that period. The global
decorative aesthetics demand also declined in similar trend. We are affected by adverse developments that affect the
sale of two-wheelers, passenger vehicles and consumer appliances in India and outside India. The Indian automotive
and consumer appliance industries have, in recent periods, been adversely affected by factors such as demonetization
and the banking and credit crises followed by events such as the transition to Bharat Stage VI emission standard for
all categories of vehicles and the impact of the COVID-19 pandemic. Although an increase was witnessed in market
demand for vehicles and consumer appliances as the COVID-19 lockdown measures were gradually lifted in the
interim, there is no assurance that sales of passenger automobiles and consumer appliances will rebound to pre-
pandemic levels. These factors and the performance of the automotive and consumer appliance industries muted our
Company’s growth trajectory in Fiscal 2020. For further details, see “Management’s Discussion and Analysis of
Financial Condition and Results of Operations—Fiscal 2020 compared to Fiscal 2019” on page 255.
The sales, volumes and prices for our products are also influenced by the cyclicality of automotive production and
seasonality of demand for automobiles. Also see “—21. The cyclical and seasonal nature of automotive sales and
production could adversely affect our business”.
If one or a combination of the foregoing factors were to arise, our business, financial condition, results of operations
and prospects could be materially and adversely affected.
6. Our failure to anticipate, identify, understand and respond timely to evolving technological and market trends and
preferences to develop new products to meet our customers’ demands and to adapt to major changes and shifts in
the aesthetics industry may adversely affect our business.
The aesthetics markets in which we operate are undergoing significant changes, with increasing focus on new products
such as capacitive and food grade quality overlays, “In-mould” electronics (“IME(s)”), lens mask assemblies, digital
dials and electronically configurable instrument clusters and driver information and display systems which involve the
use of new and evolving technologies such as injection moulding, electronic integration of multi-function displays,
3D printing, laser cutting, surface finishing and coatings and trivalent chrome plating.
We expect to continue to dedicate significant financial and other resources to our product development efforts in order
to maintain our competitive position. Investing in product development, including developing new products and
enhancing existing products, is expensive and time consuming, and there is no assurance that such activities will result
in significant new marketable products or enhancements to our products, design improvements, cost savings, revenues
or other expected benefits. If we spend significant time and effort on innovation, design and development, and are
unable to generate an adequate return on such investments, our business and results of operations may be materially
and adversely affected. In the past, as part of our growth and expansion plan, we have diversified into new product
lines. Any inability to do such diversification in the future to expand our business could adversely affect our business.
While we have implemented firewalls, anti-virus, endpoint security and other cyber security risk mitigation measures
to ensure protection of our IT systems against risks pertaining to cyberattacks, cyber extortion, viruses or other
31
malware, among other threats, there can be no assurance that we will continue to successfully implement such security
measures in a manner that protects the integrity of the data in our IT systems or at all.
Our ability to anticipate changes in technology and industry trends and to successfully develop and introduce new,
enhanced and commercially-viable products on a timely basis is a significant factor in our ability to remain
competitive. Further, changes in consumer preferences or industry requirements or in competitive technologies may
render certain of our products obsolete or less attractive. For example, certain customers may consider replacing
premium 3D lux parts with lower priced plastic chrome plated, hot foiled or painted parts. Moreover, proliferation of
heads-up display (HUD) may impact the demand for appliques in the long term. However, we cannot assure you that
we will be able to develop or secure the necessary technology and equipment that will allow us to remain competitive
or expand our product portfolio in a timely manner, or at all, which could adversely affect our business and operating
margins.
Unexpected advances in a given technology in the market or difficulties encountered in developing a new technology
internally, could prevent us from seizing opportunities relating to technological breakthroughs and as a result could
impact our competitive positioning, growth and profitability. We are also subject to the risks generally associated with
new product introductions and applications, including lack of market acceptance, delays in product development and
failure of products to operate properly. Also see “—23. If our design and development efforts do not succeed, the
introduction of new products may be hindered and changes in technology may render our current technologies
obsolete or require us to make substantial capital investments. Start-up costs and inefficiencies related to new products
or programs can adversely affect our operating results and such costs may not be fully recoverable if new programs
are cancelled.” on page 40.
If we are unable to maintain our competitive advantage through innovation and development of new and compelling
products in response to our customers’ preferences or if we do not sustain our ability to meet our customers’ technology
requirements, our business, financial condition and results of operations could be materially and adversely affected.
7. We operate in a highly competitive industry and increased competition may lead to a reduction in our revenues,
reduced profit margins or a loss of market share.
The aesthetics products industry is highly competitive, involving a few players with diversified product portfolios
having presence across most OEMs; however, there are several other enterprises which manufacture of one or a limited
range of aesthetics and are direct suppliers to OEMs and Tier-1 suppliers, evidencing the fragmented nature of the
aesthetics industry, according to the CRISIL Report. According to that report, certain segments within the aesthetics
industry, particularly decals, graphics and logos, are highly commoditized and have low barriers to entry or exit,
leading to a market with a certain degree of fragmentation. Increased competition from other organized and
unorganized aesthetic product and solution providers may lead to a reduction in our revenues, reduced profit margins
or a loss of market share.
Our success depends on our ability to anticipate, understand and address the preferences of our existing and prospective
customers as well as to understand evolving industry trends and our failure to adequately do so could adversely affect
our business. Further, if the quality of our products or the level of our services deteriorates, or if we are unable to
provide high-precision aesthetic products in a timely, reliable and secure manner, our reputation and business may
suffer. Our competitors may successfully attract our customers by matching or exceeding what we offer. In respect of
products or solutions where we are a new entrant, some of our competitors may have more experience than us.
Among other things, our competitors may:
• have presence, or expand their presence, in higher number of geographic markets than we are present in;
• reduce, or offer discounts on, their prices for similar products as ours; while we may respond by matching
their prices, by offering comparable or more attractive commercial terms or by increasing our advertising and
promotions in order to retain or attract customers, it may increase our costs and limit our ability to maintain
our operating margins or growth rate;
• target the same products or applications as us or develop different products that compete with our current
solutions;
• attract or retain a key managerial or sales personnel with relationships with a key customer or confidential
information regarding our future product pipeline and growth plans;
• be able to source raw materials at more competitive prices;
• harness better process technology or improved process yield and respond more quickly and effectively than
we do to new or changing opportunities, applications, technologies, standards, or customer requirements;
32
• benefit from a wider range of products and services and a broader customer base needed to bring competitive
solutions to the market;
• possess greater economies of scale if they are larger than us and operating efficiencies such as higher
production capacities; or
• possess greater financial resources than we do, and may be able to devote greater resources to pricing and
promotional programs.
If any or a combination of the foregoing factors occur, we may not be able to maintain our growth rate and our revenues
and operating margins may decline. We cannot assure you that we will continue to effectively compete with our
competitors in the future, and our inability to compete effectively could affect our ability to retain our existing
customers or attract new customers, which may in turn materially and adversely affect our business, financial
condition, results of operations and prospects. Also, see “Our Business—Competition” on page 120.
8. We depend on the skills and experience of our senior management and other key personnel with technical expertise
and the loss of any of those personnel or the inability to attract and retain qualified personnel could materially and
adversely affect our business and operations.
Our success depends to a large extent upon the continued efforts and services of our senior management team as well
as other key personnel with technical expertise, and we rely significantly on their experience. For details of our senior
management and Key Managerial Personnel, see “Our Business—Competitive Strengths—Experienced and qualified
management team” and “Management—Key Managerial Personnel” on pages 120 and 160, respectively. We could
be adversely affected by the loss of any of our senior management or such other key personnel. In an event of their
retirement or departure, we cannot assure you that we will be able to find suitable replacements with similar experience
and skills. The market for such qualified professionals is competitive and we may not continue to be successful in our
efforts to attract and retain qualified people. Our success also depends, in part, on key customer relationships forged
by members of our senior management. If we were to lose these members of our senior management, we cannot assure
you that we will be able to continue to maintain key customer relationships or renew them. Loss of such personnel
may also impair our level of technical expertise. If we are unable to retain these members of our senior management,
our business, financial condition, results of operations and prospects may be adversely affected.
We are a technology driven company with significant focus on our in-house design and development capabilities. Our
future success and our ability to provide high-quality products and services and to manage the complexity of our
business depends, in part, on our ability to attract, hire and retain semi-skilled and skilled and qualified personnel with
experience, know-how and skills at all levels of our business and operations in the areas of management, product
engineering, design, manufacture, servicing, sales, marketing, information technology and finance who can adapt to a
dynamic, competitive and challenging business environment.
Higher attrition rates lead to an increase in our training and recruitment costs. Our Company’s average attrition rate in
the last three Fiscals was 13.29% with respect to its total workforce. Competition for such personnel is intense and the
cost of retaining or replacing such personnel may affect our profitability. If we lose the services of any member of our
skilled personnel, we cannot assure you that we will be able to locate suitable or qualified replacements, which may
adversely affect our growth objectives and, in turn, our business, financial condition, results of operations and
prospects.
9. We do not have firm long term commitment agreements with all our customers. We may not realize all of the
revenue expected from our existing or new programs and may not be able to accurately forecast demand for our
products and plan production schedules in advance.
The amount of our sales to the customers, including the realization of future sales from awarded business or obtaining
new business or customers, is inherently subject to a number of risks and uncertainties, including the accuracy of
customer estimates relating to volumes of vehicles or consumer appliances to be produced and sold and the timing of
such production.
We typically participate in a rigorous vendor selection processes with our customers for securing business. We are
generally required to submit a detailed technical proposal and may be required to develop and supply concept
prototypes based on the initial design plans. Once our prototype is confirmed, we are awarded the program. We
typically execute standard terms and conditions or master purchase agreements with our customers followed by
program-specific statement of work and open purchase orders, which is consistent with market practice in our industry.
However, there is no assurance in relation to the sales volumes and revenue that the program will eventually generate
for us. Further, our customers may delay or cancel a development program that has been awarded to us due to various
reasons. For example, as a result of impact of the COVID-19 pandemic, our customers may delay their product
development programs. Since we do not have firm commitment or long-term supply agreements with all our customers,
and instead rely on purchase orders, statements of work and customer schedules to govern the volume, price and other
33
terms of the development program and sales, which may be amended or cancelled prior to finalization, we may not
have any recourse in the event of an unexpected delay or cancellation of a development program.
We base our growth estimates, in part, on volumes promised by our customers. Under the statement of work, our
customers provide us only with forecast volume for the program and there is no commitment on the part of the customer
to purchase the quantities specified in the volume projections. Our purchase orders with customers are generally open-
ended in terms of period and quantity to be supplied. Pursuant to the purchase order, our customers provide program-
specific delivery schedules at short intervals throughout the period of the program and are based on a number of
economic and business factors such as our customers’ demand and supply situation, and other variables and
assumptions, some or all of which may change or may not be accurate and, accordingly, our growth estimates may not
accurately indicate our actual sales and revenues for any future period or date.
The purchase orders are valid as long as our customers require the specific aesthetic products from us. Although our
customers provide us with forecasts of annual business volumes, the actual orders are only placed by way of ongoing
purchase orders and our customers typically make no long-term commitments and as a result, our sales from period to
period may fluctuate significantly as a result of changes in our customers’ vendor preferences or the discontinuation
of, loss of business with respect to, or a lack of commercial success of, a particular vehicle model or consumer
appliance. If there are significant cuts in production schedules announced by customers with little advance notice, we
may be unable to respond with corresponding production and inventory reductions. As a result, it is difficult for us to
forecast revenue, production or sales and plan our inventory in advance. Our inability to forecast the level of customer
demand for our products and our inability to accurately schedule our raw material purchases and production and
manage our inventory may adversely affect our business and cash flows from operations.
Any failure to meet our customers’ expectations could result in the cancellation of orders. Our customers may terminate
their arrangements with us for cause or otherwise for, among others, a change of control of our Company and our non-
compliance with contractual obligations such as standards for product quality and quantity as well as delivery
schedules, and in certain cases have no liability to pay for or reimburse lost profits, unabsorbed overheads, capital
investments made by us, product development and engineering costs, facilities and equipment rental and other related
costs such as penalties or administrative charges incurred directly or indirectly by us in connection with cancelled
orders. Even after such termination, we will continue to be bound by some of our obligations, including non-disclosure
of confidential information and continuing indemnity obligations.
In addition, we do not have exclusive contracts with any of our large customers, which entitles them to replace us with
another supplier under certain circumstances. Accordingly, we may not in fact realize all of the future sales represented
by our awarded business, which could materially and adversely affect our business, cash flows, financial condition
and results of operations.
Also see “—24. Our business agreements include certain onerous and restrictive terms, failure to comply with which
may lead to termination of such agreements, which may adversely affect our business and operations” on page 25.
10. We do not have long term contracts or exclusive arrangements with any of our suppliers; any major disruption to
the timely and adequate supplies of our raw materials may adversely affect the pricing and supply of our products.
We use a variety of raw materials to manufacture our aesthetic products. The principal raw materials and components
we use include plastics, copper, nickel, aluminium, paints, inks, chemicals, adhesives, plastic polymers such as
polyvinyl chloride (“PVC”), metallized polyester, polyethylene terephthalate (“PET”), polycarbonate (“PC”) in the
form of films, sheets and resins.
We do not currently have long term contracts or exclusive supply arrangements with any of our suppliers and we
purchase the raw materials on spot order basis. Although we have not encountered any significant disruptions in the
sourcing and/or supply of our raw materials, we cannot assure you that such disruptions will not occur and/or we shall
continue to be able to source raw materials in a cost effective manner.
We select suppliers based on total value (including total price, quality, delivery and technology), taking into
consideration their production capacities and financial condition and expect that they will deliver in accordance with
our quality standards and comply with their contractual obligations with us. We are dependent on a limited set of third
party suppliers, some of whom are our competitors, for our raw materials. We cannot assure you that strong demand,
capacity limitations, industry shortages, work stoppages, labour or social unrest, transport bottlenecks and risks,
weather emergencies, commercial disputes, government actions, riots, wars, sabotage, cyber-attacks, non-conforming
materials, acts of terrorism, “acts of God” (which means an event that directly and exclusively results from the
occurrence of natural causes that could not have been prevented by the exercise of foresight or caution), financial or
operational instability of suppliers or other problems that our suppliers experience will not result in occasional
shortages or delays in their supply of materials to us. The COVID-19 pandemic resulted in some disruptions in
operations during the first quarter of Fiscal 2021.
34
The failure of our suppliers to deliver raw material in the necessary quantities or as per the required delivery schedule,
or specifications in relation to quality, standard or performance, may adversely affect our production schedule and
processes, thereby preventing us from delivering to our customers and in turn giving rise to contractual penalties or
liabilities, loss of customers or reputation, any of which could adversely affect our business, financial condition and
results of operations. Additionally, a material shortage in supply of raw material could result in the failure to meet our
contractual obligations, which may in turn result in a loss of revenue and cash flows. We cannot assure you that if we
experience a significant or prolonged shortage of raw materials from any of our suppliers, we will be able to source
materials of comparable quality from other sources on similar commercial terms and at comparable costs, within a
reasonable timeframe to meet our production schedules and to deliver our products to our customers in timely fashion
and we could miss customer delivery expectations.
Some of our raw material imports are regulated by the Manufacture, Storage and Import of Hazardous Chemical Rules,
1989 that, among other things, allows the concerned authority to take any action if it deems that the chemicals proposed
to be imported may cause major accidents or stop an import of chemicals based on safety and environmental
considerations. We cannot assure you that such regulations would not be made more stringent which would
consequently restrict our ability to import raw materials from other jurisdictions. We also cannot assure you that, under
such circumstances, we will be successful in identifying alternate suppliers for raw materials or we will be able to
source the raw materials at favourable terms in a timely manner. Also see “—28. Activities in our operations involves
working with hazardous materials which can be dangerous to our operations and the environment and could cause
injuries to people or property.” on page 25.
If any of the foregoing risks occur, our customer relations, reputation, business, financial condition and results of
operations could be materially and adversely affected.
11. Our manufacturing and warehousing facilities are subject to various operating risks and their shutdown could
restrict and adversely affect our business and operations. Any slowdown in the states where our manufacturing
facilities are located could also adversely impact our business, results of operations and financial condition.
We manufacture our aesthetic products from manufacturing facilities located in Bengaluru and Pune in India. As at
the date of this Red Herring Prospectus, in addition to our manufacturing facilities in Bengaluru and Pune, our
distribution channel comprised seven warehouses located in Gurugram in Haryana, Rudrapur in Uttarakhand,
Aurangabad and Pune in Maharashtra, Kanchipuram and Hosur in Tamil Nadu and Mysuru in Karnataka in India. Due
to their geographic location in certain select states in India, our manufacturing and warehousing facilities are
susceptible to local and regional factors at these locations such as system failures, weather conditions, accidents,
natural disasters, regional conflicts, civil unrest and other adverse social, economic and political events.
Our manufacturing and warehousing facilities are subject to various operating risks and we may encounter
manufacturing problems or experience difficulties or delays as a result of occurrence of the following events:
• forced or voluntary closure, including as a result of natural or man-made disasters, pandemic or regulatory
inspections;
• failure or bottlenecks in production processes, breakdown or failure of equipment, power supply or processes;
• unanticipated or adverse events connected with integration of our Pune facility with our operations;
• performance below expected levels of efficiency, obsolescence of our equipment and production facilities;
• problems with supply chain continuity at either of our facilities or at a suppliers or vendors’ facility;
• industrial accidents and compliance with the directives of relevant government authorities;
• contravention of any condition of our regulatory approvals such as any norms prescribed by pollution control
authorities; and
• labour disputes, strikes, lock-outs that may result in temporary shutdowns or manufacturing disruptions.
Any such events or any other events beyond our control may cause an unplanned shutdown or temporary or sustained
slowdown in our production, or may require us to incur significant compliance or remediation costs. We may not be
able to sufficiently pass on such costs to our customers or recover through insurance in all events. For instance, on
account of the government restrictions in India due to the COVID-19 pandemic, (a) our Registered and Corporate
Office and operations at our Company’s manufacturing facility located in Bengaluru were temporarily closed in April
2020, and (b) operations at our manufacturing facility located in Pune were temporarily closed from end March 2020
to early May 2020. For details in relation to the addresses of our Bengaluru and Pune manufacturing facilities, see
“Definitions and Abbreviations—Bengaluru Facility” and “Definitions and Abbreviations—Pune Facility” on pages 1
and 1, respectively. Further, the assembly lines of our customers rely significantly on the timely delivery of our
products and our ability to provide an uninterrupted supply of our products is critical to our business. Stoppage in

35
critical operations or interruption of assembly lines may cause certain of our customers to terminate their relationships
with us, impose penalties, or initiate legal proceedings against us for damages.
If any of the above-mentioned risks were to occur, our business, results of operations and financial condition could be
adversely affected.
12. We are exposed to counterparty credit risk and any delay in, or non-receipt of, payments may adversely affect our
cash flows and results of operations.
We are exposed to counterparty credit risk in the usual course of our business due to the nature of, and the inherent
risks involved in, dealings, agreements and arrangements with our counterparties who may delay or fail to make
payments or perform their other contractual obligations.
Our operations involve extending credit to our customers in respect of sale of our products and consequently, we face
the risk of the uncertainty regarding the receipt of these outstanding amounts. As at June 30, 2021, our outstanding
trade receivables were ₹613.13 million which constituted 82.56% of our revenue from operations. As at March 31,
2021, March 31, 2020 and March 31, 2019, our outstanding trade receivables were ₹597.30 million, ₹448.26 million
and ₹457.66 million, respectively, and constituted 23.74%, 20.74% and 19.29%, respectively, of our revenue from
operations. We also provide advances to our suppliers and ₹70.01 million of such advances provided by us remained
outstanding as at June 30, 2021.
The financial condition of our customers, business partners, suppliers and other counterparties may be affected by the
performance of their business which may be impacted by several factors including general economic conditions which
may be beyond our control. An event such as the outbreak of the COVID-19 pandemic that results in a slowdown in
the general economy or a potential credit crisis could cause our customers, business partners or suppliers to suffer
disruptions in their businesses or experience financial distress, their access to the credit markets could be limited, and
they could file for insolvency or bankruptcy protection and we cannot assure you of the continued viability of our
counterparties or that we will accurately assess their creditworthiness.
Such conditions could cause our customers to delay payment, request modifications of their payment terms, or default
on their payment obligations to us, all of which could increase our receivables. We cannot assure you that we will be
able to collect the whole or any part of any overdue payments. A significant delay in, or non-receipt of, large payments
or non-performance by our customers, business partners, suppliers or other counterparties could adversely affect our
cash flows and results of operations. Timely collection of dues from customers also depends on our ability to complete
our contractual commitments and subsequently bill for and collect from our customers. If we are unable to meet our
contractual obligations, we may experience delays in the collection of, or be unable to collect, our customer balances,
which could adversely affect our cash flows and results of operations.
The credit period offered by our business partners and suppliers is generally lesser than what we generally grant our
customers, which typically ranges between 30 and 120 days for our Company. The longer credit period granted to our
customers compared to that offered by our suppliers may potentially result in certain cash flow mismatches. We cannot
assure you that we will not experience any significant cash flow mismatches in the future or that our cash flow
management measures will function properly, or at all. If we fail to properly manage the possible cash flow
mismatches, our cash flows, financial condition and results of operations could be materially and adversely affected.
13. We may face difficulties in executing our expansion plans and other growth strategies.
Our business and growth strategies include continuing expansion of the size and scope of our business by developing
and introducing new technologies and efficient processes, diversifying our product portfolio with focus on premium
products, capitalizing on industry trends and focusing on premium products, increasing our share of business with
existing customers and adding new customers and expanding our geographical presence by expanding exports and
global product offerings. See “Our Business—Our Business Strategy” on page 120, for details on our business and
growth strategies. Even if we have successfully executed our business strategies in the past, we cannot assure you that
any of our growth strategies will be successful in a timely manner, or at all.
According to the CRISIL Report, the demand for aesthetics is expected to grow at a CAGR of approximately 20.00%
over the Fiscal 2021 to Fiscal 2026 period to reach approximately ₹49.20 billion by Fiscal 2026 and we expect the
global aesthetics industry to follow a similar trend. The demand for aesthetic products is expected to recover and grow
by approximately 17.00% in Fiscal 2022. A key part of our strategy is to take advantage of these favourable trends.
However, we cannot assure you that these trends will materialize as expected or that our future performance will be
consistent with, or exceed, our past performance.
The success of our growth strategies will depend, among other things, on our ability to implement our plans correctly,
timely develop and commercialize new products and technologies such as IMLs/IMDs, IMEs and capacitive overlays,
operate in markets or geographies where we have limited or no experience, overcome entry barriers and qualify in a
36
rigorous selection processes to become an approved vendor for key customers operating in the passenger vehicle and
consumer appliance industries, diversify and differentiate our product offering and pricing to compete effectively.
Further, as we scale-up and diversify our operations, we will need to manage relationships with a larger number of
customers and suppliers. We may not be able to execute our operations efficiently resulting in delays, increased costs
and product defects. We cannot assure you that our current policies and systems will adequately address these
challenges, or that new risks will not arise as a result of our growth which we have not anticipated.
We expect our strategies to place significant demands on our management and other resources and require us to
continue developing and improving our operational, financial and other internal controls. We may not be successful
in controlling our input costs, effectively managing our internal supply chain and manufacturing processes.
Additionally, we may be subject to business and competitive uncertainties and other factors beyond our control such
as shift in customer preferences or a slowdown in the global economic and market conditions resulting in decline in
demand for our or our customers’ products. For example, some of our customers with established global platforms
may already have an established supply chain and they may not be able to integrate us without undue cost or disruption
to their operations. In addition, we could face challenges from global competitors and incumbent local aesthetics
suppliers who may have stronger and more established operations and may have advantages over us in terms of pricing,
costs and local knowledge, among other factors.
Our strategies may not generate the expected returns or be profitable and we may not be able to fully implement our
strategies, which could materially and adversely affect our business, cash flows, financial condition, results of
operations and growth prospects.
14. We are subject to strict quality requirements and any failure by us or our suppliers to comply with quality standards
may lead to cancellation of existing and future orders, product recalls, product liability, warranty claims and other
disputes and claims.
Under the terms of our agreements or arrangements with our customers, we and our manufacturing processes are
subject to strict quality standards imposed by them. Failure by us or any of our business partners or suppliers to achieve
or maintain compliance with these requirements or quality standards may adversely affect our ability to supply
products to our customers. Our customers may reject our products, terminate their contracts with us or choose our
competitors over us if we fail to perform our contractual obligations or meet the quality or performance standards set
out in our agreements or arrangements with our customers, which may in-turn harm our reputation. Failure by us or
any of our business partners or suppliers to comply with applicable quality standards could also result in our products
failing to perform as expected, or alleged to result in property damage if our products are defective or are used
incorrectly by our customers (or by their customers or end-users). The occurrence of any such events could expose us
to product warranty, product recall or product liability claims.
Under the product warranties provide by us to certain key customers, we may be required to bear costs and expenses
for the repair or replacement of these defective products. The provision for warranty and rejection is done based on
past experiences, product lifecycle maturity, reprocessing or repair cost. The provisions for expected cost of warranty
obligations are recognized based on our management’s best estimate of the expenditure required to settle the
obligation, which takes into account the empirical data on the nature frequency and average cost of warranty claims
and regarding possible future incidences. For details, see “Financial Information” on page 183. Such warranties may
be enforced against us even in cases where the underlying sales contract has expired.
We are also required to maintain general liability insurance covering our products. As at March 31, 2021, our
Company’s and our Subsidiary’s total insurance coverage was ₹1,740.00 million and ₹343.50 million, respectively.
We may also be required to indemnify customers against losses occurring as a result of defective products and
reimburse our customers for administrative, labour, material and other such costs, which may survive after termination
of our agreements or arrangements with our customers. We may also become subject to legal proceedings and
commercial or contractual disputes. Potential product recalls could cause disruption to our business and result in
reputational harm and the costs and expenses associated with warranties, product recalls and product liability claims
could adversely affect our results of operations and financial condition. If we incur significant liabilities for which
there is no or insufficient insurance coverage our business, financial condition and results of operations could be
adversely affected.
Also see “—24. Our business agreements include certain onerous and restrictive terms, failure to comply with which
may lead to termination of such agreements, which may adversely affect our business and operations” on page 25.
15. Pricing pressure from customers may affect our gross margin, profitability and ability to increase our prices.
Our customers negotiate for larger discounts in price of our products and services as the volume of their orders increase.
In addition, estimating amounts of such price reductions is subject to risk and uncertainties, as any price reduction is
the result of negotiations and other factors. Accordingly, suppliers must be able to reduce their operating costs in order
37
to maintain profitability. We seek price reductions from our suppliers and improved processes to increase
manufacturing efficiency and reduce costs.
Pursuing cost-cutting measures while maintaining rigorous quality standards may adversely affect our sales and profit
margins. To maintain our profit margins, we focus on developing new processes and alternate raw materials and
regularly evaluate value engineering proposals, the benefits of which support stable or increased prices. If we are
unable to offset customer price reductions in the future through continued technology improvements, improved
operational efficiencies, new manufacturing processes, cost-effective sourcing alternatives, cost reductions or other
productivity initiatives, our business, financial condition and results of operations may be materially adversely
affected. In addition, costs incurred by us to customize certain of our equipment and processes to meet specific
customer requirements may or may not be fully recovered from our customers. We cannot assure you that we will be
able to avoid future customer price reductions or offset the impact of any such price reductions, which may adversely
affect our business, financial condition and results of operations.
16. Any increase or volatility in the price of raw materials could adversely affect our profit margins.
Raw material pricing can be volatile due to a number of factors beyond our control, including global demand and
supply, general economic and political conditions, higher transportation and labour costs, labour unrest, natural
disasters, the spread of communicable diseases, the COVID-19 pandemic, competition, import duties, tariffs and
currency exchange rates, and there are uncertainties inherent in estimating such variables, regardless of the
methodologies and assumptions that we may use. This volatility in commodity prices can affect our raw material costs.
We have adopted a diversification strategy and have made arrangements with various suppliers to reduce the risk of
price volatility and outage of raw materials. Further, volatility in fuel prices can also affect commodity prices
worldwide which may increase our raw material costs.
Our Company’s business is sensitive to the prices of PVC, PC, metalized polyester films, inks and chemicals, which
together constituted 66.25%, 66.19%, 66.06% and 65.75% of our Company’s total cost of raw materials in the three
month period ended June 30, 2021 and in Fiscals 2021, 2020 and 2019, respectively and 23.84%, 27.00%, 26.10% and
26.42%, respectively of our Company’s revenue from operations in those periods. Similarly, our Subsidiary’s business
is particularly sensitive to the prices of polymer granules, chemicals, paints, copper, nickel, which together constituted
48.61% and 49.91% of our Subsidiary’s total cost of raw materials in the three month period ended June 30, 2021 and
Fiscal 2021, respectively, and 30.63% and 28.56% of our Subsidiary’s revenue from operations in that period.
In the three month period ended June 30, 2021, our Company imported raw materials amounting to ₹77.08 million,
which constituted 37.70%, of our total cost of raw materials and 13.57% of our revenue from operations in that period.
In Fiscals 2021, 2020 and 2019, our Company imported raw materials amounting to ₹346.33 million, ₹289.11 million
and ₹317.32 million, which constituted 33.74%, 33.85% and 33.29%, respectively, of its total cost of raw materials
and 13.76%, 13.37% and 13.37%, respectively, of its revenue from operations in those periods. Any restriction on
import of such raw materials or any increase in shipment costs could significantly increase the costs of such imported
raw materials, which could adversely affect our results of operations.
Our dependence on certain suppliers may also adversely affect the availability of key materials at reasonable prices.
We cannot assure you that our suppliers will continue to supply the required components or raw materials to us or
supply such raw materials and components at prices favourable to us, particularly at a time that we face substantial
pressure from customers to reduce the prices of our products. Our need to maintain a continued supply of raw materials
may make it difficult to resist price increases and surcharges imposed by our suppliers. Our inability to pass
fluctuations in raw material prices on to our customers could adversely affect our profit margins and, in turn, our
business, financial condition and results of operations. Even if we are able to pass on increases in raw material costs,
our cash flows and results of operations may still be adversely affected because of any gap in time between the date
of procurement of those raw materials and date on which we are able to reset the price of our products.
17. The annexure to our Statutory Auditors’ report issued under the Companies (Auditor’s Report) Order, 2016
(“CARO”), on our historical audited financial statements contain statements on certain matters.
The annexure to our Statutory Auditors’ report issued under CARO, on our audited financial statements for Fiscals
2021, 2020, and 2019 contain statements on certain matters in relation to dues which have not been deposited with the
appropriate authorities on account of dispute pertaining to income tax and excise duty. For further information, see
“Restated Financial Information—Annexure VI” on page 208. There can be no assurance that similar matters will not
form part of our financial statements for the future Fiscals, or that such matters will not affect our financial results in
future Fiscals. Investors should consider the matters in evaluating our financial condition, results of operations and
cash flows. Any such matters in the auditors’ report and/ or CARO report on our financial statements in the future may
also adversely affect the trading price of the Equity Shares.
18. Certain of our properties, including the land on which our Registered and Corporate Office and manufacturing
facility in Bengaluru are located, are leased from the KIADB. Certain warehouses are also leased from third parties.
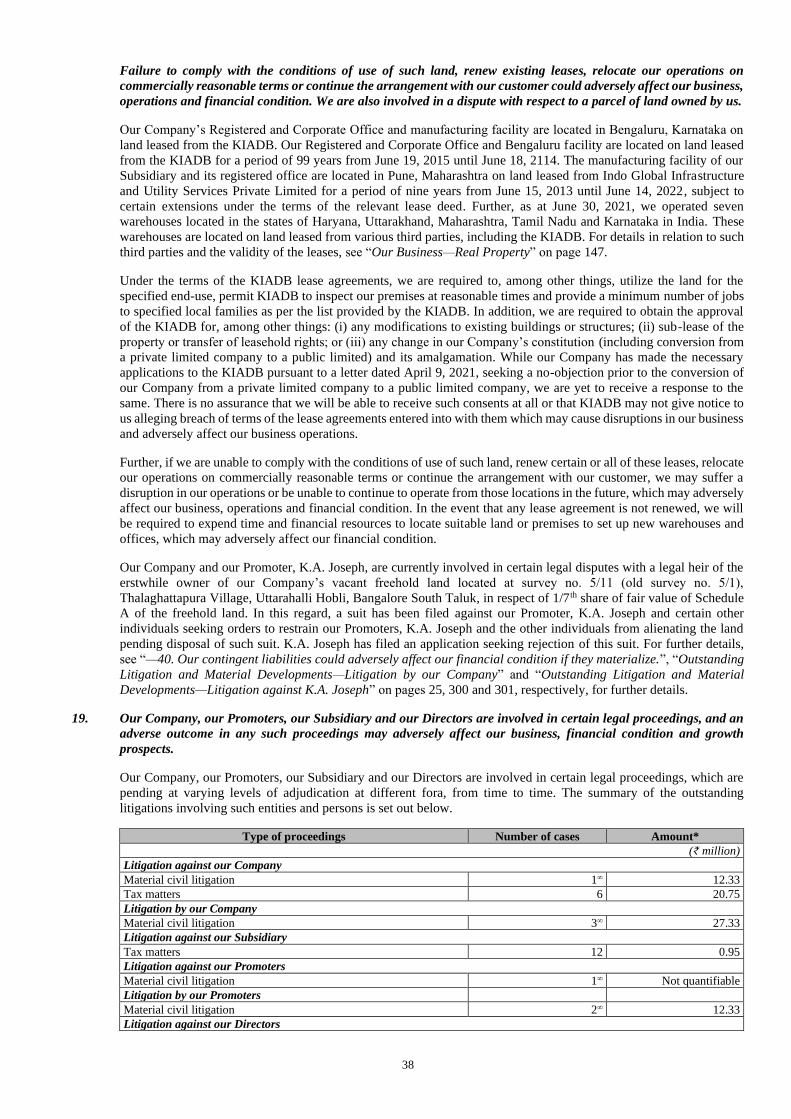
38
Failure to comply with the conditions of use of such land, renew existing leases, relocate our operations on
commercially reasonable terms or continue the arrangement with our customer could adversely affect our business,
operations and financial condition. We are also involved in a dispute with respect to a parcel of land owned by us.
Our Company’s Registered and Corporate Office and manufacturing facility are located in Bengaluru, Karnataka on
land leased from the KIADB. Our Registered and Corporate Office and Bengaluru facility are located on land leased
from the KIADB for a period of 99 years from June 19, 2015 until June 18, 2114. The manufacturing facility of our
Subsidiary and its registered office are located in Pune, Maharashtra on land leased from Indo Global Infrastructure
and Utility Services Private Limited for a period of nine years from June 15, 2013 until June 14, 2022, subject to
certain extensions under the terms of the relevant lease deed. Further, as at June 30, 2021, we operated seven
warehouses located in the states of Haryana, Uttarakhand, Maharashtra, Tamil Nadu and Karnataka in India. These
warehouses are located on land leased from various third parties, including the KIADB. For details in relation to such
third parties and the validity of the leases, see “Our Business—Real Property” on page 147.
Under the terms of the KIADB lease agreements, we are required to, among other things, utilize the land for the
specified end-use, permit KIADB to inspect our premises at reasonable times and provide a minimum number of jobs
to specified local families as per the list provided by the KIADB. In addition, we are required to obtain the approval
of the KIADB for, among other things: (i) any modifications to existing buildings or structures; (ii) sub-lease of the
property or transfer of leasehold rights; or (iii) any change in our Company’s constitution (including conversion from
a private limited company to a public limited) and its amalgamation. While our Company has made the necessary
applications to the KIADB pursuant to a letter dated April 9, 2021, seeking a no-objection prior to the conversion of
our Company from a private limited company to a public limited company, we are yet to receive a response to the
same. There is no assurance that we will be able to receive such consents at all or that KIADB may not give notice to
us alleging breach of terms of the lease agreements entered into with them which may cause disruptions in our business
and adversely affect our business operations.
Further, if we are unable to comply with the conditions of use of such land, renew certain or all of these leases, relocate
our operations on commercially reasonable terms or continue the arrangement with our customer, we may suffer a
disruption in our operations or be unable to continue to operate from those locations in the future, which may adversely
affect our business, operations and financial condition. In the event that any lease agreement is not renewed, we will
be required to expend time and financial resources to locate suitable land or premises to set up new warehouses and
offices, which may adversely affect our financial condition.
Our Company and our Promoter, K.A. Joseph, are currently involved in certain legal disputes with a legal heir of the
erstwhile owner of our Company’s vacant freehold land located at survey no. 5/11 (old survey no. 5/1),
Thalaghattapura Village, Uttarahalli Hobli, Bangalore South Taluk, in respect of 1/7th share of fair value of Schedule
A of the freehold land. In this regard, a suit has been filed against our Promoter, K.A. Joseph and certain other
individuals seeking orders to restrain our Promoters, K.A. Joseph and the other individuals from alienating the land
pending disposal of such suit. K.A. Joseph has filed an application seeking rejection of this suit. For further details,
see “—40. Our contingent liabilities could adversely affect our financial condition if they materialize.”, “Outstanding
Litigation and Material Developments—Litigation by our Company” and “Outstanding Litigation and Material
Developments—Litigation against K.A. Joseph” on pages 25, 300 and 301, respectively, for further details.
19. Our Company, our Promoters, our Subsidiary and our Directors are involved in certain legal proceedings, and an
adverse outcome in any such proceedings may adversely affect our business, financial condition and growth
prospects.
Our Company, our Promoters, our Subsidiary and our Directors are involved in certain legal proceedings, which are
pending at varying levels of adjudication at different fora, from time to time. The summary of the outstanding
litigations involving such entities and persons is set out below.
Type of proceedings Number of cases Amount*
(₹ million)
Litigation against our Company
Material civil litigation 1∞ 12.33
Tax matters 6 20.75
Litigation by our Company
Material civil litigation 3∞ 27.33
Litigation against our Subsidiary
Tax matters 12 0.95
Litigation against our Promoters
Material civil litigation 1∞ Not quantifiable
Litigation by our Promoters
Material civil litigation 2∞ 12.33
Litigation against our Directors
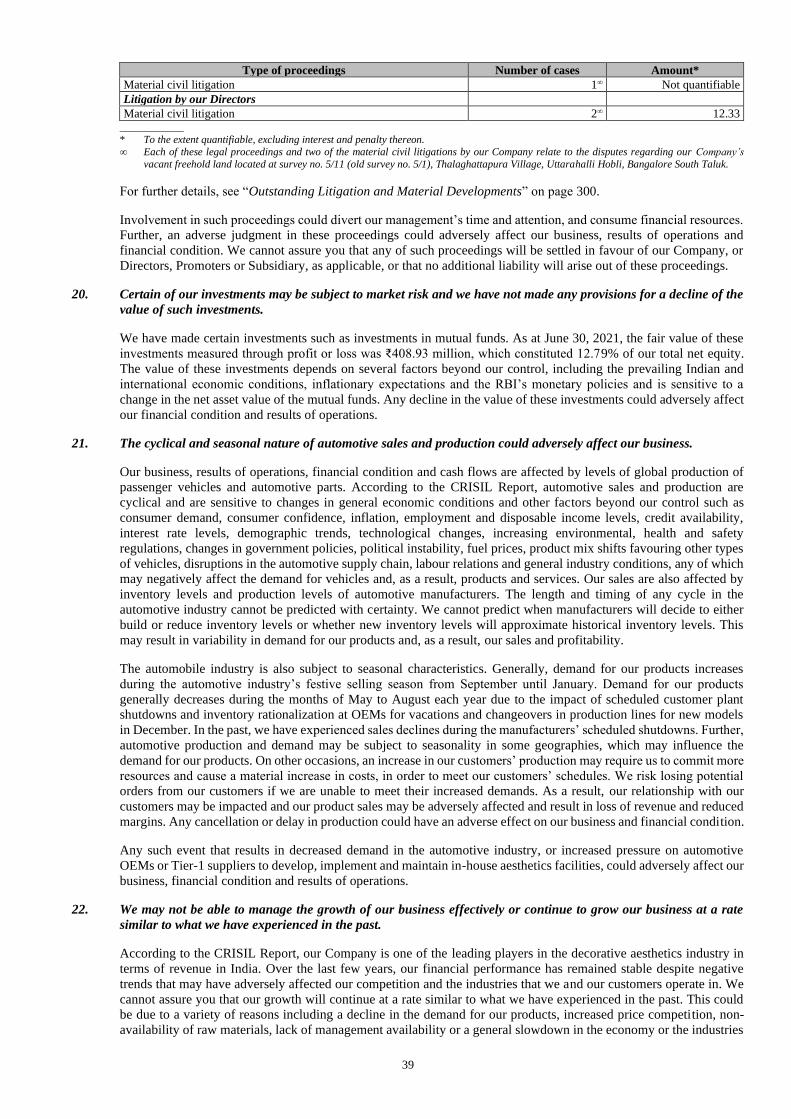
39
Type of proceedings Number of cases Amount*
Material civil litigation 1∞ Not quantifiable
Litigation by our Directors
Material civil litigation 2∞ 12.33 ____________
* To the extent quantifiable, excluding interest and penalty thereon.
∞ Each of these legal proceedings and two of the material civil litigations by our Company relate to the disputes regarding our Company’s
vacant freehold land located at survey no. 5/11 (old survey no. 5/1), Thalaghattapura Village, Uttarahalli Hobli, Bangalore South Taluk.
For further details, see “Outstanding Litigation and Material Developments” on page 300.
Involvement in such proceedings could divert our management’s time and attention, and consume financial resources.
Further, an adverse judgment in these proceedings could adversely affect our business, results of operations and
financial condition. We cannot assure you that any of such proceedings will be settled in favour of our Company, or
Directors, Promoters or Subsidiary, as applicable, or that no additional liability will arise out of these proceedings.
20. Certain of our investments may be subject to market risk and we have not made any provisions for a decline of the
value of such investments.
We have made certain investments such as investments in mutual funds. As at June 30, 2021, the fair value of these
investments measured through profit or loss was ₹408.93 million, which constituted 12.79% of our total net equity.
The value of these investments depends on several factors beyond our control, including the prevailing Indian and
international economic conditions, inflationary expectations and the RBI’s monetary policies and is sensitive to a
change in the net asset value of the mutual funds. Any decline in the value of these investments could adversely affect
our financial condition and results of operations.
21. The cyclical and seasonal nature of automotive sales and production could adversely affect our business.
Our business, results of operations, financial condition and cash flows are affected by levels of global production of
passenger vehicles and automotive parts. According to the CRISIL Report, automotive sales and production are
cyclical and are sensitive to changes in general economic conditions and other factors beyond our control such as
consumer demand, consumer confidence, inflation, employment and disposable income levels, credit availability,
interest rate levels, demographic trends, technological changes, increasing environmental, health and safety
regulations, changes in government policies, political instability, fuel prices, product mix shifts favouring other types
of vehicles, disruptions in the automotive supply chain, labour relations and general industry conditions, any of which
may negatively affect the demand for vehicles and, as a result, products and services. Our sales are also affected by
inventory levels and production levels of automotive manufacturers. The length and timing of any cycle in the
automotive industry cannot be predicted with certainty. We cannot predict when manufacturers will decide to either
build or reduce inventory levels or whether new inventory levels will approximate historical inventory levels. This
may result in variability in demand for our products and, as a result, our sales and profitability.
The automobile industry is also subject to seasonal characteristics. Generally, demand for our products increases
during the automotive industry’s festive selling season from September until January. Demand for our products
generally decreases during the months of May to August each year due to the impact of scheduled customer plant
shutdowns and inventory rationalization at OEMs for vacations and changeovers in production lines for new models
in December. In the past, we have experienced sales declines during the manufacturers’ scheduled shutdowns. Further,
automotive production and demand may be subject to seasonality in some geographies, which may influence the
demand for our products. On other occasions, an increase in our customers’ production may require us to commit more
resources and cause a material increase in costs, in order to meet our customers’ schedules. We risk losing potential
orders from our customers if we are unable to meet their increased demands. As a result, our relationship with our
customers may be impacted and our product sales may be adversely affected and result in loss of revenue and reduced
margins. Any cancellation or delay in production could have an adverse effect on our business and financial condition.
Any such event that results in decreased demand in the automotive industry, or increased pressure on automotive
OEMs or Tier-1 suppliers to develop, implement and maintain in-house aesthetics facilities, could adversely affect our
business, financial condition and results of operations.
22. We may not be able to manage the growth of our business effectively or continue to grow our business at a rate
similar to what we have experienced in the past.
According to the CRISIL Report, our Company is one of the leading players in the decorative aesthetics industry in
terms of revenue in India. Over the last few years, our financial performance has remained stable despite negative
trends that may have adversely affected our competition and the industries that we and our customers operate in. We
cannot assure you that our growth will continue at a rate similar to what we have experienced in the past. This could
be due to a variety of reasons including a decline in the demand for our products, increased price competition, non-
availability of raw materials, lack of management availability or a general slowdown in the economy or the industries
40
in which our customers operate. If we fail to expand at a rate which is more than or consistent with our historical
performance, we may lose market share and customers to our competitors.
Our growth has placed, and continues to place, significant demands on our internal administrative infrastructure, our
managerial, technical and operational capabilities as well as our financial, management and other internal risk control
systems. If we are unable to increase our production capacity in line with our customer requirements, continuous
expansion may increase the challenges involved with our ability to:
• maintain high levels of customer satisfaction and quality standards;
• develop and maintain relationships with our suppliers;
• improve our operations and technology systems and maintain risk management standards;
• operate in markets or geographies where we have limited experience; and
• preserve a uniform culture, values and work ethic in our operations.
If one or a combination of the above-mentioned factors were to arise, our business, cash flows, financial condition,
results of operations and growth prospects could be materially and adversely affected.
23. If our design and development efforts do not succeed, the introduction of new products may be hindered and
changes in technology may render our current technologies obsolete or require us to make substantial capital
investments. Start-up costs and inefficiencies related to new products or programs can adversely affect our
operating results and such costs may not be fully recoverable if new programs are cancelled.
Our business is continually changing due to technological advances which result in frequent introduction of new
products and significant price competition. Our success depends significantly on our ability to successfully and timely
develop and, subsequently, commercialize new technologies or products in response to these changes. To develop our
products, we commit substantial time, efforts, funds and other resources in areas which we believe have significant
growth potential.
We may not be able to successfully and profitably develop, produce and market such technologies or products, and
our new products may not perform as we expect. Even if we are successful in developing a new product, such product
may not meet the needs of our customers as effectively as competitive offerings. Our products could also become
subject to litigation by other parties claiming that our product infringes on their intellectual property or may be
otherwise unsuccessful in the market place due to the introduction of superior products by our competitors. As a result,
our ongoing investments in design and development of new products and processes may result in higher costs without
a proportionate increase in revenues. Moreover, it may take longer than we anticipate for new products to gain market
acceptance.
Although we strive to maintain and upgrade our technologies, facilities and machinery consistent with prevailing
customer preferences as well as applicable international quality standards, the technologies, facilities and machinery
we currently use may become obsolete. The cost of implementing new technologies and upgrading our manufacturing
facilities could be significant. If our products and technologies become obsolete and if we are unable to innovate and
keep up with technological advancements or to successfully introduce new products for various reasons, our business,
cash flows, financial condition and results of operations could be adversely affected.
New programs that customers award us often entail material start-up costs with respect to the design, development and
testing of the products to match our customers’ specifications. If we are unable to recoup start-up costs, manage our
labour and equipment resources effectively in connection with the establishment of new programs and new customer
relationships, or correctly estimate required resources in advance, our gross margins and operating results could be
adversely affected. These factors are particularly evident in the early stages of the life cycle of new products and new
programs. These factors also affect our ability to efficiently use labour and equipment. In addition, if any of these new
programs or new customer relationships were terminated, our operating results could be adversely affected,
particularly in the short term. We may not be able to adequately recover these start-up costs or replace anticipated
revenues with any such new products or programs, which could adversely affect our business, cash flows, financial
condition and results of operations.
24. Our business agreements include certain onerous and restrictive terms, failure to comply with which may lead to
termination of such agreements, which may adversely affect our business and operations.
In connection with our business, we enter into supply agreements, manufacturing agreements, arrangements with
vendors and general purchase agreements. These agreements contain certain restrictive terms, including:

41
• non-compete provisions, restricting the sale of our products for a specific customer in the open market or to other
manufacturers, distributors or direct or indirect competitors of the customer (including affiliates) unless permitted
by the customer;
• restrictions on change in control or ownership of our Company;
• maintenance of insurance coverage in specified amounts for, among others, product liability, commercial general
liability, and risk cover for personnel and property. As at March 31, 2021, our Company’s and our Subsidiary’s
total insurance coverage was ₹1,740.00 million and ₹343.50 million, respectively;
• adherence to strict quality standards and customer specifications (including international standards),
environmental laws such as the E-Waste (Management) Rules, 2016;
• conforming packaging, labelling, shipping and storage of our products to prescribed norms;
• customers having the right to inspect our manufacturing facilities;
• compliance with sanctions, anti-corruptions laws and competition laws;
• restrictions on sub-contracting or assignment without the customer’s consent;
• payment of liquidated damages in case of delayed delivery and indemnification obligations surviving termination
of agreements with our customers;
• non-solicit provisions in relation to our employees and those of our customers;
• protection of customer data against unauthorized access and compliance with applicable data privacy laws;
• cancellation of scheduled orders, observing confidentiality and satisfactory indemnification of claims on
termination of agreements;
• changes to product specifications or cancellation of order by customers; and
• liabilities to pay penalties for delay in shipment of products.
In addition, these agreements include a provision which requires our customer to inform us if it receives a competitive
offer for a product supplied by us, and if we are unable to match the offer within a specified time period, the customer
can terminate the agreement. Further, under these arrangements, our Company is responsible for product liability,
product defects and warranty claims for certain specified periods. See “—14. We are subject to strict quality
requirements and any failure by us or our suppliers to comply with quality standards may lead to cancellation of
existing and future orders, product recalls, product liability, warranty claims and other disputes and claims.” on page
36.
Our customers also have the right to reject delivery of products which do not comply with their requirements or which
fail the quality standards and testing procedures set out in their agreements. If we are unable to meet such obligations,
our customers may terminate their agreements with us and choose to work with our competitors, and we may be
required to indemnify them on terms set out in the agreements. Under certain arrangements, we are also required to
continue to supply spare parts for a period of time that ranges from 10 to 15 years from the last manufacturing date for
mass production for which the parts were supplied. Certain supply contracts can be terminated by prior written notice
of a specified number of days, ranging from 60 days to six months, with contract expiring at the end of the year. In
certain cases, our customer has the right to terminate the agreement if, in its opinion, we are incapable of complying
with the terms of the agreement.
We also enter into confidentiality agreements with our customers in relation to the information, specifications and
intellectual property shared by them. Compliance with these requirements may restrict our ability to undertake certain
business operations and may increase our compliance costs. See “—31. Failure to maintain our customers’ confidential
information could adversely affect our business, or damage our reputation” on page 44.
25. Our past or planned capital expenditure may not result in growth. Delay in implementation and expansion of our
manufacturing facilities may subject us to risks related to time and cost overruns.
We have incurred significant capital expenditure in the past few years, including for the setting up of our manufacturing
facility at Bengaluru. Our capital expenditures comprised of payments for purchase of property, plant and equipment
and intangible assets, capital work-in-progress, capital advances and expenses related to right-of-use assets. In the
three month period ended June 30, 2021, our capital expenditure was ₹21.66 million and in the Fiscals 2021, 2020 and
2019, our capital expenditures were ₹102.04 million, ₹161.20 million and ₹454.62 million, respectively. We possess
the ability to increase our existing production capabilities without significant additional capital expenditure, given that
the annual production capacity at our Bengaluru manufacturing facility can be increased up to 209.70 million products
and our capacity utilization rate for this facility was 10.14% and 44.07% in the three month period ended June 30,
2021 and Fiscal 2021, respectively. However, we cannot assure you that our past capital expenditure will result in
42
business growth or that we will not be required to make certain incremental capital expenditure and other investments
in order to compete effectively and respond to changing customer preferences.
For any such expansion, we may face risks relating to delays in construction, failure of our contractors and suppliers
to adhere to our specifications and timelines, among other things. Problems that could adversely affect our expansion
plans include labour shortages, increased costs of equipment or manpower, inadequate performance of the equipment
and installed machinery, delays in completion, defects in design or construction, the possibility of unanticipated future
regulatory restrictions, incremental pre-operative expenses and other external factors which may not be within our
control. We have limited control over the timing and quality of services, equipment or other supplies from third party
contractors appointed by us, and we may be required to incur additional unanticipated costs to remedy any defect or
default in their services or products to ensure that the planned timelines are adhered to. Our actual capital expenditures
for the proposed capacity additions and expansions could exceed our budgeted costs, or may not be able to achieve the
intended economic benefits. We cannot assure you that we will be able to successfully convert these capital
expenditures to be as profitable as our existing business, or at all, resulting in business losses and adversely affecting
our financial condition and results of operations.
Additionally, we incur certain capital expenditure for maintenance, such as for upgrading and improving our
manufacturing facilities, infrastructure, machines, equipment and technology to allow us to offer a diverse product
suite, reduce operating costs and drive productivity and in the event of any negative impact of the business, such capital
expenditure may result in negative cash flows. Further, expansion and acquisitions may require us to incur additional
capital expenditure or assume new debt, expose us to future funding obligations or integration risks and we cannot
assure you that such expansion or acquisition will contribute to our profitability.
For details of our manufacturing facilities, see “Our Business—Manufacturing Facilities” on page 120 and for details
in relation to the addresses of our Bengaluru and Pune manufacturing facilities, see “Definitions and Abbreviations—
Bengaluru Facility” and “Definitions and Abbreviations—Pune Facility” on pages 1 and 1, respectively.
26. We are exposed to risks relating to fluctuations in foreign currency exchange rates.
While we earn a principal portion of our revenue from operations in the Indian Rupee, we are exposed to risks related
to fluctuations in foreign currency exchange rates, particularly to the U.S. dollar and Euro owing to our export sales
to customers outside India and import of raw materials such as metalized polyester films, inks and chemicals,
adhesives, PVCs, poly carbonate films, sales and purchases for which are denominated in these currencies. For
instance, in the three month period ended June 30, 2021 and Fiscals 2021, 2020 and 2019, our export sales to customers
outside India (i.e., rest of the world) constituted 17.55%, 16.05%, 14.89% and 9.82% of our revenue from operations,
respectively and our exposure to USD denominated currency risk for trade receivables was ₹146.96 million, ₹117.61
million, ₹102.53 million and ₹77.41 million, respectively, during those periods. As we expand our business and
operations, we expect that our revenues from sales to customers outside India will increase in the future. Since our
local reporting currency is Indian Rupees, we are also subject to currency translation risk as all foreign currency
transactions including sales, purchases and other related expenses are translated into Indian Rupees for the purposes
of our financial statements.
Fluctuations in foreign currency exchange rates against the Indian Rupee could adversely affect our reported revenues
and results of operations if the value of Indian Rupee appreciates with respect to these currencies. Further, depreciation
in the value of the Indian Rupee against such other currencies could increase the Indian Rupee cost of purchasing raw
materials. We have not entered into any hedging arrangements to help mitigate the effects of fluctuations in exchange
rates to the extent we are unable to match any foreign exchange expenses with earnings.
Further, on listing, our Equity Shares will be quoted in Indian Rupees on the Stock Exchanges. Any dividends in
respect of our Equity Shares will also be paid in Indian Rupees and subsequently converted into the relevant foreign
currency for repatriation, if required. Any adverse movement in currency exchange rates during the time that it takes
to undertake such conversion may reduce the net dividend to foreign investors. In addition, any adverse movement in
currency exchange rates during a delay in repatriating outside India the proceeds from a sale of Equity Shares, for
example, because of a delay in regulatory approvals that may be required for the sale of Equity Shares may reduce the
proceeds received by Equity Shareholders. For example, the exchange rate between the Indian Rupee and the U.S.
dollar has fluctuated substantially in recent years and may continue to fluctuate substantially in the future, which may
have an adverse effect on the trading price of our Equity Shares and returns on our Equity Shares, independent of our
operating results.
27. Any disruption in supply of electricity could adversely affect our operations and increase our manufacturing costs.
We require electricity for our manufacturing facilities, and electricity costs represented a significant portion of our
production costs. In the three month period ended June 30, 2021 and Fiscals 2021, 2020 and 2019, our power and fuel
costs were ₹21.11 million, ₹51.77 million, ₹56.74 million and ₹53.72 million, representing 2.84%, 2.06%, 2.62% and
43
2.26%, respectively, of our revenue from operations in those periods. If costs of electricity were to rise, or if their
supply arrangements were disrupted, our profitability could decline.
We source a significant portion of our electricity requirements for our Bengaluru manufacturing facility from our roof-
top solar power panels, which accounted for 30.39%, 29.41% and 16.93%, respectively, of our total power
consumption in the three month period ended June 30, 2021 and Fiscals 2021 and 2020, with the remaining power
being purchased from state electricity boards and third party suppliers, the cost of which could be significantly higher,
thereby adversely affecting our cost of production and profitability. Disruptions in supply of electricity for any reason
could cause us to rely on other sources of power such as diesel-power electricity generating sets, which may not be
able to consistently meet our requirements. If electricity from alternate power source is not available at acceptable
prices, or at all, we may be required to shut down production and bear costs associated with restarting production, the
loss of production in progress and delays in delivery schedules. If costs of electricity were to rise, or if electricity
supply arrangements were disrupted, our profitability could decline.
28. Activities in our operations involves working with hazardous materials which can be dangerous to our operations
and the environment and could cause injuries to people or property.
Our operations are subject to operating risks associated with the aesthetics industry, including related to handling of
sharp equipment and the storage of raw materials such as inks, chemicals and adhesives used in our manufacturing
processes, which can result in eye injuries, among other things. Operations of our Subsidiary include painting and
plating processes which involve handling of paints, hardeners, thinners and hazardous materials such as acids and
chemicals, which can cause accidents resulting in serious injuries or death of employees or other persons, if improperly
handled, and cause damage to our properties and the properties of others. We are also subject to environmental risks
in relation to our raw materials such as plastic, PET, copper, nickel, aluminium, paints, metallized polyester, PVC,
PC, inks, chemicals and adhesives which, if improperly stored or disposed, may result in severe environmental damage.
Further, we are required to comply with various environmental laws and regulations such as the E-waste (Management)
Rules, 2016 issued by the Ministry of Environment, Forest and Climate Change.
Despite compliance with requisite safety requirements and standards, our operations are subject to hazards such as
mechanical failures, explosions, fires, release of hazardous substances, chemicals or gases and other operational
problems and environmental risks. The occurrence of any of these hazards could result in a suspension of operations
and the imposition of civil or criminal liabilities. The loss or shutting down of our facilities could disrupt our business
operations and adversely affect our reputation, financial condition and results of operations. We may also face claims
and litigation, in India or overseas, filed on behalf of persons alleging injury predominantly as a result of occupational
exposure to hazards at our facilities. If these claims and lawsuits, individually or in the aggregate, are resolved against
us, our business, results of operations and financial condition could be adversely affected.
29. We are dependent on third party transporters for the delivery of raw materials and finished products and are
exposed to the risk of disruption in their operations or a decrease in the quality of their services.
We use third party transporters in our operations. Our success depends on the smooth supply and transportation of our
finished products and the various raw materials required for our manufacturing facilities, which is subject to various
risks, uncertainties and other hazards beyond our control such as unavailability of vessel space, port congestion,
inadequate port infrastructure, accidents, adverse weather conditions, strikes and civil unrest, which could adversely
affect supplies from our suppliers. In addition, raw materials and finished products maybe lost or damaged in transit
for various reasons including occurrence of accidents or natural disasters. There may also be delay in delivery of raw
materials and finished products which may also adversely affect our business and results of operations. A failure to
maintain a continuous supply of raw materials and just-in-time delivery for our finished products could materially and
adversely affect our business, financial condition and results of operations.
Additionally, if we lose one or more of our transportation providers, we may not be able to obtain terms as favourable
as those we receive from those that we currently use, which in turn would increase our costs and adversely affect our
operating results. Further, if our transportation providers do not carry sufficient insurance coverage, any losses that
may arise during the transportation process will have to be claimed under our insurance policies. We cannot assure
you that we will receive compensation for any such claims in a timely manner, or at all, which may adversely affect
our business, cash flows, financial condition and results of operations.
Disruptions of transportation services because of weather-related problems, strikes, inadequacies in the road or rail
infrastructure, or other events could impair the ability of the third-party transportation providers to deliver us the raw
materials and our finished products to our customers in a timely manner, or at all. As a result, in the event there is any
disruption in the supply of our raw materials and our finished products, our business, cash flows and results of
operations may be adversely affected.
30. If we inadvertently infringe on the intellectual property rights of others, our business and results of operations may
be adversely affected.
44
We cannot determine with certainty as to whether we are infringing on any existing third-party intellectual property
rights. Although we typically confirm that our products do not violate existing intellectual property rights of third
parties, we may face claims that our products infringe third party intellectual property rights. Even though many of
our manufacturing services contracts generally require our customers to indemnify us for infringement claims relating
to the product designs, certain customers may be unwilling or unable to satisfy their indemnity obligations. Some of
the agreements with our customers provide us temporary ownership of intellectual property for researching, designing,
testing and developing products specifically for the customers. Any failure to comply with the terms and conditions
of such agreements with our customers may adversely affect our reputation, business, financial condition and results
of operations. In addition, we may be responsible for claims that the processes that we use in manufacturing infringe
third party intellectual property rights, which may force us to alter our technologies or designs, obtain licenses or cease
some of our operations. Such licenses or design modifications can be extremely costly. Further, necessary licenses
may not be available to us on satisfactory terms, if at all. Infringement claims could subject us to significant liability
for damages and potentially injunctive action and, regardless of merits, could be time-consuming and expensive to
resolve. Any of the foregoing could adversely affect our business, financial condition and results of operations.
31. Failure to maintain our customers’ confidential information could adversely affect our business, or damage our
reputation.
We do not have intellectual property rights over the products we develop and produce for our customers, under the
terms of the relevant customer agreements. In certain cases, our customers share their intellectual property rights in
the course of the product development process that we carry out for them. We are bound by confidentiality obligations
under our non-disclosure agreements with our customers to keep confidential certain details of our customers and to
protect their intellectual property, including in relation to technical data such as product designs and drawings that
may have been shared with us by our customers.
While it is our policy to enter into confidentiality agreements with our key employees to protect our and our customers’
intellectual property, there can be no assurance that these confidentiality agreements will not be breached or that they
will provide meaningful protection for our or our customers’ intellectual property.
An inadvertent breach or any misuse of intellectual property or proprietary data by any of our employees or business
partners may result in termination of contracts by our customers and could expose us to expensive infringement claims.
Such claims, irrespective of whether they are successful or not, may cause us to incur substantial cost and diminish
our goodwill and reputation, making it difficult for us to compete effectively and could adversely affect our business,
financial condition and results of operations.
32. Any failure to protect and leverage our intellectual property rights could adversely affect our competitive position,
business, financial condition and results of operation.
We have registered certain trademarks in India. See “Business—Intellectual Property” and “Government and Other
Approvals” on pages 120 and 305, respectively. The use of our trademarks or logos by third parties could adversely
affect our reputation, which could in turn adversely affect our business and results of operations. We may not be able
to prevent infringement of our trademarks and a passing off action may not provide sufficient protection until such
time that this registration is granted.
If our trademarks or other intellectual property are improperly used, the value and reputation of our business could be
harmed. The measures we take to protect our intellectual property may not be adequate to prevent unauthorized use of
our intellectual property by third parties. Notwithstanding the precautions we take to protect our intellectual property
rights, it is possible that third parties may copy or otherwise infringe upon our rights, which may adversely affect our
business, financial condition and results of operations.
33. Compliance with, and changes in, safety, health and environmental laws and regulations may increase our
compliance costs and as such adversely affect our business, results of operations and financial condition.
We are subject to a broad range of safety, health, environmental and related laws and regulations in India, which
impose controls on the disposal and storage of raw materials, noise emissions, air and water discharges on the storage,
handling, discharge and disposal of chemicals, employee exposure to hazardous substances and other aspects of our
operations. For example, the laws in India limit the amount of hazardous and pollutant discharge that our
manufacturing facilities may release into the air and water. The discharge of substances that are chemical in nature or
of other hazardous substances into the air, soil or water beyond these limits may cause us to be liable to regulatory
bodies and incur costs to remedy the damage caused by such discharges. Any of the foregoing could subject us to
litigation, which may increase our expenses in the event we are found liable, and could adversely affect our reputation.
The Draft Environment Impact Assessment 2020 (“EIA 2020”) has been issued by the Ministry of Forest, Environment
and Climate Change, which when notified, will supersede the Environment Impact Assessment 2006. The EIA 2020,
among other things, also aims to strengthen the monitoring mechanism for compliance of conditions for prior
environment clearance. We may be subject to stricter compliance requirements under the EIA 2020 for the facilities

45
that we may setup in future and any such increased compliance may lead to increase in compliance cost and may
adversely affect our business, financial condition and results of operations. Also, see “Key Regulations and Policies”
on page 148.
The adoption of stricter health and safety laws and regulations, stricter interpretations of existing laws, increased
governmental enforcement of laws or other developments in the future may require that we make additional capital
expenditure, incur additional expenses or take other actions in order to remain compliant and maintain our current
operations. We may inadvertently fail to comply with such regulations which could lead to enforced shutdowns and
other sanctions imposed by the relevant authorities. Complying with, and changes in, these laws and regulations may
increase our compliance costs and adversely affect our business, financial condition and results of operations.
34. We derive a portion of our revenues from export sales to certain countries and could be adversely affected by any
adverse changes in the conditions affecting these markets. Further, any change in the benefits and incentives under
certain export promotion schemes applicable to us or a delay in disbursement of benefits under such schemes may
adversely affect our results of operations.
A portion of our Company’s revenues is dependent on export of our products to Asia, the United States, Europe,
Africa, the Middle East and Latin America, which constituted 29.96%, 10.11%, 45.77%, 3.39%, 1.76% and 9.01%,
respectively, of our Company’s revenue from operations from rest of the world (exports) in Fiscal 2021. Set forth
below is a breakdown of our revenue from operations by geography based on location of customers, for the periods
indicated.
Three month period
ended June 30, 2021
Fiscal 2021 Fiscal 2020 Fiscal 2019
Amount Percentage
of total
Amount Percentage
of total
Amount Percentage
of total
Amount Percentage
of total
(₹ million) (%) (₹ million) (%) (₹ million) (%) (₹ million) (%)
India 612.34 82.45 2,112.31 83.95 1,839.90 85.11 2,139.60 90.18
Rest of the world
(exports)
130.35 17.55 403.85 16.05 321.83 14.89 232.92 9.82
Total 742.69 100.00 2,516.16 100.00 2,161.73 100.00 2,372.52 100.00
In the event of a slowdown in these regions, or any developments that make our products less attractive in any of these
regions, we may experience adverse effects on our business and results of operations. Our revenues from these markets
may decline as a result of increased competition, regulatory action, pricing pressures, fluctuations in the demand for
or supply of our products. Further, our exports are subject to the risks that are specific to each country and region we
export to, as well as risks associated with international operations, in general. These risks include complying with
changes in foreign laws, regulations and policies, including restrictions on trade, import and export license
requirements, and tariffs and taxes, intellectual property enforcement issues and changes in foreign trade and
investment policies. In the event we are unable to effectively address or comply with changes in foreign laws, or meet
the conditions stipulated in our licenses, we may be subject to penalties and other regulatory actions, which could
adversely affect our reputation, business, prospects, result of operations and financial condition.
Our Company currently avails benefits under certain export promotion schemes such as the Remission of Duties and
Taxes on Exported Products Scheme, the Duty Drawback Scheme and the Merchandise Exports from India Scheme.
In Fiscals 2021, 2020 and 2019, these export incentives amounted to ₹14.37 million, ₹4.50 million and ₹4.86 million,
respectively. Any reduction or withdrawal of such benefits or our inability to meet any of the conditions prescribed
under any of the schemes would adversely affect our business, financial condition and results of operations. Further,
the benefits or incentives under such schemes are available to us for a fixed period subject to compliance with various
terms and conditions and such incentive are not subject to renewal. We cannot assure you that we will continue to
enjoy these benefits in the future or will be able to obtain timely disbursement of such benefits.
35. We are susceptible to risks relating to compliance with various labour, workplace and related laws.
We are subject to stringent labour laws and regulations including those governing detailed procedures for the
establishment of unions, dispute resolution and employee removal and legislation that imposes certain financial
obligations on employers upon retrenchment. We are also subject to laws and regulations governing relationships with
employees in such areas as minimum wage and maximum working hours, overtime, working conditions, hiring and
termination of employees, contract labour and work permits.
For certain operations and processes, we or our independent contractors engage contract labour. Engagement of such
labour is regulated by applicable labour laws in India and we could be held responsible for wage payments to labourers
in the event of any default by the independent contractor engaged by us in making payment of wages or providing
benefits such as payment of, or contribution to, provident fund. Any adverse decision by a regulatory body or court
requiring us to employ such contract labour may adversely affect our business and operating margins.
46
Further, work stoppages due to strikes or other events could result in slowdowns or closures of our operations which
may adversely affect our ability to perform our business operations. While we have not experienced any strikes or
labour unrest at any of our manufacturing facilities in the past, we cannot assure you that we will not experience work
disruptions in the future due to industrial unrest, disputes or other problems with our work force. Furthermore,
amendments to labour laws could adversely affect our business, operating costs and margins. In the event the welfare
requirements under labour laws and regulations applicable to us change in a manner that requires us to increase
payment of employee benefits, we cannot assure you that we will be able to recover such increased labour and
compliance costs from our customers, which may adversely affect our business, operations, cash flows and results of
operations.
36. Our financing arrangements contain restrictive covenants. Our inability to meet our obligations under our debt
financing arrangements could adversely affect our business and financial condition.
As at June 30, 2021, our borrowings (current and non-current) aggregated to ₹86.38 million. In addition, our Company
has availed a working capital loan with a sanctioned amount of ₹100.00 million and ₹350.00 million from Kotak
Mahindra Bank Limited and Citibank N.A., respectively, on June 30, 2021, which had not been drawn down as at the
date of this Red Herring Prospectus.
Any significant increase in our finance cost as a result of fluctuations in interest rates may adversely affect our business
and financial condition. Since the interest rates on certain of our borrowings may be subject to changes based on the
prime lending rate of the respective bank lenders, such borrowings may be subject to renegotiation and/or escalation
on a periodic basis and may not be covered by interest rate hedge agreements. Any future performance issues by us or
in the aesthetics industry may result in a downgrade of our credit ratings, which may in turn lead to an increase in our
borrowing costs and constrain our access to funds and debt markets and, as a result, may adversely affect our business
growth. In addition, any downgrade of our credit ratings could result in default under our financing arrangements or
lenders imposing additional terms and conditions in any future financing or refinancing arrangements in the future. If
we cannot obtain alternative sources of financing or our costs of borrowings become significantly more expensive, our
business and financial condition could be adversely affected.
Moreover, the agreements governing certain of our debt obligations include terms that, in addition to certain financial
covenants, restrict our ability to, inter alia, without the prior consent of lenders:
• make any changes to our capital structure, ownership or control;
• make any drastic changes to our management operations;
• formulate any scheme of amalgamation or reconstruction;
• undertake any new project, implement any scheme of expansion or acquire fixed assets in excess of specified
limits;
• undertake guarantee obligations on behalf of any other company;
• invest in the capital market or in subsidiaries, for acquisitions or for real estate;
• diversify into non-core areas of business;
• reduce or change shareholding of promoter which results in change of management control of our Company;
• declare dividends;
• create any encumbrances over our property or undertakings;
• change the remuneration with regard to remuneration of directors by means of ordinary remuneration or
commission, scale of sitting fees etc.; or
• repay amounts borrowed from our Promoters.
Further, a loan facility availed by one of our Promoters, Evergraph, includes terms that, in addition to certain financial
covenants applicable to our Company, restrict our ability to modify or amend the constitutional documents of our
Company without the prior consent of lender.
Undertaking any of the above without the consent of our lenders or non-compliance with any of the covenants of our
financing agreements could trigger an event of default which will entitle the respective lenders to enforce remedies
under the relevant terms of the financing agreements, that include, among other things, acceleration in repayment of
the amounts outstanding under the financing agreements, enforcement of any security interest created under the
financing agreements. Further, we cannot assure you that we will be able to obtain approvals to undertake any of these
activities as and when required or that we will be able to comply with such covenants or other covenants in the future.
A default by us under the terms of any financing agreement may also trigger a cross-default under some of our other
47
financing agreements, or any other agreements or instruments containing cross-default provisions which may,
individually or in aggregate, adversely affect our operations, financial position and credit rating. For details of our
borrowings, see “Financial Indebtedness” on page 252.
37. The Proforma Condensed Consolidated Financial Information included in this Red Herring Prospectus to reflect
the impact of the Exotech Acquisition is not indicative of our future financial condition or financial performance.
Our Company recently completed the Exotech Acquisition pursuant to which Exotech became our Subsidiary on April
5, 2021. As a result, our Restated Consolidated Financial Information as at and for the three month period ended June 30,
2021 (which includes the financial performance and financial condition of Exotech) may not be comparable to our Restated
Consolidated Financial Information for prior periods. For further details, see “History and Certain Corporate Matters—
Material acquisitions or divestments of business or undertakings, mergers, amalgamations or revaluation of assets in
the last 10 years”, and “Management’s Discussion and Analysis of Financial Condition and Results of Operations—
Exotech Acquisition and Basis of Preparation of the Proforma Condensed Consolidated Financial Information” on
pages 154 and 255, respectively.
Our proforma condensed consolidated financial information as at and for the financial year ended March 31, 2021 has
been prepared for illustrative purposes only, and presents the impact of the Exotech Acquisition on our Company,
including the results of operations and the financial position of our Company that would have resulted had the Exotech
Acquisition been completed on a date occurring at the beginning of the last completed financial year presented in the
restated financial information, i.e., April 1, 2020. Our Proforma Condensed Consolidated Financial Information are
not a substitute for our past results and may not necessarily be indicative of what our actual results of operations,
financial position and cash flows would have been for such period or as at such date, nor are these intended to be
indicative of expected results or operations in the future periods or our future financial position. For further details,
see “Proforma Condensed Consolidated Financial Information” on page 291.
Our Proforma Condensed Consolidated Financial Information does not include all of the information required for
financial statements under Ind AS. It does not include any adjustment for liabilities or related costs that may result
from the Exotech Acquisition, nor do they reflect any adjustments for potential synergies therefrom. Further, our
Proforma Condensed Consolidated Financial Information was not prepared in accordance with auditing or other
standards and practices generally accepted in other jurisdictions or in connection with an offering registered with the
SEC under the U.S. Securities Act, and consequently, does not comply with the presentation of proforma financial
information in accordance with those standards and practices.
Accordingly, the degree of reliance placed by investors on our Proforma Condensed Consolidated Financial
Information and our Restated Consolidated Financial Information should be limited.
38. Failure or disruption of our information technology systems may adversely affect our business, financial condition,
results of operations and prospects.
We have implemented various information technology (“IT”) systems which covers key areas of our operations,
procurement, inventory, sales and dispatch and accounting. We significantly rely on our IT systems for the timely
supply of our products to customers. These systems are potentially vulnerable to damage or interruption from a variety
of sources, which could result in an adverse effect on our operations. A large-scale IT malfunction could disrupt our
business or lead to disclosure of, and unauthorized access to, sensitive Company information. Our ability to keep our
business operating depends on the proper and efficient operation, functioning and upgrade of various IT systems,
which are susceptible to malfunctions, disruptions and interruptions (including those due to equipment damage, power
outages, computer viruses and a range of other hardware, software and network upgrade problems). Such malfunction
or disruptions could cause economic losses for which we could be held liable. A failure of our IT systems could also
cause damage our reputation which could harm our business. Any of these developments, alone or in combination,
could adversely affect our business, financial condition and results of operations.
Further, unavailability of, or failure to retain, well trained employees capable of constantly servicing our IT systems
may lead to inefficiency or disruption of IT systems thereby adversely affecting our ability to operate efficiently. Any
failure or disruption in the operation of these systems or the loss of data due to such failure or disruption (including
due to human error or sabotage) may affect our ability to plan, track, record and analyse work in progress and sales,
process financial information, meet business objectives based on IT initiatives such as product life cycle management,
manage our creditors, debtors, manage payables and inventory or otherwise conduct our normal business operations,
which may increase our costs and otherwise materially adversely affect our business, financial condition, results of
operations and prospects.
39. Our insurance coverage may not be adequate to protect us against all material risks.
Our principal types of insurance coverage include among others, protection from fire, burglary, marine sales turn over
policy to cover various risks during the transit of goods and insurance policies for our employees such as group medi-
48
claim insurance policy, group personal accident insurance policy and employees compensation insurance. We also
maintain a directors’ and officers’ management liability and company reimbursement insurance policy for all our
Directors.
We cannot assure you that any claim under the insurance policies maintained by us will be honoured fully, in part or
on time, or that we have taken out sufficient insurance to cover all our losses. In addition, our insurance coverage
expires from time to time. We apply for the renewal of our insurance coverage in the normal course of our business,
but we cannot assure you that such renewals will be granted in a timely manner, at acceptable cost, or at all.
Additionally, in future, we may be required to bear increased premiums for our insurance to provide coverage for
pandemics such as COVID-19. Our Company’s total insurance coverage was ₹1,947.49 million, which covered
181.28% of our Company’s tangible assets (excluding freehold land and vehicles) as at June 30, 2021. Our Subsidiary’s
total insurance coverage was ₹403.50 million, which covered 264.97% of our Subsidiary’s tangible assets (excluding
freehold land and vehicles), as at June 30, 2021.
To the extent that we suffer loss or damage, or successful assertion of one or more large claims against us for events
for which we are not insured, or for which we did not obtain or maintain insurance, or which is not covered by
insurance, exceeds our insurance coverage or where our insurance claims are rejected, the loss would have to be borne
by us and our results of operations, financial performance and cash flows could be adversely affected. Also see “Our
Business –Insurance” on page 120.
40. Our contingent liabilities could adversely affect our financial condition if they materialize.
According to our Restated Consolidated Financial Information, as at June 30, 2021, our contingent liabilities that have
not been provided for are as set out in the table below.
(₹ million) Particulars As at June 30, 2021
Guarantee deposits with banks 0.10
Goods and Services Tax 8.28
Claim towards freehold land 20.40* ____________
* Our Company had purchased a freehold land located at survey no. 5/11 (old survey no. 5/1), Thalaghattapura Village, Uttarahalli Hobli,
Bangalore South Taluk in the year 2001, measuring 37 guntas and consisting of Schedule A (measuring 19 guntas) and Schedule B (measuring 17 guntas). On transition to Ind AS, our Company elected to fair value the freehold land at deemed cost of ₹278.10 million. Our Company and our
Promoter, K.A. Joseph, are involved in a legal dispute with a legal heir of the erstwhile owner of the freehold land for separate possession of 1/7
share of Schedule A of the freehold land. The amount of ₹20.40 million was been arrived at by calculating 1/7 share of fair value of Schedule A of the freehold land. As our Company is contesting this claim, outflows and other consequential payments, if any, arising out of this claim would
depend on the outcome of the dispute. For details of the ongoing litigation pertaining to this land, see “Outstanding Litigation and Material
Developments—Litigation by our Company” and “Outstanding Litigation and Material Developments—Litigation against K.A. Joseph” on pages
300 and 301, respectively.
If any of these contingent liabilities materialize, our results of operations and financial condition may be adversely
affected. For further details, see “Financial Information” on page 183.
41. Our Promoters will continue to retain certain influence over our Company after completion of the Offer, which
will allow them to influence the outcome of matters submitted for approval of our Shareholders.
The aggregate pre-Offer shareholding of our Promoters, as of the date of this Red Herring Prospectus is 98.60% of the
issued, subscribed and paid-up Equity Shares. For details, see “Capital Structure” on page 78. Consequently, our
Promoters will continue to exercise certain influence over us after completion of the Offer, including being able to
control the composition of our Board of Directors and determine decisions requiring simple or special majority voting,
and our other Shareholders may be unable to affect the outcome of such voting.
Our Board composition shall at all times remain compliant with the applicable provisions of the Companies Act and
the SEBI Listing Regulations, and we believe that the nominee rights proposed to be retained by our Promoters
subsequent to the Offer are not prejudicial to the interests of any Shareholder, including any public Shareholder.
However, there can be no assurance that the continuing right of our Promoters for representation on our Board will
not be considered as a special right by any of our present or future Shareholders. Our Promoters may, in the future,
take or block actions with respect to our business which may conflict with our best interests or the interests of other
minority Shareholders, such as actions with respect to future capital raising. They could delay, defer or cause a change
of our control or a change in our capital structure, a merger, consolidation, takeover or other business combination
involving us or discourage or encourage a potential acquirer from acquiring us. We cannot assure you that our
Promoters will always act to resolve any future conflicts of interest in our favour, thereby adversely affecting our
business, results of operations and prospects.
Further, one of our Promoters, Evergraph, has availed a loan from certain overseas lenders, for which security has
been created in favour of such overseas lenders over the shares of Evergraph held by Everstone Capital Partners II

49
LLC, the promoter of Evergraph. If such security over such shares is enforced in accordance with the relevant loan
facility documentation, it could potentially lead to a change in control of our Company.
42. Fraud, theft, employee negligence or similar incidents may adversely affect our results of operations and financial
condition.
Our operations may be subject to incidents of theft or damage to inventory in transit and prior to or during warehouse
stocking. Our business may also encounter some inventory loss on account of employee theft, vendor fraud and general
administrative errors. While we have never experienced any such instance in the past, there can be no assurance that
we will not experience any fraud, theft, employee negligence, security lapse, loss in transit or similar incidents in the
future, which could adversely affect our results of operations and financial condition. Additionally, losses due to theft,
fire, breakage or damage caused by other casualties, could adversely affect our results of operations and financial
condition.
43. We are subject to the risk of failure of, or a material weakness in, our internal control systems.
We are exposed to risks arising from the inadequacy or failure of internal systems or processes, and any actions we
may take to mitigate these risks may not be sufficient to ensure an effective internal control environment. Errors may
be repeated or compounded before they are discovered and rectified. Our management information systems and
internal control procedures may not be able to identify non-compliance in a timely manner, or at all. Where internal
control weaknesses are identified, our actions may not be sufficient to fully correct such weaknesses. In addition,
several of our collection related processes are yet to be fully automated, which may increase the risk that human error,
tampering or manipulation will result in losses that may be difficult to detect. As a result, we may incur expenses or
suffer monetary losses, which may not be covered by our insurance policies and may adversely affect our business,
financial condition and results of operations.
44. We have not been able to trace certain secretarial records and documents in relation to certain transfers of Equity
Shares involving one of our Promoters, K.A. Joseph and an allotment to K.A. Joseph. We cannot assure you that
no legal proceedings or regulatory actions will be initiated against our Company in the future in relation to missing
secretarial records.
We manage our internal compliance by monitoring and evaluating internal controls and ensuring all relevant statutory
and regulatory compliances. However, there can be no assurance that deficiencies in our internal controls will not
arise, or that we will be able to implement, and continue to maintain, adequate measures to rectify or mitigate any such
deficiencies in our internal controls, in a timely manner or at all. Despite conducting searches of our internal records,
we are unable to trace, certain secretarial records such as Form 1 for allotment of 25,330 Equity Shares to K.A. Joseph
on June 21, 2005 and share transfer forms for transfer of 120,000 and 140,000 Equity Shares to Serigraph Inc. from
K.A. Joseph on April 23, 2007 and January 7, 2008, respectively.
In the absence of such records, or for discrepancies therein, we have relied on minutes of meetings of the Company,
our register of share transfers, our register of members and the form FC-TRS filings made by the transferees with the
RBI, as applicable, in order to ascertain details of such transfers. Although no regulatory action/litigation is pending
against us in relation to such untraceable secretarial and other corporate records, we cannot assure you that we will not
be subject to penalties imposed by regulatory authorities in this respect. Accordingly, we cannot assure you that our
Company will not be subject to any action, including monetary penalties by statutory authorities on account of any
non-availability of any of its secretarial records, which may adversely affect our business, financial condition and
reputation. We also cannot assure you that such secretarial and other corporate records and documents will be available
with us in the future.
For further details, see “Capital Structure—Share Capital History of our Company” and “Capital Structure—History
of Equity Share capital held by our Promoters” on pages 78 and 80, respectively.
45. Any future transactions with related parties may potentially involve conflicts of interest.
It is likely that we may enter into transactions with related parties in the future. Although going forward, all material
related party transactions that we may enter into, will be subject to the Board’s or Shareholders’ approval, as necessary
under the Companies Act and the SEBI Listing Regulations, we cannot assure you that such transactions, individually
or in the aggregate, will not adversely affect our financial condition and results of operations or that we would achieve
more favourable terms if such transactions are entered into with unrelated parties. Such related party transactions may
potentially involve conflicts of interest. For details of related party transactions, see Note 37 included in Annexure VII
to the Restated Consolidated Financial Information in “Financial Information” on page 183.
46. Information relating to the installed capacity, actual production and capacity utilization of our manufacturing
facilities included in this Red Herring Prospectus are based on certain assumptions and estimates and future
production and capacity may vary.
50
Information relating to the installed capacity, actual production and capacity utilization of our manufacturing facilities
included in this Red Herring Prospectus have been certified by G. Shankar Rao, an independent chartered engineer,
by his certificate dated July 29, 2021. Such information is also based on certain assumptions and estimates of our
management that have been taken into account by such independent chartered engineer in the calculation of the
installed capacity, actual production and capacity utilization of our manufacturing facilities and such calculations may
not be computed on the basis of any standard methodology and may not be comparable to that employed by other
aesthetics companies. These assumptions and estimates include the period during which the manufacturing facilities
operated in a year, the number of machine-working hours per day, working shifts and breaks by the workmen, seamless
working of each machine cycle time, scheduled maintenance activities, floor-wise dedicated set up of machines and
availability of printing machines.
Actual production levels and future capacity utilization rates may vary significantly from the estimated production
capacities of our manufacturing facilities and their historical capacity utilization rates. Undue reliance should therefore
not be placed on our historical installed capacity, actual production and capacity utilization for our manufacturing
facilities included in this Red Herring Prospectus. See “Our Business—Manufacturing Capacity and Capacity
Utilization” on page 120.
47. This Red Herring Prospectus contains information from industry sources including the industry report prepared
by CRISIL which has been commissioned, and paid for, by our Company for the purpose of this Red Herring
Prospectus. Investors are advised not to place undue reliance on such information.
This Red Herring Prospectus includes information derived from third party industry sources and from a report issued
in June 2021, titled “Assessment of Select Aesthetic Components” prepared by CRISIL (the “CRISIL Report”), which
has been commissioned on February 26, 2021, and paid for, by our Company for the purposes of confirming our
understanding of the aesthetics industry exclusively in connection with the Offer and available at
www.sjsindia.com/investors.html#disclosures. Certain data and information as of October 1, 2021 pertaining to
affordable housing progress, FY 2021 production and sales figures for passenger vehicles, two wheelers and consumer
durable, export figures for vehicle segments for FY 2021, consumer durable market insights for FY 2021,
macroeconomic parameters, near term outlook have been updated in the CRISIL Report. Further, the reports use
certain methodologies for market sizing and forecasting. There are no standard data gathering methodologies in the
markets in which we operate, and methodologies and assumptions vary widely among different industry sources. Such
assumptions may change based on various factors. We cannot assure you that such assumptions are correct or will not
change and, accordingly, our position in the market may differ from that presented in this Red Herring Prospectus.
Further, the CRISIL Report or any other industry data or sources are not recommendations to invest in our Company.
You should consult your own advisors and undertake an independent assessment of information in this Red Herring
Prospectus based on, or derived from, the CRISIL Report. You are advised not to place undue reliance on the CRISIL
Report or extracts thereof as included in this Red Herring Prospectus, when making your investment decision. Also,
see “Certain Conventions, Presentation of Financial, Industry and Market Data and Currency of Presentation—
Industry and Market Data” and “Industry Overview” on pages 19 and 96, respectively.
48. Certain non-GAAP financial measures and performance indicators used in this Red Herring Prospectus to review
and analyse our financial and operating performance may have limitations as analytical tools, may vary from any
standard methodology applicable across the aesthetics or manufacturing industry, and may not be comparable with
financial or statistical information of similar nomenclature computed and presented by other aesthetics or
manufacturing companies.
We use certain supplemental non-GAAP measures to review and analyse our financial and operating performance
from period to period, and to evaluate our business, which have been included in this Red Herring Prospectus.
Although these non-GAAP measures are not a measure of performance calculated in accordance with applicable
accounting standards, our Company’s management believes that they are useful to an investor in evaluating us because
they are widely used measures to evaluate a company’s operating and financial performance. For more information on
the non-GAAP financial measures used in this Red Herring Prospectus, see “Certain Conventions, Presentation of
Financial, Industry and Market Data and Currency of Presentation—Non-GAAP Financial Measures”, “Definitions
and Abbreviations” and “Management’s Discussion and Analysis of Financial Condition and Results of Operations—
Non-GAAP Measures” on pages 19, 1 and 255, respectively.
Presentation of these non-GAAP financial measures and key performance indicators should not be considered in
isolation from, or as a substitute for, analysis of our historical financial performance, as reported and presented in our
Restated Consolidated Financial Information or the Proforma Condensed Consolidated Financial Information set out
in this Red Herring Prospectus. These non-GAAP financial measures and performance indicators are not defined under
Ind AS, are not presented in accordance with Ind AS and have limitations as analytical tools which indicate, among
other things, that they do not reflect our cash expenditures or future requirements for capital expenditure or contractual
commitments or the changes in, or cash requirements for, our working capital needs; or the finance cost, or the cash
requirements necessary to service our debt. These non-GAAP financial measures may differ from similar titled
51
information used by other companies, including peer companies, who may calculate such information differently and
hence their comparability with those used by us may be limited. Therefore, these non-GAAP financial measures and
key performance indicators should not be viewed as substitutes for performance or profitability measures under Ind
AS or as indicators of our operating performance, cash flows, liquidity or profitability.
49. Any unsecured loans taken by us may be recalled at any time.
As at June 30, 2021, we had availed unsecured loans from banks of ₹75.22 million. Existing unsecured loans or any
unsecured loans availed in the future, including working capital loans, may be recalled at any time at the option of the
lender. There can be no assurance that the lenders will not recall such borrowings or if we will be able to repay loans
advanced to us in a timely manner or at all. In the event that any lender seeks a repayment of any such loan, we would
need to find alternative sources of financing, which may not be available on commercially reasonable terms, or at all.
As a result, if such unsecured loans are recalled at any time, it may adversely affect our financial condition and results
of operations.
50. We cannot assure payment of dividends on the Equity Shares in the future.
While our declaration of dividends is at the discretion of our Board and subject to Shareholder approval as set out in
the section “Dividend Policy” on page 182, the amount of future dividend payments by our Company, if any, will
depend upon our future earnings, financial condition, cash flows, working capital requirements, capital expenditures,
applicable Indian legal restrictions and other factors. Our Company may decide to retain all of its earnings to finance
the development and expansion of its business and therefore, we may not declare dividends on the Equity Shares.
Additionally, we may, in the future, be restricted by the terms of our loan agreements to make any dividend payments
unless otherwise agreed with our lenders.
51. Our Company will not receive any proceeds from the Offer.
The Offer comprises an Offer for Sale aggregating up to ₹8,000.00 million by the Selling Shareholders. Our Company
will not receive any proceeds of the Offer. However, in the event that the Offer is withdrawn or not completed for any
reason whatsoever, all the Offer related expenses will be exclusively borne by our Company. The expenses of the
Selling Shareholders will, at the outset, be borne by our Company and each Selling Shareholder will reimburse our
Company for such expenses (inclusive of taxes) incurred by our Company on behalf of such Selling Shareholders, in
relation to the Offer, upon successful completion of the Offer in the manner as prescribed under applicable law and in
a manner as may be mutually agreed among our Company and the Selling Shareholders.
External Risk Factors
Risks related to India
52. Political, economic or other factors that are beyond our control may have a material adverse effect on our business,
operations, prospects or financial results.
We are dependent on domestic, regional and global economic and market conditions. Our performance, growth and
market price of the Equity Shares are and will be dependent to a large extent on the health of the economies in which
we operate.
While our Company is incorporated in India, our products are sold in, among other regions, India, the rest of Asia, the
United States, Europe, Africa, the Middle East and Latin America. All of our assets and employees are located in India,
and we intend to continue to develop and expand our business in India. Political and economic instability, slowdown
or conflict in these regions or worldwide could materially and adversely affect our business and financial results.
Our business and financial condition could be impacted by certain factors, including the following:
• any slowdown in the Indian economy in the future;
• increase in interest rates may adversely impact our access to capital and increase our borrowing costs, which
may constrain our ability to grow our business and operate profitably;
• a change in the trade policies, in terms of tariff and non-tariff barriers, in the countries from which we import
raw materials and to which we export our products, may adversely affect our profitability;
• fluctuations in India’s foreign exchange reserves may affect liquidity and interest rates in the Indian economy as
well as the valuation of the Indian Rupee, which may adversely affect our financial condition;
• political instability, resulting from a change in government or in economic and fiscal policies, may adversely
affect economic conditions in India;
52
• any adverse fluctuations in global commodity prices;
• the occurrence of natural or man-made disasters or epidemic or pandemic such as COVID-19 may adversely
affect economic conditions in India; and
• civil unrest, acts of violence, terrorist attacks, regional conflicts or situations or war may adversely affect the
financial markets, which may impact our business, financial condition, results of operations and cash flows.
In the three month period ended June 30, 2021 and Fiscals 2021, 2020 and 2019, our Company imported raw materials
sourced from China amounting to ₹18.17 million, ₹61.40 million, ₹33.10 million and ₹27.93 million, which constituted
8.89%, 5.98%, 3.88% and 2.93%, respectively, of its total cost of raw materials and 3.20%, 2.44%, 1.53% and 1.18%,
respectively, of its revenue from operations in those periods. Relations between India and China have been volatile
over the past year. While there have been no major disruptions in the supply chain of raw material from China so far,
if the relationship deteriorates further or there is an escalation of conflict, our supply chain may be disrupted, which
could adversely affect our business, financial condition and results of operations.
Trade deficits could also adversely affect our business. India’s trade relationships with other countries and its trade
deficit, driven to a major extent by global crude oil prices, may adversely affect Indian economic conditions. Crude
oil prices have been volatile over the past year, and if trade deficits increase or are no longer manageable because of
the rise in global crude oil prices or otherwise, the Indian economy, and therefore our business and our financial results
may be materially and adversely impacted.
53. If inflation were to rise in India, we might not be able to increase the prices of our products and services at a
proportional rate in order to pass costs on to our customers and our profits may decline.
Inflation rates could be volatile. The Indian economy has had sustained periods of high inflation in the recent past and
we may face high inflation in the future. High rates of inflation could contribute to an increase in interest rates and
increased costs of raw material, increased costs of transportation and may increase our employee costs and decrease
demand for our products and services, which may adversely affect our profitability and competitive advantage, to the
extent that we are unable to pass on increased employee costs by increasing cost of our products and services, which
may in turn adversely affect our business, financial condition and results of operations.
54. Changing laws, rules and regulations and legal uncertainties, adverse application or interpretation of corporate
and tax laws, may adversely affect our business, prospects and results of operations.
The regulatory and policy environment in which we operate is evolving and subject to change. Our business and
financial performance could be adversely affected by unfavourable changes in or interpretations of existing, or the
promulgation of new, laws, rules and regulations applicable to us and our business. In such instances, and including
the instances mentioned below, our business, results of operations and prospects may be adversely impacted, to the
extent that we are unable to suitably respond to and comply with any such changes in applicable law and policy. Any
political instability in India, such as corruption, scandals and protests against certain economic reforms, which have
occurred in the past, could slow the pace of liberalization and deregulation. The rate of economic liberalization could
change, and specific laws and policies affecting foreign investment, currency exchange rates and other matters
affecting investment in India could change as well.
The GoI has recently introduced a new law relating to social security and wages in September 2020, the Code for
Social Security (the “Social Security Code”). This code will impact overall employee expenses and, in turn, could
impact the profitability of our Company. Under the Social Security Code, a new concept of deemed remuneration has
been introduced, such that where an employee receives more than half (or such other percentage as may be notified
by the GoI), of their total remuneration in the form of allowances and other amounts that are not included within the
definition of wages under the Social Security Code, the excess amount received shall be deemed as remuneration and
accordingly be added to wages for the purposes of the Social Security Code and the compulsory contribution to be
made towards the employees’ provident fund. The Social Security Code has been published in the Gazette of India.
The effective date from which the Social Security Code will be applicable is yet to be notified and the rules are yet to
be finalized.
The application of various Indian tax laws, rules and regulations to our business, currently or in the future, is subject
to interpretation by the applicable taxation authorities. Any future amendments may affect our benefits such as
exemption for income earned by way of dividend from investments in other domestic companies and units of mutual
funds, exemption for interest received in respect of tax free bonds, and long-term capital gains on equity shares if
withdrawn by the statute in the future, and the same may no longer be available to us. Any adverse order passed by
the appellate authorities/ tribunals/ courts would have an effect on our profitability.
Unfavourable changes in or interpretations of existing, or the promulgation of new, laws, rules and regulations
including foreign investment and stamp duty laws governing our business and operations could result in us being
deemed to be in contravention of such laws and may require us to apply for additional approvals. For instance, the
53
Supreme Court of India has in a decision clarified the components of basic wages which need to be considered by
companies while making provident fund payments, which resulted in an increase in the provident fund payments to be
made by companies. Any such decisions in future or any further changes in interpretation of laws may have an impact
on our results of operations.
Further, the GoI has announced the union budget for Fiscal 2022, pursuant to which the Finance Bill, 2021 (the
“Finance Bill”), has introduced various amendments. The Finance Bill has received assent from the President of India
on March 28, 2021, and has been enacted as the Finance Act, 2021 (the “Finance Act”). We are yet to assess the
complete impact that any amendments made pursuant to the Finance Act would have on our business, financial
condition and results of operations. Furthermore, changes in capital gains tax or tax on capital market transactions or
the sale of shares could affect investor returns. As a result, any such changes or interpretations could have an adverse
effect on our business and financial performance. For further discussion on capital gains tax, see “—62. Investors may
be subject to Indian taxes arising out of capital gains on the sale of the Equity Shares” on page 57.
There can be no assurance that the GoI will not implement new regulations and policies requiring us to obtain approvals
and licenses from the GoI or other regulatory bodies, or impose onerous requirements and conditions on our operations.
Any such changes and the related uncertainties with respect to the applicability, interpretation and implementation of
any amendment or change to governing laws, regulation or policy, including by reason of an absence, or a limited
body, of administrative or judicial precedent in the jurisdictions in which we operate may be time consuming as well
as costly for us to resolve and may impact the viability of our current business or restrict our ability to grow our
business in the future. It may also have a material adverse effect on our business, financial condition, cash flows and
results of operations. In addition, we may have to incur expenditures to comply with the requirements of any new
regulations, which could materially harm our results of operations or cash flows. Any unfavourable changes to the
laws and regulations applicable to us could also subject us to additional liabilities.
We are unable to determine the impact of any changes in or interpretations of existing, or the promulgation of, new,
laws, rules and regulations applicable to us and our business. If that was to occur it could result in us, our business,
operations or group structure being deemed to be in contravention of such laws and/or may require us to apply for
additional approvals. We may incur increased costs and other burdens relating to compliance with such new
requirements, which may also require significant management time and other resources, and any failure to comply
may adversely affect our business, results of operations and prospects. Uncertainty in the applicability, interpretation
or implementation of any amendment to, or change in, governing law, regulation or policy, including by reason of an
absence, or a limited body, of administrative or judicial precedent may be time consuming as well as costly for us to
resolve and may impact the viability of our current business or restrict our ability to grow our business in the future.
55. Recent global economic conditions have been challenging and continue to affect the Indian market, which may
adversely affect our business, financial condition, results of operations and prospects.
The Indian economy and its securities markets are influenced by economic developments and volatility in securities
markets in other countries. Investors’ reactions to developments in one country may have adverse effects on the market
price of securities of companies located in other countries, including India. The ongoing COVID-19 pandemic has
caused an economic downturn in several major economies and generated volatility in, and general adverse impact on,
the global securities markets, including in India; further, it is not possible for us to predict the extent and duration of
this volatility and adverse impact on the global or Indian securities markets, including any possible impact on our
Equity Shares. For further discussion on COVID-19, see “—3. The coronavirus disease (COVID-19) and the measures
taken by the government to curb its spread could materially and adversely affect our business, financial condition and
results of operations. The extent to which the COVID-19 pandemic will impact our business, operations and financial
performance is uncertain and cannot be predicted.” on page 26. Negative economic developments, such as rising
fiscal or trade deficits, or a default on national debt, in other emerging market countries may also affect investor
confidence and cause increased volatility in Indian securities markets and indirectly affect the Indian economy in
general. Any worldwide financial instability could also have a negative impact on the Indian economy, including the
movement of exchange rates and interest rates in India and could then adversely affect our business, financial
performance and the price of our Equity Shares.
Large budget deficits and rising public debts in recent years, for example in Europe, have triggered sovereign debt
finance crises that resulted in the bailouts of European economies and elevated the risk of government debt defaults,
forcing governments to undertake aggressive budget cuts and austerity measures, in turn underscoring the risk of global
economic and financial market volatility. Financial markets and the supply of credit could continue to be negatively
impacted by ongoing concerns surrounding the sovereign debts and/or fiscal deficits of several countries in Europe,
the possibility of further downgrades of, or defaults on, sovereign debt, concerns about a slowdown in growth in certain
economies and uncertainties regarding the stability and overall standing of the European Monetary Union. Increased
budget deficits and the incurrence of additional public debt in Europe and other developed markets as a result of the
COVID-19 pandemic may exacerbate these risks and uncertainties.
54
Further deterioration in the global economy as a result of COVID-19 or otherwise, or the perception that such
deterioration could occur, may continue to adversely affect global economic conditions and the stability of global
financial markets, and may significantly reduce global market liquidity and restrict the ability of key market
participants to operate in certain financial markets. Any of these factors could depress economic activity and restrict
our access to capital, which could adversely affect our business, financial condition, cash flows and results of
operations and reduce the price of our Equity Shares. Any financial disruption could adversely affect our business,
results of operations shareholders’ equity and the price of our Equity Shares.
56. Significant differences exist between Ind AS used to prepare our financial information and other accounting
principles, such as IFRS and U.S. GAAP, with which investors may be more familiar.
The SEBI ICDR Regulations requires us to, for the purposes of disclosure in this Red Herring Prospectus, prepare and
present our financial statements for the last three Fiscals (in this case, for Fiscals 2021, 2020 and 2019) and the stub
period (as at and for the three month period ended June 30, 2021) in accordance with Ind AS. Our Company
transitioned to the Ind AS with a transition date of April 1, 2019. Our financial statements as at and for the financial
year ended March 31, 2021 are the first that we have prepared in accordance with Ind AS. Our Restated Consolidated
Financial Information included in this Red Herring Prospectus is presented in conformity with Ind AS, restated in
accordance with the requirements of Section 26 of part I of the Companies Act, 2013, the SEBI ICDR Regulations and
the Guidance Note on “Reports in Company Prospectus (Revised 2019)” issued by the ICAI. These include the
financial statements of our Company as at and for the financial year end March 31, 2019, prepared on a proforma basis
in accordance with the SEBI Circular SEBI/HO/CFD/DIL/CIR/P/2016/47 dated March 31, 2016. Our Proforma
Condensed Consolidated Financial Information included in this Red Herring Prospectus is also presented in conformity
with Ind AS.
Ind AS differs from accounting principles with which prospective investors may be familiar, such as IFRS and U.S.
GAAP. We have not attempted to quantify the impact of U.S. GAAP or IFRS on the financial data included in this
Red Herring Prospectus, nor do we provide a reconciliation of our financial statements to those of U.S. GAAP or
IFRS. U.S. GAAP and IFRS differ in significant respects from Ind AS. Accordingly, the degree to which the Ind AS
financial statements, which are restated as per the SEBI ICDR Regulations included in this Red Herring Prospectus,
will provide meaningful information is entirely dependent on the reader’s level of familiarity with Indian accounting
practices. Any reliance by persons not familiar with Indian accounting practices on the financial disclosures presented
in this Red Herring Prospectus should be limited accordingly.
57. We may be affected by competition law in India and any adverse application or interpretation of the Competition
Act could adversely affect our business.
The Competition Act, 2002, as amended (the “Competition Act”), regulates practices having an appreciable adverse
effect on competition in the relevant market in India. Under the Competition Act, any formal or informal arrangement,
understanding or action in concert, which causes or is likely to cause an appreciable adverse effect on competition is
considered void and results in the imposition of substantial monetary penalties. Further, any agreement among
competitors which directly or indirectly: (i) involves the determination of purchase or sale prices, limits or controls
production, supply, markets, technical development, investment or provision of services; (ii) shares the market or
source of production or provision of services by way of allocation of geographical area, type of goods or services or
number of customers in the relevant market; or (iii) results in bid-rigging or collusive bidding is presumed to have an
appreciable adverse effect on competition. The Competition Act also prohibits abuse of a dominant position by any
enterprise. The combination regulation (merger control) provisions under the Competition Act require acquisitions of
shares, voting rights, assets or control or mergers or amalgamations that cross the prescribed asset and turnover based
thresholds to be mandatorily notified to, and pre-approved by, the CCI. Additionally, the Competition Commission of
India (Procedure in regard to the Transaction of Business Relating to Combinations) Regulations, 2011, as amended,
set out the mechanism for implementation of the merger control regime in India. The CCI has extra-territorial powers
and can investigate any agreements, abusive conduct or combination occurring outside India if such agreement,
conduct or combination has an appreciable adverse effect on competition in India. However, we cannot predict the
impact of the provisions of the Competition Act on the agreements entered into by it at this stage.
If we are affected, directly or indirectly, by the application or interpretation of any provision of the Competition Act,
or any award passed by the CCI, or any adverse publicity that may be generated due to scrutiny or prosecution by the
CCI or if any prohibition or substantial penalties are levied under the Competition Act, it would adversely affect our
business, financial condition, cash flows and results of operations.
58. A downgrade in the sovereign credit rating of India may affect the trading price of the Equity Shares.
India’s sovereign rating decreased from Baa2 with a “negative” outlook to Baa3 with a “negative” outlook by Moody’s
and from BBB with a “stable” outlook to BBB with a “negative” outlook (Fitch) in June 2020; and from BBB “stable”
to BBB “negative” by DBRS in May 2020. India’s sovereign ratings from S&P is BBB- with a “stable” outlook in
September 2020. Any further adverse revisions to India’s credit ratings for domestic and international debt by
55
international rating agencies may adversely impact our ability to raise additional financing and the interest rates and
other commercial terms at which such financing is available, including raising any overseas additional financing. A
downgrading of India’s credit ratings may occur, for reasons beyond our control such as, upon a change of government
tax or fiscal policy. This could adversely affect our ability to access to the debt capital markets and to fund our growth
on favourable terms or at all, and consequently adversely affect our business and financial performance and the price
of our Equity Shares.
59. Foreign investors may have difficulty enforcing foreign judgments against us, our management or the Book
Running Lead Managers.
Our Company is incorporated under the laws of India. A majority of our Directors and all the executive officers are
residents of India and a significant portion of our assets are located in India. As a result, it may not be possible for
investors to effect service of process upon us or such persons in jurisdictions outside India, or to enforce against us or
such parties judgments obtained in courts outside India based upon the liability provisions of foreign countries,
including the civil liability provisions of the federal securities laws of the United States. India exercises reciprocal
recognition and enforcement of judgments in civil and commercial matters with a limited number of jurisdictions. In
order to be enforceable, a judgment obtained in a jurisdiction which India recognises as a reciprocating territory must
meet certain requirements of the Civil Procedure Code, 1908 (the “CPC”).
India is not a party to any international treaty in relation to the recognition or enforcement of foreign judgments.
Instead, recognition and enforcement of foreign judgments is provided for under Section 13 and Section 44A of the
CPC. Section 13 of the Civil Procedure Code provides that a foreign judgment shall be conclusive as to any matter
directly adjudicated upon except: (i) where the judgment has not been pronounced by a court of competent jurisdiction;
(ii) where the judgment has not been given on the merits of the case; (iii) where it appears on the face of the proceedings
that the judgment is founded on an incorrect view of international law or a refusal to recognize the law of India in
cases in which such law is applicable; (iv) where the proceedings in which the judgment was obtained were opposed
to natural justice; (v) where the judgment has been obtained by fraud; and (vi) where the judgment sustains a claim
founded on a breach of any law in force in India.
Section 44A of the Civil Procedure Code provides that where a foreign judgment has been rendered by a superior court
in any country or territory outside India which the GoI has by notification declared to be a reciprocating territory, it
may be enforced in India by proceedings in execution as if the judgment had been rendered by the relevant court in
India. However, Section 44A of the Civil Procedure Code is applicable only to monetary decrees not being in the
nature of any amounts payable in respect of taxes or other charges of a like nature or in respect of a fine or other
penalty but does not include an arbitration award, even if such an award is enforceable as a decree or judgment.
The United States and Canada have not been declared by the GoI to be a reciprocating territory for the purpose of
Section 44A of the Civil Procedure Code. However, the United Kingdom, Singapore and Hong Kong, among others,
have been declared by the GoI to be reciprocating territories. A judgment of a court in the United States or another
jurisdiction which is not a reciprocating territory may be enforced only by a fresh suit upon the judgment and not by
proceedings in execution. The suit must be brought in India within three years from the date of the judgment in the
same manner as any other suit filed to enforce a civil liability in India. It is unlikely that a court in India would award
damages on the same basis as a foreign court if an action is brought in India. It is also unlikely that an Indian court
would enforce a foreign judgment if that court were of the view that the amount of damages awarded was excessive
or inconsistent with public policy. A party seeking to enforce a foreign judgment in India is required to obtain approval
from the RBI to execute such a judgment or to repatriate outside India any amount recovered.
60. We are, and after the Offer may remain, a “foreign-owned and controlled” company in accordance with the
Consolidated FDI Policy and FEMA Non-debt Instruments Rules. We are subject to certain foreign investment
restrictions, which could limit our ability to attract foreign investors and our ability to raise foreign capital is subject
to certain conditions prescribed under Indian laws.
In accordance with the provisions of the Consolidated FDI Policy and FEMA Non-debt Instruments Rules, our
Company is a foreign owned and controlled company. As a foreign-owned and controlled company, our Company is
subject to various requirements under the Consolidated FDI Policy and other Indian foreign investment laws. Such
requirements include restrictions on undertaking certain business activities without prior GoI approval or at all, and
pricing guidelines applicable to issue or transfer of our Equity Shares. Further, as long as we are a foreign-owned and
controlled company, we may not be able to undertake certain commercially attractive business activities or investments
without prior approval of the GoI or at all.
Foreign investment in Indian securities is subject to regulation by Indian regulatory authorities. Under the foreign
exchange regulations currently in force in India, transfers of shares between non-residents and residents are freely
permitted (subject to certain exceptions and compliance with sectoral norms and certain other restrictions) if they
comply with the pricing guidelines and reporting requirements specified by the RBI. If the transfer of shares is not in
compliance with such pricing guidelines or reporting requirements or falls under any of the exceptions referred to
56
above, then a prior regulatory approval will be required. Additionally, shareholders who seek to convert the Rupee
proceeds from a sale of shares in India into a foreign currency and repatriate that foreign currency from India will
require a no-objection certificate or a tax clearance certificate from the Indian income tax authorities. Additionally,
the GoI may impose foreign exchange restrictions in certain emergency situations, including situations where there
are sudden fluctuations in interest rates or exchange rates, where the GoI experiences extreme difficulty in stabilizing
the balance of payments, or where there are substantial disturbances in the financial and capital markets in India. We
cannot assure investors that any required approval from the RBI or any other governmental agency can be obtained on
any particular terms or at all. Further, the GoI on April 22, 2020 amended the FEMA Non-debt Instruments Rules
pursuant to which any investment into India by an entity of a country which shares a land border with India, or the
beneficial owner of an investment into India who is situated in or is a citizen of any such country, shall require the
approval of the GoI. For further details, see “Restrictions on Foreign Ownership of Indian Securities” on page 340.
As an Indian company, we are also subject to exchange controls that regulate borrowing in foreign currencies. Such
regulatory restrictions could limit our financing sources and could constrain our ability to obtain financing on
competitive terms and refinance existing indebtedness. In addition, we cannot assure you that any required regulatory
approvals for borrowing in foreign currencies will be granted to us without onerous conditions, or at all. Limitations
on foreign debt may adversely affect our business, financial condition and results of operations.
Risks related to the Offer and the Equity Shares
61. Our Equity Shares have never been publicly traded, and may experience price and volume fluctuations following
the completion of the Offer. Further, our Equity Shares may not result in an active or liquid market and the price
of our Equity Shares may be volatile and you may be unable to resell your Equity Shares at or above the Offer Price
or at all. The Offer Price is also not indicative of the market price of the Equity Shares.
Prior to the Offer, there has been no public market for our Equity Shares, and an active trading market may not develop
or be sustained after the Offer. Listing and quotation does not guarantee that a market for our Equity Shares will
develop or, if developed, does not guarantee the liquidity of such market for the Equity Shares. Investors might not be
able to rapidly sell the Equity Shares at the quoted price if there is no active trading in the Equity Shares. The Offer
Price will be determined by our Company and the Selling Shareholders in consultation with the BRLMs through the
Book Building Process. The Offer Price will be based on numerous factors, including certain qualitative and
quantitative factors, the basic and diluted earnings per share, price earnings ratio in relation to the offer price per equity
share of the face value, comparison with listed industry peers, if any, and return on net worth as described under “Basis
for Offer Price” on page 90 and may not be indicative of the market price for the Equity Shares after the Offer.
The market price of the Equity Shares may fluctuate as a result of, among other things, the following factors, some of
which are beyond our control:
• quarterly variations in our results of operations;
• results of operations that vary from the expectations of securities analysts and investors;
• results of operations that vary from those of our competitors;
• changes in expectations as to our future financial performance, including financial estimates by research analysts
and investors;
• a change in research analysts’ recommendations;
• announcements by us or our competitors of significant acquisitions, strategic alliances, joint operations or capital
commitments;
• announcements by third parties or governmental entities of significant claims or proceedings against us;
• developments relating to our peer companies in our industry;
• new laws and governmental regulations applicable to our industry;
• additions or departures of Key Management Personnel;
• changes in exchange rates;
• speculative trading in the Equity Shares;
• investor perception of us and the aesthetics industry;
• the public’s reaction to our press releases and adverse media reports;
• fluctuations in stock market prices and volume; and
• general economic and stock market conditions.
57
Changes in relation to any of the factors listed above could adversely affect the price of the Equity Shares. The market
price of the Equity Shares may decline below the Offer Price and investors may not be able to re-sell Equity Shares at
or above the Offer Price resulting in a loss of all or part of the investment.
62. Investors may be subject to Indian taxes arising out of capital gains on the sale of the Equity Shares.
Under the current Indian tax laws and unless specifically exempted, capital gains arising from the sale of equity shares
in an Indian company are generally taxable in India. However, any gain realized on the sale of listed equity shares on
or before March 31, 2018 on a stock exchange held for more than 12 months will not be subject to capital gains tax in
India if Securities Transaction tax (“STT”) is paid on the sale transaction and additionally, as stipulated by the Finance
Act, 2017, STT had been paid at the time of acquisition of such equity shares on or after October 1, 2004, except in
the case of such acquisitions of equity shares which are not subject to STT, as notified by the GoI under notification
no. 43/2017/F. No. 370142/09/2017- TPL on June 5, 2017. However, the Finance Act, 2018, has levied taxes on such
long-term capital gains exceeding ₹100,000.00 arising from a sale of equity shares on or after April 1, 2018, while
continuing to exempt the unrealized capital gains earned up to January 31, 2018 on such equity shares subject to
specific conditions. Accordingly, you may be subject to payment of long-term capital gains tax in India, in addition to
payment of STT, on the sale of any equity shares held for more than 12 months. STT will be levied on and collected
by a domestic stock exchange on which the equity shares are sold.
With respect to capital gains arising in an off market sale, long term capital gains are subject to tax at the rate of
10.00% (plus applicable surcharge and cess) without the exemption of ₹100,000. Short-term capital gains, arising from
the sale of such equity shares on a stock exchange would be subject to tax at the rate of 15.00% (plus applicable
surcharge and cess), while short term capital gains arising in an off-market sale would be subject to tax at a higher rate
of 40.00% (plus applicable surcharge and cess) in the case of foreign companies and 30.00% (plus applicable surcharge
and cess) in the case of other non-resident taxpayers.
Further, any gain realized on the sale of listed equity shares held for a period of 12 months or less will be subject to
short-term capital gains tax at in India. Capital gains arising from the sale of equity shares will be exempt from taxation
in India in cases where an exemption is provided under a treaty between India and the country of which the seller is a
resident. Generally, Indian tax treaties do not limit India’s ability to impose tax on capital gains. As a result, residents
of other countries may be liable for tax in India as well as in their own jurisdictions on gains arising from a sale of
equity shares.
The Finance Act, 2019, which amended the Indian Stamp Act, 1899 with effect from July 1, 2020, clarified that, in
the absence of a specific provision under an agreement, the liability to pay stamp duty in case of sale of securities
through stock exchanges will be of the buyer, while in other cases of transfer for consideration through a depository,
the onus will be on the transferor. The stamp duty on transfer of securities other than debentures on a delivery basis is
specified at 0.015% and on a non-delivery basis is specified at 0.003% of the consideration amount. As such, the
impact that the Finance Act, 2019 may have on our business and operations is uncertain.
The GoI has announced the union budget for Fiscal 2022 and the Finance Act, 2021 has received the President’s assent
on March 28, 2021. There is no certainty on the impact that the Finance Act, 2021 may have on our business and
operations or on the industry in which we operate. We cannot predict whether any amendments made pursuant to the
Finance Act, 2021 would have an adverse effect on our business, financial condition and results of operations.
63. Any future issuance of Equity Shares may dilute your shareholding, and significant sales of Equity Shares by our
promoters, may adversely affect the trading price of the Equity Shares.
Any future issuance of the Equity Shares or securities linked to the Equity Shares by our Company, including issuance
of Equity Shares to employees or former employees upon exercise of vested options held by them under ESOP 2021,
may dilute your shareholding. Any such future issuance of the Equity Shares or future sales of the Equity Shares by
any of our significant shareholders may also adversely affect the trading price of the Equity Shares and impact our
ability to raise funds through an offering of our securities. Any perception by investors that such issuances or sales
might occur could also affect the trading price of the Equity Shares. Additionally, the disposal, pledge or encumbrance
of the Equity Shares by any of our significant shareholders, or the perception that such transactions may occur, may
affect the trading price of the Equity Shares.
There can be no assurance that we will not issue further Equity Shares or that our existing Shareholders including our
Promoters will not dispose of further Equity Shares after the completion of the Offer (subject to compliance with the
lock-in provisions under the SEBI ICDR Regulations) or pledge or encumber their Equity Shares. Any future issuances
could also dilute the value of shareholder’s investment in the Equity Shares and adversely affect the trading price of
our Equity Shares. Such securities may also be issued at prices below the Offer Price. We may also issue convertible
debt securities to finance our future growth or fund our business activities. In addition, any perception by investors
that such issuances or sales might occur may also affect the market price of our Equity Shares.
58
64. Holders of Equity Shares may be restricted in their ability to exercise pre-emptive rights under Indian law and
thereby may suffer future dilution of their ownership position.
Under the Companies Act, a public company having share capital and incorporated in India must offer its holders of
equity shares pre-emptive rights to subscribe and pay for a proportionate number of equity shares to maintain their
existing ownership percentages before the issuance of any new equity shares, unless the pre-emptive rights have been
waived by adoption of a special resolution. However, if the laws of the jurisdiction the investors are located in do not
permit them to exercise their pre-emptive rights without our filing an offering document or registration statement with
the applicable authority in such jurisdiction, the investors will be unable to exercise their pre-emptive rights unless we
make such a filing. If we elect not to file a registration statement, the new securities may be issued to a custodian, who
may sell the securities for the investor's benefit. The value the custodian receives on the sale of such securities and the
related transaction costs cannot be predicted. In addition, to the extent that the investors are unable to exercise pre-
emption rights granted in respect of the Equity Shares held by them, their proportional interest in our Company would
be reduced.
65. Rights of shareholders of companies under Indian law may be different from laws of other jurisdictions.
Our Articles of Association, composition of our Board, Indian laws governing our corporate affairs, the validity of
corporate procedures, directors’ fiduciary duties, responsibilities and liabilities, and shareholders’ rights may differ
from those that would apply to a company in another jurisdiction. Shareholders’ rights under Indian law may be
different from shareholders’ rights under the laws of other countries or jurisdictions. Investors may face challenges in
asserting their rights as shareholder in an Indian company than as a shareholder of an entity in another jurisdiction.
66. QIBs and Non-Institutional Investors are not permitted to withdraw or lower their Bids (in terms of quantity of
Equity Shares or the Bid Amount) at any stage after submitting a Bid, and Retail Individual Investors are not
permitted to withdraw their Bids after Bid/Offer Closing Date.
Pursuant to the SEBI ICDR Regulations, QIBs and Non-Institutional Investors are not permitted to withdraw or lower
their Bids (in terms of quantity of Equity Shares or the Bid Amount) at any stage after submitting a Bid. Retail
Individual Investors can revise their Bids during the Bid/Offer Period and withdraw their Bids until Bid/Offer Closing
Date. While our Company is required to complete Allotment pursuant to the Offer within six Working Days from the
Bid/Offer Closing Date, or such other timeline as may be prescribed under applicable law, events affecting the Bidders’
decision to invest in the Equity Shares, including material adverse changes in international or national monetary policy,
financial, political or economic conditions, our business, results of operation or financial condition may arise between
the date of submission of the Bid and Allotment. Our Company may complete the Allotment of the Equity Shares even
if such events occur, and such events limit the Bidders’ ability to sell the Equity Shares Allotted pursuant to the Offer
or cause the trading price of the Equity Shares to decline on listing.

59
SECTION III: INTRODUCTION
THE OFFER
The following table summarizes the Offer details:
The Offer consists of
Offer of Equity Shares by way of Offer for Sale by the Selling
Shareholders (1)(2)
Up to [●] Equity Shares aggregating up to ₹8,000.00 million
Of which
A) QIB Portion(3) Not more than [●] Equity Shares
of which
Anchor Investor Portion(4) Up to [●] Equity Shares
Net QIB Portion (assuming Anchor Investor Portion is
fully subscribed)
[●] Equity Shares
of which:
Mutual Fund Portion [●] Equity Shares
Balance for all QIBs including Mutual Funds [●] Equity Shares
B) Non-Institutional Portion Not less than [●] Equity Shares
C) Retail Portion Not less than [●] Equity Shares
Pre-Offer and post-Offer Equity Shares
Equity Shares outstanding prior to the Offer 30,437,904 Equity Shares
Equity Shares outstanding after the Offer 30,437,904 Equity Shares
Utilisation of Net Proceeds Our Company will not receive any proceeds from the Offer for Sale.
For further details, please see “Objects of the Offer” on page 88. (1) The Offer has been authorized by a resolution of our Board of Directors at their meeting held on June 30, 2021. Further, our Board has taken on record
the approval for the Offer for Sale by the Selling Shareholders pursuant to its resolution dated July 12, 2021 and October 11, 2021. The Draft Red
Herring Prospectus was approved by our Board pursuant to a resolution passed on July 27, 2021. This Red Herring Prospectus has been approved by
our Board pursuant to a resolution dated October 22, 2021.
(2) Each of the Selling Shareholders, severally and not jointly, confirm that the Equity Shares being offered by such Selling Shareholder have been held for a period of at least one year immediately preceding the date of filing the Draft Red Herring Prospectus with the SEBI, and are otherwise eligible for
being offered for sale pursuant to the Offer in terms of the SEBI ICDR Regulations. Each Selling Shareholder, severally and not jointly, confirm that they
have authorised and consented to participate in the Offer for Sale, in the following manner:
Sr.
No
Name of the Selling
Shareholder
Number of Offered Shares Aggregate proceeds from
the sale of Offered Shares
Date of consent
letter
Date of resolution of
board of directors
1. Evergraph Up to [●] Equity Shares Up to ₹7,100.00 million October 11, 2021* July 2, 2021 and
October 11, 2021
2. K.A. Joseph Up to [●] Equity Shares Up to ₹900.00 million October 11, 2021 -
Total Up to [●] Equity Shares Up to ₹8,000.00 million - * Pursuant to the board resolution dated October 11, 2021
(3) Subject to valid bids being received at or above the Offer Price, undersubscription, if any, in any category, except in the QIB Portion, would be allowed
to be met with spill-over from any other category or combination of categories of Bidders at the discretion of our Company and the Selling Shareholders
in consultation with the Book Running Lead Managers, and the Designated Stock Exchange, subject to applicable laws. For further details, see “Offer
Procedure” on page 326.
(4) Our Company and the Selling Shareholders may, in consultation with the Book Running Lead Managers, allocate up to 60% of the QIB Portion to Anchor
Investors on a discretionary basis in accordance with the SEBI ICDR Regulations. One-third of the Anchor Investor Portion shall be reserved for domestic
Mutual Funds only, subject to valid Bids being received from domestic Mutual Funds at or above the Anchor Investor Allocation Price. In the event of under-subscription in the Anchor Investor Portion, the remaining Equity Shares shall be added to the Net QIB Portion. Further, 5% of the Net QIB
Portion shall be available for allocation on a proportionate basis to Mutual Funds only, and the remainder of the QIB Portion shall be available for
allocation on a proportionate basis to all QIB Bidders (other than Anchor Investors), including Mutual Funds, subject to valid Bids being received at or above the Offer Price. However, if the aggregate demand from Mutual Funds is less than 5% of the Net QIB Portion, the balance Equity Shares available
for allotment in the Mutual Fund Portion will be added to the Net QIB Portion and allocated proportionately to the QIB Bidders (other than Anchor
Investors) in proportion to their Bids. For further details, see “Offer Procedure” on page 3261.
Allocation to Bidders in all categories except the Anchor Investor Portion and the Retail Portion, shall be made on a
proportionate basis subject to valid Bids received at or above the Offer Price. The allocation to each RIB shall not be less than
the minimum Bid Lot, subject to availability of Equity Shares in the Retail Portion, and the remaining available Equity Shares,
if any, shall be allocated on a proportional basis. For further details, see “Offer Procedure” on page 326.
For details of the terms of the Offer, see “Terms of the Offer” on page 319.

60
SUMMARY OF THE RESTATED CONSOLIDATED FINANCIAL INFORMATION
The summary financial information (excluding the notes) presented below has been derived from the Restated Consolidated
Financial Information and should be read in conjunction with information in “Financial Information” and “Management’s
Discussion and Analysis of Financial Condition and Results of Operations” on pages 183 and 255, respectively.
(The remainder of this page is intentionally left blank)
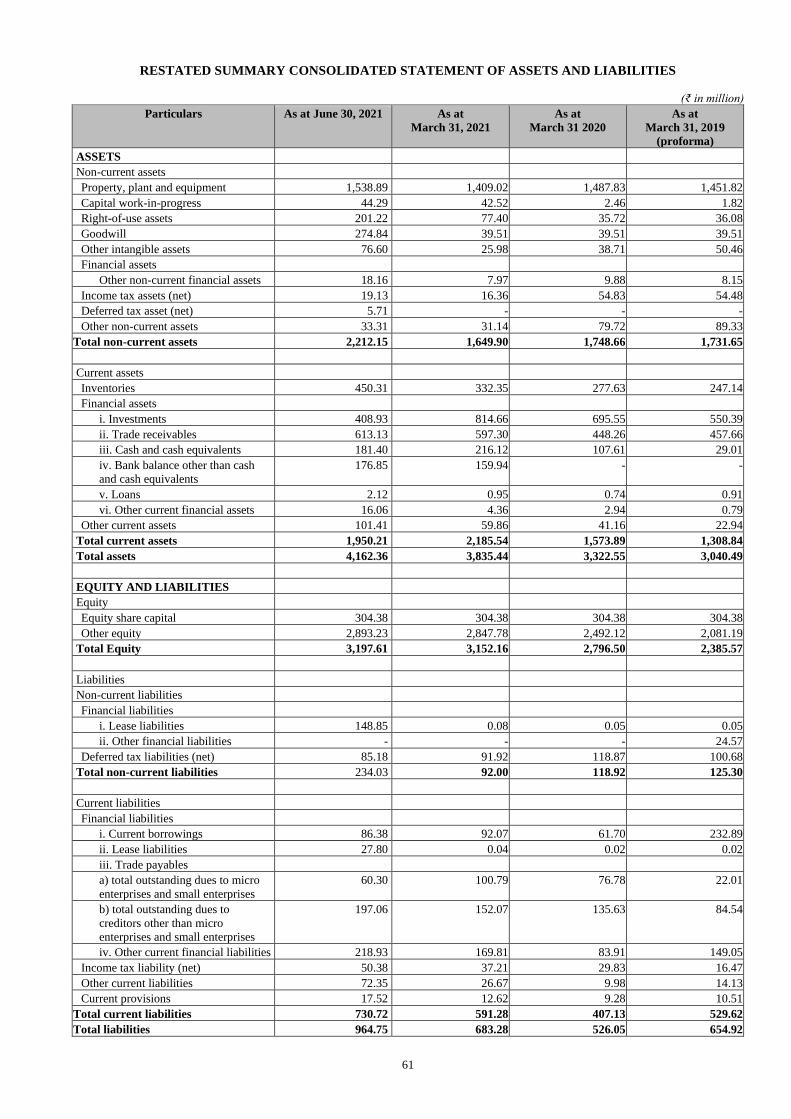
61
RESTATED SUMMARY CONSOLIDATED STATEMENT OF ASSETS AND LIABILITIES
(₹ in million)
Particulars As at June 30, 2021 As at
March 31, 2021
As at
March 31 2020
As at
March 31, 2019
(proforma)
ASSETS
Non-current assets
Property, plant and equipment 1,538.89 1,409.02 1,487.83 1,451.82
Capital work-in-progress 44.29 42.52 2.46 1.82
Right-of-use assets 201.22 77.40 35.72 36.08
Goodwill 274.84 39.51 39.51 39.51
Other intangible assets 76.60 25.98 38.71 50.46
Financial assets
Other non-current financial assets 18.16 7.97 9.88 8.15
Income tax assets (net) 19.13 16.36 54.83 54.48
Deferred tax asset (net) 5.71 - - -
Other non-current assets 33.31 31.14 79.72 89.33
Total non-current assets 2,212.15 1,649.90 1,748.66 1,731.65
Current assets
Inventories 450.31 332.35 277.63 247.14
Financial assets
i. Investments 408.93 814.66 695.55 550.39
ii. Trade receivables 613.13 597.30 448.26 457.66
iii. Cash and cash equivalents 181.40 216.12 107.61 29.01
iv. Bank balance other than cash
and cash equivalents
176.85 159.94 - -
v. Loans 2.12 0.95 0.74 0.91
vi. Other current financial assets 16.06 4.36 2.94 0.79
Other current assets 101.41 59.86 41.16 22.94
Total current assets 1,950.21 2,185.54 1,573.89 1,308.84
Total assets 4,162.36 3,835.44 3,322.55 3,040.49
EQUITY AND LIABILITIES
Equity
Equity share capital 304.38 304.38 304.38 304.38
Other equity 2,893.23 2,847.78 2,492.12 2,081.19
Total Equity 3,197.61 3,152.16 2,796.50 2,385.57
Liabilities
Non-current liabilities
Financial liabilities
i. Lease liabilities 148.85 0.08 0.05 0.05
ii. Other financial liabilities - - - 24.57
Deferred tax liabilities (net) 85.18 91.92 118.87 100.68
Total non-current liabilities 234.03 92.00 118.92 125.30
Current liabilities
Financial liabilities
i. Current borrowings 86.38 92.07 61.70 232.89
ii. Lease liabilities 27.80 0.04 0.02 0.02
iii. Trade payables
a) total outstanding dues to micro
enterprises and small enterprises
60.30 100.79 76.78 22.01
b) total outstanding dues to
creditors other than micro
enterprises and small enterprises
197.06 152.07 135.63 84.54
iv. Other current financial liabilities 218.93 169.81 83.91 149.05
Income tax liability (net) 50.38 37.21 29.83 16.47
Other current liabilities 72.35 26.67 9.98 14.13
Current provisions 17.52 12.62 9.28 10.51
Total current liabilities 730.72 591.28 407.13 529.62
Total liabilities 964.75 683.28 526.05 654.92

62
Particulars As at June 30, 2021 As at
March 31, 2021
As at
March 31 2020
As at
March 31, 2019
(proforma)
Total equity and liabilities 4,162.36 3,835.44 3,322.55 3,040.49
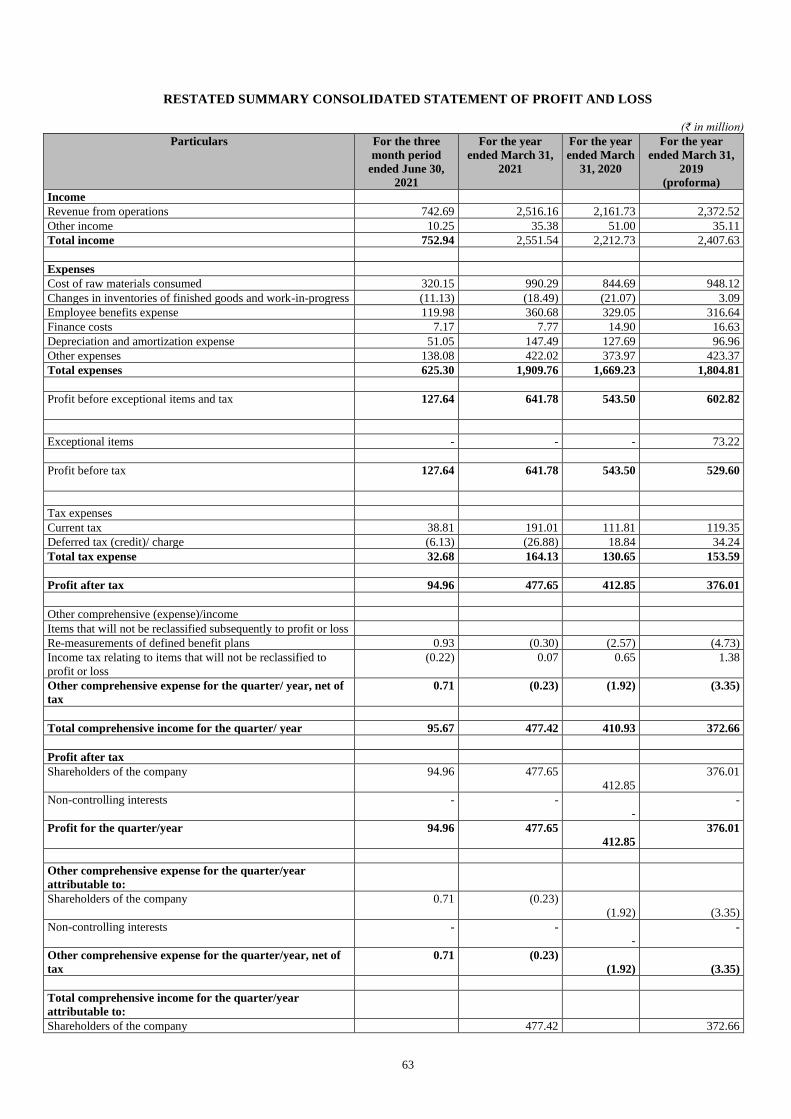
63
RESTATED SUMMARY CONSOLIDATED STATEMENT OF PROFIT AND LOSS
(₹ in million)
Particulars For the three
month period
ended June 30,
2021
For the year
ended March 31,
2021
For the year
ended March
31, 2020
For the year
ended March 31,
2019
(proforma)
Income
Revenue from operations 742.69 2,516.16 2,161.73 2,372.52
Other income 10.25 35.38 51.00 35.11
Total income 752.94 2,551.54 2,212.73 2,407.63
Expenses
Cost of raw materials consumed 320.15 990.29 844.69 948.12
Changes in inventories of finished goods and work-in-progress (11.13) (18.49) (21.07) 3.09
Employee benefits expense 119.98 360.68 329.05 316.64
Finance costs 7.17 7.77 14.90 16.63
Depreciation and amortization expense 51.05 147.49 127.69 96.96
Other expenses 138.08 422.02 373.97 423.37
Total expenses 625.30 1,909.76 1,669.23 1,804.81
Profit before exceptional items and tax 127.64
641.78 543.50 602.82
Exceptional items - - - 73.22
Profit before tax 127.64
641.78 543.50 529.60
Tax expenses
Current tax 38.81 191.01 111.81 119.35
Deferred tax (credit)/ charge (6.13) (26.88) 18.84 34.24
Total tax expense 32.68 164.13 130.65 153.59
Profit after tax 94.96 477.65 412.85 376.01
Other comprehensive (expense)/income
Items that will not be reclassified subsequently to profit or loss
Re-measurements of defined benefit plans 0.93 (0.30) (2.57) (4.73)
Income tax relating to items that will not be reclassified to
profit or loss
(0.22) 0.07 0.65 1.38
Other comprehensive expense for the quarter/ year, net of
tax
0.71 (0.23) (1.92) (3.35)
Total comprehensive income for the quarter/ year 95.67 477.42 410.93 372.66
Profit after tax
Shareholders of the company 94.96 477.65
412.85
376.01
Non-controlling interests - -
-
-
Profit for the quarter/year 94.96 477.65
412.85
376.01
Other comprehensive expense for the quarter/year
attributable to:
Shareholders of the company 0.71 (0.23)
(1.92)
(3.35)
Non-controlling interests - -
-
-
Other comprehensive expense for the quarter/year, net of
tax
0.71 (0.23)
(1.92)
(3.35)
Total comprehensive income for the quarter/year
attributable to:
Shareholders of the company 477.42 372.66
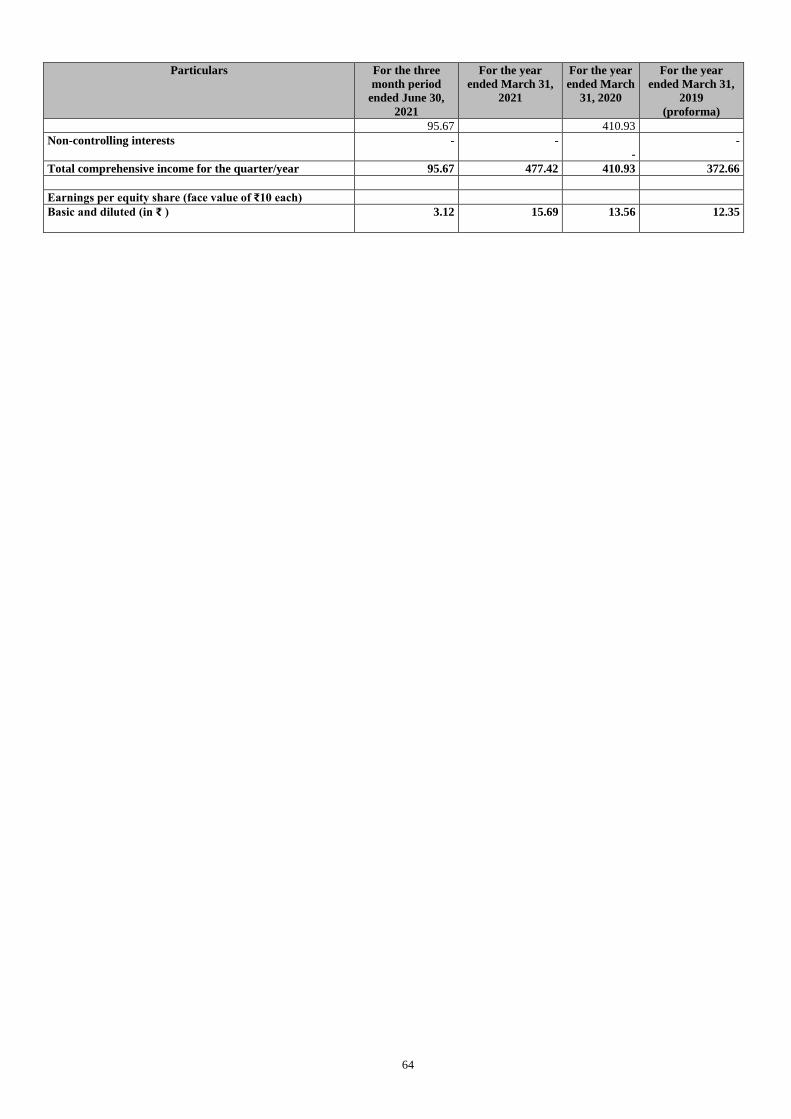
64
Particulars For the three
month period
ended June 30,
2021
For the year
ended March 31,
2021
For the year
ended March
31, 2020
For the year
ended March 31,
2019
(proforma)
95.67 410.93
Non-controlling interests - -
-
-
Total comprehensive income for the quarter/year 95.67 477.42 410.93 372.66
Earnings per equity share (face value of ₹10 each)
Basic and diluted (in ₹ ) 3.12
15.69 13.56 12.35
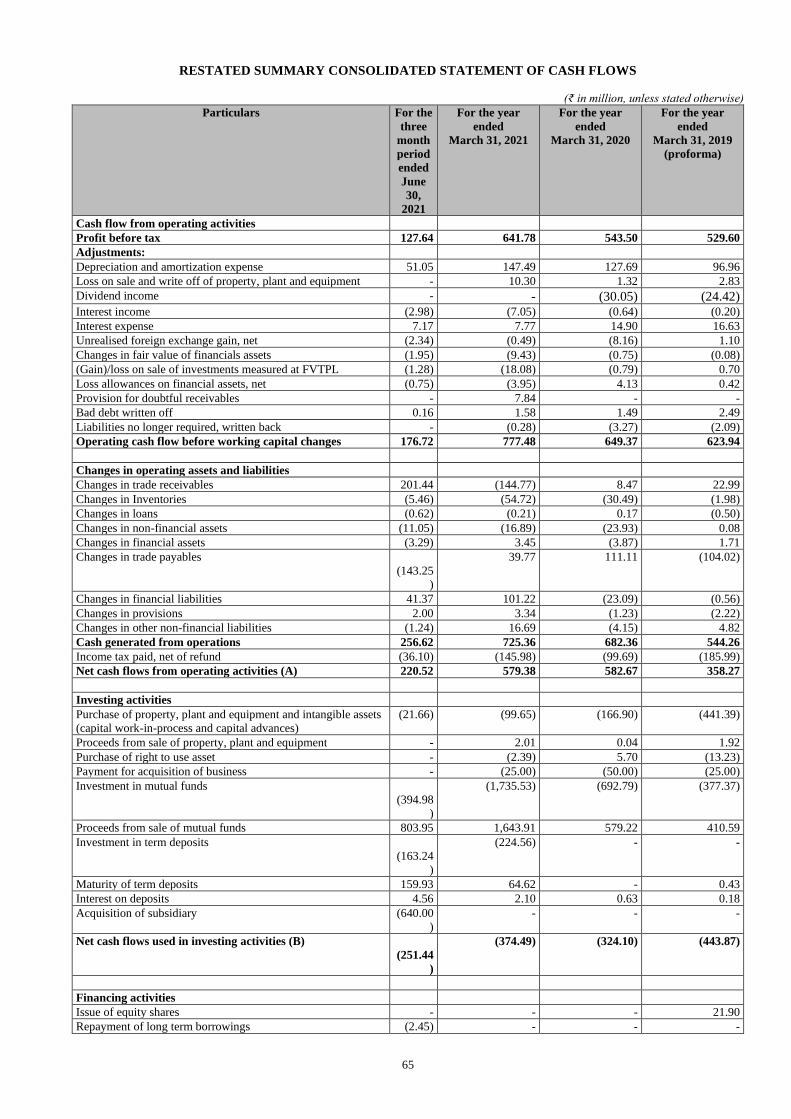
65
RESTATED SUMMARY CONSOLIDATED STATEMENT OF CASH FLOWS
(₹ in million, unless stated otherwise)
Particulars For the
three
month
period
ended
June
30,
2021
For the year
ended
March 31, 2021
For the year
ended
March 31, 2020
For the year
ended
March 31, 2019
(proforma)
Cash flow from operating activities
Profit before tax 127.64 641.78 543.50 529.60
Adjustments:
Depreciation and amortization expense 51.05 147.49 127.69 96.96
Loss on sale and write off of property, plant and equipment - 10.30 1.32 2.83
Dividend income - - (30.05) (24.42) Interest income (2.98) (7.05) (0.64) (0.20)
Interest expense 7.17 7.77 14.90 16.63
Unrealised foreign exchange gain, net (2.34) (0.49) (8.16) 1.10
Changes in fair value of financials assets (1.95) (9.43) (0.75) (0.08)
(Gain)/loss on sale of investments measured at FVTPL (1.28) (18.08) (0.79) 0.70
Loss allowances on financial assets, net (0.75) (3.95) 4.13 0.42
Provision for doubtful receivables - 7.84 - -
Bad debt written off 0.16 1.58 1.49 2.49
Liabilities no longer required, written back - (0.28) (3.27) (2.09)
Operating cash flow before working capital changes 176.72 777.48 649.37 623.94
Changes in operating assets and liabilities
Changes in trade receivables 201.44 (144.77) 8.47 22.99
Changes in Inventories (5.46) (54.72) (30.49) (1.98)
Changes in loans (0.62) (0.21) 0.17 (0.50)
Changes in non-financial assets (11.05) (16.89) (23.93) 0.08
Changes in financial assets (3.29) 3.45 (3.87) 1.71
Changes in trade payables
(143.25
)
39.77 111.11 (104.02)
Changes in financial liabilities 41.37 101.22 (23.09) (0.56)
Changes in provisions 2.00 3.34 (1.23) (2.22)
Changes in other non-financial liabilities (1.24) 16.69 (4.15) 4.82
Cash generated from operations 256.62 725.36 682.36 544.26
Income tax paid, net of refund (36.10) (145.98) (99.69) (185.99)
Net cash flows from operating activities (A) 220.52 579.38 582.67 358.27
Investing activities
Purchase of property, plant and equipment and intangible assets
(capital work-in-process and capital advances)
(21.66) (99.65) (166.90) (441.39)
Proceeds from sale of property, plant and equipment - 2.01 0.04 1.92
Purchase of right to use asset - (2.39) 5.70 (13.23)
Payment for acquisition of business - (25.00) (50.00) (25.00)
Investment in mutual funds
(394.98
)
(1,735.53) (692.79) (377.37)
Proceeds from sale of mutual funds 803.95 1,643.91 579.22 410.59
Investment in term deposits
(163.24
)
(224.56) - -
Maturity of term deposits 159.93 64.62 - 0.43
Interest on deposits 4.56 2.10 0.63 0.18
Acquisition of subsidiary (640.00
)
- - -
Net cash flows used in investing activities (B)
(251.44
)
(374.49) (324.10) (443.87)
Financing activities
Issue of equity shares - - - 21.90
Repayment of long term borrowings (2.45) - - -

66
Particulars For the
three
month
period
ended
June
30,
2021
For the year
ended
March 31, 2021
For the year
ended
March 31, 2020
For the year
ended
March 31, 2019
(proforma)
Proceeds/(repayment) of short-term borrowings, net (52.62) 30.37 (171.19) 77.19
Payment of principal and interest portions of lease liabilities (6.95) - - -
Dividend paid (50.22) (121.76) - -
Interest paid (2.82) (4.54) (10.27) (10.05)
Net cash flows used in financing activities (C)
(115.06
)
(95.93) (181.46) 89.04
Net increase in cash and cash equivalents (A+ B+ C)
(145.98
)
108.96 77.11 3.44
Effects of exchange gain on cash and cash equivalents 0.03 (0.45) 1.49 -
Cash and cash equivalents at the beginning of the year 216.12 107.61 29.01 25.57
Cash Acquired as part of business combination 111.23 - - -
Cash and cash equivalents at the end of the quarter/
year
181.40 216.12 107.61 29.01
Components of cash and cash equivalents
Cash on hand 0.26 0.22 0.26 0.19
Balance with banks
- on current account 66.33 196.13 72.09 19.35
- in Exchange earner's foreign currency accounts 31.05 16.37 31.86 6.07
- Deposits with original maturity of less than 3 months 83.76 3.40 3.40 3.40
Cash and cash equivalents in statement of assets and
liabilities
year
181.40 216.12 107.61 29.01
Reconciliation between opening and closing balance sheet for liabilities arising from financing activities: (₹ in million)
Particulars Opening balance
April 1, 2021
Additions due to
acquisition
Cash flows Non-cash
movement
Closing balance
June 30, 2021
Long-term borrowings - 13.61 (2.45) -11.16 -
Leases 0.12 179.08 (6.95) 4.40 176.65
Short-term borrowings 92.07 35.77 (52.62) 11.16 86.38
Interest accrued but not due - 0.05 (2.82) 2.77 -
Total liabilities from financing
activities
92.19 228.51 (64.84)
7.17
263.03
Reconciliation between opening and closing balance sheet for liabilities arising from financing activities:
(₹ in million)
Particulars Opening balance
April 1, 2020
Cash flows Non-cash movement Closing balance
March 31, 2021
Short-term borrowings 61.70 30.37 - 92.07
Interest accrued but not due 0.01 (4.54) 4.53 -
Total liabilities from financing activities 61.71 25.83 4.53 92.07
Reconciliation between opening and closing balance sheet for liabilities arising from financing activities:
(₹ in million)
Particulars Opening balance
April 1,
2019(Proforma)
Cash flows Non-cash movement Closing balance
March 31, 2020
(Proforma)
Short-term borrowings 232.89 (171.19) - 61.70
Interest accrued but not due 0.10 (10.27) 10.18 0.01
Total liabilities from financing activities 232.99 (181.46) 10.18 61.71
Reconciliation between opening and closing balance sheet for liabilities arising from financing activities:
(₹ in million)

67
Particulars Opening balance
April 1, 2018
(Proforma)
Cash flows Non-cash movement Closing balance
March 31, 2019
(Proforma)
Short-term borrowings 155.70 77.19 - 232.89
Interest accrued but not due - (10.05) 10.15 0.10
Total liabilities from financing activities 155.70 67.14 10.15 232.99

68
SUMMARY OF PROFORMA CONDENSED CONSOLIDATED FINANCIAL INFORMATION
The following tables provide the summary of the Proforma Condensed Consolidated Financial Information (excluding the
notes) (to be read in conjunction with the “Management’s Discussion and Analysis of Financial Conditional and Results of
Operations – Exotech Acquisition and Basis of Preparation of the Proforma Condensed Consolidated Financial Information”
on page 255) as at and for the year ended March 31, 2021, to illustrate the impact of the acquisition of Exotech as a subsidiary
of our Company as if the acquisition had taken place at an earlier date selected in accordance with the SEBI ICDR Regulations.
For further details, see “Proforma Financial Information” on page 291; “History and Certain Corporate Matters – Material
acquisitions or divestments of business or undertakings, mergers, amalgamations or revaluation of assets in the last 10 years”
on page 154; and “Risk Factors — 37. The Proforma Condensed Consolidated Financial Information included in this RHP to
reflect the impact of the Exotech Acquisition is not indicative of our future financial condition or financial performance” on
page 25.
(The remainder of this page is intentionally left blank)
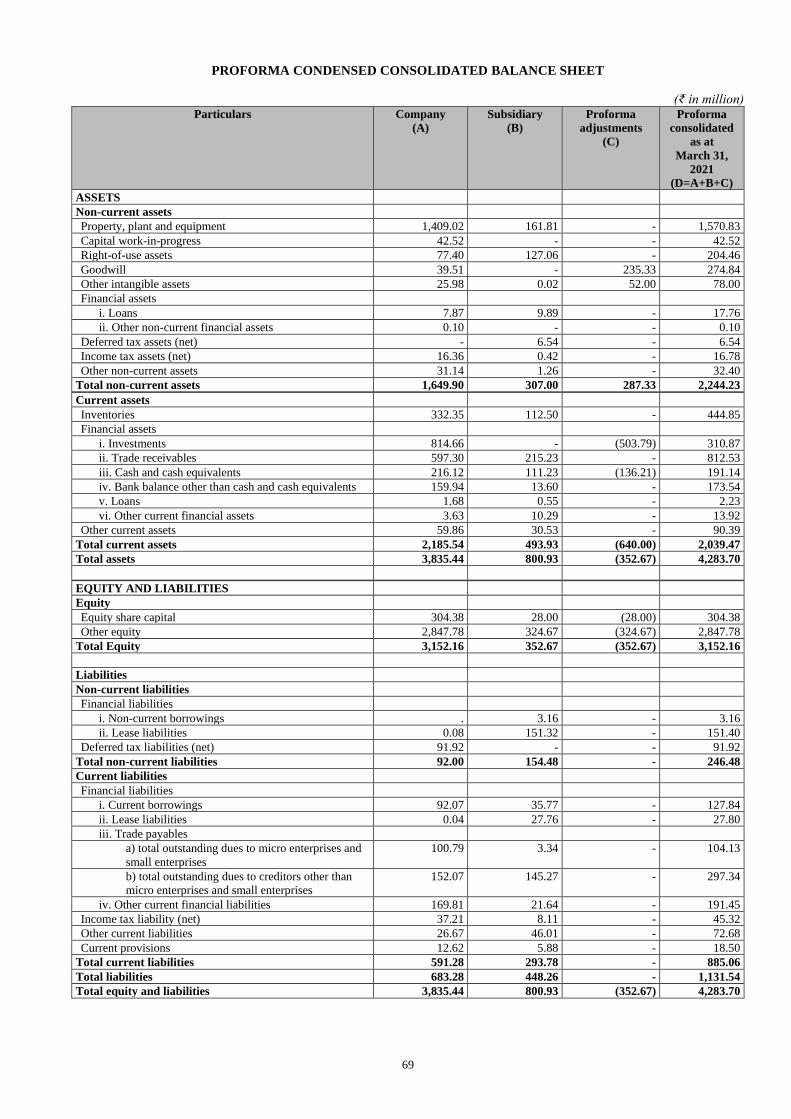
69
PROFORMA CONDENSED CONSOLIDATED BALANCE SHEET
(₹ in million) Particulars Company
(A)
Subsidiary
(B)
Proforma
adjustments
(C)
Proforma
consolidated
as at
March 31,
2021
(D=A+B+C)
ASSETS
Non-current assets
Property, plant and equipment 1,409.02 161.81 - 1,570.83
Capital work-in-progress 42.52 - - 42.52
Right-of-use assets 77.40 127.06 - 204.46
Goodwill 39.51 - 235.33 274.84
Other intangible assets 25.98 0.02 52.00 78.00
Financial assets
i. Loans 7.87 9.89 - 17.76
ii. Other non-current financial assets 0.10 - - 0.10
Deferred tax assets (net) - 6.54 - 6.54
Income tax assets (net) 16.36 0.42 - 16.78
Other non-current assets 31.14 1.26 - 32.40
Total non-current assets 1,649.90 307.00 287.33 2,244.23
Current assets
Inventories 332.35 112.50 - 444.85
Financial assets
i. Investments 814.66 - (503.79) 310.87
ii. Trade receivables 597.30 215.23 - 812.53
iii. Cash and cash equivalents 216.12 111.23 (136.21) 191.14
iv. Bank balance other than cash and cash equivalents 159.94 13.60 - 173.54
v. Loans 1.68 0.55 - 2.23
vi. Other current financial assets 3.63 10.29 - 13.92
Other current assets 59.86 30.53 - 90.39
Total current assets 2,185.54 493.93 (640.00) 2,039.47
Total assets 3,835.44 800.93 (352.67) 4,283.70
EQUITY AND LIABILITIES
Equity
Equity share capital 304.38 28.00 (28.00) 304.38
Other equity 2,847.78 324.67 (324.67) 2,847.78
Total Equity 3,152.16 352.67 (352.67) 3,152.16
Liabilities
Non-current liabilities
Financial liabilities
i. Non-current borrowings . 3.16 - 3.16
ii. Lease liabilities 0.08 151.32 - 151.40
Deferred tax liabilities (net) 91.92 - - 91.92
Total non-current liabilities 92.00 154.48 - 246.48
Current liabilities
Financial liabilities
i. Current borrowings 92.07 35.77 - 127.84
ii. Lease liabilities 0.04 27.76 - 27.80
iii. Trade payables
a) total outstanding dues to micro enterprises and
small enterprises
100.79 3.34 - 104.13
b) total outstanding dues to creditors other than
micro enterprises and small enterprises
152.07 145.27 - 297.34
iv. Other current financial liabilities 169.81 21.64 - 191.45
Income tax liability (net) 37.21 8.11 - 45.32
Other current liabilities 26.67 46.01 - 72.68
Current provisions 12.62 5.88 - 18.50
Total current liabilities 591.28 293.78 - 885.06
Total liabilities 683.28 448.26 - 1,131.54
Total equity and liabilities 3,835.44 800.93 (352.67) 4,283.70

70
PROFORMA CONDENSED CONSOLIDATED STATEMENT OF PROFIT AND LOSS
(₹ in million) Particulars Company
(A)
Subsidiary
(B)
Proforma
adjustments
(C)
Proforma
consolidated
for the year
ended
March 31,
2021
(D=A+B+C)
Income
Revenue from operations 2,516.16 685.26 - 3,201.42
Other income 35.38 64.15 - 99.53
Total income 2,551.54 749.41 - 3,300.95
Expenses
Cost of raw materials consumed 990.29 383.26 - 1,373.55
Changes in inventories of finished goods and work-in-
progress
(18.49) (9.35) - (27.84)
Employee benefits expense 360.68 82.21 - 442.89
Finance costs 7.77 23.94 - 31.71
Depreciation and amortization expense 147.49 48.33 9.90 205.72
Other expenses 422.02 154.94 - 576.96
Total expenses 1,909.76 683.33 9.90 2,602.99
Profit before tax 641.78 66.08 (9.90) 697.96
Tax expenses
Current tax 191.01 13.81 - 204.82
Deferred tax (credit)/charge (26.88) 0.21 - (26.67)
Total tax expense 164.13 14.02 - 178.15
Profit for the year 477.65 52.06 (9.90) 519.81
Other comprehensive (expense)/income
Items that will not be reclassified subsequently to profit or loss
Re-measurements of defined benefit plans (0.30) (0.12) - (0.42)
Income tax effect 0.07 0.04 - 0.11
Other comprehensive expense for the year, net of tax (0.23) (0.08) - (0.31)
Total comprehensive income for the year 477.42 51.98 (9.90) 519.50
Profit for the year attributable to:
Shareholders of the company 477.65 52.06 (9.90) 519.81
Non-controlling interests - - - -
Profit for the year 477.65 52.06 (9.90) 519.81
Other comprehensive expense for the year attributable to:
Shareholders of the company (0.23) (0.08) - (0.31)
Non-controlling interests - - - -
Other comprehensive expense for the year, net of tax (0.23) (0.08) - (0.31)
Total comprehensive income for the year attributable to:
Shareholders of the company 477.42 51.98 (9.90) 519.50
Non-controlling interests - - - -
Total comprehensive income for the year 477.42 51.98 (9.90) 519.50
Earnings per equity share (face value of ₹10 each)
Weighted average number of equity shares
30,437,904
Proforma basic and diluted earning per share (EPS) (in ₹)
17.08

71
GENERAL INFORMATION
Registered and Corporate Office
S.J.S. Enterprises Limited
Sy. No. 28/P16 of Agra Village and
Sy. No. 85/P6 of B.M. Kaval Village
Kengeri Hobli
Bangalore 560 082
Karnataka, India
CIN: U51909KA2005PLC036601
Address of the RoC
Our Company is registered with the RoC situated at the following address:
Registrar of Companies, Karnataka at Bangalore
‘E’ Wing, 2nd Floor, Kendriya Sadana
Kormangala, Bangalore 560 034
Karnataka, India
Board of Directors
As on the date of this Red Herring Prospectus, our Board comprises the following:
Name Designation DIN Address
Ramesh Chandra
Jain
Chairman and Independent
Director
00038529 No. 5305, DLF City, DLF Phase – 4, Galleria DLF – IV,
Farrukhnagar, Gurgaon 122 009, Haryana, India
K.A. Joseph Managing Director 00784084 No. 514, 1st Cross, 12th Main, 4th Block, Koramangala,
Bangalore 560 034, Karnataka, India
Sanjay Thapar Executive Director and
Chief Executive Officer
01029851 A16, Padma Vilas Enclave, 18 Prince of Wales Drive,
Wanwadi, Pune 411 040, Maharashtra, India
Kevin K. Joseph Executive Director 09206689 No. 514, 1st Cross, 12th Main, 4th Block, Koramangala,
Bangalore 560 034, Karnataka, India
Kazi Arif Uz Zaman Nominee Director* 00237331 No. 34/4, 1st Main 5th Cross, Near Kothanur Bus stop,
Anjanappa Layout, North Dr. Shivarama Karanth Nagar,
Bangalore 560 077, Karnataka, India
Vishal Sharma Nominee Director* 01599024 A-148, Ground Floor, M2K Aura, Near Mayfield Gardens,
Sector 47, Gurgaon 122 018, Haryana, India
Veni Thapar Non-Executive Independent
Director
01811724 C-2/37, Safdurjung Development Area, Delhi 110 016, India
Matthias Frenzel Non-Executive Independent
Director
09168925 Lahalla 630 Kode 44298 Sweden
* Kazi Arif Uz Zaman and Vishal Sharma are nominee directors appointed on behalf of Evergraph on our Board
For further details of our Directors, see “Our Management” on page 160.
Company Secretary and Compliance Officer
Thabraz Hushain W.
Sy. No. 28/P16 of Agra Village
and Sy. No. 85/P6 of B.M. Kaval Village
Kengeri Hobli
Bangalore 560 082
Karnataka, India
Tel: +91 80 6194 0777
E-mail: [email protected]
Book Running Lead Managers
Axis Capital Limited
8th Floor, Axis House
C 2 Wadia International Centre
P. B. Marg, Worli
Mumbai 400 025
Maharashtra, India
Tel: +91 22 4325 2183
E-mail: [email protected]
IIFL Securities Limited
10th Floor, IIFL Centre
Kamala City, Senapati Bapat Marg
Lower Parel (West)
Mumbai 400 013
Maharashtra, India
Tel: +91 22 4646 4600
E-mail: [email protected]
72
Investor grievance e-mail: [email protected]
Website: www.axiscapital.co.in
Contact Person: Pratik Pednekar
SEBI Registration No.: INM000012029
Investor grievance e-mail: [email protected]
Website: www.iiflcap.com
Contact Person: Ujjaval Kumar/ Dhruv Bhagwat
SEBI Registration No.: INM000010940
Edelweiss Financial Services Limited
6th Floor, Edelweiss House
Off CST Road, Kalina
Mumbai 400 098
Maharashtra, India
Tel: + 91 22 4009 4400
E-mail: [email protected]
Investor grievance e-mail:
Website: www.edelweissfin.com
Contact Person: Malay Shah
SEBI Registration No.: INM0000010650
Legal Counsel to our Company, K.A. Joseph and Evergraph as to Indian Law
Cyril Amarchand Mangaldas
Prestige Falcon Tower
3rd Floor, Brunton Road
Craig Park Layout, Victoria Road
Bengaluru 560 001
Karnataka, India
Tel: +91 80 6792 2000
Legal Counsel to the BRLMs as to Indian Law
S&R Associates
One World Centre, 1403 Tower 2 B
841 Senapati Bapat Marg, Lower Parel
Mumbai 400 013
Maharashtra, India
Tel: +91 22 4302 8000
Statutory Auditors to our Company
B S R & Co. LLP, Chartered Accountants
Embassy Golf Links Business Park
Pebble Beach, B Block, 3rd Floor
Off Intermediate Ring Road
Bengaluru 560071
Karnataka, India
Tel: +91 80 4682 3000
Email: [email protected]
Firm registration number: 101248W/W-100022
Peer review number: 011748
There has been no change in our auditors in the last three years immediately preceding the date of this Red Herring Prospectus.
Registrar to the Offer
Link Intime India Private Limited
C 101, 247 Park
L.B.S. Marg
Vikhroli (West)
Mumbai 400 083
Maharashtra, India
Tel: +91 22 49186200
E-mail: [email protected]
Investor grievance email: [email protected]
Website: www.linkintime.co.in
Contact Person: Shanti Gopalkrishnan

73
SEBI Registration No.: INR000004058
Syndicate Member
Edelweiss Securities Limited
Edelweiss House, Off CST Road
Kalina, Mumbai 400 098
Maharashtra, India
Tel: +91 22 4063 5569
E-mail: [email protected]
Website: www.edelweissfin.com
Contact Person: Prakash Boricha
SEBI Registration No.: INZ000166136
Banker to the Offer
Axis Bank Limited
No. 09, Esquire Center
MG Road, Bangalore 560 001
Karnataka, India
Tel: +91 80 2537 0611
E-mail: [email protected]
Website: www.axisbank.com
Contact Person: Nilam Choudhury
SEBI Registration No.: INBI00000017
Bankers to our Company
Citibank N.A.
No. 5, MG Road
Ranga Complex Third Floor
Bangalore 560 001
Karnataka, India
Tel: +91 96866 60899
E-mail: [email protected]
Website: www.citi.com
Contact Person: Jagadeesh Hegde
State Bank of India
SME Jayanagar Branch (06959)
No. 311 (New) 19, 1st Floor
1st Main Road, 40th Cross
Jayanagar 8th Block
Bangalore 560 070
Karnataka, India
Tel: +91 80 2665 7240/ 80 2665 7242
E-mail: [email protected]
Website: www.onlinesbi.com
Contact Person: Sanjai Kumar Srivastava, Chief Manager
Designated Intermediaries
Self-Certified Syndicate Banks
The banks registered with SEBI, which offer the facility of ASBA services, (i) in relation to ASBA, where the Bid Amount will
be blocked by authorising an SCSB, a list of which is available on the website of SEBI at
https://www.sebi.gov.in/sebiweb/other/OtherAction.do?doRecognisedFpi=yes&intmId=34 and updated from time to time and
at such other websites as may be prescribed by SEBI from time to time, (ii) in relation to RIBs using the UPI Mechanism, a list
of which is available on the website of SEBI at
https://sebi.gov.in/sebiweb/other/OtherAction.do?doRecognisedFpi=yes&intmId=40 or such other website as updated from
time to time.
Applications through UPI in the Offer can be made only through the SCSBs mobile applications whose name appears on the
SEBI website. A list of SCSBs and mobile application, which, are live for applying in public issues using UPI mechanism is
provided as Annexure ‘A’ to the SEBI circular no. SEBI/HO/CFD/DIL2/CIR/P/2019/85 dated July 26, 2019. The list is
74
available on the website of SEBI at https://www.sebi.gov.in/sebiweb/other/OtherAction.do?doRecognisedFpi=yes&intmId=43
and updated from time to time and at such other websites as may be prescribed by SEBI from time to time.
Syndicate SCSB Branches
In relation to Bids (other than Bids by Anchor Investors and RIBs) submitted under the ASBA process to a member of the
Syndicate, the list of branches of the SCSBs at the Specified Locations named by the respective SCSBs to receive deposits of
Bid cum Application Forms from the members of the Syndicate is available on the website of the SEBI
(https://www.sebi.gov.in/sebiweb/other/OtherAction.do?doRecognisedFpi=yes&intmId=35) and updated from time to time.
For more information on such branches collecting Bid cum Application Forms from the Syndicate at Specified Locations, see
the website of the SEBI http://www.sebi.gov.in/sebiweb/other/OtherAction.do?doRecognised=yes as updated from time to
time.
Registered Brokers
The list of the Registered Brokers eligible to accept ASBA forms, including details such as postal address, telephone number
and e-mail address, is provided on the websites of the Stock Exchanges at
www.bseindia.com/Markets/PublicIssues/brokercentres_new.aspx? and
www.nseindia.com/products/content/equities/ipos/ipo_mem_terminal.htm, respectively, as updated from time to time.
Registrar and Share Transfer Agents
The list of the RTAs eligible to accept ASBA Forms at the Designated RTA Locations, including details such as address,
telephone number and e-mail address, is provided on the websites of the Stock Exchanges at
www.bseindia.com/Static/Markets/PublicIssues/RtaDp.aspx? and
www.nseindia.com/products/content/equities/ipos/asba_procedures.htm respectively, as updated from time to time.
Collecting Depository Participants
The list of the CDPs eligible to accept ASBA Forms at the Designated CDP Locations, including details such as their name and
contact details, is provided on the websites of the Stock Exchanges at
www.bseindia.com/Static/Markets/PublicIssues/RtaDp.aspx? and
www.nseindia.com/products/content/equities/ipos/asba_procedures.htm, respectively, as updated from time to time.
Experts to the Offer
Except as stated below, our Company has not obtained any expert opinions:
Our Company has received written consent dated October 22, 2021 from our Statutory Auditors, namely, B S R & Co. LLP,
Chartered Accountants, holding a valid peer review certificate from the ICAI, to include their name in this Red Herring
Prospectus as required under Section 26(5) of the Companies Act read with SEBI ICDR Regulations and as an “expert” as
defined under section 2(38) of the Companies Act, 2013 to the extent and in their capacity as our Statutory Auditors, and in
respect of their (i) examination report, dated October 11, 2021 on our Restated Consolidated Financial Information; (ii)
assurance report on the compilation of our Proforma Condensed Consolidated Financial Information, dated October 11, 2021
on our Proforma Condensed Consolidated Financial Information; and (iii) their report dated October 22, 2021 on the statement
of possible special tax benefits included in this Red Herring Prospectus and such consent has not been withdrawn as on the date
of this Red Herring Prospectus.
In addition, (i) our Company has received written consent dated July 29, 2021 from G. Shankar Rao, as the chartered engineer
to include his name as an “expert” under Section 2(38) of the Companies Act, 2013, and other applicable provisions of the
Companies Act, 2013 in his capacity as a ‘chartered engineer’, in respect of the certificate dated July 29, 2021, and such consent
has not been withdrawn as on the date of this Red Herring Prospectus, and (ii) our Company has received written consent dated
July 27, 2021 from Ramanand & Associates, Chartered Accountants, as the independent chartered accountants to include its
name as an “expert” under Section 2(38) of the Companies Act, 2013, and other applicable provisions of the Companies Act,
2013 in his capacity as an independent chartered accountant, in respect of the certificates dated October 22, 2021, and such
consent has not been withdrawn as on the date of this Red Herring Prospectus.
Monitoring Agency
As the Offer is an offer for sale of Equity Shares by the Selling Shareholders, our Company is not required to appoint a
monitoring agency for this Offer.
Appraising Entity
As the Offer is an offer for sale of Equity Shares by the Selling Shareholders, our Company will not receive any proceeds from
the Offer. Accordingly, no appraising entity has been appointed for the Offer.

75
Credit Rating
As the Offer is an offer for sale of Equity Shares by the Selling Shareholders, there is no credit rating required.
IPO Grading
No credit agency registered with SEBI has been appointed in respect of obtaining grading for the Offer.
Trustees
As the Offer is an offer for sale of Equity Shares by the Selling Shareholders, the appointment of trustees is not required.
Green Shoe Option
No green shoe option is contemplated under the Offer.
Inter-se allocation of responsibilities
The following table sets forth the inter-se allocation of responsibilities for various activities among the Book Running Lead
Managers:
Sr.
No.
Activity Responsibility Co-
ordination
1. Capital structuring with the relative components and formalities such as composition of debt and
equity, type of instruments, and positioning strategy
BRLMs Axis
2. Due diligence of Company including its operations / management / business plans / legal etc.,
Drafting and design of Draft Red Herring Prospectus, Red Herring Prospectus and Prospectus.
Ensure compliance and completion of prescribed formalities with the Stock Exchanges, SEBI and
RoC including finalisation of RHP, Prospectus, Offer Agreement, Syndicate and Underwriting
Agreements and RoC filing
BRLMs Axis
3. Drafting and approval of all statutory advertisements BRLMs Axis
4. Drafting and approval of all publicity material other than statutory advertisements as mentioned
in point 3 above, including corporate advertising and brochures, etc. and filing of media
compliance report
BRLMs Edelweiss
5. Appointment of intermediaries - s - Registrar to the Offer, Advertising Agency,
Printers, Sponsor Bank, Banker(s) to the Offer, and any other intermediaries (including
coordination of all agreements)
BRLMs IIFL
6. Preparation of road show presentation for the road show team BRLMs IIFL
7 Preparation of FAQs for the road show team BRLMs Edelweiss
8. International institutional marketing of the Offer, which will cover, inter alia:
• Institutional marketing strategy
• Finalising the list and division of international investors for one-to-one meetings
Finalising international road show and investor meeting schedules
BRLMs IIFL
9. Domestic institutional marketing of the Offer, which will cover, inter alia:
• Finalising the list and division of domestic investors for one-to-one meetings
• Finalising domestic road show and investor meeting schedules
BRLMs Axis
10. Retail marketing and Non-institutional marketing strategy for the Offer, which will cover, inter-
alia:
• Finalising media, marketing, public relations strategy and publicity budget
• Finalising collection centres
BRLMs Edelweiss
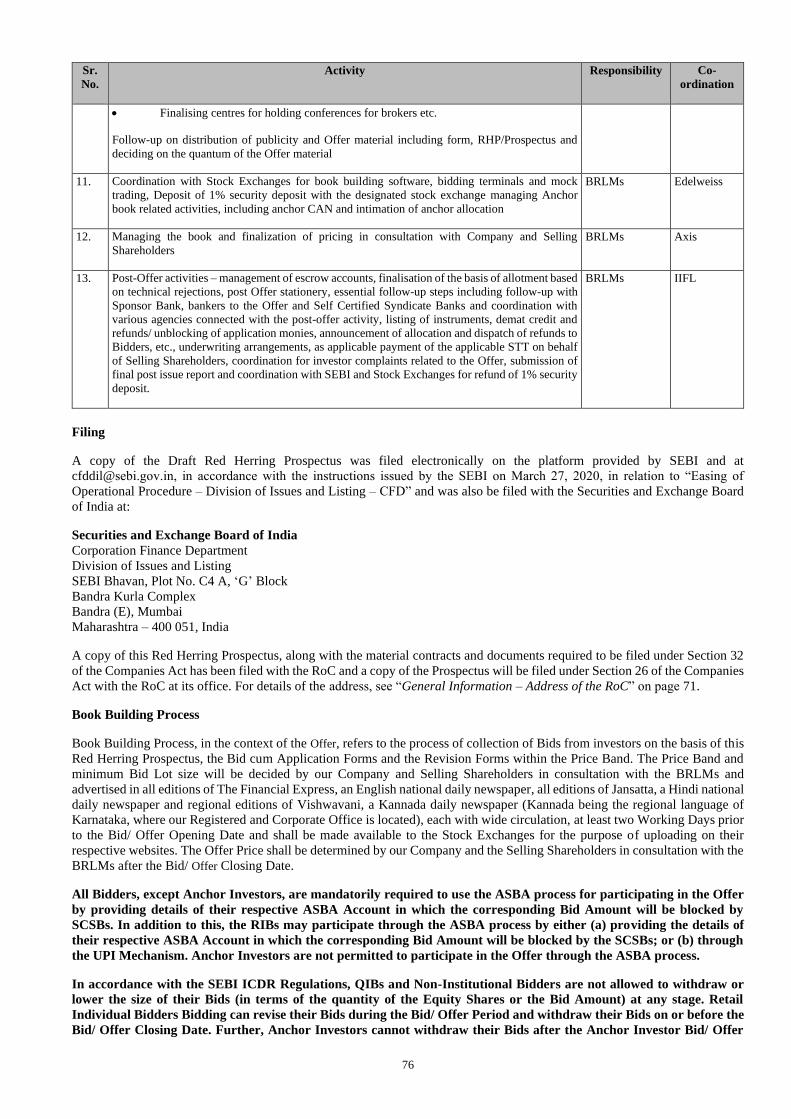
76
Sr.
No.
Activity Responsibility Co-
ordination
• Finalising centres for holding conferences for brokers etc.
Follow-up on distribution of publicity and Offer material including form, RHP/Prospectus and
deciding on the quantum of the Offer material
11. Coordination with Stock Exchanges for book building software, bidding terminals and mock
trading, Deposit of 1% security deposit with the designated stock exchange managing Anchor
book related activities, including anchor CAN and intimation of anchor allocation
BRLMs Edelweiss
12. Managing the book and finalization of pricing in consultation with Company and Selling
Shareholders
BRLMs Axis
13. Post-Offer activities – management of escrow accounts, finalisation of the basis of allotment based
on technical rejections, post Offer stationery, essential follow-up steps including follow-up with
Sponsor Bank, bankers to the Offer and Self Certified Syndicate Banks and coordination with
various agencies connected with the post-offer activity, listing of instruments, demat credit and
refunds/ unblocking of application monies, announcement of allocation and dispatch of refunds to
Bidders, etc., underwriting arrangements, as applicable payment of the applicable STT on behalf
of Selling Shareholders, coordination for investor complaints related to the Offer, submission of
final post issue report and coordination with SEBI and Stock Exchanges for refund of 1% security
deposit.
BRLMs IIFL
Filing
A copy of the Draft Red Herring Prospectus was filed electronically on the platform provided by SEBI and at
[email protected], in accordance with the instructions issued by the SEBI on March 27, 2020, in relation to “Easing of
Operational Procedure – Division of Issues and Listing – CFD” and was also be filed with the Securities and Exchange Board
of India at:
Securities and Exchange Board of India
Corporation Finance Department
Division of Issues and Listing
SEBI Bhavan, Plot No. C4 A, ‘G’ Block
Bandra Kurla Complex
Bandra (E), Mumbai
Maharashtra – 400 051, India
A copy of this Red Herring Prospectus, along with the material contracts and documents required to be filed under Section 32
of the Companies Act has been filed with the RoC and a copy of the Prospectus will be filed under Section 26 of the Companies
Act with the RoC at its office. For details of the address, see “General Information – Address of the RoC” on page 71.
Book Building Process
Book Building Process, in the context of the Offer, refers to the process of collection of Bids from investors on the basis of this
Red Herring Prospectus, the Bid cum Application Forms and the Revision Forms within the Price Band. The Price Band and
minimum Bid Lot size will be decided by our Company and Selling Shareholders in consultation with the BRLMs and
advertised in all editions of The Financial Express, an English national daily newspaper, all editions of Jansatta, a Hindi national
daily newspaper and regional editions of Vishwavani, a Kannada daily newspaper (Kannada being the regional language of
Karnataka, where our Registered and Corporate Office is located), each with wide circulation, at least two Working Days prior
to the Bid/ Offer Opening Date and shall be made available to the Stock Exchanges for the purpose of uploading on their
respective websites. The Offer Price shall be determined by our Company and the Selling Shareholders in consultation with the
BRLMs after the Bid/ Offer Closing Date.
All Bidders, except Anchor Investors, are mandatorily required to use the ASBA process for participating in the Offer
by providing details of their respective ASBA Account in which the corresponding Bid Amount will be blocked by
SCSBs. In addition to this, the RIBs may participate through the ASBA process by either (a) providing the details of
their respective ASBA Account in which the corresponding Bid Amount will be blocked by the SCSBs; or (b) through
the UPI Mechanism. Anchor Investors are not permitted to participate in the Offer through the ASBA process.
In accordance with the SEBI ICDR Regulations, QIBs and Non-Institutional Bidders are not allowed to withdraw or
lower the size of their Bids (in terms of the quantity of the Equity Shares or the Bid Amount) at any stage. Retail
Individual Bidders Bidding can revise their Bids during the Bid/ Offer Period and withdraw their Bids on or before the
Bid/ Offer Closing Date. Further, Anchor Investors cannot withdraw their Bids after the Anchor Investor Bid/ Offer
77
Period. Allocation to the QIBs (other than Anchor Investors) and Non-Institutional Buyers will be on a proportionate
basis while allocation to the Anchor Investors will be on a discretionary basis.
Each Bidder by submitting a Bid in the Offer, will be deemed to have acknowledged the above restrictions and the terms
of the Offer.
Our Company will comply with the SEBI ICDR Regulations and any other directions issued by SEBI in relation to this Offer.
In this regard, our Company along with the Selling Shareholders has appointed the BRLMs to manage this Offer and procure
Bids for this Offer.
The Book Building Process is in accordance with guidelines, rules and regulations prescribed by SEBI and are subject
to change from time to time. Bidders are advised to make their own judgement about an investment through this process
prior to submitting a Bid.
For further details on the method and procedure for Bidding, see “Offer Structure” and “Offer Procedure” on pages 324 and
326, respectively.
Bidders should note that the Offer is also subject to obtaining (i) final listing and trading approvals of the Stock Exchanges,
which our Company shall apply for after Allotment; and (ii) final approval of the RoC after the Prospectus is filed with the
RoC.
Illustration of Book Building and Price Discovery Process
For an illustration of the Book Building Process and the price discovery process, see “Offer Procedure” on page 326.
Underwriting Agreement
After the determination of the Offer Price and allocation of Equity Shares, but prior to the filing of the Prospectus with the RoC,
our Company and the Selling Shareholders intend to enter into an Underwriting Agreement with the Underwriter(s) for the
Equity Shares proposed to be issued and offered in the Offer. The extent of underwriting obligations and the Bids to be
underwritten by each BRLMs shall be as per the Underwriting Agreement. The Underwriting Agreement is dated [●]. Pursuant
to the terms of the Underwriting Agreement, the obligations of each of the Underwriter(s) will be several and will be subject to
certain conditions specified therein.
The Underwriter(s) have indicated their intention to underwrite the following number of Equity Shares pursuant to the
Underwriting Agreement:
(This portion has been intentionally left blank and will be filled in before filing of the Prospectus with the RoC)
Name, Address, Telephone Number and
Email Address of the Underwriters
Indicative Number of Equity Shares to be
Underwritten
Amount Underwritten
(in ₹ million)
[●] [●] [●]
The abovementioned underwriting commitments are indicative and will be finalised after pricing of the Offer, the Basis of
Allotment and actual allocation in accordance with provisions of the SEBI ICDR Regulations.
In the opinion of our Board (based on representations made to our Company by the Underwriter(s)), the resources of the
abovementioned Underwriter(s) are sufficient to enable them to discharge their respective underwriting obligations in full. The
abovementioned Underwriters are registered with the SEBI under Section 12(1) of the SEBI Act or registered as brokers with
the Stock Exchanges. Our Board/ IPO Committee, at its meeting held on [●], has accepted and entered into the Underwriting
Agreement mentioned above on behalf of our Company.
Allocation among the Underwriter(s) may not necessarily be in proportion to their underwriting commitment set forth in the
table above.
Notwithstanding the above table, the Underwriter(s) shall be severally responsible for ensuring payment with respect to the
Equity Shares allocated to investors respectively procured by them in accordance with the Underwriting Agreement. In the
event of any default in payment, the respective Underwriter, in addition to other obligations defined in the Underwriting
Agreement, will also be required to procure subscribers for or subscribe to the Equity Shares to the extent of the defaulted
amount in accordance with the Underwriting Agreement. The Underwriting Agreement has not been executed as on the date of
this Red Herring Prospectus and will be executed after determination of the Offer Price and allocation of Equity Shares, but
prior to the filing of the Prospectus with the RoC.

78
CAPITAL STRUCTURE
The share capital of our Company, as on the date of this Red Herring Prospectus, is set forth below:
(In ₹, except share data) Sr. No. Particulars Aggregate value at face
value (₹)
Aggregate value at Offer
Price*
A. AUTHORIZED SHARE CAPITAL(1)
35,000,000 Equity Shares 350,000,000.00 [●]
B. ISSUED, SUBSCRIBED AND PAID-UP SHARE CAPITAL
BEFORE AND AFTER THE OFFER
30,437,904 Equity Shares 304,379,040.00 [●]
C. PRESENT OFFER
Offer for Sale of up to [●] Equity Shares by the Selling Shareholders
aggregating up to ₹8,000 million(2) (3)
[●] [●]
D. SECURITIES PREMIUM ACCOUNT
Before and after the Offer 39,411,360.00 * To be included upon finalisation of Offer Price (1) For details in relation to the changes in the authorised share capital of our Company, see “History and Certain Corporate Matters – Amendments to the
MoA” on page 154. (2) The Offer has been authorised by our Board of Directors pursuant to the resolution passed at its meeting dated June 30, 2021, and the DRHP was
approved by our Board pursuant to a resolution passed on July 27, 2021. This Red Herring Prospectus has been approved by our Board pursuant to a
resolution passed on October 22, 2021. (3) The Selling Shareholders confirm that the Offered Shares have been held by the Selling Shareholders for a period of at least one year prior to the filing
of the Draft Red Herring Prospectus in accordance with Regulation 8 of the SEBI ICDR Regulations and accordingly, are eligible for the Offer in
accordance with the provisions of the SEBI ICDR Regulations. For details on the authorization of the Selling Shareholders in relation to the Offered
Shares, see “The Offer” on page 59.
Notes to the Capital Structure
1. Share Capital History of our Company
(a) Equity Share capital
The history of the Equity Share capital of our Company is set forth in the table below:
(1) 25,340 Equity Shares were allotted to Sumathi Sivakumar, 25,330 Equity Shares each were allotted to V. Srinivasan and K.A. Joseph,
8,000 Equity Shares each were allotted to V. Sharada Srinivasan and Daisy Joseph, 6,000 Equity Shares were allotted to S. Sivakumar and 2,000 Equity Shares were allotted to S. Vishnu Sivakumar
(2) 966,700 Equity Shares were allotted to S. Sivakumar and 966,650 Equity Shares each were allotted to K.A. Joseph and V. Srinivasan
in the ratio of nine Equity Shares for every one Equity Shares held
Date of
allotment
and when
made fully
paid up
Number of
Equity
Shares
allotted
Face
value per
Equity
Share
(₹)
Offer
Price
per
Equity
Share
(₹)
Nature of
consideration
Nature of
allotment
Cumulative
number of
Equity Shares
Cumulative paid-
up Equity Share
capital
(₹)
June 21,
2005
100,000 10 10 Cash Initial
subscription
to MoA(1)
100,000 1,000,000
September
26, 2005
2,900,000 10 10 Cash Rights
issue(2)
3,000,000 30,000,000
March 6,
2017
27,000,000 10 NA NA Bonus issue
of nine
Equity
Shares as
bonus share
for every one
existing
Equity
Share(3)
30,000,000 300,000,000
December
5, 2017
437,904 10 100 Cash Private
placement(4)
30,437,904 301,094,760
January 11,
2019
345,944 Equity Shares allotted to SCPL and 91,960 Equity Shares
allotted to K.A. Joseph on December 5, 2017 were made fully paid
up on January 11, 2019
30,437,904 304,379,040

79
(3) Bonus issue was undertaken by way of capitalisation from the profit and loss account of our Company to the persons who were
Shareholders as on the record date. Accordingly, 21,060,000 Equity Shares were allotted to Evergraph, 5,328,000 Equity Shares
were allotted to K.A. Joseph, 270,000 Equity Shares each were allotted to S. Sivakumar and V. Srinivasan and 72,000 Equity Shares were allotted to Daisy Joseph
(4) 345,944 Equity Shares were allotted to SCPL and 91,960 Equity Shares were allotted to K.A. Joseph. Such Equity Shares were
partly paid and ₹25 per Equity Share was paid at the time of allotment of such Equity Shares. Such Equity Shares were made fully
paid up on January 11, 2019
(b) Preference Share capital
Our Company does not have any outstanding preference shares as on the date of the filing of this Red Herring
Prospectus.
2. Offer of Equity Shares at a price lower than the Offer Price in the last year
Our Company has not issued any Equity Shares during a period of one year preceding the date of this Red Herring
Prospectus.
3. Offer of shares for consideration other than cash or out of revaluation of reserves
Our Company has not issued any Equity Shares for consideration other than cash or out of revaluation of reserves in
the one year preceding the date of this Red Herring Prospectus.
4. Offer of Equity Shares pursuant to schemes of arrangement
Our Company has not allotted any Equity Shares pursuant to a scheme of amalgamation approved under Section 391
to 394 of the Companies Act, 1956 or Sections 230 to 234 of the Companies Act.
5. History of the Equity Share capital held by our Promoters
As on the date of this Red Herring Prospectus, our Promoters hold 30,011,760 Equity Shares equivalent to 98.60% of
the issued, subscribed and paid-up Equity Share capital of our Company.
(a) Build-up of the shareholding of our Promoters in our Company
The details regarding the equity shareholding of our Promoter since incorporation of our Company is set forth
in the table below.
Date of
allotment
and made
fully paid-
up/ transfer
Nature of
transaction
No. of
Equity
Shares
allotted/
transferred
Nature of
consideration
Face
Value
per
Equity
Share
(₹)
Offer
Price/
Transfer
Price per
Equity
Share (₹)
Percentage
of the pre-
Offer
capital (%)
Percentage
of the post-
Offer capital
(%)
K.A. Joseph
June 21,
2005
Initial
subscription to
MoA
25,330 Cash 10 10 0.08 0.08
September
26, 2005
Rights issue 966,650 Cash 10 10 3.18 3.18
April 23,
2007
Transfer of
Equity Shares(1)
(120,000) Cash 10 118 (0.39) (0.39)
January 7,
2008
Transfer of
Equity Shares(2)
(140,000) Cash 10 353.35 (0.46) (0.46)
January 7,
2008
Transfer of
Equity Shares(3)
(10,000) Cash 10 353.35 (0.03) (0.03)
September
29, 2015
Transfer of
Equity Shares(4)
86,175 Cash 10 290 0.28 0.28
September
29, 2015
Transfer of
Equity Shares(5)
(208,015) Cash 10 880 (0.68) (0.68)
December
21, 2015
Transfer of
Equity Shares(6)
(8,140) Cash 10 880 (0.03) (0.03)
March 6,
2017
Bonus issue of
nine Equity
Shares as bonus
share for every
one existing
Equity Share
5,328,000 NA 10 NA 17.50 17.50

80
Date of
allotment
and made
fully paid-
up/ transfer
Nature of
transaction
No. of
Equity
Shares
allotted/
transferred
Nature of
consideration
Face
Value
per
Equity
Share
(₹)
Offer
Price/
Transfer
Price per
Equity
Share (₹)
Percentage
of the pre-
Offer
capital (%)
Percentage
of the post-
Offer capital
(%)
August 17,
2017
Transfer of
Equity Shares(7)
300,000 Cash 10 100 0.99 0.99
December 5,
2017
Private
placement(8)
91,960 Cash 10 100 0.30 0.30
April 16,
2021
Transfer of
Equity Shares(9)
(100) Cash 10 10 (0.00) (0.00)
April 16,
2021
Transfer of
Equity Shares(10)
(100) Cash 10 10 (0.00) (0.00)
Total (A) 6,311,760 20.74 20.74
Evergraph
September
24, 2015
Transfer of
Equity Shares(11)
667,695 Cash 10 880 2.19 2.19
September
29, 2015
Transfer of
Equity Shares(12)
673,615 Cash 10 880 2.21 2.21
September
29, 2015
Transfer of
Equity Shares(13)
69,290 Cash 10 880 0.23 0.23
September
29, 2015
Transfer of
Equity Shares(14)
208,015 Cash 10 880 0.68 0.68
September
29, 2015
Transfer of
Equity Shares(15)
604,385 Cash 10 880 1.99 1.99
September
29, 2015
Transfer of
Equity Shares(16)
30,000 Cash 10 880 0.10 0.10
December
21, 2015
Transfer of
Equity Shares(17)
26,365 Cash 10 880 0.09 0.09
December
21, 2015
Transfer of
Equity Shares(18)
2,710 Cash 10 880 0.01 0.01
December
21, 2015
Transfer of
Equity Shares(19)
8,140 Cash 10 880 0.03 0.03
December
21, 2015
Transfer of
Equity Shares(20)
23,655 Cash 10 880 0.08 0.08
December
21, 2015
Transfer of
Equity Shares(21)
26,130 Cash 10 880 0.09 0.09
March 6,
2017
Bonus issue of
nine Equity
Shares as bonus
share for every
one existing
Equity Share
21,060,000 NA 10 NA 69.19 69.19
August 17,
2017
Transfer of
Equity Shares(22)
300,000 Cash 10 100 0.99 0.99
Total (B) 23,700,000 77.86 77.86
Total (A + B) 30,011,760 98.60 98.60 (1) 120,000 Equity Shares were transferred to Serigraph Inc. from K.A. Joseph
(2) 140,000 Equity Shares were transferred to Serigraph Inc. from K.A. Joseph (3) 10,000 Equity Shares were transferred to N. Subramanian from K.A. Joseph
(4) 86,175 Equity Shares were transferred to K.A. Joseph from Serigraph Inc.
(5) 208,015 Equity Shares were transferred to Evergraph from K.A. Joseph (6) 8,140 Equity Shares were transferred to Evergraph from K.A. Joseph
(7) 300,000 Equity Shares were transferred to K.A. Joseph from S. Sivakumar
(8) 91,960 Equity Shares were allotted to K.A. Joseph. Such Equity Shares were partly paid and ₹25 per Equity Share was paid at the time of allotment of such Equity Shares. Such Equity Shares were made fully paid up on January 11, 2019
(9) 100 Equity Shares were transferred to Kevin K. Joseph from K.A. Joseph
(10) 100 Equity Shares were transferred to Nikita Joseph from K.A. Joseph (11) 667,695 Equity Shares were transferred to Evergraph from Serigraph Inc.
(12) 673,615 Equity Shares were transferred to Evergraph from V. Srinivasan
(13) 69,290 Equity Shares were transferred to Evergraph from S. Sivakumar (14) 208,015 Equity Shares were transferred to Evergraph from K.A. Joseph
(15) 604,385 Equity Shares were transferred to Evergraph from S. Sumathi
(16) 30,000 Equity Shares were transferred to Evergraph from N. Subramanian (17) 26,365 Equity Shares were transferred to Evergraph from V. Srinivasan
(18) 2,710 Equity Shares were transferred to Evergraph from S. Sivakumar
(19) 8,140 Equity Shares were transferred to Evergraph from K.A. Joseph (20) 23,655 Equity Shares were transferred to Evergraph from S. Sumathi
(21) 26,130 Equity Shares were transferred to Evergraph from Serigraph Inc.
(22) 300,000 Equity Shares were transferred to Evergraph from V. Srinivasan
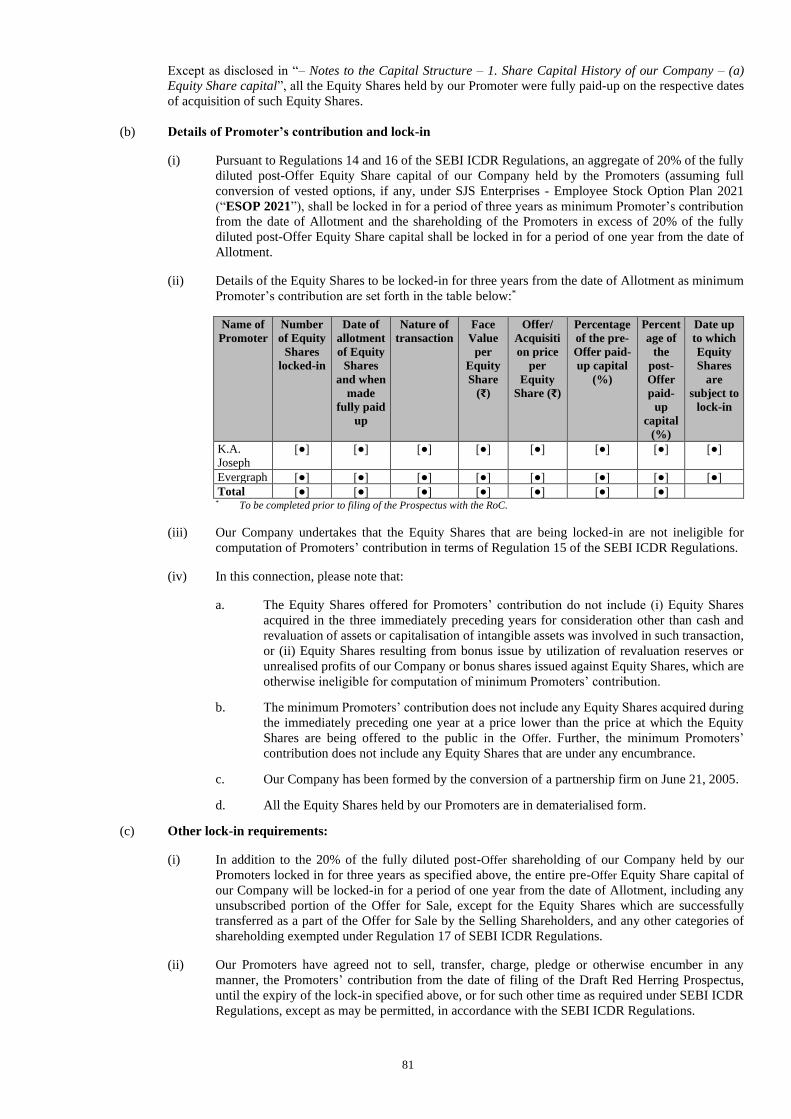
81
Except as disclosed in “– Notes to the Capital Structure – 1. Share Capital History of our Company – (a)
Equity Share capital”, all the Equity Shares held by our Promoter were fully paid-up on the respective dates
of acquisition of such Equity Shares.
(b) Details of Promoter’s contribution and lock-in
(i) Pursuant to Regulations 14 and 16 of the SEBI ICDR Regulations, an aggregate of 20% of the fully
diluted post-Offer Equity Share capital of our Company held by the Promoters (assuming full
conversion of vested options, if any, under SJS Enterprises - Employee Stock Option Plan 2021
(“ESOP 2021”), shall be locked in for a period of three years as minimum Promoter’s contribution
from the date of Allotment and the shareholding of the Promoters in excess of 20% of the fully
diluted post-Offer Equity Share capital shall be locked in for a period of one year from the date of
Allotment.
(ii) Details of the Equity Shares to be locked-in for three years from the date of Allotment as minimum
Promoter’s contribution are set forth in the table below:*
Name of
Promoter
Number
of Equity
Shares
locked-in
Date of
allotment
of Equity
Shares
and when
made
fully paid
up
Nature of
transaction
Face
Value
per
Equity
Share
(₹)
Offer/
Acquisiti
on price
per
Equity
Share (₹)
Percentage
of the pre-
Offer paid-
up capital
(%)
Percent
age of
the
post-
Offer
paid-
up
capital
(%)
Date up
to which
Equity
Shares
are
subject to
lock-in
K.A.
Joseph
[●] [●] [●] [●] [●] [●] [●] [●]
Evergraph [●] [●] [●] [●] [●] [●] [●] [●]
Total [●] [●] [●] [●] [●] [●] [●] * To be completed prior to filing of the Prospectus with the RoC.
(iii) Our Company undertakes that the Equity Shares that are being locked-in are not ineligible for
computation of Promoters’ contribution in terms of Regulation 15 of the SEBI ICDR Regulations.
(iv) In this connection, please note that:
a. The Equity Shares offered for Promoters’ contribution do not include (i) Equity Shares
acquired in the three immediately preceding years for consideration other than cash and
revaluation of assets or capitalisation of intangible assets was involved in such transaction,
or (ii) Equity Shares resulting from bonus issue by utilization of revaluation reserves or
unrealised profits of our Company or bonus shares issued against Equity Shares, which are
otherwise ineligible for computation of minimum Promoters’ contribution.
b. The minimum Promoters’ contribution does not include any Equity Shares acquired during
the immediately preceding one year at a price lower than the price at which the Equity
Shares are being offered to the public in the Offer. Further, the minimum Promoters’
contribution does not include any Equity Shares that are under any encumbrance.
c. Our Company has been formed by the conversion of a partnership firm on June 21, 2005.
d. All the Equity Shares held by our Promoters are in dematerialised form.
(c) Other lock-in requirements:
(i) In addition to the 20% of the fully diluted post-Offer shareholding of our Company held by our
Promoters locked in for three years as specified above, the entire pre-Offer Equity Share capital of
our Company will be locked-in for a period of one year from the date of Allotment, including any
unsubscribed portion of the Offer for Sale, except for the Equity Shares which are successfully
transferred as a part of the Offer for Sale by the Selling Shareholders, and any other categories of
shareholding exempted under Regulation 17 of SEBI ICDR Regulations.
(ii) Our Promoters have agreed not to sell, transfer, charge, pledge or otherwise encumber in any
manner, the Promoters’ contribution from the date of filing of the Draft Red Herring Prospectus,
until the expiry of the lock-in specified above, or for such other time as required under SEBI ICDR
Regulations, except as may be permitted, in accordance with the SEBI ICDR Regulations.

82
(iii) Any Equity Shares Allotted to Anchor Investors under the Anchor Investor Portion shall be locked-
in for a period of 30 days from the date of Allotment.
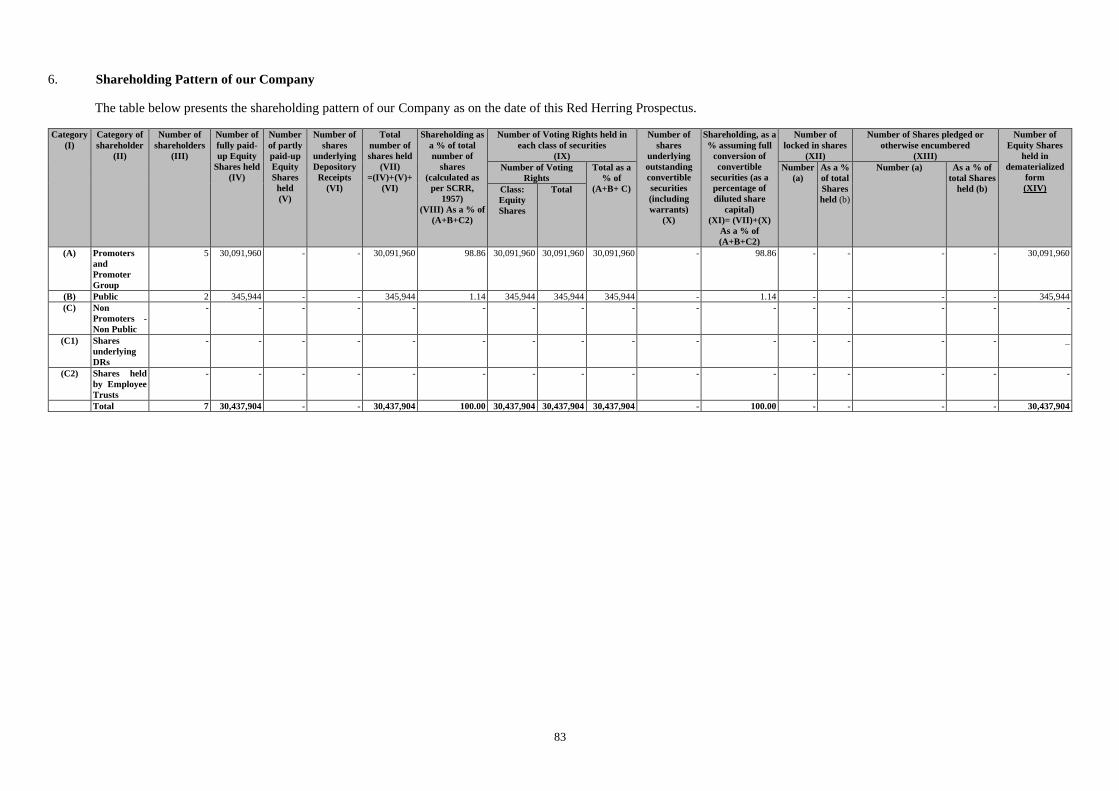
83
6. Shareholding Pattern of our Company
The table below presents the shareholding pattern of our Company as on the date of this Red Herring Prospectus.
Category
(I)
Category of
shareholder
(II)
Number of
shareholders
(III)
Number of
fully paid-
up Equity
Shares held
(IV)
Number
of partly
paid-up
Equity
Shares
held
(V)
Number of
shares
underlying
Depository
Receipts
(VI)
Total
number of
shares held
(VII)
=(IV)+(V)+
(VI)
Shareholding as
a % of total
number of
shares
(calculated as
per SCRR,
1957)
(VIII) As a % of
(A+B+C2)
Number of Voting Rights held in
each class of securities
(IX)
Number of
shares
underlying
outstanding
convertible
securities
(including
warrants)
(X)
Shareholding, as a
% assuming full
conversion of
convertible
securities (as a
percentage of
diluted share
capital)
(XI)= (VII)+(X)
As a % of
(A+B+C2)
Number of
locked in shares
(XII)
Number of Shares pledged or
otherwise encumbered
(XIII)
Number of
Equity Shares
held in
dematerialized
form
(XIV)
Number of Voting
Rights
Total as a
% of
(A+B+ C)
Number
(a)
As a %
of total
Shares
held (b)
Number (a) As a % of
total Shares
held (b) Class:
Equity
Shares
Total
(A) Promoters
and
Promoter
Group
5 30,091,960 - - 30,091,960 98.86 30,091,960 30,091,960 30,091,960 - 98.86 - - - - 30,091,960
(B) Public 2 345,944 - - 345,944 1.14 345,944 345,944 345,944 - 1.14 - - - - 345,944
(C) Non
Promoters -
Non Public
- - - - - - - - - - - - - - - -
(C1) Shares
underlying
DRs
- - - - - - - - - - - - - - - _
(C2) Shares held
by Employee
Trusts
- - - - - - - - - - - - - - - -
Total 7 30,437,904 - - 30,437,904 100.00 30,437,904 30,437,904 30,437,904 - 100.00 - - - - 30,437,904
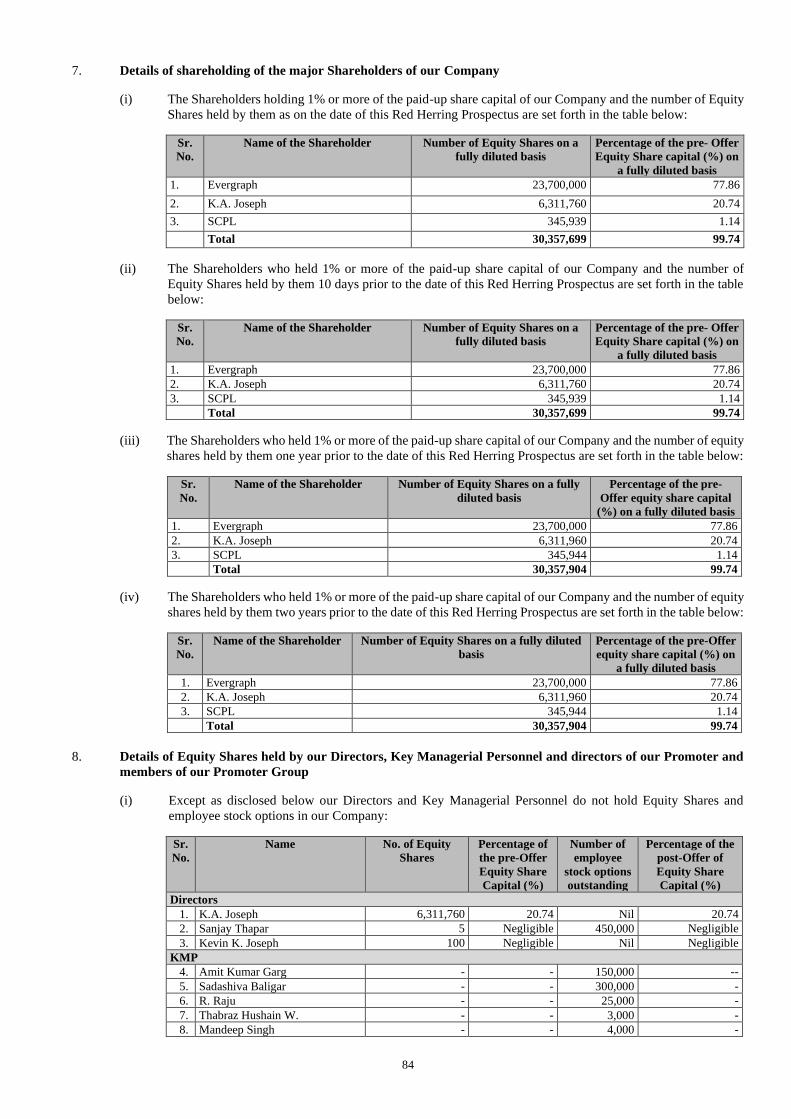
84
7. Details of shareholding of the major Shareholders of our Company
(i) The Shareholders holding 1% or more of the paid-up share capital of our Company and the number of Equity
Shares held by them as on the date of this Red Herring Prospectus are set forth in the table below:
Sr.
No.
Name of the Shareholder Number of Equity Shares on a
fully diluted basis
Percentage of the pre- Offer
Equity Share capital (%) on
a fully diluted basis
1. Evergraph 23,700,000 77.86
2. K.A. Joseph 6,311,760 20.74
3. SCPL 345,939 1.14
Total 30,357,699 99.74
(ii) The Shareholders who held 1% or more of the paid-up share capital of our Company and the number of
Equity Shares held by them 10 days prior to the date of this Red Herring Prospectus are set forth in the table
below:
Sr.
No.
Name of the Shareholder Number of Equity Shares on a
fully diluted basis
Percentage of the pre- Offer
Equity Share capital (%) on
a fully diluted basis
1. Evergraph 23,700,000 77.86
2. K.A. Joseph 6,311,760 20.74
3. SCPL 345,939 1.14
Total 30,357,699 99.74
(iii) The Shareholders who held 1% or more of the paid-up share capital of our Company and the number of equity
shares held by them one year prior to the date of this Red Herring Prospectus are set forth in the table below:
Sr.
No.
Name of the Shareholder Number of Equity Shares on a fully
diluted basis
Percentage of the pre-
Offer equity share capital
(%) on a fully diluted basis
1. Evergraph 23,700,000 77.86
2. K.A. Joseph 6,311,960 20.74
3. SCPL 345,944 1.14
Total 30,357,904 99.74
(iv) The Shareholders who held 1% or more of the paid-up share capital of our Company and the number of equity
shares held by them two years prior to the date of this Red Herring Prospectus are set forth in the table below:
Sr.
No.
Name of the Shareholder Number of Equity Shares on a fully diluted
basis
Percentage of the pre-Offer
equity share capital (%) on
a fully diluted basis
1. Evergraph 23,700,000 77.86
2. K.A. Joseph 6,311,960 20.74
3. SCPL 345,944 1.14
Total 30,357,904 99.74
8. Details of Equity Shares held by our Directors, Key Managerial Personnel and directors of our Promoter and
members of our Promoter Group
(i) Except as disclosed below our Directors and Key Managerial Personnel do not hold Equity Shares and
employee stock options in our Company:
Sr.
No.
Name No. of Equity
Shares
Percentage of
the pre-Offer
Equity Share
Capital (%)
Number of
employee
stock options
outstanding
Percentage of the
post-Offer of
Equity Share
Capital (%)
Directors
1. K.A. Joseph 6,311,760 20.74 Nil 20.74
2. Sanjay Thapar 5 Negligible 450,000 Negligible
3. Kevin K. Joseph 100 Negligible Nil Negligible
KMP
4. Amit Kumar Garg - - 150,000 --
5. Sadashiva Baligar - - 300,000 -
6. R. Raju - - 25,000 -
7. Thabraz Hushain W. - - 3,000 -
8. Mandeep Singh - - 4,000 -

85
Sr.
No.
Name No. of Equity
Shares
Percentage of
the pre-Offer
Equity Share
Capital (%)
Number of
employee
stock options
outstanding
Percentage of the
post-Offer of
Equity Share
Capital (%)
Sub Total 6,311,860 20.74 928,000 20.74
(ii) Except as disclosed below, the directors of our Promoters, our Promoters and the members of the Promoter
Group do not hold Equity Shares in our Company:
Sr.
No.
Name of the Shareholder No. of Equity Shares Percentage of the pre-Offer paid up
equity share Capital (%)
Promoters
1. Evergraph 23,700,000 77.86
2. K.A. Joseph 6,311,760 20.74
Total (A) 30,011,760 98.60
Promoter Group
1. Daisy Joseph 80,000 0.26
2. Kevin K. Joseph 100 Negligible
3. Nikita Joseph 100 Negligible
Total (B) 80,200 0.26
Total (A+B) 30,091,960 98.86
9. The BRLMs and their associates (as defined under the SEBI Merchant Bankers Regulations) do not hold any Equity
Shares in our Company as on the date of this Red Herring Prospectus.
10. There are no partly paid-up Equity Shares as on the date of this Red Herring Prospectus and except as disclosed in “–
Notes to the Capital Structure – 1. Share Capital History of our Company – (a) Equity Share capital”, all Equity Shares
were fully paid-up as on the date of allotment.
11. ESOP 2021
Our Company, pursuant to the resolution passed by our Board on July 12, 2021 and the resolution passed by our
Shareholders on July 14, 2021, adopted ESOP 2021 to create, offer, issue and allot in one or more tranches, stock
options which are convertible into Equity Shares. ESOP 2021 was further amended pursuant to a resolution passed by
our Board on September 24, 2021 and the resolution passed by our Shareholders on September 27, 2021. The purpose
of ESOP 2021 is to reward the employees of our Company for their association, retention, dedication and contribution
to the goals of the Company. The aggregate number of Equity Shares issued under ESOP 2021, upon exercise, shall
not exceed 2,435,000 Equity Shares at such price and on such terms and conditions as may be fixed or determined by
the Board. We have granted employee stock options to 276 employees under ESOP 2021 across various levels in our
Company.
As on the date of this Red Herring Prospectus, 1,389,000 options have been granted by our Company under ESOP
2021. The details of ESOP 2021, are as follows:
Particulars Details
Options granted 1,389,000
Exercise Price (in ₹) 263.86
Options vested and not exercised Nil
Options exercised Nil
The total number of Equity Shares arising as a result of
exercise of options granted
1,389,000
Options forfeited/lapsed Nil
Variation of terms of options Variations are only in the Vesting Period as follows:
• All employees: after completion of 3rd year - 50%, after
completion of 4th year - 25%, after completion of 5th year - 25%,
• Sanjay Thapar: all after completion of 3rd year
• Amit Kumar Garg: after completion of 3rd year - 66.67%, after
completion of 4th year- 33.33%,
Money realized by exercise of options Nil
Total number of options in force 1,389,000
Employee-wise detail of options granted to:
i. Key managerial personnel Amit Kumar Garg: 150,000
Sanjay Thapar: 450,000
Sadashiva Baligar: 300,000
R. Raju: 25,000
Thabraz Hushain W.: 3,000
Mandeep Singh: 4,000
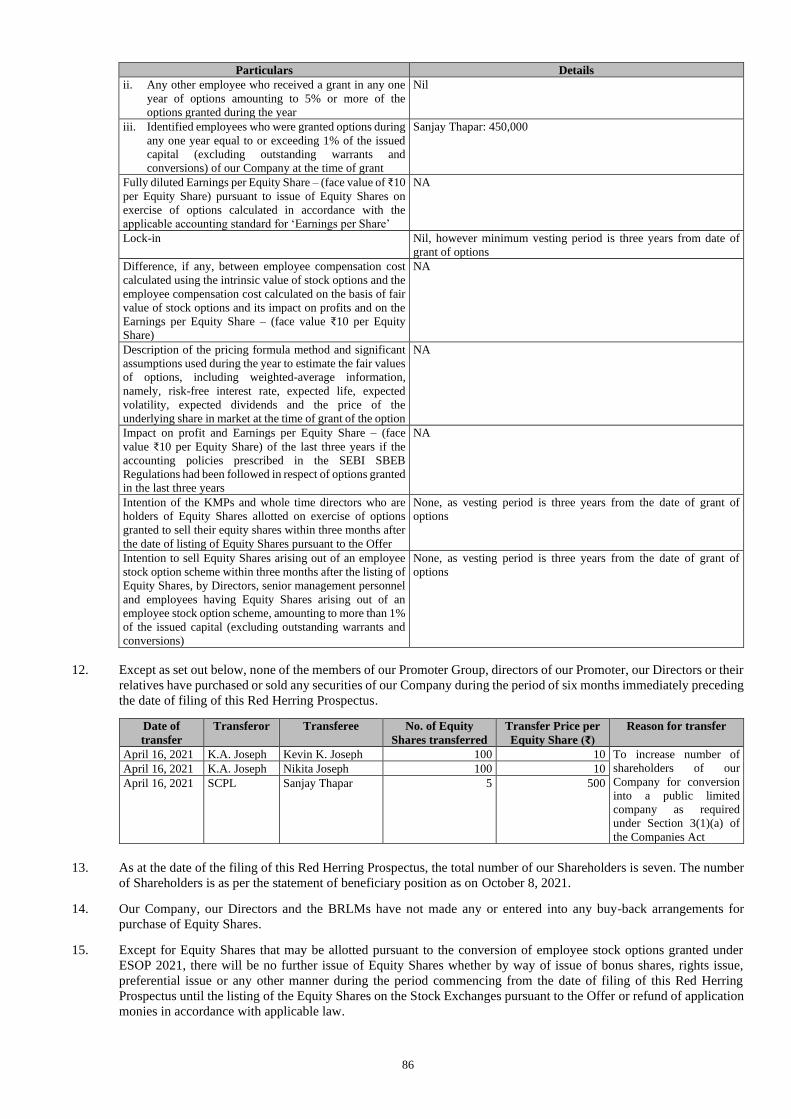
86
Particulars Details
ii. Any other employee who received a grant in any one
year of options amounting to 5% or more of the
options granted during the year
Nil
iii. Identified employees who were granted options during
any one year equal to or exceeding 1% of the issued
capital (excluding outstanding warrants and
conversions) of our Company at the time of grant
Sanjay Thapar: 450,000
Fully diluted Earnings per Equity Share – (face value of ₹10
per Equity Share) pursuant to issue of Equity Shares on
exercise of options calculated in accordance with the
applicable accounting standard for ‘Earnings per Share’
NA
Lock-in Nil, however minimum vesting period is three years from date of
grant of options
Difference, if any, between employee compensation cost
calculated using the intrinsic value of stock options and the
employee compensation cost calculated on the basis of fair
value of stock options and its impact on profits and on the
Earnings per Equity Share – (face value ₹10 per Equity
Share)
NA
Description of the pricing formula method and significant
assumptions used during the year to estimate the fair values
of options, including weighted-average information,
namely, risk-free interest rate, expected life, expected
volatility, expected dividends and the price of the
underlying share in market at the time of grant of the option
NA
Impact on profit and Earnings per Equity Share – (face
value ₹10 per Equity Share) of the last three years if the
accounting policies prescribed in the SEBI SBEB
Regulations had been followed in respect of options granted
in the last three years
NA
Intention of the KMPs and whole time directors who are
holders of Equity Shares allotted on exercise of options
granted to sell their equity shares within three months after
the date of listing of Equity Shares pursuant to the Offer
None, as vesting period is three years from the date of grant of
options
Intention to sell Equity Shares arising out of an employee
stock option scheme within three months after the listing of
Equity Shares, by Directors, senior management personnel
and employees having Equity Shares arising out of an
employee stock option scheme, amounting to more than 1%
of the issued capital (excluding outstanding warrants and
conversions)
None, as vesting period is three years from the date of grant of
options
12. Except as set out below, none of the members of our Promoter Group, directors of our Promoter, our Directors or their
relatives have purchased or sold any securities of our Company during the period of six months immediately preceding
the date of filing of this Red Herring Prospectus.
Date of
transfer
Transferor Transferee No. of Equity
Shares transferred
Transfer Price per
Equity Share (₹)
Reason for transfer
April 16, 2021 K.A. Joseph Kevin K. Joseph 100 10 To increase number of
shareholders of our
Company for conversion
into a public limited
company as required
under Section 3(1)(a) of
the Companies Act
April 16, 2021 K.A. Joseph Nikita Joseph 100 10
April 16, 2021 SCPL Sanjay Thapar 5 500
13. As at the date of the filing of this Red Herring Prospectus, the total number of our Shareholders is seven. The number
of Shareholders is as per the statement of beneficiary position as on October 8, 2021.
14. Our Company, our Directors and the BRLMs have not made any or entered into any buy-back arrangements for
purchase of Equity Shares.
15. Except for Equity Shares that may be allotted pursuant to the conversion of employee stock options granted under
ESOP 2021, there will be no further issue of Equity Shares whether by way of issue of bonus shares, rights issue,
preferential issue or any other manner during the period commencing from the date of filing of this Red Herring
Prospectus until the listing of the Equity Shares on the Stock Exchanges pursuant to the Offer or refund of application
monies in accordance with applicable law.

87
16. There have been no financing arrangements whereby the directors of our Promoter, our Promoter Group, our Directors,
and their relatives have financed the purchase by any other person of securities of our Company other than in the
normal course of the business of the financing entity, during a period of six months preceding the date of filing of the
Draft Red Herring Prospectus.
17. Our Company presently does not intend or propose and is not under negotiations and considerations to alter its capital
structure for a period of six months from the Bid/ Offer Opening Date, by way of split or consolidation of the
denomination of Equity Shares or further issue of Equity Shares (including issue of securities convertible into or
exchangeable, directly or indirectly for Equity Shares) whether on a preferential basis or by way of issue of bonus
shares or on a rights basis or by way of further public issue of Equity Shares or qualified institutions placements or
otherwise. Provided, however, that the foregoing restrictions do not apply to any issuance of Equity Shares, pursuant
to the exercise of employee stock options under ESOP 2021.
18. Except employee stock options granted pursuant to ESOP 2021, there are no outstanding convertible securities or any
warrant, option or right to convert a debenture, loan or other instrument which would entitle any person any option to
receive Equity Shares, as on the date of this Red Herring Prospectus.
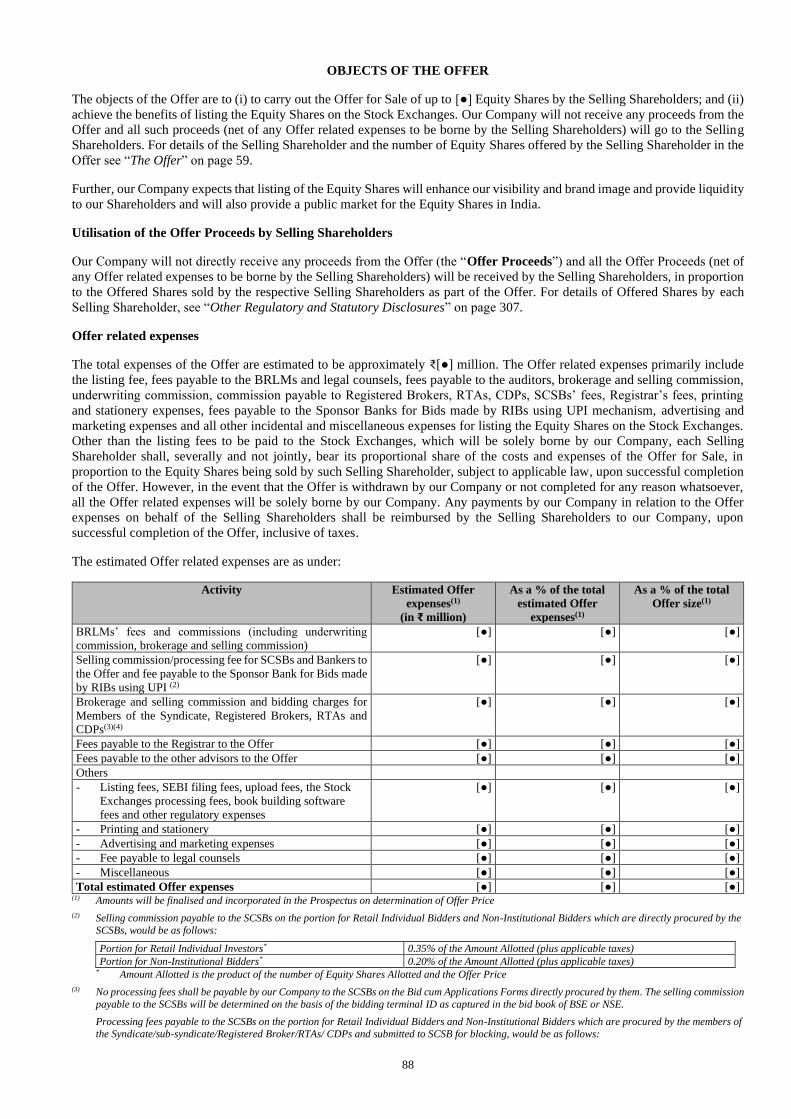
88
OBJECTS OF THE OFFER
The objects of the Offer are to (i) to carry out the Offer for Sale of up to [●] Equity Shares by the Selling Shareholders; and (ii)
achieve the benefits of listing the Equity Shares on the Stock Exchanges. Our Company will not receive any proceeds from the
Offer and all such proceeds (net of any Offer related expenses to be borne by the Selling Shareholders) will go to the Selling
Shareholders. For details of the Selling Shareholder and the number of Equity Shares offered by the Selling Shareholder in the
Offer see “The Offer” on page 59.
Further, our Company expects that listing of the Equity Shares will enhance our visibility and brand image and provide liquidity
to our Shareholders and will also provide a public market for the Equity Shares in India.
Utilisation of the Offer Proceeds by Selling Shareholders
Our Company will not directly receive any proceeds from the Offer (the “Offer Proceeds”) and all the Offer Proceeds (net of
any Offer related expenses to be borne by the Selling Shareholders) will be received by the Selling Shareholders, in proportion
to the Offered Shares sold by the respective Selling Shareholders as part of the Offer. For details of Offered Shares by each
Selling Shareholder, see “Other Regulatory and Statutory Disclosures” on page 307.
Offer related expenses
The total expenses of the Offer are estimated to be approximately ₹[●] million. The Offer related expenses primarily include
the listing fee, fees payable to the BRLMs and legal counsels, fees payable to the auditors, brokerage and selling commission,
underwriting commission, commission payable to Registered Brokers, RTAs, CDPs, SCSBs’ fees, Registrar’s fees, printing
and stationery expenses, fees payable to the Sponsor Banks for Bids made by RIBs using UPI mechanism, advertising and
marketing expenses and all other incidental and miscellaneous expenses for listing the Equity Shares on the Stock Exchanges.
Other than the listing fees to be paid to the Stock Exchanges, which will be solely borne by our Company, each Selling
Shareholder shall, severally and not jointly, bear its proportional share of the costs and expenses of the Offer for Sale, in
proportion to the Equity Shares being sold by such Selling Shareholder, subject to applicable law, upon successful completion
of the Offer. However, in the event that the Offer is withdrawn by our Company or not completed for any reason whatsoever,
all the Offer related expenses will be solely borne by our Company. Any payments by our Company in relation to the Offer
expenses on behalf of the Selling Shareholders shall be reimbursed by the Selling Shareholders to our Company, upon
successful completion of the Offer, inclusive of taxes.
The estimated Offer related expenses are as under:
Activity Estimated Offer
expenses(1)
(in ₹ million)
As a % of the total
estimated Offer
expenses(1)
As a % of the total
Offer size(1)
BRLMs’ fees and commissions (including underwriting
commission, brokerage and selling commission)
[●] [●] [●]
Selling commission/processing fee for SCSBs and Bankers to
the Offer and fee payable to the Sponsor Bank for Bids made
by RIBs using UPI (2)
[●] [●] [●]
Brokerage and selling commission and bidding charges for
Members of the Syndicate, Registered Brokers, RTAs and
CDPs(3)(4)
[●] [●] [●]
Fees payable to the Registrar to the Offer [●] [●] [●]
Fees payable to the other advisors to the Offer [●] [●] [●]
Others
- Listing fees, SEBI filing fees, upload fees, the Stock
Exchanges processing fees, book building software
fees and other regulatory expenses
[●] [●] [●]
- Printing and stationery [●] [●] [●]
- Advertising and marketing expenses [●] [●] [●]
- Fee payable to legal counsels [●] [●] [●]
- Miscellaneous [●] [●] [●]
Total estimated Offer expenses [●] [●] [●] (1) Amounts will be finalised and incorporated in the Prospectus on determination of Offer Price
(2) Selling commission payable to the SCSBs on the portion for Retail Individual Bidders and Non-Institutional Bidders which are directly procured by the
SCSBs, would be as follows:
Portion for Retail Individual Investors* 0.35% of the Amount Allotted (plus applicable taxes)
Portion for Non-Institutional Bidders* 0.20% of the Amount Allotted (plus applicable taxes) * Amount Allotted is the product of the number of Equity Shares Allotted and the Offer Price
(3) No processing fees shall be payable by our Company to the SCSBs on the Bid cum Applications Forms directly procured by them. The selling commission
payable to the SCSBs will be determined on the basis of the bidding terminal ID as captured in the bid book of BSE or NSE.
Processing fees payable to the SCSBs on the portion for Retail Individual Bidders and Non-Institutional Bidders which are procured by the members of
the Syndicate/sub-syndicate/Registered Broker/RTAs/ CDPs and submitted to SCSB for blocking, would be as follows:
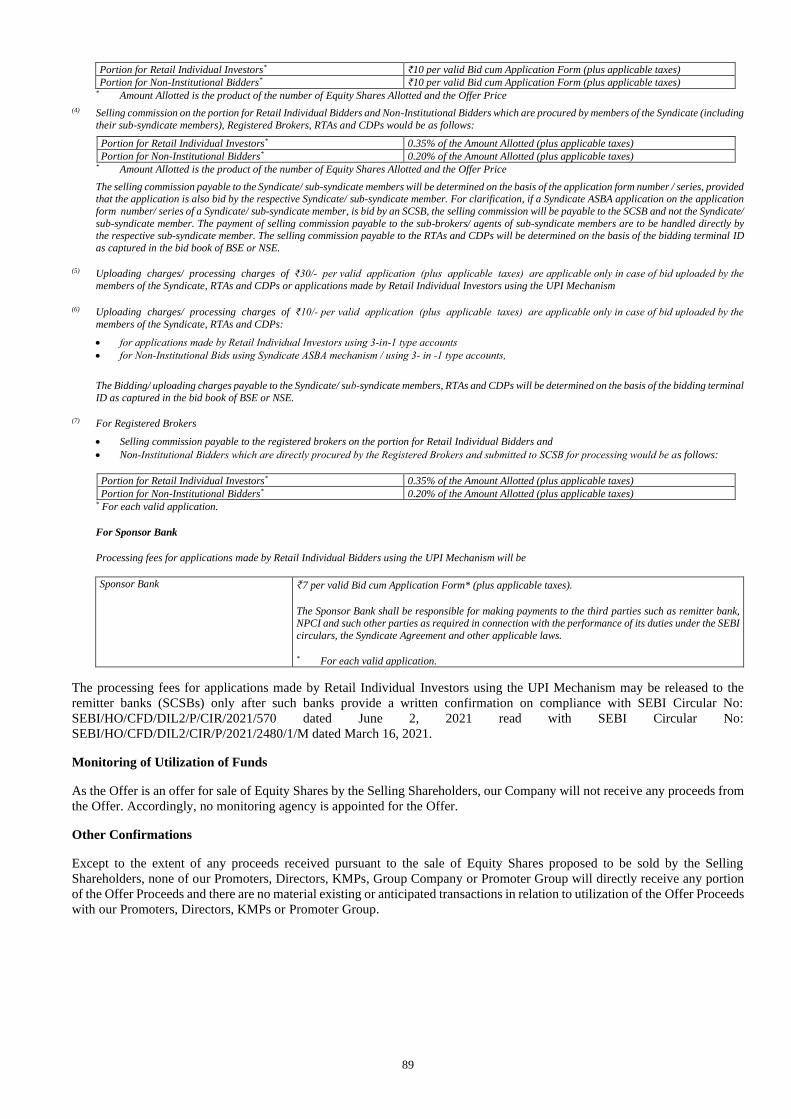
89
Portion for Retail Individual Investors* ₹10 per valid Bid cum Application Form (plus applicable taxes)
Portion for Non-Institutional Bidders* ₹10 per valid Bid cum Application Form (plus applicable taxes) * Amount Allotted is the product of the number of Equity Shares Allotted and the Offer Price
(4) Selling commission on the portion for Retail Individual Bidders and Non-Institutional Bidders which are procured by members of the Syndicate (including
their sub-syndicate members), Registered Brokers, RTAs and CDPs would be as follows:
Portion for Retail Individual Investors* 0.35% of the Amount Allotted (plus applicable taxes)
Portion for Non-Institutional Bidders* 0.20% of the Amount Allotted (plus applicable taxes) * Amount Allotted is the product of the number of Equity Shares Allotted and the Offer Price
The selling commission payable to the Syndicate/ sub-syndicate members will be determined on the basis of the application form number / series, provided that the application is also bid by the respective Syndicate/ sub-syndicate member. For clarification, if a Syndicate ASBA application on the application
form number/ series of a Syndicate/ sub-syndicate member, is bid by an SCSB, the selling commission will be payable to the SCSB and not the Syndicate/
sub-syndicate member. The payment of selling commission payable to the sub-brokers/ agents of sub-syndicate members are to be handled directly by the respective sub-syndicate member. The selling commission payable to the RTAs and CDPs will be determined on the basis of the bidding terminal ID
as captured in the bid book of BSE or NSE.
(5) Uploading charges/ processing charges of ₹30/‐ per valid application (plus applicable taxes) are applicable only in case of bid uploaded by the
members of the Syndicate, RTAs and CDPs or applications made by Retail Individual Investors using the UPI Mechanism
(6) Uploading charges/ processing charges of ₹10/‐ per valid application (plus applicable taxes) are applicable only in case of bid uploaded by the
members of the Syndicate, RTAs and CDPs: • for applications made by Retail Individual Investors using 3‐in‐1 type accounts
• for Non‐Institutional Bids using Syndicate ASBA mechanism / using 3‐ in ‐1 type accounts,
The Bidding/ uploading charges payable to the Syndicate/ sub‐syndicate members, RTAs and CDPs will be determined on the basis of the bidding terminal
ID as captured in the bid book of BSE or NSE.
(7) For Registered Brokers
• Selling commission payable to the registered brokers on the portion for Retail Individual Bidders and
• Non‐Institutional Bidders which are directly procured by the Registered Brokers and submitted to SCSB for processing would be as follows:
Portion for Retail Individual Investors* 0.35% of the Amount Allotted (plus applicable taxes)
Portion for Non-Institutional Bidders* 0.20% of the Amount Allotted (plus applicable taxes) * For each valid application.
For Sponsor Bank
Processing fees for applications made by Retail Individual Bidders using the UPI Mechanism will be
Sponsor Bank ₹7 per valid Bid cum Application Form* (plus applicable taxes).
The Sponsor Bank shall be responsible for making payments to the third parties such as remitter bank, NPCI and such other parties as required in connection with the performance of its duties under the SEBI
circulars, the Syndicate Agreement and other applicable laws.
* For each valid application.
The processing fees for applications made by Retail Individual Investors using the UPI Mechanism may be released to the
remitter banks (SCSBs) only after such banks provide a written confirmation on compliance with SEBI Circular No:
SEBI/HO/CFD/DIL2/P/CIR/2021/570 dated June 2, 2021 read with SEBI Circular No:
SEBI/HO/CFD/DIL2/CIR/P/2021/2480/1/M dated March 16, 2021.
Monitoring of Utilization of Funds
As the Offer is an offer for sale of Equity Shares by the Selling Shareholders, our Company will not receive any proceeds from
the Offer. Accordingly, no monitoring agency is appointed for the Offer.
Other Confirmations
Except to the extent of any proceeds received pursuant to the sale of Equity Shares proposed to be sold by the Selling
Shareholders, none of our Promoters, Directors, KMPs, Group Company or Promoter Group will directly receive any portion
of the Offer Proceeds and there are no material existing or anticipated transactions in relation to utilization of the Offer Proceeds
with our Promoters, Directors, KMPs or Promoter Group.
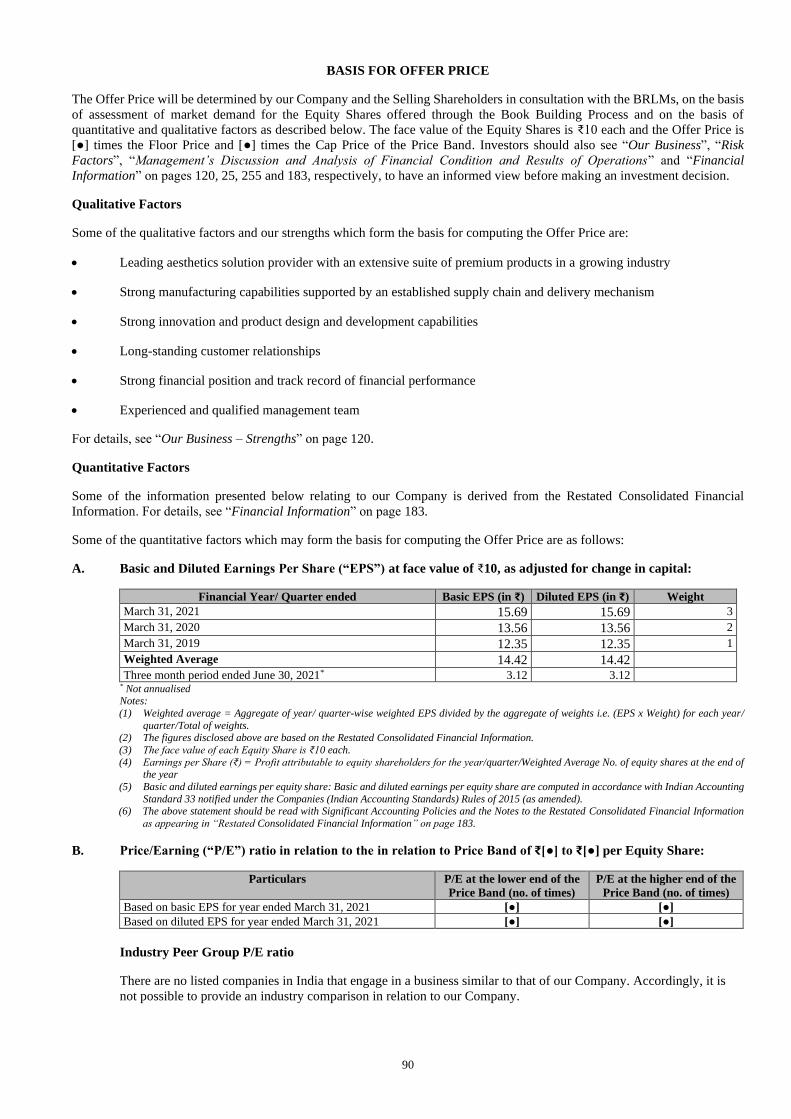
90
BASIS FOR OFFER PRICE
The Offer Price will be determined by our Company and the Selling Shareholders in consultation with the BRLMs, on the basis
of assessment of market demand for the Equity Shares offered through the Book Building Process and on the basis of
quantitative and qualitative factors as described below. The face value of the Equity Shares is ₹10 each and the Offer Price is
[●] times the Floor Price and [●] times the Cap Price of the Price Band. Investors should also see “Our Business”, “Risk
Factors”, “Management’s Discussion and Analysis of Financial Condition and Results of Operations” and “Financial
Information” on pages 120, 25, 255 and 183, respectively, to have an informed view before making an investment decision.
Qualitative Factors
Some of the qualitative factors and our strengths which form the basis for computing the Offer Price are:
• Leading aesthetics solution provider with an extensive suite of premium products in a growing industry
• Strong manufacturing capabilities supported by an established supply chain and delivery mechanism
• Strong innovation and product design and development capabilities
• Long-standing customer relationships
• Strong financial position and track record of financial performance
• Experienced and qualified management team
For details, see “Our Business – Strengths” on page 120.
Quantitative Factors
Some of the information presented below relating to our Company is derived from the Restated Consolidated Financial
Information. For details, see “Financial Information” on page 183.
Some of the quantitative factors which may form the basis for computing the Offer Price are as follows:
A. Basic and Diluted Earnings Per Share (“EPS”) at face value of ₹10, as adjusted for change in capital:
Financial Year/ Quarter ended Basic EPS (in ₹) Diluted EPS (in ₹) Weight
March 31, 2021 15.69 15.69 3
March 31, 2020 13.56 13.56 2
March 31, 2019 12.35 12.35 1
Weighted Average 14.42 14.42
Three month period ended June 30, 2021* 3.12 3.12 * Not annualised Notes:
(1) Weighted average = Aggregate of year/ quarter-wise weighted EPS divided by the aggregate of weights i.e. (EPS x Weight) for each year/
quarter/Total of weights. (2) The figures disclosed above are based on the Restated Consolidated Financial Information.
(3) The face value of each Equity Share is ₹10 each.
(4) Earnings per Share (₹) = Profit attributable to equity shareholders for the year/quarter/Weighted Average No. of equity shares at the end of the year
(5) Basic and diluted earnings per equity share: Basic and diluted earnings per equity share are computed in accordance with Indian Accounting
Standard 33 notified under the Companies (Indian Accounting Standards) Rules of 2015 (as amended). (6) The above statement should be read with Significant Accounting Policies and the Notes to the Restated Consolidated Financial Information
as appearing in “Restated Consolidated Financial Information” on page 183.
B. Price/Earning (“P/E”) ratio in relation to the in relation to Price Band of ₹[●] to ₹[●] per Equity Share:
Particulars P/E at the lower end of the
Price Band (no. of times)
P/E at the higher end of the
Price Band (no. of times)
Based on basic EPS for year ended March 31, 2021 [●] [●]
Based on diluted EPS for year ended March 31, 2021 [●] [●]
Industry Peer Group P/E ratio
There are no listed companies in India that engage in a business similar to that of our Company. Accordingly, it is
not possible to provide an industry comparison in relation to our Company.
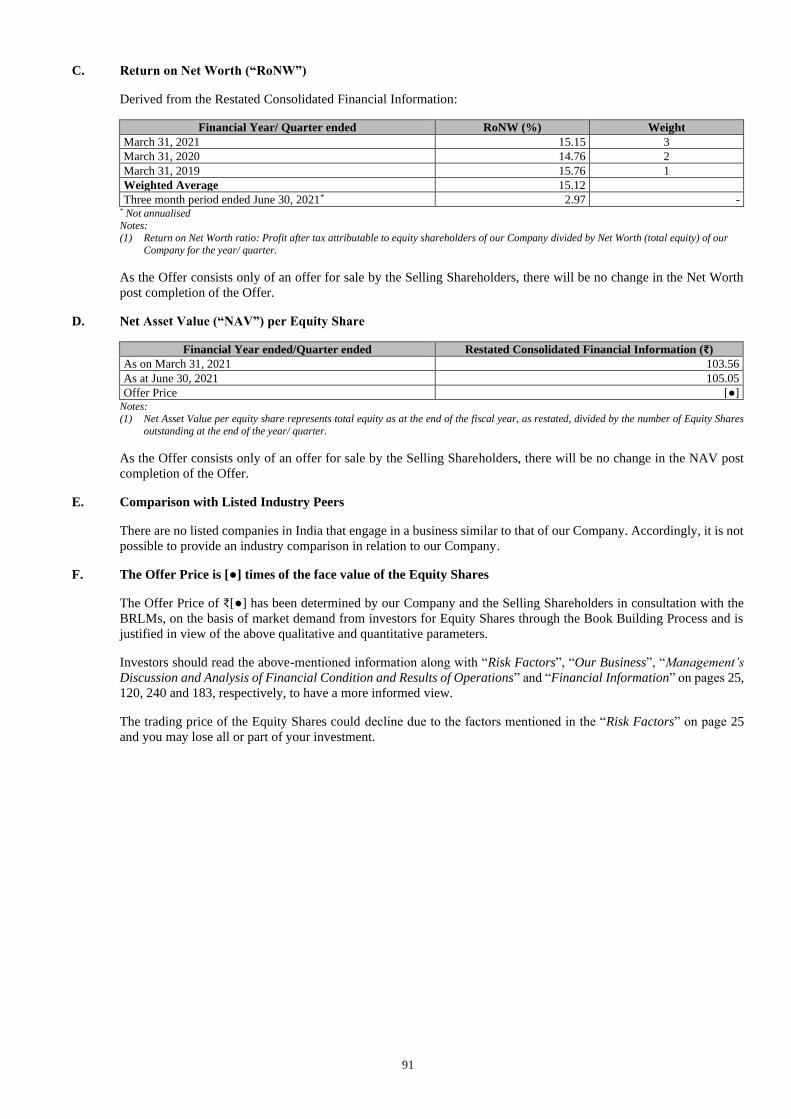
91
C. Return on Net Worth (“RoNW”)
Derived from the Restated Consolidated Financial Information:
Financial Year/ Quarter ended RoNW (%) Weight
March 31, 2021 15.15 3
March 31, 2020 14.76 2
March 31, 2019 15.76 1
Weighted Average 15.12
Three month period ended June 30, 2021* 2.97 - * Not annualised
Notes:
(1) Return on Net Worth ratio: Profit after tax attributable to equity shareholders of our Company divided by Net Worth (total equity) of our
Company for the year/ quarter.
As the Offer consists only of an offer for sale by the Selling Shareholders, there will be no change in the Net Worth
post completion of the Offer.
D. Net Asset Value (“NAV”) per Equity Share
Financial Year ended/Quarter ended Restated Consolidated Financial Information (₹)
As on March 31, 2021 103.56
As at June 30, 2021 105.05
Offer Price [●] Notes:
(1) Net Asset Value per equity share represents total equity as at the end of the fiscal year, as restated, divided by the number of Equity Shares
outstanding at the end of the year/ quarter.
As the Offer consists only of an offer for sale by the Selling Shareholders, there will be no change in the NAV post
completion of the Offer.
E. Comparison with Listed Industry Peers
There are no listed companies in India that engage in a business similar to that of our Company. Accordingly, it is not
possible to provide an industry comparison in relation to our Company.
F. The Offer Price is [●] times of the face value of the Equity Shares
The Offer Price of ₹[●] has been determined by our Company and the Selling Shareholders in consultation with the
BRLMs, on the basis of market demand from investors for Equity Shares through the Book Building Process and is
justified in view of the above qualitative and quantitative parameters.
Investors should read the above-mentioned information along with “Risk Factors”, “Our Business”, “Management’s
Discussion and Analysis of Financial Condition and Results of Operations” and “Financial Information” on pages 25,
120, 240 and 183, respectively, to have a more informed view.
The trading price of the Equity Shares could decline due to the factors mentioned in the “Risk Factors” on page 25
and you may lose all or part of your investment.
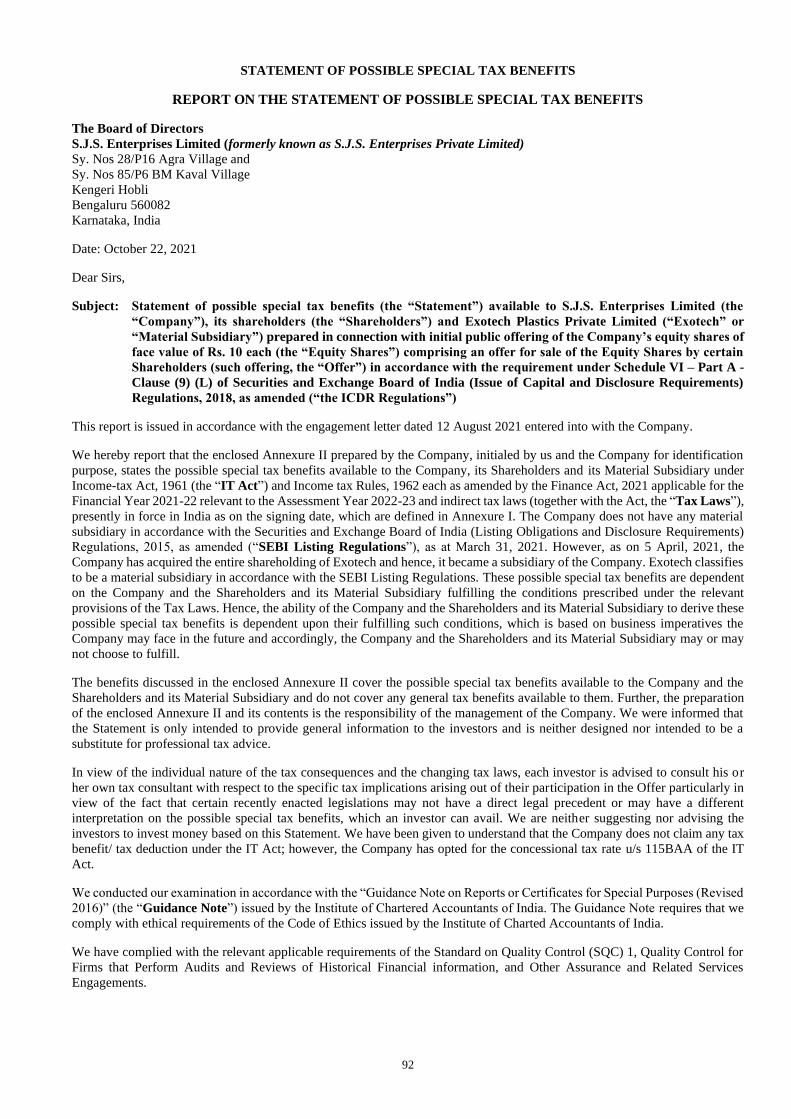
92
STATEMENT OF POSSIBLE SPECIAL TAX BENEFITS
REPORT ON THE STATEMENT OF POSSIBLE SPECIAL TAX BENEFITS
The Board of Directors
S.J.S. Enterprises Limited (formerly known as S.J.S. Enterprises Private Limited)
Sy. Nos 28/P16 Agra Village and
Sy. Nos 85/P6 BM Kaval Village
Kengeri Hobli
Bengaluru 560082
Karnataka, India
Date: October 22, 2021
Dear Sirs,
Subject: Statement of possible special tax benefits (the “Statement”) available to S.J.S. Enterprises Limited (the
“Company”), its shareholders (the “Shareholders”) and Exotech Plastics Private Limited (“Exotech” or
“Material Subsidiary”) prepared in connection with initial public offering of the Company’s equity shares of
face value of Rs. 10 each (the “Equity Shares”) comprising an offer for sale of the Equity Shares by certain
Shareholders (such offering, the “Offer”) in accordance with the requirement under Schedule VI – Part A -
Clause (9) (L) of Securities and Exchange Board of India (Issue of Capital and Disclosure Requirements)
Regulations, 2018, as amended (“the ICDR Regulations”)
This report is issued in accordance with the engagement letter dated 12 August 2021 entered into with the Company.
We hereby report that the enclosed Annexure II prepared by the Company, initialed by us and the Company for identification
purpose, states the possible special tax benefits available to the Company, its Shareholders and its Material Subsidiary under
Income-tax Act, 1961 (the “IT Act”) and Income tax Rules, 1962 each as amended by the Finance Act, 2021 applicable for the
Financial Year 2021-22 relevant to the Assessment Year 2022-23 and indirect tax laws (together with the Act, the “Tax Laws”),
presently in force in India as on the signing date, which are defined in Annexure I. The Company does not have any material
subsidiary in accordance with the Securities and Exchange Board of India (Listing Obligations and Disclosure Requirements)
Regulations, 2015, as amended (“SEBI Listing Regulations”), as at March 31, 2021. However, as on 5 April, 2021, the
Company has acquired the entire shareholding of Exotech and hence, it became a subsidiary of the Company. Exotech classifies
to be a material subsidiary in accordance with the SEBI Listing Regulations. These possible special tax benefits are dependent
on the Company and the Shareholders and its Material Subsidiary fulfilling the conditions prescribed under the relevant
provisions of the Tax Laws. Hence, the ability of the Company and the Shareholders and its Material Subsidiary to derive these
possible special tax benefits is dependent upon their fulfilling such conditions, which is based on business imperatives the
Company may face in the future and accordingly, the Company and the Shareholders and its Material Subsidiary may or may
not choose to fulfill.
The benefits discussed in the enclosed Annexure II cover the possible special tax benefits available to the Company and the
Shareholders and its Material Subsidiary and do not cover any general tax benefits available to them. Further, the preparation
of the enclosed Annexure II and its contents is the responsibility of the management of the Company. We were informed that
the Statement is only intended to provide general information to the investors and is neither designed nor intended to be a
substitute for professional tax advice.
In view of the individual nature of the tax consequences and the changing tax laws, each investor is advised to consult his or
her own tax consultant with respect to the specific tax implications arising out of their participation in the Offer particularly in
view of the fact that certain recently enacted legislations may not have a direct legal precedent or may have a different
interpretation on the possible special tax benefits, which an investor can avail. We are neither suggesting nor advising the
investors to invest money based on this Statement. We have been given to understand that the Company does not claim any tax
benefit/ tax deduction under the IT Act; however, the Company has opted for the concessional tax rate u/s 115BAA of the IT
Act.
We conducted our examination in accordance with the “Guidance Note on Reports or Certificates for Special Purposes (Revised
2016)” (the “Guidance Note”) issued by the Institute of Chartered Accountants of India. The Guidance Note requires that we
comply with ethical requirements of the Code of Ethics issued by the Institute of Charted Accountants of India.
We have complied with the relevant applicable requirements of the Standard on Quality Control (SQC) 1, Quality Control for
Firms that Perform Audits and Reviews of Historical Financial information, and Other Assurance and Related Services
Engagements.
93
We do not express any opinion or provide any assurance as to whether:
i) the Company and the Shareholders and its Material Subsidiary will continue to obtain these possible special tax
benefits in future; or
ii) the conditions prescribed for availing the possible special tax benefits where applicable, have been/would be met
with.
The contents of enclosed Annexure are based on the information, explanation and representations obtained from the Company,
and on the basis of our understanding of the business activities and operations of the Company.
Our views expressed herein are based on the facts and assumptions indicated to us. No assurance is given that the revenue
authorities/ courts will concur with the views expressed herein. Our views are based on the existing provisions of law and its
interpretation, which are subject to change from time to time. We do not assume responsibility to update the views consequent
to such changes. We shall not be liable to the Company for any claims, liabilities or expenses relating to this assignment except
to the extent of fees relating to this assignment, as finally judicially determined to have resulted primarily from bad faith or
intentional misconduct. We will not be liable to any other person in respect of this Statement.
We hereby give consent to include this Statement in the red herring prospectus, and prospectus and in any other material used
in connection with the Offer, and is not to be used, referred to or distributed for any other purpose without our prior written
consent.
for B S R & Co. LLP
Chartered Accountants
ICAI firm registration number: 101248W/ W-100022
Umang Banka
Partner
Membership No.: 223018
ICAI UDIN: 21223018AAAADD2287
Place: Bengaluru
Date: October 22, 2021

94
ANNEXURE I
List of Tax Laws
1. Income-tax Act, 1961 and Income-tax Rules, 1962
2. Central Goods and Services Tax Act, 2017 / the Integrated Goods and Services Tax Act, 2017 and applicable State
Goods and Services Tax Act, 2017
3. Customs Act, 1962
4. Customs Tariff Act, 1975
5. Foreign Trade Policy 2015-20 as extended until 30 September, 2021 vide Notification No 60/2015-20 dated 31 March,
2021

95
ANNEXURE II
ANNEXURE TO THE STATEMENT OF POSSIBLE SPECIAL TAX BENEFITS AVAILABLE TO THE COMPANY,
THE SHAREHOLDERS AND ITS MATERIAL SUBSIDIARY UNDER THE APPLICABLE TAX LAWS
Outlined below are the possible special tax benefits available to the Company and its Shareholders and its Material Subsidiary
under the Tax Laws in force in India (i.e. applicable for the Financial Year 2021-22 relevant to the Assessment Year 2022-23
till the signing date of this annexure). These possible special tax benefits are dependent on the Company or the Shareholders
and its Material Subsidiary fulfilling the conditions prescribed under the Tax Laws. Hence, the ability of the Company or
the Shareholders or its Material Subsidiary to derive the possible special tax benefits is dependent upon fulfilling such
conditions, which are based on business imperatives it faces in the future, it may or may not choose to fulfill.
UNDER THE TAX LAWS
A. Special tax benefits available to the Company
The Company is neither eligible nor is availing any special corporate tax benefits under the Tax Laws identified in
Annexure I above.
The Company is eligible to avail the following indirect tax benefits under the Tax Laws identified in Annexure I above:
• Duty Drawback u/s 75 of Customs Act 1962
• Duty Drawback u/s 74 of Customs Act 1962
• Duty Free Import Authorisation (‘DFIA’) covered in Chapter 4 of Duty Exemption/Remission
• Remission of Duties and Taxes on Exported Products ('RODTEP') notified vide Notification No -19/ 2015-
2020 dated 17 August 2021, effective from 1 January 2021
B. Special tax benefits available to Shareholders
The shareholders of the Company are not eligible to any special tax benefits under the Taw Laws identified in
Annexure I above.
C. Special tax benefits available to the Material Subsidiary
The Material Subsidiary is not eligible for any special tax benefits under the Taw Laws identified in Annexure I
above.
NOTES:
1. The above is as per the prevalent tax laws as on date.
2. We have not considered the general tax benefits available to the Company, Shareholders or its Material Subsidiary.
3. The above Statement sets out the provisions of Tax Laws in a summary manner only and is not a complete analysis or
listing of all the existing and potential tax consequences of the purchase, ownership and disposal of Equity Shares.
4. In respect of non-residents, the tax rates and the consequent taxation mentioned above shall be further subject to any
benefits available under the applicable double taxation avoidance agreement, if any, between India and the country in
which the non-resident has fiscal domicile.
5. We have not considered any benefits provided by the Central / any State Government under any Industrial Policy /
Investment Promotion schemes.
For S.J.S. Enterprises Limited
Authorized Signatory
Place: Bengaluru
Date: October 22, 2021

96
SECTION IV: ABOUT OUR COMPANY
INDUSTRY OVERVIEW
The information in this section is derived from the report titled “Assessment of Select Aesthetic Components” issued in June 2021
(the “CRISIL Report”), prepared by CRISIL Research, a division of CRISIL Limited (“CRISIL”) and available at
www.sjsindia.com/investors.html#disclosures. Certain data and information as of October 1, 2021 pertaining to affordable housing
progress, FY 2021 production and sales figures for passenger vehicles, two wheelers and consumer durable, export figures for vehicle
segments for FY 2021, consumer durable market insights for FY 2021, macroeconomic parameters, near term outlook have been
updated in the CRISIL Report. We commissioned the CRISIL Report on February 26, 2021, which is a paid report, for the purpose of
confirming our understanding of the industry exclusively in connection with the Offer for an agreed fees. Neither we, nor any of the
Book Running Lead Managers, nor any other person connected with the Offer has verified the information in the CRISIL Report.
Further, the CRISIL Report was prepared based on publicly available information, data and statistics as at specific dates and may no
longer be current or reflect current trends. The CRISIL Report may also be based on sources that base their information on estimates,
projections, forecasts and assumptions that may prove to be incorrect.
CRISIL has advised that, while it has taken due care and caution in preparing the CRISIL Report based on the information obtained
by CRISIL from sources which it considers reliable (“Data”), it does not guarantee the accuracy, adequacy or completeness of the
Data and is not responsible for any errors or omissions or for the results obtained from the use of Data. Further, the CRISIL Report
is not a recommendation to invest or disinvest in any entity covered in the CRISIL Report and no part of the CRISIL Report should be
construed as an expert advice or investment advice or any form of investment banking within the meaning of any law or regulation.
CRISIL especially states that it has no liability whatsoever to the subscribers, users, transmitters or distributors of the CRISIL Report.
Without limiting the generality of the foregoing, nothing in the CRISIL Report is to be construed as CRISIL providing or intending to
provide any services in jurisdictions where CRISIL does not have the necessary permission and/or registration to carry out its business
activities in this regard. Our Company will be responsible for ensuring compliances and consequences of non-compliances for use of
the CRISIL Report or part thereof outside India. CRISIL Research operates independently of, and does not have access to information
obtained by CRISIL’s Ratings Division or CRISIL Risk and Infrastructure Solutions Ltd. (“CRIS”), which may, in their regular
operations, obtain information of a confidential nature. The views expressed in the CRISIL Report are that of CRISIL Research and
not of CRISIL’s Ratings Division or CRIS. No part of the CRISIL Report may be published/reproduced in any form without CRISIL’s
prior written approval.
The information in the CRISIL Report pertaining to forecasts in the aesthetics industry are restricted to the Indian market. The global
aesthetics industry is expected to follow a similar trend. In addition, the market sizing and outlook of relevant decorative aesthetics
in the CRISIL Report has been restricted to the two-wheelers, passenger vehicles and large consumer durables industries. The overall
aesthetics industry, in India and globally, is very large and aesthetic products find applications across a wide range of industries.
Accordingly, investment decisions should not be based solely on the information in this section.
OVERVIEW OF THE DECORATIVE AESTHETICS INDUSTRY
The manufacturers of discretionary consumption products such as automobiles and consumer durables strive hard to bring
value-for-money products in the market to retain and expand their market shares. While product features and price are key
elements, product aesthetics are critical in creating brand value for original equipment manufacturers (“OEMs”). Consumers
give preference to products that are not only value-for-money but also aesthetically superior. Aesthetically superior products
hold strong relevance for discretionary consumption products, such as automobiles and consumer durables. (Source: CRISIL Report)
Key consumer discretionary products where decorative aesthetic components are widely used include:
• two-wheelers;
• passenger vehicles;
• other automobile segments such as three wheelers, commercial vehicles and tractors or farm equipment;
• large consumer durables such as washing machines, refrigerators, room air conditioners (ACs), televisions (TVs);
• small consumer durables and electronics such as fans, switchgears, water heaters, air purifiers, vacuum cleaners, hand
free sanitizer dispensers, other consumer electronics, mobiles, laptops, desktops, power banks and trimmers;
• kitchen appliances such as mixers and grinders, water purifiers and microwave ovens;
• medical devices and medical electronic devices such as x-ray machines, CT scan machines, MRI scan machines, self-care
glucometers, blood pressure monitors and oximeters; and
• industrial equipment (such as ATMs) and fast moving consumer goods (FMCG) (containers for shampoo bottles, compact,
lipsticks etc.).
(Source: CRISIL Report)
Decorative aesthetic components in consumer discretionary products include logos, stickers, decals, appliques, overlays,
chrome plated parts, IML/ IMD, IME etc. A few components such as appliques, overlays and optical plastics are also deployed
for their functional attributes in addition to their role in increasing aesthetic value of a product. (Source: CRISIL Report)
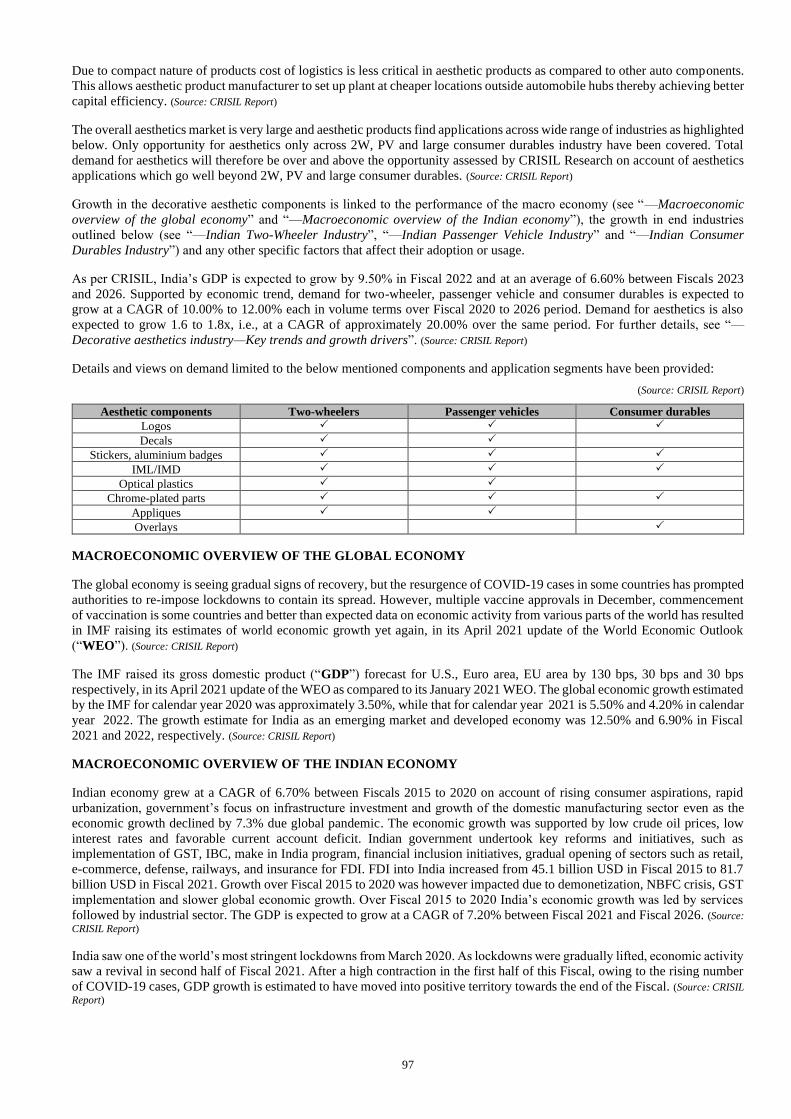
97
Due to compact nature of products cost of logistics is less critical in aesthetic products as compared to other auto components.
This allows aesthetic product manufacturer to set up plant at cheaper locations outside automobile hubs thereby achieving better
capital efficiency. (Source: CRISIL Report)
The overall aesthetics market is very large and aesthetic products find applications across wide range of industries as highlighted
below. Only opportunity for aesthetics only across 2W, PV and large consumer durables industry have been covered. Total
demand for aesthetics will therefore be over and above the opportunity assessed by CRISIL Research on account of aesthetics
applications which go well beyond 2W, PV and large consumer durables. (Source: CRISIL Report)
Growth in the decorative aesthetic components is linked to the performance of the macro economy (see “—Macroeconomic
overview of the global economy” and “—Macroeconomic overview of the Indian economy”), the growth in end industries
outlined below (see “—Indian Two-Wheeler Industry”, “—Indian Passenger Vehicle Industry” and “—Indian Consumer
Durables Industry”) and any other specific factors that affect their adoption or usage.
As per CRISIL, India’s GDP is expected to grow by 9.50% in Fiscal 2022 and at an average of 6.60% between Fiscals 2023
and 2026. Supported by economic trend, demand for two-wheeler, passenger vehicle and consumer durables is expected to
grow at a CAGR of 10.00% to 12.00% each in volume terms over Fiscal 2020 to 2026 period. Demand for aesthetics is also
expected to grow 1.6 to 1.8x, i.e., at a CAGR of approximately 20.00% over the same period. For further details, see “—
Decorative aesthetics industry—Key trends and growth drivers”. (Source: CRISIL Report)
Details and views on demand limited to the below mentioned components and application segments have been provided:
(Source: CRISIL Report)
Aesthetic components Two-wheelers Passenger vehicles Consumer durables
Logos
Decals
Stickers, aluminium badges
IML/IMD
Optical plastics
Chrome-plated parts
Appliques
Overlays
MACROECONOMIC OVERVIEW OF THE GLOBAL ECONOMY
The global economy is seeing gradual signs of recovery, but the resurgence of COVID-19 cases in some countries has prompted
authorities to re-impose lockdowns to contain its spread. However, multiple vaccine approvals in December, commencement
of vaccination is some countries and better than expected data on economic activity from various parts of the world has resulted
in IMF raising its estimates of world economic growth yet again, in its April 2021 update of the World Economic Outlook
(“WEO”). (Source: CRISIL Report)
The IMF raised its gross domestic product (“GDP”) forecast for U.S., Euro area, EU area by 130 bps, 30 bps and 30 bps
respectively, in its April 2021 update of the WEO as compared to its January 2021 WEO. The global economic growth estimated
by the IMF for calendar year 2020 was approximately 3.50%, while that for calendar year 2021 is 5.50% and 4.20% in calendar
year 2022. The growth estimate for India as an emerging market and developed economy was 12.50% and 6.90% in Fiscal
2021 and 2022, respectively. (Source: CRISIL Report)
MACROECONOMIC OVERVIEW OF THE INDIAN ECONOMY
Indian economy grew at a CAGR of 6.70% between Fiscals 2015 to 2020 on account of rising consumer aspirations, rapid
urbanization, government’s focus on infrastructure investment and growth of the domestic manufacturing sector even as the
economic growth declined by 7.3% due global pandemic. The economic growth was supported by low crude oil prices, low
interest rates and favorable current account deficit. Indian government undertook key reforms and initiatives, such as
implementation of GST, IBC, make in India program, financial inclusion initiatives, gradual opening of sectors such as retail,
e-commerce, defense, railways, and insurance for FDI. FDI into India increased from 45.1 billion USD in Fiscal 2015 to 81.7
billion USD in Fiscal 2021. Growth over Fiscal 2015 to 2020 was however impacted due to demonetization, NBFC crisis, GST
implementation and slower global economic growth. Over Fiscal 2015 to 2020 India’s economic growth was led by services
followed by industrial sector. The GDP is expected to grow at a CAGR of 7.20% between Fiscal 2021 and Fiscal 2026. (Source:
CRISIL Report)
India saw one of the world’s most stringent lockdowns from March 2020. As lockdowns were gradually lifted, economic activity
saw a revival in second half of Fiscal 2021. After a high contraction in the first half of this Fiscal, owing to the rising number
of COVID-19 cases, GDP growth is estimated to have moved into positive territory towards the end of the Fiscal. (Source: CRISIL
Report)
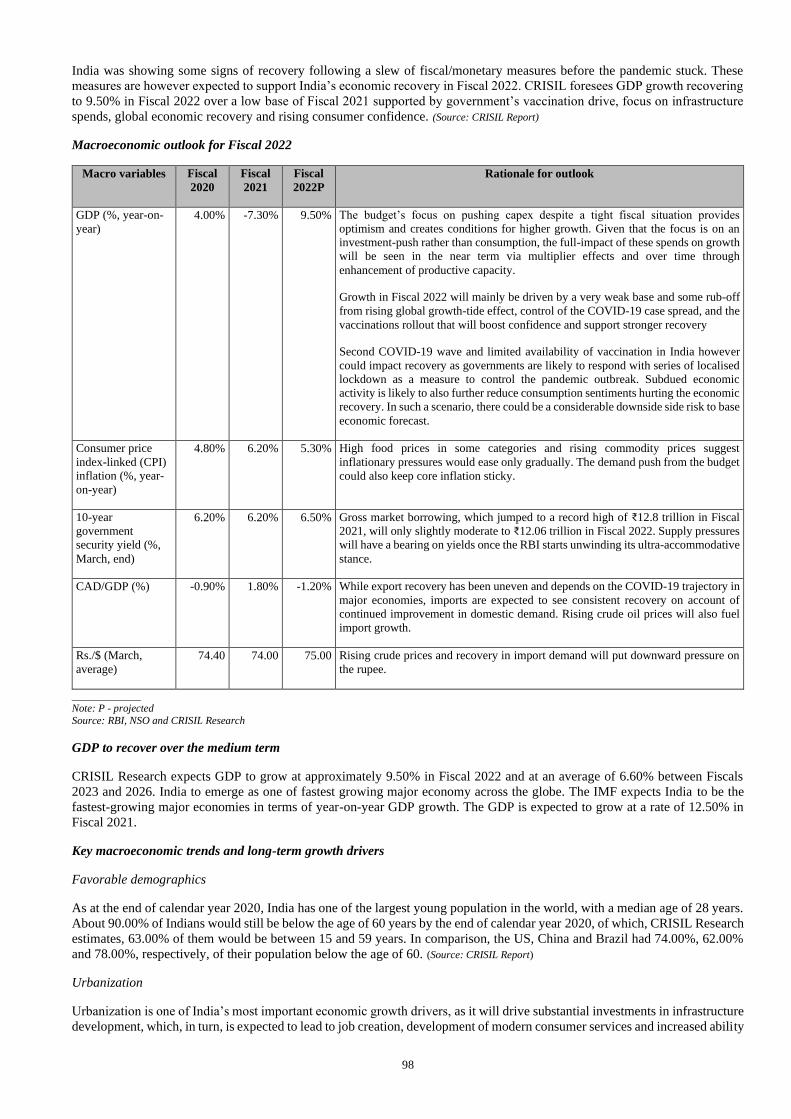
98
India was showing some signs of recovery following a slew of fiscal/monetary measures before the pandemic stuck. These
measures are however expected to support India’s economic recovery in Fiscal 2022. CRISIL foresees GDP growth recovering
to 9.50% in Fiscal 2022 over a low base of Fiscal 2021 supported by government’s vaccination drive, focus on infrastructure
spends, global economic recovery and rising consumer confidence. (Source: CRISIL Report)
Macroeconomic outlook for Fiscal 2022
Macro variables Fiscal
2020
Fiscal
2021
Fiscal
2022P
Rationale for outlook
GDP (%, year-on-
year)
4.00% -7.30% 9.50% The budget’s focus on pushing capex despite a tight fiscal situation provides
optimism and creates conditions for higher growth. Given that the focus is on an
investment-push rather than consumption, the full-impact of these spends on growth
will be seen in the near term via multiplier effects and over time through
enhancement of productive capacity.
Growth in Fiscal 2022 will mainly be driven by a very weak base and some rub-off
from rising global growth-tide effect, control of the COVID-19 case spread, and the
vaccinations rollout that will boost confidence and support stronger recovery
Second COVID-19 wave and limited availability of vaccination in India however
could impact recovery as governments are likely to respond with series of localised
lockdown as a measure to control the pandemic outbreak. Subdued economic
activity is likely to also further reduce consumption sentiments hurting the economic
recovery. In such a scenario, there could be a considerable downside side risk to base
economic forecast.
Consumer price
index-linked (CPI)
inflation (%, year-
on-year)
4.80% 6.20% 5.30% High food prices in some categories and rising commodity prices suggest
inflationary pressures would ease only gradually. The demand push from the budget
could also keep core inflation sticky.
10-year
government
security yield (%,
March, end)
6.20% 6.20% 6.50% Gross market borrowing, which jumped to a record high of ₹12.8 trillion in Fiscal
2021, will only slightly moderate to ₹12.06 trillion in Fiscal 2022. Supply pressures
will have a bearing on yields once the RBI starts unwinding its ultra-accommodative
stance.
CAD/GDP (%) -0.90% 1.80% -1.20% While export recovery has been uneven and depends on the COVID-19 trajectory in
major economies, imports are expected to see consistent recovery on account of
continued improvement in domestic demand. Rising crude oil prices will also fuel
import growth.
Rs./$ (March,
average)
74.40 74.00 75.00 Rising crude prices and recovery in import demand will put downward pressure on
the rupee.
_____________
Note: P - projected
Source: RBI, NSO and CRISIL Research
GDP to recover over the medium term
CRISIL Research expects GDP to grow at approximately 9.50% in Fiscal 2022 and at an average of 6.60% between Fiscals
2023 and 2026. India to emerge as one of fastest growing major economy across the globe. The IMF expects India to be the
fastest-growing major economies in terms of year-on-year GDP growth. The GDP is expected to grow at a rate of 12.50% in
Fiscal 2021.
Key macroeconomic trends and long-term growth drivers
Favorable demographics
As at the end of calendar year 2020, India has one of the largest young population in the world, with a median age of 28 years.
About 90.00% of Indians would still be below the age of 60 years by the end of calendar year 2020, of which, CRISIL Research
estimates, 63.00% of them would be between 15 and 59 years. In comparison, the US, China and Brazil had 74.00%, 62.00%
and 78.00%, respectively, of their population below the age of 60. (Source: CRISIL Report)
Urbanization
Urbanization is one of India’s most important economic growth drivers, as it will drive substantial investments in infrastructure
development, which, in turn, is expected to lead to job creation, development of modern consumer services and increased ability
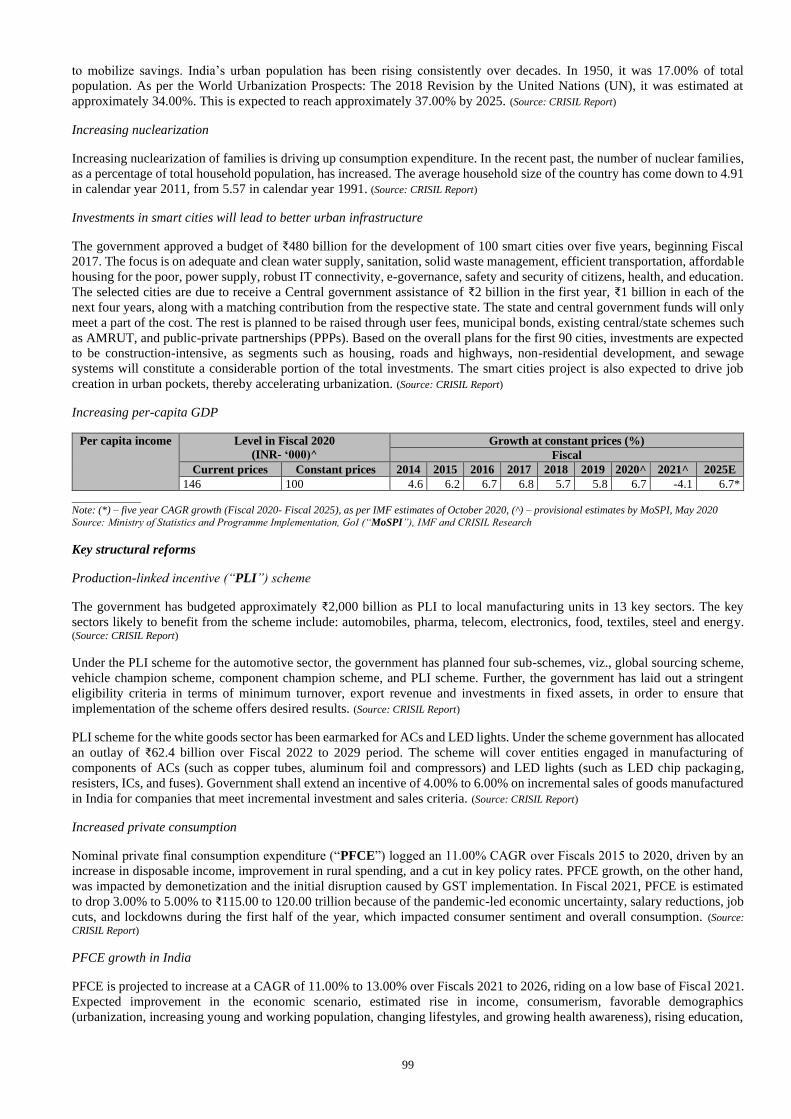
99
to mobilize savings. India’s urban population has been rising consistently over decades. In 1950, it was 17.00% of total
population. As per the World Urbanization Prospects: The 2018 Revision by the United Nations (UN), it was estimated at
approximately 34.00%. This is expected to reach approximately 37.00% by 2025. (Source: CRISIL Report)
Increasing nuclearization
Increasing nuclearization of families is driving up consumption expenditure. In the recent past, the number of nuclear families,
as a percentage of total household population, has increased. The average household size of the country has come down to 4.91
in calendar year 2011, from 5.57 in calendar year 1991. (Source: CRISIL Report)
Investments in smart cities will lead to better urban infrastructure
The government approved a budget of ₹480 billion for the development of 100 smart cities over five years, beginning Fiscal
2017. The focus is on adequate and clean water supply, sanitation, solid waste management, efficient transportation, affordable
housing for the poor, power supply, robust IT connectivity, e-governance, safety and security of citizens, health, and education.
The selected cities are due to receive a Central government assistance of ₹2 billion in the first year, ₹1 billion in each of the
next four years, along with a matching contribution from the respective state. The state and central government funds will only
meet a part of the cost. The rest is planned to be raised through user fees, municipal bonds, existing central/state schemes such
as AMRUT, and public-private partnerships (PPPs). Based on the overall plans for the first 90 cities, investments are expected
to be construction-intensive, as segments such as housing, roads and highways, non-residential development, and sewage
systems will constitute a considerable portion of the total investments. The smart cities project is also expected to drive job
creation in urban pockets, thereby accelerating urbanization. (Source: CRISIL Report)
Increasing per-capita GDP
Per capita income Level in Fiscal 2020
(INR- ‘000)^
Growth at constant prices (%)
Fiscal
Current prices Constant prices 2014 2015 2016 2017 2018 2019 2020^ 2021^ 2025E
146 100 4.6 6.2 6.7 6.8 5.7 5.8 6.7 -4.1 6.7* _____________
Note: (*) – five year CAGR growth (Fiscal 2020- Fiscal 2025), as per IMF estimates of October 2020, (^) – provisional estimates by MoSPI, May 2020
Source: Ministry of Statistics and Programme Implementation, GoI (“MoSPI”), IMF and CRISIL Research
Key structural reforms
Production-linked incentive (“PLI”) scheme
The government has budgeted approximately ₹2,000 billion as PLI to local manufacturing units in 13 key sectors. The key
sectors likely to benefit from the scheme include: automobiles, pharma, telecom, electronics, food, textiles, steel and energy. (Source: CRISIL Report)
Under the PLI scheme for the automotive sector, the government has planned four sub-schemes, viz., global sourcing scheme,
vehicle champion scheme, component champion scheme, and PLI scheme. Further, the government has laid out a stringent
eligibility criteria in terms of minimum turnover, export revenue and investments in fixed assets, in order to ensure that
implementation of the scheme offers desired results. (Source: CRISIL Report)
PLI scheme for the white goods sector has been earmarked for ACs and LED lights. Under the scheme government has allocated
an outlay of ₹62.4 billion over Fiscal 2022 to 2029 period. The scheme will cover entities engaged in manufacturing of
components of ACs (such as copper tubes, aluminum foil and compressors) and LED lights (such as LED chip packaging,
resisters, ICs, and fuses). Government shall extend an incentive of 4.00% to 6.00% on incremental sales of goods manufactured
in India for companies that meet incremental investment and sales criteria. (Source: CRISIL Report)
Increased private consumption
Nominal private final consumption expenditure (“PFCE”) logged an 11.00% CAGR over Fiscals 2015 to 2020, driven by an
increase in disposable income, improvement in rural spending, and a cut in key policy rates. PFCE growth, on the other hand,
was impacted by demonetization and the initial disruption caused by GST implementation. In Fiscal 2021, PFCE is estimated
to drop 3.00% to 5.00% to ₹115.00 to 120.00 trillion because of the pandemic-led economic uncertainty, salary reductions, job
cuts, and lockdowns during the first half of the year, which impacted consumer sentiment and overall consumption. (Source:
CRISIL Report)
PFCE growth in India
PFCE is projected to increase at a CAGR of 11.00% to 13.00% over Fiscals 2021 to 2026, riding on a low base of Fiscal 2021.
Expected improvement in the economic scenario, estimated rise in income, consumerism, favorable demographics
(urbanization, increasing young and working population, changing lifestyles, and growing health awareness), rising education,
100
and the government’s focus on manufacturing, infrastructure, skill development, and employment creation will drive
consumption. (Source: CRISIL Report)
Crude prices
Prices to remain elevated through 2021; to stabilize in approximately US$40.00 to US$45.00 range until 2025
Crude oil prices declined nearly 35.00% Year-on-year to US$42.30 per barrel in calendar year 2020, given the global oil demand
contraction on account of COVID-19. The oil demand loss was substantial in the second quarter of 2020. Thereafter, although
global demand continued to contract, the momentum of decline reduced. In calendar year 2021, oil prices are expected to
increase to $58.00 to $63.00 per barrel primarily on account of significant production cuts by OPEC+ supported by recovery in
demand. Prices are expected to be approximately US$40 to US$45 per barrel in the next 4 to 5 years as oil demand would
remain slow on account of declining global economic growth and fuel diversification. As all producing nations have heavily
invested in the upstream sector, any long-term pact to manage oil supply would not be feasible for longer duration. Moreover,
competition from alternative technologies is expected to play an important role in energy dynamics and significantly impact
crude oil demand from the road transport segment. This is especially in the Organization for Economic Cooperation and
Development (“OECD”) and a few non-OECD countries such as China and India, given the aggressive government push. In
the long run, demand is expected to see slower growth considering consumption from road transport would remain sensitive to
electric vehicle expansion. This would be further impacted by global economic conditions and trade war among major
economies. (Source: CRISIL Report)
Impact of budget
Automotive sector
(i) PVs over 20 years old are quite limited in the population, while more incentives would be needed to promote scrapping of
CVs over 15 years. Without an incentive, CRISIL Research does not see the scheme providing impetus to CV sales; (ii) the
higher import duty for select auto components is in line with the focus on localization and the recently introduced PLI scheme.
Given that average localization for automobile OEMs is approximately 90.00%, only those with lower localization, especially
the large car and high-end SUV makers (representing more than 15.00% of PV sales), are expected to see cost escalation; (iii)
CV demand, especially for tippers, will get some support from construction-led infrastructure push in sectors such as roads and
urban infrastructure; (iv) lower ADD/CVD on steel to reduce metal prices, leading to lower input costs for automobile OEMs;
(v) considering average state transport undertaking purchases (including hire purchases) over the past five years at
approximately 10,500 units, a ₹180.00 billion outlay to acquire and operate over 20,000 buses should support bus demand. It
is important to understand the modalities of the scheme and the duration over which the procurement will be spread; and (vi)
change in customs duty on tyre raw materials to lead to a net increase in tyre input cost. This is expected to be passed through. (Source: CRISIL Report)
Electronics and consumer durable sector
Increased custom duty on mobile components, printed circuit board assembly, compressors used in air-conditioning and
refrigerating equipment, inputs and parts of LED lights or fixtures to promote local manufacturing of consumer, electronics and
key components in India over mid to long term. (Source: CRISIL Report)
INDIAN TWO-WHEELER INDUSTRY
Indian two-wheeler industry review
Production volume
India is one of the largest producer of two-wheeler vehicles globally. The two wheelers segment also dominates the Indian
automobile industry accounting for approximately 80.00% of industry output in volume terms. The domestic two-wheeler
production, remained flat between Fiscals 2016 and 2021, with a large part of the subdued performance because of lower output
in Fiscal 2020, owing to transition to Bharat Stage (“BS”)-VI norms, and challenges due to the impact of COVID-19 pandemic
in Fiscal 2021. However, during Fiscals 2016 to 2019, the industry posted a growth of 9.00% CAGR, propelled by good
monsoons, favorable economic situation, and rising exports. (Source: CRISIL Report)
Two-wheeler production volume development
The two-wheeler production increased at a CAGR of 9.00% between Fiscals 2016 and Fiscal 2019. However, the production
declined at a CAGR of 13.00% between Fiscals 2020 and 2021. (Source: CRISIL Report)
Domestic sales vis-à-vis exports
The Indian two-wheeler industry is primarily domestic, with domestic sales accounting for approximately 86.00% share of
overall two-wheeler sales in the past five years. However, over the years, certain manufacturers, have been expanding their

101
geographical footprint. Also, joint ventures with global brands, and catering to the global demand of these brands from India,
have given an additional thrust to two-wheeler exports. (Source: CRISIL Report)
Two-wheeler domestic sales and exports
The two-wheeler domestic sales and exports increased at a CAGR of 9.00% between Fiscals 2016 and Fiscal 2019. However,
the sales and exports declined at a CAGR of 13.00% between Fiscals 2020 and 2021. (Source: CRISIL Report)
Share of key export destinations
In Fiscal 2021, two-wheeler exports were as follows (i) 55.00% to Africa; (ii) 18.00% to Asia; (iii) 23.00% to Latin America;
(iv) 3.00% to Middle East; and (v) 1.00% to Europe. (Source: CRISIL Report)
Production split by OEMs
Competition in the two-wheeler industry has intensified across all segments over the past few years, owing to factors such as
capacity additions, expansion of dealership network and model launches at competitive price points. Players such as Honda,
TVS and Royal Enfield have been steadily gaining market share, heightening competitive intensity over the past few years. The
trend is expected to continue, with the premium motorbikes and 125 cc scooters segments tipped to witness most of the action
in the upcoming few years. (Source: CRISIL Report)
Market share development
_____________ Note: Others include India Yamaha Motor Private Limited, Royal Enfield Motors, Suzuki Motorcycle India Private Limited, Piaggio Vehicles Private Limited,
Harley-Davidson (H-D Motor Company India Private Limited), India Kawasaki Motors Private Limited, Triumph Motorcycles (India) Private Limited,
Mahindra & Mahindra Limited
Source: Society of Indian Automobile Manufacturers (SIAM), Society of Manufacturers of Electric Vehicles (SMEV) and CRISIL Research
Key domestic regulations
The Indian government has been taking aggressive steps to converge emission standards with global norms. In February 2016,
it decided to skip BS-V norms and directly mandate BS-VI norms. Compliance with the latest emission standards requires
improvement mainly in the exhaust system, thereby increasing the prices of the two-wheeler. (Source: CRISIL Report)
35% 31% 32%
24%24% 21%
18%19% 20%
13% 15% 16%
10% 12% 11%
18.9 21.2 18.5
FY 2016 FY 2020 FY 2021
Hero MotoCorp Ltd. Honda Motorcycle & Scooter India (Pvt) Ltd Bajaj Auto Ltd. TVS Motor Company Ltd. Others
in million
units
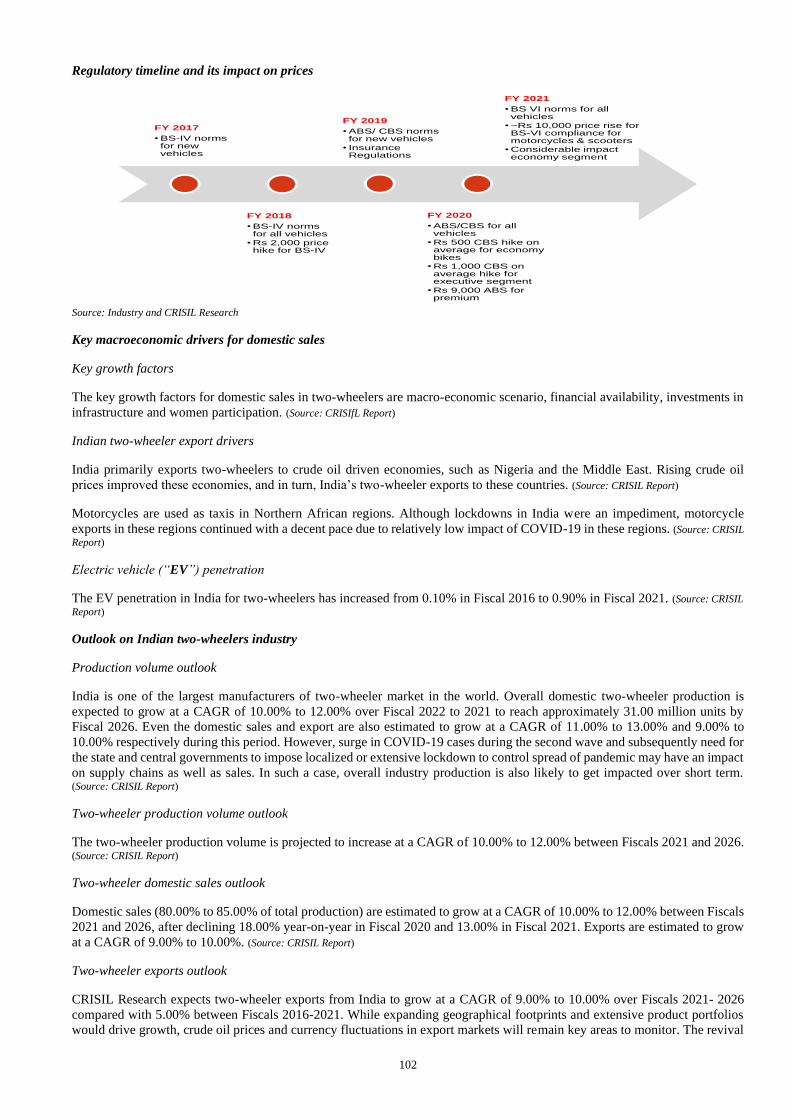
102
Regulatory timeline and its impact on prices
Source: Industry and CRISIL Research
Key macroeconomic drivers for domestic sales
Key growth factors
The key growth factors for domestic sales in two-wheelers are macro-economic scenario, financial availability, investments in
infrastructure and women participation. (Source: CRISIfL Report)
Indian two-wheeler export drivers
India primarily exports two-wheelers to crude oil driven economies, such as Nigeria and the Middle East. Rising crude oil
prices improved these economies, and in turn, India’s two-wheeler exports to these countries. (Source: CRISIL Report)
Motorcycles are used as taxis in Northern African regions. Although lockdowns in India were an impediment, motorcycle
exports in these regions continued with a decent pace due to relatively low impact of COVID-19 in these regions. (Source: CRISIL
Report)
Electric vehicle (“EV”) penetration
The EV penetration in India for two-wheelers has increased from 0.10% in Fiscal 2016 to 0.90% in Fiscal 2021. (Source: CRISIL
Report)
Outlook on Indian two-wheelers industry
Production volume outlook
India is one of the largest manufacturers of two-wheeler market in the world. Overall domestic two-wheeler production is
expected to grow at a CAGR of 10.00% to 12.00% over Fiscal 2022 to 2021 to reach approximately 31.00 million units by
Fiscal 2026. Even the domestic sales and export are also estimated to grow at a CAGR of 11.00% to 13.00% and 9.00% to
10.00% respectively during this period. However, surge in COVID-19 cases during the second wave and subsequently need for
the state and central governments to impose localized or extensive lockdown to control spread of pandemic may have an impact
on supply chains as well as sales. In such a case, overall industry production is also likely to get impacted over short term. (Source: CRISIL Report)
Two-wheeler production volume outlook
The two-wheeler production volume is projected to increase at a CAGR of 10.00% to 12.00% between Fiscals 2021 and 2026. (Source: CRISIL Report)
Two-wheeler domestic sales outlook
Domestic sales (80.00% to 85.00% of total production) are estimated to grow at a CAGR of 10.00% to 12.00% between Fiscals
2021 and 2026, after declining 18.00% year-on-year in Fiscal 2020 and 13.00% in Fiscal 2021. Exports are estimated to grow
at a CAGR of 9.00% to 10.00%. (Source: CRISIL Report)
Two-wheeler exports outlook
CRISIL Research expects two-wheeler exports from India to grow at a CAGR of 9.00% to 10.00% over Fiscals 2021- 2026
compared with 5.00% between Fiscals 2016-2021. While expanding geographical footprints and extensive product portfolios
would drive growth, crude oil prices and currency fluctuations in export markets will remain key areas to monitor. The revival
FY 2017
•BS-IV norms for new vehicles
FY 2018
•BS-IV norms for all vehicles
•Rs 2,000 price hike for BS-IV
FY 2019
•ABS/ CBS norms for new vehicles
• Insurance Regulations
FY 2020
•ABS/CBS for all vehicles
•Rs 500 CBS hike on average for economy bikes
•Rs 1,000 CBS on average hike for executive segment
•Rs 9,000 ABS for premium
FY 2021
•BS VI norms for all vehicles
•~Rs 10,000 price rise for BS-VI compliance for motorcycles & scooters
•Considerable impact economy segment
103
in the African economy is expected to lift exports in the long term. Moreover, government initiatives to make India an exports
hub, along with policies, such as PLI scheme, provide further impetus to two-wheeler exports. (Source: CRISIL Report)
Growth drivers for domestic sales
• Likely improvement in macroeconomic factors after subdued growth earlier this financial year. CRISIL Research expects
GDP to grow at a CAGR of 7.00% between Fiscal 2021 and Fiscal 2026. Inflation, on the other hand, is expected to remain
soft to moderate. Higher GDP growth and lower inflation would boost domestic sales, led by better affordability with a
rise in disposable incomes.
• The rural market is still under-penetrated, and higher penetration in semi-urban and rural markets would also steer growth
in two-wheeler sales.
• Finance penetration levels likely to rise in the long term, with continued focus of banks and NBFCs on semi-rural and rural
areas.
• Rural infrastructure growth has a pronounced impact on rural incomes, in turn, boosting domestic sales. Strong investments
under infrastructure schemes will further boost rural infrastructure, with multiplier effects.
• The use of two-wheeler (mainly electric) in last-mile delivery by e-commerce players/food chains would also drive two-
wheeler demand.
(Source: CRISIL Report)
Growth drivers for exports
CRISIL Research expects continued growth momentum in exports to Latin America in the long term, owing to better economic
growth. Exports would also be driven by the expected improvement in African economies, with a pick-up in non-oil sectors
(such as, services) and an intact long-term outlook on crude. Thus, the exports share of Latin America and Africa would improve
faster than other regions. (Source: CRISIL Report)
Two-wheeler EV penetration outlook
The two-wheeler EV penetration is projected to increase from 0.90% in Fiscal 2021 to 8.20% in Fiscal 2026. (Source: CRISIL
Report)
INDIAN PASSENGER VEHICLE INDUSTRY
Review of the India passenger vehicle industry
Historical production development
Production of passenger vehicles (“PVs”) in India increased at a CAGR of 5.20% between Fiscals 2016 and 2019 due to an
increase in domestic and exports demand. Domestic demand was driven by expansion in the addressable market, development
of infrastructure, and stable cost of vehicle ownership, as crude oil prices remained low except in the few months when output
was reduced due to sanctions imposed on Iran. (Source: CRISIL Report)
Review of PV production
The production of PV products in India increased at a CAGR of 5.20% between Fiscals 2016 and 2019. However, the production
reduced at a CAGR of 12.80% between Fiscals 2020 and 2021. (Source: CRISIL Report)
Review of PV sales
The sales of PV products in India increased at a CAGR of 6.60% between Fiscals 2016 and 2019. However, the sales reduced
at a CAGR of 10.40% between Fiscals 2020 and 2021. (Source: CRISIL Report)
Split by domestic sales and exports
The Indian PV market is focused on the domestic market, with over 85.00% demand stemming from the domestic market in
Fiscal 2021. The ratio of exports-to-production for the industry has declined from 19.00% in Fiscal 2016 to 13.00% in Fiscal
2021. This can be attributed to reduced exports due to a slowdown in the global automobile industry as well as major OEMs
focusing on serving fast-growing domestic markets over foreign markets. In Fiscal 2020, this share had gone up to
approximately 20.00% as OEMs enhance their focus on export markets. Stagnating domestic traction in the past three years has
resulted in foreign automobile manufacturers such as Ford, General Motors (GM), and Volkswagen (VW) increasing their focus
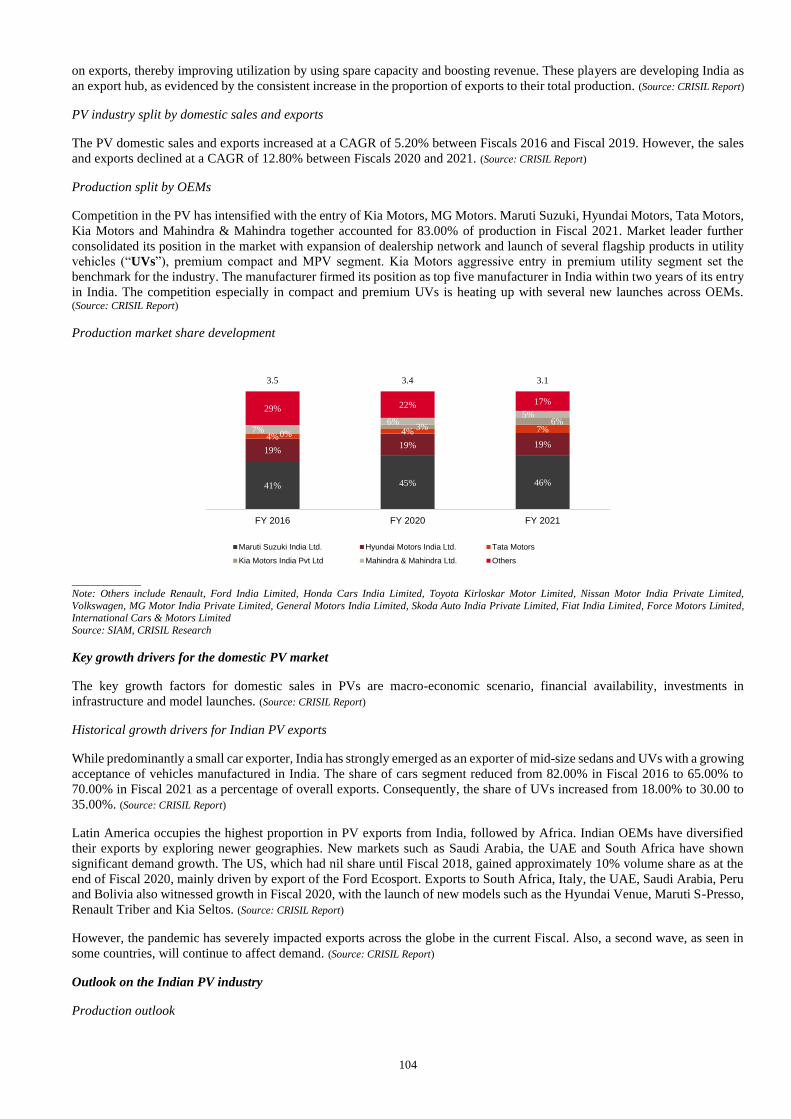
104
on exports, thereby improving utilization by using spare capacity and boosting revenue. These players are developing India as
an export hub, as evidenced by the consistent increase in the proportion of exports to their total production. (Source: CRISIL Report)
PV industry split by domestic sales and exports
The PV domestic sales and exports increased at a CAGR of 5.20% between Fiscals 2016 and Fiscal 2019. However, the sales
and exports declined at a CAGR of 12.80% between Fiscals 2020 and 2021. (Source: CRISIL Report)
Production split by OEMs
Competition in the PV has intensified with the entry of Kia Motors, MG Motors. Maruti Suzuki, Hyundai Motors, Tata Motors,
Kia Motors and Mahindra & Mahindra together accounted for 83.00% of production in Fiscal 2021. Market leader further
consolidated its position in the market with expansion of dealership network and launch of several flagship products in utility
vehicles (“UVs”), premium compact and MPV segment. Kia Motors aggressive entry in premium utility segment set the
benchmark for the industry. The manufacturer firmed its position as top five manufacturer in India within two years of its entry
in India. The competition especially in compact and premium UVs is heating up with several new launches across OEMs. (Source: CRISIL Report)
Production market share development
_____________
Note: Others include Renault, Ford India Limited, Honda Cars India Limited, Toyota Kirloskar Motor Limited, Nissan Motor India Private Limited,
Volkswagen, MG Motor India Private Limited, General Motors India Limited, Skoda Auto India Private Limited, Fiat India Limited, Force Motors Limited, International Cars & Motors Limited
Source: SIAM, CRISIL Research
Key growth drivers for the domestic PV market
The key growth factors for domestic sales in PVs are macro-economic scenario, financial availability, investments in
infrastructure and model launches. (Source: CRISIL Report)
Historical growth drivers for Indian PV exports
While predominantly a small car exporter, India has strongly emerged as an exporter of mid-size sedans and UVs with a growing
acceptance of vehicles manufactured in India. The share of cars segment reduced from 82.00% in Fiscal 2016 to 65.00% to
70.00% in Fiscal 2021 as a percentage of overall exports. Consequently, the share of UVs increased from 18.00% to 30.00 to
35.00%. (Source: CRISIL Report)
Latin America occupies the highest proportion in PV exports from India, followed by Africa. Indian OEMs have diversified
their exports by exploring newer geographies. New markets such as Saudi Arabia, the UAE and South Africa have shown
significant demand growth. The US, which had nil share until Fiscal 2018, gained approximately 10% volume share as at the
end of Fiscal 2020, mainly driven by export of the Ford Ecosport. Exports to South Africa, Italy, the UAE, Saudi Arabia, Peru
and Bolivia also witnessed growth in Fiscal 2020, with the launch of new models such as the Hyundai Venue, Maruti S-Presso,
Renault Triber and Kia Seltos. (Source: CRISIL Report)
However, the pandemic has severely impacted exports across the globe in the current Fiscal. Also, a second wave, as seen in
some countries, will continue to affect demand. (Source: CRISIL Report)
Outlook on the Indian PV industry
Production outlook
41% 45% 46%
19%19% 19%
4%4% 7%
0%3%
6%7%
6%5%
29% 22% 17%
3.5 3.4 3.1
FY 2016 FY 2020 FY 2021
Maruti Suzuki India Ltd. Hyundai Motors India Ltd. Tata Motors
Kia Motors India Pvt Ltd Mahindra & Mahindra Ltd. Others

105
CRISIL Research estimates overall PV production to increase at a CAGR of 10.00% to 12.00% from Fiscal 2021 to 2026, and
reach approximately 5.1 million units by Fiscal 2026. However, surge in COVID-19 cases in the second wave and subsequent
need for the state and central governments to impose localized or extended lockdown to control spread of pandemic may have
an impact on supply chains as well as sales. In such a case, overall industry production is also likely to get impacted over short
term. (Source: CRISIL Report)
PV production outlook
CRISIL forecasts exports to increase at a CAGR of 11.00% to 13.00% between Fiscals 2021 and 2026. Rising competition in
Europe amid sluggish demand growth, though, will prevent further increase in growth. Moreover, penetration of electric and
hybrid vehicles will be a key monitorable. (Source: CRISIL Report)
Domestic sales outlook
Domestic PV sales are expected to increase by 10.00% to 11.00% CAGR over Fiscals 2021 to 2026. The growth is expected to
increase post Fiscal 2021, as consecutive years of double-digit declines would lead to a very low base in Fiscal 2021. However,
rise in COVID-19 cases and ensuing need for lockdowns are likely to reduce demand sentiments as well as pose supply chain
challenges for the OEMs. Over short to mid-term COVID-19 induced demand for personal mobility may support PV sales,
Over mid to long-term, moderate macroeconomic growth, increasing disposable income, relatively stable cost of vehicle
ownership, and lower fuel prices are likely to positively impact demand for passenger vehicles. Other factors that would aid
demand are increasing urbanization, government support to farm incomes, and improved availability of finance. However,
increasing congestion in metro cities and rising popularity of shared mobility services are likely to restrict car sales in the long
term. (Source: CRISIL Report)
PV domestic sales outlook
The domestic sales for PV in India is projected to increase at a CAGR of 10.00% to 11.00% between Fiscals 2021 and 2026. (Source: CRISIL Report)
Split by domestic sales and exports
The domestic sales and exports for PV in India is projected to increase at a CAGR of 10.00% to 12.00% between Fiscals 2021
and 2026. (Source: CRISIL Report)
Key trends and growth drivers
Future growth drivers for the domestic market
• Underpenetrated market huge potential for cars and UVs
• Expected improvement in macroeconomic factors after subdued growth in Fiscal 2020 and a decline in Fiscal 2021
• Anticipated improvement in rural demand
• Enhanced product offering
• Cars on subscription
• Future growth drivers for the exports market include capacity expansion by top players, stable crude oil prices to aid
demand from African and Latin American geographies, continued expansion undertaken by players into newer markets
and PLI scheme.
(Source: CRISIL Report)
Electric PVs to contribute to approximately 4.00% of domestic sales by Fiscal 2026
CRISIL Research expects the share of EVs in total passenger car sales to remain low (approximately 4.00%) in Fiscal 2026.
Penetration in Fiscal 2021 was approximately 0.16%. EV penetration can be higher if government adopts stricter policies on
OEMs for not meeting CAFÉ norms. The exact quantum of EV penetration in an aggressive case depends on incentives given
for adoption and setting up of charging infrastructure. EV penetration will also be propelled by policies adopted by the
government for penalizing non-adherence to CAFÉ norms. (Source: CRISIL Report)
INDIAN CONSUMER DURABLES INDUSTRY
Review and outlook
Consumer durables (or electronic home appliances) are defined as products/ appliances that have a certain utility and/or
entertainment value, lengthier life (typically more than three years) and require replacement after a few years. These appliances
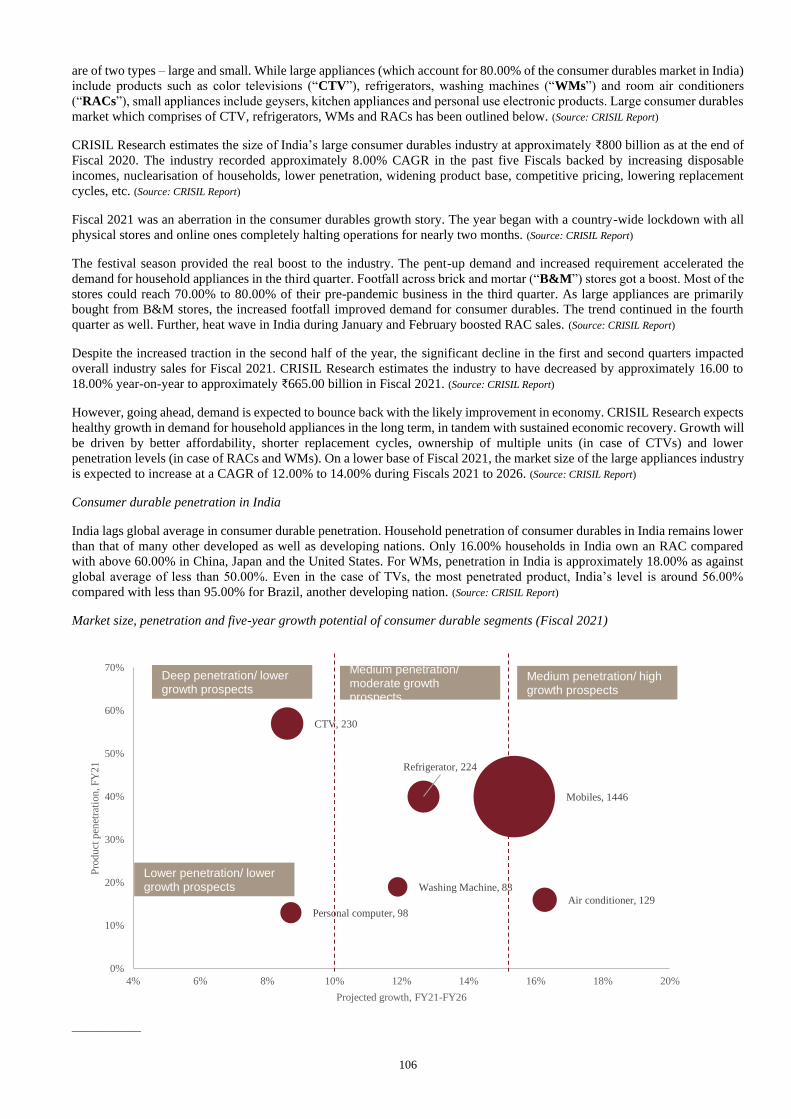
106
are of two types – large and small. While large appliances (which account for 80.00% of the consumer durables market in India)
include products such as color televisions (“CTV”), refrigerators, washing machines (“WMs”) and room air conditioners
(“RACs”), small appliances include geysers, kitchen appliances and personal use electronic products. Large consumer durables
market which comprises of CTV, refrigerators, WMs and RACs has been outlined below. (Source: CRISIL Report)
CRISIL Research estimates the size of India’s large consumer durables industry at approximately ₹800 billion as at the end of
Fiscal 2020. The industry recorded approximately 8.00% CAGR in the past five Fiscals backed by increasing disposable
incomes, nuclearisation of households, lower penetration, widening product base, competitive pricing, lowering replacement
cycles, etc. (Source: CRISIL Report)
Fiscal 2021 was an aberration in the consumer durables growth story. The year began with a country-wide lockdown with all
physical stores and online ones completely halting operations for nearly two months. (Source: CRISIL Report)
The festival season provided the real boost to the industry. The pent-up demand and increased requirement accelerated the
demand for household appliances in the third quarter. Footfall across brick and mortar (“B&M”) stores got a boost. Most of the
stores could reach 70.00% to 80.00% of their pre-pandemic business in the third quarter. As large appliances are primarily
bought from B&M stores, the increased footfall improved demand for consumer durables. The trend continued in the fourth
quarter as well. Further, heat wave in India during January and February boosted RAC sales. (Source: CRISIL Report)
Despite the increased traction in the second half of the year, the significant decline in the first and second quarters impacted
overall industry sales for Fiscal 2021. CRISIL Research estimates the industry to have decreased by approximately 16.00 to
18.00% year-on-year to approximately ₹665.00 billion in Fiscal 2021. (Source: CRISIL Report)
However, going ahead, demand is expected to bounce back with the likely improvement in economy. CRISIL Research expects
healthy growth in demand for household appliances in the long term, in tandem with sustained economic recovery. Growth will
be driven by better affordability, shorter replacement cycles, ownership of multiple units (in case of CTVs) and lower
penetration levels (in case of RACs and WMs). On a lower base of Fiscal 2021, the market size of the large appliances industry
is expected to increase at a CAGR of 12.00% to 14.00% during Fiscals 2021 to 2026. (Source: CRISIL Report)
Consumer durable penetration in India
India lags global average in consumer durable penetration. Household penetration of consumer durables in India remains lower
than that of many other developed as well as developing nations. Only 16.00% households in India own an RAC compared
with above 60.00% in China, Japan and the United States. For WMs, penetration in India is approximately 18.00% as against
global average of less than 50.00%. Even in the case of TVs, the most penetrated product, India’s level is around 56.00%
compared with less than 95.00% for Brazil, another developing nation. (Source: CRISIL Report)
Market size, penetration and five-year growth potential of consumer durable segments (Fiscal 2021)
_____________
CTV, 230
Refrigerator, 224
Washing Machine, 83
Air conditioner, 129
Mobiles, 1446
Personal computer, 98
0%
10%
20%
30%
40%
50%
60%
70%
4% 6% 8% 10% 12% 14% 16% 18% 20%
Pro
du
ct p
enet
rati
on
, F
Y2
1
Projected growth, FY21-FY26
Deep penetration/ lower growth prospects
Lower penetration/ lower growth prospects
Medium penetration/ moderate growth prospects
Medium penetration/ high growth prospects
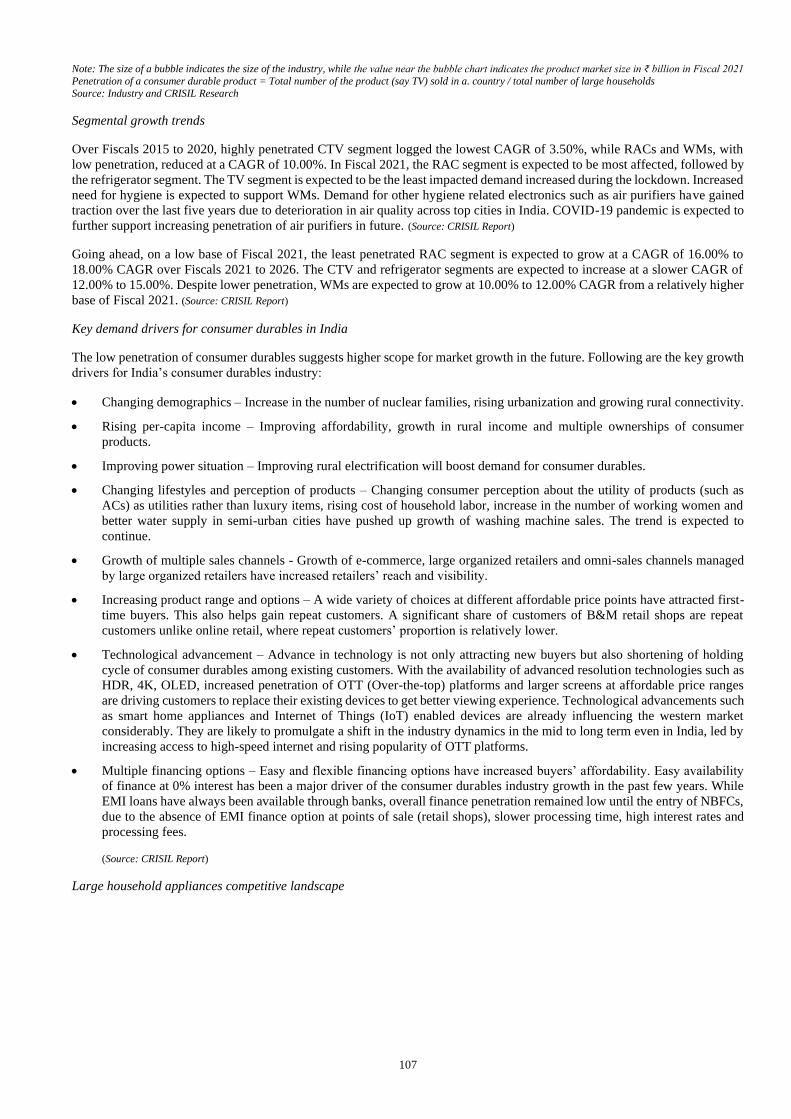
107
Note: The size of a bubble indicates the size of the industry, while the value near the bubble chart indicates the product market size in ₹ billion in Fiscal 2021
Penetration of a consumer durable product = Total number of the product (say TV) sold in a. country / total number of large households
Source: Industry and CRISIL Research
Segmental growth trends
Over Fiscals 2015 to 2020, highly penetrated CTV segment logged the lowest CAGR of 3.50%, while RACs and WMs, with
low penetration, reduced at a CAGR of 10.00%. In Fiscal 2021, the RAC segment is expected to be most affected, followed by
the refrigerator segment. The TV segment is expected to be the least impacted demand increased during the lockdown. Increased
need for hygiene is expected to support WMs. Demand for other hygiene related electronics such as air purifiers have gained
traction over the last five years due to deterioration in air quality across top cities in India. COVID-19 pandemic is expected to
further support increasing penetration of air purifiers in future. (Source: CRISIL Report)
Going ahead, on a low base of Fiscal 2021, the least penetrated RAC segment is expected to grow at a CAGR of 16.00% to
18.00% CAGR over Fiscals 2021 to 2026. The CTV and refrigerator segments are expected to increase at a slower CAGR of
12.00% to 15.00%. Despite lower penetration, WMs are expected to grow at 10.00% to 12.00% CAGR from a relatively higher
base of Fiscal 2021. (Source: CRISIL Report)
Key demand drivers for consumer durables in India
The low penetration of consumer durables suggests higher scope for market growth in the future. Following are the key growth
drivers for India’s consumer durables industry:
• Changing demographics – Increase in the number of nuclear families, rising urbanization and growing rural connectivity.
• Rising per-capita income – Improving affordability, growth in rural income and multiple ownerships of consumer
products.
• Improving power situation – Improving rural electrification will boost demand for consumer durables.
• Changing lifestyles and perception of products – Changing consumer perception about the utility of products (such as
ACs) as utilities rather than luxury items, rising cost of household labor, increase in the number of working women and
better water supply in semi-urban cities have pushed up growth of washing machine sales. The trend is expected to
continue.
• Growth of multiple sales channels - Growth of e-commerce, large organized retailers and omni-sales channels managed
by large organized retailers have increased retailers’ reach and visibility.
• Increasing product range and options – A wide variety of choices at different affordable price points have attracted first-
time buyers. This also helps gain repeat customers. A significant share of customers of B&M retail shops are repeat
customers unlike online retail, where repeat customers’ proportion is relatively lower.
• Technological advancement – Advance in technology is not only attracting new buyers but also shortening of holding
cycle of consumer durables among existing customers. With the availability of advanced resolution technologies such as
HDR, 4K, OLED, increased penetration of OTT (Over-the-top) platforms and larger screens at affordable price ranges
are driving customers to replace their existing devices to get better viewing experience. Technological advancements such
as smart home appliances and Internet of Things (IoT) enabled devices are already influencing the western market
considerably. They are likely to promulgate a shift in the industry dynamics in the mid to long term even in India, led by
increasing access to high-speed internet and rising popularity of OTT platforms.
• Multiple financing options – Easy and flexible financing options have increased buyers’ affordability. Easy availability
of finance at 0% interest has been a major driver of the consumer durables industry growth in the past few years. While
EMI loans have always been available through banks, overall finance penetration remained low until the entry of NBFCs,
due to the absence of EMI finance option at points of sale (retail shops), slower processing time, high interest rates and
processing fees.
(Source: CRISIL Report)
Large household appliances competitive landscape
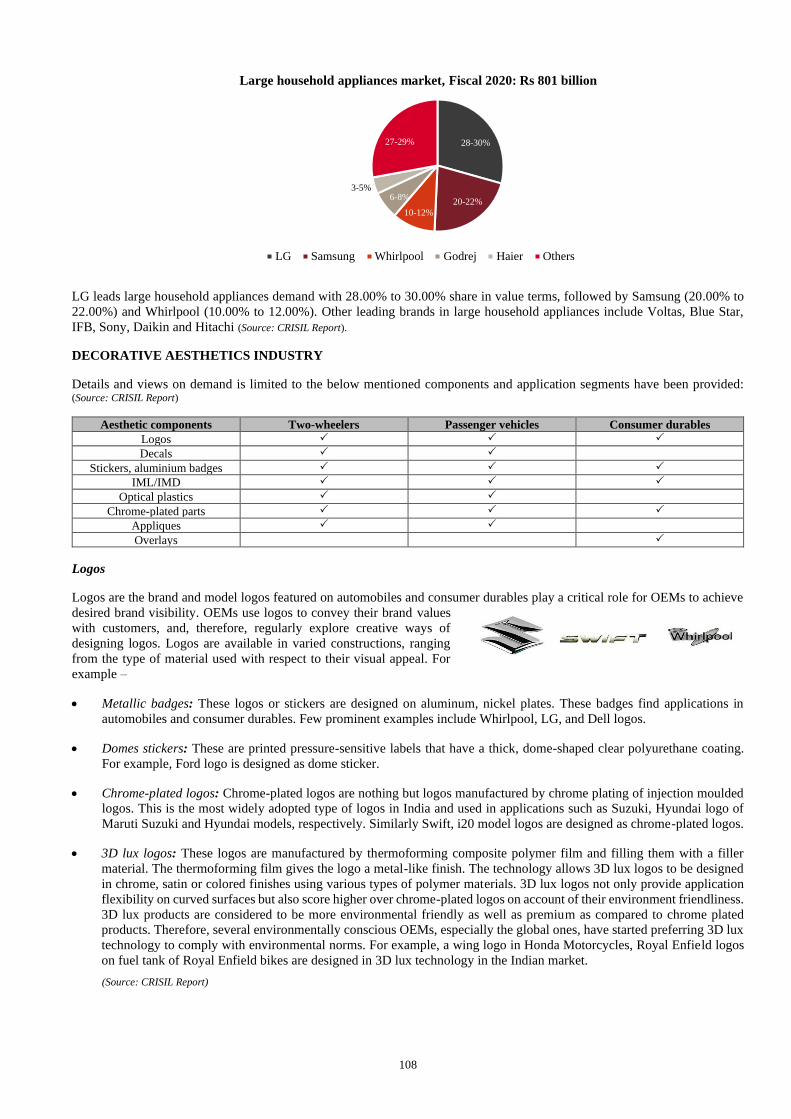
108
LG leads large household appliances demand with 28.00% to 30.00% share in value terms, followed by Samsung (20.00% to
22.00%) and Whirlpool (10.00% to 12.00%). Other leading brands in large household appliances include Voltas, Blue Star,
IFB, Sony, Daikin and Hitachi (Source: CRISIL Report).
DECORATIVE AESTHETICS INDUSTRY
Details and views on demand is limited to the below mentioned components and application segments have been provided: (Source: CRISIL Report)
Aesthetic components Two-wheelers Passenger vehicles Consumer durables
Logos
Decals
Stickers, aluminium badges
IML/IMD
Optical plastics
Chrome-plated parts
Appliques
Overlays
Logos
Logos are the brand and model logos featured on automobiles and consumer durables play a critical role for OEMs to achieve
desired brand visibility. OEMs use logos to convey their brand values
with customers, and, therefore, regularly explore creative ways of
designing logos. Logos are available in varied constructions, ranging
from the type of material used with respect to their visual appeal. For
example –
• Metallic badges: These logos or stickers are designed on aluminum, nickel plates. These badges find applications in
automobiles and consumer durables. Few prominent examples include Whirlpool, LG, and Dell logos.
• Domes stickers: These are printed pressure-sensitive labels that have a thick, dome-shaped clear polyurethane coating.
For example, Ford logo is designed as dome sticker.
• Chrome-plated logos: Chrome-plated logos are nothing but logos manufactured by chrome plating of injection moulded
logos. This is the most widely adopted type of logos in India and used in applications such as Suzuki, Hyundai logo of
Maruti Suzuki and Hyundai models, respectively. Similarly Swift, i20 model logos are designed as chrome-plated logos.
• 3D lux logos: These logos are manufactured by thermoforming composite polymer film and filling them with a filler
material. The thermoforming film gives the logo a metal-like finish. The technology allows 3D lux logos to be designed
in chrome, satin or colored finishes using various types of polymer materials. 3D lux logos not only provide application
flexibility on curved surfaces but also score higher over chrome-plated logos on account of their environment friendliness.
3D lux products are considered to be more environmental friendly as well as premium as compared to chrome plated
products. Therefore, several environmentally conscious OEMs, especially the global ones, have started preferring 3D lux
technology to comply with environmental norms. For example, a wing logo in Honda Motorcycles, Royal Enfield logos
on fuel tank of Royal Enfield bikes are designed in 3D lux technology in the Indian market.
(Source: CRISIL Report)
28-30%
20-22%
10-12%
6-8%3-5%
27-29%
Large household appliances market, Fiscal 2020: Rs 801 billion
LG Samsung Whirlpool Godrej Haier Others

109
Decal/graphic stickers
Decal stickers are printed on vinyl films for decorative purposes on
automobiles, particularly two-wheelers in India. Within two-wheelers,
economy and executive segment motorcycles and mostly basic scooters
produced in India have decal finishes. (Source: CRISIL Report)
Manufacturers find decal stickers a cost-effective way to decorate and distinguish seemingly similar two-wheeler models.
Particularly, in premium motorcycles, OEMs have greater flexibility to deploy suitably designed moulded plastic components
as decorative elements along with decals, whereas OEMs use decals as a cost-effective option to decorate affordable segment
two-wheelers passenger vehicles and other automobile vehicle segments such as tractors, commercial vehicles. OEMs also
use graphic stickers for branding purpose, which generally include technology branding. (Source: CRISIL Report)
Decals can be used on various parts of motorcycles such as fuel tank, side panel, rear panel, engine cover, fairing, fender,
tyres, etc. Along with enhancing the visual appeal, decals provide desired durability, abrasive resistance, ultra violet (UV)
resistance, adhesive strength to withstand extreme weather conditions in automobile applications. Vehicle OEMs experiment
using colours, textures and thicknesses to get desired visual and performance characteristics. (Source: CRISIL Report)
IMD/IML parts
IMD/IML is a process for decorating or labelling injection moulded plastic parts or components during the plastic injection
moulding cycle. IMD/IML techniques allow for the integration of decoration/labelling activities in the plastic injection
moulding process. IMD/IML processes produce high quality and visually appealing parts. These processes offer more durable
and long-lasting decorations compared to traditional moulding and decorating techniques, such as painted/ printed injection
moulded parts. (Source: CRISIL Report)
In the IML process, a plastic film is printed with decorative pattern, formed, cut to size and then inserted in the injection
moulding tool. During the injection moulding process, the film becomes an integral part of the injection moulding plastic,
giving it a decorative look. While, in the IMD process, the printed pattern on the roller gets transferred on the injection
moulded plastic. Unlike in IML, in IMD, the film does not become an integral part of moulded plastic. IMD is generally
preferred where large volumes of flat decorated parts are to be made. (Source: CRISIL Report)
As offering differentiated user experience is gaining prominence in automobile and consumer durable applications, OEMs are
exploring innovative and better ways of decorating plastic parts in their products. For instance, car manufacturers are
deploying dual tone finishes, wood or other special finishes in the vehicle in dashboards, door trims or centre consoles. These
special finishes are manufactured using IMD/IML processes. Similarly, in refrigerators and washing machines manufacturers
are exploring IMD/IML parts to give better visual appeal to their products. Use of IMD/IML is expected to increase as it is a
superior technology to other traditional aesthetic products. (Source: CRISIL Report)
Optical plastics
Optical plastics are high-quality plastic parts that allow a display to be clearly visible without any distortion and also used to
provide mechanical protection to thin-film transistor (“TFT”) screen without impacting the visibility of underlying display
device. Optical plastics are typically made of acrylics/polycarbonate material, providing desired mechanical strength, along
with optical parameters covering transmission, haze and in high end applications, require anti-reflective, anti-glare, anti-finger
print properties. Optical plastics come in varying sizes, depending on varied applications in two-wheelers and passenger
vehicles. Currently, OEMs are deploying 6 to 12 inch sized TFT screens across models. Demand for optical plastics are rising
driven by following factors:
• Advancement in technology: Improved data connectivity with the
proliferation of 4G technology, increased consumer exposure to
smartphone technology, and rising customer expectations for
convenience and seamlessness in the vehicle accessibility of smartphone
applications is driving growth of in-vehicle infotainment in passenger
vehicles.
• Wider coverage: Modern infotainment systems allow managing and
playing audio content, utilising navigation for driving, hands free call
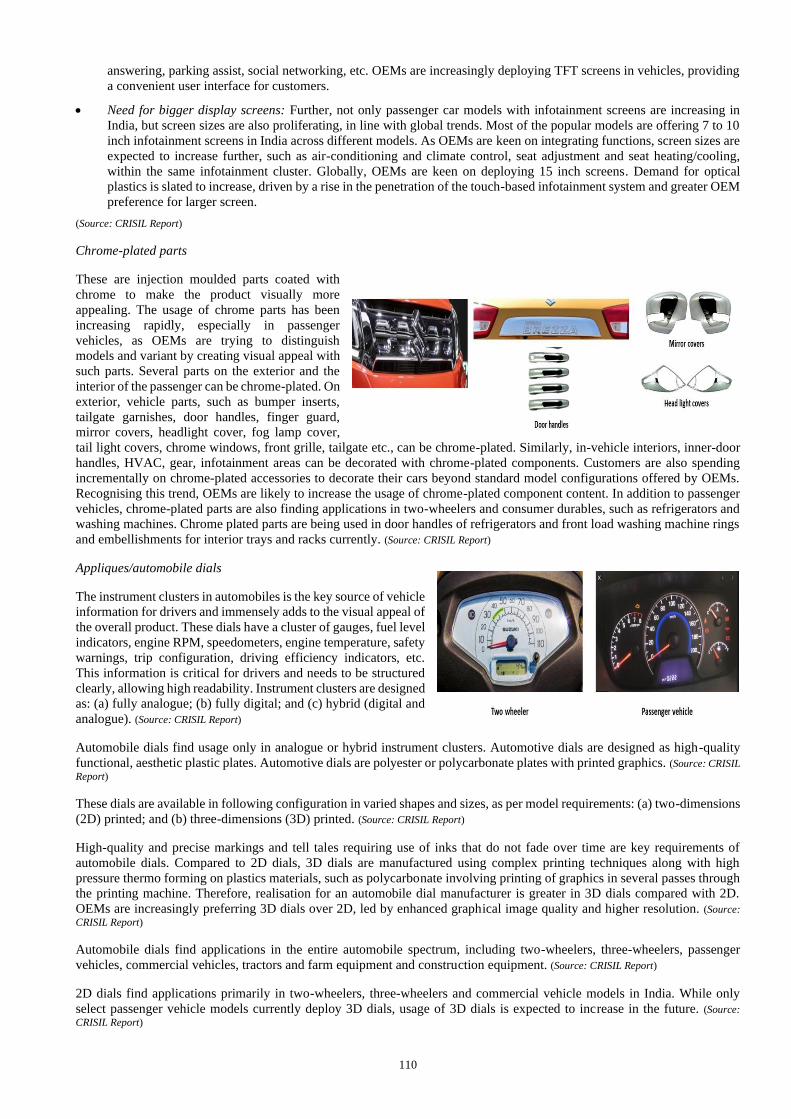
110
answering, parking assist, social networking, etc. OEMs are increasingly deploying TFT screens in vehicles, providing
a convenient user interface for customers.
• Need for bigger display screens: Further, not only passenger car models with infotainment screens are increasing in
India, but screen sizes are also proliferating, in line with global trends. Most of the popular models are offering 7 to 10
inch infotainment screens in India across different models. As OEMs are keen on integrating functions, screen sizes are
expected to increase further, such as air-conditioning and climate control, seat adjustment and seat heating/cooling,
within the same infotainment cluster. Globally, OEMs are keen on deploying 15 inch screens. Demand for optical
plastics is slated to increase, driven by a rise in the penetration of the touch-based infotainment system and greater OEM
preference for larger screen.
(Source: CRISIL Report)
Chrome-plated parts
These are injection moulded parts coated with
chrome to make the product visually more
appealing. The usage of chrome parts has been
increasing rapidly, especially in passenger
vehicles, as OEMs are trying to distinguish
models and variant by creating visual appeal with
such parts. Several parts on the exterior and the
interior of the passenger can be chrome-plated. On
exterior, vehicle parts, such as bumper inserts,
tailgate garnishes, door handles, finger guard,
mirror covers, headlight cover, fog lamp cover,
tail light covers, chrome windows, front grille, tailgate etc., can be chrome-plated. Similarly, in-vehicle interiors, inner-door
handles, HVAC, gear, infotainment areas can be decorated with chrome-plated components. Customers are also spending
incrementally on chrome-plated accessories to decorate their cars beyond standard model configurations offered by OEMs.
Recognising this trend, OEMs are likely to increase the usage of chrome-plated component content. In addition to passenger
vehicles, chrome-plated parts are also finding applications in two-wheelers and consumer durables, such as refrigerators and
washing machines. Chrome plated parts are being used in door handles of refrigerators and front load washing machine rings
and embellishments for interior trays and racks currently. (Source: CRISIL Report)
Appliques/automobile dials
The instrument clusters in automobiles is the key source of vehicle
information for drivers and immensely adds to the visual appeal of
the overall product. These dials have a cluster of gauges, fuel level
indicators, engine RPM, speedometers, engine temperature, safety
warnings, trip configuration, driving efficiency indicators, etc.
This information is critical for drivers and needs to be structured
clearly, allowing high readability. Instrument clusters are designed
as: (a) fully analogue; (b) fully digital; and (c) hybrid (digital and
analogue). (Source: CRISIL Report)
Automobile dials find usage only in analogue or hybrid instrument clusters. Automotive dials are designed as high-quality
functional, aesthetic plastic plates. Automotive dials are polyester or polycarbonate plates with printed graphics. (Source: CRISIL
Report)
These dials are available in following configuration in varied shapes and sizes, as per model requirements: (a) two-dimensions
(2D) printed; and (b) three-dimensions (3D) printed. (Source: CRISIL Report)
High-quality and precise markings and tell tales requiring use of inks that do not fade over time are key requirements of
automobile dials. Compared to 2D dials, 3D dials are manufactured using complex printing techniques along with high
pressure thermo forming on plastics materials, such as polycarbonate involving printing of graphics in several passes through
the printing machine. Therefore, realisation for an automobile dial manufacturer is greater in 3D dials compared with 2D.
OEMs are increasingly preferring 3D dials over 2D, led by enhanced graphical image quality and higher resolution. (Source:
CRISIL Report)
Automobile dials find applications in the entire automobile spectrum, including two-wheelers, three-wheelers, passenger
vehicles, commercial vehicles, tractors and farm equipment and construction equipment. (Source: CRISIL Report)
2D dials find applications primarily in two-wheelers, three-wheelers and commercial vehicle models in India. While only
select passenger vehicle models currently deploy 3D dials, usage of 3D dials is expected to increase in the future. (Source:
CRISIL Report)
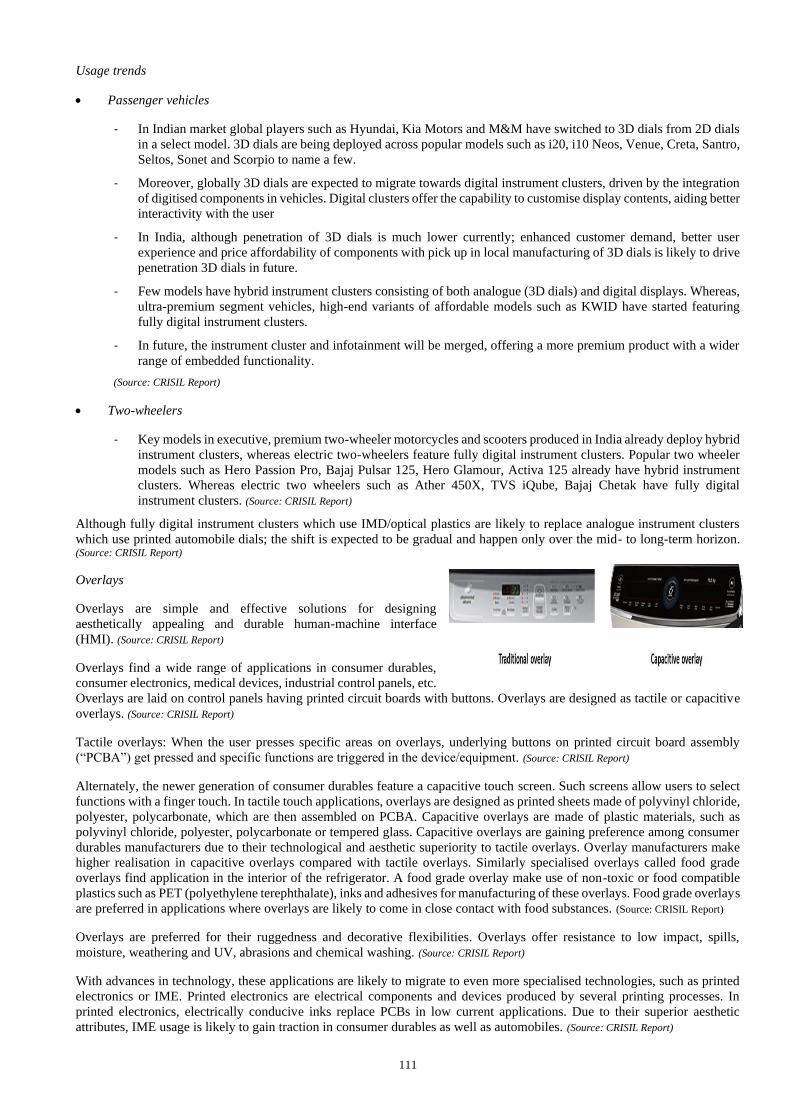
111
Usage trends
• Passenger vehicles
- In Indian market global players such as Hyundai, Kia Motors and M&M have switched to 3D dials from 2D dials
in a select model. 3D dials are being deployed across popular models such as i20, i10 Neos, Venue, Creta, Santro,
Seltos, Sonet and Scorpio to name a few.
- Moreover, globally 3D dials are expected to migrate towards digital instrument clusters, driven by the integration
of digitised components in vehicles. Digital clusters offer the capability to customise display contents, aiding better
interactivity with the user
- In India, although penetration of 3D dials is much lower currently; enhanced customer demand, better user
experience and price affordability of components with pick up in local manufacturing of 3D dials is likely to drive
penetration 3D dials in future.
- Few models have hybrid instrument clusters consisting of both analogue (3D dials) and digital displays. Whereas,
ultra-premium segment vehicles, high-end variants of affordable models such as KWID have started featuring
fully digital instrument clusters.
- In future, the instrument cluster and infotainment will be merged, offering a more premium product with a wider
range of embedded functionality.
(Source: CRISIL Report)
• Two-wheelers
- Key models in executive, premium two-wheeler motorcycles and scooters produced in India already deploy hybrid
instrument clusters, whereas electric two-wheelers feature fully digital instrument clusters. Popular two wheeler
models such as Hero Passion Pro, Bajaj Pulsar 125, Hero Glamour, Activa 125 already have hybrid instrument
clusters. Whereas electric two wheelers such as Ather 450X, TVS iQube, Bajaj Chetak have fully digital
instrument clusters. (Source: CRISIL Report)
Although fully digital instrument clusters which use IMD/optical plastics are likely to replace analogue instrument clusters
which use printed automobile dials; the shift is expected to be gradual and happen only over the mid- to long-term horizon. (Source: CRISIL Report)
Overlays
Overlays are simple and effective solutions for designing
aesthetically appealing and durable human-machine interface
(HMI). (Source: CRISIL Report)
Overlays find a wide range of applications in consumer durables,
consumer electronics, medical devices, industrial control panels, etc.
Overlays are laid on control panels having printed circuit boards with buttons. Overlays are designed as tactile or capacitive
overlays. (Source: CRISIL Report)
Tactile overlays: When the user presses specific areas on overlays, underlying buttons on printed circuit board assembly
(“PCBA”) get pressed and specific functions are triggered in the device/equipment. (Source: CRISIL Report)
Alternately, the newer generation of consumer durables feature a capacitive touch screen. Such screens allow users to select
functions with a finger touch. In tactile touch applications, overlays are designed as printed sheets made of polyvinyl chloride,
polyester, polycarbonate, which are then assembled on PCBA. Capacitive overlays are made of plastic materials, such as
polyvinyl chloride, polyester, polycarbonate or tempered glass. Capacitive overlays are gaining preference among consumer
durables manufacturers due to their technological and aesthetic superiority to tactile overlays. Overlay manufacturers make
higher realisation in capacitive overlays compared with tactile overlays. Similarly specialised overlays called food grade
overlays find application in the interior of the refrigerator. A food grade overlay make use of non-toxic or food compatible
plastics such as PET (polyethylene terephthalate), inks and adhesives for manufacturing of these overlays. Food grade overlays
are preferred in applications where overlays are likely to come in close contact with food substances. (Source: CRISIL Report)
Overlays are preferred for their ruggedness and decorative flexibilities. Overlays offer resistance to low impact, spills,
moisture, weathering and UV, abrasions and chemical washing. (Source: CRISIL Report)
With advances in technology, these applications are likely to migrate to even more specialised technologies, such as printed
electronics or IME. Printed electronics are electrical components and devices produced by several printing processes. In
printed electronics, electrically conducive inks replace PCBs in low current applications. Due to their superior aesthetic
attributes, IME usage is likely to gain traction in consumer durables as well as automobiles. (Source: CRISIL Report)
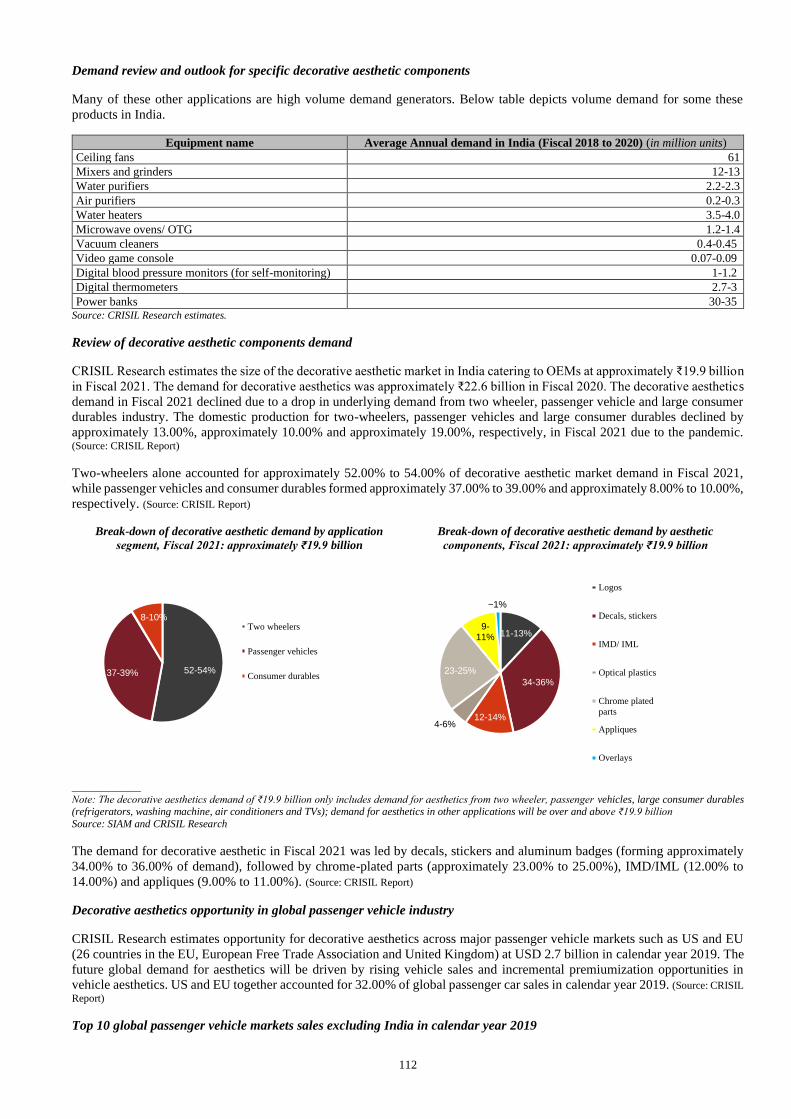
112
Demand review and outlook for specific decorative aesthetic components
Many of these other applications are high volume demand generators. Below table depicts volume demand for some these
products in India.
Equipment name Average Annual demand in India (Fiscal 2018 to 2020) (in million units)
Ceiling fans 61
Mixers and grinders 12-13
Water purifiers 2.2-2.3
Air purifiers 0.2-0.3
Water heaters 3.5-4.0
Microwave ovens/ OTG 1.2-1.4
Vacuum cleaners 0.4-0.45
Video game console 0.07-0.09
Digital blood pressure monitors (for self-monitoring) 1-1.2
Digital thermometers 2.7-3
Power banks 30-35 Source: CRISIL Research estimates.
Review of decorative aesthetic components demand
CRISIL Research estimates the size of the decorative aesthetic market in India catering to OEMs at approximately ₹19.9 billion
in Fiscal 2021. The demand for decorative aesthetics was approximately ₹22.6 billion in Fiscal 2020. The decorative aesthetics
demand in Fiscal 2021 declined due to a drop in underlying demand from two wheeler, passenger vehicle and large consumer
durables industry. The domestic production for two-wheelers, passenger vehicles and large consumer durables declined by
approximately 13.00%, approximately 10.00% and approximately 19.00%, respectively, in Fiscal 2021 due to the pandemic. (Source: CRISIL Report)
Two-wheelers alone accounted for approximately 52.00% to 54.00% of decorative aesthetic market demand in Fiscal 2021,
while passenger vehicles and consumer durables formed approximately 37.00% to 39.00% and approximately 8.00% to 10.00%,
respectively. (Source: CRISIL Report)
Break-down of decorative aesthetic demand by application
segment, Fiscal 2021: approximately ₹19.9 billion
Break-down of decorative aesthetic demand by aesthetic
components, Fiscal 2021: approximately ₹19.9 billion
_____________
Note: The decorative aesthetics demand of ₹19.9 billion only includes demand for aesthetics from two wheeler, passenger vehicles, large consumer durables (refrigerators, washing machine, air conditioners and TVs); demand for aesthetics in other applications will be over and above ₹19.9 billion
Source: SIAM and CRISIL Research
The demand for decorative aesthetic in Fiscal 2021 was led by decals, stickers and aluminum badges (forming approximately
34.00% to 36.00% of demand), followed by chrome-plated parts (approximately 23.00% to 25.00%), IMD/IML (12.00% to
14.00%) and appliques (9.00% to 11.00%). (Source: CRISIL Report)
Decorative aesthetics opportunity in global passenger vehicle industry
CRISIL Research estimates opportunity for decorative aesthetics across major passenger vehicle markets such as US and EU
(26 countries in the EU, European Free Trade Association and United Kingdom) at USD 2.7 billion in calendar year 2019. The
future global demand for aesthetics will be driven by rising vehicle sales and incremental premiumization opportunities in
vehicle aesthetics. US and EU together accounted for 32.00% of global passenger car sales in calendar year 2019. (Source: CRISIL
Report)
Top 10 global passenger vehicle markets sales excluding India in calendar year 2019
52-54%37-39%
8-10%Two wheelers
Passenger vehicles
Consumer durables
11-13%
34-36%
12-14%4-6%
23-25%
9-11%
~1%
Logos
Decals, stickers
IMD/ IML
Optical plastics
Chrome plated
parts
Appliques
Overlays
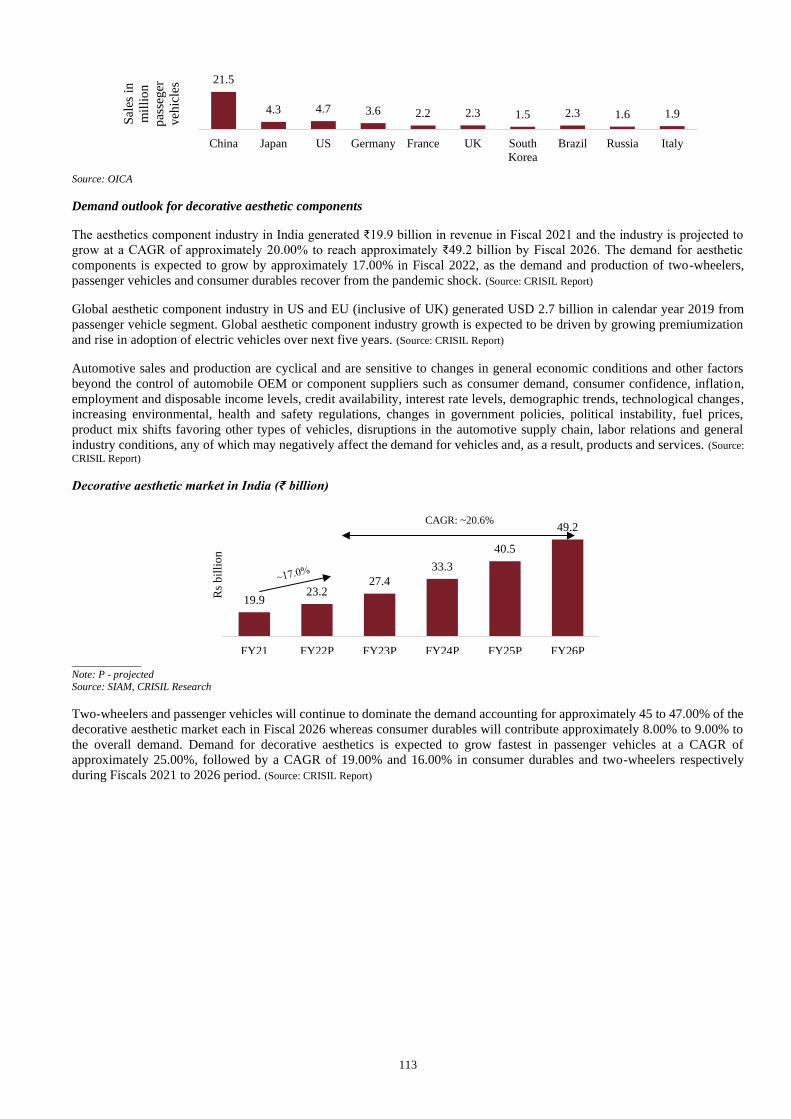
113
Source: OICA
Demand outlook for decorative aesthetic components
The aesthetics component industry in India generated ₹19.9 billion in revenue in Fiscal 2021 and the industry is projected to
grow at a CAGR of approximately 20.00% to reach approximately ₹49.2 billion by Fiscal 2026. The demand for aesthetic
components is expected to grow by approximately 17.00% in Fiscal 2022, as the demand and production of two-wheelers,
passenger vehicles and consumer durables recover from the pandemic shock. (Source: CRISIL Report)
Global aesthetic component industry in US and EU (inclusive of UK) generated USD 2.7 billion in calendar year 2019 from
passenger vehicle segment. Global aesthetic component industry growth is expected to be driven by growing premiumization
and rise in adoption of electric vehicles over next five years. (Source: CRISIL Report)
Automotive sales and production are cyclical and are sensitive to changes in general economic conditions and other factors
beyond the control of automobile OEM or component suppliers such as consumer demand, consumer confidence, inflation,
employment and disposable income levels, credit availability, interest rate levels, demographic trends, technological changes,
increasing environmental, health and safety regulations, changes in government policies, political instability, fuel prices,
product mix shifts favoring other types of vehicles, disruptions in the automotive supply chain, labor relations and general
industry conditions, any of which may negatively affect the demand for vehicles and, as a result, products and services. (Source:
CRISIL Report)
Decorative aesthetic market in India (₹ billion)
_____________
Note: P - projected
Source: SIAM, CRISIL Research
Two-wheelers and passenger vehicles will continue to dominate the demand accounting for approximately 45 to 47.00% of the
decorative aesthetic market each in Fiscal 2026 whereas consumer durables will contribute approximately 8.00% to 9.00% to
the overall demand. Demand for decorative aesthetics is expected to grow fastest in passenger vehicles at a CAGR of
approximately 25.00%, followed by a CAGR of 19.00% and 16.00% in consumer durables and two-wheelers respectively
during Fiscals 2021 to 2026 period. (Source: CRISIL Report)
21.5
4.3 4.7 3.6 2.2 2.3 1.5 2.3 1.6 1.9
China Japan US Germany France UK South
Korea
Brazil Russia Italy
Sal
es i
n
mil
lio
n
pas
seger
veh
icle
s
19.923.2
27.4
33.3
40.5
49.2
FY21 FY22P FY23P FY24P FY25P FY26P
Rs
bil
lio
n
CAGR: ~20.6%
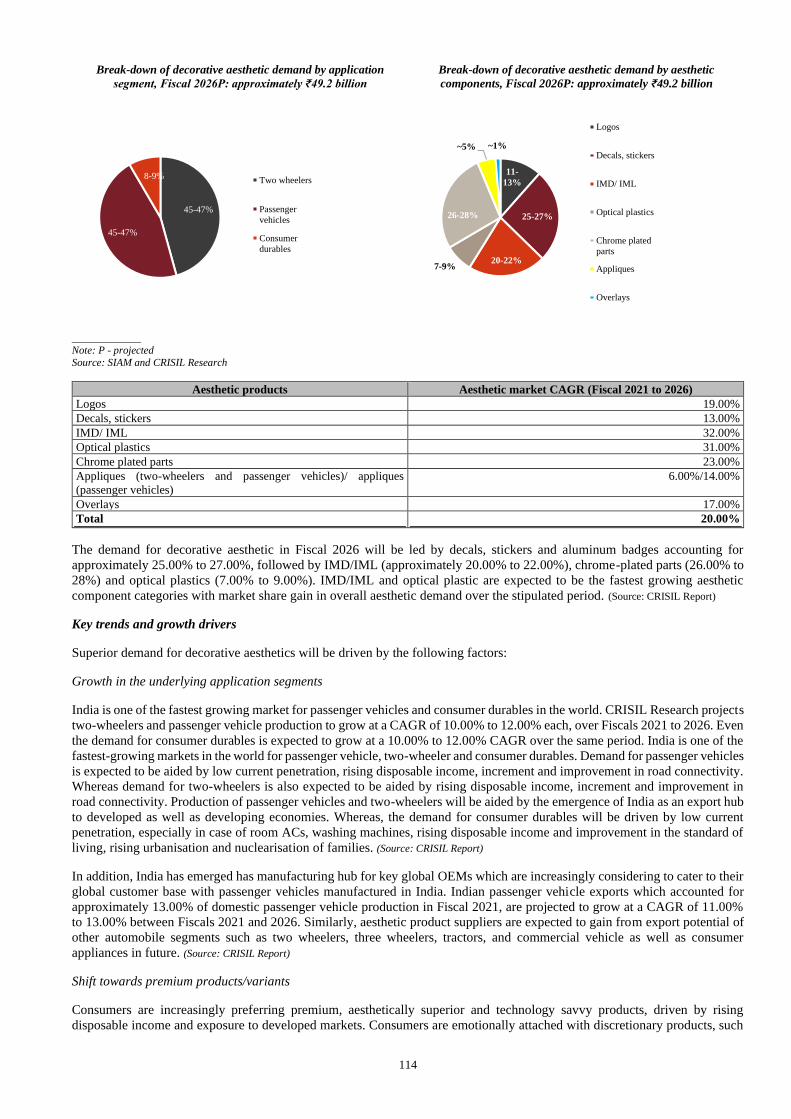
114
Break-down of decorative aesthetic demand by application
segment, Fiscal 2026P: approximately ₹49.2 billion
Break-down of decorative aesthetic demand by aesthetic
components, Fiscal 2026P: approximately ₹49.2 billion
_____________ Note: P - projected
Source: SIAM and CRISIL Research
Aesthetic products Aesthetic market CAGR (Fiscal 2021 to 2026) Logos 19.00%
Decals, stickers 13.00%
IMD/ IML 32.00%
Optical plastics 31.00%
Chrome plated parts 23.00%
Appliques (two-wheelers and passenger vehicles)/ appliques
(passenger vehicles)
6.00%/14.00%
Overlays 17.00%
Total 20.00%
The demand for decorative aesthetic in Fiscal 2026 will be led by decals, stickers and aluminum badges accounting for
approximately 25.00% to 27.00%, followed by IMD/IML (approximately 20.00% to 22.00%), chrome-plated parts (26.00% to
28%) and optical plastics (7.00% to 9.00%). IMD/IML and optical plastic are expected to be the fastest growing aesthetic
component categories with market share gain in overall aesthetic demand over the stipulated period. (Source: CRISIL Report)
Key trends and growth drivers
Superior demand for decorative aesthetics will be driven by the following factors:
Growth in the underlying application segments
India is one of the fastest growing market for passenger vehicles and consumer durables in the world. CRISIL Research projects
two-wheelers and passenger vehicle production to grow at a CAGR of 10.00% to 12.00% each, over Fiscals 2021 to 2026. Even
the demand for consumer durables is expected to grow at a 10.00% to 12.00% CAGR over the same period. India is one of the
fastest-growing markets in the world for passenger vehicle, two-wheeler and consumer durables. Demand for passenger vehicles
is expected to be aided by low current penetration, rising disposable income, increment and improvement in road connectivity.
Whereas demand for two-wheelers is also expected to be aided by rising disposable income, increment and improvement in
road connectivity. Production of passenger vehicles and two-wheelers will be aided by the emergence of India as an export hub
to developed as well as developing economies. Whereas, the demand for consumer durables will be driven by low current
penetration, especially in case of room ACs, washing machines, rising disposable income and improvement in the standard of
living, rising urbanisation and nuclearisation of families. (Source: CRISIL Report)
In addition, India has emerged has manufacturing hub for key global OEMs which are increasingly considering to cater to their
global customer base with passenger vehicles manufactured in India. Indian passenger vehicle exports which accounted for
approximately 13.00% of domestic passenger vehicle production in Fiscal 2021, are projected to grow at a CAGR of 11.00%
to 13.00% between Fiscals 2021 and 2026. Similarly, aesthetic product suppliers are expected to gain from export potential of
other automobile segments such as two wheelers, three wheelers, tractors, and commercial vehicle as well as consumer
appliances in future. (Source: CRISIL Report)
Shift towards premium products/variants
Consumers are increasingly preferring premium, aesthetically superior and technology savvy products, driven by rising
disposable income and exposure to developed markets. Consumers are emotionally attached with discretionary products, such
45-47%
45-47%
8-9% Two wheelers
Passenger
vehicles
Consumer
durables
11-
13%
25-27%
20-22%7-9%
26-28%
~5% ~1%
Logos
Decals, stickers
IMD/ IML
Optical plastics
Chrome plated
parts
Appliques
Overlays
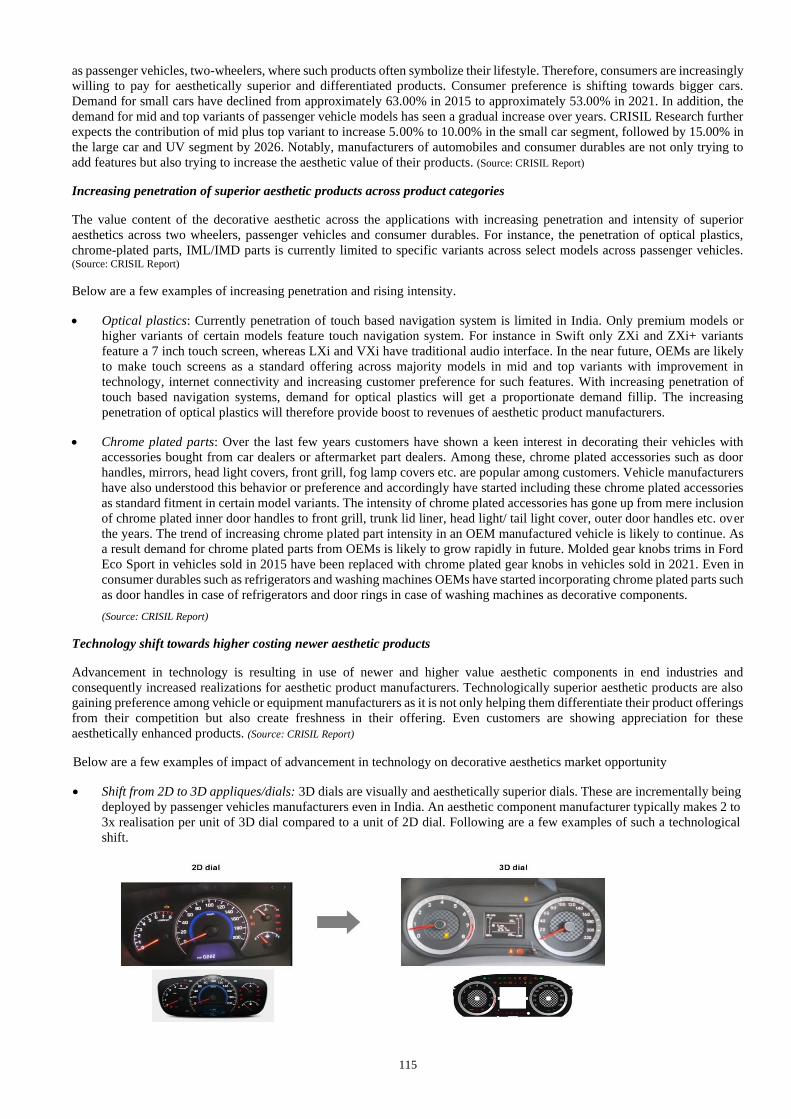
115
as passenger vehicles, two-wheelers, where such products often symbolize their lifestyle. Therefore, consumers are increasingly
willing to pay for aesthetically superior and differentiated products. Consumer preference is shifting towards bigger cars.
Demand for small cars have declined from approximately 63.00% in 2015 to approximately 53.00% in 2021. In addition, the
demand for mid and top variants of passenger vehicle models has seen a gradual increase over years. CRISIL Research further
expects the contribution of mid plus top variant to increase 5.00% to 10.00% in the small car segment, followed by 15.00% in
the large car and UV segment by 2026. Notably, manufacturers of automobiles and consumer durables are not only trying to
add features but also trying to increase the aesthetic value of their products. (Source: CRISIL Report)
Increasing penetration of superior aesthetic products across product categories
The value content of the decorative aesthetic across the applications with increasing penetration and intensity of superior
aesthetics across two wheelers, passenger vehicles and consumer durables. For instance, the penetration of optical plastics,
chrome-plated parts, IML/IMD parts is currently limited to specific variants across select models across passenger vehicles. (Source: CRISIL Report)
Below are a few examples of increasing penetration and rising intensity.
• Optical plastics: Currently penetration of touch based navigation system is limited in India. Only premium models or
higher variants of certain models feature touch navigation system. For instance in Swift only ZXi and ZXi+ variants
feature a 7 inch touch screen, whereas LXi and VXi have traditional audio interface. In the near future, OEMs are likely
to make touch screens as a standard offering across majority models in mid and top variants with improvement in
technology, internet connectivity and increasing customer preference for such features. With increasing penetration of
touch based navigation systems, demand for optical plastics will get a proportionate demand fillip. The increasing
penetration of optical plastics will therefore provide boost to revenues of aesthetic product manufacturers.
• Chrome plated parts: Over the last few years customers have shown a keen interest in decorating their vehicles with
accessories bought from car dealers or aftermarket part dealers. Among these, chrome plated accessories such as door
handles, mirrors, head light covers, front grill, fog lamp covers etc. are popular among customers. Vehicle manufacturers
have also understood this behavior or preference and accordingly have started including these chrome plated accessories
as standard fitment in certain model variants. The intensity of chrome plated accessories has gone up from mere inclusion
of chrome plated inner door handles to front grill, trunk lid liner, head light/ tail light cover, outer door handles etc. over
the years. The trend of increasing chrome plated part intensity in an OEM manufactured vehicle is likely to continue. As
a result demand for chrome plated parts from OEMs is likely to grow rapidly in future. Molded gear knobs trims in Ford
Eco Sport in vehicles sold in 2015 have been replaced with chrome plated gear knobs in vehicles sold in 2021. Even in
consumer durables such as refrigerators and washing machines OEMs have started incorporating chrome plated parts such
as door handles in case of refrigerators and door rings in case of washing machines as decorative components.
(Source: CRISIL Report)
Technology shift towards higher costing newer aesthetic products
Advancement in technology is resulting in use of newer and higher value aesthetic components in end industries and
consequently increased realizations for aesthetic product manufacturers. Technologically superior aesthetic products are also
gaining preference among vehicle or equipment manufacturers as it is not only helping them differentiate their product offerings
from their competition but also create freshness in their offering. Even customers are showing appreciation for these
aesthetically enhanced products. (Source: CRISIL Report)
Below are a few examples of impact of advancement in technology on decorative aesthetics market opportunity
• Shift from 2D to 3D appliques/dials: 3D dials are visually and aesthetically superior dials. These are incrementally being
deployed by passenger vehicles manufacturers even in India. An aesthetic component manufacturer typically makes 2 to
3x realisation per unit of 3D dial compared to a unit of 2D dial. Following are a few examples of such a technological
shift.

116
- Hyundai i10 Neos in 2021 features a speedometer with a 3D dial whereas older generation of Hyundai i10 had
speedometers with 2D dials.
• Shift from analogue to analogue- digital appliques/ dials: Popular two wheeler models such as Hero Passion Pro, Bajaj
Pulsar 125, Hero Glamour offer analogue- digital dials which cost around 6 to 8x times of pure analogue dial. Following
are a few examples of such a technological shift.
- Top variant of Suzuki Access in 2021 comes with fully digital speedometer which make use of optical plastics. In
past even the top variant Suzuki Access featured an analogue speedometer where 2D dials were used.
- Top variants of TVS Jupiter and Honda Activa 125 have shifted to digital+ analogue speedometer. Models sold for
instance in Fiscal 2015 had only 2-D dials.
• Shift from analogue to touch based navigation system in cars: Shift from analogue to touch based navigation technology
has created a new opportunity for deployment of aesthetic products such as optical plastics. Depending upon vehicle
segments, different sizes of screens are being deployed in vehicles. For instance, compared to a 7 inch screen in Swift,
Creta features an 8 or 10 inch touch screen depending upon variant. OEMs are launching model facelifts with larger
screen sizes compared to older versions. Therefore in addition to increasing penetration of optical plastics, demand for
optical plastic is getting additional fillip due to increasing sizes of touch screens. An aesthetic component manufacturer
makes around ₹350 to ₹500 per optical screen in a passenger vehicle depending upon size of the screen. Following are a
few examples of such a technological shift. Optical plastics have opened altogether a new business opportunity for
aesthetic product manufacturers. In vehicles with TFT displays with no touch option there is no aesthetic component
supply opportunity.
- In Fiscal 2015 even the top variant of Swift featured traditional infotainment system; in Fiscal 2021 ZX, ZXi
variants of Swift feature 10.78 cm touchscreen infotainment system.
- Even in case of Hyundai i10 Grand, models sold in Fiscal 2017 featured traditional infotainment system; whereas
in Fiscal 2021 Sportz, Turbo and Asta variants have 20.25 cm touchscreen infotainment system.
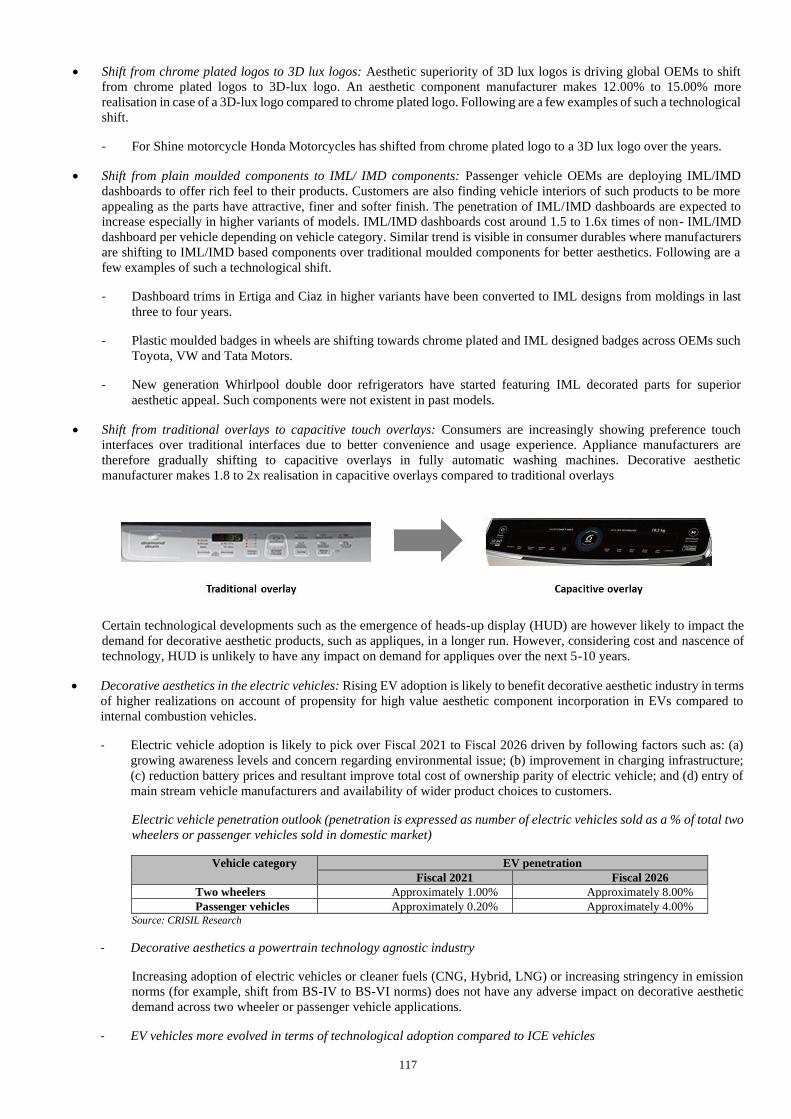
117
• Shift from chrome plated logos to 3D lux logos: Aesthetic superiority of 3D lux logos is driving global OEMs to shift
from chrome plated logos to 3D-lux logo. An aesthetic component manufacturer makes 12.00% to 15.00% more
realisation in case of a 3D-lux logo compared to chrome plated logo. Following are a few examples of such a technological
shift.
- For Shine motorcycle Honda Motorcycles has shifted from chrome plated logo to a 3D lux logo over the years.
• Shift from plain moulded components to IML/ IMD components: Passenger vehicle OEMs are deploying IML/IMD
dashboards to offer rich feel to their products. Customers are also finding vehicle interiors of such products to be more
appealing as the parts have attractive, finer and softer finish. The penetration of IML/IMD dashboards are expected to
increase especially in higher variants of models. IML/IMD dashboards cost around 1.5 to 1.6x times of non- IML/IMD
dashboard per vehicle depending on vehicle category. Similar trend is visible in consumer durables where manufacturers
are shifting to IML/IMD based components over traditional moulded components for better aesthetics. Following are a
few examples of such a technological shift.
- Dashboard trims in Ertiga and Ciaz in higher variants have been converted to IML designs from moldings in last
three to four years.
- Plastic moulded badges in wheels are shifting towards chrome plated and IML designed badges across OEMs such
Toyota, VW and Tata Motors.
- New generation Whirlpool double door refrigerators have started featuring IML decorated parts for superior
aesthetic appeal. Such components were not existent in past models.
• Shift from traditional overlays to capacitive touch overlays: Consumers are increasingly showing preference touch
interfaces over traditional interfaces due to better convenience and usage experience. Appliance manufacturers are
therefore gradually shifting to capacitive overlays in fully automatic washing machines. Decorative aesthetic
manufacturer makes 1.8 to 2x realisation in capacitive overlays compared to traditional overlays
Certain technological developments such as the emergence of heads-up display (HUD) are however likely to impact the
demand for decorative aesthetic products, such as appliques, in a longer run. However, considering cost and nascence of
technology, HUD is unlikely to have any impact on demand for appliques over the next 5-10 years.
• Decorative aesthetics in the electric vehicles: Rising EV adoption is likely to benefit decorative aesthetic industry in terms
of higher realizations on account of propensity for high value aesthetic component incorporation in EVs compared to
internal combustion vehicles.
- Electric vehicle adoption is likely to pick over Fiscal 2021 to Fiscal 2026 driven by following factors such as: (a)
growing awareness levels and concern regarding environmental issue; (b) improvement in charging infrastructure;
(c) reduction battery prices and resultant improve total cost of ownership parity of electric vehicle; and (d) entry of
main stream vehicle manufacturers and availability of wider product choices to customers.
Electric vehicle penetration outlook (penetration is expressed as number of electric vehicles sold as a % of total two
wheelers or passenger vehicles sold in domestic market)
Vehicle category EV penetration
Fiscal 2021 Fiscal 2026
Two wheelers Approximately 1.00% Approximately 8.00%
Passenger vehicles Approximately 0.20% Approximately 4.00% Source: CRISIL Research
- Decorative aesthetics a powertrain technology agnostic industry
Increasing adoption of electric vehicles or cleaner fuels (CNG, Hybrid, LNG) or increasing stringency in emission
norms (for example, shift from BS-IV to BS-VI norms) does not have any adverse impact on decorative aesthetic
demand across two wheeler or passenger vehicle applications.
- EV vehicles more evolved in terms of technological adoption compared to ICE vehicles
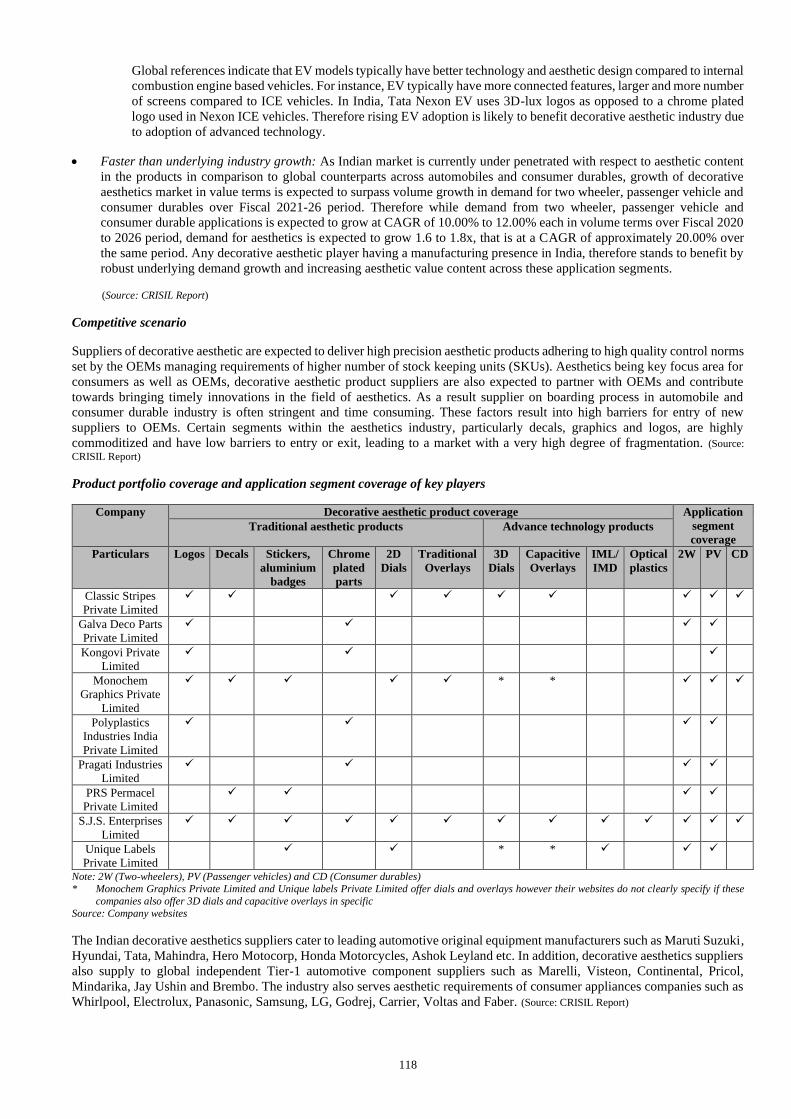
118
Global references indicate that EV models typically have better technology and aesthetic design compared to internal
combustion engine based vehicles. For instance, EV typically have more connected features, larger and more number
of screens compared to ICE vehicles. In India, Tata Nexon EV uses 3D-lux logos as opposed to a chrome plated
logo used in Nexon ICE vehicles. Therefore rising EV adoption is likely to benefit decorative aesthetic industry due
to adoption of advanced technology.
• Faster than underlying industry growth: As Indian market is currently under penetrated with respect to aesthetic content
in the products in comparison to global counterparts across automobiles and consumer durables, growth of decorative
aesthetics market in value terms is expected to surpass volume growth in demand for two wheeler, passenger vehicle and
consumer durables over Fiscal 2021-26 period. Therefore while demand from two wheeler, passenger vehicle and
consumer durable applications is expected to grow at CAGR of 10.00% to 12.00% each in volume terms over Fiscal 2020
to 2026 period, demand for aesthetics is expected to grow 1.6 to 1.8x, that is at a CAGR of approximately 20.00% over
the same period. Any decorative aesthetic player having a manufacturing presence in India, therefore stands to benefit by
robust underlying demand growth and increasing aesthetic value content across these application segments.
(Source: CRISIL Report)
Competitive scenario
Suppliers of decorative aesthetic are expected to deliver high precision aesthetic products adhering to high quality control norms
set by the OEMs managing requirements of higher number of stock keeping units (SKUs). Aesthetics being key focus area for
consumers as well as OEMs, decorative aesthetic product suppliers are also expected to partner with OEMs and contribute
towards bringing timely innovations in the field of aesthetics. As a result supplier on boarding process in automobile and
consumer durable industry is often stringent and time consuming. These factors result into high barriers for entry of new
suppliers to OEMs. Certain segments within the aesthetics industry, particularly decals, graphics and logos, are highly
commoditized and have low barriers to entry or exit, leading to a market with a very high degree of fragmentation. (Source:
CRISIL Report)
Product portfolio coverage and application segment coverage of key players
Company Decorative aesthetic product coverage Application
segment
coverage Traditional aesthetic products Advance technology products
Particulars Logos Decals Stickers,
aluminium
badges
Chrome
plated
parts
2D
Dials
Traditional
Overlays
3D
Dials
Capacitive
Overlays
IML/
IMD
Optical
plastics
2W PV CD
Classic Stripes
Private Limited
✓ ✓
✓ ✓ ✓ ✓
✓ ✓ ✓
Galva Deco Parts
Private Limited
✓
✓
✓ ✓
Kongovi Private
Limited
✓
✓
✓
Monochem
Graphics Private
Limited
✓ ✓ ✓
✓ ✓ * *
✓ ✓ ✓
Polyplastics
Industries India
Private Limited
✓
✓
✓ ✓
Pragati Industries
Limited
✓
✓
✓ ✓
PRS Permacel
Private Limited
✓ ✓
✓ ✓
S.J.S. Enterprises
Limited
✓ ✓ ✓ ✓ ✓ ✓ ✓ ✓ ✓ ✓ ✓ ✓ ✓
Unique Labels
Private Limited
✓
✓
* * ✓
✓ ✓
Note: 2W (Two-wheelers), PV (Passenger vehicles) and CD (Consumer durables)
* Monochem Graphics Private Limited and Unique labels Private Limited offer dials and overlays however their websites do not clearly specify if these
companies also offer 3D dials and capacitive overlays in specific
Source: Company websites
The Indian decorative aesthetics suppliers cater to leading automotive original equipment manufacturers such as Maruti Suzuki,
Hyundai, Tata, Mahindra, Hero Motocorp, Honda Motorcycles, Ashok Leyland etc. In addition, decorative aesthetics suppliers
also supply to global independent Tier-1 automotive component suppliers such as Marelli, Visteon, Continental, Pricol,
Mindarika, Jay Ushin and Brembo. The industry also serves aesthetic requirements of consumer appliances companies such as
Whirlpool, Electrolux, Panasonic, Samsung, LG, Godrej, Carrier, Voltas and Faber. (Source: CRISIL Report)
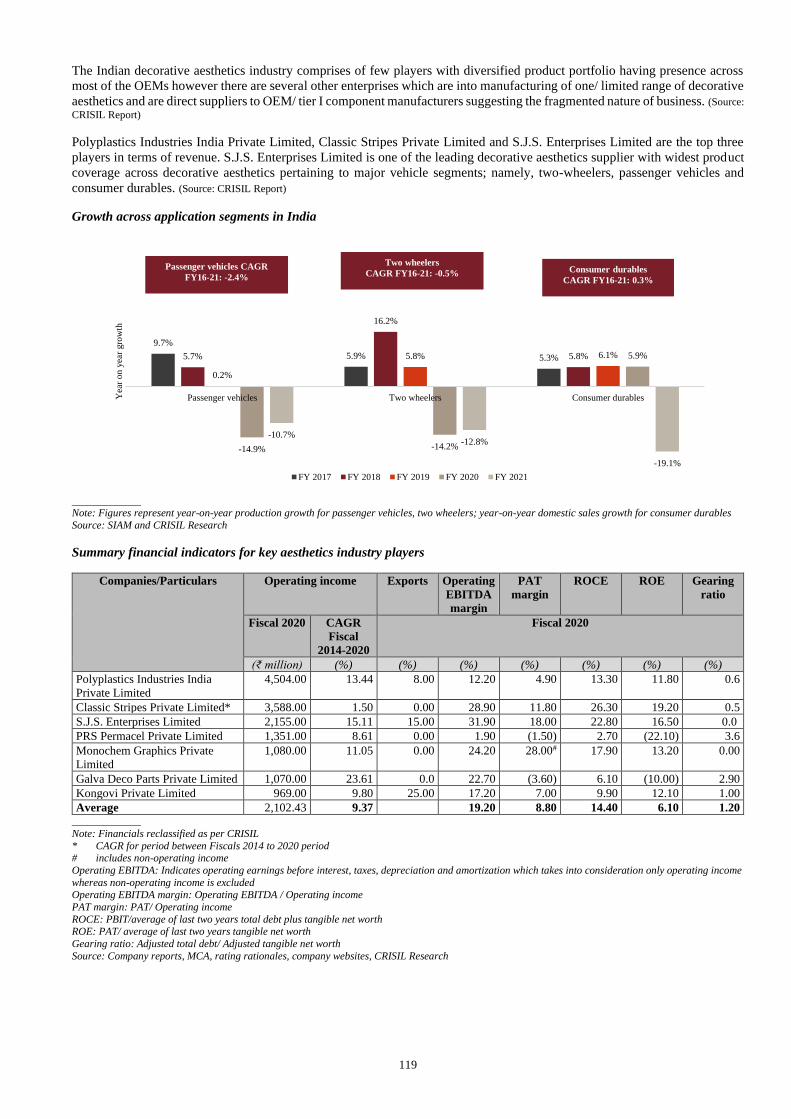
119
The Indian decorative aesthetics industry comprises of few players with diversified product portfolio having presence across
most of the OEMs however there are several other enterprises which are into manufacturing of one/ limited range of decorative
aesthetics and are direct suppliers to OEM/ tier I component manufacturers suggesting the fragmented nature of business. (Source:
CRISIL Report)
Polyplastics Industries India Private Limited, Classic Stripes Private Limited and S.J.S. Enterprises Limited are the top three
players in terms of revenue. S.J.S. Enterprises Limited is one of the leading decorative aesthetics supplier with widest product
coverage across decorative aesthetics pertaining to major vehicle segments; namely, two-wheelers, passenger vehicles and
consumer durables. (Source: CRISIL Report)
Growth across application segments in India
_____________ Note: Figures represent year-on-year production growth for passenger vehicles, two wheelers; year-on-year domestic sales growth for consumer durables
Source: SIAM and CRISIL Research
Summary financial indicators for key aesthetics industry players
Companies/Particulars Operating income Exports Operating
EBITDA
margin
PAT
margin
ROCE ROE Gearing
ratio
Fiscal 2020 CAGR
Fiscal
2014-2020
Fiscal 2020
(₹ million) (%) (%) (%) (%) (%) (%) (%)
Polyplastics Industries India
Private Limited
4,504.00 13.44 8.00 12.20 4.90 13.30 11.80 0.6
Classic Stripes Private Limited* 3,588.00 1.50 0.00 28.90 11.80 26.30 19.20 0.5
S.J.S. Enterprises Limited 2,155.00 15.11 15.00 31.90 18.00 22.80 16.50 0.0
PRS Permacel Private Limited 1,351.00 8.61 0.00 1.90 (1.50) 2.70 (22.10) 3.6
Monochem Graphics Private
Limited
1,080.00 11.05 0.00 24.20 28.00# 17.90 13.20 0.00
Galva Deco Parts Private Limited 1,070.00 23.61 0.0 22.70 (3.60) 6.10 (10.00) 2.90
Kongovi Private Limited 969.00 9.80 25.00 17.20 7.00 9.90 12.10 1.00
Average 2,102.43 9.37 19.20 8.80 14.40 6.10 1.20 _____________
Note: Financials reclassified as per CRISIL
* CAGR for period between Fiscals 2014 to 2020 period # includes non-operating income
Operating EBITDA: Indicates operating earnings before interest, taxes, depreciation and amortization which takes into consideration only operating income
whereas non-operating income is excluded Operating EBITDA margin: Operating EBITDA / Operating income
PAT margin: PAT/ Operating income
ROCE: PBIT/average of last two years total debt plus tangible net worth ROE: PAT/ average of last two years tangible net worth
Gearing ratio: Adjusted total debt/ Adjusted tangible net worth
Source: Company reports, MCA, rating rationales, company websites, CRISIL Research
9.7%
5.9% 5.3%5.7%
16.2%
5.8%
0.2%
5.8% 6.1%
-14.9% -14.2%
5.9%
-10.7%-12.8%
-19.1%
Passenger vehicles Two wheelers Consumer durablesYea
r on y
ear
gro
wth
FY 2017 FY 2018 FY 2019 FY 2020 FY 2021
Passenger vehicles CAGR
FY16-21: -2.4%
Two wheelers
CAGR FY16-21: -0.5% Consumer durables
CAGR FY16-21: 0.3%

120
OUR BUSINESS
Certain information in the following discussion, including information with respect to our plans and strategies, contains forward-
looking statements that involve risks and uncertainties. Please see “Forward-Looking Statements” and “Risk Factors” on pages 23
and 25, respectively, for a discussion of certain factors that may affect our business, results of operations or financial condition. Our
actual results may differ materially from those expressed in or implied by these forward-looking statements.
Unless otherwise indicated or the context requires otherwise, the financial information included herein is based on our Restated
Consolidated Financial Information. Our Proforma Condensed Consolidated Financial Information included in this Red Herring
Prospectus shows the impact of the Exotech Acquisition on our Company, its financial performance for the year ended March 31,
2021 and financial condition as at March 31, 2021, as if the acquisition had been completed at an earlier date selected in accordance
with the SEBI ICDR Regulations. For further information, see “Financial Information” and “Proforma Condensed Consolidated
Financial Information” on pages 183 and 291, respectively.
In this Red Herring Prospectus, unless specified otherwise, any reference to “the Company” or “our Company” refers to S.J.S.
Enterprises Limited, on a standalone basis, and a reference to “we”, “us” or “our”: (1) for any period prior to April 1, 2021 is a
reference to our Company on a standalone basis, and (2) for any period after April 1, 2021 is a reference to our Company together
with our Subsidiary, on a consolidated basis. Additionally, please refer to “Definitions and Abbreviations” on page 1 for certain
terms used in this section. Our Restated Consolidated Financial Information as at and for the three month period ended June 30, 2021
(which includes the financial performance and financial condition of Exotech) may not be comparable to our Restated Consolidated
Financial Information for prior periods.
The industry related information contained in this section is derived or extracted from the CRISIL Report which has been
commissioned, and paid for, by our Company for the purposes of confirming our understanding of the aesthetics industry exclusively
in connection with the Offer. See “Industry Overview” on page 96 for more information relating to the markets covered by the CRISIL
Report and the size of the aesthetics industry. Also see “Risk Factors—47. This Red Herring Prospectus contains information from
industry sources including the industry report prepared by CRISIL which has been commissioned, and paid for, by our Company for
the purpose of this Red Herring Prospectus. Investors are advised not to place undue reliance on such information.” on page 50.
OVERVIEW
Our Company is one of the leading players in the Indian decorative aesthetics industry in terms of revenue in Fiscal 2020 and
as at March 31, 2021, offered the widest range of aesthetics products in India, according to the CRISIL Report. We are a
“design-to-delivery” aesthetics solutions provider with the ability to design, develop and manufacture a diverse product
portfolio for a wide range of customers primarily in the automotive and consumer appliance industries. Our Company supplied
over 115 million parts with more than 6,000 SKUs in Fiscal 2021 to around 170 customers in approximately 90 cities across
20 countries. We differentiate ourselves on the basis of the wide range of our product portfolio, quality of our product offerings,
our product design and development capabilities and the strength of our relationships with customers located across various
industries globally.
In addition to manufacturing aesthetics products that cater to the requirements for two-wheeler, passenger vehicle and consumer
appliance industries, we also manufacture a wide range of aesthetics products that cater to the requirements of the commercial
vehicles, medical devices, farm equipment and sanitary ware industries. Our product offerings include decals and body graphics,
2D appliques and dials, 3D appliques and dials, 3D lux badges, domes, overlays, aluminium badges, “In-mould” label or
decoration parts (“IML/IMD(s)”), lens mask assembly and chrome-plated, printed and painted injection moulded plastic parts.
We also offer a variety of accessories for the two-wheelers’ and passenger vehicles’ aftermarket under our “Transform” brand.
Our key customer base includes:
• well-known automotive original equipment manufacturers (“OEMs”) such as Suzuki, Mahindra & Mahindra, John Deere,
Volkswagen, Ashok Leyland, Honda Motorcycle, Bajaj Auto, Royal Enfield and TVS Motors;
• Tier-1 automotive component suppliers such as Marelli, Visteon, Brembo and Mindarika;
• well-known consumer durables/appliances manufacturers such as Whirlpool, Panasonic, Samsung, Eureka Forbes, Godrej
and Liebherr;
• medical devices manufacturers such as Sensa Core; and
• sanitary ware manufacturers such as Geberit.
We have developed long-standing relationships with several customers. As at June 30, 2021, our Company’s relationship with
its 10 largest customers in terms of revenue averaged approximately 15 years. We believe that this is attributable to our
collaborative design and product development approach and high product quality. We also credit our customer loyalty to our
ability to offer “design-to-delivery” aesthetics solutions with the use of sophisticated equipment and application of new
techniques.
In the three month period ended June 30, 2021 and Fiscals 2021, 2020 and 2019, our Company’s sales to OEMs contributed
66.23%, 69.94%, 69.75% and 74.26%, respectively and sales to Tier-1 suppliers contributed 33.49%, 29.70%, 29.88% and

121
25.60%, respectively, to our Company’s revenue from operations in those periods. In the three month period ended June 30,
2021 and Fiscals 2021, 2020 and 2019, our Company’s sales of products and services to two-wheeler OEMs and Tier-1 suppliers
contributed 49.49%, 58.01%, 61.29% and 69.99% and sales of products and services to passenger vehicle OEMs and Tier-1
suppliers contributed 21.46%, 16.63%, 14.73% and 10.22%, to our Company’s revenue from operations, respectively, with a
majority of the remaining portion being contributed by sales to consumer appliance manufacturers. Our Subsidiary, Exotech,
which we acquired on April 5, 2021, caters to requirements in the two-wheelers, passenger vehicles, consumer
durables/appliances, farm equipment and sanitary ware industries for chrome-plated, printed and painted injection moulded
plastic parts. The acquisition has enhanced our product suite and customer base and provided us cross-selling opportunities to
our existing and future customer base.
According to the CRISIL Report, the demand for aesthetics in India is expected to grow at a CAGR of approximately 20.00%
over the Fiscal 2021 to Fiscal 2026 period to reach approximately ₹49.20 billion by Fiscal 2026 and is expected to surpass
volume growth in demand for two-wheelers, passenger vehicles and consumer durables over that period. We expect the global
aesthetics industry to follow a similar trend. According to the CRISIL Report, the aesthetics products industry is expected to
benefit from the increasing use by consumers of premium, aesthetically superior and technologically advanced products, which
are characterized by relatively higher pricing and higher growth potential. According to the CRISIL Report, use of
technologically advanced and higher value aesthetic products in end industries is contributing to increased realizations for
aesthetic product manufacturers. Examples of this trend include use of IML/IMD components in passenger vehicles interiors,
3D appliques instead of 2D appliques in passenger vehicles and hybrid analogue-digital dials instead of analogue dials in two-
wheelers.
With significant experience in the aesthetics industry and track record of supplying premium products, we believe that we are
well positioned to benefit from these growth trends. We have demonstrated the ability to offer premium products through our
design capabilities. For instance, we successfully diversified our product portfolio with IMLs/IMDs, 3D appliques, lens mask
assemblies and optical plastics in anticipation of, and to benefit from, these trends.
We manufacture our products from modern manufacturing facilities located in Bengaluru and Pune in India, with the facility
in Pune acquired as part of the recent acquisition of our Subsidiary. As at June 30, 2021, the annual production capacity of the
Bengaluru and Pune facilities was 209.70 million and 29.50 million products, respectively. In the three month period ended
June 30, 2021, our Company and our Subsidiary produced 21.27 million and 3.95 million products, respectively, resulting in
capacity utilization rates of 10.14% and 13.38% respectively, and their revenue from operations during the three month period
ended June 30, 2021 were ₹568.07 million and ₹174.62 million, respectively. Further, in Fiscal 2021, our Company and our
Subsidiary produced 91.94 million and 15.60 million products, respectively, resulting in capacity utilization rates of 44.07%
and 52.88% respectively, and their revenue from operations during Fiscal 2021 were ₹2,516.16 million and ₹685.26 million,
respectively. We incurred capital expenditure in Fiscals 2018 and 2019 for our Bengaluru facility, with advanced equipment
and technology systems. As a result, we believe that the annual production capacity at our Bengaluru facility can be increased
to 209.70 million products without significant additional capital expenditure.
Our Company has a strong focus on new product development (“NPD”). It has a dedicated NPD team and an in-house styling
studio with design, development, engineering and technological capabilities, which enables us to co-design new products with
customers in the product development process. We also conceptualize new designs at the design studio in our Company’s
Bengaluru facility. Our products are subject to stringent quality checks and testing in laboratories at our facilities. We have an
established supply chain and a well distributed delivery mechanism. Our Company has implemented systems for ERP and our
Subsidiary has implemented automation and centralized control through supervisory control and data acquisition (“SCADA”)
system.
We have received various awards and recognitions from our customers, including for excellence in supply, quality,
performance, delivery and price competitiveness, which is a testimony to the value we offer our customers. Our Company has
received awards from Automotive Component Manufacturers Association of India (“ACMA”) and recognition from the Quality
Circle Forum of India (“QCFI”), an industry body.
K.A. Joseph, our Managing Director and one of our Promoters, has over 34 years of experience in the aesthetics printing
business and has been instrumental in the establishment and growth of our business. Sanjay Thapar, our Chief Executive Officer,
has over 30 years of experience in the automotive industry and has been associated with our Company since 2015. He has led,
and has shaped, our Company’s product strategy and international business expansion in recent years. We have a professional
management team with extensive experience across various industries and a proven track record of performance. As at June 30,
2021, our Company had 509 permanent employees and our Subsidiary had 105 permanent employees. Our Company also
received the “Great Workplace” award in the category of “Small and Mid-Sized Organizations” by Great Place to Work
Institute, India in 2020 and 2019. See “History and Certain Corporate Matters—Awards, certifications, accreditations and
recognitions received by our Company” on page 154 for further details.
Set out below is a summary of our financial and operational performance, for the periods indicated.
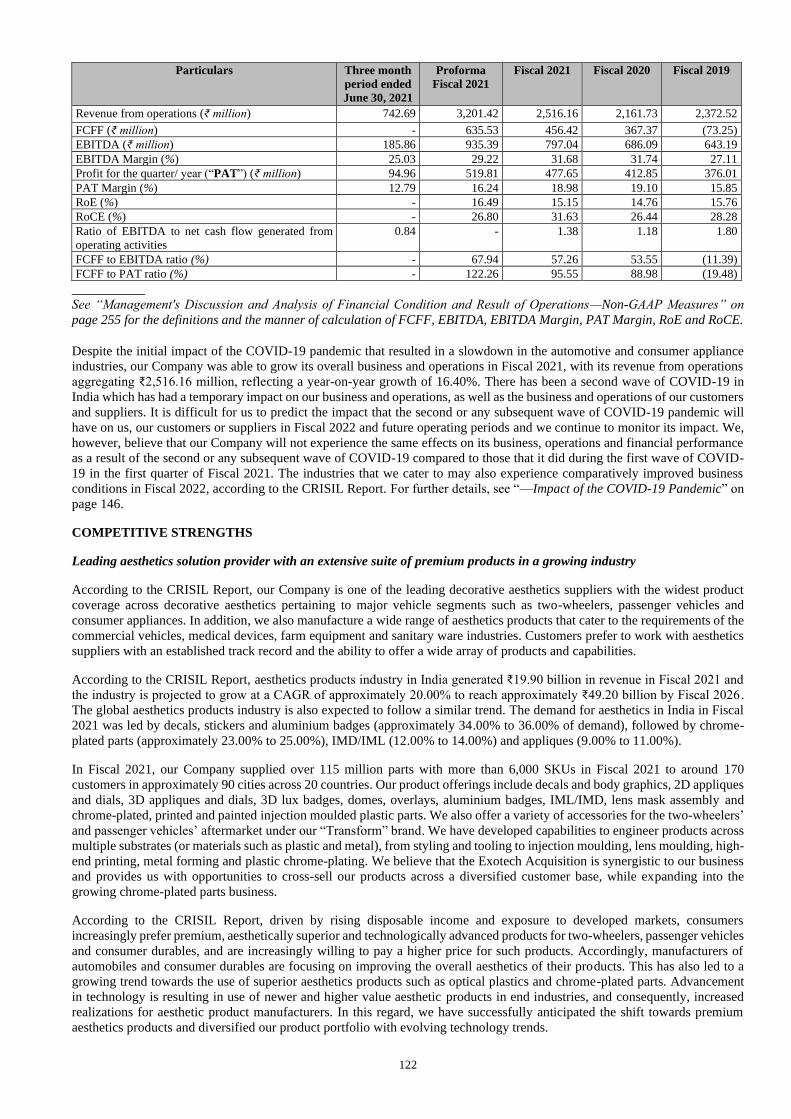
122
Particulars Three month
period ended
June 30, 2021
Proforma
Fiscal 2021
Fiscal 2021 Fiscal 2020 Fiscal 2019
Revenue from operations (₹ million) 742.69 3,201.42 2,516.16 2,161.73 2,372.52
FCFF (₹ million) - 635.53 456.42 367.37 (73.25)
EBITDA (₹ million) 185.86 935.39 797.04 686.09 643.19
EBITDA Margin (%) 25.03 29.22 31.68 31.74 27.11
Profit for the quarter/ year (“PAT”) (₹ million) 94.96 519.81 477.65 412.85 376.01
PAT Margin (%) 12.79 16.24 18.98 19.10 15.85
RoE (%) - 16.49 15.15 14.76 15.76
RoCE (%) - 26.80 31.63 26.44 28.28
Ratio of EBITDA to net cash flow generated from
operating activities
0.84 - 1.38 1.18 1.80
FCFF to EBITDA ratio (%) - 67.94 57.26 53.55 (11.39)
FCFF to PAT ratio (%) - 122.26 95.55 88.98 (19.48)
___________
See “Management's Discussion and Analysis of Financial Condition and Result of Operations—Non-GAAP Measures” on
page 255 for the definitions and the manner of calculation of FCFF, EBITDA, EBITDA Margin, PAT Margin, RoE and RoCE.
Despite the initial impact of the COVID-19 pandemic that resulted in a slowdown in the automotive and consumer appliance
industries, our Company was able to grow its overall business and operations in Fiscal 2021, with its revenue from operations
aggregating ₹2,516.16 million, reflecting a year-on-year growth of 16.40%. There has been a second wave of COVID-19 in
India which has had a temporary impact on our business and operations, as well as the business and operations of our customers
and suppliers. It is difficult for us to predict the impact that the second or any subsequent wave of COVID-19 pandemic will
have on us, our customers or suppliers in Fiscal 2022 and future operating periods and we continue to monitor its impact. We,
however, believe that our Company will not experience the same effects on its business, operations and financial performance
as a result of the second or any subsequent wave of COVID-19 compared to those that it did during the first wave of COVID-
19 in the first quarter of Fiscal 2021. The industries that we cater to may also experience comparatively improved business
conditions in Fiscal 2022, according to the CRISIL Report. For further details, see “—Impact of the COVID-19 Pandemic” on
page 146.
COMPETITIVE STRENGTHS
Leading aesthetics solution provider with an extensive suite of premium products in a growing industry
According to the CRISIL Report, our Company is one of the leading decorative aesthetics suppliers with the widest product
coverage across decorative aesthetics pertaining to major vehicle segments such as two-wheelers, passenger vehicles and
consumer appliances. In addition, we also manufacture a wide range of aesthetics products that cater to the requirements of the
commercial vehicles, medical devices, farm equipment and sanitary ware industries. Customers prefer to work with aesthetics
suppliers with an established track record and the ability to offer a wide array of products and capabilities.
According to the CRISIL Report, aesthetics products industry in India generated ₹19.90 billion in revenue in Fiscal 2021 and
the industry is projected to grow at a CAGR of approximately 20.00% to reach approximately ₹49.20 billion by Fiscal 2026 .
The global aesthetics products industry is also expected to follow a similar trend. The demand for aesthetics in India in Fiscal
2021 was led by decals, stickers and aluminium badges (approximately 34.00% to 36.00% of demand), followed by chrome-
plated parts (approximately 23.00% to 25.00%), IMD/IML (12.00% to 14.00%) and appliques (9.00% to 11.00%).
In Fiscal 2021, our Company supplied over 115 million parts with more than 6,000 SKUs in Fiscal 2021 to around 170
customers in approximately 90 cities across 20 countries. Our product offerings include decals and body graphics, 2D appliques
and dials, 3D appliques and dials, 3D lux badges, domes, overlays, aluminium badges, IML/IMD, lens mask assembly and
chrome-plated, printed and painted injection moulded plastic parts. We also offer a variety of accessories for the two-wheelers’
and passenger vehicles’ aftermarket under our “Transform” brand. We have developed capabilities to engineer products across
multiple substrates (or materials such as plastic and metal), from styling and tooling to injection moulding, lens moulding, high-
end printing, metal forming and plastic chrome-plating. We believe that the Exotech Acquisition is synergistic to our business
and provides us with opportunities to cross-sell our products across a diversified customer base, while expanding into the
growing chrome-plated parts business.
According to the CRISIL Report, driven by rising disposable income and exposure to developed markets, consumers
increasingly prefer premium, aesthetically superior and technologically advanced products for two-wheelers, passenger vehicles
and consumer durables, and are increasingly willing to pay a higher price for such products. Accordingly, manufacturers of
automobiles and consumer durables are focusing on improving the overall aesthetics of their products. This has also led to a
growing trend towards the use of superior aesthetics products such as optical plastics and chrome-plated parts. Advancement
in technology is resulting in use of newer and higher value aesthetic products in end industries, and consequently, increased
realizations for aesthetic product manufacturers. In this regard, we have successfully anticipated the shift towards premium
aesthetics products and diversified our product portfolio with evolving technology trends.

123
We have demonstrated the ability to differentiate our offerings and believe that we are well positioned to continue to benefit
from the increasing trend of premiumization across the automotive and consumer appliances industries. For instance, we
successfully anticipated the shift towards premium aesthetics products and diversified our product portfolio. We began offering
IML/IMD, 3D appliques, lens mask assemblies and optical plastics to meet the increasing demand from our customers and have
been customizing products for our customers based on their needs.
We supply our products to customers in India as well as outside India (i.e., rest of the world). In the three month period ended
July 30, 2021 and Fiscals 2021, 2020 and 2019, 17.55%, 16.05%, 14.89% and 9.82%, respectively, of our Company’s revenue
from operations were derived from sales to customers outside India (i.e., rest of the world).
Strong manufacturing capabilities supported by an established supply chain and delivery mechanism
We manufacture our aesthetics products from manufacturing facilities located in Bengaluru and Pune in India spread across an
area of approximately 235,000 and 68,350 square feet, respectively. As at June 30, 2021, the annual production capacity of our
Company’s and our Subsidiary’s manufacturing facility was 209.70 million and 29.50 million products, respectively and their
capacity utilization rates were of 10.14% and 13.38%, respectively, during the three month period ended June 30, 2021, and
their revenue from operations during this period were ₹568.07 million and ₹174.62 million, respectively. Further, as at March
31, 2021, the annual production capacity of our Company’s and our Subsidiary’s manufacturing facility was 208.61 million
and 29.50 million products, respectively and their capacity utilization rates were of 44.07% and 52.88%, respectively, in Fiscal
2021, and their revenue from operations during Fiscal 2021 were ₹2,516.16 million and ₹685.26 million, respectively . We
incurred capital expenditure in Fiscals 2018 and 2019 for our Bengaluru facility, and we believe its annual production capacity
can be increased to 209.70 million products without significant additional capital expenditure. Also, our Bengaluru facility has
additional land to undertake further expansion, if required, to capitalize on the growth of our industry.
Our Company’s Bengaluru manufacturing facility is flexible, allowing us to interchange capacity and product mix across
various product categories and industries based on customer and operational requirements, enabling us to offer a diverse range
of products and services to our customers. This optimizes our machine productivity and operational efficiency and de-risks our
business model.
We believe that our focus on adopting new technologies, process improvement and automation has resulted in enhanced
productivity and operational efficiency. Our manufacturing facilities are compliant with environment, health and safety
management systems and are IATF and ISO certified. Our Bengaluru facility is LEED Gold certified by the U.S. Green Building
Council, generates renewable solar energy of approximately 2MW and has an ISO class 7 dust-free clean room which is required
for manufacturing certain high-precision products. We seek to continuously update and improve quality in line with the
requirements of our customers. Our quality assurance and quality control teams monitor the quality of raw material we procure,
our manufacturing processes and the end products we deliver.
Our Company has a sales and marketing team of 33 personnel. We have long-term relationships with our suppliers and
equipment vendors. Our products weigh less and are easier to transport. This allows us to centralize our delivery and serve
customers from our facilities and warehouses. The strength of our delivery mechanism is demonstrated by our Company’s
ability to supply our products to around 175 customers in approximately 90 cities across 20 countries, which is supported by
six warehouses located in states of Haryana, Uttarakhand, Maharashtra, Karnataka and Tamil Nadu in India. Our Subsidiary
delivers its products to approximately 60 locations in western, southern and central India, and has a warehouse located in Tamil
Nadu. We believe that our supply chain, manufacturing capabilities and delivery mechanism enable us to meet just-in-time
delivery schedules of our customers, particularly during the critical launch period of a model, and have contributed to the overall
growth of our business.
Strong innovation and product design and development capabilities
We offer a customized set of solutions to our customers, including collaborative design and product development, which along
with innovation and adoption of new technologies has been important to our business model and growth. Our designers
conceptualize and co-develop new designs for our customers at the design studio within our Company’s Bengaluru facility
which has advanced equipment. We possess in-house design, development and engineering capabilities which, we believe,
encourages innovation and improves efficiency in our manufacturing processes.
As at June 30, 2021, our Company had a team of 44 personnel for NPD, representing approximately 8.64% of its total on-roll
manpower as at that date. This included a dedicated design and development team of six personnel, which primarily works on
the design, development and prototypes of new products and certain product upgrades. Our Subsidiary also has a design
department which includes computer-aided-design (“CAD”) engineers, program managers and tooling managers to manage
any new product lifecycle. We have developed capabilities to engineer products using multiple material substrates (or materials
such as plastic and metal) and processes, from injection moulding to metal forming, with support (for analysis, simulation and
equipment supply) from dedicated suppliers that adhere to our stringent quality standards.
Our NPD process focuses on quality, cost, development and delivery across various phases, including simulation, validation,
launch, stabilization and production. This has allowed us to develop premium products and diversify our product range. For
124
instance, according to the CRISIL Report, our Company is the one of the few aesthetics product manufacturers in India to offer
advanced technology products such as capacitive overlays and optical plastics. Over the last few years, our Company has
introduced new, premium products, some of which were developed in-house, such as IML/IMDs (which are used in interior
panels for vehicles and in consumer appliances), aluminium badges, 3D dials, tactile overlays and lens mask assemblies. Our
Subsidiary also has the capability to develop rapid prototypes to support its customers. Our Subsidiary manufactures
approximately 50 to 60 injection moulding tools per year to meet the customization requirements of the customers.
Our Company has collaborated with customers from early stages of design and product development to engineering and
manufacturing. For example, our Company collaborated with Suzuki to design and develop aesthetics for its Swift, Ertiga and
WagonR passenger vehicle models. Other customers with whom our Company has collaborated on conceptualizing and
designing aesthetics include Honda Motorcycle, Royal Enfield, TVS Motors, Eureka Forbes, Bajaj Auto and Whirlpool. We
believe that this has also helped us strengthen our product design and development capabilities and become a “design-to-
delivery” destination for our customers.
Long-standing customer relationships
Our key customer base includes automotive OEMs, global Tier-1 automotive component suppliers, consumer durables/
appliances manufacturers, medical devices manufacturers and sanitary ware manufacturers.
We have developed long-standing relationships with several customers. As at June 30, 2021, our Company’s relationship with
its 10 largest customers in terms of revenue averaged approximately 15 years. We believe that this is attributable to our
collaborative design and product development approach and high product quality. We also credit our customer loyalty to our
ability to offer “design-to-delivery” aesthetics solutions with the use of sophisticated equipment and application of new
techniques. Our Company also been able to attract new customers and significantly expand its customer base over the last three
fiscal years in India and abroad.
We typically enter into a customer relationship for a specific product line, seeking to demonstrate the quality and cost efficiency
of our product and services. Thereafter, in order to increase share of our business with customers, we pursue cross-selling
opportunities and seek to expand to other product lines and geographic areas with the customer and its related entities.
For example, our Company successfully expanded its offerings to a leading Tier-1 global independent supplier of products for
the automotive industry, with whom it established a relationship for the supply of 2D dials in India. Our Company initially
began exporting these products to the Portugal branch of the customer. Recently, our Company expanded its product offerings
and geographical reach to this customer including in the U.S., Brazil, Mexico, Russia, Slovakia, Thailand, Tunisia and Vietnam.
Contribution of sales to this customer to our Company’s revenue from operations increased to ₹416.76 million in Fiscal 2021
from ₹122.37 million in Fiscal 2019. In another example, our Company started supplying PU domes to a leading international
manufacturer of consumer appliances and expanded its business over the years to become a key supplier of IMLs/IMDs,
overlays and aluminium badges to the Indian branch of the manufacturer with a large share of its business in Europe, the Middle
East and Africa. Contribution of sales to this customer to our Company’s revenue from operations increased to ₹359.97 million
in Fiscal 2021 from ₹262.27 million in Fiscal 2019. We have also successfully entered into the U.S. business of this customer .
We meet regularly with our customers to review our performance in a number of other areas such as quality, delivery and cost.
We have received several awards from our key customers including Whirlpool, Suzuki, Honda Motorcycle and Samsung, for
supplier excellence, quality performance, price competitiveness, support and valuable contribution.
Strong financial position and track record of financial performance
Over the years, the growth of the automotive and consumer appliances industries was impacted by factors such as
demonetization in Fiscals 2017 and 2018, the banking and credit issues in Fiscals 2018 and 2019, the transition to Bharat Stage
VI emission standard for all categories of vehicles in Fiscals 2019 and 2020. While these factors and the performance of the
automotive and consumer appliance industries also impacted our Company’s growth trajectory, our Company was able to grow
its revenue from operations during these periods. Our Company’s EBITDA, EBITDA Margin, RoE and RoCE have remained
relatively stable during these periods. Our Company has demonstrated growth that surpassed the average performance on these
parameters from other peer companies operating in the Indian aesthetics industry in Fiscal 2020.
According to the CRISIL Report, the domestic production for two-wheelers, passenger vehicles and large consumer durables
declined by approximately 13.00%, 10.00% and 19.00%, respectively, in Fiscal 2021 due to the impact of the COVID-19
pandemic. Despite the resultant slowdown in these industries and the temporary effects of COVID-19 on its operations, our
Company was able to grow its overall business and operations, with a growth of 16.40% in revenue from operations to ₹2,516.16
million in Fiscal 2021 from ₹2,161.73 million in Fiscal 2020, a 16.17% growth in EBITDA to ₹797.04 million in Fiscal 2021
from ₹686.09 million in Fiscal 2020 and a 15.70% growth in profit for the year to ₹477.65 million in Fiscal 2021 from ₹412.85
million in Fiscal 2020.
125
See “—Overview” on page 120 for details of our financial performance in the three month period ended June 30, 2021 and in
Fiscals 2021, 2020 and 2019 and “Industry Overview—Summary financial indicators for key aesthetics industry players” on
page 96 for details in relation to average financial performance of the aesthetics industry in Fiscal 2020.
As at June 30, 2021, we had a strong balance sheet with total equity of ₹3,197.61 million and low leverage levels, with
borrowings (current and non-current) of ₹86.38 million, which only comprised working capital facilities. As at June 30, 2021,
the aggregate of our cash and cash equivalents of ₹181.40 million, bank balance other than cash and cash equivalents of ₹176.85
million and investments in mutual funds of ₹408.93 million was ₹767.18 million. Our cash flows from operating activities were
₹220.52 million, ₹579.38 million, ₹582.67 million and ₹358.27 million in the three month period ended June 30, 2021 and
Fiscals 2021, 2020 and 2019, respectively.
Experienced and qualified management team
We benefit from the experience and industry expertise of our senior management. K.A. Joseph, our Managing Director and one
of our Promoters, has been instrumental in the establishment and growth of our business. He has been associated with our
Company for the last 34 years. K.A. Joseph oversees our manufacturing operations and has significant experience in the
aesthetics industry. Sanjay Thapar, our Chief Executive Officer, has over 30 years of experience in the automotive industry and
has been associated with our Company since 2015. He has led, and has shaped, our Company’s product strategy and
international business expansion in recent years.
We have a professional management team with extensive experience across various industries and a proven track record of
performance. This team has been instrumental in the development of our Company’s strategy and business. Our Company has
a team of professionals across senior and mid-level management, including Amit Kumar Garg, our Company’s Chief Financial
Officer, R. Raju, our Company’s Chief Marketing Officer and Sadashiva Baligar, our Company’s Chief Operating Officer. The
average experience of our mid-level management is approximately 21.3 years, including in operations, business development,
quality assurance, customer relationships, finance and human resource management. Our recently acquired Subsidiary has a
team of senior employees with significant experience in industries in India and abroad.
We place emphasis on the strength of our workforce. As at June 30, 2021, our Company and our Subsidiary had 509 and 105
permanent employees, respectively. Our Company also received the “Great Workplace” award in the category of “Small and
Mid-Sized Organizations” by Great Place to Work Institute, India in 2020 and 2019.
OUR BUSINESS STRATEGY
Leverage market position to capitalize on favourable industry trends
The Indian aesthetics products industry generated ₹19.90 billion in revenue in Fiscal 2021, according to the CRISIL Report.
According to that report, as the Indian market is currently under penetrated with respect to aesthetic content in the products in
comparison to global counterparts across automobiles and consumer durables, the growth of the Indian decorative aesthetics
market in value terms is expected to surpass volume growth in demand for two-wheeler, passenger vehicle and consumer
durables over the Fiscal 2021 to Fiscal 2026 period. Accordingly, while demand in India from two-wheelers, passenger vehicles
and consumer durables is expected to grow at a CAGR of 10.00% to 12.00% each in volume terms over the Fiscal 2021 to
Fiscal 2026 period, the demand for aesthetics is expected to grow faster, i.e., at a CAGR of approximately 20.00% over the
same period to reach approximately ₹49.20 billion by Fiscal 2026 and we expect the global aesthetics industry to follow a
similar trend. The demand for aesthetic products is expected to recover and grow by approximately 17.00% in Fiscal 2022, as
the demand and production of two-wheelers, passenger vehicles and consumer durables recover from the impact of the COVID-
19 pandemic.
According to the CRISIL Report, some of the emerging industry trends include, among others, the use of visually and
aesthetically superior 3D appliques instead of 2D appliques in passenger vehicles, use of hybrid analogue-digital dials instead
of analogue dials in two-wheelers, use of touch-based navigation systems instead of analogue based navigation systems in
passenger vehicles, leading to higher demand for optical plastics, shift from plain moulded components to visually appealing
IML/IMDs in passenger vehicles, use of aesthetically superior 3D lux logos/badges instead of chrome-plated logos in two-
wheelers and use of capacitive touch overlays instead of traditional overlays in consumer appliances.
Another growth trend in the global aesthetic products industry, according to the CRISIL Report, is expected to be driven by
growing premiumization and rise in adoption of electric vehicles (“EVs”) over next five years. According to the CRISIL Report,
the rising EV adoption is likely to benefit the decorative aesthetic industry in terms of higher realizations on account of
propensity for high value aesthetic product incorporation in EVs compared to internal combustion vehicles.
We believe that with our experience in the aesthetics industry and track record of supplying premium products, we are well
positioned to take advantage of favourable trends in this industry. We believe that our growth in recent periods is the result of
growth in our share of business with our existing customers, gaining new customers, expansion of our product portfolio and
geographic expansion of our business, among others. These factors, combined with our favourable market position, enhances
126
our ability to respond to emerging industry trends towards more premium, customized and technologically sophisticated
aesthetic products.
We plan to continue to leverage our market leadership and diverse product offerings in order to capitalize on these industry
trends and enhance our focus on premium products. We also intend to continue enhancing our operational efficiencies, to
increase economies of scale, better absorb our fixed costs, reduce our other operating costs and strengthen our competitive
position.
Focus on development and introduction of new technologies and advanced aesthetic products
According to the CRISIL Report, driven by rising disposable income and exposure to developed markets, consumers
increasingly prefer the use of premium, aesthetically superior and technologically advanced products, which are characterized
by relatively higher pricing and higher growth potential compared to the traditional aesthetic products and the aesthetic products
industry growth is expected to benefit from this growing global trend. In addition, advances in technology is resulting in use of
newer and higher value aesthetic products in end industries, which is in turn contributing to increased realizations for aesthetic
product manufacturers.
Our design and development skills, engineering capabilities and domain knowledge have enabled us to foray into certain
advanced product categories and technologies which often have high entry barriers and few competitors. For example, our
Company has, over the last few years, successfully diversified its product offering from traditional aesthetics products such as
decals, logos, 2D appliques and domes to advanced products such as 3D lux logos/badges, 3D appliques, lens mask assemblies,
optical plastics, “In-mould” electronics (“IME(s)”) and IMLs/IMDs. We have also recently started offering products that use
chrome-plated, printed and painted injection moulded plastic parts, such as wheel covers, radiator grills and door handles,
following the acquisition of our Subsidiary. According to the CRISIL Report, aesthetics such as IML/IMD, chrome-plated parts
and optical plastics will constitute approximately 20.00% to 22.00%, 26.00% to 28.00% and 7.00% to 9.00%, respectively, of
the market demand for aesthetics by Fiscal 2026.
We intend to develop and introduce IMEs and internet of things (IOTs) enabled solutions which allow integration of electronic
chips and circuit boards within a plastic injection moulded part. These are finding increasing use in two-wheelers, passenger
vehicles and consumer durables as they are durable and offer resistance to spills, moisture, weather conditions, offer higher
aesthetic value and allow assembly of electronic components within a smaller surface area which helps reduce the size of
products. For instance, such products also contribute in reduction of the overall weight of vehicles, and find application in EVs.
With these new products, we aim to expand our sales to customers including in industries such as consumer durables/appliances
and medical devices.
We will continue to enhance our product styling, customization, design and development capabilities. We will continue to
leverage and build our capabilities to innovate and develop new products, increase the application of our products across
industries to proactively address evolving customer preferences.
Increase our share of business with existing customers and acquire new business
We intend to strengthen our relationships with our existing customers and explore opportunities to grow by expanding the array
of our existing products that we supply to our customers and gain new customer contracts by developing products aligned with
their needs. We have demonstrated the ability to grow, adapt and integrate our products in response to our customers’ needs.
Our Company’s robust account management processes resulted in an increase in the number of customers with whom it had
over ₹100.00 million in yearly annual sales from five in Fiscal 2016 to eight in the three month period ended June 30, 2021
and, as a result, deepening their relationship with our Company and us becoming an integral part of their supply chain.
We intend to continue focusing on increasing our customer base by marketing our existing products to customers who currently
do not purchase our products. Given the shift towards premium and customized products and to respond to the needs of our
customers, we will continue to pursue business related to premium and customized products and help in differentiating our
offering from our competition. We have also increased our customer base in the past through new products and segments as
well as through acquisitions and we see potential to increase our business by pursuing cross-selling opportunities. For example,
with the acquisition of our Subsidiary, we have expanded our product offerings and augmented our customer base. We recently
secured business for chrome-plated products with a leading consumer appliance manufacturer.
We have focused, and intend to continue to focus, on OEMs specializing in producing and marketing premium passenger
vehicles and related Tier-1 suppliers as well as consumer appliance manufacturers. Due to the nature of their products, passenger
vehicles and consumer appliances offer more opportunities for integration of aesthetic products such as IML/IMD interior
components, instrument clusters, and optical plastics for touch based navigation systems, chrome-plated parts and accessories
and capacitive touch overlays.
According to the CRISIL Report, two-wheelers and passenger vehicles will continue to dominate the demand accounting for
approximately 45.00% to 47.00% of the decorative aesthetic market each in Fiscal 2026 whereas consumer durables will
contribute approximately 8.00% to 9.00% to the overall demand. Demand for decorative aesthetics is expected to grow fastest

127
in passenger vehicles at a CAGR of approximately 25.00%, followed by a CAGR of 19.00% and 16.00% in consumer durables
and two-wheelers, respectively. In addition to automotive, consumer durables/appliances, medical devices, farm equipment and
sanitary ware industries, which we currently focus on, we also intend to pursue opportunities in other industries such as outdoor
equipment and FMCG.
Increase geographical footprint and increase exports
Set forth below is a breakdown of our revenue from operations by geography based on location of customers, for the periods
indicated.
Three month period
ended June 30, 2021
Fiscal 2021 Fiscal 2020 Fiscal 2019
Amount Percentage
of total
Amount Percentage
of total
Amount Percentage
of total
Amount Percentage
of total
(₹
million)
(%) (₹
million)
(%) (₹
million)
(%) (₹
million)
(%)
India 612.34 82.45 2,112.31 83.95
1,839.90
85.11
2,139.60
90.18
Rest of the world (exports) 130.35 17.55 403.85 16.05 321.83 14.89 232.92 9.82
Total 742.69 100.00 2,516.16 100.00 2,161.73 100.00 2,372.52 100.00
The chart below sets forth our revenue from operations by geography based on location of customers, for the periods indicated:
We intend to increase our presence in existing geographies and enter new geographies based on current customer relationships.
Over the three month period ended June 30, 2021 and the last three fiscal years, our Company sold its products to around 175
customers in approximately 90 cities across 20 countries, including in North America, Italy, Russia, Japan, Thailand, South
Africa and Poland. We expect our revenues to continue to increase from markets located outside India.
82.45%
17.55%
Fiscal 2022 (Q-1)
India
Rest of the world

128
India is well placed to cater to increasing global demand in the automotive sector since it is an established global OEM sourcing
base and is also a preferred designing and manufacturing base. Approximately 13.00% of passenger vehicles manufactured in
India in Fiscal 2021 were exported, according to the CRISIL Report, and the Indian passenger vehicle exports are projected to
grow at a CAGR of 11.00% to 13.00% between Fiscal 2021 and Fiscal 2026. Aesthetic product suppliers are expected to gain
from export potential of two-wheelers, three-wheelers, tractors and commercial vehicles as well as consumer appliances in the
future.
We believe that there are growth opportunities in certain select international markets, particularly in Europe and North America,
and we can benefit from the opportunity offered by global OEMs and Tier-1 suppliers in the automotive industry and the
customer appliances industry. We also intend to focus on expanding our penetration in the two-wheeler automotive segment in
Asia.
Integrate our Subsidiary and enhance opportunities
Our Company completed the Exotech Acquisition on April 5, 2021 which has enhanced our product portfolio, increased our
manufacturing capabilities and increased our customer base.
According to the CRISIL Report, while chrome-plated parts constituted the second largest product segment within the overall
aesthetics market in India in Fiscal 2021, it is expected to be the largest product segment within the overall aesthetics market
in India in Fiscal 2026. In addition, the trend of increasing chrome-plated part intensity in a vehicle is likely to continue. As a
result, demand for chrome-plated parts from OEMs is likely to grow rapidly in future. According to the CRISIL Report, the
demand for chrome-plated parts comprised 23.00% to 25.00% of the total demand in India for decorative aesthetics in Fiscal
2021, which is expected to increase to 26.00% to 28.00% of the total demand in India for decorative aesthetics by Fiscal 2026.
We expect to leverage our existing capabilities, product offerings and customer base to capitalize on this market opportunity.
We have started offering products that use chrome-plated, printed and painted injection moulded plastic parts, such as wheel
covers, radiator grills and door handles, following the acquisition of our Subsidiary. We expect that the combination of
decorative printing and injection moulding with plastic chrome-plating capabilities will help us provide diversified aesthetic
products to customers. The acquisition has also helped reduce the risk of product substitution for us. For example, we would
be able to attract and retain customers that may consider switching 3D lux badges with chrome-plated plastic parts.
Exotech’s customers include leading passenger vehicles automotive OEMs and Tier-1 suppliers and customers in the two-
wheelers, passenger vehicles, consumer appliance, farm equipment and sanitary ware industries. This provides us the
opportunity to cross-sell our Company’s existing products as well as our Subsidiary’s products across a diversified customer
base.
We will continue to take steps towards the integration of our Subsidiary’s business, including integration of employees,
uniformity of business processes and sourcing of raw materials to achieve benefits of economies of scale.
Expand our business through strategic inorganic growth opportunities
Although we intend to continue to grow organically, we believe that inorganic growth opportunities in India or outside India
may act as an enabler for growing our businesses. We intend to continue to evaluate, and selectively pursue, inorganic
opportunities where products, resources, capabilities, operations and strategies are complementary and that will diversify our
product portfolio, provide us access to a wider customer base, help us expand into new markets and geographies and consolidate
our existing capabilities. These opportunities could be by way of strategic alliances, acquisitions, joint ventures, technological
collaborations, partner tie-ups and other strategic and business combinations.
DESCRIPTION OF OUR BUSINESS
Our Company designs, develops and manufactures aesthetic products that we supply to automotive OEMs which manufacture
and assemble two-wheeler and passenger vehicles and Tier-1 automotive component suppliers as well as consumer appliance
industries. Our Subsidiary manufactures chrome-plated, printed and painted products injection moulded plastic parts catering
to aesthetic requirements of two-wheelers, passenger vehicles, consumer appliance, farm equipment and sanitary ware
industries.
Our sale of products and services constituted 99.74%, 99.64%, 99.62%, and 99.86% of our revenue from operations in the three
month period ended June 30, 2021 and Fiscals 2021, 2020 and 2019, respectively. Set forth below is a breakdown of our revenue
from operations, for the periods indicated.
Three month period
ended June 30, 2021
Fiscal 2021 Fiscal 2020 Fiscal 2019
Amount Percentage
of total
Amount Percentage
of total
Amount Percentage
of total
Amount Percentage
of total
(₹ million) (%) (₹ million) (%) (₹ million) (%) (₹ million) (%)
Revenue from contract with
customers
Sale of products 738.91 99.49 2,477.69 98.47 2,131.47 98.60 2,357.94 99.39
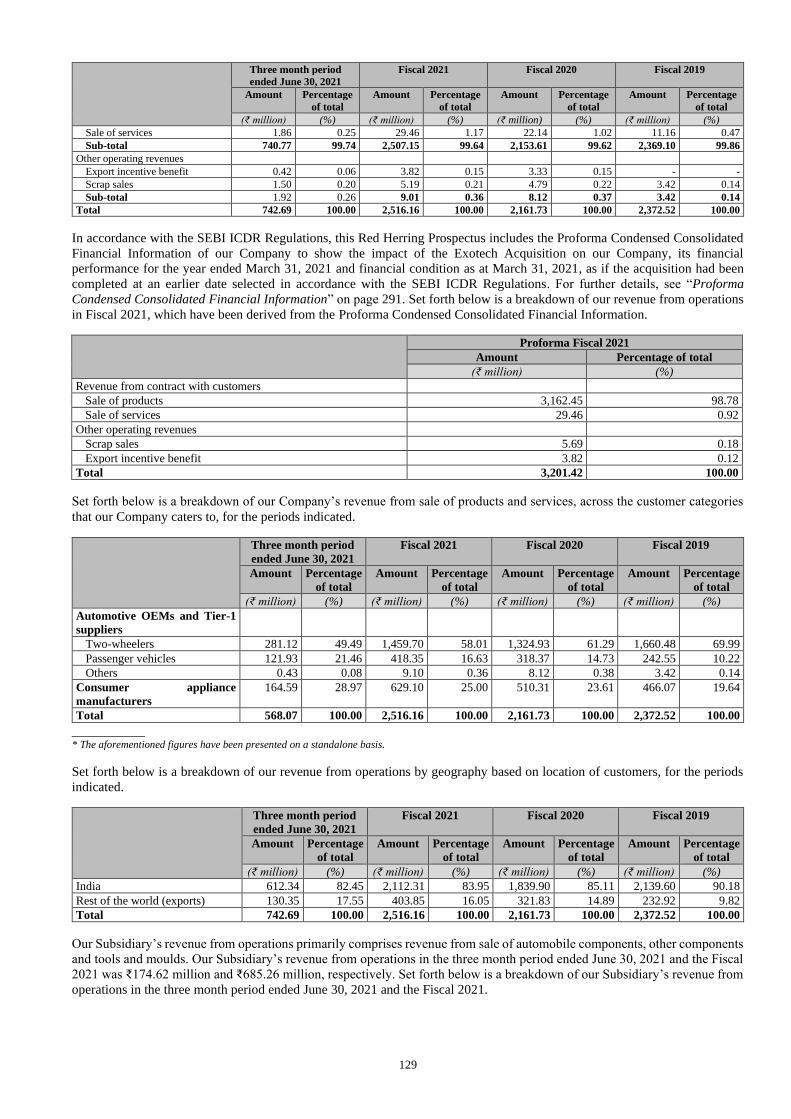
129
Three month period
ended June 30, 2021
Fiscal 2021 Fiscal 2020 Fiscal 2019
Amount Percentage
of total
Amount Percentage
of total
Amount Percentage
of total
Amount Percentage
of total
(₹ million) (%) (₹ million) (%) (₹ million) (%) (₹ million) (%)
Sale of services 1.86 0.25 29.46 1.17 22.14 1.02 11.16 0.47
Sub-total 740.77 99.74 2,507.15 99.64 2,153.61 99.62 2,369.10 99.86
Other operating revenues
Export incentive benefit 0.42 0.06 3.82 0.15 3.33 0.15 - -
Scrap sales 1.50 0.20 5.19 0.21 4.79 0.22 3.42 0.14
Sub-total 1.92 0.26 9.01 0.36 8.12 0.37 3.42 0.14
Total 742.69 100.00 2,516.16 100.00 2,161.73 100.00 2,372.52 100.00
In accordance with the SEBI ICDR Regulations, this Red Herring Prospectus includes the Proforma Condensed Consolidated
Financial Information of our Company to show the impact of the Exotech Acquisition on our Company, its financial
performance for the year ended March 31, 2021 and financial condition as at March 31, 2021, as if the acquisition had been
completed at an earlier date selected in accordance with the SEBI ICDR Regulations. For further details, see “Proforma
Condensed Consolidated Financial Information” on page 291. Set forth below is a breakdown of our revenue from operations
in Fiscal 2021, which have been derived from the Proforma Condensed Consolidated Financial Information.
Proforma Fiscal 2021
Amount Percentage of total
(₹ million) (%)
Revenue from contract with customers
Sale of products 3,162.45 98.78
Sale of services 29.46 0.92
Other operating revenues
Scrap sales 5.69 0.18
Export incentive benefit 3.82 0.12
Total 3,201.42 100.00
Set forth below is a breakdown of our Company’s revenue from sale of products and services, across the customer categories
that our Company caters to, for the periods indicated.
Three month period
ended June 30, 2021
Fiscal 2021 Fiscal 2020 Fiscal 2019
Amount Percentage
of total
Amount Percentage
of total
Amount Percentage
of total
Amount Percentage
of total
(₹ million) (%) (₹ million) (%) (₹ million) (%) (₹ million) (%)
Automotive OEMs and Tier-1
suppliers
Two-wheelers 281.12 49.49 1,459.70 58.01 1,324.93 61.29 1,660.48 69.99
Passenger vehicles 121.93 21.46 418.35 16.63 318.37 14.73 242.55 10.22
Others 0.43 0.08 9.10 0.36 8.12 0.38 3.42 0.14
Consumer appliance
manufacturers
164.59 28.97 629.10 25.00 510.31 23.61 466.07 19.64
Total 568.07 100.00 2,516.16 100.00 2,161.73 100.00 2,372.52 100.00
___________ * The aforementioned figures have been presented on a standalone basis.
Set forth below is a breakdown of our revenue from operations by geography based on location of customers, for the periods
indicated.
Three month period
ended June 30, 2021
Fiscal 2021 Fiscal 2020 Fiscal 2019
Amount Percentage
of total
Amount Percentage
of total
Amount Percentage
of total
Amount Percentage
of total
(₹ million) (%) (₹ million) (%) (₹ million) (%) (₹ million) (%)
India 612.34 82.45 2,112.31 83.95 1,839.90 85.11 2,139.60 90.18
Rest of the world (exports) 130.35 17.55 403.85 16.05 321.83 14.89 232.92 9.82
Total 742.69 100.00 2,516.16 100.00 2,161.73 100.00 2,372.52 100.00
Our Subsidiary’s revenue from operations primarily comprises revenue from sale of automobile components, other components
and tools and moulds. Our Subsidiary’s revenue from operations in the three month period ended June 30, 2021 and the Fiscal
2021 was ₹174.62 million and ₹685.26 million, respectively. Set forth below is a breakdown of our Subsidiary’s revenue from
operations in the three month period ended June 30, 2021 and the Fiscal 2021.
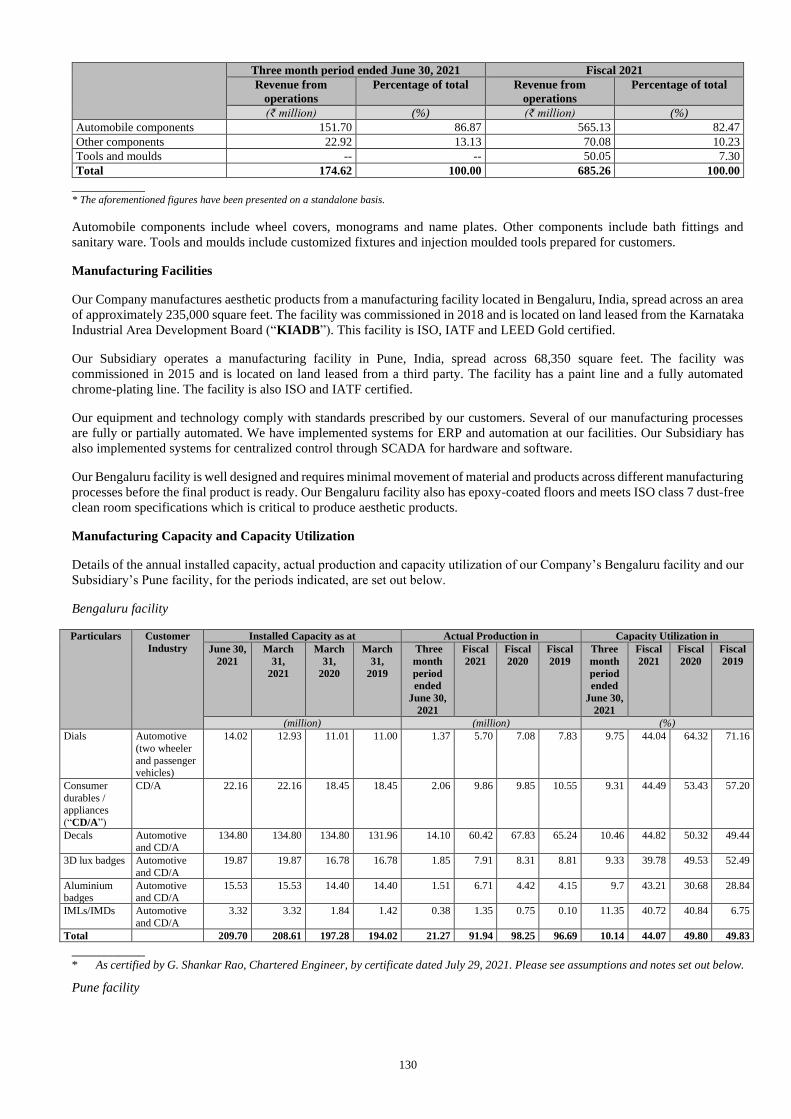
130
Three month period ended June 30, 2021 Fiscal 2021
Revenue from
operations
Percentage of total Revenue from
operations
Percentage of total
(₹ million) (%) (₹ million) (%)
Automobile components 151.70 86.87 565.13 82.47
Other components 22.92 13.13 70.08 10.23
Tools and moulds -- -- 50.05 7.30
Total 174.62 100.00 685.26 100.00
___________ * The aforementioned figures have been presented on a standalone basis.
Automobile components include wheel covers, monograms and name plates. Other components include bath fittings and
sanitary ware. Tools and moulds include customized fixtures and injection moulded tools prepared for customers.
Manufacturing Facilities
Our Company manufactures aesthetic products from a manufacturing facility located in Bengaluru, India, spread across an area
of approximately 235,000 square feet. The facility was commissioned in 2018 and is located on land leased from the Karnataka
Industrial Area Development Board (“KIADB”). This facility is ISO, IATF and LEED Gold certified.
Our Subsidiary operates a manufacturing facility in Pune, India, spread across 68,350 square feet. The facility was
commissioned in 2015 and is located on land leased from a third party. The facility has a paint line and a fully automated
chrome-plating line. The facility is also ISO and IATF certified.
Our equipment and technology comply with standards prescribed by our customers. Several of our manufacturing processes
are fully or partially automated. We have implemented systems for ERP and automation at our facilities. Our Subsidiary has
also implemented systems for centralized control through SCADA for hardware and software.
Our Bengaluru facility is well designed and requires minimal movement of material and products across different manufacturing
processes before the final product is ready. Our Bengaluru facility also has epoxy-coated floors and meets ISO class 7 dust-free
clean room specifications which is critical to produce aesthetic products.
Manufacturing Capacity and Capacity Utilization
Details of the annual installed capacity, actual production and capacity utilization of our Company’s Bengaluru facility and our
Subsidiary’s Pune facility, for the periods indicated, are set out below.
Bengaluru facility
Particulars Customer
Industry
Installed Capacity as at Actual Production in Capacity Utilization in
June 30,
2021
March
31,
2021
March
31,
2020
March
31,
2019
Three
month
period
ended
June 30,
2021
Fiscal
2021
Fiscal
2020
Fiscal
2019
Three
month
period
ended
June 30,
2021
Fiscal
2021
Fiscal
2020
Fiscal
2019
(million) (million) (%)
Dials Automotive
(two wheeler
and passenger vehicles)
14.02 12.93 11.01 11.00 1.37 5.70 7.08 7.83 9.75 44.04 64.32 71.16
Consumer
durables / appliances
(“CD/A”)
CD/A 22.16 22.16 18.45 18.45 2.06 9.86 9.85 10.55 9.31 44.49 53.43 57.20
Decals Automotive and CD/A
134.80 134.80 134.80 131.96 14.10 60.42 67.83 65.24 10.46 44.82 50.32 49.44
3D lux badges Automotive
and CD/A
19.87 19.87 16.78 16.78 1.85 7.91 8.31 8.81 9.33 39.78 49.53 52.49
Aluminium badges
Automotive and CD/A
15.53 15.53 14.40 14.40 1.51 6.71 4.42 4.15 9.7 43.21 30.68 28.84
IMLs/IMDs Automotive
and CD/A
3.32 3.32 1.84 1.42 0.38 1.35 0.75 0.10 11.35 40.72 40.84 6.75
Total 209.70 208.61 197.28 194.02 21.27 91.94 98.25 96.69 10.14 44.07 49.80 49.83
___________ * As certified by G. Shankar Rao, Chartered Engineer, by certificate dated July 29, 2021. Please see assumptions and notes set out below.
Pune facility

131
Particulars Customer
Industry
Installed Capacity as at Actual Production in Capacity Utilization in
June 30,
2021
March
31,
2021
March
31,
2020
March
31,
2019
Three
month
period
ended June
30, 2021
Fiscal
2021
Fiscal
2020
Fiscal
2019
Three
month
period
ended June
30, 2021
Fiscal
2021
Fiscal
2020
Fiscal
2019
(million) (million) (%)
Chrome plating
Automotive and CD/A
19.70 19.70 19.70 19.70 2.55 10.24 10.99 14.81 12.95 51.99 55.81 75.17
Moulding Automotive
and CD/A
7.47 7.47 7.47 7.47 1.20 4.61 4.62 6.12 16.02 61.72 61.79 81.84
Painting Automotive and CD/A
2.33 2.33 2.33 2.33 0.20 0.75 0.77 1.02 8.57 32.07 33.06 43.99
Total 29.50 29.50 29.50 29.50 3.95 15.60 16.38 21.95 13.38 52.88 55.53 74.40
___________ * As certified by G. Shankar Rao, Chartered Engineer, by certificate dated July 29, 2021. Please see assumptions and notes set out below.
Assumptions and Notes:
(1) Quantities given are in numbers of components being manufactured or produced, under each vertical (category). (2) Assumes 303 working days per year and 18 machine-working hours (taking into consideration 85% efficiency) per day involving
work during all the three working shifts in a day. (3) Assumes that the supporting manpower would be arranged by our Company as and when required to achieve the required installed
capacity. (4) Since the machine technical data sheet is not available for most of the machines, each machine cycle time is assumed to be
practically working to determine the installed capacity. Under different conditions, the installed capacity could be higher by 15% to
25%. (5) Capacities are calculated based on the floor-wise dedicated set up of machines. Based on the orders and production schedule, such
set up of machines could be modified in order to meet higher production requirements. (6) Assumes that each printing machine is fungible with any product, i.e., two-wheelers, passenger vehicles, consumer
durables/appliances or any other product. (7) Installed capacity is determined primarily on the basis of available printing machines. (8) Installed capacity determination depended on scheduled maintenance activities and assumes smooth working of all the machines in
tandem. (9) Lunch time, tea time, shift changeover time of the workmen have been considered in calculating the working hours.
Key Manufacturing Capabilities
Set out below is a graphical description of our Company’s manufacturing process.
Brief details of the key capabilities involved in the manufacture of our products are described below.
For aftermarket products and other products, our Company has capabilities across various technology processes, including
screen printing, injection moulding, high pressure forming, laser etching, metal forming, nickel plating, PU doming, hot
stamping, milling, laser cutting, punching, blanking and lamination. With the acquisition of our Subsidiary, we have also added
plastic chrome-plating and painting capabilities and enhanced our injection moulding capabilities. See “—Key Products” on
page 120 for a description of our key product offerings.
Prototyping / tooling
132
Concept design and styling / mood board interpretation capability
Our team of qualified product designers interacts with customers and helps in concept design and styling. We also share
feedback forms with our customers to review our product quality performance which helps us in understanding customer
specific requirements. Our designers put together “mood boards” based on our customers’ requirements for a particular product
and drive the selection of the design for the final product based on these “mood boards”.
Rapid prototyping and tooling
We have a dedicated prototype-tooling centre at our Bengaluru facility. We are equipped with 3D printing technology to
promptly make products. We rely on our prototyping capabilities as well as our network of suppliers to deliver products within
stipulated turnaround time. For instance, our 3D badges are typically delivered to customers within three days from the date of
the sales order.
Program management process
Our Company has dedicated program management teams for each vertical. Tools of program management throughout the
program life cycle are used, which include controlling, planning and monitoring the program, managing risks and issues and
taking corrective measures. We also focus on early engagement with customers and regular interaction to confirm that their
requirements are addressed.
Reliability and repeatability testing capability
The on-site labs at each of our facilities is equipped for quality control and quality assurance. See “—Quality Control and
Quality Assurance” on page 120. Reliability and repeatability testing are conducted at the beginning of a program and is also
carried out periodically thereafter until the end of the program.
Plastics / injection moulding
Injection moulded plastic products
Polymer or plastic granules are melted in injection moulding machines. This melted plastic is injected into tools with cavities
that are customized to the specifications of the product being manufactured. The melted plastic takes the shape of the cavity
within the tool. The part is then cooled, removed from the tool and either inspected and tested for quality control and packaged
for dispatch to customers or taken for further processing.
Thermoforming
We have high pressure thermoforming capabilities at our Bengaluru facility, to handle and shape plastic to manufacture products
such as IML/IMDs. We are also able to control and consistently achieve the optimum level of graphics distortion required for
the “3D effect” and apply this technique to manufacture our 3D lux badges, appliques and dials.
Optical grade lens moulding
We manufacture optical grade lenses out of polycarbonates and acrylic. We have an ISO class 7 certified clean room located in
the moulding and printing section of our Bengaluru facility which is used for lens moulding and lens mask assembly. We have
also developed a process in-house to minimize the stress on such lenses and achieve performance of the product.
High-end printing
We have automated printing lines for screen printing. We also have a supplier base for printing machines, inks and substrates
(or materials such as plastic and metal).
We use specialized inks that display different shades at different viewing angles. We also use metallic and chrome inks, which
are used to render a “chrome finish” to a product without chrome-plating. We also use ultraviolet (“UV”) inks, which helps in
providing a “3D effect” for certain products. For overlays, we use conductive inks which provide actuation in control panels
for user interface with the machine.
Our Company maintains a library of various ink series to help our development teams as well as our customers determine
preferred product requirements. In addition to different kinds of plastics, we also have the ability to print ink on polycarbonates,
acrylic, polyester, polyvinyl chloride (“PVC”) and composites.
Metal forming

133
We have metal stamping capabilities, in particular aluminium stamping. Our tool design for aluminium forming allows us to
achieve uniform levels of forming with mass production. We use special inks to print on metals, providing multi-colour finishing
while also meeting the quality requirements of our customers.
Surface finishing
We also have hot stamping or hot foiling machines. Using heat and pressure, the hot foiling machine applies and transfers the
foil to the relevant area on the surface of the product.
PU doming
Polyurethane liquid components are mixed in the required proportion and poured through nozzles in the required quantity on
the plastic surface. These parts are baked in a temperature-controlled oven to cure or harden the layer of polyurethane.
Chrome-plating
At our Pune facility, injection moulded plastic parts that require chrome-plating are cleaned and transported for chrome-plating
using jigs. These parts are put through various processes of chrome-plating such as cleaning, etching, neutralizing and activation
to convert a part of the surface to a conductive surface for deposition of metal. The parts are coated or finished with various
metals, including nickel (thin nickel, bright nickel, semi-bright nickel, satin nickel micro-porous nickel or high-sulphur nickel),
copper and chrome. The parts are rinsed after each step of the process to confirm that there is no contamination of chemicals
across tanks. This entire process is fully automated and controlled through the centralized SCADA system.
Painting
At our Pune facility, injection moulded plastic parts that require painting are cleaned and loaded on a conveyor system. The
conveyor system transports the plastic parts across a series of paint booths where paint is sprayed automatically on the parts.
Paint is mixed and filled in pressurized pots located in the paint booths. Depending on customer requirement and specifications,
plastic parts can have up to three layers of paint (primer, base coat and lacquer coat). The painted parts are then loaded on
another conveyor system for time and temperature-controlled drying in an oven.
Other Technologies
We have two-axis and three-axis laser cutting machines, high pressure forming machines and machines for micro-embossing
on metal and plastic.
Key Products
Our product portfolio is diverse, and we manufacture a wide range of aesthetics products catering to the two-wheelers, passenger
vehicles, commercial vehicles, consumer durables/appliances, medical devices, farm equipment and sanitary ware industries.
In Fiscal 2021, our Company supplied over 115 million parts with more than 6,000 SKUs in Fiscal 2021 to around 170
customers in approximately 90 cities across 20 countries.
Our product offerings include decals and body graphics, 2D appliques and dials, 3D appliques and dials, 3D lux badges, domes,
overlays, aluminium badges, IMLs/IMDs, lens mask assembly and chrome-plated, printed and painted injection moulded plastic
parts. Also see “—Key Manufacturing Capabilities” on page 131 for brief details of our key capabilities involved in the
manufacture of our products.
Decals and body graphics
Decals and graphics are used in two-wheelers and passenger vehicles and are applied to the body of
a vehicle to enhance its appearance. We collaborate closely with our customers for the development,
manufacture and supply of these parts.
The features of our decals and graphics include weather resistance, with up to five years of outdoor
life, easy cleaning and high gloss. We also offer multi-coloured graphics that appear to enhance
colours when viewed from certain angles.
We have approximately 33 years of experience in manufacturing these products. Printing and cutting
machines are used for manufacturing these products.
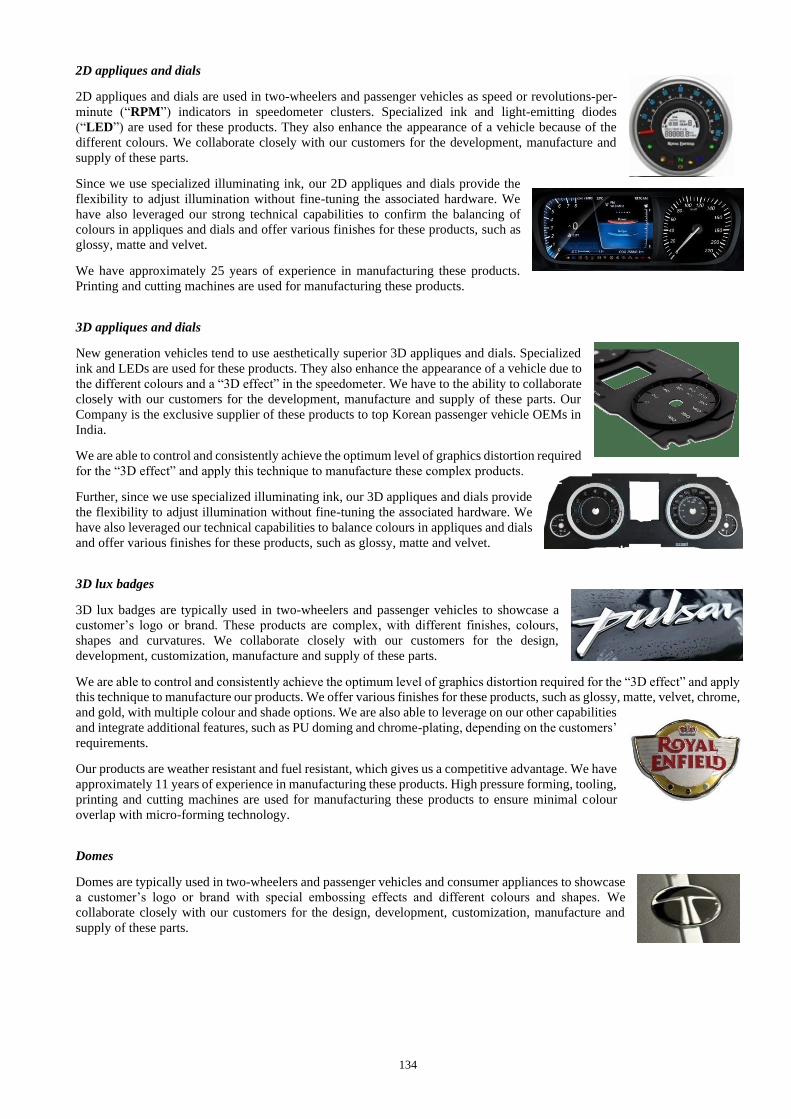
134
2D appliques and dials
2D appliques and dials are used in two-wheelers and passenger vehicles as speed or revolutions-per-
minute (“RPM”) indicators in speedometer clusters. Specialized ink and light-emitting diodes
(“LED”) are used for these products. They also enhance the appearance of a vehicle because of the
different colours. We collaborate closely with our customers for the development, manufacture and
supply of these parts.
Since we use specialized illuminating ink, our 2D appliques and dials provide the
flexibility to adjust illumination without fine-tuning the associated hardware. We
have also leveraged our strong technical capabilities to confirm the balancing of
colours in appliques and dials and offer various finishes for these products, such as
glossy, matte and velvet.
We have approximately 25 years of experience in manufacturing these products.
Printing and cutting machines are used for manufacturing these products.
3D appliques and dials
New generation vehicles tend to use aesthetically superior 3D appliques and dials. Specialized
ink and LEDs are used for these products. They also enhance the appearance of a vehicle due to
the different colours and a “3D effect” in the speedometer. We have to the ability to collaborate
closely with our customers for the development, manufacture and supply of these parts. Our
Company is the exclusive supplier of these products to top Korean passenger vehicle OEMs in
India.
We are able to control and consistently achieve the optimum level of graphics distortion required
for the “3D effect” and apply this technique to manufacture these complex products.
Further, since we use specialized illuminating ink, our 3D appliques and dials provide
the flexibility to adjust illumination without fine-tuning the associated hardware. We
have also leveraged our technical capabilities to balance colours in appliques and dials
and offer various finishes for these products, such as glossy, matte and velvet.
3D lux badges
3D lux badges are typically used in two-wheelers and passenger vehicles to showcase a
customer’s logo or brand. These products are complex, with different finishes, colours,
shapes and curvatures. We collaborate closely with our customers for the design,
development, customization, manufacture and supply of these parts.
We are able to control and consistently achieve the optimum level of graphics distortion required for the “3D effect” and apply
this technique to manufacture our products. We offer various finishes for these products, such as glossy, matte, velvet, chrome,
and gold, with multiple colour and shade options. We are also able to leverage on our other capabilities
and integrate additional features, such as PU doming and chrome-plating, depending on the customers’
requirements.
Our products are weather resistant and fuel resistant, which gives us a competitive advantage. We have
approximately 11 years of experience in manufacturing these products. High pressure forming, tooling,
printing and cutting machines are used for manufacturing these products to ensure minimal colour
overlap with micro-forming technology.
Domes
Domes are typically used in two-wheelers and passenger vehicles and consumer appliances to showcase
a customer’s logo or brand with special embossing effects and different colours and shapes. We
collaborate closely with our customers for the design, development, customization, manufacture and
supply of these parts.

135
We offer multiple colour options for these products, since we have developed techniques for micro-
embossing while ensuring product consistency.
Our products are weather resistant and fuel resistant, detergent resistant and can be applied on almost
any surface, which gives us a competitive advantage.
We have approximately 30 years of experience in manufacturing these products. Printing and micro-
embossing machines are used for manufacturing these products to ensure minimal colour overlap with
micro-embossing technology.
Overlays
Overlays are used in consumer appliances control panels and work as the interface
between users and machines. We collaborate closely with our customers for the
design, development, customization, manufacture and supply of these parts.
We offer multiple material, colour, finish and thickness options, including different
colours with different finishes using brush patterns and other processes developed
in-house.
We use quality material that sustains up to one million pushes of embossed buttons
in control panels and our products are detergent resistant, which gives us a competitive advantage.
We have approximately 30 years of experience in manufacturing these products. Printing, precision
embossing and tooling machines are used for manufacturing these products, with a partially automated
adhesive cutting and pasting process, to ensure minimal colour overlap with micro-embossing technology.
Aluminium badges
Aluminium badges are used in two-wheelers and passenger vehicles and consumer appliances
mainly as brand displays or to communicate special instructions on hard surfaces. These
products are typically tamper-proof. We collaborate closely with our customers for the design,
development, customization, manufacture and supply of these parts.
We have developed a tooling and tool selection process for embossing on metals such as
aluminium with competitive cycle times. The tools and processes are customized based on the
requirements of customers, which provides flexibility and feasibility to our customers. Our choice of
adhesive for these products is also a key differentiating factor, which gives us a competitive advantage.
We offer multiple material, colour, finish and thickness options, including different colours with different
finishes using brush patterns and other processes developed in-house.
We have approximately four years of experience in manufacturing these products. Printing, milling,
precision embossing and tooling machines are used for manufacturing these products, with a partially automated adhesive
cutting and pasting process, to ensure minimal colour overlap with micro-embossing technology.
IMLs/IMDs
IML/IMDs are used in many products, such as control panels in vehicles and
consumer appliances, branding logos and decorative plastics. According to the
CRISIL Report, use of IM/IMDs is expected to increase as it is of superior
technology compared to other traditional aesthetic products and it is also expected
to be the biggest beneficiary in terms of market share gain over the period between Fiscal 2021 and Fiscal 2026. We collaborate
closely with our customers for the design, development, customization, manufacture and supply of these parts.
We manufacture touch-sensitive control panels with conductive and non-conductive ink. We also offer multiple colour, finish
and thickness options. We utilize our precision forming, injection moulding, ink selection and printing capabilities, as well as
our in-house product design and tooling capabilities, to provide all the facilities required for such products under one roof and
ensure quality and timely delivery for our customers. We also leverage our network of tooling vendors to
deliver products within a short lead time.
We have approximately three years of experience in manufacturing these products.
Printing, thermoforming, high pressure forming and injection moulding tools and
machines, together with 3D trimming tools and machines, are used for manufacturing
these products.
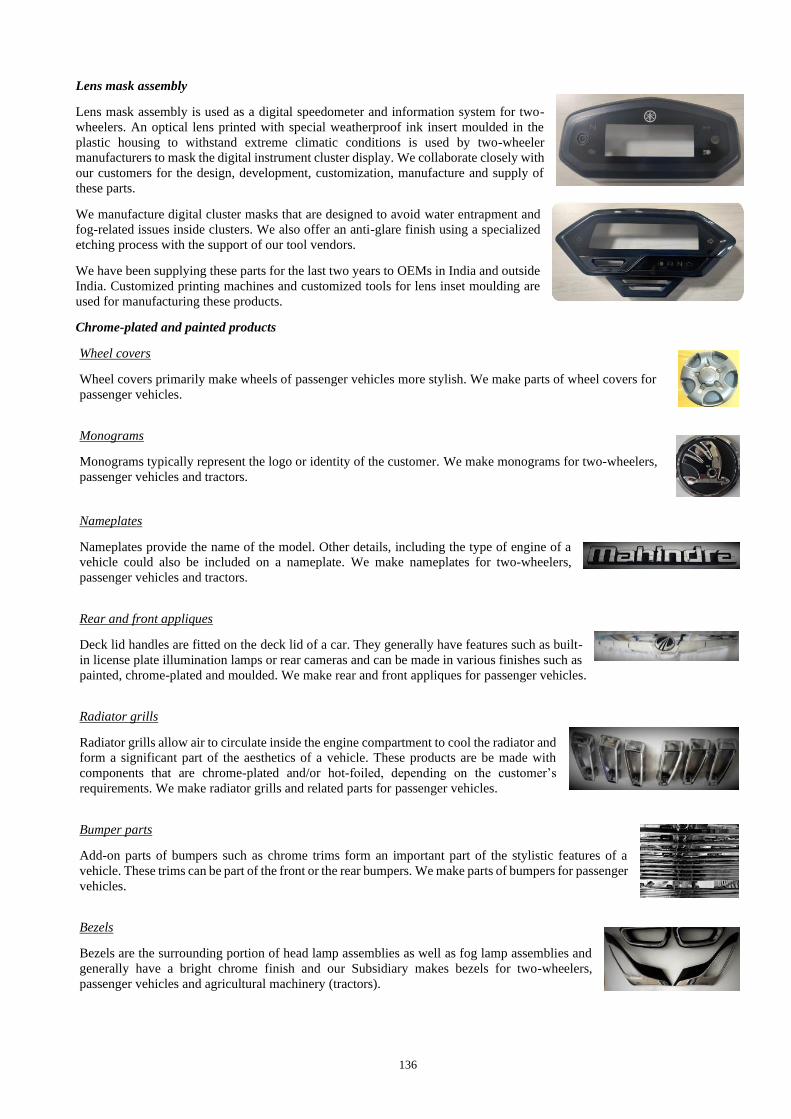
136
Lens mask assembly
Lens mask assembly is used as a digital speedometer and information system for two-
wheelers. An optical lens printed with special weatherproof ink insert moulded in the
plastic housing to withstand extreme climatic conditions is used by two-wheeler
manufacturers to mask the digital instrument cluster display. We collaborate closely with
our customers for the design, development, customization, manufacture and supply of
these parts.
We manufacture digital cluster masks that are designed to avoid water entrapment and
fog-related issues inside clusters. We also offer an anti-glare finish using a specialized
etching process with the support of our tool vendors.
We have been supplying these parts for the last two years to OEMs in India and outside
India. Customized printing machines and customized tools for lens inset moulding are
used for manufacturing these products.
Chrome-plated and painted products
Wheel covers
Wheel covers primarily make wheels of passenger vehicles more stylish. We make parts of wheel covers for
passenger vehicles.
Monograms
Monograms typically represent the logo or identity of the customer. We make monograms for two-wheelers,
passenger vehicles and tractors.
Nameplates
Nameplates provide the name of the model. Other details, including the type of engine of a
vehicle could also be included on a nameplate. We make nameplates for two-wheelers,
passenger vehicles and tractors.
Rear and front appliques
Deck lid handles are fitted on the deck lid of a car. They generally have features such as built-
in license plate illumination lamps or rear cameras and can be made in various finishes such as
painted, chrome-plated and moulded. We make rear and front appliques for passenger vehicles.
Radiator grills
Radiator grills allow air to circulate inside the engine compartment to cool the radiator and
form a significant part of the aesthetics of a vehicle. These products are be made with
components that are chrome-plated and/or hot-foiled, depending on the customer’s
requirements. We make radiator grills and related parts for passenger vehicles.
Bumper parts
Add-on parts of bumpers such as chrome trims form an important part of the stylistic features of a
vehicle. These trims can be part of the front or the rear bumpers. We make parts of bumpers for passenger
vehicles.
Bezels
Bezels are the surrounding portion of head lamp assemblies as well as fog lamp assemblies and
generally have a bright chrome finish and our Subsidiary makes bezels for two-wheelers,
passenger vehicles and agricultural machinery (tractors).
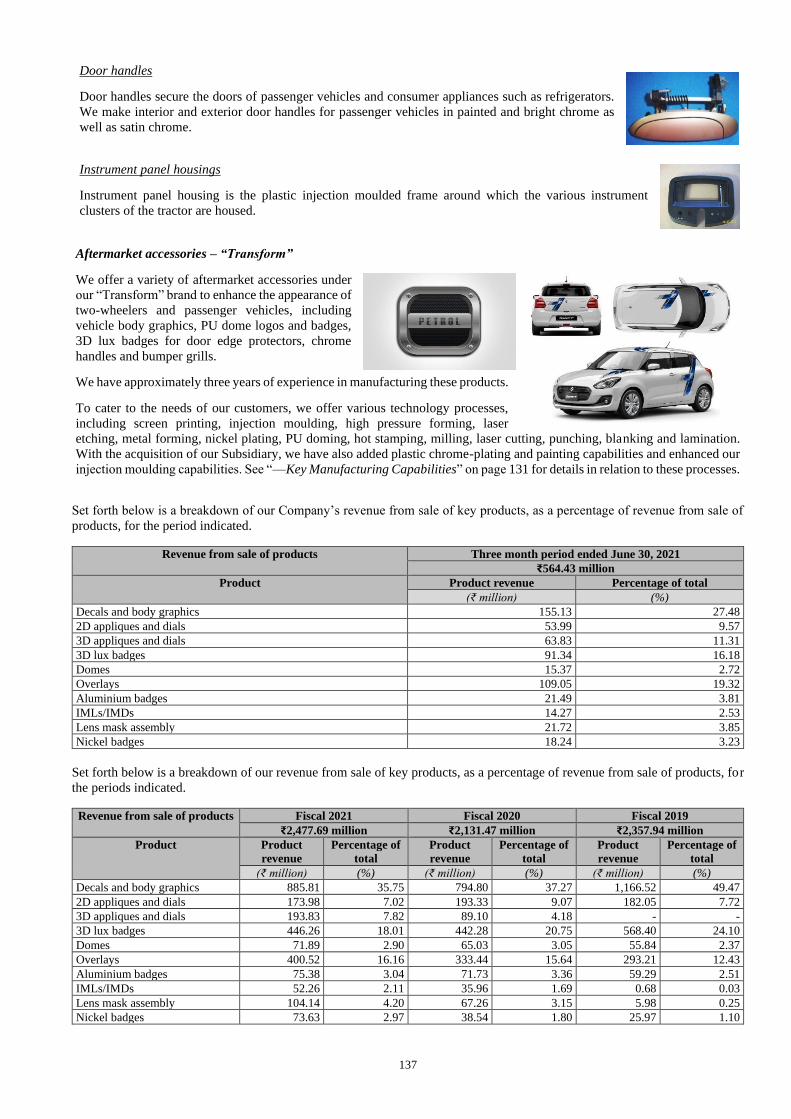
137
Door handles
Door handles secure the doors of passenger vehicles and consumer appliances such as refrigerators.
We make interior and exterior door handles for passenger vehicles in painted and bright chrome as
well as satin chrome.
Instrument panel housings
Instrument panel housing is the plastic injection moulded frame around which the various instrument
clusters of the tractor are housed.
Aftermarket accessories – “Transform”
We offer a variety of aftermarket accessories under
our “Transform” brand to enhance the appearance of
two-wheelers and passenger vehicles, including
vehicle body graphics, PU dome logos and badges,
3D lux badges for door edge protectors, chrome
handles and bumper grills.
We have approximately three years of experience in manufacturing these products.
To cater to the needs of our customers, we offer various technology processes,
including screen printing, injection moulding, high pressure forming, laser
etching, metal forming, nickel plating, PU doming, hot stamping, milling, laser cutting, punching, blanking and lamination.
With the acquisition of our Subsidiary, we have also added plastic chrome-plating and painting capabilities and enhanced our
injection moulding capabilities. See “—Key Manufacturing Capabilities” on page 131 for details in relation to these processes.
Set forth below is a breakdown of our Company’s revenue from sale of key products, as a percentage of revenue from sale of
products, for the period indicated.
Revenue from sale of products Three month period ended June 30, 2021
₹564.43 million
Product Product revenue Percentage of total
(₹ million) (%)
Decals and body graphics 155.13 27.48
2D appliques and dials 53.99 9.57
3D appliques and dials 63.83 11.31
3D lux badges 91.34 16.18
Domes 15.37 2.72
Overlays 109.05 19.32
Aluminium badges 21.49 3.81
IMLs/IMDs 14.27 2.53
Lens mask assembly 21.72 3.85
Nickel badges 18.24 3.23
Set forth below is a breakdown of our revenue from sale of key products, as a percentage of revenue from sale of products, for
the periods indicated.
Revenue from sale of products Fiscal 2021 Fiscal 2020 Fiscal 2019
₹2,477.69 million ₹2,131.47 million ₹2,357.94 million
Product Product
revenue
Percentage of
total
Product
revenue
Percentage of
total
Product
revenue
Percentage of
total
(₹ million) (%) (₹ million) (%) (₹ million) (%)
Decals and body graphics 885.81 35.75 794.80 37.27 1,166.52 49.47
2D appliques and dials 173.98 7.02 193.33 9.07 182.05 7.72
3D appliques and dials 193.83 7.82 89.10 4.18 - -
3D lux badges 446.26 18.01 442.28 20.75 568.40 24.10
Domes 71.89 2.90 65.03 3.05 55.84 2.37
Overlays 400.52 16.16 333.44 15.64 293.21 12.43
Aluminium badges 75.38 3.04 71.73 3.36 59.29 2.51
IMLs/IMDs 52.26 2.11 35.96 1.69 0.68 0.03
Lens mask assembly 104.14 4.20 67.26 3.15 5.98 0.25
Nickel badges 73.63 2.97 38.54 1.80 25.97 1.10
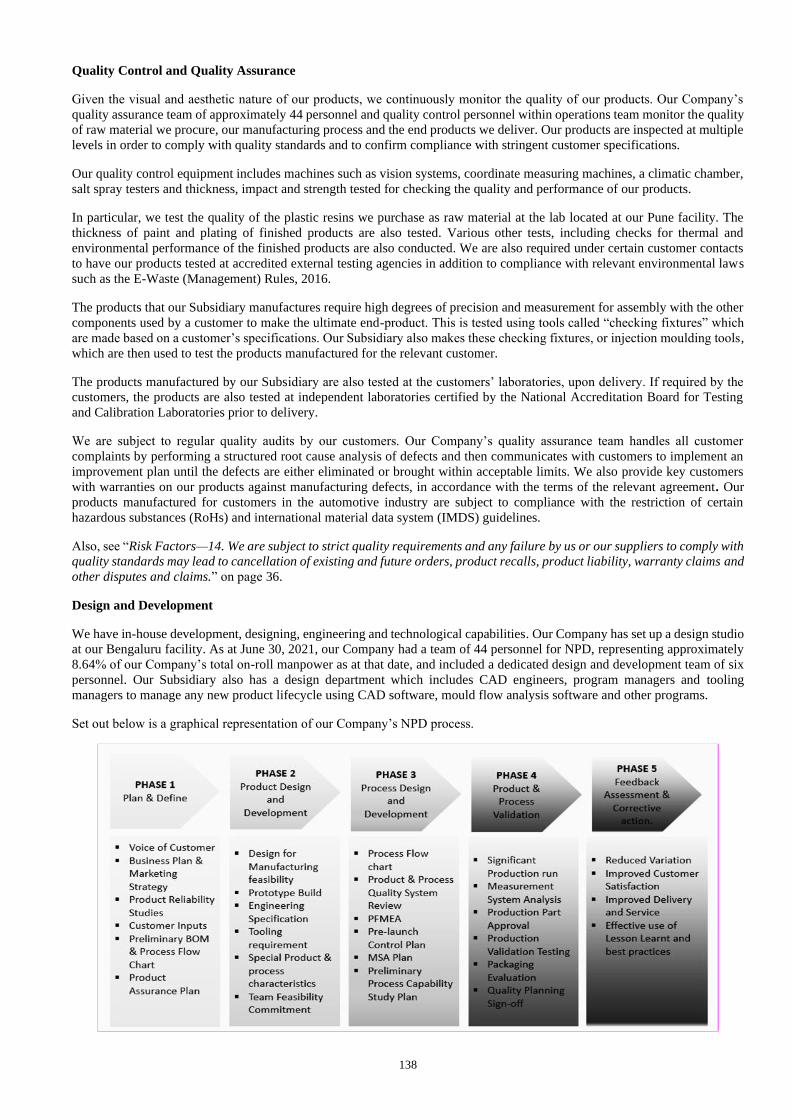
138
Quality Control and Quality Assurance
Given the visual and aesthetic nature of our products, we continuously monitor the quality of our products. Our Company’s
quality assurance team of approximately 44 personnel and quality control personnel within operations team monitor the quality
of raw material we procure, our manufacturing process and the end products we deliver. Our products are inspected at multiple
levels in order to comply with quality standards and to confirm compliance with stringent customer specifications.
Our quality control equipment includes machines such as vision systems, coordinate measuring machines, a climatic chamber,
salt spray testers and thickness, impact and strength tested for checking the quality and performance of our products.
In particular, we test the quality of the plastic resins we purchase as raw material at the lab located at our Pune facility. The
thickness of paint and plating of finished products are also tested. Various other tests, including checks for thermal and
environmental performance of the finished products are also conducted. We are also required under certain customer contacts
to have our products tested at accredited external testing agencies in addition to compliance with relevant environmental laws
such as the E-Waste (Management) Rules, 2016.
The products that our Subsidiary manufactures require high degrees of precision and measurement for assembly with the other
components used by a customer to make the ultimate end-product. This is tested using tools called “checking fixtures” which
are made based on a customer’s specifications. Our Subsidiary also makes these checking fixtures, or injection moulding tools,
which are then used to test the products manufactured for the relevant customer.
The products manufactured by our Subsidiary are also tested at the customers’ laboratories, upon delivery. If required by the
customers, the products are also tested at independent laboratories certified by the National Accreditation Board for Testing
and Calibration Laboratories prior to delivery.
We are subject to regular quality audits by our customers. Our Company’s quality assurance team handles all customer
complaints by performing a structured root cause analysis of defects and then communicates with customers to implement an
improvement plan until the defects are either eliminated or brought within acceptable limits. We also provide key customers
with warranties on our products against manufacturing defects, in accordance with the terms of the relevant agreement . Our
products manufactured for customers in the automotive industry are subject to compliance with the restriction of certain
hazardous substances (RoHs) and international material data system (IMDS) guidelines.
Also, see “Risk Factors—14. We are subject to strict quality requirements and any failure by us or our suppliers to comply with
quality standards may lead to cancellation of existing and future orders, product recalls, product liability, warranty claims and
other disputes and claims.” on page 36.
Design and Development
We have in-house development, designing, engineering and technological capabilities. Our Company has set up a design studio
at our Bengaluru facility. As at June 30, 2021, our Company had a team of 44 personnel for NPD, representing approximately
8.64% of our Company’s total on-roll manpower as at that date, and included a dedicated design and development team of six
personnel. Our Subsidiary also has a design department which includes CAD engineers, program managers and tooling
managers to manage any new product lifecycle using CAD software, mould flow analysis software and other programs.
Set out below is a graphical representation of our Company’s NPD process.
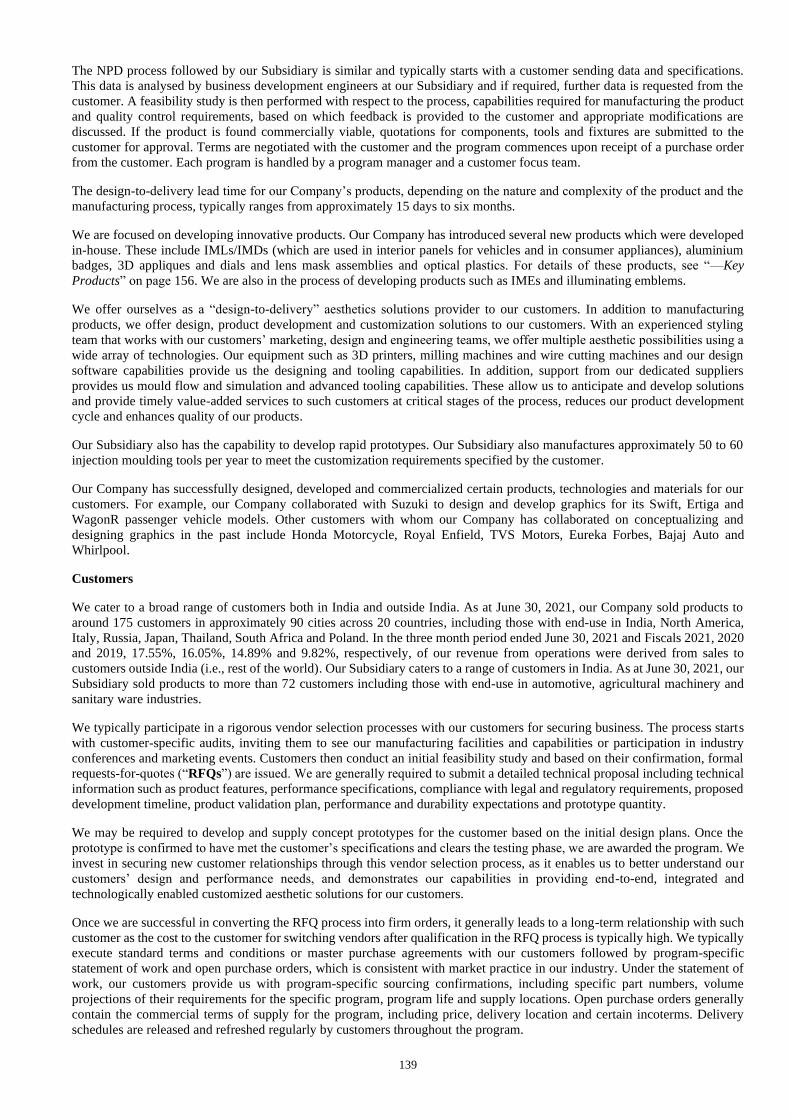
139
The NPD process followed by our Subsidiary is similar and typically starts with a customer sending data and specifications.
This data is analysed by business development engineers at our Subsidiary and if required, further data is requested from the
customer. A feasibility study is then performed with respect to the process, capabilities required for manufacturing the product
and quality control requirements, based on which feedback is provided to the customer and appropriate modifications are
discussed. If the product is found commercially viable, quotations for components, tools and fixtures are submitted to the
customer for approval. Terms are negotiated with the customer and the program commences upon receipt of a purchase order
from the customer. Each program is handled by a program manager and a customer focus team.
The design-to-delivery lead time for our Company’s products, depending on the nature and complexity of the product and the
manufacturing process, typically ranges from approximately 15 days to six months.
We are focused on developing innovative products. Our Company has introduced several new products which were developed
in-house. These include IMLs/IMDs (which are used in interior panels for vehicles and in consumer appliances), aluminium
badges, 3D appliques and dials and lens mask assemblies and optical plastics. For details of these products, see “—Key
Products” on page 156. We are also in the process of developing products such as IMEs and illuminating emblems.
We offer ourselves as a “design-to-delivery” aesthetics solutions provider to our customers. In addition to manufacturing
products, we offer design, product development and customization solutions to our customers. With an experienced styling
team that works with our customers’ marketing, design and engineering teams, we offer multiple aesthetic possibilities using a
wide array of technologies. Our equipment such as 3D printers, milling machines and wire cutting machines and our design
software capabilities provide us the designing and tooling capabilities. In addition, support from our dedicated suppliers
provides us mould flow and simulation and advanced tooling capabilities. These allow us to anticipate and develop solutions
and provide timely value-added services to such customers at critical stages of the process, reduces our product development
cycle and enhances quality of our products.
Our Subsidiary also has the capability to develop rapid prototypes. Our Subsidiary also manufactures approximately 50 to 60
injection moulding tools per year to meet the customization requirements specified by the customer.
Our Company has successfully designed, developed and commercialized certain products, technologies and materials for our
customers. For example, our Company collaborated with Suzuki to design and develop graphics for its Swift, Ertiga and
WagonR passenger vehicle models. Other customers with whom our Company has collaborated on conceptualizing and
designing graphics in the past include Honda Motorcycle, Royal Enfield, TVS Motors, Eureka Forbes, Bajaj Auto and
Whirlpool.
Customers
We cater to a broad range of customers both in India and outside India. As at June 30, 2021, our Company sold products to
around 175 customers in approximately 90 cities across 20 countries, including those with end-use in India, North America,
Italy, Russia, Japan, Thailand, South Africa and Poland. In the three month period ended June 30, 2021 and Fiscals 2021, 2020
and 2019, 17.55%, 16.05%, 14.89% and 9.82%, respectively, of our revenue from operations were derived from sales to
customers outside India (i.e., rest of the world). Our Subsidiary caters to a range of customers in India. As at June 30, 2021, our
Subsidiary sold products to more than 72 customers including those with end-use in automotive, agricultural machinery and
sanitary ware industries.
We typically participate in a rigorous vendor selection processes with our customers for securing business. The process starts
with customer-specific audits, inviting them to see our manufacturing facilities and capabilities or participation in industry
conferences and marketing events. Customers then conduct an initial feasibility study and based on their confirmation, formal
requests-for-quotes (“RFQs”) are issued. We are generally required to submit a detailed technical proposal including technical
information such as product features, performance specifications, compliance with legal and regulatory requirements, proposed
development timeline, product validation plan, performance and durability expectations and prototype quantity.
We may be required to develop and supply concept prototypes for the customer based on the initial design plans. Once the
prototype is confirmed to have met the customer’s specifications and clears the testing phase, we are awarded the program. We
invest in securing new customer relationships through this vendor selection process, as it enables us to better understand our
customers’ design and performance needs, and demonstrates our capabilities in providing end-to-end, integrated and
technologically enabled customized aesthetic solutions for our customers.
Once we are successful in converting the RFQ process into firm orders, it generally leads to a long-term relationship with such
customer as the cost to the customer for switching vendors after qualification in the RFQ process is typically high. We typically
execute standard terms and conditions or master purchase agreements with our customers followed by program-specific
statement of work and open purchase orders, which is consistent with market practice in our industry. Under the statement of
work, our customers provide us with program-specific sourcing confirmations, including specific part numbers, volume
projections of their requirements for the specific program, program life and supply locations. Open purchase orders generally
contain the commercial terms of supply for the program, including price, delivery location and certain incoterms. Delivery
schedules are released and refreshed regularly by customers throughout the program.
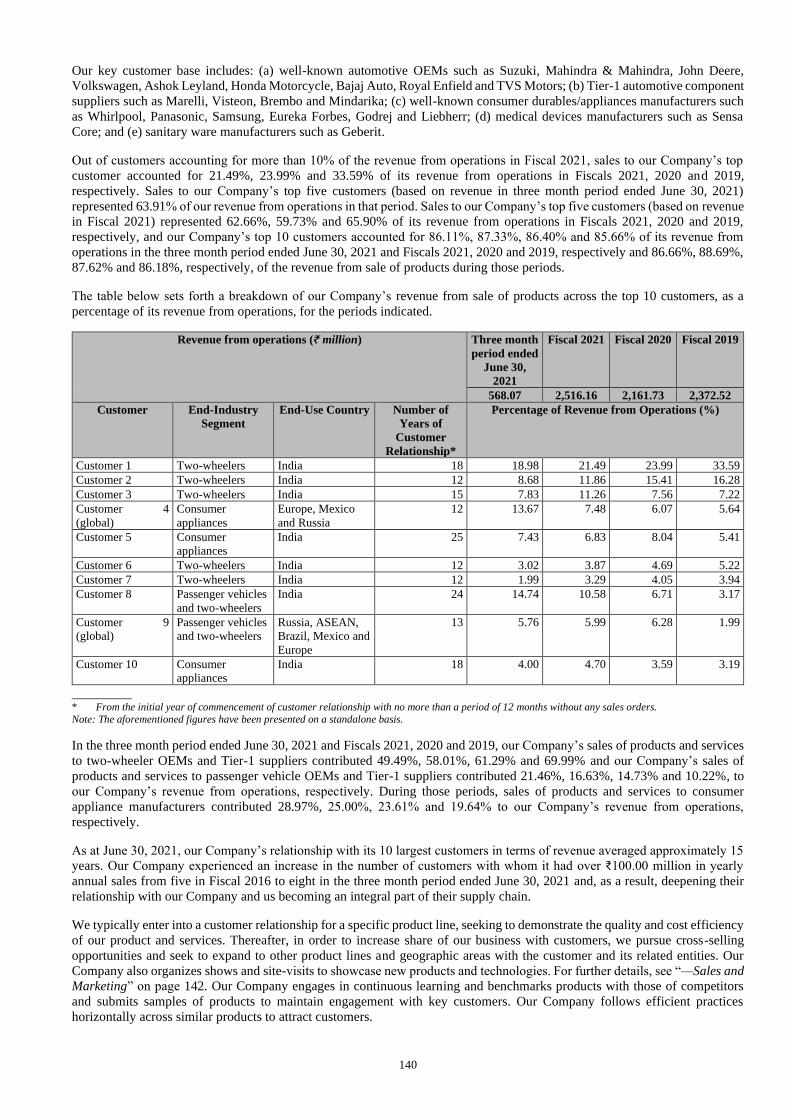
140
Our key customer base includes: (a) well-known automotive OEMs such as Suzuki, Mahindra & Mahindra, John Deere,
Volkswagen, Ashok Leyland, Honda Motorcycle, Bajaj Auto, Royal Enfield and TVS Motors; (b) Tier-1 automotive component
suppliers such as Marelli, Visteon, Brembo and Mindarika; (c) well-known consumer durables/appliances manufacturers such
as Whirlpool, Panasonic, Samsung, Eureka Forbes, Godrej and Liebherr; (d) medical devices manufacturers such as Sensa
Core; and (e) sanitary ware manufacturers such as Geberit.
Out of customers accounting for more than 10% of the revenue from operations in Fiscal 2021, sales to our Company’s top
customer accounted for 21.49%, 23.99% and 33.59% of its revenue from operations in Fiscals 2021, 2020 and 2019,
respectively. Sales to our Company’s top five customers (based on revenue in three month period ended June 30, 2021)
represented 63.91% of our revenue from operations in that period. Sales to our Company’s top five customers (based on revenue
in Fiscal 2021) represented 62.66%, 59.73% and 65.90% of its revenue from operations in Fiscals 2021, 2020 and 2019,
respectively, and our Company’s top 10 customers accounted for 86.11%, 87.33%, 86.40% and 85.66% of its revenue from
operations in the three month period ended June 30, 2021 and Fiscals 2021, 2020 and 2019, respectively and 86.66%, 88.69%,
87.62% and 86.18%, respectively, of the revenue from sale of products during those periods.
The table below sets forth a breakdown of our Company’s revenue from sale of products across the top 10 customers, as a
percentage of its revenue from operations, for the periods indicated.
Revenue from operations (₹ million) Three month
period ended
June 30,
2021
Fiscal 2021 Fiscal 2020 Fiscal 2019
568.07 2,516.16 2,161.73 2,372.52
Customer End-Industry
Segment
End-Use Country Number of
Years of
Customer
Relationship*
Percentage of Revenue from Operations (%)
Customer 1 Two-wheelers India 18 18.98 21.49 23.99 33.59
Customer 2 Two-wheelers India 12 8.68 11.86 15.41 16.28
Customer 3 Two-wheelers India 15 7.83 11.26 7.56 7.22
Customer 4
(global)
Consumer
appliances
Europe, Mexico
and Russia
12 13.67 7.48 6.07 5.64
Customer 5 Consumer
appliances
India 25 7.43 6.83 8.04 5.41
Customer 6 Two-wheelers India 12 3.02 3.87 4.69 5.22
Customer 7 Two-wheelers India 12 1.99 3.29 4.05 3.94
Customer 8 Passenger vehicles
and two-wheelers
India 24 14.74 10.58 6.71 3.17
Customer 9
(global)
Passenger vehicles
and two-wheelers
Russia, ASEAN,
Brazil, Mexico and
Europe
13 5.76 5.99 6.28 1.99
Customer 10 Consumer
appliances
India 18 4.00 4.70 3.59 3.19
_________ * From the initial year of commencement of customer relationship with no more than a period of 12 months without any sales orders.
Note: The aforementioned figures have been presented on a standalone basis.
In the three month period ended June 30, 2021 and Fiscals 2021, 2020 and 2019, our Company’s sales of products and services
to two-wheeler OEMs and Tier-1 suppliers contributed 49.49%, 58.01%, 61.29% and 69.99% and our Company’s sales of
products and services to passenger vehicle OEMs and Tier-1 suppliers contributed 21.46%, 16.63%, 14.73% and 10.22%, to
our Company’s revenue from operations, respectively. During those periods, sales of products and services to consumer
appliance manufacturers contributed 28.97%, 25.00%, 23.61% and 19.64% to our Company’s revenue from operations,
respectively.
As at June 30, 2021, our Company’s relationship with its 10 largest customers in terms of revenue averaged approximately 15
years. Our Company experienced an increase in the number of customers with whom it had over ₹100.00 million in yearly
annual sales from five in Fiscal 2016 to eight in the three month period ended June 30, 2021 and, as a result, deepening their
relationship with our Company and us becoming an integral part of their supply chain.
We typically enter into a customer relationship for a specific product line, seeking to demonstrate the quality and cost efficiency
of our product and services. Thereafter, in order to increase share of our business with customers, we pursue cross-selling
opportunities and seek to expand to other product lines and geographic areas with the customer and its related entities. Our
Company also organizes shows and site-visits to showcase new products and technologies. For further details, see “—Sales and
Marketing” on page 142. Our Company engages in continuous learning and benchmarks products with those of competitors
and submits samples of products to maintain engagement with key customers. Our Company follows efficient practices
horizontally across similar products to attract customers.
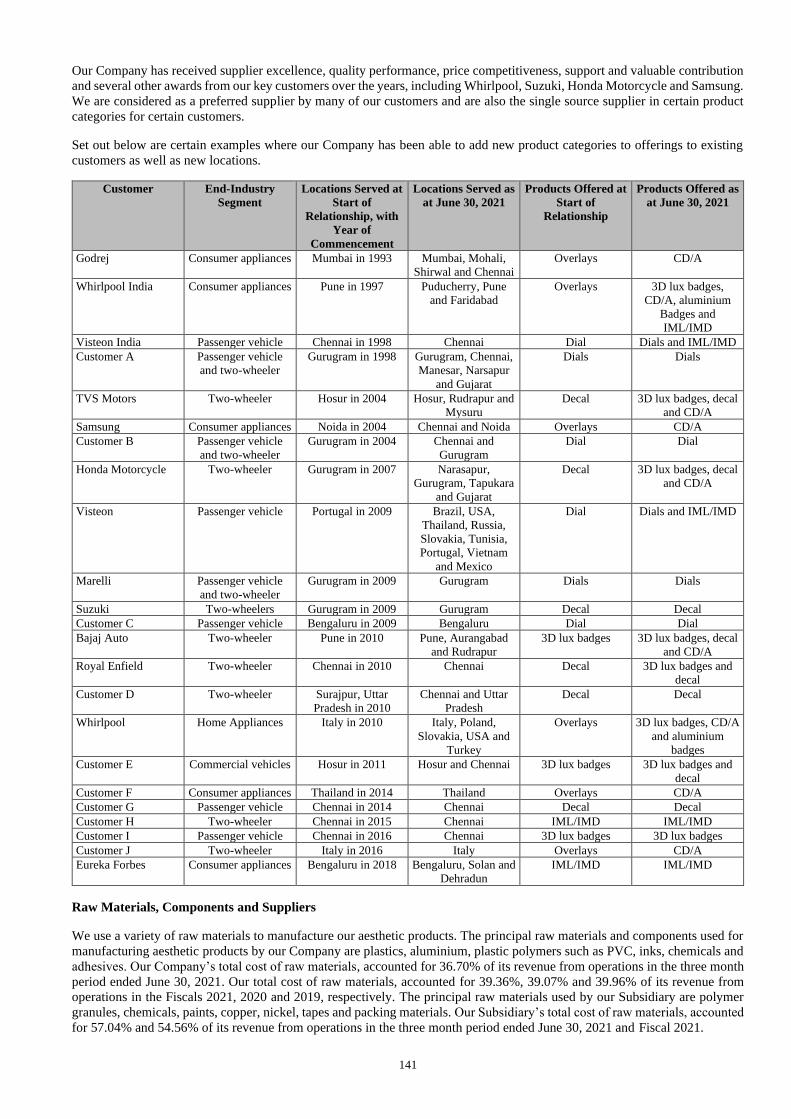
141
Our Company has received supplier excellence, quality performance, price competitiveness, support and valuable contribution
and several other awards from our key customers over the years, including Whirlpool, Suzuki, Honda Motorcycle and Samsung.
We are considered as a preferred supplier by many of our customers and are also the single source supplier in certain product
categories for certain customers.
Set out below are certain examples where our Company has been able to add new product categories to offerings to existing
customers as well as new locations.
Customer End-Industry
Segment
Locations Served at
Start of
Relationship, with
Year of
Commencement
Locations Served as
at June 30, 2021
Products Offered at
Start of
Relationship
Products Offered as
at June 30, 2021
Godrej Consumer appliances Mumbai in 1993 Mumbai, Mohali,
Shirwal and Chennai
Overlays CD/A
Whirlpool India Consumer appliances Pune in 1997 Puducherry, Pune
and Faridabad
Overlays 3D lux badges,
CD/A, aluminium
Badges and
IML/IMD
Visteon India Passenger vehicle Chennai in 1998 Chennai Dial Dials and IML/IMD
Customer A Passenger vehicle
and two-wheeler
Gurugram in 1998 Gurugram, Chennai,
Manesar, Narsapur
and Gujarat
Dials Dials
TVS Motors Two-wheeler Hosur in 2004 Hosur, Rudrapur and
Mysuru
Decal 3D lux badges, decal
and CD/A
Samsung Consumer appliances Noida in 2004 Chennai and Noida Overlays CD/A
Customer B Passenger vehicle
and two-wheeler
Gurugram in 2004 Chennai and
Gurugram
Dial Dial
Honda Motorcycle Two-wheeler Gurugram in 2007 Narasapur,
Gurugram, Tapukara
and Gujarat
Decal 3D lux badges, decal
and CD/A
Visteon Passenger vehicle Portugal in 2009 Brazil, USA,
Thailand, Russia,
Slovakia, Tunisia,
Portugal, Vietnam
and Mexico
Dial Dials and IML/IMD
Marelli Passenger vehicle
and two-wheeler
Gurugram in 2009 Gurugram Dials Dials
Suzuki Two-wheelers Gurugram in 2009 Gurugram Decal Decal
Customer C Passenger vehicle Bengaluru in 2009 Bengaluru Dial Dial
Bajaj Auto Two-wheeler Pune in 2010 Pune, Aurangabad
and Rudrapur
3D lux badges 3D lux badges, decal
and CD/A
Royal Enfield Two-wheeler Chennai in 2010 Chennai Decal 3D lux badges and
decal
Customer D Two-wheeler Surajpur, Uttar
Pradesh in 2010
Chennai and Uttar
Pradesh
Decal Decal
Whirlpool Home Appliances Italy in 2010 Italy, Poland,
Slovakia, USA and
Turkey
Overlays 3D lux badges, CD/A
and aluminium
badges
Customer E Commercial vehicles Hosur in 2011 Hosur and Chennai 3D lux badges 3D lux badges and
decal
Customer F Consumer appliances Thailand in 2014 Thailand Overlays CD/A
Customer G Passenger vehicle Chennai in 2014 Chennai Decal Decal
Customer H Two-wheeler Chennai in 2015 Chennai IML/IMD IML/IMD
Customer I Passenger vehicle Chennai in 2016 Chennai 3D lux badges 3D lux badges
Customer J Two-wheeler Italy in 2016 Italy Overlays CD/A
Eureka Forbes Consumer appliances Bengaluru in 2018 Bengaluru, Solan and
Dehradun
IML/IMD IML/IMD
Raw Materials, Components and Suppliers
We use a variety of raw materials to manufacture our aesthetic products. The principal raw materials and components used for
manufacturing aesthetic products by our Company are plastics, aluminium, plastic polymers such as PVC, inks, chemicals and
adhesives. Our Company’s total cost of raw materials, accounted for 36.70% of its revenue from operations in the three month
period ended June 30, 2021. Our total cost of raw materials, accounted for 39.36%, 39.07% and 39.96% of its revenue from
operations in the Fiscals 2021, 2020 and 2019, respectively. The principal raw materials used by our Subsidiary are polymer
granules, chemicals, paints, copper, nickel, tapes and packing materials. Our Subsidiary’s total cost of raw materials, accounted
for 57.04% and 54.56% of its revenue from operations in the three month period ended June 30, 2021 and Fiscal 2021.
142
We typically purchase our requirements for raw materials and components used in our products from qualified sources in
quantities sufficient for our needs. However, we procure certain raw materials from a limited set of suppliers.
Purchases from our Company’s top 10 suppliers constituted 58.76%, 62.48%, 64.26% and 78.53% of the total cost of raw
materials in the three month period ended June 30, 2021 and Fiscals 2021, 2020 and 2019, respectively. In the three month
period ended June 30, 2021, approximately 37.70% of the raw materials that our Company sources are imported from vendors
outside India whereas the remaining 62.30% of raw materials and components are procured from Indian vendors. Further, in
Fiscal 2021, approximately 33.74% of the raw materials that our Company sources are imported from vendors outside India
whereas the remaining 66.26% of raw materials and components are procured from Indian vendors. Our Subsidiary purchases
raw materials from India.
Our Company has long-term relationships of 10 years or more with several of key suppliers. We generally do not sign any
agreement with one-time vendors whereas we place purchase orders with regular suppliers and may enter into arrangements
with certain identified vendors. We do not enter into any long-term volume commitment for procuring materials. These practices
are consistent with the nature of our commitments with our customers and therefore does not expose us to any major risk from
fluctuation in the prices of materials.
We have a rigorous vendor evaluation, selection and quality control process to confirm that we partner with suppliers who have
the ability to comply with our quality standards, delivery schedules and other contractual obligations. Generally, we select
suppliers based on total value delivered by them (including total price, quality, delivery and technology), taking into
consideration their production capacities and financial condition. In order to comply with quality standards on an ongoing basis
and to avoid supply disruptions, we also provide training and guidance to the suppliers to upgrade their manufacturing processes.
Utilities
Power and Fuel
We use electricity for our operations. Our total costs for power and fuel constituted 2.84%, 2.06%, 2.62% and 2.26% of our
revenue from operations in the three month period ended June 30, 2021 and Fiscals 2021, 2020 and 2019, respectively. We
purchase utilities for our operations from the local utility companies in the jurisdictions where we operate. Our Company also
generates electricity from roof top solar panels for captive consumption, which accounted for 30.39%, 29.41% and 16.93% of
our Company’s total electricity requirements in the three month period ended June 30, 2021 and Fiscals 2021 and 2020,
respectively.
Water
We primarily source water from bore wells and the local industrial development authority for our operations. We also have
effluent treatment plants at our manufacturing facilities for the treatment of waste-water and its reuse, in compliance with
applicable regulatory requirements.
Sales and Marketing
Our Company’s sales and marketing team of 33 personnel include a business development team of 12 personnel that focuses
on building customer relationships, business development and supporting our program-specific management teams. The
business development team is responsible for identifying new customers, new markets, new technologies and forging local and
global partnerships with OEMs and Tier-1 suppliers within the automotive, consumer appliance and allied industries. A business
development strategy based on the market and our requirements is also designed by our sales and marketing team.
Our Subsidiary has a team comprised of a senior manager and an engineer for managing sales and marketing functions. Sales
forecasts are prepared based on orders and requests received from customers prior to the beginning of each month. Such sales
forecasts are used as input for an ERP system to prepare job orders and purchase orders that enable our Subsidiary to fulfil the
customers’ requirements. Stocks and inventory are maintained for raw material as well as finished goods to confirm a smooth
production cycle and delivery to customers without delay.
The sales and marketing team closely coordinates with our NPD team and our customers’ marketing, design and engineering
teams to understand their style, design and other technical requirements. Their degree of involvement varies depending upon a
customer’s requirements and ranges from designing of products from inception, including providing inputs on the type of
materials to be used to proposing unique features, submitting prototypes based on customers’ requirements and proposing new
specifications to improve the existing design.
We adopt a strategy of early engagement with customers to increase the probability of new business and strengthen our
relationship. Our Company conducts technology shows for customers to showcase new products and possibilities in the
aesthetics sphere. These shows also include mock-ups of end products with features that could enhance product appeal. R&D,
styling, purchasing, marketing and other top management executives representing our customers attend these shows. This helps
us build early customer engagement and strengthen our position as their supplier of choice for our products.
143
We also work with customers on co-designing by proposing ideas, technology and designs from the conceptual stage of product
development. Key account managers are assigned to serve specific customers for one or more products and are responsible for
servicing existing business and for identifying and winning new business.
Distribution
Storage
Our Company’s distribution channel consists of six warehouses. These are located in Gurugram in Haryana, Rudrapur in
Uttarakhand, Aurangabad and Pune in Maharashtra, Kanchipuram in Tamil Nadu and Mysuru in Karnataka in India. Our
Company also has a warehouse adjoining our manufacturing facility in Bengaluru, located within the same premises. Our
Subsidiary leases a warehouse in Hosur in Tamil Nadu to cater to the requirements of one of its largest customers, TVS Motors.
Our manufacturing facilities and warehouses in India are located close to the automotive and engineering clusters where several
of our customers are based. Our warehouses work as our delivery points to key customers enabling us to meet their just-in-time
delivery schedules, drives economies of scale and logistical efficiencies for our customers insulating them from supply
disruptions and enhance our engagement with them. Our warehousing arrangements are flexible in nature and therefore storage
space can be increased or decreased depending on our requirements.
Transportation
Our Company’s supply chain and logistics team of 14 personnel handles supplies of our products to our customers. This team
is responsible for end-to-end coordination with customers, the production planning team and the dispatch team. For our
operations in India, we typically move finished goods to our customers by road within their delivery schedules. In a few cases,
our customers may directly pick up the goods at our manufacturing facilities or warehouses, and in such cases our customers
handle these arrangements. For our customers located outside India, we generally export our products through sea shipments
and, by air in certain circumstances to allow operation of customer production lines without interruption. Costs associated with
the transportation of our products are generally included in the purchase price.
Certifications, Awards and Accreditations
We have been recognized by our customers and industry organizations for our excellence in business. For details in connection
with certifications and awards received by our Company, see “History and Certain Corporate Matters—Awards, certifications,
accreditations and recognitions received by our Company” on page 154.
Our Bengaluru facility is certified for international quality and environmental management systems such as IATF 16949:2016,
ISO 9001:2015 and ISO 45001:2018. Our Pune facility is also certified for international quality and environmental management
systems such as IATF 16949:2016 and ISO 14001:2015.
Competition
The Indian decorative aesthetics industry is comprised of a few players with diversified product portfolios having presence
across most OEMs, however there are several other enterprises which manufacture one or a limited range of decorative
aesthetics and are direct suppliers to OEMs and Tier-1 suppliers, evidencing the fragmented nature of the industry. Certain
segments within the aesthetics industry, particularly decals, graphics and logos, are highly commoditized and have low barriers
to entry or exit, leading to a market with a certain degree of fragmentation. We believe that the principal competitive factors in
our markets include customer relationships, technology, reliability, price, design capability, quality of products and services,
delivery timelines, development and program/model launch support and the ability to understand evolving industry trends as
well as the ability to anticipate, understand and address customer requirements.
We compete worldwide with a number of other Indian and foreign manufacturers that produce and sell similar aesthetic
products. Many of our competitors are larger and have greater financial and other resources than our Company as well as other
economic advantages as compared to our business, such as patents, existing underutilized capacity, lower labour costs, lower
health care costs, lower tax rates and, in some cases, export or raw materials subsidies. In addition, a number of our major
automotive OEMs and consumer appliance manufacturers may commence manufacture of competing aesthetic products for
their own use and for others. Other customers could elect to manufacture products to meet their own requirements or to compete
with us. For many products, our competitors may enjoy local or other economic advantages not available to us. Also, see “Risk
Factors—7. We operate in a highly competitive industry and increased competition may lead to a reduction in our revenues,
reduced profit margins or a loss of market share.” on page 31.
According to the CRISIL Report, our principal competitors in India include Polyplastics Industries India Private Limited,
Classic Stripes Private Limited, PRS Permacel Private Limited, Monochem Graphics Private Limited, Galva Deco Parts Private
Limited, Pragati Industries Private Limited, Unique Label Private Limited and Kongovi Private Limited. For further details,
see “Industry Overview” on page 96.
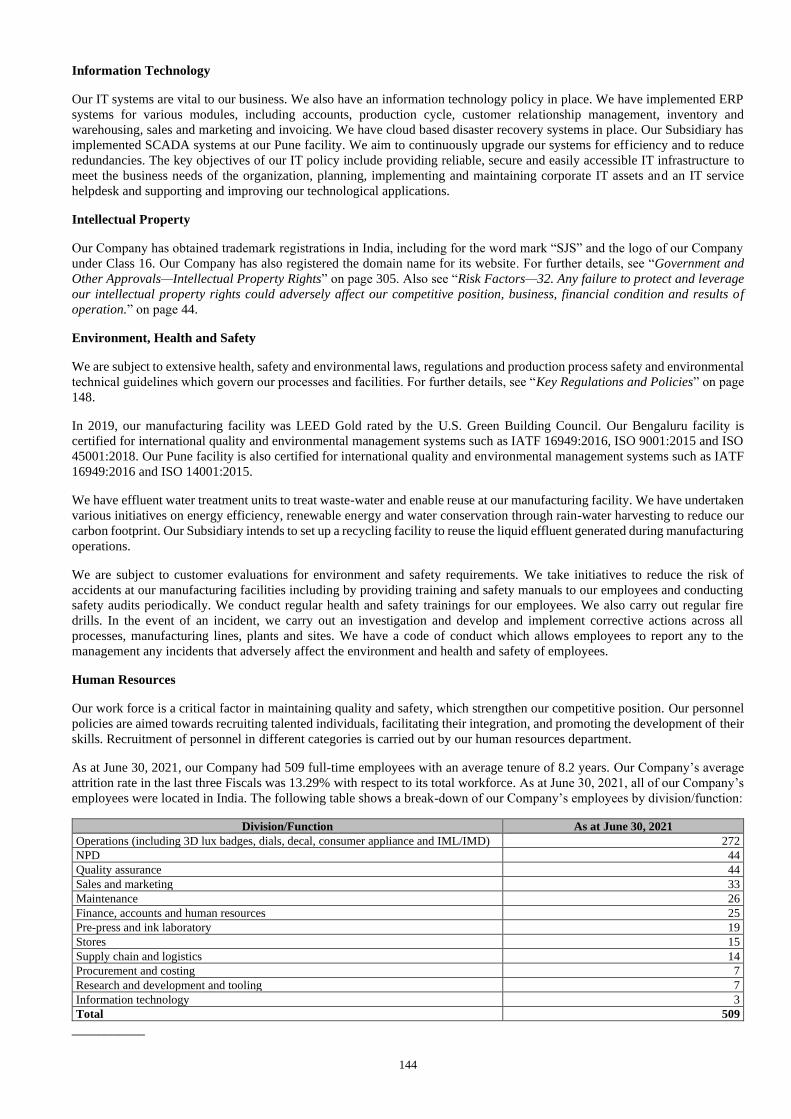
144
Information Technology
Our IT systems are vital to our business. We also have an information technology policy in place. We have implemented ERP
systems for various modules, including accounts, production cycle, customer relationship management, inventory and
warehousing, sales and marketing and invoicing. We have cloud based disaster recovery systems in place. Our Subsidiary has
implemented SCADA systems at our Pune facility. We aim to continuously upgrade our systems for efficiency and to reduce
redundancies. The key objectives of our IT policy include providing reliable, secure and easily accessible IT infrastructure to
meet the business needs of the organization, planning, implementing and maintaining corporate IT assets and an IT service
helpdesk and supporting and improving our technological applications.
Intellectual Property
Our Company has obtained trademark registrations in India, including for the word mark “SJS” and the logo of our Company
under Class 16. Our Company has also registered the domain name for its website. For further details, see “Government and
Other Approvals—Intellectual Property Rights” on page 305. Also see “Risk Factors—32. Any failure to protect and leverage
our intellectual property rights could adversely affect our competitive position, business, financial condition and results of
operation.” on page 44.
Environment, Health and Safety
We are subject to extensive health, safety and environmental laws, regulations and production process safety and environmental
technical guidelines which govern our processes and facilities. For further details, see “Key Regulations and Policies” on page
148.
In 2019, our manufacturing facility was LEED Gold rated by the U.S. Green Building Council. Our Bengaluru facility is
certified for international quality and environmental management systems such as IATF 16949:2016, ISO 9001:2015 and ISO
45001:2018. Our Pune facility is also certified for international quality and environmental management systems such as IATF
16949:2016 and ISO 14001:2015.
We have effluent water treatment units to treat waste-water and enable reuse at our manufacturing facility. We have undertaken
various initiatives on energy efficiency, renewable energy and water conservation through rain-water harvesting to reduce our
carbon footprint. Our Subsidiary intends to set up a recycling facility to reuse the liquid effluent generated during manufacturing
operations.
We are subject to customer evaluations for environment and safety requirements. We take initiatives to reduce the risk of
accidents at our manufacturing facilities including by providing training and safety manuals to our employees and conducting
safety audits periodically. We conduct regular health and safety trainings for our employees. We also carry out regular fire
drills. In the event of an incident, we carry out an investigation and develop and implement corrective actions across all
processes, manufacturing lines, plants and sites. We have a code of conduct which allows employees to report any to the
management any incidents that adversely affect the environment and health and safety of employees.
Human Resources
Our work force is a critical factor in maintaining quality and safety, which strengthen our competitive position. Our personnel
policies are aimed towards recruiting talented individuals, facilitating their integration, and promoting the development of their
skills. Recruitment of personnel in different categories is carried out by our human resources department.
As at June 30, 2021, our Company had 509 full-time employees with an average tenure of 8.2 years. Our Company’s average
attrition rate in the last three Fiscals was 13.29% with respect to its total workforce. As at June 30, 2021, all of our Company’s
employees were located in India. The following table shows a break-down of our Company’s employees by division/function:
Division/Function As at June 30, 2021 Operations (including 3D lux badges, dials, decal, consumer appliance and IML/IMD) 272
NPD 44
Quality assurance 44
Sales and marketing 33
Maintenance 26
Finance, accounts and human resources 25
Pre-press and ink laboratory 19
Stores 15
Supply chain and logistics 14
Procurement and costing 7
Research and development and tooling 7
Information technology 3
Total 509
___________
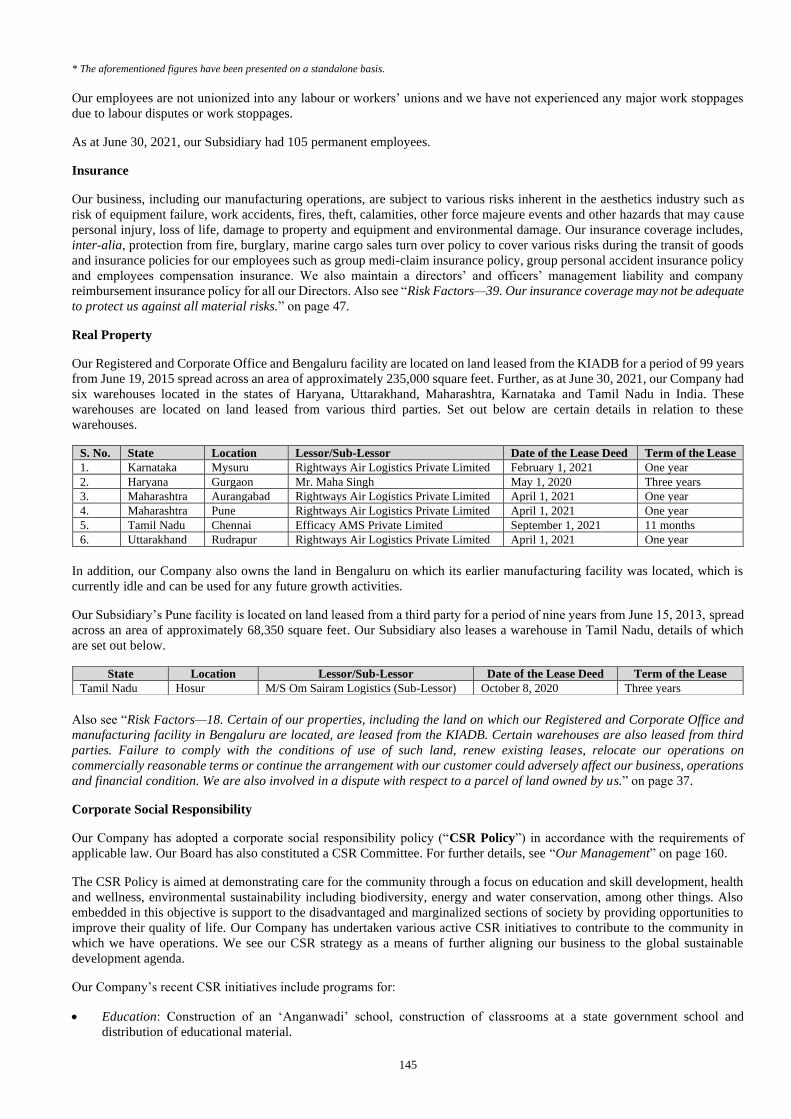
145
* The aforementioned figures have been presented on a standalone basis.
Our employees are not unionized into any labour or workers’ unions and we have not experienced any major work stoppages
due to labour disputes or work stoppages.
As at June 30, 2021, our Subsidiary had 105 permanent employees.
Insurance
Our business, including our manufacturing operations, are subject to various risks inherent in the aesthetics industry such as
risk of equipment failure, work accidents, fires, theft, calamities, other force majeure events and other hazards that may cause
personal injury, loss of life, damage to property and equipment and environmental damage. Our insurance coverage includes,
inter-alia, protection from fire, burglary, marine cargo sales turn over policy to cover various risks during the transit of goods
and insurance policies for our employees such as group medi-claim insurance policy, group personal accident insurance policy
and employees compensation insurance. We also maintain a directors’ and officers’ management liability and company
reimbursement insurance policy for all our Directors. Also see “Risk Factors—39. Our insurance coverage may not be adequate
to protect us against all material risks.” on page 47.
Real Property
Our Registered and Corporate Office and Bengaluru facility are located on land leased from the KIADB for a period of 99 years
from June 19, 2015 spread across an area of approximately 235,000 square feet. Further, as at June 30, 2021, our Company had
six warehouses located in the states of Haryana, Uttarakhand, Maharashtra, Karnataka and Tamil Nadu in India. These
warehouses are located on land leased from various third parties. Set out below are certain details in relation to these
warehouses.
In addition, our Company also owns the land in Bengaluru on which its earlier manufacturing facility was located, which is
currently idle and can be used for any future growth activities.
Our Subsidiary’s Pune facility is located on land leased from a third party for a period of nine years from June 15, 2013, spread
across an area of approximately 68,350 square feet. Our Subsidiary also leases a warehouse in Tamil Nadu, details of which
are set out below.
Also see “Risk Factors—18. Certain of our properties, including the land on which our Registered and Corporate Office and
manufacturing facility in Bengaluru are located, are leased from the KIADB. Certain warehouses are also leased from third
parties. Failure to comply with the conditions of use of such land, renew existing leases, relocate our operations on
commercially reasonable terms or continue the arrangement with our customer could adversely affect our business, operations
and financial condition. We are also involved in a dispute with respect to a parcel of land owned by us.” on page 37.
Corporate Social Responsibility
Our Company has adopted a corporate social responsibility policy (“CSR Policy”) in accordance with the requirements of
applicable law. Our Board has also constituted a CSR Committee. For further details, see “Our Management” on page 160.
The CSR Policy is aimed at demonstrating care for the community through a focus on education and skill development, health
and wellness, environmental sustainability including biodiversity, energy and water conservation, among other things. Also
embedded in this objective is support to the disadvantaged and marginalized sections of society by providing opportunities to
improve their quality of life. Our Company has undertaken various active CSR initiatives to contribute to the community in
which we have operations. We see our CSR strategy as a means of further aligning our business to the global sustainable
development agenda.
Our Company’s recent CSR initiatives include programs for:
• Education: Construction of an ‘Anganwadi’ school, construction of classrooms at a state government school and
distribution of educational material.
S. No. State Location Lessor/Sub-Lessor Date of the Lease Deed Term of the Lease
1. Karnataka Mysuru Rightways Air Logistics Private Limited February 1, 2021 One year
2. Haryana Gurgaon Mr. Maha Singh May 1, 2020 Three years
3. Maharashtra Aurangabad Rightways Air Logistics Private Limited April 1, 2021 One year
4. Maharashtra Pune Rightways Air Logistics Private Limited April 1, 2021 One year
5. Tamil Nadu Chennai Efficacy AMS Private Limited September 1, 2021 11 months
6. Uttarakhand Rudrapur Rightways Air Logistics Private Limited April 1, 2021 One year
State Location Lessor/Sub-Lessor Date of the Lease Deed Term of the Lease
Tamil Nadu Hosur M/S Om Sairam Logistics (Sub-Lessor) October 8, 2020 Three years
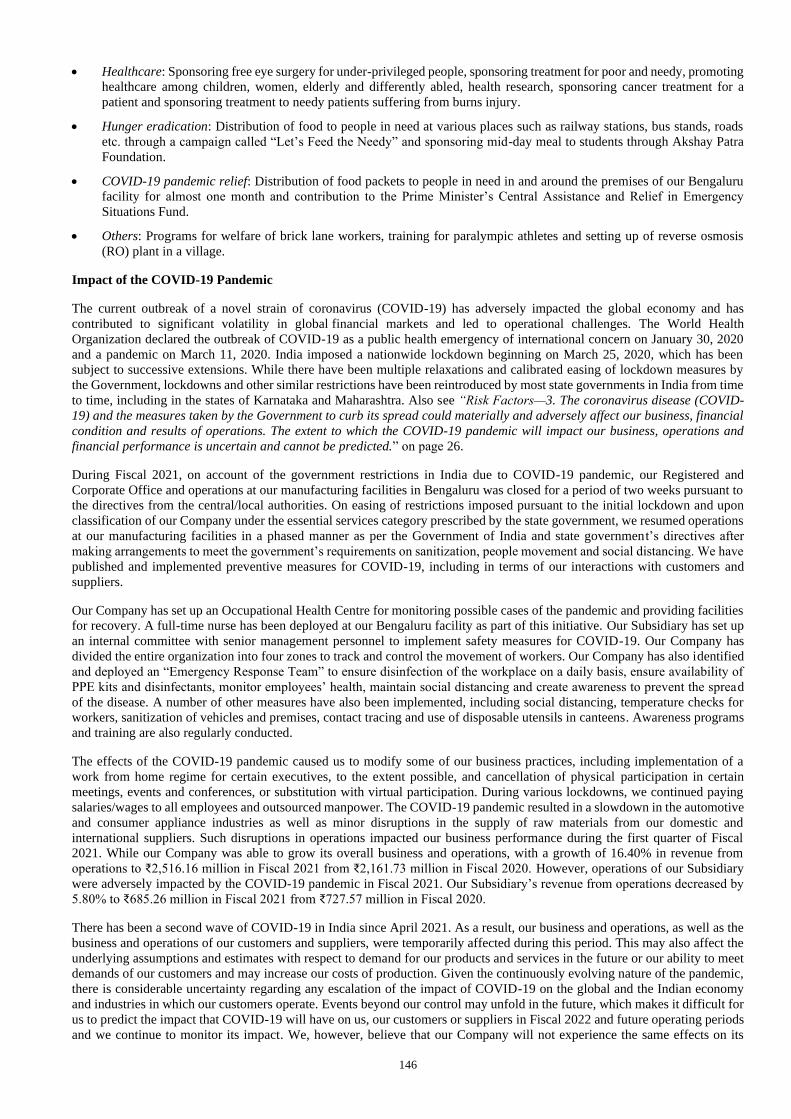
146
• Healthcare: Sponsoring free eye surgery for under-privileged people, sponsoring treatment for poor and needy, promoting
healthcare among children, women, elderly and differently abled, health research, sponsoring cancer treatment for a
patient and sponsoring treatment to needy patients suffering from burns injury.
• Hunger eradication: Distribution of food to people in need at various places such as railway stations, bus stands, roads
etc. through a campaign called “Let’s Feed the Needy” and sponsoring mid-day meal to students through Akshay Patra
Foundation.
• COVID-19 pandemic relief: Distribution of food packets to people in need in and around the premises of our Bengaluru
facility for almost one month and contribution to the Prime Minister’s Central Assistance and Relief in Emergency
Situations Fund.
• Others: Programs for welfare of brick lane workers, training for paralympic athletes and setting up of reverse osmosis
(RO) plant in a village.
Impact of the COVID-19 Pandemic
The current outbreak of a novel strain of coronavirus (COVID-19) has adversely impacted the global economy and has
contributed to significant volatility in global financial markets and led to operational challenges. The World Health
Organization declared the outbreak of COVID-19 as a public health emergency of international concern on January 30, 2020
and a pandemic on March 11, 2020. India imposed a nationwide lockdown beginning on March 25, 2020, which has been
subject to successive extensions. While there have been multiple relaxations and calibrated easing of lockdown measures by
the Government, lockdowns and other similar restrictions have been reintroduced by most state governments in India from time
to time, including in the states of Karnataka and Maharashtra. Also see “Risk Factors—3. The coronavirus disease (COVID-
19) and the measures taken by the Government to curb its spread could materially and adversely affect our business, financial
condition and results of operations. The extent to which the COVID-19 pandemic will impact our business, operations and
financial performance is uncertain and cannot be predicted.” on page 26.
During Fiscal 2021, on account of the government restrictions in India due to COVID-19 pandemic, our Registered and
Corporate Office and operations at our manufacturing facilities in Bengaluru was closed for a period of two weeks pursuant to
the directives from the central/local authorities. On easing of restrictions imposed pursuant to the initial lockdown and upon
classification of our Company under the essential services category prescribed by the state government, we resumed operations
at our manufacturing facilities in a phased manner as per the Government of India and state government’s directives after
making arrangements to meet the government’s requirements on sanitization, people movement and social distancing. We have
published and implemented preventive measures for COVID-19, including in terms of our interactions with customers and
suppliers.
Our Company has set up an Occupational Health Centre for monitoring possible cases of the pandemic and providing facilities
for recovery. A full-time nurse has been deployed at our Bengaluru facility as part of this initiative. Our Subsidiary has set up
an internal committee with senior management personnel to implement safety measures for COVID-19. Our Company has
divided the entire organization into four zones to track and control the movement of workers. Our Company has also identified
and deployed an “Emergency Response Team” to ensure disinfection of the workplace on a daily basis, ensure availability of
PPE kits and disinfectants, monitor employees’ health, maintain social distancing and create awareness to prevent the spread
of the disease. A number of other measures have also been implemented, including social distancing, temperature checks for
workers, sanitization of vehicles and premises, contact tracing and use of disposable utensils in canteens. Awareness programs
and training are also regularly conducted.
The effects of the COVID-19 pandemic caused us to modify some of our business practices, including implementation of a
work from home regime for certain executives, to the extent possible, and cancellation of physical participation in certain
meetings, events and conferences, or substitution with virtual participation. During various lockdowns, we continued paying
salaries/wages to all employees and outsourced manpower. The COVID-19 pandemic resulted in a slowdown in the automotive
and consumer appliance industries as well as minor disruptions in the supply of raw materials from our domestic and
international suppliers. Such disruptions in operations impacted our business performance during the first quarter of Fiscal
2021. While our Company was able to grow its overall business and operations, with a growth of 16.40% in revenue from
operations to ₹2,516.16 million in Fiscal 2021 from ₹2,161.73 million in Fiscal 2020. However, operations of our Subsidiary
were adversely impacted by the COVID-19 pandemic in Fiscal 2021. Our Subsidiary’s revenue from operations decreased by
5.80% to ₹685.26 million in Fiscal 2021 from ₹727.57 million in Fiscal 2020.
There has been a second wave of COVID-19 in India since April 2021. As a result, our business and operations, as well as the
business and operations of our customers and suppliers, were temporarily affected during this period. This may also affect the
underlying assumptions and estimates with respect to demand for our products and services in the future or our ability to meet
demands of our customers and may increase our costs of production. Given the continuously evolving nature of the pandemic,
there is considerable uncertainty regarding any escalation of the impact of COVID-19 on the global and the Indian economy
and industries in which our customers operate. Events beyond our control may unfold in the future, which makes it difficult for
us to predict the impact that COVID-19 will have on us, our customers or suppliers in Fiscal 2022 and future operating periods
and we continue to monitor its impact. We, however, believe that our Company will not experience the same effects on its

147
business, operations and financial performance as a result of the second or any subsequent wave of COVID-19 compared to
those that it did during the first wave of COVID-19 in the first quarter of Fiscal 2021. The industries that we cater to may also
experience comparatively improved business conditions in Fiscal 2022, according to the CRISIL Report.

148
KEY REGULATIONS AND POLICIES
Given below is an indicative summary of certain relevant laws and regulations as prescribed by the Government of India or
State Governments which are applicable to our Company and our Subsidiary. The information in this section has been obtained
from various legislations, including regulations promulgated by regulatory bodies, which are available in the public domain.
The description of the applicable regulations as given below has been provided in a manner to provide general information to
the investors and may not be exhaustive and is neither designed nor intended to be a substitute for professional legal advice.
The statements below are based on the current provisions of applicable law, which are subject to change or modification by
subsequent legislative, regulatory, administrative or judicial decisions.
We are a “design-to-delivery” aesthetics solutions provider with the ability to design, develop and manufacture a diverse product
portfolio. We operate through our manufacturing facilities located in Bengaluru, Karnataka and Pune, Maharashtra. For further
details, see “Our Business” on page 120.
Under the provisions of various Central Government and State Government statutes and legislations, our Company and our
Subsidiary are required to obtain and periodically renew certain licenses or registrations and to seek statutory permissions to
conduct our business and operations. For further details, see “Government and Other Approvals” on page 305.
Given below is a brief description of certain relevant legislations that are currently applicable to the business carried on by us.
I. Key Regulations applicable to our Company and Subsidiary
The key laws applicable to our Company and Subsidiary include:
Factories Act, 1948
The Factories Act, 1948, as amended (the “Factories Act”), defines a “factory” to cover any premises which employs
10 or more workers on any day of the preceding 12 months and in which a manufacturing process is carried on with
the aid of power or any premises where at least 20 workers are employed, and where a manufacturing process is carried
on without the aid of power. Each State Government has enacted rules in respect of the prior submission of plans and
their approval for the establishment of factories and registration/licensing thereof. The Factories Act provides for
imposition of fines and imprisonment of the manager and occupier of the factory in case of any contravention of the
provisions of the Factories Act.
Shops and Establishments Legislations in various states
Under the provisions of local shops and establishments legislations applicable in the states in which establishments
are set up, establishments are required to be registered as prescribed under the respective legislations. Such legislations
regulate the working and employment conditions of the workers employed in shops and establishments including
commercial establishments and provide for fixation of working hours, rest intervals, overtime, holiday, leave,
termination of service, maintenance of shops and establishments and other rights and obligations of the employers and
employee. Our locations/units have to be registered under the shops and establishments legislations of the state where
they are located.
Legal Metrology Act, 2009 (“LM Act”)
The LM Act seeks to establish and enforce standards of weights and measures, regulate trade and commerce in weights,
measures and other goods which are sold or distributed by weight, measure or number and for matters connected
therewith or incidental thereto. The LM Act makes it mandatory to obtain a license from the Controller of Legal
Metrology by any person who manufactures sells or repairs any weight or measure. All weights or measures in use or
proposed to be used in any transaction, are required to be verified and stamped at such place and during such hours as
the Controller of Legal Metrology may specify, on payment of prescribed fees. Various penalties have been provided
for contravention of the provisions of the LM Act. The penalty of using a non-standard weight or measure may attract
a fine of up to ₹ 20,000 and a subsequent offence may lead to penalties and imprisonment extending to three years
along with fine. In case a person imports any weight or measure without being registered under the LM Act, he may
be punished with fine which may extend to ₹ 25,000. The LM Act also provides for provisions relating to compounding
of offences.
Sale of Goods Act, 1930 (the “Sale of Goods Act”)
The Sale of Goods Act governs contracts relating to sale of goods in India. The contracts for sale of goods are subject
to the general principles of the law relating to contracts. A contract of sale may be an absolute one, or based on certain
conditions. The Sale of Goods Act contains provisions in relation to the essential aspects of such contracts, including
the transfer of ownership of the goods, delivery of goods, rights and duties of the buyer and seller, remedies for breach
of contract and the conditions and warranties implied under a contract for sale of goods.

149
Motor Vehicles Act, 1988 (“MVA”) and Central Motor Vehicles Rules, 1989 (“CMV Rules”)
The MVA read with the CMV Rules is an umbrella legislation which regulates all aspects of road transport vehicles
including licensing of drivers and conductors, registration of motor vehicles, control of motor vehicles through permits,
licensing of driving schools, special provisions relating to state transport undertakings, traffic regulation and insurance.
As per MVA and the CMV Rules, no person shall drive any motor vehicle in any public place or in any other place
unless the vehicle is registered with the registering authority and the vehicle carries a registration mark displayed in
the manner as specified in the MVA and the CMV Rules. The MVA and the CMV Rules also state that no person shall
establish or maintain any driving school or establishment for imparting instructions for hire or reward in driving motor
vehicles without a license in Form 11 granted by the licensing authority
Fire prevention and life safety measures
We are subject to the fire control and safety rules and regulations framed by the state governments of Maharashtra and
Karnataka under the Maharashtra Fire Prevention & Life Safety Measure Act, 2006 and the Karnataka Fire Force Act,
1964 respectively.
Merchandise Exports from India Scheme (“MEIS”)
The MEIS was introduced as a part of the ‘Foreign Trade Policy’ 2015-2020 (“FTP”), which was effective until
September 30, 2021. The objective of MEIS is to promote the manufacture and export of notified goods or products
by providing rewards to exporters. ‘Duty Credit Scrips’ are granted as reward and can be used for: (i) payment of
customs duty for import of inputs or goods, and in case of defaults in export obligations; (ii) payment of central excise
duties on domestic procurement of inputs or goods; and (iii) payment of composition fee or application fee under FTP,
and for payment of value shortfall in export obligations, among other things.
The Directorate General of Foreign Trade (“DGFT”) notified a list of products and corresponding list of export
markets and rate of rewards, basis which rewards can be claimed. Reward is calculated on the basis of free on board
(“FOB”) value of exports. Further, exports of goods through courier or foreign post office using e-commerce, of FOB
value up to Rs. 500,000 per consignment shall also be entitled for rewards under MEIS. In case the value of exports is
more than Rs. 500,000 per consignment then the MEIS reward would be calculated basis FOB value of Rs. 500,000
only. The scheme also provides for categories of exports that are ineligible for grant of rewards.
Remission of Duties and Taxes on Exported Products Scheme (“RoDTEP Scheme”)
The RoDTEP Scheme was implemented on January 1, 2021, to refund to exporters the embedded central, state and
local duties/taxes that were not refunded under any other duty remission schemes. The refund will be credited in an
exporter’s ledger account with customs authorities and can be used to pay basic customs duty on imported goods. The
credits can also be transferred to other importers.
The RoDTEP Scheme has been formulated to replace the existing MEIS.
Duty Drawback Scheme
Under Section 75 of Customs Act, 1962, the Central Government is empowered to grant duty drawback of the duty
paid on imported goods which are used in the manufacture of exported goods. The Duty Drawback Scheme is a part
of the FTP, which was effective until September 30, 2021. Under the scheme, customs and central excise duties
chargeable on any imported materials or excisable materials used in the manufacture of exported goods, will be
rebated.
Refund of duty is claimed as per all industry rates (“AIR”). AIRs are notified, generally every year by the Central
Government in the form of a ‘Drawback Schedule’ based on the average quantity and value of inputs and duties (both
customs and central excise) borne by export products. The AIR may be fixed as a percentage of FOB price of export
product or as specific rates. All claims of duty drawback are filed with reference to the tariff items and description of
goods given in the drawback schedule.
II. Key applicable intellectual property laws
The Copyright Act, 1957 (“Copyright Act”)
The Copyright Act governs copyrights subsisting in original literary, dramatic, musical or artistic works,
cinematograph films, and sound recordings, including computer programmes, tables and compilations including
computer databases. Even while copyright registration is not a prerequisite for acquiring or enforcing a copyright in
an otherwise copyrightable work, registration under the Copyright Act acts as a prima facie evidence of the particulars
entered therein and helps expedite infringement proceedings and reduce delay caused due to evidentiary
considerations.
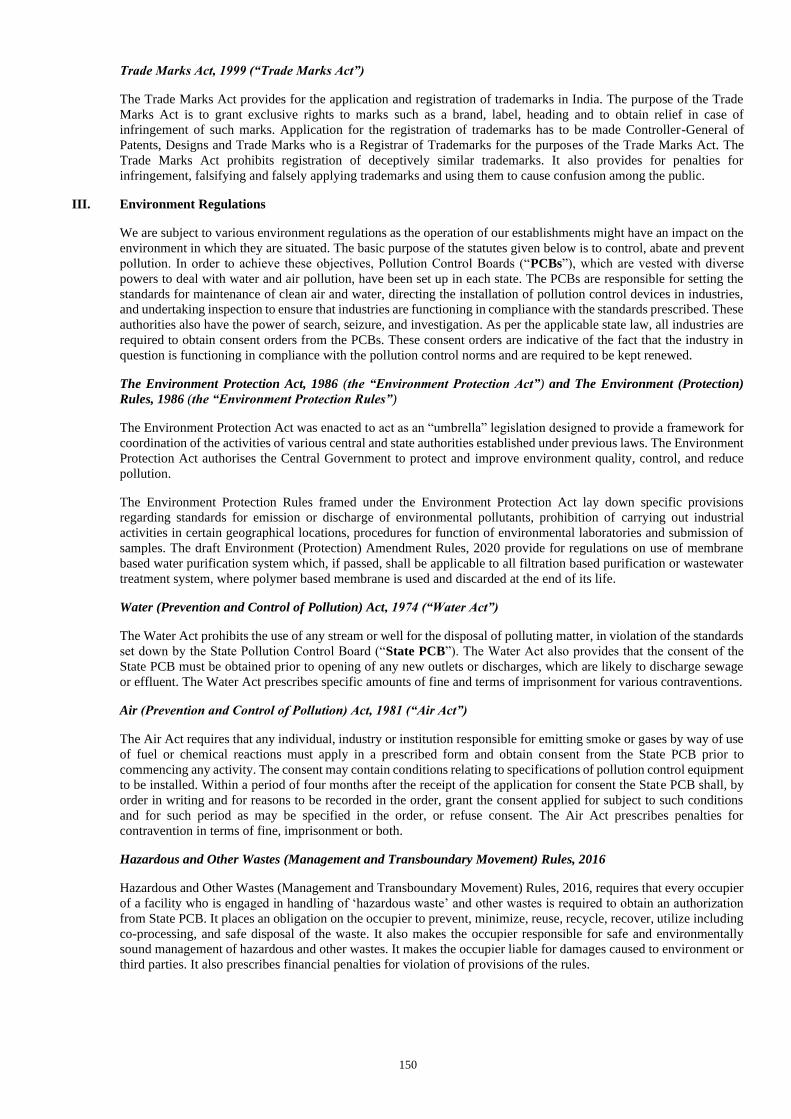
150
Trade Marks Act, 1999 (“Trade Marks Act”)
The Trade Marks Act provides for the application and registration of trademarks in India. The purpose of the Trade
Marks Act is to grant exclusive rights to marks such as a brand, label, heading and to obtain relief in case of
infringement of such marks. Application for the registration of trademarks has to be made Controller-General of
Patents, Designs and Trade Marks who is a Registrar of Trademarks for the purposes of the Trade Marks Act. The
Trade Marks Act prohibits registration of deceptively similar trademarks. It also provides for penalties for
infringement, falsifying and falsely applying trademarks and using them to cause confusion among the public.
III. Environment Regulations
We are subject to various environment regulations as the operation of our establishments might have an impact on the
environment in which they are situated. The basic purpose of the statutes given below is to control, abate and prevent
pollution. In order to achieve these objectives, Pollution Control Boards (“PCBs”), which are vested with diverse
powers to deal with water and air pollution, have been set up in each state. The PCBs are responsible for setting the
standards for maintenance of clean air and water, directing the installation of pollution control devices in industries,
and undertaking inspection to ensure that industries are functioning in compliance with the standards prescribed. These
authorities also have the power of search, seizure, and investigation. As per the applicable state law, all industries are
required to obtain consent orders from the PCBs. These consent orders are indicative of the fact that the industry in
question is functioning in compliance with the pollution control norms and are required to be kept renewed.
The Environment Protection Act, 1986 (the “Environment Protection Act”) and The Environment (Protection)
Rules, 1986 (the “Environment Protection Rules”)
The Environment Protection Act was enacted to act as an “umbrella” legislation designed to provide a framework for
coordination of the activities of various central and state authorities established under previous laws. The Environment
Protection Act authorises the Central Government to protect and improve environment quality, control, and reduce
pollution.
The Environment Protection Rules framed under the Environment Protection Act lay down specific provisions
regarding standards for emission or discharge of environmental pollutants, prohibition of carrying out industrial
activities in certain geographical locations, procedures for function of environmental laboratories and submission of
samples. The draft Environment (Protection) Amendment Rules, 2020 provide for regulations on use of membrane
based water purification system which, if passed, shall be applicable to all filtration based purification or wastewater
treatment system, where polymer based membrane is used and discarded at the end of its life.
Water (Prevention and Control of Pollution) Act, 1974 (“Water Act”)
The Water Act prohibits the use of any stream or well for the disposal of polluting matter, in violation of the standards
set down by the State Pollution Control Board (“State PCB”). The Water Act also provides that the consent of the
State PCB must be obtained prior to opening of any new outlets or discharges, which are likely to discharge sewage
or effluent. The Water Act prescribes specific amounts of fine and terms of imprisonment for various contraventions.
Air (Prevention and Control of Pollution) Act, 1981 (“Air Act”)
The Air Act requires that any individual, industry or institution responsible for emitting smoke or gases by way of use
of fuel or chemical reactions must apply in a prescribed form and obtain consent from the State PCB prior to
commencing any activity. The consent may contain conditions relating to specifications of pollution control equipment
to be installed. Within a period of four months after the receipt of the application for consent the State PCB shall, by
order in writing and for reasons to be recorded in the order, grant the consent applied for subject to such conditions
and for such period as may be specified in the order, or refuse consent. The Air Act prescribes penalties for
contravention in terms of fine, imprisonment or both.
Hazardous and Other Wastes (Management and Transboundary Movement) Rules, 2016
Hazardous and Other Wastes (Management and Transboundary Movement) Rules, 2016, requires that every occupier
of a facility who is engaged in handling of ‘hazardous waste’ and other wastes is required to obtain an authorization
from State PCB. It places an obligation on the occupier to prevent, minimize, reuse, recycle, recover, utilize including
co-processing, and safe disposal of the waste. It also makes the occupier responsible for safe and environmentally
sound management of hazardous and other wastes. It makes the occupier liable for damages caused to environment or
third parties. It also prescribes financial penalties for violation of provisions of the rules.
151
Plastic Waste Management Rules, 2016
Under the Plastic Waste Management Rules, 2016, all institutional generators of plastic waste, are required to inter
alia, segregate and store the waste generated by them in accordance with the Solid Waste Management Rules, 2016,
and handover segregated wastes to authorized waste processing or disposal facilities or deposition centers, either on
its own or through the authorized waste collection agency.
E-waste (Management) Rules, 2016 (“E-Waste Rules”)
The E-Waste Rules, apply to every manufacturer, producer, consumer, bulk consumer, collection centres, dealers, e-
retailer, refurbisher, dismantler and recycler involved in manufacture, sale, transfer, purchase, collection, storage and
processing of e-waste or electrical and electronic equipment listed in Schedule I appended to the E-Waste Rules. It
also includes the components, consumables, parts, and spares which make the product operational.
The manufacturers, dealers, e-retailers, and refurbishers have been brought under the ambit of the E-Waste Rules to
ensure that e-waste is effectively channelized and disposed of. The manufacturer has to undertake authorization from
the concerned state pollution control board, collect the e-waste which is generated during the manufacturing process
and channelize it for recycling or disposal, ensure that no damage is caused to the environment during storage and
transportation of e-waste, maintain records of e-waste generated, and file annual returns to the concerned E-Waste
Rules. The E-Waste Rules, have also prescribed the responsibilities of the dealer, refurbisher, and the state government
to ensure that the e-waste is effectively channelized and disposed of.
Environment Impact Assessment Notification of 2006
The Ministry of Environment, Forests and Climate Change has notified the Environment Impact Assessment
Notification of 2006 in September 2006. The notification makes it mandatory for various projects to get environment
clearance.
IV. Labour legislations
In addition to the Factories Act, the employment of workers, depending on the nature of activity, is regulated by a
wide variety of generally applicable labour laws. The following is an indicative list of labour laws which may be
applicable to our Company due to the nature of the business activities:
1. Contract Labour (Regulation and Abolition) Act, 1970
2. Employees’ Provident Funds and Miscellaneous Provisions Act, 1952
3. Employees’ State Insurance Act, 1948
4. Minimum Wages Act, 1948
5. Payment of Bonus Act, 1965
6. Payment of Gratuity Act, 1972
7. Payment of Wages Act, 1936
8. Maternity Benefit Act, 1961
9. Industrial Disputes Act, 1947
10. Sexual Harassment of Women at Workplace (Prevention, Prohibition and Redressal) Act, 2013
11. The Industries (Development and Regulation) Act, 1951
12. Employees’ Compensation Act, 1923
13. The Industrial Employment Standing Orders Act, 1946
14. The Child Labour (Prohibition and Regulation) Act, 1986
15. The Equal Remuneration Act, 1976
16. Apprentices Act, 1961 read with Apprenticeship Rules, 1992
152
The Occupational Safety, Health and Working Conditions Code, 2020 (enacted by the Parliament of India and assented
to by the President of India) will come into force on such date as may be notified in the official gazette by the Central
Government and different dates may be appointed for different provisions of the Occupational Safety, Health and
Working Conditions Code, 2020. Once effective, it will subsume, inter alia, the Factories Act and the Contract Labour
(Regulation and Abolition) Act, 1970.
The Government of India enacted ‘The Code on Social Security, 2020’ which received the assent of the President of
India, with certain of the provisions thereunder notified already. The code proposes to subsume, inter alia, the
Employees’ Compensation Act, 1923, the Employees’ State Insurance Act, 1948, the Employees’ Provident Funds
and Miscellaneous Provisions Act, 1952, the Maternity Benefit Act, 1961 and the Payment of Gratuity Act, 1972.
The Government of India enacted ‘The Code on Wages, 2019’ which received the assent of the President of India. The
code proposes to subsume the Equal Remuneration Act, 1976, the Minimum Wages Act, 1948, the Payment of Bonus
Act, 1965 and the Payment of Wages Act, 1936. In pursuance of the code, the Code on Wages (Central Advisory
Board) Rules, 2021 have been notified, which prescribe, inter alia, the constitution and functions of the Central
Advisory Board set up under the Code on Wages, 2019.
The Industrial Relations Code, 2020 (enacted by the Parliament of India and assented to by the President of India) will
come into force on such date as may be notified in the official gazette by the Central Government and different date
may be appointed for different provisions of the Industrial Relations Code, 2020. Once effective, it will subsume the
Trade Union Act, 1926, the Industrial Employment (Standing Orders) Act, 1946 and the Industrial Dispute Act, 1947.
V. Foreign Exchange Laws
Foreign Investment Regulations
Foreign investment in India is governed by the provisions of Foreign Exchange Management Act, 1999, as amended,
along with the rules, regulations and notifications made by the Reserve Bank of India thereunder, and the consolidated
FDI Policy, effective from October 15, 2020, issued by the DPIIT, and any modifications thereto or substitutions
thereof, issued from time to time (the “Consolidated FDI Policy”). Under the current Consolidated FDI Policy,
foreign direct investment in companies engaged in the manufacturing sector is permitted up to 100% of the paid-up
share capital of such company under the automatic route, subject to compliance with certain prescribed pricing
guidelines and reporting requirements.
Foreign Trade Regulations
Imports and exports are governed by the Foreign Trade (Development and Regulation) Act, 1992, as amended (the
“FTDR”) and the Export and Import Policy (the “EXIM Policy”) formulated by the Central Government from time
to time. FTDR provides for an Importer Exporter Code (“IEC”) to be granted to those persons licensed
to carry out imports and exports, which may be suspended or cancelled in case of violation of the provisions of FTDR
or the EXIM Policy.
Export Promotion Capital Goods Scheme, 2020
The Export Promotion Capital Goods Scheme (the “EPCG Scheme”) provides that importers can benefit from reduced
duties on the import of capital goods provided that they fulfil an export obligation to export a prescribed amount of
their goods manufactured or services rendered (such amount being a multiple of the duty saved) within a specified
period. Export obligations can be fulfilled by either through direct exports or through third parties. An EPCG
authorization holder shall be liable to pay custom duties along with interest custom in the event of nonfulfillment of
prescribed export obligations.
VI. Laws Relating to Taxation
In addition to the aforementioned material legislations which are applicable to our Company, some of the tax
legislations that may be applicable to the operations of our Company include:
1. Income Tax Act 1961, the Income Tax Rules, 1962, as amended by the Finance Act in respective years;
2. Central Goods and Service Tax Act, 2017, the Central Goods and Service Tax Rules, 2017 and various
state-wise legislations made thereunder;
3. The Integrated Goods and Service Tax Act, 2017 and rules thereof;
4. Customs and Central Excise Duties Drawback Rules, 2017;

153
5. Professional tax-related state-wise legislations;
6. Customs Act, 1962;
7. Customs Tariff Act, 1975;
8. Foreign Trade Policy 2015-20 as extended until March 31, 2021 vide Notification No 57/2015-20 dated
March 31, 2020; and
9. Indian Stamp Act, 1899 and various state-wise legislations made thereunder.
Certain of our key approvals, licenses, consents, registrations and permits may have expired or may expire in the ordinary
course of business, from time to time and our Company and Subsidiary have either already made an application to the
appropriate authorities for renewal of such key approvals, licenses, consents, registrations and permits or are in the process of
making such renewal applications. For details, see “Government and Other Approvals” on page 305.

154
HISTORY AND CERTAIN CORPORATE MATTERS
Brief history of our Company
Our Company was originally incorporated as a partnership firm in the name of “SJS Enterprises” pursuant to a deed of
partnership dated June 10, 1987. Subsequently, pursuant to a deed of co-partnery dated March 25, 2005 and a certificate of
incorporation dated June 21, 2005 issued by the RoC, SJS Enterprises was registered as a private limited company under the
Companies Act, 1956 under Part IX of the Companies Act, 1956 in the name of “S.J.S. Enterprises Private Limited”.
Subsequently, our Company was converted into a public limited company, as approved by our Shareholders pursuant to a
resolution dated April 28, 2021 and a fresh certificate of incorporation dated June 4, 2021 was issued by the RoC, consequent
upon conversion, recording the change in the name of our Company to “S.J.S. Enterprises Limited”.
Changes in the Registered Office
Except as disclosed below, there has been no change in registered office of our Company since the date of incorporation.
Date of change of
Registered and
Corporate Office
Details of change in the Registered and Corporate Office Reasons for change in the Registered and
Corporate Office
March 13, 2019 From No. 1, Thalagattapura, Kanakapura Main Road, Bangalore 560
062, Karnataka, India to Sy. No. 28/P16 of Agra Village and Sy. No.
85/P6 of B.M. Kaval Village, Kengeri Hobli, Bangalore 560 062,
Karnataka, India.
Shift of our Registered and Corporate Office
to move it closer to our manufacturing facility
situated at Kengeri Hobli, Bengaluru and for
operational convenience
February 16, 2021 From Sy. No. 28/P16 of Agra Village and Sy. No. 85/P6 of B.M.
Kaval Village, Kengeri Hobli, Bangalore 560 062, Karnataka, India
to Sy. No. 28/P16 of Agra Village and Sy. No. 85/P6 of B.M. Kaval
Village, Kengeri Hobli, Bangalore 560 082, Karnataka, India.
Rectification of the pin code of our Registered
and Corporate Office
Main objects of our Company
The main objects contained in our MoA are as follows:
1. “To carry on the business of manufacturers, providing of services or consultancy in relation to, dealers in, exporters
and importers of all kinds of aesthetic, functional and/or decorative components, and human machine interface parts,
for use in, or on, vehicles, appliances, machinery and equipment, products, furniture, home decoration items including,
but not limited to, logos, decals, stickers, aluminium badges, in-mould labelling, in-mould decoration, optical plastics,
chrome plated parts, appliques and overlays and to carry on the business of manufacturers, dealers in, exporters and
importers of all kinds of machinery, products, components, tools, dies, fittings and raw materials required for all kinds
of aesthetic, functional and/or decorative components, and human machine interface parts, for use in, or on, vehicles,
appliances, machinery and equipment, products, furniture, home decoration items.
2. To carry on the business of printers in all its branches and kinds and to undertake printing orders specific to clients
and for that purpose to establish printing press and deal with all kinds of printing material, equipment, machinery,
special inks and the like.
3. To carry on the business of manufacturers of, dealers in, exporters, importers, distributors and stockiest of all kinds
of inks, paints, waxes, resins synthetic resins, adhesive wax, glues, gums and compounds of all kinds and other
formulations having adhesive properties and having commercial, domestic, industrial, packing and other
applications.”
The main objects as contained in our MoA enable our Company to carry on the business presently being carried out and
proposed to be carried out by it.
Amendments to the MoA
Set out below are the amendments to our MoA in the last 10 years:
Date of
Shareholders’
resolution/
Effective date
Particulars
February 27, 2017 Clause V of the MoA was amended to reflect the increase in the authorized share capital of our Company from
₹30,000,000 divided into 3,000,000 equity shares of ₹10 each to ₹300,000,000 divided into 30,000,000 equity shares
of ₹10 each.
October 25, 2017 Clause V of the MoA was amended to reflect the increase in the authorized share capital of our Company from
₹300,000,000 divided into 30,000,000 equity shares of ₹10 each to ₹310,000,000 divided into 31,000,000 equity shares
of ₹10 each.
155
Date of
Shareholders’
resolution/
Effective date
Particulars
March 11, 2021 Clause V of the MoA was amended to reflect the increase in the authorized share capital of our Company from
₹310,000,000 divided into 31,000,000 equity shares of ₹10 each to ₹350,000,000 divided into 35,000,000 equity shares
of ₹10 each.
April 28, 2021 Clause I of the MoA was amended to reflect the change in name of our Company from “S.J.S. Enterprises Private
Limited” to “S.J.S. Enterprises Limited” pursuant to conversion of our Company into a public limited company
July 1, 2021 Clause I of the MoA was amended to align the main objects clauses of the MoA of our Company with the main business
and activities of our Company and the MoA was amended to align it with Table A of the Schedule I of the Companies
Act
Major events and milestones of our Company
Calendar Year Event
2021 • Acquisition of Exotech
• Entry into chrome plating
2020 Entry into new product line - formed appliques segment
2018 • New manufacturing facility commissioned with 235,000 sq. ft. area
• Entry into new product lines – IMD/ IML parts
2016 Entry into new product lines – aluminium badges
2015 Acquisition of majority stake by Evergraph
2010 Entry into new product lines in segments such as 3D lux badges
2006 Joint Venture with Serigraph, a US based commercial printing player
1987 Incorporated as a partnership firm in the name of “SJS Enterprises”
Awards, certifications, accreditations and recognitions received by our Company and our Subidiary
Calendar Year Awards
2020 • Received a certificate for “Great Workplace” in category of “Small and Mid-Sized Organizations” from Great
Place to Work Institute, India.
2019 • Received “Performance Award – Spare Delivery” from Suzuki Motorcyle India Private Limited.
• Received a certificate for “Great Workplace” in category of “Small and Mid-Sized Organizations” from Great
Place to Work Institute, India.
• Received certificate for standard “IATF 16949:2016” for “Manufacture of Overlays, Logos, Name Plates, Dial
Appliques, Self Adhesive Labels, In Mold Decoration and Injection Moulding Components” from TUV
Rheinland Cert GmbH, Germany.
• Received certificate for standard “ISO 9001:2015” for “Manufacture of Overlays, Logos, Name Plates, Dial
Appliques, Self Adhesive Labels, In Mold Decoration and Injection Moulding Components” from TUV
Rheinland Cert GmbH, Germany.
• Received certificate for standard “ISO 14001:2015” for “Manufacture of Overlays, Logos, Name Plates, Dial
Appliques, Self Adhesive Labels, In Mold Decoration and Injection Moulding Components” from TUV
Rheinland Cert GmbH, Germany.
• Received certificate for standard “ISO 45001:2018” for “Manufacture of Overlays, Logos, Name Plates, Dial
Appliques, Self Adhesive Labels, In Mold Decoration and Injection Moulding Components” from TUV
Rheinland Cert GmbH, Germany.
• Received a “Gold” certificate for “Building Design and Construction: New Construction and Major
Renovations” from Green Business Certification Inc.
156
Calendar Year Awards
• Received the “Gold Award” from QCFI, Bengaluru chapter on Quality Concept.
• Awarded second position at the Second Zonal Kaizen Contest by ACMA (Southern Region).
2018 • Received recognition for “Supply Chain Partnership” from Royal Enfield.
• Received the “Excellence Award” at the National Convention on Quality Concepts, Gwalior from QCFI.
• Received the “Gold Award” at the Chapter Convention on Quality Concept, Mysore.
• Awarded second position at the First Zonal Competition on Poka-Yoke by ACMA (Southern Region).
• Awarded third position at the First Zonal Kaizen Contest by ACMA (Southern Region).
• Awarded for “High Standard of Excellence” by John Deere.
2017 • Received “Excellence Award for Cost” from Yamaha Motor India Group.
• Received “Whirlpool Supplier Award – Quality Excellence” from Whirlpool Corporation.
• Received “Certificate of Appreciation in recognition of Grade ‘A’ in Supplier Evaluation 2016”.
• Received “Recognition Award” for valuable support and contribution from Honda.
• Received “Certificate of Appreciation in recognition of Grade A in Supplier Evaluation 2016” from Samsung.
2016 • Received “Supplier Excellence Award” from Whirlpool Corporation.
• Received “Certificate of Appreciation for highest production of One Lakh Washers in September 2016” from
Whirlpool Corporation.
• Received recognition for “Long-Standing Association” from Royal Enfield.
• Received the status of “One Star Export House” from Ministry of Commerce and Industry, Director General
of Foreign Trade.
• Received the “Gold Award” from QCFI, Bengaluru chapter on Quality Concept.
• Received the “Gold Award” from QCFI at the Regional Convention on Quality Concept, Mysore.
• Received a “Certificate of Appreciation” from Mindarika Private Limited.
2015 • Received “Excellence Award for Development” from Yamaha Motor India Group.
• Received “Award of Appreciation for Achieving 100% Delivery Rating” at Annual Supplier Conference 2015,
from Uno Minda Group.
• Received “Vendor Performance Award – Cost Reduction Wave” from Suzuki Motorcycle India Private
Limited.
2014 • Received the “Gold Award” from QCFI, Bengaluru chapter at RCQC 2014
2013 • Received “Best Supplier – Quality” from Toshiba Machine.
• Received “Certificate of Appreciation for Significant Contribution and Support Towards Localisation of
Components” from Salcomp India.
• Received recognition for “Supply Chain Partnership” from Royal Enfield.
• Received the “Gold Award” from QCFI, Bengaluru chapter on Quality Concept.
2012 • Received “Certificate of Appreciation for Significant Contribution and Support Towards Localisation of
Components” from Salcomp India.
• Received “Recognition Award” for valuable support and contribution from Honda.
157
Time and cost over-runs
There have been no significant time and cost over-runs in the development, implementation of any of our plants or facilities,
except in the ordinary course of business.
Defaults or re-scheduling/restructuring of borrowings
There have been no defaults or re-scheduling/ re-structuring in relation to borrowings availed by our Company from any
financial institutions or banks.
Accumulated Profits or Losses
There are no accumulated profits and losses of our Subsidiary that are not accounted for by our Company in the Restated
Consolidated Financial Information.
Significant financial and strategic partners
As at the date of this Red Herring Prospectus, our Company does not have any significant financial or strategic partners.
Details of guarantees given to third parties by our Promoter Selling Shareholders
Our Promoter Selling Shareholders have not given any guarantees to third parties on behalf of our Company.
Launch of key products or services, entry into new geographies or exit from existing markets
For details of key products or services launched by our Company, entry into new geographies or exit from existing markets,
see “Our Business” on page 120.
Details regarding material acquisitions or divestments of business/ undertakings, mergers, amalgamations or any
revaluation of assets, in the last 10 years
Except as disclosed below, our Company has not acquired any material business/ undertakings, and has not undertaken any
mergers, amalgamations or any revaluation of assets, in the last 10 years.
Acquisition of Exotech pursuant to the Exotech SPA
The Exotech SPA was entered into among our Company, Exotech, Rajiv Kothari, Umesh Kothari and Exotech Exports and
Investments Private Limited. On April 5, 2021, our Company acquired 100% equity shareholding of Exotech upon payment of
consideration of ₹640.00 million, which was sourced primarily from sale of our Company’s investments in mutual funds,
pursuant to which Exotech became our Subsidiary. Our Company made this investment by acquiring from the existing
shareholders of Exotech, 2,799,972 equity shares of ₹10 each held in its own name and 28 shares of ₹10 each held in the name
of its nominee.
The representations and warranties provided by the sellers under the Exotech SPA in relation to Exotech pertain to, inter-alia,
certain fundamental warranties, taxation matters, and certain other matters. The sellers have also provided fundamental
representations and warranties in relation to, inter-alia, the power and authority of the sellers to execute the agreement, due
authorization and execution of the agreement, delivery and performance of the agreement not conflicting with charter
documents, applicable law, contracts and consents by which the sellers are bound and title to shares. Certain representations
are qualified by the knowledge of the sellers or disclosures provided by the sellers.
Pursuant to the Exotech SPA, Rajiv Kothari has continued to be employed as the chief executive officer of Exotech in
accordance with the terms of an employment agreement executed with Exotech.
The sellers have agreed to be jointly and severally liable for all indemnity claims which are received (i) in perpetuity for claims
in relation to breach of fundamental warranties; (ii) within a period of seven years from the closing date for claims in relation
to breach of tax warranties; and (iii) within a period of three years from the closing date for claims in relation to breach of all
other warranties. Except in case of fraud, wilful misconduct, gross negligence, wilful breach of the Exotech SPA by the sellers
and the breach of any fundamental warranties, the aggregate liability of the sellers towards our Company and Exotech (the
“Exotech Indemnified Parties”) is limited to 50% of the purchase price paid by our Company.
Other than in relation to certain specific indemnity matters, no indemnity claim can be made against the sellers unless the
cumulative aggregate amount of the claim exceeds ₹25.00 million. If a claim exceeds this threshold, the sellers will indemnify
the Indemnified Parties for the entire amount of the loss, and not just the loss in excess of the claim threshold. For calculation
of the claim threshold, any individual claim which is less than ₹0.50 million is to be excluded and the sellers will not be liable
for such loss.

158
Our Company has also agreed to indemnify the sellers for any breach of the Exotech SPA by our Company. Further, under the
Exotech SPA, our Company and the sellers have agreed to non-compete and non-solicit obligations (which includes, not
directly, indirectly or beneficially, invest in or retain interest in any person who competes or is in a similar line of business as
Exotech; hiring any employee of Exotech; disclosing details of employees, customers vendors, contractors or agent of the
Company to any third party; or distributing or selling material deceptively similar to the Company), after the termination of the
agreement for a period of three years from the date of acquisition of our Subsidiary i.e., April 5, 2021.
Holding Company
As at the date of this Red Herring Prospectus, our Promoter, Evergraph is the holding company of our Company. For details,
see “Our Promoters and Promoter Group” on page 177.
Our Subsidiary
As at the date of this Red Herring Prospectus, our Company has one Subsidiary. Exotech has been categorised as a Material
Subsidiary of our Company.
Exotech Plastics Private Limited (“Exotech”)
Corporate Information
Exotech was incorporated on July 17, 1996 as a private limited company under the Companies Act, 1956. The CIN of Exotech
is U25206MH1996PTC101162 pursuant to a certificate of incorporation issued by the Registrar of Companies, Maharashtra,
Pune on December 18, 2009. The registered office of Exotech is located at Plot No. F-27 C, MIDC Ranjangaon Village
Karegaon, Taluka Shirur, Pune 412 220, Maharashtra, India.
Nature of Business
Exotech is engaged in the business of, inter alia, manufacturing, assembling, producing, painting, chrome plating and other
surface finishing processes for all types of components, spare parts, assemblies and accessories of plastic, and other materials
including injection moulded items etc. for use in automotive, farm equipment, sanitary ware industry.
Capital Structure
The authorised share capital of Exotech is ₹38,000,000 divided into 3,800,000 equity shares of face value of ₹10 each. The
issued, subscribed and paid up capital of Exotech is ₹28,000,000 divided into 2,800,000 equity shares of face value of ₹10 each.
Shareholding pattern
Our Company holds 2,799,972 equity shares of face value of ₹10 each (being 99.99% ownership in Exotech). Additionally,
Sanjay Thapar, our Chief Executive Officer and Executive Director, holds 28 equity shares of face value of ₹10 each (being
0.001% of total share capital of Exotech) as a nominee, on behalf of our Company.
Joint Venture
As at the date of this Red Herring Prospectus, our Company has no joint ventures.
Associate
As at the date of this Red Herring Prospectus, our Company has no Associate Companies.
Shareholders’ agreements and other agreements
Except as set out below, there are no other arrangements or agreements, deeds of assignment, acquisition agreements,
shareholders’ agreements, inter-se agreements, any agreements between the Company, the Promoters and the Shareholders,
agreements of like nature and clauses/ covenants which are material to the Company. Further, there are no other clauses/
covenants which are adverse or prejudicial to the interest of the minority/ public shareholders of the Company.
Key terms of subsisting shareholders’ agreements
Shareholders’ agreement dated July 2, 2015 executed between our Company, Evergraph and K.A. Joseph, as amended on
September 21, 2015 and September 14, 2020 (“S.J.S. Shareholders’ Agreement”)
Our Company has executed the S.J.S. Shareholders’ Agreement, which sets out, inter alia, the inter se rights and obligations
between our Promoters and provisions for the issue, transfer and disposal of the Equity Shares and management of our
Company. Pursuant to the S.J.S. Shareholders’ Agreement, our Shareholders have a pro rata pre-emptive right to subscribe to
any further issue of securities by our Company. Further, so long as K.A. Joseph holds at least 10% of share capital of our
159
Company, and his employment has not been terminated for cause, he has the rights to veto certain reserved matters. Each
Promoter is also required to provide a right of first offer to the other Promoter in case it intends to transfer its shareholding in
our Company. The S.J.S Shareholders’ Agreement also includes, inter alia, board nomination rights, non-compete and non-
solicit conditions applicable to K.A. Joseph and confidentiality and indemnity provisions.
The S.J.S Shareholders’ Agreement was amended pursuant to the execution of the waiver and termination agreement dated July
1, 2021, executed between our Company, Evergraph and K.A. Joseph (“Waiver and Termination Agreement”). Pursuant to
the said agreement, the parties have agreed that the S.J.S Shareholders’ Agreement shall automatically stand terminated, without
any further action of the parties, from the date on which the Equity Shares are listed on a recognised stock exchange, pursuant
to the Offer. However, (i) the right of K.A. Joseph to appoint two directors on the Board, so long as he holds at least 10% of
the fully diluted share capital of our Company, and (ii) the right of Evergraph to appoint two directors on the Board, so long as
it holds at least 10% of the fully diluted share capital of our Company, shall survive such termination, provided that approval
of the shareholders of our Company, by way of a special resolution, is obtained post completion of this Offer, at the first
shareholders’ meeting held by our Company post completion of the Offer.
Letter agreement dated July 2, 2015 to record the mutual understanding between V. Srinivasan, S. Sivakumar, Daisy Joseph,
K.A. Joseph, our Company and Evergraph (“Letter Agreement”), as amended by the waiver and termination letter dated
July 6, 2021 entered into between Daisy Joseph, K.A. Joseph, Evergraph and our Company (“Waiver and Termination
Letter”)
The Letter Agreements sets out tag along and drag along rights held by the parties to the Letter Agreement. Pursuant to the
Waiver and Termination Letter, Daisy Joseph, K.A., Joseph, Evergraph and our Company have agreed (i) to waive the tag along
and drag along rights, and (ii) that the Letter Agreement shall automatically stand terminated on the date on which the Equity
Shares are listed on a recognized stock exchange, pursuant to the Offer. Further, since V. Srinivasan and S. Sivakumar are not
holding any Equity Shares, they are not bound by the terms of the Letter Agreement and were not required to execute the Waiver
and Termination Letter.
Key terms of other subsisting material agreements
As on the date of this Red Herring Prospectus, our Company has not entered into any material agreements other than in the
ordinary course of business. For details on business agreements of our Company, see “Our Business” on page 120.
Agreements with Key Managerial Personnel, Directors, Promoters or any other employee
As on the date of this Red Herring Prospectus, there are no agreements entered into by a Key Managerial Personnel or Director
or any other employee of our Company, either by themselves or on behalf of any other person, with any shareholder or any
other third party with regard to compensation or profit sharing in connection with dealings in the securities of our Company.

160
OUR MANAGEMENT
In terms of the Articles of Association, our Company is required to have not less than three Directors and not more than 15
Directors on the Board. As on the date of this Red Herring Prospectus, our Board comprises of eight Directors including three
executive directors, two non-executive Nominee Directors and three non-executive Independent Directors. Our Board includes
one woman director.
The following table sets forth details regarding our Board of Directors as at the date of this Red Herring Prospectus:
S.
No.
Name, designation, address, occupation, date of birth,
period and term of directorship and DIN
Age
(years)
Other directorships
1. Ramesh Chandra Jain
Designation: Chairman and Independent Director
Address: No. 5305, DLF City, DLF Phase – 4, Galleria DLF
– IV, Farrukhnagar, Gurgaon 122 009, Haryana, India
Occupation: Professional
Date of birth: December 22, 1946
Period and term: For a period of five years with effect from
July 6, 2021 to July 5, 2026
DIN: 00038529
74 • Exotech Plastics Private Limited;
• Frick India Limited;
• Indoi Systems Private Limited;
• Kamdhenu Limited;
• Modern Automotives Limited;
• The Hi-Tech Gears Limited; and
• The Hi-Tech Robotic Systemz Limited
2. K.A. Joseph
Designation: Managing Director
Address: No. 514, 1st Cross, 12th Main, 4th Block,
Koramangala, Bangalore 560 034, Karnataka, India
Occupation: Business
Date of birth: May 18, 1962
Period and term: For a period of five years with effect from
April 1, 2020 to March 31, 2025
DIN: 00784084
59 Exotech
3. Sanjay Thapar
Designation: Executive Director and Chief Executive Officer
Address: A16, Padma Vilas Enclave, 18 Prince of Wales
Drive, Wanwadi, Pune 411 040, Maharashtra, India
Occupation: Professional
Date of birth: January 8, 1959
Period and term: With effect from September 24, 2015 and
eligible to retire by rotation
DIN: 01029851
62 • Exotech; and
• SCPL
4. Kevin K. Joseph
Designation: Executive Director
Address: #514, 1st Cross, 12th Main, 4th Block, Koramangala,
Agara, Bangalore 560 034, Karnataka, India
Occupation: Business
Date of birth: March 9, 1992
Period and term: With effect from July 22, 2021 and eligible
to retire by rotation
29 Nil
161
S.
No.
Name, designation, address, occupation, date of birth,
period and term of directorship and DIN
Age
(years)
Other directorships
DIN: 09206689
5. Kazi Arif Uz Zaman
Designation: Nominee Director*
Address: No. 34/4, 1st Main 5th Cross, Near Kothanur Bus
stop, Anjanappa Layout, North Dr. Shivarama Karanth Nagar,
Bangalore 560 077, Karnataka, India
Occupation: Professional
Date of birth: July 11, 1971
Period and term: With effect from September 24, 2015 and
eligible to retire by rotation
DIN: 00237331
50 • Ascentios Advisors Private Limited
6. Vishal Sharma
Designation: Nominee Director*
Address: A-148, Ground Floor, M2K Aura, Near Mayfield
Gardens, Sector 47, Gurgaon 122 018, Haryana, India
Occupation: Professional
Date of birth: March 30, 1978
Period and term: With effect from April 28, 2016 and eligible
to retire by rotation
DIN: 01599024
42 • Calibre Chemicals Private Limited;
• Everhome India Private Limited;
• Exotech;
• Integris Health Private Limited;
• Interarch Building Products Private Limited; and
• Transhealth Private Limited
7. Veni Thapar
Designation: Non-Executive Independent Director
Address: C-2/37, Safdarjung Development Area, South Delhi,
Delhi 110 016, India
Occupation: Professional
Date of birth: January 11, 1971
Period and term: For a period of five years with effect from
July 12, 2021 to July 11, 2026
DIN: 01811724
50 • RVR Corporate Consultancy Private Limited
8. Matthias Frenzel
Designation: Non-Executive Independent Director
Address: Lahälla 630, Kode 442 98, Sweden
Occupation: Professional
Date of birth: November 10, 1968
Period and term: For a period of five years with effect from
July 6, 2021 to July 5, 2026
DIN: 09168925
52 Nil
* Kazi Arif Uz Zaman and Vishal Sharma are nominee directors appointed on behalf of Evergraph Holdings on our Board
Relationship between our Directors
Except Kevin K. Joseph, who is the son of K.A. Joseph, none of our Directors are related to each other.
Brief Biographies of Directors
162
Ramesh Chandra Jain is the Chairman and an Independent Director, of our Company. He holds a bachelor’s (honors) degree
in technology in mechanical engineering from the Indian Institute of Technology, Kharagpur and a master’s degree in science
(industrial engineering and administration) from the Cranfield Institute of Technology (now known as Cranfield University),
United Kingdom. He has received the Society of British Aerospace Companies Prize in Aircraft Production, 1972-73 from the
Cranfield University, United Kingdom. He has previously worked for 25 years in Eicher from where he retired as the group
vice chairman. He has also worked in Hindustan Aeronautics Limited prior to Eicher.
He was the president of the Tractors Manufacturer Association, the chairman of the Confederation of Indian Industries, Haryana
State Council and a director on various boards including, inter alia, Eicher Limited, Modern Steel Limited, Graziano
Trasmissioni India Private Limited and Minda Sai Limited.
He has also previously been engaged by the Cabinet Secretariat to guide some of the Ministries of the Government of India in
preparing their departmental strategies.
K.A. Joseph is the Managing Director of our Company. He holds a bachelor’s degree in science from the Bangalore University
and a post graduate diploma in business administration from the St. Joseph’s College of Business Administration, Bangalore.
He is one of the Promoters and co-founders of our Company. He has more than 34 years of experience in the aesthetics printing
business. He leads the plant and manufacturing operations for our Company and has spearheaded our Company’s technological
and product innovation over the years. He has also helped design the new manufacturing facility into which our Company
shifted its operations in 2018. He is also a director on the board of Exotech.
Sanjay Thapar is an Executive Director and Chief Executive Officer of our Company. He holds a first class (with distinction)
bachelor’s degree in science (mechanical engineering) from the Delhi College of Engineering, University of Delhi. He has over
30 years of experience in the automotive industry. He started his career with Tata Engineering and Locomotive Company
Limited (now known as Tata Motors Limited). He was previously the president of Minda HUF Limited, the managing director
of Minda Valeo Security Systems and the group chief strategy officer with the Ashok Minda Group. He leads the strategy,
business development and finance functions for our Company and has played an instrumental role in formulating our sales
strategy, building our customer base, deepening our customer relationships and developing new product offerings. He has led,
and has shaped, our Company’s product strategy and international business expansion in recent years.
Kevin K. Joseph is an Executive Director of our Company. He holds a bachelor’s degree in mechanical engineering from the
Visvesvaraya Technological University, Belgaum. He has previously worked with Tata Elxsi Limited as a senior design
engineer and works at our Company as the Executive - Manufacturing.
Kazi Arif Uz Zaman is a Nominee Director of our Company. He holds a bachelor’s degree of technology with honours in
electrical engineering from the Indian Institute of Technology, Kharagpur and a post graduate diploma in management from
the Indian Institute of Management, Ahmedabad. He is a chartered financial analyst (CFA) charter holder from the Association
for Investment Management and Research (now known as CFA Institute, USA). He has over 25 years of experience and has
previously worked with ANZ Grindlays Bank Limited/ Standard Chartered Grindlays Bank/ ANZ Capital Private Limited,
ICICI Venture Funds Management Company Limited and Everstone Capital Advisors Private Limited where his last
designation was managing director – private equity. He is presently a partner of GestAlt Network LLP.
Vishal Sharma is a Nominee Director of our Company. He holds a bachelor’s degree in textile technology from the Indian
Institute of Technology, Delhi and a post graduate programme in management from the Indian School of Business, Hyderabad.
He is currently the managing director – investments and operations with Everstone Capital Advisors Private Limited. He has
previously worked with Sapient Corporation (now known as Publicis Sapient) (a division of TLG India Private Limited) and
Boston Consulting Group (India) Private Limited.
Veni Thapar is a Non-Executive Independent Director of our Company. She holds a bachelor’s degree in commerce (honours)
from the University of Delhi. She is a fellow member of the Institute of Chartered Accountants of India, has passed the final
exam held by the Institute of Cost Accountants of India to qualify as a cost accountant and is a certified information systems
auditor from the Information Systems and Audit Control Association. Further, she has completed the post qualification course
in information systems audit from the Institute of Chartered Accountants of India. She is presently a partner of V K Thapar &
Company, Chartered Accountants and is on the Board of Governors of the Indian Institute of Corporate Affairs for her second
term. She has been on the board of Bank of India as a part-time, non-official director under the chartered accountant category.
Matthias Frenzel is a Non-Executive Independent Director of our Company. He holds a diploma engineering (FH) in
mechanical engineering – material technology from the Technical College, Berlin and a master’s degree in business
administration from the Düsseldorf Business School GmbH. He has previously worked as the director (mechanics,
electromechanics procurement supplier quality) with Visteon Electronics Germany GmbH, S-Y Systems Technologies Europe
GmbH and Johnson Controls GmbH.
Confirmations
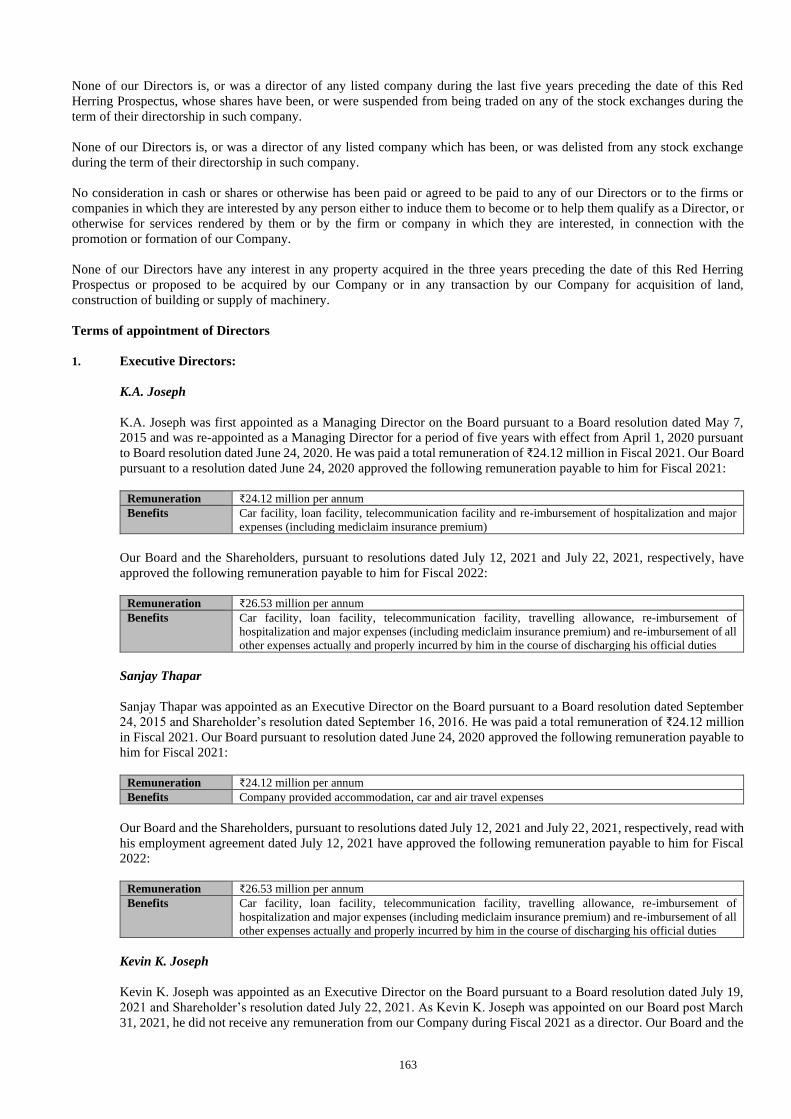
163
None of our Directors is, or was a director of any listed company during the last five years preceding the date of this Red
Herring Prospectus, whose shares have been, or were suspended from being traded on any of the stock exchanges during the
term of their directorship in such company.
None of our Directors is, or was a director of any listed company which has been, or was delisted from any stock exchange
during the term of their directorship in such company.
No consideration in cash or shares or otherwise has been paid or agreed to be paid to any of our Directors or to the firms or
companies in which they are interested by any person either to induce them to become or to help them qualify as a Director, or
otherwise for services rendered by them or by the firm or company in which they are interested, in connection with the
promotion or formation of our Company.
None of our Directors have any interest in any property acquired in the three years preceding the date of this Red Herring
Prospectus or proposed to be acquired by our Company or in any transaction by our Company for acquisition of land,
construction of building or supply of machinery.
Terms of appointment of Directors
1. Executive Directors:
K.A. Joseph
K.A. Joseph was first appointed as a Managing Director on the Board pursuant to a Board resolution dated May 7,
2015 and was re-appointed as a Managing Director for a period of five years with effect from April 1, 2020 pursuant
to Board resolution dated June 24, 2020. He was paid a total remuneration of ₹24.12 million in Fiscal 2021. Our Board
pursuant to a resolution dated June 24, 2020 approved the following remuneration payable to him for Fiscal 2021:
Remuneration ₹24.12 million per annum
Benefits Car facility, loan facility, telecommunication facility and re-imbursement of hospitalization and major
expenses (including mediclaim insurance premium)
Our Board and the Shareholders, pursuant to resolutions dated July 12, 2021 and July 22, 2021, respectively, have
approved the following remuneration payable to him for Fiscal 2022:
Remuneration ₹26.53 million per annum
Benefits Car facility, loan facility, telecommunication facility, travelling allowance, re-imbursement of
hospitalization and major expenses (including mediclaim insurance premium) and re-imbursement of all
other expenses actually and properly incurred by him in the course of discharging his official duties
Sanjay Thapar
Sanjay Thapar was appointed as an Executive Director on the Board pursuant to a Board resolution dated September
24, 2015 and Shareholder’s resolution dated September 16, 2016. He was paid a total remuneration of ₹24.12 million
in Fiscal 2021. Our Board pursuant to resolution dated June 24, 2020 approved the following remuneration payable to
him for Fiscal 2021:
Remuneration ₹24.12 million per annum
Benefits Company provided accommodation, car and air travel expenses
Our Board and the Shareholders, pursuant to resolutions dated July 12, 2021 and July 22, 2021, respectively, read with
his employment agreement dated July 12, 2021 have approved the following remuneration payable to him for Fiscal
2022:
Remuneration ₹26.53 million per annum
Benefits Car facility, loan facility, telecommunication facility, travelling allowance, re-imbursement of
hospitalization and major expenses (including mediclaim insurance premium) and re-imbursement of all
other expenses actually and properly incurred by him in the course of discharging his official duties
Kevin K. Joseph
Kevin K. Joseph was appointed as an Executive Director on the Board pursuant to a Board resolution dated July 19,
2021 and Shareholder’s resolution dated July 22, 2021. As Kevin K. Joseph was appointed on our Board post March
31, 2021, he did not receive any remuneration from our Company during Fiscal 2021 as a director. Our Board and the
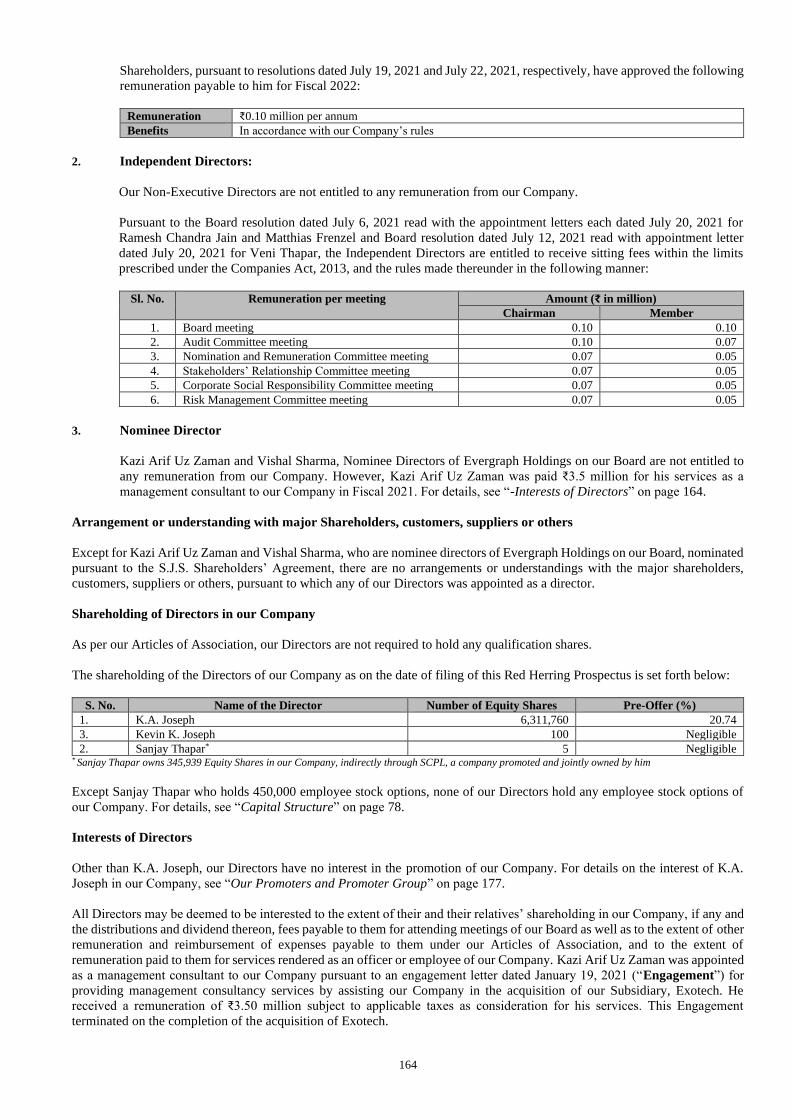
164
Shareholders, pursuant to resolutions dated July 19, 2021 and July 22, 2021, respectively, have approved the following
remuneration payable to him for Fiscal 2022:
Remuneration ₹0.10 million per annum
Benefits In accordance with our Company’s rules
2. Independent Directors:
Our Non-Executive Directors are not entitled to any remuneration from our Company.
Pursuant to the Board resolution dated July 6, 2021 read with the appointment letters each dated July 20, 2021 for
Ramesh Chandra Jain and Matthias Frenzel and Board resolution dated July 12, 2021 read with appointment letter
dated July 20, 2021 for Veni Thapar, the Independent Directors are entitled to receive sitting fees within the limits
prescribed under the Companies Act, 2013, and the rules made thereunder in the following manner:
Sl. No. Remuneration per meeting Amount (₹ in million)
Chairman Member
1. Board meeting 0.10 0.10
2. Audit Committee meeting 0.10 0.07
3. Nomination and Remuneration Committee meeting 0.07 0.05
4. Stakeholders’ Relationship Committee meeting 0.07 0.05
5. Corporate Social Responsibility Committee meeting 0.07 0.05
6. Risk Management Committee meeting 0.07 0.05
3. Nominee Director
Kazi Arif Uz Zaman and Vishal Sharma, Nominee Directors of Evergraph Holdings on our Board are not entitled to
any remuneration from our Company. However, Kazi Arif Uz Zaman was paid ₹3.5 million for his services as a
management consultant to our Company in Fiscal 2021. For details, see “-Interests of Directors” on page 164.
Arrangement or understanding with major Shareholders, customers, suppliers or others
Except for Kazi Arif Uz Zaman and Vishal Sharma, who are nominee directors of Evergraph Holdings on our Board, nominated
pursuant to the S.J.S. Shareholders’ Agreement, there are no arrangements or understandings with the major shareholders,
customers, suppliers or others, pursuant to which any of our Directors was appointed as a director.
Shareholding of Directors in our Company
As per our Articles of Association, our Directors are not required to hold any qualification shares.
The shareholding of the Directors of our Company as on the date of filing of this Red Herring Prospectus is set forth below:
S. No. Name of the Director Number of Equity Shares Pre-Offer (%)
1. K.A. Joseph 6,311,760 20.74
3. Kevin K. Joseph 100 Negligible
2. Sanjay Thapar* 5 Negligible * Sanjay Thapar owns 345,939 Equity Shares in our Company, indirectly through SCPL, a company promoted and jointly owned by him
Except Sanjay Thapar who holds 450,000 employee stock options, none of our Directors hold any employee stock options of
our Company. For details, see “Capital Structure” on page 78.
Interests of Directors
Other than K.A. Joseph, our Directors have no interest in the promotion of our Company. For details on the interest of K.A.
Joseph in our Company, see “Our Promoters and Promoter Group” on page 177.
All Directors may be deemed to be interested to the extent of their and their relatives’ shareholding in our Company, if any and
the distributions and dividend thereon, fees payable to them for attending meetings of our Board as well as to the extent of other
remuneration and reimbursement of expenses payable to them under our Articles of Association, and to the extent of
remuneration paid to them for services rendered as an officer or employee of our Company. Kazi Arif Uz Zaman was appointed
as a management consultant to our Company pursuant to an engagement letter dated January 19, 2021 (“Engagement”) for
providing management consultancy services by assisting our Company in the acquisition of our Subsidiary, Exotech. He
received a remuneration of ₹3.50 million subject to applicable taxes as consideration for his services. This Engagement
terminated on the completion of the acquisition of Exotech.
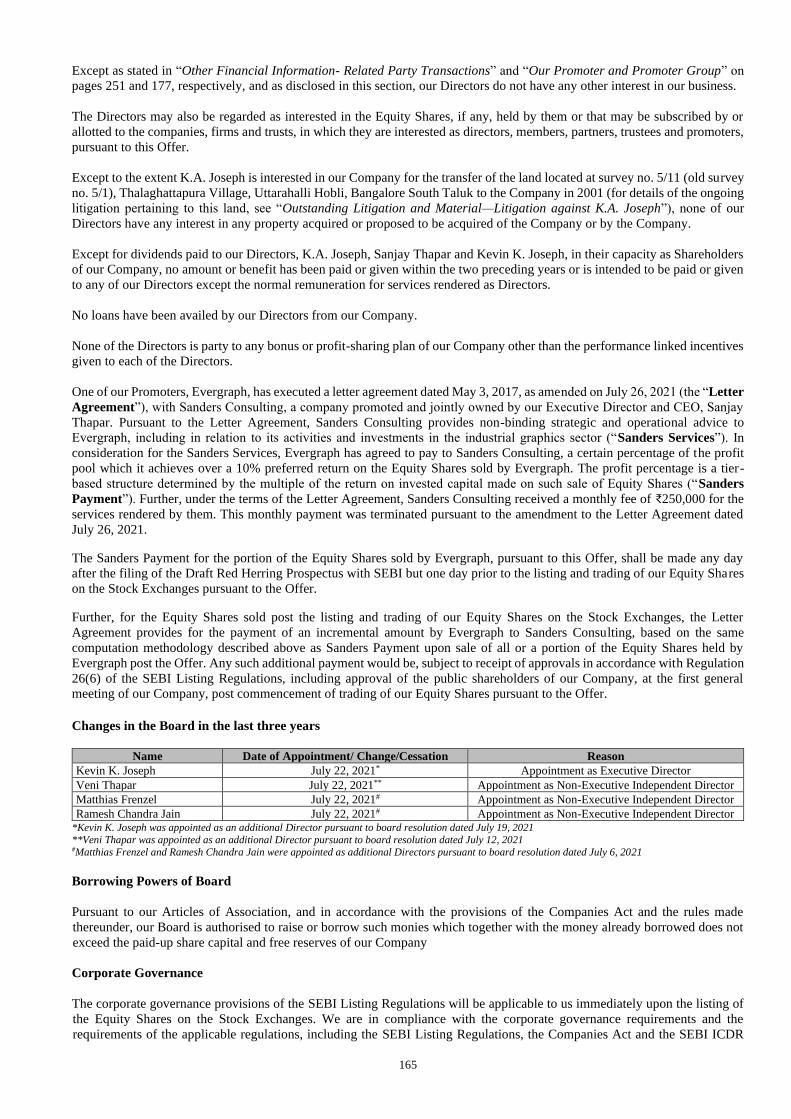
165
Except as stated in “Other Financial Information- Related Party Transactions” and “Our Promoter and Promoter Group” on
pages 251 and 177, respectively, and as disclosed in this section, our Directors do not have any other interest in our business.
The Directors may also be regarded as interested in the Equity Shares, if any, held by them or that may be subscribed by or
allotted to the companies, firms and trusts, in which they are interested as directors, members, partners, trustees and promoters,
pursuant to this Offer.
Except to the extent K.A. Joseph is interested in our Company for the transfer of the land located at survey no. 5/11 (old survey
no. 5/1), Thalaghattapura Village, Uttarahalli Hobli, Bangalore South Taluk to the Company in 2001 (for details of the ongoing
litigation pertaining to this land, see “Outstanding Litigation and Material—Litigation against K.A. Joseph”), none of our
Directors have any interest in any property acquired or proposed to be acquired of the Company or by the Company.
Except for dividends paid to our Directors, K.A. Joseph, Sanjay Thapar and Kevin K. Joseph, in their capacity as Shareholders
of our Company, no amount or benefit has been paid or given within the two preceding years or is intended to be paid or given
to any of our Directors except the normal remuneration for services rendered as Directors.
No loans have been availed by our Directors from our Company.
None of the Directors is party to any bonus or profit-sharing plan of our Company other than the performance linked incentives
given to each of the Directors.
One of our Promoters, Evergraph, has executed a letter agreement dated May 3, 2017, as amended on July 26, 2021 (the “Letter
Agreement”), with Sanders Consulting, a company promoted and jointly owned by our Executive Director and CEO, Sanjay
Thapar. Pursuant to the Letter Agreement, Sanders Consulting provides non-binding strategic and operational advice to
Evergraph, including in relation to its activities and investments in the industrial graphics sector (“Sanders Services”). In
consideration for the Sanders Services, Evergraph has agreed to pay to Sanders Consulting, a certain percentage of the profit
pool which it achieves over a 10% preferred return on the Equity Shares sold by Evergraph. The profit percentage is a tier-
based structure determined by the multiple of the return on invested capital made on such sale of Equity Shares (“Sanders
Payment”). Further, under the terms of the Letter Agreement, Sanders Consulting received a monthly fee of ₹250,000 for the
services rendered by them. This monthly payment was terminated pursuant to the amendment to the Letter Agreement dated
July 26, 2021.
The Sanders Payment for the portion of the Equity Shares sold by Evergraph, pursuant to this Offer, shall be made any day
after the filing of the Draft Red Herring Prospectus with SEBI but one day prior to the listing and trading of our Equity Shares
on the Stock Exchanges pursuant to the Offer.
Further, for the Equity Shares sold post the listing and trading of our Equity Shares on the Stock Exchanges, the Letter
Agreement provides for the payment of an incremental amount by Evergraph to Sanders Consulting, based on the same
computation methodology described above as Sanders Payment upon sale of all or a portion of the Equity Shares held by
Evergraph post the Offer. Any such additional payment would be, subject to receipt of approvals in accordance with Regulation
26(6) of the SEBI Listing Regulations, including approval of the public shareholders of our Company, at the first general
meeting of our Company, post commencement of trading of our Equity Shares pursuant to the Offer.
Changes in the Board in the last three years
Name Date of Appointment/ Change/Cessation Reason
Kevin K. Joseph July 22, 2021* Appointment as Executive Director
Veni Thapar July 22, 2021** Appointment as Non-Executive Independent Director
Matthias Frenzel July 22, 2021# Appointment as Non-Executive Independent Director
Ramesh Chandra Jain July 22, 2021# Appointment as Non-Executive Independent Director *Kevin K. Joseph was appointed as an additional Director pursuant to board resolution dated July 19, 2021
**Veni Thapar was appointed as an additional Director pursuant to board resolution dated July 12, 2021 #Matthias Frenzel and Ramesh Chandra Jain were appointed as additional Directors pursuant to board resolution dated July 6, 2021
Borrowing Powers of Board
Pursuant to our Articles of Association, and in accordance with the provisions of the Companies Act and the rules made
thereunder, our Board is authorised to raise or borrow such monies which together with the money already borrowed does not
exceed the paid-up share capital and free reserves of our Company
Corporate Governance
The corporate governance provisions of the SEBI Listing Regulations will be applicable to us immediately upon the listing of
the Equity Shares on the Stock Exchanges. We are in compliance with the corporate governance requirements and the
requirements of the applicable regulations, including the SEBI Listing Regulations, the Companies Act and the SEBI ICDR
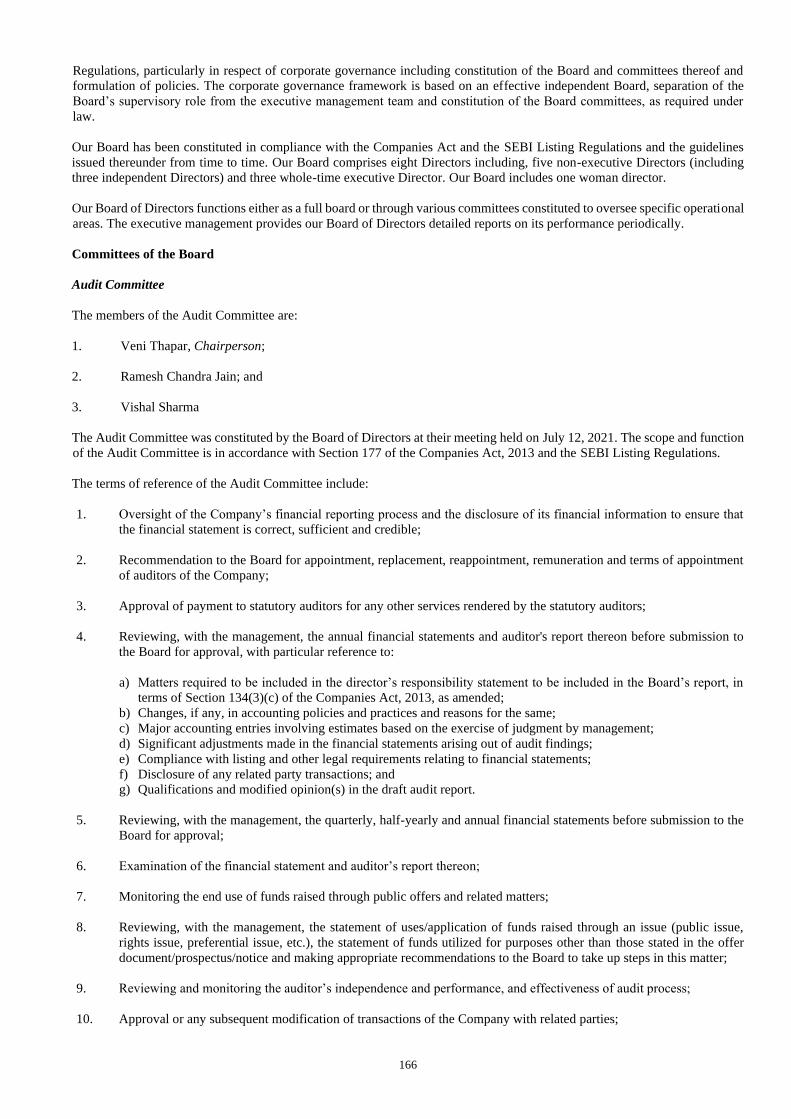
166
Regulations, particularly in respect of corporate governance including constitution of the Board and committees thereof and
formulation of policies. The corporate governance framework is based on an effective independent Board, separation of the
Board’s supervisory role from the executive management team and constitution of the Board committees, as required under
law.
Our Board has been constituted in compliance with the Companies Act and the SEBI Listing Regulations and the guidelines
issued thereunder from time to time. Our Board comprises eight Directors including, five non-executive Directors (including
three independent Directors) and three whole-time executive Director. Our Board includes one woman director.
Our Board of Directors functions either as a full board or through various committees constituted to oversee specific operational
areas. The executive management provides our Board of Directors detailed reports on its performance periodically.
Committees of the Board
Audit Committee
The members of the Audit Committee are:
1. Veni Thapar, Chairperson;
2. Ramesh Chandra Jain; and
3. Vishal Sharma
The Audit Committee was constituted by the Board of Directors at their meeting held on July 12, 2021. The scope and function
of the Audit Committee is in accordance with Section 177 of the Companies Act, 2013 and the SEBI Listing Regulations.
The terms of reference of the Audit Committee include:
1. Oversight of the Company’s financial reporting process and the disclosure of its financial information to ensure that
the financial statement is correct, sufficient and credible;
2. Recommendation to the Board for appointment, replacement, reappointment, remuneration and terms of appointment
of auditors of the Company;
3. Approval of payment to statutory auditors for any other services rendered by the statutory auditors;
4. Reviewing, with the management, the annual financial statements and auditor's report thereon before submission to
the Board for approval, with particular reference to:
a) Matters required to be included in the director’s responsibility statement to be included in the Board’s report, in
terms of Section 134(3)(c) of the Companies Act, 2013, as amended;
b) Changes, if any, in accounting policies and practices and reasons for the same;
c) Major accounting entries involving estimates based on the exercise of judgment by management;
d) Significant adjustments made in the financial statements arising out of audit findings;
e) Compliance with listing and other legal requirements relating to financial statements;
f) Disclosure of any related party transactions; and
g) Qualifications and modified opinion(s) in the draft audit report.
5. Reviewing, with the management, the quarterly, half-yearly and annual financial statements before submission to the
Board for approval;
6. Examination of the financial statement and auditor’s report thereon;
7. Monitoring the end use of funds raised through public offers and related matters;
8. Reviewing, with the management, the statement of uses/application of funds raised through an issue (public issue,
rights issue, preferential issue, etc.), the statement of funds utilized for purposes other than those stated in the offer
document/prospectus/notice and making appropriate recommendations to the Board to take up steps in this matter;
9. Reviewing and monitoring the auditor’s independence and performance, and effectiveness of audit process;
10. Approval or any subsequent modification of transactions of the Company with related parties;
167
11. Scrutiny of inter-corporate loans and investments;
12. Valuation of undertakings or assets of the Company, wherever it is necessary;
13. Evaluation of internal financial controls and risk management systems;
14. Reviewing, with the management, performance of statutory and internal auditors, adequacy of the internal control
systems;
15. Reviewing the adequacy of internal audit function, if any, including the structure of the internal audit department,
staffing and seniority of the official heading the department, reporting structure coverage and frequency of internal
audit;
16. Discussion with internal auditors of any significant findings and follow up thereon;
17. Reviewing the findings of any internal investigations by the internal auditors into matters where there is suspected
fraud or irregularity or a failure of internal control systems of a material nature and reporting the matter to the Board;
18. Discussion with statutory auditors, internal auditors, secretarial auditors and cost auditors before the audit commences,
about the nature and scope of audit as well as post-audit discussion to ascertain any area of concern;
19. To look into the reasons for substantial defaults in the payment to the depositors, debenture holders, shareholders (in
case of non-payment of declared dividends) and creditors;
20. To review the functioning of the whistle blower mechanism;
21. Approval of appointment of chief financial officer, or any other person heading the finance function or discharging
that function, after assessing the qualifications, experience and background, etc. of the candidate;
22. Ensuring that an information system audit of the internal systems and process is conducted at least once in two years
to assess operational risks faced by the Company;
23. Establishing a vigil mechanism/ whistle blower policy for directors and employees to report their genuine concerns or
grievances;
24. Consider and comment on rationale, cost-benefits and impact of schemes involving merger, demerger, amalgamation
etc., on the listed entity and its shareholders;
25. Reviewing the utilization of loan and/or advances from investment by the holding company in the subsidiary exceeding
₹100 crore or 10% of the asset size of the subsidiary, whichever is lower including existing loans / advances /
investments; and
26. Carrying out any other function as may be required / mandated by the Board from time to time and/ or mandated as
per the provisions of the Securities and Exchange Board of India (Listing Obligations and Disclosure Requirements)
Regulations, 2015, as amended, the Companies Act, 2013, as amended (including Section 177), the listing agreements
to be entered into between the Company and the respective stock exchanges on which the equity shares of the Company
are proposed to be listed and/or any other applicable laws.
The Audit Committee shall mandatorily review the following information:
1. management discussion and analysis of financial condition and results of operations;
2. statement of significant related party transactions (as defined by the Audit Committee), submitted by management;
3. management letters / letters of internal control weaknesses issued by the statutory auditors;
4. internal audit reports relating to internal control weaknesses;
5. the appointment, removal and terms of remuneration of the internal auditor shall be subject to review by the Audit
Committee; and
6. the examination of the financial statements and the auditors’ report thereon; and
7. statement of deviations as and when becomes applicable:
168
(a) quarterly statement of deviation(s) submitted to stock exchange(s) in terms of Regulation 32(1) of the
Securities and Exchange Board of India (Listing Obligations and Disclosure Requirements) Regulations,
2015, as amended.
(b) Annual statement of funds utilized for purposes other than those stated in the offer
document/prospectus/notice in terms of Regulation 32(7) of the Securities and Exchange Board of India
(Listing Obligations and Disclosure Requirements) Regulations, 2015, as amended.
The powers of the Audit Committee will include the following:
1. to investigate activity within its terms of reference;
2. to seek information from any employees;
3. to obtain outside legal or other professional advice; and
4. to secure attendance of outsiders with relevant expertise, if it considers necessary
The Audit Committee is required to meet at least four times in a year and not more than 120 days are permitted to elapse
between two meetings under the terms of the SEBI Listing Regulations.
Nomination and Remuneration Committee
The members of the Nomination and Remuneration Committee are:
1. Veni Thapar, Chairperson;
2. Kazi Arif Uz Zaman
3. Ramesh Chandra Jain; and
4. Vishal Sharma
The Nomination and Remuneration Committee was constituted by the Board of Directors at their meeting held on July 12,
2021. The scope and function of the Nomination and Remuneration Committee is in accordance with Section 178 of the
Companies Act, 2013 and the SEBI Listing Regulations.
The terms of reference of the Nomination and Remuneration Committee include:
1. Formulating the criteria for determining qualifications, positive attributes and independence of a director and
recommend to the Board a policy relating to, the remuneration of the directors, key managerial personnel and other
employees;
The Nomination and Remuneration Committee, while formulating the above policy, should ensure that:
(a) the level and composition of remuneration be reasonable and sufficient to attract, retain and motivate directors
of the quality required to run the Company successfully;
(b) relationship of remuneration to performance is clear and meets appropriate performance benchmarks; and
(c) remuneration to directors, key managerial personnel and senior management involves a balance between fixed
and incentive pay reflecting short and long term performance objectives appropriate to the working of the
Company and its goals;
2. Formulating criteria for evaluation of performance of independent directors and the Board;
3. Devising a policy on diversity of Board;
4. Identifying persons who are qualified to become directors and who may be appointed in senior management in
accordance with the criteria laid down, and recommend to the Board their appointment and removal and carrying out
evaluation of every director’s performance and specifying the manner for effective evaluation of performance of
Board, its committees and individual directors, to be carried out either by the Board, by the Nomination and
Remuneration Committee or by an independent external agency and reviewing its implementation and compliance;
5. Extending or continuing the term of appointment of the independent director, on the basis of the report of performance
evaluation of independent directors;
6. Recommending to the Board, all remuneration, in whatever form, payable to senior management;
7. Administering, monitoring and formulating detailed terms and conditions of the Company’s ESOP plan;
169
8. Performing such functions as are required to be performed by the compensation committee under the Securities and
Exchange Board of India (Share Based Employee Benefits) Regulations, 2014, as amended;
9. Engaging the services of any consultant/professional or other agency for the purpose of recommending compensation
structure/policy;
10. Analyzing, monitoring and reviewing various human resource and compensation matters;
11. Reviewing and approving compensation strategy from time to time in the context of the then current Indian market in
accordance with applicable laws;
12. Framing suitable policies and systems to ensure that there is no violation, by an employee of any applicable laws in
India or overseas, including:
(a) The Securities and Exchange Board of India (Prohibition of Insider Trading) Regulations, 2015, as amended;
or
(b) The Securities and Exchange Board of India (Prohibition of Fraudulent and Unfair Trade Practices relating
to the Securities Market) Regulations, 2003, as amended;
13. Carrying out any other function as may be required/ mandated by the Board from time to time and/ or mandated as per
the provisions of the Securities and Exchange Board of India (Listing Obligations and Disclosure Requirements)
Regulations, 2015, the Companies Act, 2013, each as amended, the listing agreements to be entered into between the
Company and the respective stock exchanges on which the equity shares of the Company are proposed to be listed
and/or any other applicable laws; and
14. Performing such other functions as may be necessary or appropriate for the performance of its duties.
Stakeholders’ Relationship Committee
The members of the Stakeholders’ Relationship Committee are:
1. Matthias Frenzel, Chairman;
2. K.A Joseph
3. Kazi Arif Uz Zaman; and
4. Sanjay Thapar
The Stakeholders’ Relationship Committee was constituted by the Board of Directors at their meeting held on July 12, 2021.
The scope and function of the Stakeholders’ Relationship Committee is in accordance with Section 178 of the Companies Act,
2013 and the SEBI Listing Regulations.
The terms of reference of the Stakeholders’ Relationship Committee are as follows:
1. To resolve the grievances of the security holders of the Company including complaints related to transfer/transmission
of shares, non-receipt of annual report, non-receipt of declared dividends, issue of new/duplicate certificates, general
meetings etc. and assisting with quarterly reporting of such complaints;
2. To review measures taken for effective exercise of voting rights by shareholders;
3. To review adherence to the service standards adopted by the Company in respect of various services being rendered
by the registrar and share transfer agent;
4. To review the various measures and initiatives taken by the Company for reducing the quantum of unclaimed dividends
and ensuring timely receipt of dividend warrants/annual reports/statutory notices by the shareholders of the Company;
5. To formulate procedures in line with the statutory guidelines to ensure speedy disposal of various requests received
from shareholders from time to time;
6. To approve, register, refuse to register transfer or transmission of shares and other securities;
7. To sub-divide, consolidate and/or replace any share or other securities certificate(s) of the Company;
170
8. To issue duplicate share or other security(ies) certificate(s) in lieu of the original share/security(ies) certificate(s) of
the Company; and
9. Carrying out such other functions as may be specified by the Board from time to time or specified/provided under the
Companies Act, 2013 or the Securities and Exchange Board of India (Listing Obligations and Disclosure
Requirements) Regulations, 2015, each as amended or by any other regulatory authority.
Corporate Social Responsibility Committee
The members of the corporate social responsibility committee are:
1. Matthias Frenzel, Chairman;
2. K.A Joseph;
3. Sanjay Thapar;
4. Vishal Sharma; and
5. Veni Thapar
The Corporate Social Responsibility Committee was first constituted by a meeting of the Board of Directors held on April 7,
2014 and last reconstituted on July 12, 2021. The terms and reference of the Corporate Social Responsibility Committee include
the following:
1. Formulation of a corporate social responsibility policy to the Board, indicating the activities to be undertaken by the
Company in areas or subjects specified in the Companies Act, 2013. The activities should be within the list of permitted
activities specified in the Companies Act, 2013 and the rules thereunder;
2. Recommending the amount of expenditure to be incurred, amount to be at least 2% of the average net profit of the
Company in the three immediately preceding financial years or where the Company has not completed the period of
three financial years since its incorporation, during such immediately preceding financial years;
3. Instituting a transparent monitoring mechanism for implementation of the corporate social responsibility projects or
programs or activities undertaken by the Company;
4. Monitoring the corporate social responsibility policy from time to time and issuing necessary directions as required
for proper implementation and timely completion of corporate social responsibility programmes;
5. Identifying corporate social responsibility policy partners and corporate social responsibility policy programmes;
6. Identifying and appointing the corporate social responsibility team of the Company including corporate social
responsibility manager, wherever required; and
7. Performing such other duties and functions as the Board may require the corporate social responsibility committee to
undertake to promote the corporate social responsibility activities of the Company or as may be required under
applicable laws.
Risk Management Committee
The members of the Risk Management Committee are:
1. Sanjay Thapar, Chairman;
2. Vishal Sharma; and
3. Veni Thapar
The Risk Management Committee was constituted by the Board of Directors at their meeting held on July 12, 2021. The terms
and reference of the Risk Management Committee include the following:
1. To formulate a detailed risk management policy which shall include:
(a) A framework for identification of internal and external risks specifically faced by the listed entity, in particular
171
including financial, operational, sectoral, sustainability (particularly, ESG related risks), information, cyber
security risks or any other risk as may be determined by the Risk Management Committee.
(b) Measures for risk mitigation including systems and processes for internal control of identified risks.
(c) Business continuity plan.
2. To ensure that appropriate methodology, processes and systems are in place to monitor and evaluate risks associated
with the business of the Company;
3. To monitor and oversee implementation of the risk management policy, including evaluating the adequacy of risk
management systems;
4. To periodically review the risk management policy, at least once in two years, including by considering the changing
industry dynamics and evolving complexity;
5. To keep the board of directors informed about the nature and content of its discussions, recommendations and actions
to be taken; and
6. The appointment, removal and terms of remuneration of the Chief Risk Officer (if any) shall be subject to review by
the Risk Management Committee.
IPO Committee
The members of the IPO committee are:
1. K. A Joseph, Chairman;
2. Sanjay Thapar; and
3. Vishal Sharma
The IPO Committee was constituted by a meeting of the Board of Directors held on July 6, 2021. The terms and reference of
the IPO Committee include the following:
1. To approve amendments to the memorandum of association and the articles of association of the Company;
2. To make applications, seek clarifications, obtain approvals and seek exemptions from, where necessary, the Reserve
Bank of India (“RBI”), the Securities and Exchange Board of India (“SEBI”), the relevant registrar of companies and
any other governmental or statutory authorities as may be required in connection with the Offer and accept on behalf
of the Board such conditions and modifications as may be prescribed or imposed by any of them while granting such
approvals, permissions and sanctions as may be required and wherever necessary, incorporate such modifications /
amendments as may be required in the draft red herring prospectus, the red herring prospectus and the prospectus as
applicable;
3. To finalize, settle, approve, adopt and file in consultation with the BRLMs where applicable, the DRHP, the RHP, the
Prospectus, the preliminary and final international wrap and any amendments, supplements, notices, addenda or
corrigenda thereto, and take all such actions as may be necessary for the submission and filing of these documents
including incorporating such alterations/corrections/ modifications as may be required by SEBI, the RoC or any other
relevant governmental and statutory authorities or in accordance with applicable laws;
4. To decide, along with the Selling Shareholders, in consultation with the BRLMs on the actual Offer size, timing,
pricing, discount, reservation and all the terms and conditions of the Offer, including the price band (including offer
price for anchor investors), bid period, Offer price, and to do all such acts and things as may be necessary and expedient
for, and incidental and ancillary to the Offer including to make any amendments, modifications, variations or
alterations in relation to the Offer;
5. To appoint and enter into and terminate arrangements with the BRLMs, underwriters to the Offer, syndicate members
to the Offer, brokers to the Offer, escrow collection bankers to the Offer, refund bankers to the Offer, registrars, legal
advisors, auditors, and any other agencies or persons or intermediaries to the Offer and to negotiate, finalise and amend
the terms of their appointment, including but not limited to the execution of the mandate letter with the BRLMs and
negotiation, finalization, execution and, if required, amendment of the offer agreement with the BRLMs;
6. To negotiate, finalise and settle and to execute and deliver or arrange the delivery of the DRHP, the RHP, the
Prospectus, offer agreement, syndicate agreement, underwriting agreement, share escrow agreement, cash escrow
agreement, agreements with the registrar to the offer and all other documents, deeds, agreements and instruments
172
whatsoever with the registrar to the Offer, legal advisors, auditors, stock exchange(s), BRLMs and any other
agencies/intermediaries in connection with the Offer with the power to authorise one or more officers of the Company
to execute all or any of the aforesaid documents or any amendments thereto as may be required or desirable in relation
to the Offer;
7. To seek, if required, the consent and/or waiver of the lenders of the Company, customers, parties with whom the
Company has entered into various commercial and other agreements, all concerned government and regulatory
authorities in India or outside India, and any other consents and/or waivers that may be required in relation to the Offer
or any actions connected therewith;
8. To open and operate bank accounts in terms of the escrow agreement and to authorize one or more officers of the
Company to execute all documents/deeds as may be necessary in this regard;
9. To open and operate bank accounts of the Company in terms of Section 40(3) of the Companies Act, 2013, as amended,
and to authorize one or more officers of the Company to execute all documents/deeds as may be necessary in this
regard;
10. To authorize and approve, in consultation with the Selling Shareholders, incurring of expenditure and payment of fees,
commissions, brokerage, remuneration and reimbursement of expenses in connection with the Offer;
11. To accept and appropriate the proceeds of the Offer in accordance with the applicable laws;
12. To approve code of conduct as may be considered necessary by the IPO Committee or as required under applicable
laws, regulations or guidelines for the Board, officers of the Company and other employees of the Company;
13. To approve the implementation of any corporate governance requirements that may be considered necessary by the
Board or the IPO Committee or as may be required under the applicable laws or the SEBI (Listing Obligations and
Disclosure Requirements) Regulations, 2015, as amended and listing agreements to be entered into by the Company
with the relevant stock exchanges, to the extent allowed under law;
14. To issue receipts/allotment letters/confirmation of allotment notes either in physical or electronic mode representing
the underlying Equity Shares in the capital of the Company with such features and attributes as may be required and
to provide for the tradability and free transferability thereof as per market practices and regulations, including listing
on one or more stock exchange(s), with power to authorize one or more officers of the Company to sign all or any of
the aforestated documents;
15. To authorize and approve notices, advertisements in relation to the Offer in consultation with the relevant
intermediaries appointed for the Offer;
16. To do all such acts, deeds, matters and things and execute all such other documents, etc., as may be deemed necessary
or desirable for such purpose, along with the Selling Shareholders, including without limitation, to finalise the basis
of allocation and to transfer and allot the shares to the successful allottees as permissible in law, issue of allotment
letters/confirmation of allotment notes, share certificates in accordance with the relevant rules, in consultation with the
BRLMs;
17. To do all such acts, deeds and things as may be required to dematerialise the Equity Shares and to sign and / or modify,
as the case maybe, agreements and/or such other documents as may be required with National Securities Depository
Limited, the Central Depository Services (India) Limited, registrar and transfer agents and such other agencies,
authorities or bodies as may be required in this connection and to authorize one or more officers of the Company to
execute all or any of the aforestated documents;
18. To make applications for listing of the Equity Shares in one or more stock exchange(s) for listing of the Equity Shares
and to execute and to deliver or arrange the delivery of necessary documentation to the concerned stock exchange(s)
in connection with obtaining such listing including without limitation, entering into listing agreements and affixing the
common seal of the Company where necessary;
19. To settle all questions, difficulties or doubts that may arise in regard to the Offer, including such issues or allotment,
terms of the IPO, utilisation of the IPO proceeds and matters incidental thereto as it may deem fit;
20. To submit undertaking/certificates or provide clarifications to the SEBI, Registrar of Companies, and the relevant stock
exchange(s) where the Equity Shares are to be listed;
21. To negotiate, finalize, settle, execute and deliver any and all other documents or instruments and to do or cause to be
done any and all acts or things as the IPO Committee may deem necessary, appropriate or advisable in order to carry

173
out the purposes and intent of this resolution or in connection with the Offer and any documents or instruments so
executed and delivered or acts and things done or caused to be done by the IPO Committee shall be conclusive evidence
of the authority of the IPO Committee in so doing;
22. To delegate any of its powers set out under (a) to (q) hereinabove, as may be deemed necessary and permissible under
applicable laws to the officials of the Company;
23. To approve suitable policies on insider trading, whistle-blowing, risk management, and any other policies as may be
required under the SEBI Listing Regulations or any other Applicable Laws;
24. To approve the list of ‘group of companies’ of the Company, identified pursuant to the materiality policy adopted by
the Board, for the purposes of disclosure in the DRHP, RHP and Prospectus;
25. Deciding, negotiating and finalising the pricing and all other related matters regarding the pre-IPO placement,
including the execution of the relevant documents with the investors in consultation with the BRLMs and in accordance
with applicable laws;
26. taking on record the approval of the Selling Shareholders for offering their Equity Shares in the offer for sale;
27. to withdraw the DRHP or the RHP or to decide to not proceed with the Offer at any stage in accordance with applicable
laws and in consultation with the BRLMs; and
28. To appoint, in consultation with the Selling Shareholders, the BRLMs, the registrar and other intermediaries to the
Offer, in accordance with the provisions of the Securities and Exchange Board of India (Issue of Capital and Disclosure
Requirements) Regulations, 2018, as amended and other applicable laws including legal counsels, banks or agencies
concerned and entering into any agreements or other instruments for such purpose, to remunerate all such
intermediaries/agencies including the payments of commissions, brokerages, etc. and to terminate any agreements or
arrangements with such intermediaries/ agents.
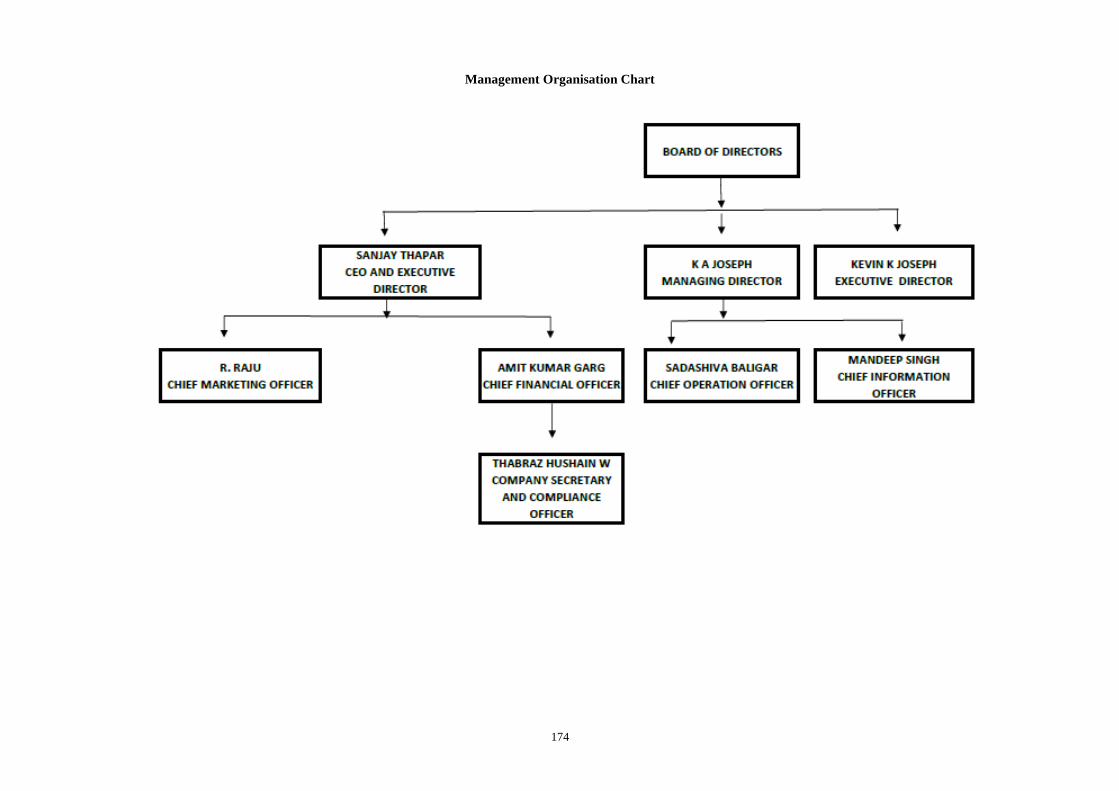
174
Management Organisation Chart
175
Key Managerial Personnel
The details of the Key Managerial Personnel of our Company are as follows:
K.A. Joseph is the Managing Director of our Company. For further details in relation to him, see “– Brief Biographies of
Directors” on page 161. For details of compensation paid to them, see “Terms of Appointment of Directors” on page 163.
Sanjay Thapar is the Chief Executive Officer and Executive Director of our Company. For further details in relation to him,
see “– Brief Biographies of Directors” on page 161. For details of compensation paid to them, see “Terms of Appointment of
Directors” on page 163.
Amit Kumar Garg is the Chief Financial Officer of our Company. He holds a bachelor’s degree in commerce from the
University of Delhi and a master’s degree in business administration from the Massachusetts Institute of Technology. He is
also an associate of the Institute of Chartered Accountants of India. Prior to joining our Company, he was the chief financial
officer of Markets and Markets Research Private Limited and NIIT Technologies Limited, the regional finance director of South
Asia of Intertek India Private Limited., the director (finance) Fidelity Business Services India Private Limited. He has also
previously worked with American Express (India) Private Limited, Price Waterhouse. He is the co-founder of WinPe
Development Forum, a not-for-profit organisation to promote participation of women in the private equity industry in India. He
joined our company on May 19, 2021 and accordingly, did not receive any remuneration from our Company during Fiscal 2021.
Mandeep Singh is the Chief Information Officer of our Company. He holds a bachelor’s degree in engineering from the
Kuvempu University, Karnataka. He was the founder of Nanatom Technologies Private Limited and has previously worked
with our Company, Spurthi Meditech (TPA) Solutions Private Limited and Ind-Swift Laboratories Limited. He joined our
company on September 1, 2021 and accordingly, did not receive any remuneration from our Company during Fiscal 2021.
R. Raju is the Chief Marketing Officer of our Company. He holds a diploma in mechanical engineering from the Thiagarajar
Polytechnic, Salem, a diploma in production management from Annamalai University, Tamil Nadu, a post graduate diploma in
marketing management and a master’s degree in business administration (marketing management) from the Indira Gandhi
National Open University. He joined our company on April 17, 2020. He has over 22 years of experience in the field of
marketing and has previously worked with ITW India Limited, ITW Signode India Limited, Sundaram Auto Components
Limited (A TVS group company) and Minda Sai Limited. The gross total remuneration paid to him in Fiscal 2021 was ₹5.54
million.
Sadashiva Baligar is the Chief Operation Officer of our Company. He holds a bachelor’s degree in engineering (mechanical)
from University of Mysore. He has also completed the leadership development program I 2016 from the Toyota Institute. Prior
to joining our Company, he has worked with Motherson Automotive Technologies and Engineering Limited, a division of
Motherson Sumi Systems Limited, Automotive Manufacturers (Malaysia) SDN BHD, Toyota Kirloskar Auto Parts Private
Limited and the vice president of operations with Musashi Auto Parts India Private Limited. He was also the senior vice
president of the Automotive Component Manufacturers Association of India – Karnataka State and Hosur region in Fiscal 2020.
He joined our company on April 21, 2021, and accordingly, did not receive any remuneration from our Company during Fiscal
2021.
Thabraz Hushain W. is the Company Secretary and Compliance Officer of our Company. He holds a bachelor’s degree in
commerce from the Bangalore University. He is also an associate of the Institute of Company Secretaries of India. He joined
our company on June 18, 2018. Prior to joining our Company, he has worked with Unaitted Builders Consultants Private
Limited and Hinduja Global Solutions Limited. The gross total remuneration paid to him in Fiscal 2021 was ₹0.75 million.
Relationship between our Key Managerial Personnel and Directors
Except K.A. Joseph, who is the father of Kevin K. Joseph, none of the Key Managerial Personnel are either related to each
other or to the Directors.
Shareholding of Key Managerial Personnel
The shareholding of the Key Managerial Personnel of our Company as on the date of filing of this Red Herring Prospectus is
set forth below:
S. No. Name of the Director Number of Equity Shares Pre-Offer (%)
1. K.A. Joseph 6,311,760 20.74
2. Sanjay Thapar* 5 Negligible * Sanjay Thapar owns 345,939 Equity Shares in our Company, indirectly through SCPL, a company promoted and jointly owned by him
Bonus or Profit-Sharing Plans of the Key Managerial Personnel
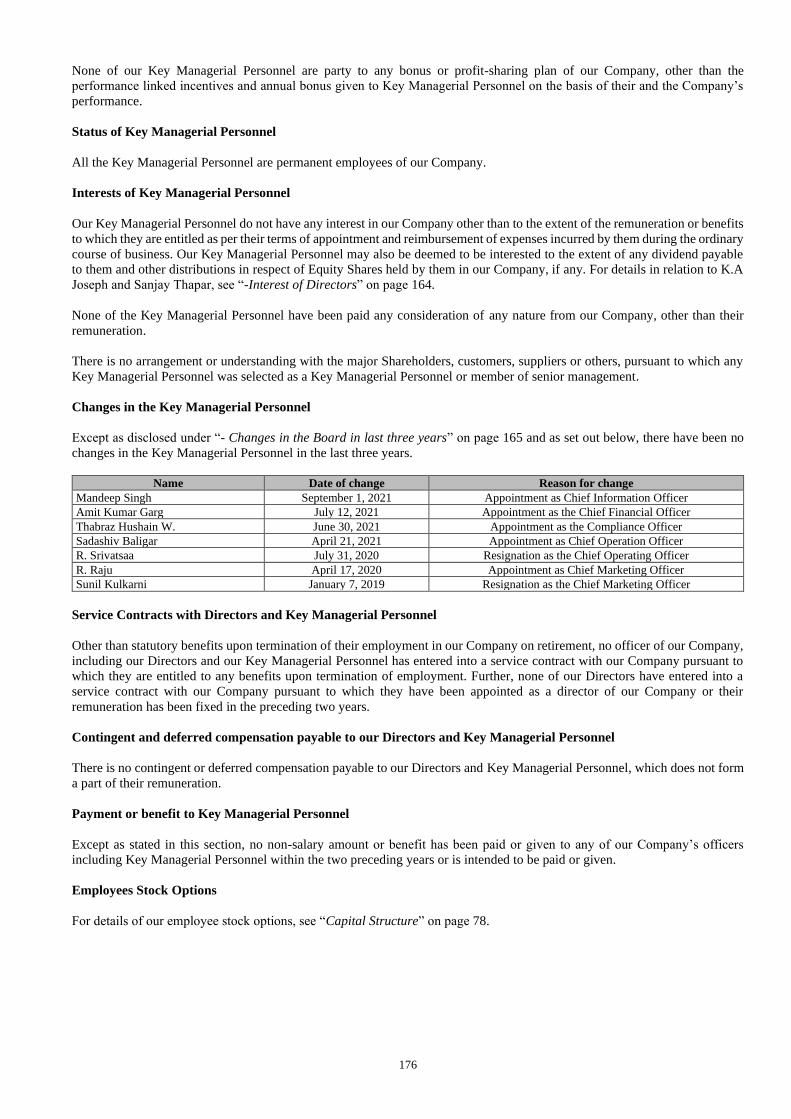
176
None of our Key Managerial Personnel are party to any bonus or profit-sharing plan of our Company, other than the
performance linked incentives and annual bonus given to Key Managerial Personnel on the basis of their and the Company’s
performance.
Status of Key Managerial Personnel
All the Key Managerial Personnel are permanent employees of our Company.
Interests of Key Managerial Personnel
Our Key Managerial Personnel do not have any interest in our Company other than to the extent of the remuneration or benefits
to which they are entitled as per their terms of appointment and reimbursement of expenses incurred by them during the ordinary
course of business. Our Key Managerial Personnel may also be deemed to be interested to the extent of any dividend payable
to them and other distributions in respect of Equity Shares held by them in our Company, if any. For details in relation to K.A
Joseph and Sanjay Thapar, see “-Interest of Directors” on page 164.
None of the Key Managerial Personnel have been paid any consideration of any nature from our Company, other than their
remuneration.
There is no arrangement or understanding with the major Shareholders, customers, suppliers or others, pursuant to which any
Key Managerial Personnel was selected as a Key Managerial Personnel or member of senior management.
Changes in the Key Managerial Personnel
Except as disclosed under “- Changes in the Board in last three years” on page 165 and as set out below, there have been no
changes in the Key Managerial Personnel in the last three years.
Name Date of change Reason for change
Mandeep Singh September 1, 2021 Appointment as Chief Information Officer
Amit Kumar Garg July 12, 2021 Appointment as the Chief Financial Officer
Thabraz Hushain W. June 30, 2021 Appointment as the Compliance Officer
Sadashiv Baligar April 21, 2021 Appointment as Chief Operation Officer
R. Srivatsaa July 31, 2020 Resignation as the Chief Operating Officer
R. Raju April 17, 2020 Appointment as Chief Marketing Officer
Sunil Kulkarni January 7, 2019 Resignation as the Chief Marketing Officer
Service Contracts with Directors and Key Managerial Personnel
Other than statutory benefits upon termination of their employment in our Company on retirement, no officer of our Company,
including our Directors and our Key Managerial Personnel has entered into a service contract with our Company pursuant to
which they are entitled to any benefits upon termination of employment. Further, none of our Directors have entered into a
service contract with our Company pursuant to which they have been appointed as a director of our Company or their
remuneration has been fixed in the preceding two years.
Contingent and deferred compensation payable to our Directors and Key Managerial Personnel
There is no contingent or deferred compensation payable to our Directors and Key Managerial Personnel, which does not form
a part of their remuneration.
Payment or benefit to Key Managerial Personnel
Except as stated in this section, no non-salary amount or benefit has been paid or given to any of our Company’s officers
including Key Managerial Personnel within the two preceding years or is intended to be paid or given.
Employees Stock Options
For details of our employee stock options, see “Capital Structure” on page 78.

177
OUR PROMOTERS AND PROMOTER GROUP
Our Promoters are K.A. Joseph and Evergraph. For details of the shareholding of our Promoters, as on the date of this Red
Herring Prospectus, please see the section titled “Capital Structure – Details of Equity Shares held by our Directors, Key
Managerial Personnel and directors of our Promoter and members of our Promoter Group” on page 78.
Our Promoters
K.A. Joseph
For a complete profile of K.A. Joseph, i.e., his age, residential address, educational
qualifications, professional experience, positions/ posts held in the past and other directorships,
special achievements, business and other activities, see “Our Management” on page 160.
His driving license number is KA0519911000211. His PAN is ABCPJ7738H and his Aadhaar
card number is 762569091362.
K.A. Joseph is not involved in any ventures other than our Company.
Our Company confirms that the PAN, bank account number and passport number of K.A. Joseph were submitted to the Stock
Exchanges, at the time of filing of the Draft Red Herring Prospectus with them.
Evergraph
Corporate information
Evergraph was incorporated as a private company limited by shares, under the laws of the Republic of Singapore on June 3,
2015. The registered office of Evergraph is located at 163 Penang Road, #08-01, Winsland House II, Singapore 238 463.
Evergraph is authorised to carry on or undertake any business or activity, do any act or enter into and transactions subject to
the provisions of the laws of Singapore. There has been no change in its activities since its incorporation. Its Unique Entity
Number is 201524938Z. Evergraph is wholly owned by Everstone Capital Partners II LLC.
Board of directors
As on date of this Red Herring Prospectus, the board of directors of Evergraph comprise of the following:
a. Shelly Smith;
b. Terence Gerard Gomes;
c. Amit Manocha; and
d. Arjun Oberoi
Shareholding pattern
The shareholding pattern of Evergraph is as follows:
Name of shareholder No. of shares held Percentage of Shareholding (%)
Ordinary Shares
Everstone Capital Partners II LLC 3,150,000 100.00
Preference Shares
Everstone Capital Partners II LLC 12,600,000 100.00
Total 100.00
Changes in control
There has been no change in the control of Evergraph in the last three years preceding the date of this Red Herring Prospectus.
Promoter of Evergraph
Evergraph is promoted by Everstone Capital Partners II LLC. Everstone Capital Management serves as the investment manager
of Everstone Capital Partners II LLC. Everstone Capital Management does not hold any Equity Shares in our Company.
178
There is no natural person holding 15% or more of the voting rights of Evergraph. However, Everstone Capital Management,
through its role as the investment manager of Everstone Capital Partners II LLC, indirectly controls voting rights of Evergraph,
as at the date of this Red Herring Prospectus. Sameer Sain and Atul Kapur together control, through one or more entities,
Everstone Capital Management. Further, they disclaim beneficial ownership of Equity Shares in our Company, other than to
the extent of their respective economic interest, direct or indirect, in Everstone Capital Partners II LLC.
Other than our Company, Evergraph is not involved in any other ventures.
Our Company confirms that the PAN, bank account number and company registration number of Evergraph were submitted to
the Stock Exchanges, at the time of filing of the Draft Red Herring Prospectus with them.
Board of directors
As on date of this Red Herring Prospectus, the board of directors of Everstone Capital Partners II LLC comprise of the
following:
a. Fareed Soreefan;
b. Sanjoy Chatterjee;
c. Philip Donald Walters;
d. Jose Antonio Carranza; and
e. Bhanu Pratabsingh Jaddoo
Interests of Promoters
Our Promoters are interested in our Company to the extent of their respective shareholding in our Company and the dividends
and other distributions thereon, and in the case of K.A. Joseph, (i) he has promoted our Company; (ii) the shareholding of his
relatives in our Company and the dividends payable, if any, and any other distributions in respect of the Equity Shares held by
them or their relatives; (iii) of being the Managing Director of our Company and the remuneration, sitting fees or reimbursement
of expenses payable by our Company to him; and (iv) of being a subscriber to the Memorandum of Association. For details,
see “Our Management” on page 160 and “Capital Structure” on page 78.
Our Promoters are not interested in the properties acquired by our Company in the three years preceding the date of filing of
this Red herring Prospectus or proposed to be acquired by our Company.
Further, except to the extent K.A. Joseph is interested in our Company for the transfer of the land located at survey no. 5/11
(old survey no. 5/1), Thalaghattapura Village, Bangalore South Taluk to the Company in 2001 (for details of the ongoing
litigation pertaining to this land, see “Outstanding Litigation and Material—Litigation against K.A. Joseph”), none of our
Promoters have any interest in any transaction of our Company for acquisition of land, construction of building or supply of
machinery.
Our Promoters do not have any interest in any venture that is involved in any activities similar to those conducted by our
Company.
Except as disclosed in this Red Herring Prospectus, our Promoters are not interested as a member of a firm or company, and no
sum has been paid or agreed to be paid to our Promoters or to such firm or company in cash or shares or otherwise by any
person for services rendered by him or by such firm or company in connection with the promotion or formation of our Company.
Material guarantees given by our Promoters
Our Promoters have not given any material guarantee to any third party with respect to the Equity Shares as on the date of this
Red Herring Prospectus.
Companies and firms with which our Promoters have disassociated in the last three years
Our Promoters have not disassociated themselves from any company or firms during the three years preceding the date of this
Red Herring Prospectus.
Confirmations
Our Promoters and members of our Promoter Group have not been declared wilful defaulters by any bank or financial institution
or consortium thereof, in accordance with the guidelines on wilful defaulters issued by Reserve Bank of India.
179
Our Promoters and members of our Promoter Group have not been prohibited from accessing or operating in capital markets
under any order or direction passed by SEBI or any other regulatory or governmental authority.
Our Promoters are not and have never been promoters, directors or person in control of any other company which is prohibited
from accessing or operating in capital markets under any order or direction passed by SEBI or any other regulatory or
governmental authority.
Change in the management and control of our Company
There has not been any change in the management or control of our Company during the last five years preceding the date of
this Red Herring Prospectus. Evergraph is not the original promoter of our Company and was subsequently named as promoters
of our Company due to its shareholding of our Company, pursuant to the S.J.S. Shareholders’ Agreement. For further details,
see “Capital Structure – History of the Equity Share capital held by our Promoters” on page 78.
Payment or benefits to Promoter or Promoter Group
Except as disclosed in “Our Management - Terms of appointment of Directors - 1. Executive Directors” and “– Interests of
Promoters” on pages 163 and 178, respectively, there has been no payment or benefit to our Promoters or Promoter Group
during the two years prior to the filing of this Red herring Prospectus and there is no intention to pay or give any benefit to our
Promoter or Promoter Group as on the date of filing of this Red Herring Prospectus.
Promoter Group
The following individuals and entities constitute our Promoter Group in terms of Regulation 2(1)(pp) of the SEBI ICDR
Regulations.
Natural persons who are part of our Promoter Group
The following table sets forth details of the natural persons who are part of our Promoter Group (due to their relationship with
our Promoters):
Name of the Individual Promoter Name of the Relative Relationship with the Promoter
K.A. Joseph Daisy Joseph Wife
K.A. Thresiamma Sister
Kevin K. Joseph Son
Nikita Joseph Daughter
Joseph Mathew Brother-in-law
Entities forming part of our Promoter Group
Everstone Capital Partners II LLC
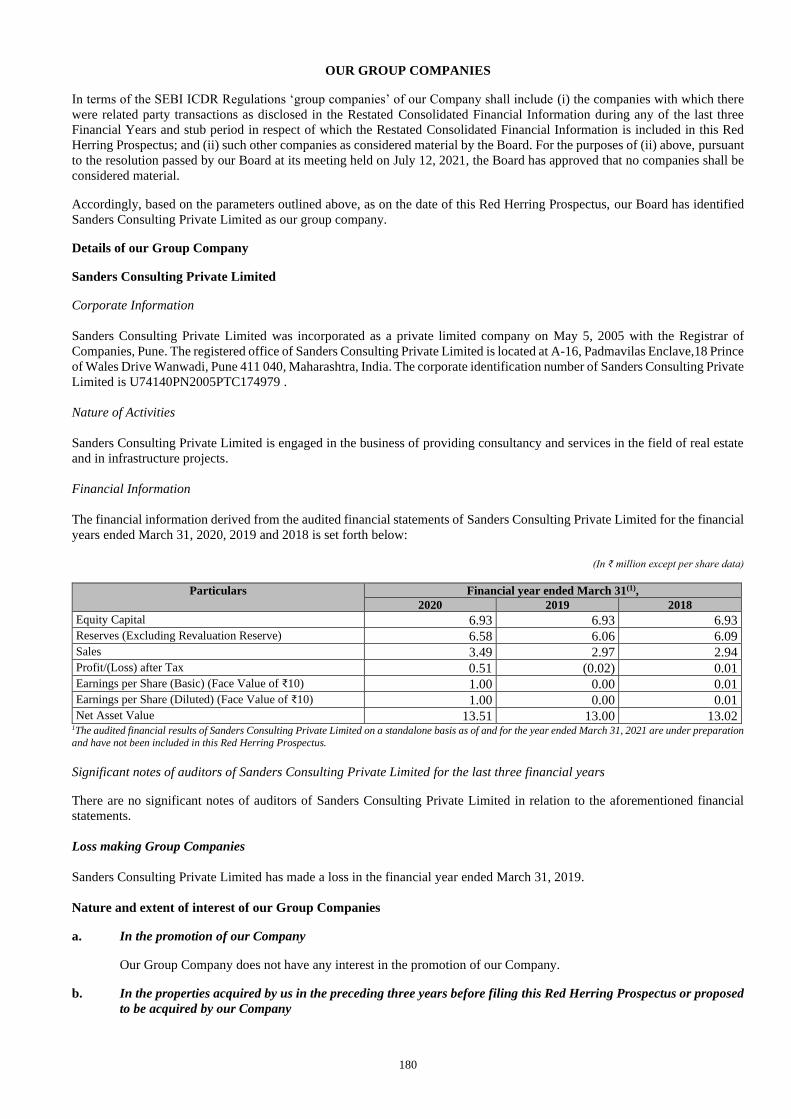
180
OUR GROUP COMPANIES
In terms of the SEBI ICDR Regulations ‘group companies’ of our Company shall include (i) the companies with which there
were related party transactions as disclosed in the Restated Consolidated Financial Information during any of the last three
Financial Years and stub period in respect of which the Restated Consolidated Financial Information is included in this Red
Herring Prospectus; and (ii) such other companies as considered material by the Board. For the purposes of (ii) above, pursuant
to the resolution passed by our Board at its meeting held on July 12, 2021, the Board has approved that no companies shall be
considered material.
Accordingly, based on the parameters outlined above, as on the date of this Red Herring Prospectus, our Board has identified
Sanders Consulting Private Limited as our group company.
Details of our Group Company
Sanders Consulting Private Limited
Corporate Information
Sanders Consulting Private Limited was incorporated as a private limited company on May 5, 2005 with the Registrar of
Companies, Pune. The registered office of Sanders Consulting Private Limited is located at A-16, Padmavilas Enclave,18 Prince
of Wales Drive Wanwadi, Pune 411 040, Maharashtra, India. The corporate identification number of Sanders Consulting Private
Limited is U74140PN2005PTC174979 .
Nature of Activities
Sanders Consulting Private Limited is engaged in the business of providing consultancy and services in the field of real estate
and in infrastructure projects.
Financial Information
The financial information derived from the audited financial statements of Sanders Consulting Private Limited for the financial
years ended March 31, 2020, 2019 and 2018 is set forth below:
(In ₹ million except per share data)
Particulars Financial year ended March 31(1),
2020 2019 2018
Equity Capital 6.93 6.93 6.93
Reserves (Excluding Revaluation Reserve) 6.58 6.06 6.09
Sales 3.49 2.97 2.94
Profit/(Loss) after Tax 0.51 (0.02) 0.01
Earnings per Share (Basic) (Face Value of ₹10) 1.00 0.00 0.01
Earnings per Share (Diluted) (Face Value of ₹10) 1.00 0.00 0.01
Net Asset Value 13.51 13.00 13.02 1The audited financial results of Sanders Consulting Private Limited on a standalone basis as of and for the year ended March 31, 2021 are under preparation
and have not been included in this Red Herring Prospectus.
Significant notes of auditors of Sanders Consulting Private Limited for the last three financial years
There are no significant notes of auditors of Sanders Consulting Private Limited in relation to the aforementioned financial
statements.
Loss making Group Companies
Sanders Consulting Private Limited has made a loss in the financial year ended March 31, 2019.
Nature and extent of interest of our Group Companies
a. In the promotion of our Company
Our Group Company does not have any interest in the promotion of our Company.
b. In the properties acquired by us in the preceding three years before filing this Red Herring Prospectus or proposed
to be acquired by our Company
181
Our Group Company is not interested in the properties acquired by us in the three years preceding the filing of this
Red Herring Prospectus or proposed to be acquired by us as on the date of this Red Herring Prospectus.
c. In transactions for acquisition of land, construction of building and supply of machinery
Our Group Company is not interested in any transactions for the acquisition of land, construction of building or supply
of machinery.
Defunct Group Companies
Our Group Company is not defunct and no applications have been made to the relevant registrar of companies for striking off
their names during the five years immediately preceding the date of filing of this Red Herring Prospectus with SEBI.
Group Companies which are a sick industrial company or are under winding up/ insolvency proceedings
Our Group Company does not fall under the definition of sick companies under the erstwhile Sick Industrial Companies (Special
Provisions) Act, 1985 and are not under any winding up or insolvency proceedings under applicable law.
Common Pursuits between our Group Companies and our Company
There are no common pursuits between our Group Company and our Company.
Related business transactions with the Group Companies and significance on the financial performance of our Company
Other than the transactions disclosed in “Other Financial Information – Related Party Transactions” on page 251, there are no
other related business transactions with our Group Company.
Business interest of our Group Companies in our Company
Except to the extent of shareholding in our Company and as disclosed in “Other Financial Information – Related Party
Transactions” on page 251, our Group Company does not have any business interest in our Company.
Other confirmations
The equity shares of our Group Company are not listed on any stock exchange.
Our Group Company have made any public or rights issue of securities in the preceding three years.
Our Group Company is not involved in any pending litigation which has material impact on our Company.
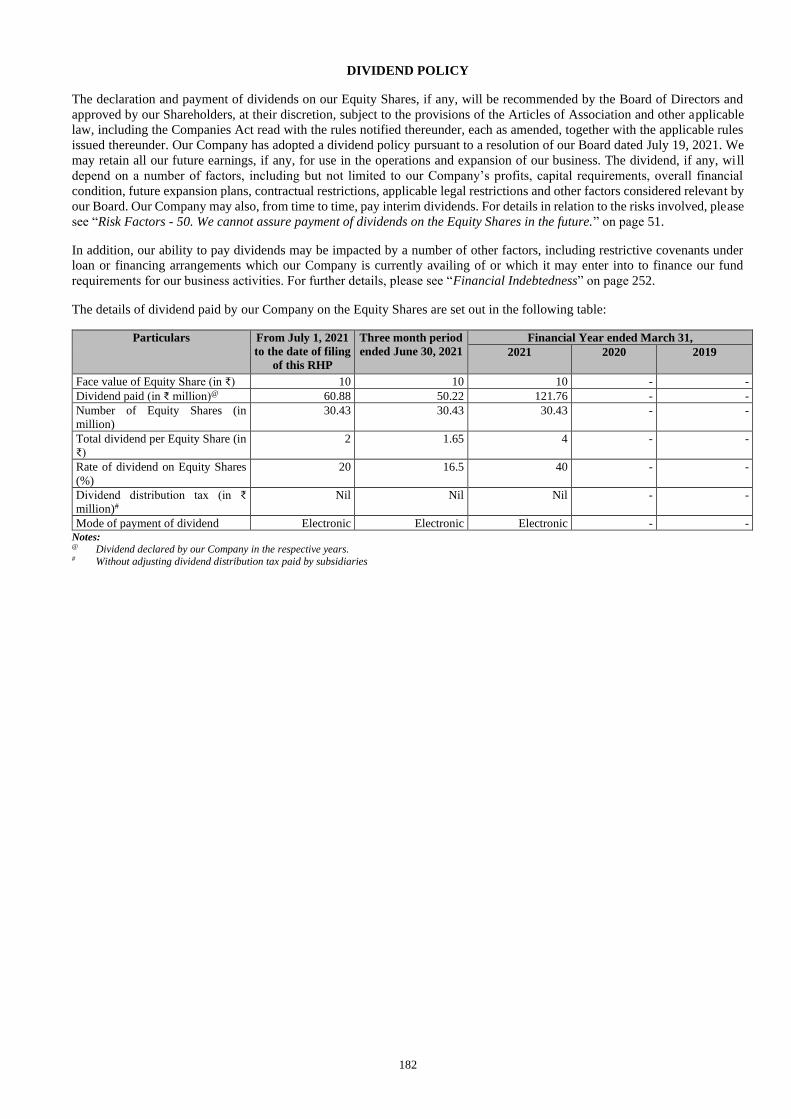
182
DIVIDEND POLICY
The declaration and payment of dividends on our Equity Shares, if any, will be recommended by the Board of Directors and
approved by our Shareholders, at their discretion, subject to the provisions of the Articles of Association and other applicable
law, including the Companies Act read with the rules notified thereunder, each as amended, together with the applicable rules
issued thereunder. Our Company has adopted a dividend policy pursuant to a resolution of our Board dated July 19, 2021. We
may retain all our future earnings, if any, for use in the operations and expansion of our business. The dividend, if any, will
depend on a number of factors, including but not limited to our Company’s profits, capital requirements, overall financial
condition, future expansion plans, contractual restrictions, applicable legal restrictions and other factors considered relevant by
our Board. Our Company may also, from time to time, pay interim dividends. For details in relation to the risks involved, please
see “Risk Factors - 50. We cannot assure payment of dividends on the Equity Shares in the future.” on page 51.
In addition, our ability to pay dividends may be impacted by a number of other factors, including restrictive covenants under
loan or financing arrangements which our Company is currently availing of or which it may enter into to finance our fund
requirements for our business activities. For further details, please see “Financial Indebtedness” on page 252.
The details of dividend paid by our Company on the Equity Shares are set out in the following table:
Particulars From July 1, 2021
to the date of filing
of this RHP
Three month period
ended June 30, 2021
Financial Year ended March 31,
2021 2020 2019
Face value of Equity Share (in ₹) 10 10 10 - -
Dividend paid (in ₹ million)@ 60.88 50.22 121.76 - -
Number of Equity Shares (in
million)
30.43 30.43 30.43 - -
Total dividend per Equity Share (in
₹)
2 1.65 4 - -
Rate of dividend on Equity Shares
(%)
20 16.5 40 - -
Dividend distribution tax (in ₹
million)#
Nil Nil Nil - -
Mode of payment of dividend Electronic Electronic Electronic - - Notes: @ Dividend declared by our Company in the respective years. # Without adjusting dividend distribution tax paid by subsidiaries

183
SECTION V: FINANCIAL INFORMATION
RESTATED CONSOLIDATED FINANCIAL INFORMATION
(The remainder of this page is intentionally left blank)
INDEPENDENT AUDITOR’S EXAMINATION REPORT ON RESTATED CONSOLIDATED
FINANCIAL INFORMATION
The Board of Directors
S.J.S. Enterprises Limited (formerly known as S.J.S. Enterprises Private Limited)
Sy. Nos. 28/P16 Agra Village and
Sy. Nos. 85/P6 BM Kaval Village
Kengeri, Hobli
Bengaluru – 560 082
Karnataka, India.
Dear Sir/Ma’am,
1) We have examined, the attached restated consolidated financial information of S.J.S. Enterprises
Limited (the “Company” or the “Holding Company”) and its subsidiary Exotech Plastics Private
Limited (“ EPPL”) (the Company and its subsidiary together referred to as the “Group") comprising
the restated consolidated statement of assets and liabilities as at 30 June 2021, 31 March 2021, 31 March
2020 and 31 March 2019, the restated consolidated statement of profit and loss (including other
comprehensive income), the restated consolidated statement of changes in equity, the restated
consolidated statement of cash flows for the three months period ended 30 June 2021 and for the years
ended 31 March 2021, 31 March 2020 and 31 March 2019 and the summary statement of significant
accounting policies, and other explanatory information (collectively, the “Restated Consolidated
Financial Information”), as approved by the Board of Directors of the Company at their meeting
held on 11 October 2021 for the purpose of inclusion in the Red Herring Prospectus (the “RHP”) and
Prospectus prepared by the Company in connection with its proposed initial public offer of its equity
shares (the “IPO”) prepared in terms of the requirements of:
(a) Section 26 of Part I of Chapter III of the Companies Act, 2013 (the “Act”);
(b) The Securities and Exchange Board of India (Issue of Capital and Disclosure Requirements)
Regulations, 2018, as amended (the “ICDR Regulations”); and
(c) The Guidance Note on Reports in Company Prospectuses (Revised 2019) issued by the
Institute of Chartered Accountants of India (“ICAI”), as amended from time to time (the
“Guidance Note”).
2) The Company’s Board of Directors is responsible for the preparation of the Restated Consolidated
Financial Information for the purpose of inclusion in the RHP and Prospectus to be filed with the
Securities and Exchange Board of India (the “SEBI”) and the stock exchanges where the equity
shares of the Company are proposed to be listed (the “Stock Exchanges”) in connection with the
proposed IPO. The Restated Consolidated Financial Information have been prepared by the
management of the Company on the basis of preparation as stated in note [1(b)] of Annexure V to
the Restated Consolidated Financial Information.
The respective Board of Directors of the Companies included in the Group are responsible for
designing, implementing and maintaining adequate internal control relevant to the preparation and
presentation of the Restated Consolidated Financial Information. The respective Board of Directors
are also responsible for identifying and ensuring that the Group complies with the Act, the ICDR
Regulations and the Guidance Note.
184
INDEPENDENT AUDITOR’S EXAMINATION REPORT ON RESTATED CONSOLIDATED
FINANCIAL INFORMATION (CONTINUED)
3) We have examined such Restated Consolidated Financial Information taking into consideration:
(a) The terms of our engagement agreed upon with you in accordance with our engagement letter
dated 22 April 2021 and addendum dated 12 August 2021 in connection with the IPO of equity
shares of the Company;
(b) The Guidance Note. The Guidance Note also requires that we comply with the ethical
requirements of the Code of Ethics issued by the ICAI;
(c) Concepts of test checks and materiality to obtain reasonable assurance based on verification of
evidence supporting the Restated Consolidated Financial Information; and
(d) The requirements of Section 26 of the Act and the ICDR Regulations. Our work was performed
solely to assist you in meeting your responsibilities in relation to your compliance with the Act,
the ICDR Regulations and the Guidance Note in connection with the IPO of equity shares of
the Company.
4) These Restated Consolidated Financial Information have been compiled by the management of the
Company from:
a) As at and for the three months period ended 30 June 2021: From the audited special purpose
consolidated financial statements of the Group as at and for the three months period ended 30
June 2021 prepared in accordance with the Indian Accounting Standards (Ind AS) 34 "Interim
Financial Reporting", specified under Section 133 of the Act and other accounting principles
generally accepted in India (the “Special Purpose Consolidated Financial Statements”) which
have been approved by the Board of Directors at their meeting held on 11 October 2021;
b) As at and for the year ended 31 March 2021 and 31 March 2020: From the audited financial
statements of the Company as at and for the year ended 31 March 2021 and 31 March 2020
(being comparative period for the financial statement for the year ended 31 March 2021),
prepared in accordance with the Indian Accounting Standards notified under the section 133
of the Act read with Companies (Indian Accounting Standards) Rules 2015, as amended, and
other accounting principles generally accepted in India, which was approved by the Board of
Directors at their meeting held on 19 July 2021; and
c) As at and for the year ended 31 March 2019: From the audited financial statements of the
Company for the year ended 31 March 2019, prepared in accordance with Accounting
Standards notified under section 133 of the Act (“Indian GAAP”) and other accounting
principles generally accepted in India which was approved by the Board of Directors at their
meeting held on 20 June 2019, after incorporating Ind AS adjustments to align accounting
policies, exemptions and disclosures as adopted by the Company on its first time adoption of
Ind AS, as on the transition date (i.e., 1 April 2019).
The Restated Consolidated Financial Information as at and for the year ended 31 March 2019 are
referred to as “the Proforma Ind AS Restated Consolidated Financial Information” as per the
Guidance Note.
185
INDEPENDENT AUDITOR’S EXAMINATION REPORT ON RESTATED CONSOLIDATED
FINANCIAL INFORMATION (CONTINUED)
5) For the purpose of our examination, we have relied on:
(a) Auditors’ report issued by us dated 11 October 2021, on the Special Purpose Consolidated
Financial Statements of the Group as at and for the three months period ended 30 June 2021 as
referred in Paragraph 4 above; and
(b) Auditors’ report issued by us dated 19 July 2021, on the financial statements of the Company as
at and for the years ended 31 March 2021 and 31 March 2020 (being comparative period for the
financials for the year ended 31 March 2021) as referred in Paragraph 4 above; and
(c) Auditors’ Report issued by us dated 20 June 2019, on the audited Indian GAAP financial
statements of the Company as at and for the year ended 31 March 2019, after incorporating Ind AS
adjustments to align accounting policies, exemptions and disclosures as adopted by the
Company on its first-time adoption of Ind AS, as on the transition date as referred in Paragraph 4
above.
6) Based on our examination and according to the information and explanations given to us, we report
that the Restated Consolidated Financial Information:
i. have been prepared after incorporating adjustments for the changes in accounting policies
and regrouping/ reclassifications retrospectively in the financial years ended 31 March 2021,
31 March 2020 and 31 March 2019 to reflect the same accounting treatment as per the
accounting policies and grouping / classifications followed as at and for the three months
ended 30 June 2021;
ii. have been prepared after incorporating proforma Ind AS adjustments to the audited Indian
GAAP financial statements as at and for the year ended 31 March 2019 as described in Note
44 to the Restated Consolidated Financial Information;
iii. does not contain any qualifications requiring adjustments. However, those qualifications in
the Companies (Auditor’s Report) Order, 2016 issued by the Central Government of India in
terms of sub section (11) of section 143 of the Act, which do not require any corrective
adjustments in the Restated Consolidated Financial Information have been disclosed in
Annexure VI to the Restated Consolidated Financial Information; and
iv. have been prepared in accordance with the Act, the ICDR Regulations and the Guidance
Note.
7) The Restated Consolidated Financial Information do not reflect the effects of events that occurred
subsequent to the respective dates of the reports on the Special Purpose Consolidated Financial
Statements and audited financial statements mentioned in paragraph 4 above.
8) This report should not in any way be construed as a reissuance or re-dating of any of the previous
audit reports issued by us, nor should this report be construed as a new opinion on any of the financial
statements referred to herein.
9) We have no responsibility to update our report for events and circumstances occurring after the date
of the report.
186
INDEPENDENT AUDITOR’S EXAMINATION REPORT ON RESTATED CONSOLIDATED
FINANCIAL INFORMATION (CONTINUED)
10) Our report is intended solely for use of the Board of Directors for inclusion in the RHP and
prospectus to be filed with the SEBI and the Stock Exchanges in connection with the proposed IPO.
Our report should not be used, referred to or distributed for any other purpose except with our prior
consent in writing. Accordingly, we do not accept or assume any liability or any duty of care for any
other purpose or to any other person to whom this report is shown or into whose hands it may come
without our prior consent in writing.
for B S R & Co. LLP
Chartered Accountants
ICAI Firm’s Registration No: 101248W/W-100022
Umang Banka
Partner
Membership No.: 223018
ICAI UDIN: 21223018AAAADA5216
Place: Bengaluru
Date: 11 October 2021
187
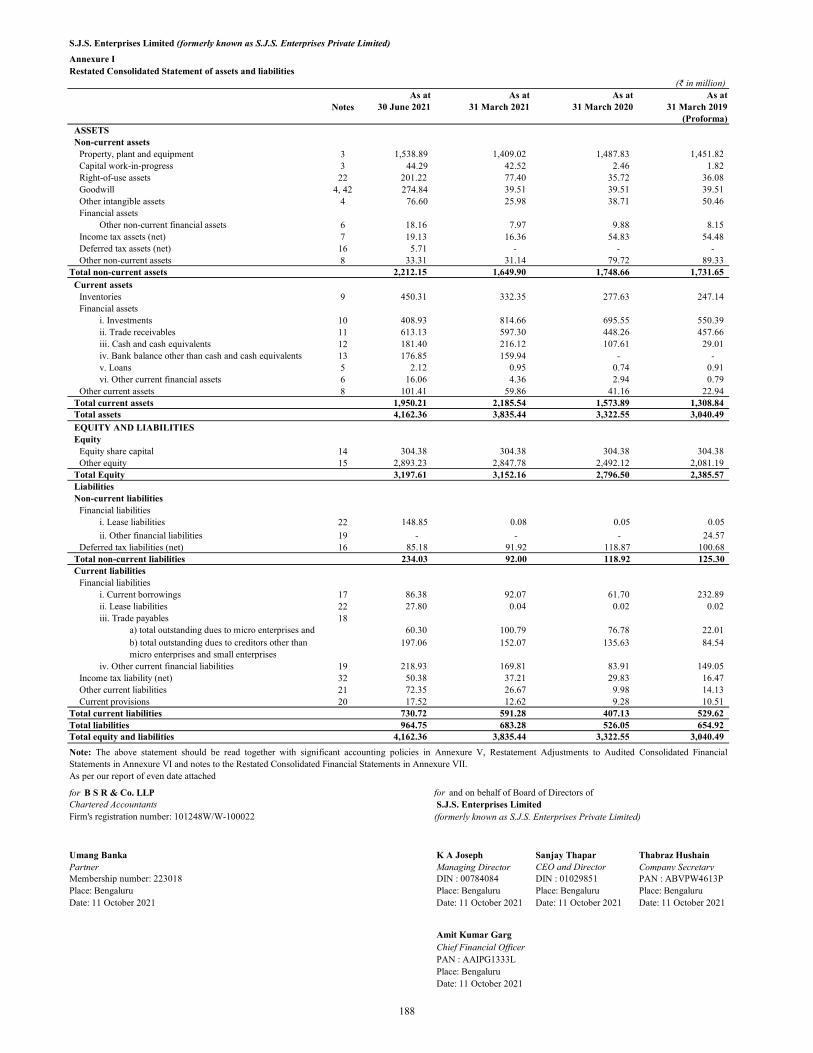
S.J.S. Enterprises Limited (formerly known as S.J.S. Enterprises Private Limited)
Annexure IRestated Consolidated Statement of assets and liabilities
(₹ in million)
Notes (Proforma)
ASSETS Non-current assets
Property, plant and equipment 3 1,538.89 1,409.02 1,487.83 1,451.82 Capital work-in-progress 3 44.29 42.52 2.46 1.82 Right-of-use assets 22 201.22 77.40 35.72 36.08 Goodwill 4, 42 274.84 39.51 39.51 39.51 Other intangible assets 4 76.60 25.98 38.71 50.46 Financial assets
Other non-current financial assets 6 18.16 7.97 9.88 8.15 Income tax assets (net) 7 19.13 16.36 54.83 54.48 Deferred tax assets (net) 16 5.71 - - - Other non-current assets 8 33.31 31.14 79.72 89.33
Total non-current assets 2,212.15 1,649.90 1,748.66 1,731.65 Current assets
Inventories 9 450.31 332.35 277.63 247.14 Financial assets
i. Investments 10 408.93 814.66 695.55 550.39 ii. Trade receivables 11 613.13 597.30 448.26 457.66 iii. Cash and cash equivalents 12 181.40 216.12 107.61 29.01 iv. Bank balance other than cash and cash equivalents 13 176.85 159.94 - - v. Loans 5 2.12 0.95 0.74 0.91 vi. Other current financial assets 6 16.06 4.36 2.94 0.79
Other current assets 8 101.41 59.86 41.16 22.94 Total current assets 1,950.21 2,185.54 1,573.89 1,308.84 Total assets 4,162.36 3,835.44 3,322.55 3,040.49
EQUITY AND LIABILITIES Equity
Equity share capital 14 304.38 304.38 304.38 304.38 Other equity 15 2,893.23 2,847.78 2,492.12 2,081.19
Total Equity 3,197.61 3,152.16 2,796.50 2,385.57 Liabilities Non-current liabilities
Financial liabilitiesi. Lease liabilities 22 148.85 0.08 0.05 0.05 Non-current provisions - - - ii. Other financial liabilities 19 - - - 24.57
Deferred tax liabilities (net) 16 85.18 91.92 118.87 100.68 Total non-current liabilities 234.03 92.00 118.92 125.30 Current liabilities
Financial liabilitiesi. Current borrowings 17 86.38 92.07 61.70 232.89 ii. Lease liabilities 22 27.80 0.04 0.02 0.02 iii. Trade payables 18
a) total outstanding dues to micro enterprises and 60.30 100.79 76.78 22.01 b) total outstanding dues to creditors other than micro enterprises and small enterprises
197.06 152.07 135.63 84.54
iv. Other current financial liabilities 19 218.93 169.81 83.91 149.05 Income tax liability (net) 32 50.38 37.21 29.83 16.47 Other current liabilities 21 72.35 26.67 9.98 14.13 Current provisions 20 17.52 12.62 9.28 10.51
Total current liabilities 730.72 591.28 407.13 529.62 Total liabilities 964.75 683.28 526.05 654.92 Total equity and liabilities 4,162.36 3,835.44 3,322.55 3,040.49
As per our report of even date attached
for B S R & Co. LLP for and on behalf of Board of Directors of Chartered Accountants S.J.S. Enterprises LimitedFirm's registration number: 101248W/W-100022 (formerly known as S.J.S. Enterprises Private Limited)
Umang Banka K A Joseph Sanjay Thapar Thabraz HushainPartner Managing Director CEO and Director Company SecretaryMembership number: 223018 DIN : 00784084 DIN : 01029851 PAN : ABVPW4613PPlace: Bengaluru Place: Bengaluru Place: Bengaluru Place: BengaluruDate: 11 October 2021 Date: 11 October 2021 Date: 11 October 2021 Date: 11 October 2021
Amit Kumar GargChief Financial Officer PAN : AAIPG1333LPlace: BengaluruDate: 11 October 2021
Note: The above statement should be read together with significant accounting policies in Annexure V, Restatement Adjustments to Audited Consolidated FinancialStatements in Annexure VI and notes to the Restated Consolidated Financial Statements in Annexure VII.
As at31 March 2021
As at31 March 2020
As at31 March 2019
As at30 June 2021
188
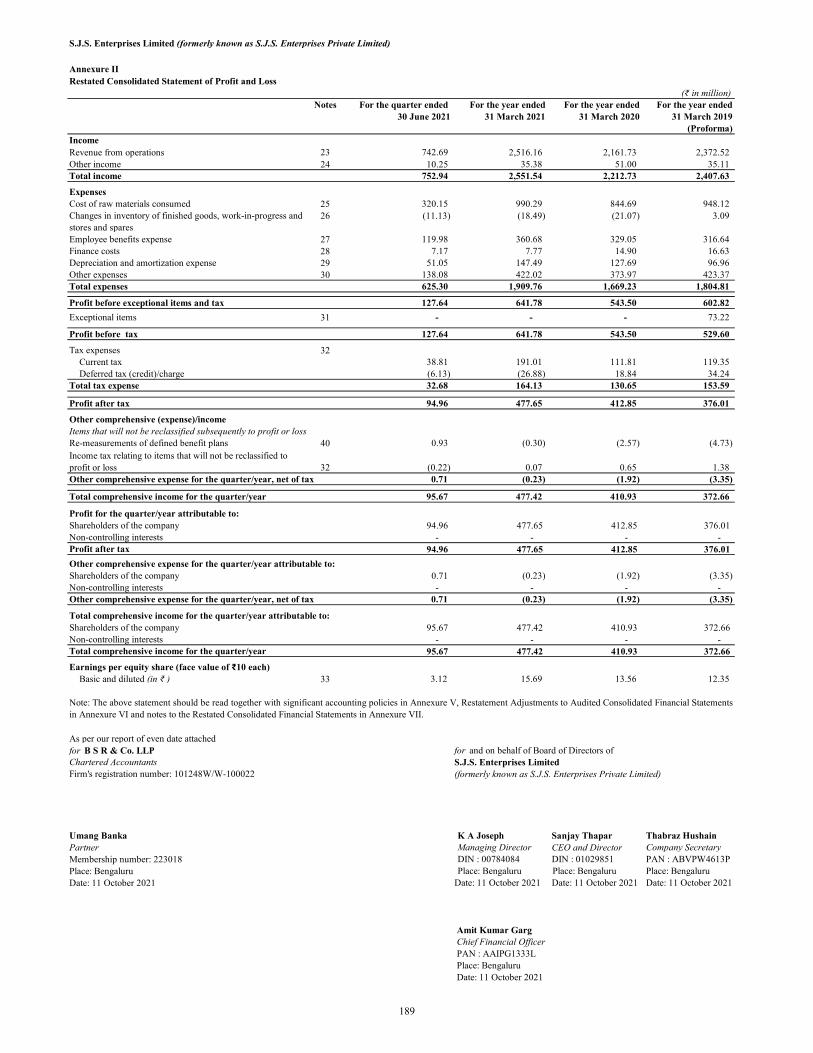
S.J.S. Enterprises Limited (formerly known as S.J.S. Enterprises Private Limited)
Annexure IIRestated Consolidated Statement of Profit and Loss
(₹ in million)Notes For the quarter ended For the year ended For the year ended For the year ended
30 June 2021 31 March 2021 31 March 2020 31 March 2019(Proforma)
IncomeRevenue from operations 23 742.69 2,516.16 2,161.73 2,372.52 Other income 24 10.25 35.38 51.00 35.11 Total income 752.94 2,551.54 2,212.73 2,407.63
ExpensesCost of raw materials consumed 25 320.15 990.29 844.69 948.12 Changes in inventory of finished goods, work-in-progress and stores and spares
26 (11.13) (18.49) (21.07) 3.09
Employee benefits expense 27 119.98 360.68 329.05 316.64 Finance costs 28 7.17 7.77 14.90 16.63 Depreciation and amortization expense 29 51.05 147.49 127.69 96.96 Other expenses 30 138.08 422.02 373.97 423.37 Total expenses 625.30 1,909.76 1,669.23 1,804.81
Profit before exceptional items and tax 127.64 641.78 543.50 602.82
Exceptional items 31 - - - 73.22
Profit before tax 127.64 641.78 543.50 529.60
Tax expenses 32Current tax 38.81 191.01 111.81 119.35 Deferred tax (credit)/charge (6.13) (26.88) 18.84 34.24
Total tax expense 32.68 164.13 130.65 153.59
Profit after tax 94.96 477.65 412.85 376.01
Other comprehensive (expense)/incomeItems that will not be reclassified subsequently to profit or lossRe-measurements of defined benefit plans 40 0.93 (0.30) (2.57) (4.73) Income tax relating to items that will not be reclassified to profit or loss 32 (0.22) 0.07 0.65 1.38 Other comprehensive expense for the quarter/year, net of tax 0.71 (0.23) (1.92) (3.35)
Total comprehensive income for the quarter/year 95.67 477.42 410.93 372.66
Profit for the quarter/year attributable to:Shareholders of the company 94.96 477.65 412.85 376.01 Non-controlling interests - - - - Profit after tax 94.96 477.65 412.85 376.01
Other comprehensive expense for the quarter/year attributable to: Shareholders of the company 0.71 (0.23) (1.92) (3.35) Non-controlling interests - - - - Other comprehensive expense for the quarter/year, net of tax 0.71 (0.23) (1.92) (3.35)
Total comprehensive income for the quarter/year attributable to:Shareholders of the company 95.67 477.42 410.93 372.66 Non-controlling interests - - - - Total comprehensive income for the quarter/year 95.67 477.42 410.93 372.66
Earnings per equity share (face value of ₹10 each)Basic and diluted (in ₹ ) 33 3.12 15.69 13.56 12.35
As per our report of even date attachedfor B S R & Co. LLP for and on behalf of Board of Directors of Chartered Accountants S.J.S. Enterprises LimitedFirm's registration number: 101248W/W-100022 (formerly known as S.J.S. Enterprises Private Limited)
Umang Banka K A Joseph Sanjay Thapar Thabraz HushainPartner Managing Director CEO and Director Company SecretaryMembership number: 223018 DIN : 00784084 DIN : 01029851 PAN : ABVPW4613PPlace: Bengaluru Place: Bengaluru Place: Bengaluru Place: BengaluruDate: 11 October 2021 Date: 11 October 2021 Date: 11 October 2021 Date: 11 October 2021
Amit Kumar GargChief Financial Officer PAN : AAIPG1333LPlace: BengaluruDate: 11 October 2021
Note: The above statement should be read together with significant accounting policies in Annexure V, Restatement Adjustments to Audited Consolidated Financial Statementsin Annexure VI and notes to the Restated Consolidated Financial Statements in Annexure VII.
189

S.J.S. Enterprises Limited (formerly known as S.J.S. Enterprises Private Limited)
Annexure III `Restated Consolidated Statement of Cash Flows
(₹ in million)For the quarter ended For the year ended For the year ended For the year ended
30 June 2021 31 March 2021 31 March 2020 31 March 2019(Proforma)
Cash flow from operating activitiesProfit before tax 127.64 641.78 543.50 529.60 Adjustments:Depreciation and amortization expense 51.05 147.49 127.69 96.96 Loss on sale and write off of property, plant and equipment, net - 10.30 1.32 2.83 Dividend income - - (30.05) (24.42) Interest income (2.98) (7.05) (0.64) (0.20) Interest expense 7.17 7.77 14.90 16.63 Unrealised foreign exchange gain, net (2.34) (0.49) (8.16) 1.10 Changes in fair value of financials assets (1.95) (9.43) (0.75) (0.08) (Gain)/loss on sale of investments measured at FVTPL (1.28) (18.08) (0.79) 0.70 Loss allowances on financial assets, net (0.75) (3.95) 4.13 0.42 Provision for doubtful advances and receivables - 7.84 - - Bad debt written off 0.16 1.58 1.49 2.49 Liabilities no longer required, written back - (0.28) (3.27) (2.09) Operating cash flow before working capital changes 176.72 777.48 649.37 623.94
Changes in operating assets and Changes in trade receivables 201.44 (144.77) 8.47 22.99 Changes in inventories (5.46) (54.72) (30.49) (1.98) Changes in loans (0.62) (0.21) 0.17 (0.50) Changes in non-financial assets (11.05) (16.89) (23.93) 0.08 Changes in financial assets (3.29) 3.45 (3.87) 1.71 Changes in trade payables (143.25) 39.77 111.11 (104.02) Changes in financial liabilities 41.37 101.22 (23.09) (0.56) Changes in provisions 2.00 3.34 (1.23) (2.22) Changes in other non-financial liabilities (1.24) 16.69 (4.15) 4.82 Cash generated from operations 256.62 725.36 682.36 544.26 Income tax paid, net of refund (36.10) (145.98) (99.69) (185.99) Net cash flows generated from operating activities (A) 220.52 579.38 582.67 358.27
Investing activitiesPurchase of property, plant and equipment and intangible assets (21.66) (99.65) (166.90) (441.39) Proceeds from sale of property, plant and equipment - 2.01 0.04 1.92 Purchase of right to use asset (including changes in capital advance) - (2.39) 5.70 (13.23) Payment of purchase consideration - (25.00) (50.00) (25.00) Investment in mutual funds (394.98) (1,735.53) (692.79) (377.37) Proceeds from sale of mutual funds 803.95 1,643.91 579.22 410.59 Investment in term deposits (163.24) (224.56) - - Maturity of term deposits 159.93 64.62 - 0.43 Interest received on deposits 4.56 2.10 0.63 0.18 Acquisition of subsidiary (refer note 42) (640.00) - - Net cash flows used in investing activities (B) (251.44) (374.49) (324.10) (443.87)
Financing activitiesIssue of equity shares - - - 21.90 Repayment of long-term borrowings (2.45) Proceeds/(repayment) of short-term borrowings, net (52.62) 30.37 (171.19) 77.19 Payment of principal and interest portion of lease liabilities (6.95) - - - Dividend paid (50.22) (121.76) - - Interest paid (2.82) (4.54) (10.27) (10.05) Net cash flows (used in)/from financing activities (C) (115.06) (95.93) (181.46) 89.04
Net increase in cash and cash equivalents (A+ B+ C) (145.98) 108.96 77.11 3.44 Effects of exchange gain on cash and cash equivalents 0.03 (0.45) 1.49 -
216.12 107.61 29.01 25.57
Cash Acquired as part of business combination ( Refer Note 42) 111.23 - - - Cash and cash equivalents at the end of the quarter/year (refer Note 12) 181.40 216.12 107.61 29.01
Cash and cash equivalents at the beginning of the year ( Refer Note 1 (g) in Annexure V)
190
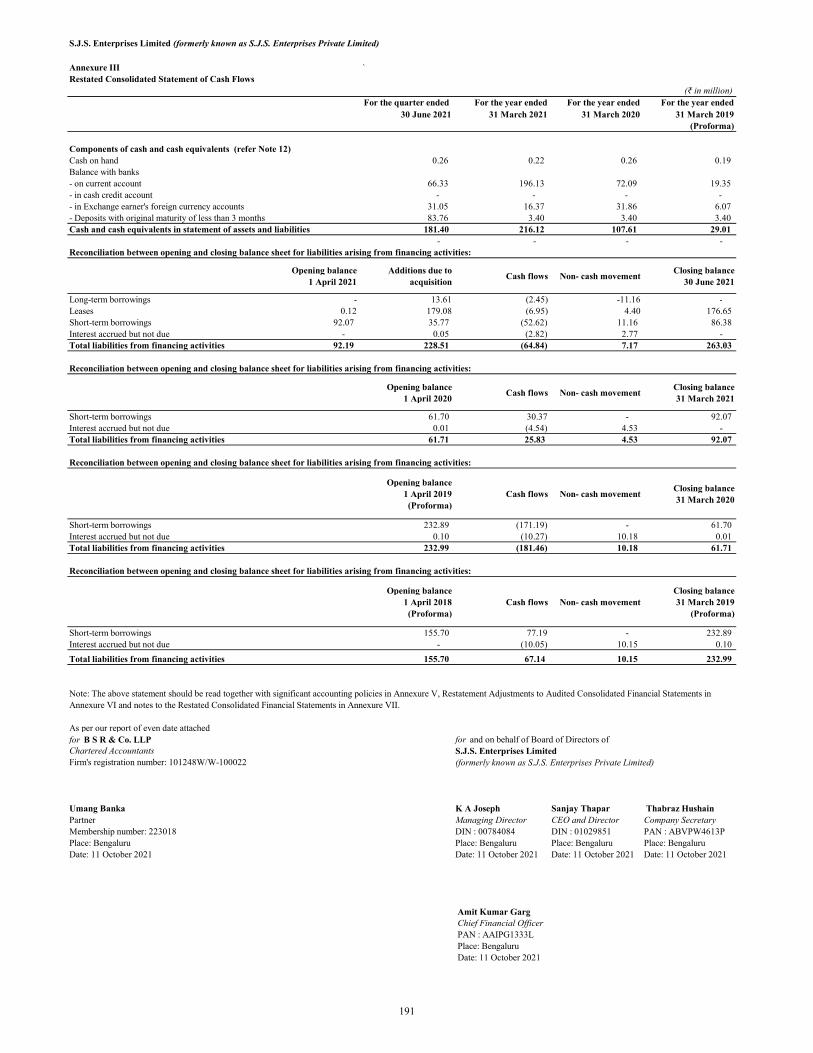
S.J.S. Enterprises Limited (formerly known as S.J.S. Enterprises Private Limited)
Annexure III `Restated Consolidated Statement of Cash Flows
(₹ in million)For the quarter ended For the year ended For the year ended For the year ended
30 June 2021 31 March 2021 31 March 2020 31 March 2019(Proforma)
Components of cash and cash equivalents (refer Note 12)Cash on hand 0.26 0.22 0.26 0.19 Balance with banks- on current account 66.33 196.13 72.09 19.35 - in cash credit account - - - - - in Exchange earner's foreign currency accounts 31.05 16.37 31.86 6.07 - Deposits with original maturity of less than 3 months 83.76 3.40 3.40 3.40 Cash and cash equivalents in statement of assets and liabilities 181.40 216.12 107.61 29.01
- - - - Reconciliation between opening and closing balance sheet for liabilities arising from financing activities:
Opening balance 1 April 2021
Additions due to acquisition
Cash flows Non- cash movement Closing balance
30 June 2021
Long-term borrowings - 13.61 (2.45) -11.16 - Leases 0.12 179.08 (6.95) 4.40 176.65 Short-term borrowings 92.07 35.77 (52.62) 11.16 86.38 Interest accrued but not due - 0.05 (2.82) 2.77 - Total liabilities from financing activities 92.19 228.51 (64.84) 7.17 263.03
Reconciliation between opening and closing balance sheet for liabilities arising from financing activities:
Opening balance 1 April 2020
Cash flows Non- cash movement Closing balance
31 March 2021
Short-term borrowings 61.70 30.37 - 92.07 Interest accrued but not due 0.01 (4.54) 4.53 - Total liabilities from financing activities 61.71 25.83 4.53 92.07
Reconciliation between opening and closing balance sheet for liabilities arising from financing activities:
Opening balance 1 April 2019 (Proforma)
Cash flows Non- cash movement Closing balance
31 March 2020
Short-term borrowings 232.89 (171.19) - 61.70 Interest accrued but not due 0.10 (10.27) 10.18 0.01 Total liabilities from financing activities 232.99 (181.46) 10.18 61.71
Reconciliation between opening and closing balance sheet for liabilities arising from financing activities:
Opening balance 1 April 2018 (Proforma)
Cash flows Non- cash movement Closing balance
31 March 2019 (Proforma)
Short-term borrowings 155.70 77.19 - 232.89 Interest accrued but not due - (10.05) 10.15 0.10
Total liabilities from financing activities 155.70 67.14 10.15 232.99
As per our report of even date attachedfor B S R & Co. LLP for and on behalf of Board of Directors of Chartered Accountants S.J.S. Enterprises LimitedFirm's registration number: 101248W/W-100022 (formerly known as S.J.S. Enterprises Private Limited)
Umang Banka K A Joseph Sanjay Thapar Thabraz HushainPartner Managing Director CEO and Director Company SecretaryMembership number: 223018 DIN : 00784084 DIN : 01029851 PAN : ABVPW4613PPlace: Bengaluru Place: Bengaluru Place: Bengaluru Place: BengaluruDate: 11 October 2021 Date: 11 October 2021 Date: 11 October 2021 Date: 11 October 2021
Amit Kumar GargChief Financial Officer PAN : AAIPG1333LPlace: BengaluruDate: 11 October 2021
Note: The above statement should be read together with significant accounting policies in Annexure V, Restatement Adjustments to Audited Consolidated Financial Statements in Annexure VI and notes to the Restated Consolidated Financial Statements in Annexure VII.
191
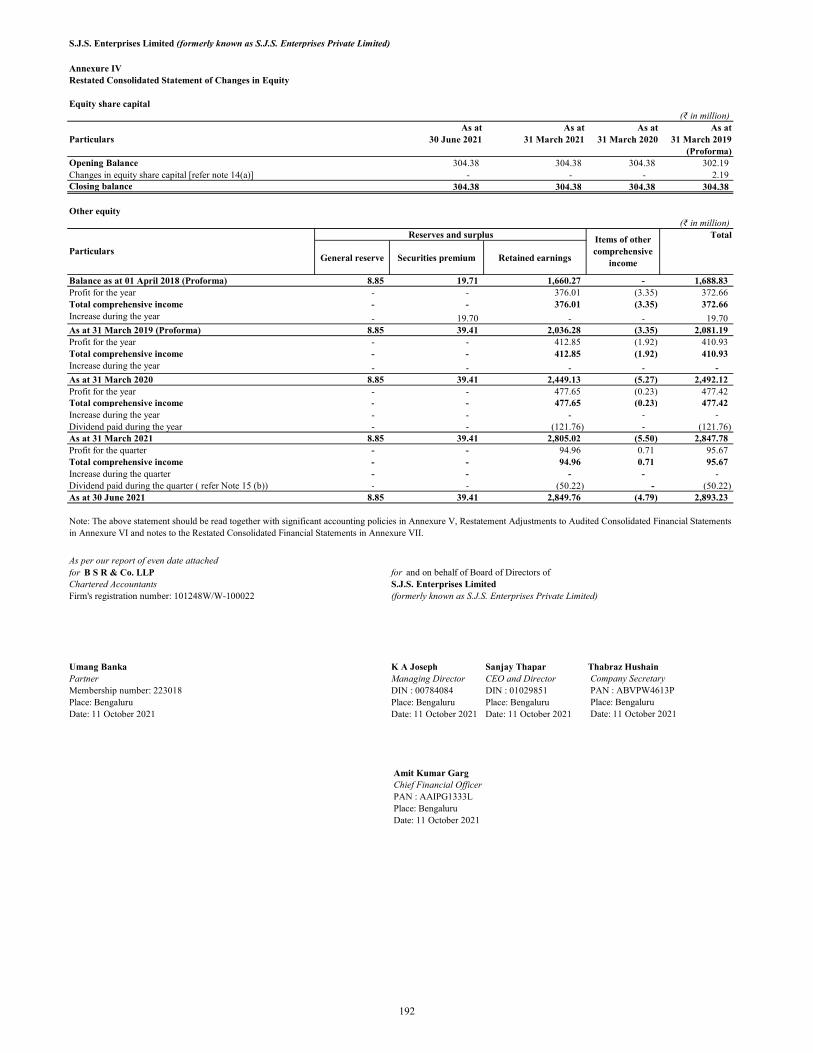
S.J.S. Enterprises Limited (formerly known as S.J.S. Enterprises Private Limited)
Annexure IVRestated Consolidated Statement of Changes in Equity
Equity share capital(₹ in million)
ParticularsAs at
30 June 2021As at
31 March 2021As at
31 March 2020As at
31 March 2019 (Proforma)
Opening Balance 304.38 304.38 304.38 302.19 Changes in equity share capital [refer note 14(a)] - - - 2.19 Closing balance 304.38 304.38 304.38 304.38
Other equity(₹ in million)
Reserves and surplus
General reserve Securities premium Retained earnings
Balance as at 01 April 2018 (Proforma) 8.85 19.71 1,660.27 - 1,688.83 Profit for the year - - 376.01 (3.35) 372.66 Total comprehensive income - - 376.01 (3.35) 372.66
- 19.70 - - 19.70 As at 31 March 2019 (Proforma) 8.85 39.41 2,036.28 (3.35) 2,081.19 Profit for the year - - 412.85 (1.92) 410.93 Total comprehensive income - - 412.85 (1.92) 410.93
- - - - - As at 31 March 2020 8.85 39.41 2,449.13 (5.27) 2,492.12 Profit for the year - - 477.65 (0.23) 477.42 Total comprehensive income - - 477.65 (0.23) 477.42
- - - - - Dividend paid during the year - - (121.76) - (121.76) As at 31 March 2021 8.85 39.41 2,805.02 (5.50) 2,847.78 Profit for the quarter - - 94.96 0.71 95.67 Total comprehensive income - - 94.96 0.71 95.67
- - - - - - - (50.22) - (50.22)
As at 30 June 2021 8.85 39.41 2,849.76 (4.79) 2,893.23
As per our report of even date attachedfor B S R & Co. LLP for and on behalf of Board of Directors of Chartered Accountants S.J.S. Enterprises LimitedFirm's registration number: 101248W/W-100022 (formerly known as S.J.S. Enterprises Private Limited)
Umang Banka K A Joseph Sanjay Thapar Thabraz HushainPartner Managing Director CEO and Director Company SecretaryMembership number: 223018 DIN : 00784084 DIN : 01029851 PAN : ABVPW4613PPlace: Bengaluru Place: Bengaluru Place: Bengaluru Place: BengaluruDate: 11 October 2021 Date: 11 October 2021 Date: 11 October 2021 Date: 11 October 2021
Amit Kumar GargChief Financial Officer PAN : AAIPG1333LPlace: BengaluruDate: 11 October 2021
Note: The above statement should be read together with significant accounting policies in Annexure V, Restatement Adjustments to Audited Consolidated Financial Statementsin Annexure VI and notes to the Restated Consolidated Financial Statements in Annexure VII.
Increase during the year
Total
Particulars
Increase during the year
Items of other comprehensive
income
Increase during the year
Increase during the quarterDividend paid during the quarter ( refer Note 15 (b))
192
S.J.S. Enterprises Limited (formerly known as S.J.S. Enterprises Private Limited)
Annexure V
Significant accounting policies
1) Company overview
S.J.S Enterprises Limited (formerly S.J.S Enterprises Private Limited) (“S.J.S” or the “Company” or the “Parent Company”) together with
its subsidiary (collectively the “Group”) is engaged in the business of manufacturing of decorative aesthetic products primarily for
automotive, consumer durables and consumer appliance industry such as automotive dials, overlays, badges and logos, spare parts,
assemblies, accessories of plastic and other materials.
The Company is incorporated and domiciled in India. The Company was formed as a partnership firm in 1987 and was converted to private
limited company in 2005. The Company has changed its name to S.J.S. Enterprises Limited based on an approval from Registrar of
Companies, Bangalore Karnataka and accordingly it has become a public limited company.
The registered office of the Company is in Kengeri, Bengaluru, Karnataka, India.
The Parent Company acquired its subsidiary Exotech Plastics Private Limited with effect from 05 April, 2021 and is preparing consolidated
financial statements for the first time.
a) Statement of Compliance
The Restated Consolidated Financial Statements of the Group have been prepared for inclusion in the Red Herring Prospectus (‘RHP’)
and Prospectus (together called as “offer document”) to be filed by the Company with the Securities and Exchange Board of India
(“SEBI”) in connection with the proposed Initial Public Offering ('IPO') of equity shares of the Company comprising an offer for sale
of the shares by certain shareholders of the Company (referred to as the "Issue"). The Restated Consolidated Financial Statements
comprise of the restated consolidated statement of assets and liabilities as at 30 June 2021, 31 March 2021, 31 March 2020 and 31
March 2019 (Proforma), the restated consolidated statement of profit and loss, the restated consolidated statement of cash flows and
the restated statement of changes in equity for the quarter/years ended 30 June 2021, 31 March 2021, 31 March 2020 and 31 March
2019 (Proforma) and Annexure V to VII thereto (hereinafter collectively referred to as “the Restated Consolidated Financial
Statements”).
The Restated Consolidated Financial Statements have been prepared to comply in all material respects with the requirements of
Section 26 of Part I of Chapter III of the Companies Act, 2013 (“the Act”) read with Rules 4 to 6 of Companies (Prospectus and
Allotment of Securities) Rules, 2014 (“the Rules’) and the Securities and Exchange Board of India (Issue of Capital and Disclosure
Requirements) Regulations, 2009, as amended from time to time (“SEBI ICDR Regulations”).
The Group's Restated Consolidated Financial Statements for the quarter ended June 30, 2021 were approved by Board of Directors of
the Company in their meeting held on 11 October 2021.
b) Basis of preparation
The Restated Consolidated Financial Statements of the Group have been prepared and presented as follows:
a. The Restated Consolidated Financial Statements as at and for the quarter ended 30 June 2021 has been complied by the
Management from the audited consolidated financial statements of the Group as at and for the quarter ended 30 June 2021,
prepared in accordance with Indian Accounting Standards (Ind AS) as prescribed under Section 133 of Companies Act, 2013
read with Companies (Indian Accounting Standards) Rules 2015, subsequent amendments thereof and other relevant provisions
of the Act. The Company has acquired a subsidiary, Exotech Plastics Private Limited, India (‘the Subsidiary’) effective 5 April
2021. With the acquisition of the Subsidiary, the Company has prepared Restated Consolidated financial statements for the first
time for the period ended 30 June 2021. Accordingly, comparative numbers are standalone numbers of the Company and hence
are not strictly comparable.
b. The Restated Consolidated Financial Statements as at and for the years ended 31 March 2021 and 31 March 2020 have been
compiled by the Management from the audited financial statements of the Company as at and for the year ended 31 March 2021
which include the comparative Ind AS financial statements as at and for the year ended 31 March 2020 prepared in accordance
with Indian Accounting Standards (Ind AS) as prescribed under Section 133 of Companies Act, 2013 read with Companies
(Indian Accounting Standards) Rules 2015, subsequent amendments thereof and other relevant provisions of the Act; and
The Proforma Restated Consolidated Financial Statements as at and for the year ended 31 March 2019 have been compiled by the
Management from the audited financial statements of the Company as at and for the year ended 31 March 2019 prepared in accordance
with Accounting Standards (Previous GAAP) as prescribed under Section 133 of the Companies Act, 2013 read with Rule 7 of the
Companies (Accounts) Rules, 2014 and the relevant provisions of the Act. These Proforma Restated Consolidated Financial Statements
have been prepared by making Ind AS adjustments to the audited Previous GAAP financial statements as at and for the year ended 31
March 2019 in accordance with the provisions of SEBI Circular SEBI/HO/ CFD/DIL/CIR/P/2016/47 (“SEBI Ind AS Circular”) dated 31
March 2016 and Guidance Note on Reports in Company Prospectuses (Revised 2016) (“Guidance Note”).
193
S.J.S. Enterprises Limited (formerly known as S.J.S. Enterprises Private Limited)
Annexure V
Significant accounting policies (Continued)
In accordance with Ind AS 101 First-time Adoption of Indian Accounting Standard, the Company has presented a reconciliation from the
presentation of financial statements prepared in accordance with Previous GAAP to Ind AS for Shareholders’ Fund as at 31 March 2020
and 01 April 2019 and of the profit for the year ended 31 March 2020. Further, the Company has also presented a reconciliation of
proforma adjustment from previous GAAP to Ind AS for shareholders fund as at 01 April 2018 and of profit for the year ended 31 March
2019 for the purpose of preparation of Proforma Restated Financial Statements as at and for the year ended 31 March 2019.
The Restated Consolidated Financial Statements for the year ended 31 March 2021 are Company's first Ind AS financial statements. Refer
note 44 in Annexure VII for explanatory notes to ‘First time adoption of Ind AS’, details of first-time adoption exemptions availed by the
Company and statement of reconciliation between the Previous GAAP and Ind AS.
The Company has followed the same accounting policy choices (both mandatory exceptions and optional exemptions availed as per Ind
AS 101) as initially adopted on its Ind AS transition date (i.e. 01 April 2019) while preparing the Proforma Restated Consolidated Financial
Statements as at and for the year ended 31 March 2019 (Proforma) and accordingly suitable restatement adjustments in the accounting
heads has been made in the Proforma Restated Consolidated financial Statements.
The Restated Consolidated Financial Statements have been prepared on a historical cost convention, except for certain financial assets
and liabilities that have been measured at fair value (refer accounting policy regarding financial instruments).
The Restated Consolidated Financial Statements have been prepared so as to contain information/disclosures and incorporating
adjustments set out below in accordance with the SEBI ICDR Regulations:
a) Adjustments for audit qualification requiring corrective adjustment in the Restated Consolidated Financial Statements, if any;
b) Adjustments for the material amounts in respective years to which they relate, if any;
c) Adjustments for previous years identified and adjusted in arriving at the profits or losses of the years to which they relate
irrespective of the year in which the event triggering the profit or loss occurred, if any;
d) Adjustments to the profits or losses of the earlier years and of the year in which the change in the accounting policy has taken
place is recomputed to reflect what the profits or losses of those years would have been if a uniform accounting policy was
followed in each of these years, if any;
e) Adjustments for reclassification of the corresponding items of income, expenses, assets and liabilities, in order to bring them
in line with the groupings as per the audited financial statements of the Company for the year ended 31 March 2019 (Proforma)
and the requirements of the SEBI ICDR Regulations, if any;
f) The resultant tax impact due to the aforesaid adjustments, if any.
The accounting policies set out below have been applied consistently to the periods presented in the Restated Consolidated Financial
Statements.
These Restated Consolidated Financial Statements have been prepared as a going concern on the basis of relevant Ind AS that are effective
at the Group’s reporting date, 30 June 2021.
c) Functional currency and presentation
These Restated Consolidated Financial Statements are presented in Indian Rupees (INR), which is also the Group’s functional
currency. All amounts have been rounded-off to the nearest millions up to two decimal places, unless otherwise mentioned.
d) Use of estimates, assumptions and judgements
The preparation of Restated Consolidated Financial Statements in conformity with Ind AS requires management to make judgements,
estimates and assumptions that affect the application of accounting policies and the reported amounts of assets, liabilities, the
disclosure of contingent liabilities on the date of the Restated Consolidated Financial Statements and the reported amount of income
and expenses for the year reported. Actual results may differ from these estimates.
The estimates and underlying assumptions are reviewed on an ongoing basis. They are based on historical experience and other factors
that are believed to be reasonable under the circumstance. Revisions to accounting estimates are recognised in the year in which the
estimates are revised, and future periods are affected.
Assumptions, judgements and estimation:
Information about assumptions and estimation uncertainties that have a significant risk of resulting in a material adjustment in the
amounts recognised in the Restated Consolidated Financial Statements is included in the following notes:
- Note 2 (m) - Lease classification;
- Note 2 (c) and Note 2 (d)- Useful life of property, plant and equipment and intangible assets;
194
S.J.S. Enterprises Limited (formerly known as S.J.S. Enterprises Private Limited)
Annexure V
Significant accounting policies (Continued)
Use of estimates, assumptions and judgements (continued)
- Note 2 (g) - Impairment of financial assets
- Note 2 (k) - Measurement of defined benefit obligations: key actuarial assumptions.
- Note 2 (o) - Recognition and measurement of provisions and contingencies: key assumptions about the likelihood and magnitude of
an outflow of resources
- Note 2 (b)- Business Combination
Impact of COVID-19 (Global Pandemic)
In March 2020, the World Health Organization declared COVID-19 to be a Pandemic. The Group adopted measures to curb the spread
of infection in order to protect the health of its employees and ensure business continuity with minimal disruption including remote
working, maintaining social distancing, sanitization of work spaces etc . The Group has evaluated the possible effects that may result
from the pandemic relating to COVID-19 on the carrying amounts of its assets and liabilities and its internal financial controls. The
Group has considered internal and external sources of information as of the date of approval of these Restated Consolidated Financial
Statements in determining the possible impact, if any, of the resurgence of the COVID-19 pandemic on the carrying amounts of its
trade receivables, inventories, financial and non-financial assets. The Group has used the principle of prudence in applying judgements
and making estimates. Based on this evaluation, the Group does not expect any material impact on its restated financial statement.
However, the eventual outcome of impact of COVID-19 pandemic may be different from those estimated as on the date of approval
of these Restated Consolidated Financial Statements, as the COVID-19 situation evolves in India and Globally. The Group will
continue to closely monitor any material changes to future economic conditions and consequential impact on its Restated Consolidated
Financial Statements.
e) Current and non-current classification
The Group presents assets and liabilities in the balance sheet based on current/ non-current classification.
An asset is treated as current when it is:
Expected to be realized or intended to be sold or consumed in normal operating cycle
Held primarily for the purpose of trading
Expected to be realized within twelve months after the reporting period, or
Cash or cash equivalent unless restricted from being exchanged or used to settle a liability for at least twelve months after the
reporting period
All other assets are classified as non-current.
A liability is treated as current when:
It is expected to be settled in normal operating cycle,
It is held primarily for the purpose of trading,
It is due to be settled within twelve months after the reporting period, or
There is no unconditional right to defer the settlement of the liability for at least twelve months after the reporting period.•
All other liabilities are classified as non-current.
Deferred tax assets and liabilities are classified as non-current assets and non-current liabilities.
The operating cycle is the time between the acquisition of assets for processing and their realisation in cash and cash equivalents. The
Group has identified twelve months as its operating cycle.
f) Fair value measurement
Certain accounting policies and disclosures of the Group require the measurement of fair values, for both financial and non-financial
assets and liabilities. The Group has an established control framework with respect to the measurement of fair values. The valuation team regularly reviews
significant unobservable inputs and valuation adjustments. Fair values are categorised into different levels in a fair value hierarchy based on the inputs used in the valuation techniques as follows:
- Level 1: quoted prices (unadjusted) in active markets for identical assets or liabilities.
- Level 2: inputs other than quoted prices included in Level 1 that are observable for the asset or liability, either directly (i.e. as prices)
or indirectly (i.e. derived from prices).
- Level 3: inputs for the asset or liability that are not based on observable market data (unobservable inputs).
When measuring the fair value of an asset or a liability, the Group uses observable market data as far as possible. If the inputs used to
measure the fair value of an asset or a liability fall into different levels of the fair value hierarchy, then the fair value measurement is
195
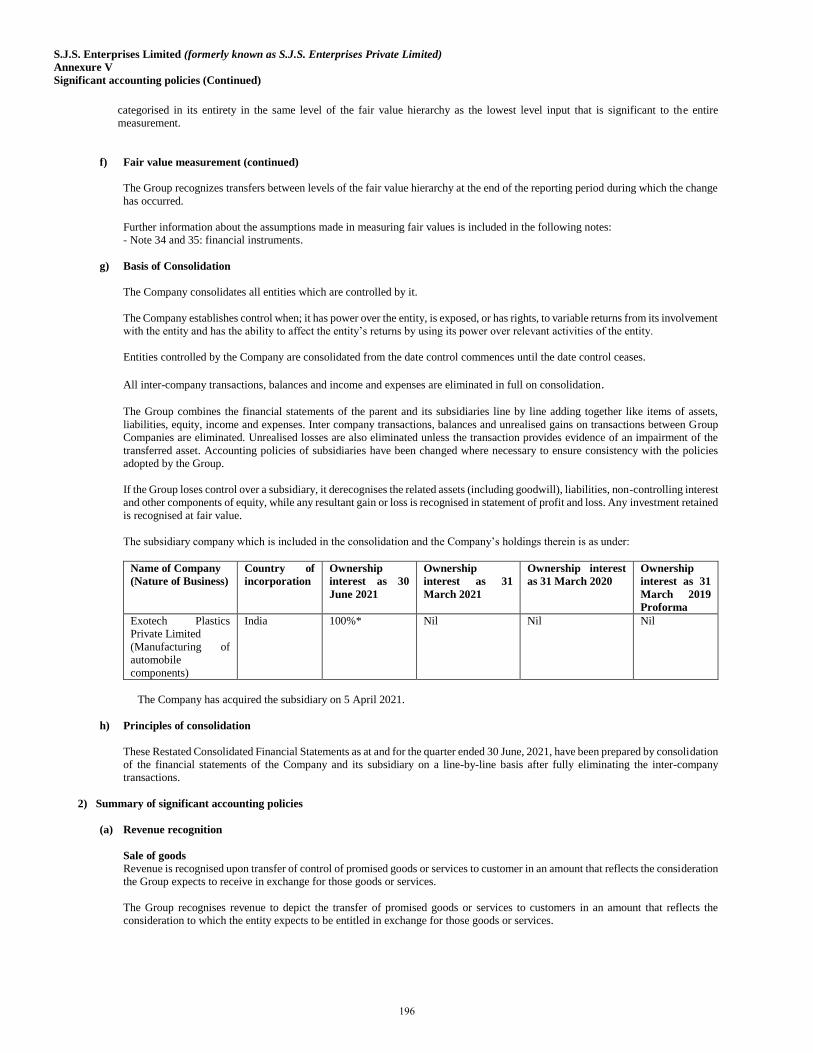
S.J.S. Enterprises Limited (formerly known as S.J.S. Enterprises Private Limited)
Annexure V
Significant accounting policies (Continued)
categorised in its entirety in the same level of the fair value hierarchy as the lowest level input that is significant to the entire
measurement.
f) Fair value measurement (continued)
The Group recognizes transfers between levels of the fair value hierarchy at the end of the reporting period during which the change
has occurred.
Further information about the assumptions made in measuring fair values is included in the following notes:
- Note 34 and 35: financial instruments.
g) Basis of Consolidation
The Company consolidates all entities which are controlled by it.
The Company establishes control when; it has power over the entity, is exposed, or has rights, to variable returns from its involvement
with the entity and has the ability to affect the entity’s returns by using its power over relevant activities of the entity.
Entities controlled by the Company are consolidated from the date control commences until the date control ceases.
All inter-company transactions, balances and income and expenses are eliminated in full on consolidation.
The Group combines the financial statements of the parent and its subsidiaries line by line adding together like items of assets,
liabilities, equity, income and expenses. Inter company transactions, balances and unrealised gains on transactions between Group
Companies are eliminated. Unrealised losses are also eliminated unless the transaction provides evidence of an impairment of the
transferred asset. Accounting policies of subsidiaries have been changed where necessary to ensure consistency with the policies
adopted by the Group.
If the Group loses control over a subsidiary, it derecognises the related assets (including goodwill), liabilities, non-controlling interest
and other components of equity, while any resultant gain or loss is recognised in statement of profit and loss. Any investment retained
is recognised at fair value.
The subsidiary company which is included in the consolidation and the Company’s holdings therein is as under:
Name of Company
(Nature of Business)
Country of
incorporation
Ownership
interest as 30
June 2021
Ownership
interest as 31
March 2021
Ownership interest
as 31 March 2020
Ownership
interest as 31
March 2019
Proforma
Exotech Plastics
Private Limited
(Manufacturing of
automobile
components)
India 100%* Nil Nil Nil
The Company has acquired the subsidiary on 5 April 2021.
h) Principles of consolidation
These Restated Consolidated Financial Statements as at and for the quarter ended 30 June, 2021, have been prepared by consolidation
of the financial statements of the Company and its subsidiary on a line-by-line basis after fully eliminating the inter-company
transactions.
2) Summary of significant accounting policies
(a) Revenue recognition
Sale of goods
Revenue is recognised upon transfer of control of promised goods or services to customer in an amount that reflects the consideration
the Group expects to receive in exchange for those goods or services.
The Group recognises revenue to depict the transfer of promised goods or services to customers in an amount that reflects the
consideration to which the entity expects to be entitled in exchange for those goods or services.
196
S.J.S. Enterprises Limited (formerly known as S.J.S. Enterprises Private Limited)
Annexure V
Significant accounting policies (Continued)
Revenue is measured at fair value of the consideration received or receivable, after deduction of any trade discounts, volume rebates
and any taxes or duties collected on behalf of the government which are levied on sales such as goods and services tax, etc. For
certain contracts that permits the customer to return an item, revenue is recognised to the extent that it is probable that a significant
reversal in the amount of cumulative revenue recognised will not occur and is reassessed at the end of each reporting period.
Revenue from sale of products is recognised at the point in time when control is transferred to customer.
Costs that relate directly to a contract and incurred in securing a contract are recognized as an asset and amortized over the contract
term as reduction in revenue
Further, revenue from sale of goods is recognized based on a 5-Step Methodology which is as follows:
Step 1: Identify the contract(s) with a customer
Step 2: Identify the performance obligation in contract
Step 3: Determine the transaction price
Step 4: Allocate the transaction price to the performance obligations in the contract
Step 5: Recognise revenue when (or as) the entity satisfies a performance obligation
Contracts are subject to modification to account for changes in contract specification and requirements. The Group reviews
modification to contract in conjunction with the original contract, basis which the transaction price could be allocated to a new
performance obligation, or transaction price of an existing obligation could undergo a change. In the event transaction price is revised
for existing obligation, a cumulative adjustment is accounted for.
Scrap sales
Revenue from sale of scraps in the course of ordinary activities is measured at the fair value of the consideration received or
receivable.
Contract balances
Trade receivables
A trade receivable is recognised if the amount of consideration is unconditional (i.e., only the passage of time is required before
payment of the consideration is due). Refer to accounting policies of financial assets in section - Financial instruments – initial
recognition and subsequent measurement.
Unbilled revenue / Contract assets
Unbilled revenue / Contract assets are recognised when there is excess of revenue earned over billings on contracts. Contract assets
are classified as unbilled receivables (only act of invoicing is pending) when there is unconditional right to receive cash, and only
passage of time is required, as per contractual terms.
Unearned or deferred revenue is recognised when there are billings in excess of revenues.
Sale of services
Revenue with respect to sale of services is recognized when the services are rendered, and no significant uncertainty exists regarding
the collection of consideration.
Export incentives
Government incentives are accrued for based on fulfilment of eligibility criteria for availing the incentives and when there is no
uncertainty in receiving the same.
Variable consideration
If the consideration in a contract includes a variable amount, such as sales returns and discounts, the Group estimates the amount of
consideration to which it will be entitled in exchange for transferring the goods to the customer. The variable consideration is
estimated at contract inception and constrained until it is highly probable that a significant revenue reversal in the amount of
cumulative revenue recognised will not occur when the associated uncertainty with the variable consideration is subsequently
resolved.
Other income
Other income comprises interest income on deposits, gain/ (losses) on disposal of financial assets and non-financial assets. It is
recognised on accrual basis except where the receipt of income is uncertain.
Interest income is recognised using the effective interest method. The ‘effective interest rate’ is the rate that exactly discounts the
estimated future cash payments or receipts over the expected life of the financial instrument to:
• The gross carrying amount of the financial asset; or
• The amortised cost of the financial liability.
Dividend income is accounted when the right to receive the dividend is established, Dividend income is included under the head
“Other income” in the statement of profit and loss account.
197
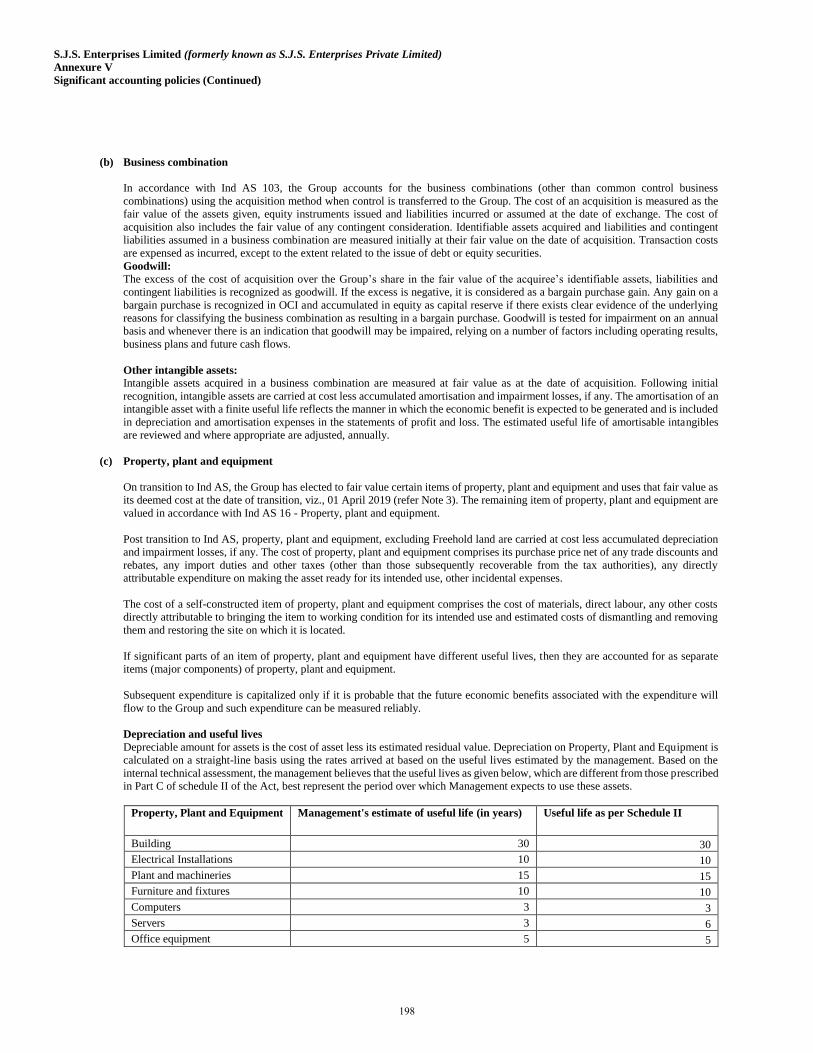
S.J.S. Enterprises Limited (formerly known as S.J.S. Enterprises Private Limited)
Annexure V
Significant accounting policies (Continued)
(b) Business combination
In accordance with Ind AS 103, the Group accounts for the business combinations (other than common control business
combinations) using the acquisition method when control is transferred to the Group. The cost of an acquisition is measured as the
fair value of the assets given, equity instruments issued and liabilities incurred or assumed at the date of exchange. The cost of
acquisition also includes the fair value of any contingent consideration. Identifiable assets acquired and liabilities and contingent
liabilities assumed in a business combination are measured initially at their fair value on the date of acquisition. Transaction costs
are expensed as incurred, except to the extent related to the issue of debt or equity securities.
Goodwill:
The excess of the cost of acquisition over the Group’s share in the fair value of the acquiree’s identifiable assets, liabilities and
contingent liabilities is recognized as goodwill. If the excess is negative, it is considered as a bargain purchase gain. Any gain on a
bargain purchase is recognized in OCI and accumulated in equity as capital reserve if there exists clear evidence of the underlying
reasons for classifying the business combination as resulting in a bargain purchase. Goodwill is tested for impairment on an annual
basis and whenever there is an indication that goodwill may be impaired, relying on a number of factors including operating results,
business plans and future cash flows.
Other intangible assets:
Intangible assets acquired in a business combination are measured at fair value as at the date of acquisition. Following initial
recognition, intangible assets are carried at cost less accumulated amortisation and impairment losses, if any. The amortisation of an
intangible asset with a finite useful life reflects the manner in which the economic benefit is expected to be generated and is included
in depreciation and amortisation expenses in the statements of profit and loss. The estimated useful life of amortisable intangibles
are reviewed and where appropriate are adjusted, annually.
(c) Property, plant and equipment
On transition to Ind AS, the Group has elected to fair value certain items of property, plant and equipment and uses that fair value as
its deemed cost at the date of transition, viz., 01 April 2019 (refer Note 3). The remaining item of property, plant and equipment are
valued in accordance with Ind AS 16 - Property, plant and equipment.
Post transition to Ind AS, property, plant and equipment, excluding Freehold land are carried at cost less accumulated depreciation
and impairment losses, if any. The cost of property, plant and equipment comprises its purchase price net of any trade discounts and
rebates, any import duties and other taxes (other than those subsequently recoverable from the tax authorities), any directly
attributable expenditure on making the asset ready for its intended use, other incidental expenses.
The cost of a self-constructed item of property, plant and equipment comprises the cost of materials, direct labour, any other costs
directly attributable to bringing the item to working condition for its intended use and estimated costs of dismantling and removing
them and restoring the site on which it is located.
If significant parts of an item of property, plant and equipment have different useful lives, then they are accounted for as separate
items (major components) of property, plant and equipment.
Subsequent expenditure is capitalized only if it is probable that the future economic benefits associated with the expenditure will
flow to the Group and such expenditure can be measured reliably.
Depreciation and useful lives
Depreciable amount for assets is the cost of asset less its estimated residual value. Depreciation on Property, Plant and Equipment is
calculated on a straight-line basis using the rates arrived at based on the useful lives estimated by the management. Based on the
internal technical assessment, the management believes that the useful lives as given below, which are different from those prescribed
in Part C of schedule II of the Act, best represent the period over which Management expects to use these assets.
Property, Plant and Equipment Management's estimate of useful life (in years) Useful life as per Schedule II
Building 30 30
Electrical Installations 10 10
Plant and machineries 15 15
Furniture and fixtures 10 10
Computers 3 3
Servers 3 6
Office equipment 5 5
198
S.J.S. Enterprises Limited (formerly known as S.J.S. Enterprises Private Limited)
Annexure V
Significant accounting policies (Continued)
Vehicle 8 8
Freehold land is not depreciated. The estimated useful lives, residual values and depreciation method are reviewed at the end of each
reporting period, with the effect of any changes in estimate accounted for on a prospective basis.
(c) Property, plant and equipment (continued)
A property, plant and equipment is eliminated from the Restated Consolidated Financial Statements on disposal or when no further
benefit is expected from its use and disposal. Assets retired from active use and held for disposal are generally stated at the lower of
their net book value and net realizable value. Any gain or losses arising disposal of property, plant and equipment is recognized in
the statement of profit and loss.
Advance paid towards the acquisition of property, plant and equipment outstanding at each balance sheet date classified as capital
advances under other non-current assets and the cost of the assets not put to use before such date are disclosed under Capital work
in progress.
(d) Intangible assets
On transition to Ind AS, the Group has valued intangible assets in accordance with Ind AS 38 - Intangible Assets.
Post transition to Ind AS, intangible assets with finite useful lives that are acquired separately are carried at cost less accumulated
amortisation and accumulated impairment losses. Intangible assets are amortized over their respective individual estimated useful
lives on a straight-line basis, from the date that they are available for use. The estimated useful life of an identifiable intangible asset
is based on a number of factors including the effects of obsolescence, demand, competition, and other economic factors (such as the
stability of the industry, and known technological advances), and the level of maintenance expenditures required to obtain the
expected future cash flows from the asset. Amortization methods and useful lives are reviewed periodically including at each
financial year end.
The useful lives of intangible assets that is considered for amortization of intangible assets are as follows:
Intangible Asset Management's estimate of useful life (in years)
Computer Software 3
Technical Know How 3
Customer Relationship 7
Non-compete 3
An intangible asset is derecognised on disposal, or when no future economic benefits are expected from use or disposal. Gains or
losses arising from derecognition of an intangible asset, measured as the difference between the net disposal proceeds and the
carrying amount of the asset, are recognised in Statement of profit and loss when the asset is derecognised.
(e) Impairment of non-financial asset
Goodwill
Goodwill is tested for impairment on an annual basis and whenever there is an indication that goodwill may be impaired, relying on
a number of factors including operating results, business plans and future cash flows. For the purpose of impairment testing, goodwill
acquired in a business combination is allocated to the Group's cash generating units (CGU) or groups of CGU's expected to benefit
from the synergies arising from the business combination. A CGU is the smallest identifiable group of assets that generates cash
inflows that are largely independent of the cash inflows from other assets or group of assets. Impairment occurs when the carrying
amount of a CGU including the goodwill, exceeds the estimated recoverable amount of the CGU. The recoverable amount of a CGU
is the higher of its fair value less cost to sell and its value-in-use. Value-in-use is the present value of future cash flows expected to
be derived from the CGU. Total impairment loss of a CGU is allocated first to reduce the carrying amount of goodwill allocated to
the CGU and then to the other assets of the CGU pro-rata on the basis of the carrying amount of each asset in the CGU. An impairment
loss on goodwill is recognised in the consolidated statement of profit and loss and is not reversed in the subsequent period.
Intangible assets and property, plant and equipment
Intangible assets and property, plant and equipment are evaluated for recoverability whenever events or changes in circumstances
indicate that their carrying amounts may not be recoverable. For the purpose of impairment testing, the recoverable amount (i.e. the
higher of the fair value less cost to sell and the value in- use) is determined on an individual asset basis unless the asset does not
generate cash flows that are largely independent of those from other assets. In such cases, the recoverable amount is determined for
the CGU to which the asset belongs.
199

S.J.S. Enterprises Limited (formerly known as S.J.S. Enterprises Private Limited)
Annexure V
Significant accounting policies (Continued)
If such assets are considered to be impaired, the impairment to be recognized in the statement of profit and loss is measured by the
amount by which the carrying value of the assets exceeds the estimated recoverable amount of the asset. An impairment loss is
reversed in the statement of profit and loss if there has been a change in the estimates used to determine the recoverable amount.
(e) Impairment of non-financial asset (continued)
The carrying amount of the asset is increased to its revised recoverable amount, provided that this amount does not exceed the
carrying amount that would have been determined (net of any accumulated amortization or depreciation) had no impairment loss
been recognized for the asset in prior years.
(f) Inventories
Inventories are valued at the lower of cost and net realisable value. Cost of inventories comprises purchase price, costs of conversion
and other costs incurred in bringing the inventories to their present location and condition. Net realizable value is the estimated
selling price in the ordinary course of business, less estimated costs to sell. The comparison of cost and net realizable value is made
on an item-by-item basis.
The method of determination of cost is as follows:
• Raw materials and components– on a weighted average basis
• Stores and spares – on a weighted average basis
• Work-in-progress – includes cost of conversion.
• Finished goods– includes cost of conversion.
• Goods in transit – at purchase cost
The net realizable value of work-in-progress is determined with reference to the net realizable value of related finished goods. Raw
materials and other supplies held for use in production of inventories are not written down below cost except in cases where material
prices have declined, and it is estimated that the cost of the finished products will exceed their net realizable value. Fixed production
overheads are allocated on the basis of normal capacity of production facilities. The provision for inventory obsolescence is assessed
periodically and is provided as considered necessary.
(g) Financial Instruments
A. Financial assets
i) Recognition and initial measurement
Trade receivables and debt securities are initially recognized when they are originated. All other financial assets and liabilities are
initially recognized when the Group becomes a party to contractual provisions of the instrument.
All financial instruments are recognised initially at fair value. Transaction costs that are attributable to the acquisition of the financial
asset (other than financial assets recorded at fair value through profit or loss) are included in the fair value of the financial assets.
ii) Classification and subsequent measurement
Financial assets
On initial recognition, a financial instrument is classified and measured at
• Amortised cost
• Fair value through other comprehensive income (FVOCI) - debt instruments;
• Fair value through other comprehensive income (FVOCI) - equity investments; or
• Fair value through profit and loss (FVTPL).
Financial assets are not classified subsequent to their initial recognition, except if and in the period the Group changes its business
model for managing financial assets.
A financial asset is measured at amortised cost if it meets both the following conditions and is not designated as at FVTPL:
• The asset is held within a business model whose objective is to hold assets to collect contractual cash flows; and
• The contractual terms of the financial assets give rise on a specified date to cash flows that are solely payments of principal and
interest on the principal amounts outstanding.
A debt investment is measured at FVTOCI if it meets both of the following conditions and is not designated as at FVTPL:
200
S.J.S. Enterprises Limited (formerly known as S.J.S. Enterprises Private Limited)
Annexure V
Significant accounting policies (Continued)
• The asset is held within a business model whose objective is achieved by both collecting contractual cash flow and selling financial
assets; and
• The contractual terms of the financial assets give rise on a specified date to cash flows that are solely payments of principal and
interest on the principal amounts outstanding.
(g) Financial Instruments (continued)
On initial recognition of an equity investment that is not held for trading, the Group may irrevocably elect to present subsequent
changes in the investment’s fair value in OCI (designated as FVOCI- equity investment). This election is made on an investment-to-
investment basis.
All financial assets not classified as amortised cost or FVOCI as described above are measured at FVTPL On initial recognition, the
Group may irrevocably designate a financial asset that otherwise meets the requirements to be measured at amortised cost or at
FVOCI as at FVTPL, if doing so eliminates or significantly reduces an accounting mistake that would otherwise arise.
Financial assets: Subsequent measurement and gains and losses
Financial assets, at FVTPL:
These assets are subsequently measured at fair value. Net gains and losses, including any interest or dividend income are recognized
in profit or loss.
Financial assets at amortised cost: These assets are subsequently measured at amortised cost using the effective interest method. The amortised cost is reduced by
impairment losses. Interest income, foreign exchange gains and losses and impairment are recognized in profit or loss. Any gain or
loss on derecognition is recognized in profit or loss.
Debt investments at FVTOCI:
These assets are subsequently measured at fair value. Interest income under effective interest method, foreign exchange gains and
losses and impairment are recognized in profit or loss. Other net gains and losses are recognized in OCI. On derecognition, gains
and losses accumulated in OCI are reclassified to profit or loss.
Equity investments at FVTOCI:
These assets are subsequently measured at fair value. Dividends are recognized as income in profit or loss unless the dividend clearly
represents a recovery of part of the cost of the investment. Other net gains and losses are recognized in OCI and are not reclassified
to profit or loss.
Impairment of financial assets
The Group assesses on a forward-looking basis the expected credit losses associated with its assets carried at amortised cost. The
impairment methodology applied depends on whether there has been a significant increase in credit risk. Note 34 details how the
Group determines whether there has been a significant increase in credit risk.
In accordance with Ind AS 109, the Group applies expected credit loss (“ECL”) model for measurement and recognition of
impairment loss. The Group follows 'simplified approach' for recognition of impairment loss allowance on financial assets, trade
receivables. The application of simplified approach does not require the Group to track changes in credit risk. Rather, it recognises
impairment loss allowance based on lifetime ECLs at each reporting date, right from its initial recognition.
For recognition of impairment loss on other financial assets and risk exposure, the Group determines that whether there has been a
significant increase in the credit risk since initial recognition. If credit risk has not increased significantly, 12-month ECL is used to
provide for impairment loss. However, if credit risk has increased significantly, lifetime ECL is used. If in subsequent period, credit
quality of the instrument improves such that there is no longer a significant increase in credit risk since initial recognition, then the
Group reverts to recognising impairment loss allowance based on 12 month ECL.
iii) Derecognition of financial assets
A financial asset is derecognized only when:
• The Group has transferred the rights to receive cash flows from financial asset or
• Retains the contractual rights to receive the cash flows from financial asset but assumed a contractual obligation to pay the cash
flows to one or more recipients.
Where the Group has transferred an asset, the Group evaluates whether it has transferred substantially all risks and rewards of
ownership of the financial asset. In such cases, the financial asset is derecognized. Where the entity has not transferred substantially
all risks and rewards of ownership of the financial asset, the financial asset is not derecognized.
201
S.J.S. Enterprises Limited (formerly known as S.J.S. Enterprises Private Limited)
Annexure V
Significant accounting policies (Continued)
Where the Group has neither transferred a financial asset nor retains substantially all risks and rewards of ownership of the financial
asset, the financial asset is derecognized if the Group has not retained control of the financial asset. Where the Group retains control
of the financial asset, the asset is continued to be recognized to the extent of continuing involvement in the financial asset.
(g) Financial Instruments (continued)
B. Financial liability
i) Initial recognition and measurement
Financial liabilities are classified, at initial recognition, as financial liabilities at fair value through profit or loss or amortised cost.
All financial liabilities are recognized initially at fair value and, in case of loans and borrowings and payables, net of directly
attributable transaction costs.
ii) Subsequent measurement
The measurement of financial liabilities depends on their classification, as described below:
Financial liabilities at fair value through profit or loss
Financial liabilities at fair value through profit or loss include financial liabilities held for trading and financial liabilities designated
upon initial recognition as at fair value through profit or loss. Financial liabilities are classified as held for trading if they are incurred
for the purpose of repurchasing in the near term. This category also includes derivative financial instruments entered into by the
Group that are not designated as hedging instruments in hedge relationships as defined by Ind AS 109. Separate embedded derivatives
are also classified as held for trading unless they are designated as effective hedging instruments.
Gains or losses on liabilities held for trading are recognized in the profit or loss.
Financial liabilities designated upon initial recognition at fair value through profit or loss are designated as such at the initial date of
recognition, and only if the criteria in Ind AS 109 are satisfied. For liabilities designated as FVTPL, fair value gains/ losses
attributable to changes in own credit risk are recognized in OCI. These gains/ losses are not subsequently transferred to statement of
profit and loss. However, the Group may transfer the cumulative gain or loss within equity. All other changes in fair value of such
liability are recognized in the statement of profit or loss. The Group has not designated any financial liability as at fair value through
profit or loss.
Amortised cost
After initial recognition, interest-bearing loans and borrowings are subsequently measured at amortised cost using the Effective
Interest Rate (“EIR”) method. Gains and losses are recognized in profit or loss when the liabilities are derecognized as well as
through the EIR amortization process.
Amortised cost is calculated by taking into account any discount or premium on acquisition and fees or costs that are an integral part
of the EIR. The EIR amortization is included as finance costs in the statement of profit and loss.
Financial guarantee contracts
Financial guarantee contracts issued by the Group are those contracts that require a payment to be made to reimburse the holder for
a loss it incurs because the specified party fails to make a payment when due in accordance with the terms of a debt instrument.
Financial guarantee contracts are recognized initially as a liability at fair value, adjusted for transaction costs that are directly
attributable to the issuance of the guarantee. Subsequently, the liability is measured at the higher of the amount of loss allowance
determined as per impairment requirements of Ind AS 109 and the amount recognized less cumulative amortization.
Derecognition
A financial liability is derecognized when the obligation under the liability is discharged or cancelled or expires. When an existing
financial liability is replaced by another from the same lender on substantially different terms, or the terms of an existing liability
are substantially modified, such an exchange or modification is treated as the derecognition of the original liability and the
recognition of a new liability. The difference in the respective carrying amounts is recognized in the statement of profit or loss.
Offsetting
Financial assets and financial liabilities are offset and the net amount reported in the balance sheet if there is a currently enforceable
legal right to offset the recognized amounts and there is an intention to settle on a net basis, to realize the assets and settle the
liabilities simultaneously.
(h) Cash and cash equivalents
202

S.J.S. Enterprises Limited (formerly known as S.J.S. Enterprises Private Limited)
Annexure V
Significant accounting policies (Continued)
Cash and cash equivalent includes cash on hand, other short-term, highly liquid investments with original maturities of three months
or less that are readily convertible to known amounts of cash and which are subject to an insignificant risk of changes in value, and
bank overdrafts.
(i) Cash dividend to equity holders of the Group
The Group recognises a liability to make cash distributions to equity holders of the Group when the distribution is authorised, and
the distribution is no longer at the discretion of the Group. Final dividends on shares are recorded as a liability on the date of approval
by the shareholders and interim dividends are recorded as a liability on the date of declaration by the Board of Directors.
(j) Foreign Currency transactions and translations
Foreign currency are translated into the functional currency using the exchange rates at the dates of the transactions. Foreign currency
denominated monetary assets and liabilities are translated into relevant functional currency at exchange rates in effect at the balance
sheet date.
Foreign exchange gains and losses resulting from the settlement of such transactions and from the translation of monetary assets and
liabilities denominated in foreign currencies at year end exchange rates are generally recognized in statement of profit and loss.
Non-monetary assets and non-monetary liabilities denominated in foreign currency and measured at fair value are translated at the
exchange rate prevalent at the date when the fair value was determined. Non-monetary assets and non-monetary liabilities
denominated in a foreign currency and measured at historical cost are translated at the exchange rate prevalent at the date of
transaction. Translation differences on assets and liabilities carried at fair value are reported as part of the fair value gain or loss and
are generally recognized in statement of profit and loss, except exchange differences arising from the translation of the following
items which are recognized in OCI:
• equity investments at fair value through OCI (FVOCI)
• a financial liability designated as a hedge of the net investment in a foreign operation to the extent that the hedge is effective; and
• qualifying cash flow hedges to the extent that the hedges are effective.
(k) Employee benefits
(i) Defined contribution plan
A defined contribution plan is a post-employment benefit plan under which an entity pays specified contributions to a separate entity
and has no obligation to pay any further amounts. The Group makes specified monthly contributions towards employee Provident
Fund to Government administered Provident Fund Scheme which is a defined contribution plan. The Group’s contribution is
recognized as an expense in the statement of profit and loss during the period in which the employee renders the related service.
(ii) Defined benefit plans
The Company’s and its subsidiary’s gratuity plan is a defined benefit plan. The present value of gratuity obligation under such
defined benefit plans is determined based on actuarial valuations carried out by an independent actuary using the Projected Unit
Credit Method, which recognizes each period of service as giving rise to additional unit of employee benefit entitlement and measure
each unit separately to build up the final obligation. The obligation is measured at the present value of estimated future cash flows.
The discount rates used for determining the present value of obligation under defined benefit plans, is based on the market yields on
Government securities as at the balance sheet date, having maturity periods approximating to the terms of related obligations.
Actuarial gains or losses are recognized in other comprehensive income. Further, the profit or loss does not include an expected
return on plan assets. Instead net interest recognized in profit or loss is calculated by applying the discount rate used to measure the
defined benefit obligation to the net defined benefit liability or asset. The actual return on plan assets above or below the discount
rate is recognized as part of remeasurement of net defined liability or asset through other comprehensive income.
Remeasurements comprising actuarial gains or losses and return on plan assets (excluding amounts included in net interest on the
net defined benefit liability) are not reclassified to profit or loss in subsequent periods.
The Company’s and its subsidiary’s gratuity scheme is administered through a third party trust and the provision for the same is
determined on the basis of actuarial valuation carried out by an independent actuary. Provision is made for the shortfall, if any,
between the amounts required to be contributed to meet the accrued liability for gratuity as determined by actuarial valuation and
the available corpus of the funds.
(iii) Short-term employee benefits
All employee benefits falling due wholly within twelve months of rendering the services are classified as short term employee
benefits, which include benefits like salaries, wages and performance incentives and are recognised as expenses in the period in
which the employee renders the related service.
Short term employee benefits are measured on an undiscounted basis and are expensed as the related service is provided. A liability
is recognized for the amount expected to be paid e.g. short term performance incentive, if the Group has a present legal or constructive
203

S.J.S. Enterprises Limited (formerly known as S.J.S. Enterprises Private Limited)
Annexure V
Significant accounting policies (Continued)
obligation to pay this amount as a result of past services provided by the employee and the amount of obligation can be estimated
reliably.
When the benefits of a plan are changed or when a plan is curtailed, the resulting change in benefit that relates to past service (‘past
service cost’ or ‘past service gain’) or the gain or loss on curtailment is recognized immediately in profit or loss. The Group
recognizes gains and losses on the settlement of a defined benefit plan when the settlement occurs.
(k) Employee benefits (continued)
(iv) Compensated absences
Compensated absences which are not expected to occur within twelve months after the end of the period in which the employee
renders the related services are recognised at an actuarially determined liability at the present value of the defined benefit obligation
at the Balance sheet date. In respect of compensated absences expected to occur within twelve months after the end of the period in
which the employee renders the related services, liability for short-term employee benefits is measured at the undiscounted amount
of the benefits expected to be paid in exchange for the related service.
(l) Borrowing costs
Borrowing costs are interest and other costs (including exchange differences relating to foreign currency borrowings to the extent
that they are regarded as an adjustment to interest costs) incurred in connection with the borrowing of funds. Borrowing costs
allocated to and utilized for qualifying assets pertaining to the period from commencement of activities directly attributable to the
acquisition, construction or production of upto the date of capitalisation of such asset are added to the cost of the assets. Qualifying
asset is an asset that necessarily takes a substantial period of time to get ready for its intended use Borrowing cost also includes
exchange differences to the extent regarded as an adjustment to the borrowing costs. All other borrowing costs are expensed in the
period in which they occur.
(m) Leases
The Group has applied Ind AS 116 using the full retrospective approach, hence, the comparative information has been restated.
The Group assesses at contract inception whether a contract is, or contains, a lease, that is if the contract conveys the right to control
the use of an identified asset for a period of time in exchange for consideration.
Group as a lessee The Group accounts for each lease component within the contract as a lease separately from non-lease components of the contract
and allocates the consideration in the contract to each lease component on the basis of the relative stand-alone price of the lease
component and the aggregate stand-alone price of the non-lease components.
The Group recognises a right-of-use (ROU) asset and a lease liability at the lease commencement date. The ROU asset is initially
measured at cost, which comprises the initial amount of the lease liability adjusted for any lease payments made at or before the
commencement date, plus any initial direct costs incurred and an estimate of costs to dismantle and remove the underlying asset or
to restore the underlying asset or the site on which it is located, less any lease incentives received.
The ROU asset is subsequently depreciated using the straight-line method from the commencement date to the end of the lease term.
The lease liability is initially measured at the present value of the lease payments that are not paid at the commencement date,
discounted using the Group’s incremental borrowing rate. It is remeasured when there is a change in future lease payments arising
from a change in an index or rate, if there is a change in the Group’s estimate of the amount expected to be payable under a residual
value guarantee, or if the Group changes its assessment of whether it will exercise a purchase, extension or termination option.
When the lease liability is remeasured in this way, a corresponding adjustment is made to the carrying amount of the right-of-use
asset, or is recorded in profit or loss if the carrying amount of the right-of-use asset has been reduced to zero.
The Group applies the short-term lease recognition exemption to all assets that have a lease term of 12 months or less from the
commencement date. The lease payments associated with these leases are recognized as an expense on a straight-line basis over the
lease term. Further, leases for which the underlying asset is of low value has been recognized immediately in the Statement of Profit
and Loss.
(n) Taxation
Income tax expense comprises current and deferred income tax. Income tax expense is recognized in net profit in the statement of
profit and loss except to the extent it relates to items recognized directly in equity, in which case it is recognized in other
comprehensive income.
204

S.J.S. Enterprises Limited (formerly known as S.J.S. Enterprises Private Limited)
Annexure V
Significant accounting policies (Continued)
Current income tax for current and prior periods is recognized at the amount expected to be paid or recovered from the tax authorities,
using the tax rates and tax laws that have been enacted or substantively enacted by the reporting date.
Deferred income tax assets and liabilities are recognized for all temporary differences arising between the tax bases of assets and
liabilities and their carrying amounts in the Restated financial statements except for the cases mentioned below.
Deferred income tax assets and liabilities are measured using tax rates and tax laws that have been enacted or substantively enacted
by the balance sheet date and are expected to apply to taxable income in the years in which those temporary differences are expected
(n) Taxation (continued)
to be recovered or settled. The effect of changes in tax rates on deferred income tax assets and liabilities is recognized as income or
expense in the period that includes the enactment or substantive enactment date.
Deferred tax is not recognized for temporary differences arising on the initial recognition of assets and liabilities in a transaction that
is not a business combination and that affects neither accounting nor taxable profits or loss at the time of the transaction.
Deferred tax assets are recognised to the extent that it is probable that future taxable profits will be available against which they can
be used. The Group recognises a deferred tax asset only to the extent that it has sufficient taxable temporary differences or there is
convincing other evidence that sufficient taxable profits will be available against which such deferred tax can be realised. Deferred
tax assets, unrecognised or recognised, are reviewed at each reporting date and are recognised/reduced to the extent that it is
probable/no longer probable respectively that the related tax benefit will be realised.
Minimum alternative tax ('MAT') paid in accordance with the tax laws, which gives rise to future economic benefits in the form of
adjustment of future tax liability, is considered as an asset if there is convincing evidence that the Group will pay normal income tax
in future years. Ind AS 12 defines deferred tax to include carry forward of unused tax credits that are carried forward by the entity
for a specified period of time. Accordingly, MAT credit entitlement is grouped with deferred tax assets (net) in the balance sheet.
The Group offsets, the current tax assets and liabilities (on a year on year basis) and deferred tax assets and liabilities, where it has
a legally enforceable right and where it intends to settle such assets and liabilities on a net basis.
(o) Provisions and Contingent Liabilities
(i) Provisions
Provisions are recognised when the Group has a present obligation (legal or constructive) as a result of a past event, it is probable
that an outflow of resources embodying economic benefits will be required to settle the obligation and a reliable estimate can be
made of the amount of the obligation. When the Group expects some or all of a provision to be reimbursed, the expense relating to
a provision is presented in the statement of profit and loss net of any reimbursement. If the effect of the time value of money is
material, provisions are discounted using a current pre-tax rate that reflects, when appropriate, the risks specific to the liability. When
discounting is used, the increase in the provision due to the passage of time is recognised as a finance cost. Expected future operating
losses are not provided for.
(ii) Onerous contract
Provision for onerous contracts. i.e. contracts where the expected unavoidable cost of meeting the obligations under the contract
exceed the economic benefits expected to be received under it, are recognised when it is probable that an outflow of resources
embodying economic benefits will be required to settle a present obligation as a result of an obligating event based on a reliable
estimate of such obligation.
(iii) Contingent liabilities
A disclosure for contingent liabilities is made where there is a possible obligation or a present obligation that may probably not
require an outflow of resources. When there is a possible or a present obligation where the likelihood of outflow of resources is
remote, no provision or disclosure is made.
(p) Earnings per share
The basic earnings per share is computed by dividing the net profit attributable to the owners of the Parent Company for the year by
the weighted average number of equity shares outstanding during reporting period.
The number of shares used in computing diluted earnings per share comprises the weighted average shares considered for deriving
basic earnings per share and also the weighted average number of equity shares which could have been issued on the conversion of
all dilutive potential equity shares.
Dilutive potential equity shares are deemed converted as of the beginning of the reporting date, unless they have been issued at a
later date. In computing diluted earnings per share, only potential equity shares that is dilutive and which either reduces earnings per
share or increase loss per share are included. The Group does not have any dilutive equity shares.
205
S.J.S. Enterprises Limited (formerly known as S.J.S. Enterprises Private Limited)
Annexure V
Significant accounting policies (Continued)
(q) Segment reporting
Operating segments are reported in a manner consistent with the internal reporting provided to the chief operating decision maker
(CODM). The Group has identified one reportable segment based on the dominant source, nature of risks and return and the internal
organisation and management structure and for which discrete financial information is available. The CODM monitors the operating
results of the entity as a whole for the purpose of making decisions about resource allocation and performance assessment. Refer
Note 41 for segment information and segment reporting.
(r) Cash flow statement
Cash flows are reported using the indirect method, whereby net profit before taxes for the period is adjusted for the effects of
transactions of a non-cash nature, any deferrals or accruals of past or future operating cash receipts or payments and item of income
or expenses associated with investing or financing cash flows. The cash flows from operating, investing and financing activities of
the Group are segregated.
(s) Government grants
Government grants are recognized where there is reasonable assurance that the grant will be received, and all attached conditions
will be complied with. When the grant relates to an expense item, it is recognized as income on a systematic basis over the periods
that the related costs, for which it is intended to compensate, are expensed. When the grant relates to an asset, it is recognized as
income in proportion to the depreciation charged over the expected useful life of the related asset. Industrial Promotion Subsidies
under the Package Scheme of Incentives. 2007 is recognized to the extent the claims towards such subsidy are accepted
unconditionally by the concerned government authorities.
(t) First-time adoption of Ind AS
Overall Principle: The Company’s has prepared opening balance sheet as per Ind AS as of 01 April 2019 (transition date) by recognising all assets and
liabilities whose recognition is required by Ind AS, not recognising items of assets or liabilities which are not permitted by Ind AS,
by reclassifying items from previous Indian GAAP to Ind AS as required under Ind AS, and applying Ind AS in measurement for
recognised assets and liabilities. However, this principle is subject to the certain exception and certain optional exemptions availed
by the Company’s as detailed below.
(i) Deemed cost for Property, plant and equipment:
As permitted by Ind AS 101, the Company’s has elected to fair value its freehold land and uses that fair value as its deemed
cost at the date of transition, viz,, 01 April 2019. With respect to the remaining item of property, plant and equipment and
intangible assets, the Company’s has elected to value them in accordance with Ind AS 16 and Ind AS 38 respectively.
(ii) Past business combinations:
The Company’s has elected to apply Ind AS 103 Business Combinations retrospectively to past business combinations that
occurred before the Ind AS transition date of 01 April 2019, from 01 April 2018. Consequently,
(a) The Company’s has kept the same classification for the past business combinations, for business acquisitions prior to 01
April 2018, as in its previous GAAP financial statements;
(b) For business combinations taking place between 01 April 2018 to 01 April 2019 (date of transition), the Company’s has
recognised assets and liabilities that were not recognised in accordance with previous GAAP in the balance sheet of the
Company’s and would qualify for recognition in accordance with Ind AS;
(iii) Leases:
1. Company’s chose to assess whether a contract contains a lease on the basis of facts and circumstances existing as at
transition date (instead of lease inception date).
2. As at the date of transition to Ind AS, Company’s chose to apply on a lease-by-lease basis:
(a) apply a single discount rate to a portfolio of leases with reasonably similar characteristics
(b) elect not to recognize ROU and lease liability for leases whose term ends within 12 months of the date of transition or
underlying asset is of low value
(c) exclude initial direct costs from the measurement of the right-of-use asset at the date of transition to Ind AS.
(d) use hindsight, such as in determining the lease term if the contract contains options to extend or terminate the lease.
(iv) Derecognition of financial assets and liabilities:
The Company’s has applied the derecognition requirements of financial assets and financial liabilities prospectively for
transactions occurring on or after 01 April 2019 (the transition date).
(v) Impairment of financial assets:
206

S.J.S. Enterprises Limited (formerly known as S.J.S. Enterprises Private Limited)
Annexure V
Significant accounting policies (Continued)
The Company’s has applied the impairment requirements of Ind AS 109 retrospectively; however, as permitted by Ind AS
101, it has used reasonable and supportable information that is available without undue cost or effort to determine the credit
risk at the date that financial instruments were initially recognised in order to compare it with the credit risk at the transition
date. Further, the Company’s has not undertaken an exhaustive search for information when determining, at the date of
transition to Ind AS, whether there have been significant increases in credit risk since initial recognition, as permitted by Ind
AS 101.
(t) First-time adoption of Ind AS (continued)
(vi) Defined benefit plans:
Under Ind AS, remeasurements i.e. actuarial gains and losses and the return on plan assets, excluding amounts included in
the net interest expense on the net defined benefit liability are recognized in other comprehensive income instead of profit
or loss. Under the previous GAAP, these remeasurements were forming part of the profit or loss for the year.
(u) Recent Accounting pronouncements
Ministry of Corporate Affairs (“MCA”) notifies new standard or amendments to the existing standards. There is no such notification
which would have been applicable from 1 July 2021.
MCA issued notifications dated 24 March 2021 to amend Schedule III to the Companies Act, 2013 to enhance the disclosures
required to be made by the Group in its financial statements. These amendments are applicable to the Group for the financial period
starting 1 April 2021 and the Group has complied with the disclosure requirements.
207
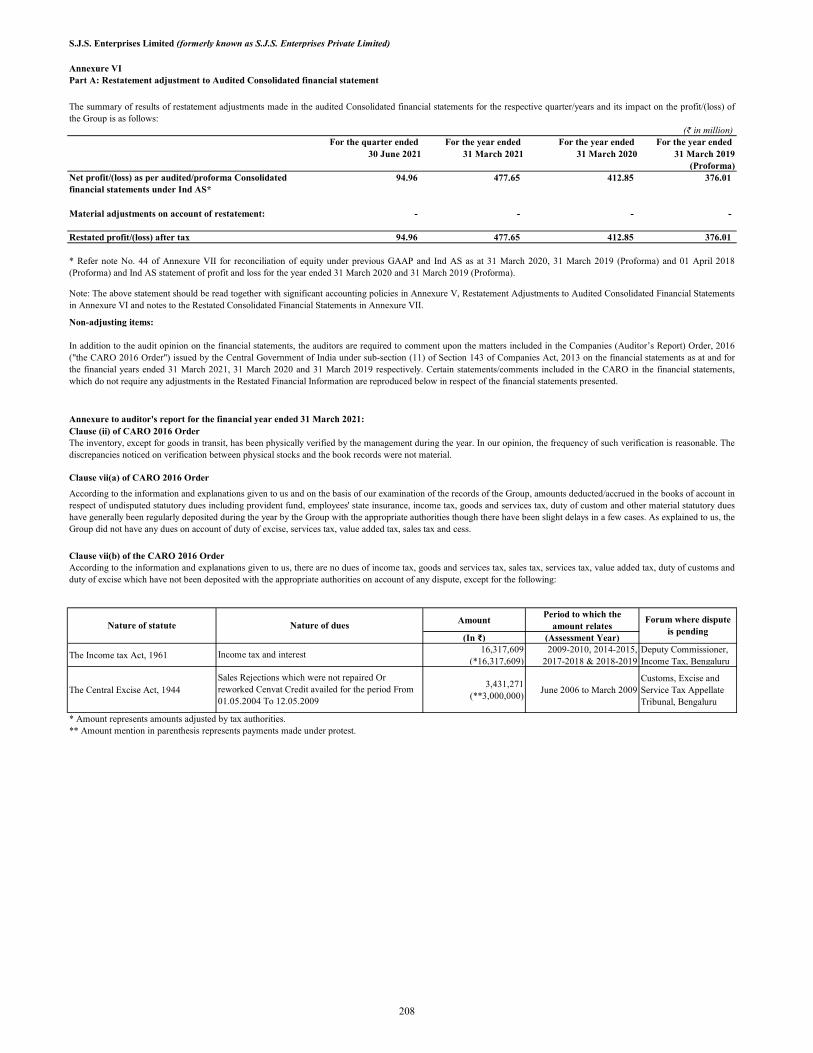
S.J.S. Enterprises Limited (formerly known as S.J.S. Enterprises Private Limited)
Annexure VIPart A: Restatement adjustment to Audited Consolidated financial statement
(₹ in million)For the quarter ended For the year ended For the year ended For the year ended
30 June 2021 31 March 2021 31 March 2020 31 March 2019(Proforma)
94.96 477.65 412.85 376.01
- - - -
Restated profit/(loss) after tax 94.96 477.65 412.85 376.01
Non-adjusting items:
AmountPeriod to which the
amount relates (In ₹) (Assessment Year)
The Income tax Act, 196116,317,609
(*16,317,609)2009-2010, 2014-2015,
2017-2018 & 2018-2019 Deputy Commissioner, Income Tax, Bengaluru
The Central Excise Act, 19443,431,271
(**3,000,000)June 2006 to March 2009
Customs, Excise and Service Tax Appellate Tribunal, Bengaluru
* Amount represents amounts adjusted by tax authorities.** Amount mention in parenthesis represents payments made under protest.
The summary of results of restatement adjustments made in the audited Consolidated financial statements for the respective quarter/years and its impact on the profit/(loss) ofthe Group is as follows:
* Refer note No. 44 of Annexure VII for reconciliation of equity under previous GAAP and Ind AS as at 31 March 2020, 31 March 2019 (Proforma) and 01 April 2018(Proforma) and Ind AS statement of profit and loss for the year ended 31 March 2020 and 31 March 2019 (Proforma).
Note: The above statement should be read together with significant accounting policies in Annexure V, Restatement Adjustments to Audited Consolidated Financial Statementsin Annexure VI and notes to the Restated Consolidated Financial Statements in Annexure VII.
Net profit/(loss) as per audited/proforma Consolidated financial statements under Ind AS*
Material adjustments on account of restatement:
In addition to the audit opinion on the financial statements, the auditors are required to comment upon the matters included in the Companies (Auditor’s Report) Order, 2016("the CARO 2016 Order") issued by the Central Government of India under sub-section (11) of Section 143 of Companies Act, 2013 on the financial statements as at and forthe financial years ended 31 March 2021, 31 March 2020 and 31 March 2019 respectively. Certain statements/comments included in the CARO in the financial statements,which do not require any adjustments in the Restated Financial Information are reproduced below in respect of the financial statements presented.
Annexure to auditor's report for the financial year ended 31 March 2021:Clause (ii) of CARO 2016 OrderThe inventory, except for goods in transit, has been physically verified by the management during the year. In our opinion, the frequency of such verification is reasonable. Thediscrepancies noticed on verification between physical stocks and the book records were not material.
Clause vii(a) of CARO 2016 Order
According to the information and explanations given to us and on the basis of our examination of the records of the Group, amounts deducted/accrued in the books of account inrespect of undisputed statutory dues including provident fund, employees' state insurance, income tax, goods and services tax, duty of custom and other material statutory dueshave generally been regularly deposited during the year by the Group with the appropriate authorities though there have been slight delays in a few cases. As explained to us, theGroup did not have any dues on account of duty of excise, services tax, value added tax, sales tax and cess.
Clause vii(b) of the CARO 2016 OrderAccording to the information and explanations given to us, there are no dues of income tax, goods and services tax, sales tax, services tax, value added tax, duty of customs andduty of excise which have not been deposited with the appropriate authorities on account of any dispute, except for the following:
Nature of statuteForum where dispute
is pendingNature of dues
Income tax and interest
Sales Rejections which were not repaired Or reworked Cenvat Credit availed for the period From 01.05.2004 To 12.05.2009
208
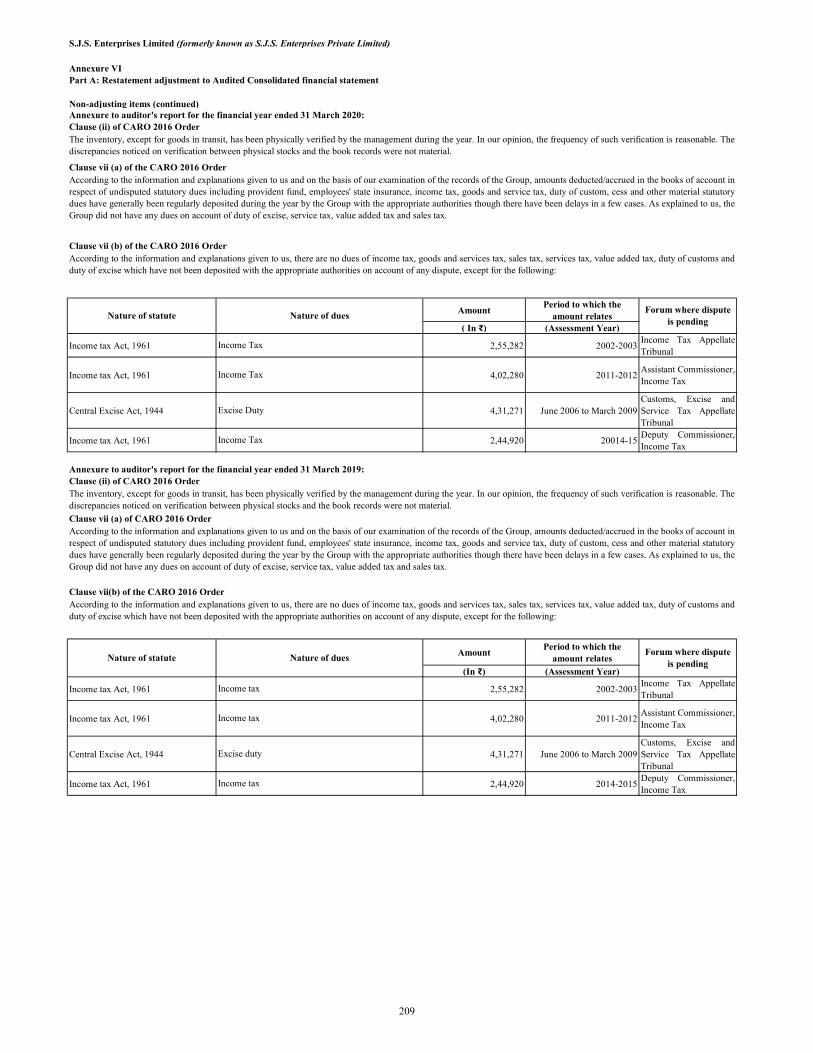
S.J.S. Enterprises Limited (formerly known as S.J.S. Enterprises Private Limited)
Annexure VIPart A: Restatement adjustment to Audited Consolidated financial statement
Non-adjusting items (continued)
AmountPeriod to which the
amount relates ( In ₹) (Assessment Year)
Income tax Act, 1961 2,55,282 2002-2003Income Tax AppellateTribunal
Income tax Act, 1961 4,02,280 2011-2012Assistant Commissioner,Income Tax
Central Excise Act, 1944 4,31,271 June 2006 to March 2009Customs, Excise andService Tax AppellateTribunal
Income tax Act, 1961 2,44,920 20014-15Deputy Commissioner,Income Tax
AmountPeriod to which the
amount relates
(In ₹) (Assessment Year)
Income tax Act, 1961 2,55,282 2002-2003Income Tax AppellateTribunal
Income tax Act, 1961 4,02,280 2011-2012Assistant Commissioner,Income Tax
Central Excise Act, 1944 4,31,271 June 2006 to March 2009Customs, Excise andService Tax AppellateTribunal
Income tax Act, 1961 2,44,920 2014-2015Deputy Commissioner,Income Tax
Annexure to auditor's report for the financial year ended 31 March 2020:
Nature of statuteForum where dispute
is pending
Annexure to auditor's report for the financial year ended 31 March 2019:
Clause (ii) of CARO 2016 OrderThe inventory, except for goods in transit, has been physically verified by the management during the year. In our opinion, the frequency of such verification is reasonable. Thediscrepancies noticed on verification between physical stocks and the book records were not material.
According to the information and explanations given to us and on the basis of our examination of the records of the Group, amounts deducted/accrued in the books of account inrespect of undisputed statutory dues including provident fund, employees' state insurance, income tax, goods and service tax, duty of custom, cess and other material statutorydues have generally been regularly deposited during the year by the Group with the appropriate authorities though there have been delays in a few cases. As explained to us, theGroup did not have any dues on account of duty of excise, service tax, value added tax and sales tax.
According to the information and explanations given to us, there are no dues of income tax, goods and services tax, sales tax, services tax, value added tax, duty of customs andduty of excise which have not been deposited with the appropriate authorities on account of any dispute, except for the following:
Clause vii (a) of the CARO 2016 Order
Clause vii (b) of the CARO 2016 Order
Nature of dues
Income Tax
Income Tax
Excise Duty
Income Tax
Clause (ii) of CARO 2016 Order
Clause vii (a) of CARO 2016 Order
Clause vii(b) of the CARO 2016 Order
The inventory, except for goods in transit, has been physically verified by the management during the year. In our opinion, the frequency of such verification is reasonable. Thediscrepancies noticed on verification between physical stocks and the book records were not material.
According to the information and explanations given to us and on the basis of our examination of the records of the Group, amounts deducted/accrued in the books of account inrespect of undisputed statutory dues including provident fund, employees' state insurance, income tax, goods and service tax, duty of custom, cess and other material statutorydues have generally been regularly deposited during the year by the Group with the appropriate authorities though there have been delays in a few cases. As explained to us, theGroup did not have any dues on account of duty of excise, service tax, value added tax and sales tax.
Income tax
Income tax
Excise duty
Income tax
According to the information and explanations given to us, there are no dues of income tax, goods and services tax, sales tax, services tax, value added tax, duty of customs andduty of excise which have not been deposited with the appropriate authorities on account of any dispute, except for the following:
Nature of statuteForum where dispute
is pendingNature of dues
209
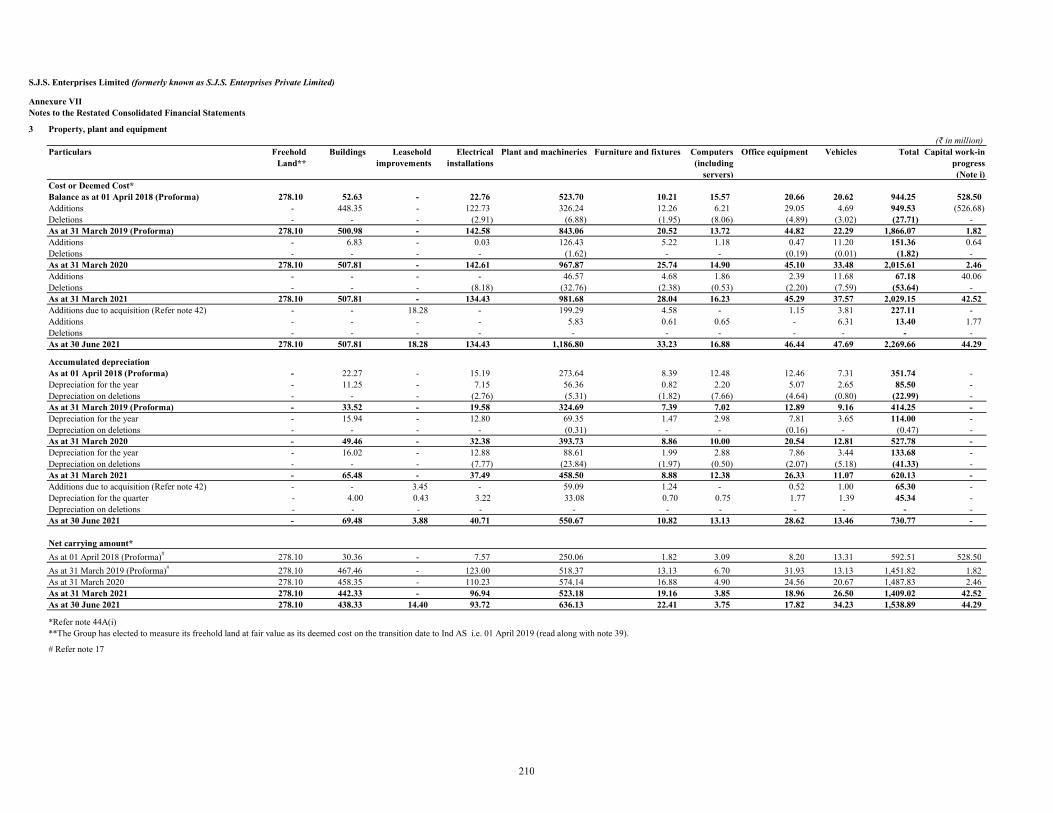
S.J.S. Enterprises Limited (formerly known as S.J.S. Enterprises Private Limited)
Annexure VIINotes to the Restated Consolidated Financial Statements
3 Property, plant and equipment(₹ in million)
Particulars Freehold Land**
Buildings Leasehold improvements
Electrical installations
Plant and machineries Furniture and fixtures Computers (including
servers)
Office equipment Vehicles Total Capital work-in-progress(Note i)
Cost or Deemed Cost*Balance as at 01 April 2018 (Proforma) 278.10 52.63 - 22.76 523.70 10.21 15.57 20.66 20.62 944.25 528.50 Additions - 448.35 - 122.73 326.24 12.26 6.21 29.05 4.69 949.53 (526.68) Deletions - - - (2.91) (6.88) (1.95) (8.06) (4.89) (3.02) (27.71) - As at 31 March 2019 (Proforma) 278.10 500.98 - 142.58 843.06 20.52 13.72 44.82 22.29 1,866.07 1.82 Additions - 6.83 - 0.03 126.43 5.22 1.18 0.47 11.20 151.36 0.64 Deletions - - - - (1.62) - - (0.19) (0.01) (1.82) - As at 31 March 2020 278.10 507.81 - 142.61 967.87 25.74 14.90 45.10 33.48 2,015.61 2.46 Additions - - - - 46.57 4.68 1.86 2.39 11.68 67.18 40.06 Deletions - - - (8.18) (32.76) (2.38) (0.53) (2.20) (7.59) (53.64) - As at 31 March 2021 278.10 507.81 - 134.43 981.68 28.04 16.23 45.29 37.57 2,029.15 42.52 Additions due to acquisition (Refer note 42) - - 18.28 - 199.29 4.58 - 1.15 3.81 227.11 - Additions - - - - 5.83 0.61 0.65 - 6.31 13.40 1.77 Deletions - - - - - - - - - - - As at 30 June 2021 278.10 507.81 18.28 134.43 1,186.80 33.23 16.88 46.44 47.69 2,269.66 44.29
Accumulated depreciationAs at 01 April 2018 (Proforma) - 22.27 - 15.19 273.64 8.39 12.48 12.46 7.31 351.74 - Depreciation for the year - 11.25 - 7.15 56.36 0.82 2.20 5.07 2.65 85.50 - Depreciation on deletions - - - (2.76) (5.31) (1.82) (7.66) (4.64) (0.80) (22.99) - As at 31 March 2019 (Proforma) - 33.52 - 19.58 324.69 7.39 7.02 12.89 9.16 414.25 - Depreciation for the year - 15.94 - 12.80 69.35 1.47 2.98 7.81 3.65 114.00 - Depreciation on deletions - - - - (0.31) - - (0.16) - (0.47) - As at 31 March 2020 - 49.46 - 32.38 393.73 8.86 10.00 20.54 12.81 527.78 - Depreciation for the year - 16.02 - 12.88 88.61 1.99 2.88 7.86 3.44 133.68 - Depreciation on deletions - - - (7.77) (23.84) (1.97) (0.50) (2.07) (5.18) (41.33) - As at 31 March 2021 - 65.48 - 37.49 458.50 8.88 12.38 26.33 11.07 620.13 - Additions due to acquisition (Refer note 42) - - 3.45 - 59.09 1.24 - 0.52 1.00 65.30 - Depreciation for the quarter - 4.00 0.43 3.22 33.08 0.70 0.75 1.77 1.39 45.34 - Depreciation on deletions - - - - - - - - - - - As at 30 June 2021 - 69.48 3.88 40.71 550.67 10.82 13.13 28.62 13.46 730.77 -
Net carrying amount*
As at 01 April 2018 (Proforma)# 278.10 30.36 - 7.57 250.06 1.82 3.09 8.20 13.31 592.51 528.50
As at 31 March 2019 (Proforma)# 278.10 467.46 - 123.00 518.37 13.13 6.70 31.93 13.13 1,451.82 1.82 As at 31 March 2020 278.10 458.35 - 110.23 574.14 16.88 4.90 24.56 20.67 1,487.83 2.46 As at 31 March 2021 278.10 442.33 - 96.94 523.18 19.16 3.85 18.96 26.50 1,409.02 42.52 As at 30 June 2021 278.10 438.33 14.40 93.72 636.13 22.41 3.75 17.82 34.23 1,538.89 44.29
# Refer note 17
*Refer note 44A(i)**The Group has elected to measure its freehold land at fair value as its deemed cost on the transition date to Ind AS i.e. 01 April 2019 (read along with note 39).
210
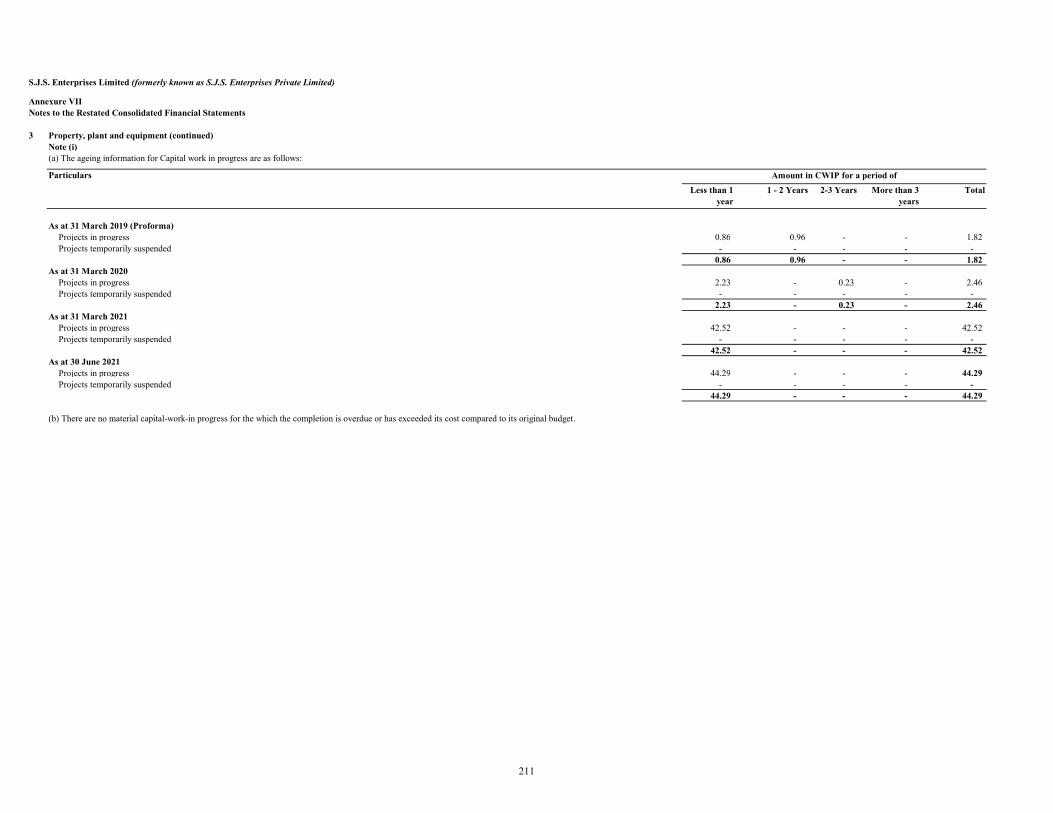
S.J.S. Enterprises Limited (formerly known as S.J.S. Enterprises Private Limited)
Annexure VIINotes to the Restated Consolidated Financial Statements
3 Property, plant and equipment (continued)Note (i)
Less than 1 year
1 - 2 Years 2-3 Years More than 3 years
Total
As at 31 March 2019 (Proforma)Projects in progress 0.86 0.96 - - 1.82 Projects temporarily suspended - - - - -
0.86 0.96 - - 1.82 As at 31 March 2020
Projects in progress 2.23 - 0.23 - 2.46 Projects temporarily suspended - - - - -
2.23 - 0.23 - 2.46 As at 31 March 2021
Projects in progress 42.52 - - - 42.52 Projects temporarily suspended - - - - -
42.52 - - - 42.52 As at 30 June 2021
Projects in progress 44.29 - - - 44.29 Projects temporarily suspended - - - - -
44.29 - - - 44.29
(a) The ageing information for Capital work in progress are as follows:
(b) There are no material capital-work-in progress for the which the completion is overdue or has exceeded its cost compared to its original budget.
Particulars Amount in CWIP for a period of
211
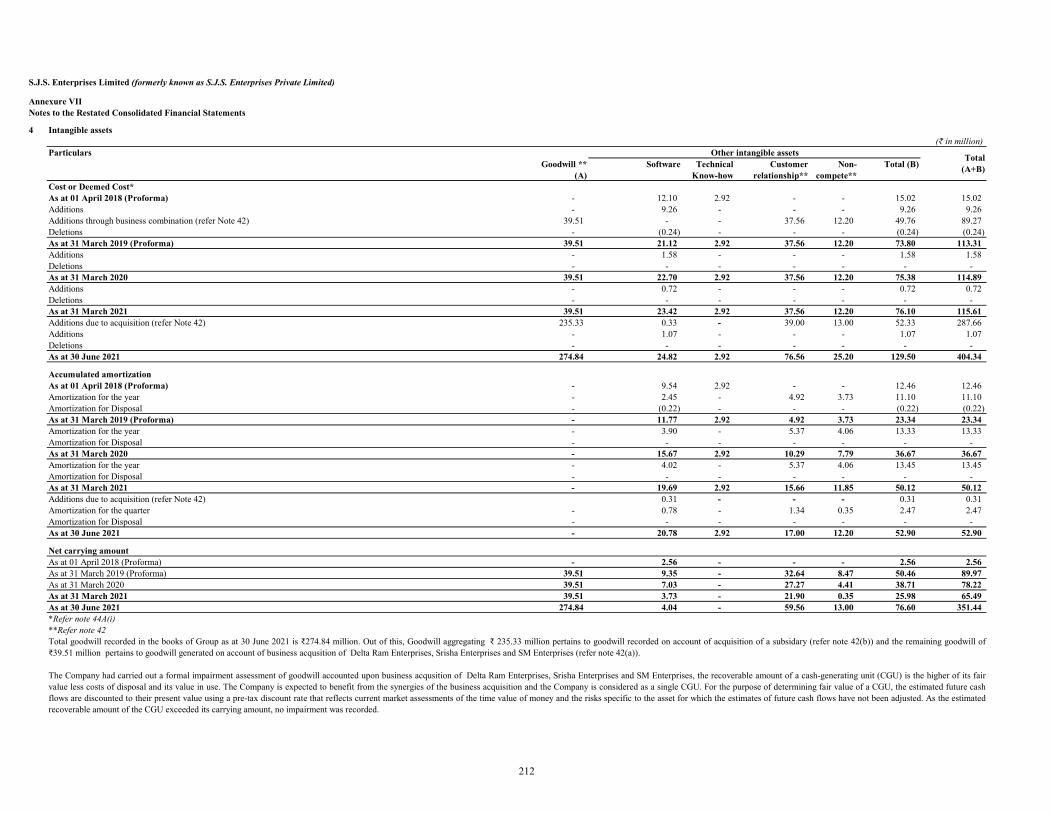
S.J.S. Enterprises Limited (formerly known as S.J.S. Enterprises Private Limited)
Annexure VIINotes to the Restated Consolidated Financial Statements
4 Intangible assets(₹ in million)
Particulars Other intangible assets Goodwill **
(A) Software Technical
Know-how Customer
relationship** Non-
compete** Total (B)
Cost or Deemed Cost*As at 01 April 2018 (Proforma) - 12.10 2.92 - - 15.02 15.02 Additions - 9.26 - - - 9.26 9.26 Additions through business combination (refer Note 42) 39.51 - - 37.56 12.20 49.76 89.27 Deletions - (0.24) - - - (0.24) (0.24) As at 31 March 2019 (Proforma) 39.51 21.12 2.92 37.56 12.20 73.80 113.31 Additions - 1.58 - - - 1.58 1.58 Deletions - - - - - - - As at 31 March 2020 39.51 22.70 2.92 37.56 12.20 75.38 114.89 Additions - 0.72 - - - 0.72 0.72 Deletions - - - - - - - As at 31 March 2021 39.51 23.42 2.92 37.56 12.20 76.10 115.61 Additions due to acquisition (refer Note 42) 235.33 0.33 - 39.00 13.00 52.33 287.66 Additions - 1.07 - - - 1.07 1.07 Deletions - - - - - - - As at 30 June 2021 274.84 24.82 2.92 76.56 25.20 129.50 404.34
Accumulated amortizationAs at 01 April 2018 (Proforma) - 9.54 2.92 - - 12.46 12.46 Amortization for the year - 2.45 - 4.92 3.73 11.10 11.10 Amortization for Disposal - (0.22) - - - (0.22) (0.22) As at 31 March 2019 (Proforma) - 11.77 2.92 4.92 3.73 23.34 23.34 Amortization for the year - 3.90 - 5.37 4.06 13.33 13.33 Amortization for Disposal - - - - - - - As at 31 March 2020 - 15.67 2.92 10.29 7.79 36.67 36.67 Amortization for the year - 4.02 - 5.37 4.06 13.45 13.45 Amortization for Disposal - - - - - - - As at 31 March 2021 - 19.69 2.92 15.66 11.85 50.12 50.12 Additions due to acquisition (refer Note 42) 0.31 - - - 0.31 0.31 Amortization for the quarter - 0.78 - 1.34 0.35 2.47 2.47 Amortization for Disposal - - - - - - - As at 30 June 2021 - 20.78 2.92 17.00 12.20 52.90 52.90
Net carrying amountAs at 01 April 2018 (Proforma) - 2.56 - - - 2.56 2.56 As at 31 March 2019 (Proforma) 39.51 9.35 - 32.64 8.47 50.46 89.97 As at 31 March 2020 39.51 7.03 - 27.27 4.41 38.71 78.22 As at 31 March 2021 39.51 3.73 - 21.90 0.35 25.98 65.49 As at 30 June 2021 274.84 4.04 - 59.56 13.00 76.60 351.44 *Refer note 44A(i)**Refer note 42Total goodwill recorded in the books of Group as at 30 June 2021 is ₹274.84 million. Out of this, Goodwill aggregating ₹ 235.33 million pertains to goodwill recorded on account of acquisition of a subsidary (refer note 42(b)) and the remaining goodwill of₹39.51 million pertains to goodwill generated on account of business acqusition of Delta Ram Enterprises, Srisha Enterprises and SM Enterprises (refer note 42(a)).
The Company had carried out a formal impairment assessment of goodwill accounted upon business acqusition of Delta Ram Enterprises, Srisha Enterprises and SM Enterprises, the recoverable amount of a cash-generating unit (CGU) is the higher of its fairvalue less costs of disposal and its value in use. The Company is expected to benefit from the synergies of the business acquisition and the Company is considered as a single CGU. For the purpose of determining fair value of a CGU, the estimated future cashflows are discounted to their present value using a pre-tax discount rate that reflects current market assessments of the time value of money and the risks specific to the asset for which the estimates of future cash flows have not been adjusted. As the estimatedrecoverable amount of the CGU exceeded its carrying amount, no impairment was recorded.
Total(A+B)
212
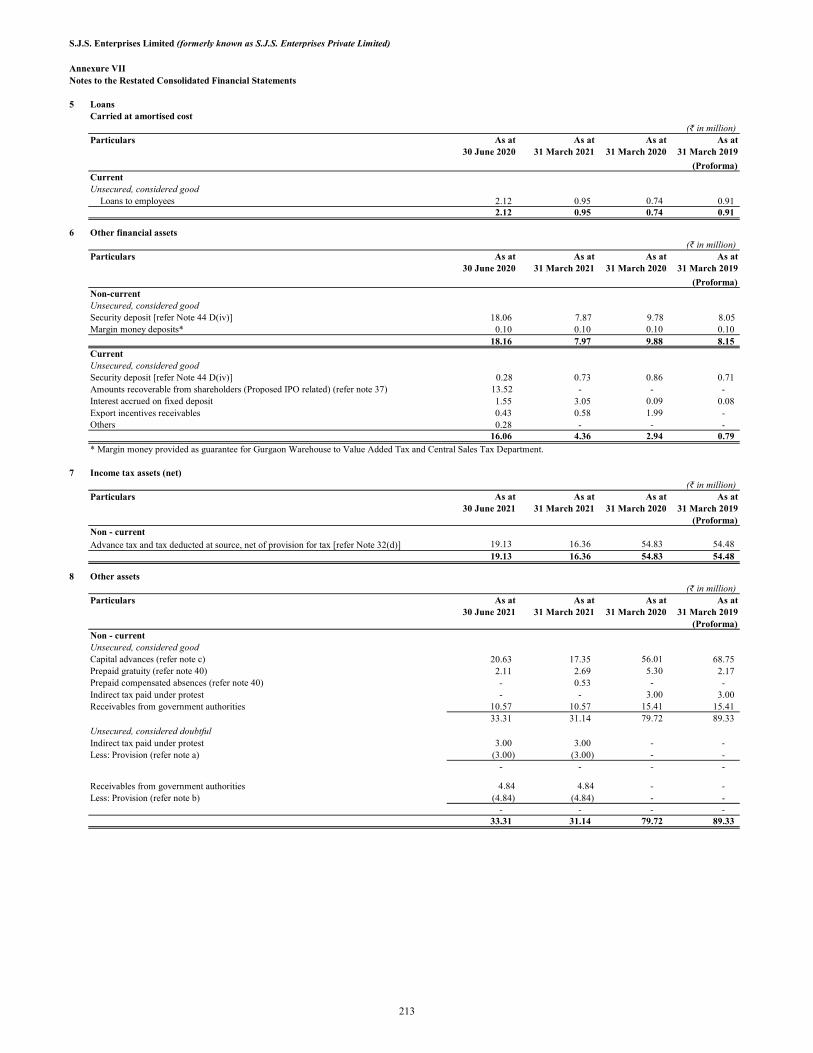
S.J.S. Enterprises Limited (formerly known as S.J.S. Enterprises Private Limited)
Annexure VIINotes to the Restated Consolidated Financial Statements
5 LoansCarried at amortised cost
(₹ in million)Particulars As at
30 June 2020As at
31 March 2021As at
31 March 2020As at
31 March 2019
(Proforma)CurrentUnsecured, considered good
Advance to EmployeeLoans to employees 2.12 0.95 0.74 0.91 2.12 0.95 0.74 0.91
6 Other financial assets(₹ in million)
Particulars As at30 June 2020
As at31 March 2021
As at31 March 2020
As at31 March 2019
(Proforma)Non-current Unsecured, considered good
Security Deposits - non currentSecurity deposit [refer Note 44 D(iv)] 18.06 7.87 9.78 8.05 Deposits with remaining maturity for more than 12 monthsMargin money deposits* 0.10 0.10 0.10 0.10
18.16 7.97 9.88 8.15 CurrentUnsecured, considered goodSecurity deposit [refer Note 44 D(iv)] 0.28 0.73 0.86 0.71 Amounts recoverable from shareholders (Proposed IPO related) (refer note 37) 13.52 - - -
Interest Accrued on DepositsInterest accrued on fixed deposit 1.55 3.05 0.09 0.08 Export incentives receivablesExport incentives receivables 0.43 0.58 1.99 - Interest on security deposit receivablesOthers 0.28 - - -
16.06 4.36 2.94 0.79
* Margin money provided as guarantee for Gurgaon Warehouse to Value Added Tax and Central Sales Tax Department.
7 Income tax assets (net)(₹ in million)
Particulars As at30 June 2021
As at31 March 2021
As at31 March 2020
As at31 March 2019
(Proforma)Non - current
Advance income-tax, net 19.13 16.36 54.83 54.48 19.13 16.36 54.83 54.48
8 Other assets(₹ in million)
Particulars As at30 June 2021
As at31 March 2021
As at31 March 2020
As at31 March 2019
(Proforma)Non - currentUnsecured, considered good
Capital advances - NCCapital advances (refer note c) 20.63 17.35 56.01 68.75 Advance paid to gratuityPrepaid gratuity (refer note 40) 2.11 2.69 5.30 2.17 Advance paid to leave salaryPrepaid compensated absences (refer note 40) - 0.53 - -
Indirect tax paid under protest - - 3.00 3.00 Receivables from government authorities 10.57 10.57 15.41 15.41
33.31 31.14 79.72 89.33 Unsecured, considered doubtful
Balances with statutory / government authorities-LTIndirect tax paid under protest 3.00 3.00 - - Provision for doubtful balancesLess: Provision (refer note a) (3.00) (3.00) - -
- - - -
Receivables with statutory / government authoritiesReceivables from government authorities 4.84 4.84 - - Provision for doubtful receivablesLess: Provision (refer note b) (4.84) (4.84) - -
- - - - 33.31 31.14 79.72 89.33
Advance tax and tax deducted at source, net of provision for tax [refer Note 32(d)]
213

S.J.S. Enterprises Limited (formerly known as S.J.S. Enterprises Private Limited)
Annexure VIINotes to the Restated Consolidated Financial Statements
8 Other assets (continued)Current
(₹ in million)
Particulars As at30 June 2021
As at31 March 2021
As at31 March 2020
As at31 March 2019
(Proforma)
Unsecured, considered goodPrepaid Expenses- CurrentPrepaid expenses 19.29 17.88 6.53 3.76 Balances with statutory / government authoritiesBalances with government authorities 5.15 1.29 4.40 0.58 Advance recoverable in cash or kindAdvance to suppliers 70.01 32.00 19.95 14.34
Prepaid gratuity (refer note 40) 6.56 6.99 6.67 4.05
Advance paid to leave salaryPrepaid compensated absences (refer note 40) - 1.44 3.40 - Others Others 0.40 0.26 0.21 0.21
101.41 59.86 41.16 22.94
9 Inventories (Valued at lower of cost and net realizable value)(₹ in million)
Particulars As at30 June 2021
As at31 March 2021
As at31 March 2020
As at31 March 2019
(Proforma)Raw materials (refer note (a) and (b)) 195.02 172.35 136.12 126.70
Work-in-progressWork-in-progress 108.45 51.76 48.69 13.83 Finished goods (refer note (b)) 140.79 101.96 85.79 103.07
Stores and sparesStores and spares 6.05 6.28 7.03 3.54 450.31 332.35 277.63 247.14
10 Investments(₹ in million)
ParticularsAs at
30 June 2021As at
31 March 2021As at
31 March 2020As at
31 March 2019(Proforma)
CurrentInvestment in Mutual FundInvestment in Mutual funds - Unquoted* 408.93 814.66 695.55 550.39
Carried at fair value through statement of profit and loss (FVTPL)(₹ in million)
Particulars As at30 June 2021
As at31 March 2021
As at31 March 2020
As at31 March 2019
(Proforma)Mutual Fund held in liquid mutual fund units
- - - 40.67
- - - 40.25
- - - 20.09
- - - 58.66
- - - 31.73
- - - 40.29
- 130.36 119.77 -
b) Bangalore Metro Rail Corporation Limited ( BMRCL) has acquired a portion of the freehold land for an agreed compensation of ₹15.41 million (including tax deductedat source). On the above land, one of the female legal heirs of the erstwhile owner of the freehold land has raised an allegation for separate possession of certain portion ofthe freehold land (Also refer note 39).
On account of the dispute, the acquisition compensation amount has been deposited by BMRCL in the Court till the final settlement. During the year ended 31 March 2021, the Group has made a total provision of ₹4.84 million primarily towards the female legal heir share of claim.
a) The provision pertains to payment made to Central Excise Department under protest.
c) Pursuant to a memorandum of understanding (‘MOU”) dated 8 April 2010, the Group had paid an advanced money of ₹ 15.00 million for lease of four acres of land forconstruction of a new factory covering 150,000 square feet for a period of 20 years. Subsequently, the land could not be converted to Industrial land due to conversionrestriction from the civic authority. Consequently, the Group has requested for refund of the advance amount due to failure to satisfaction of the terms of the MoU. On non-receipt of the advance amount, the Group filed Suit in the Court of the City Civil and Sessions Judge, Mayo Hall, Bangalore during the year ended 31 March 2011. Thematter is currently pending in the court for further hearing.
(a) Including goods in transit as on 30 June 2021 ₹50.43 million (31 March 2021 ₹43.02 million, 31 March 2020 ₹25.48 million , 31 March 2019 (Proforma) ₹11.44million)
(b) Value of inventories above is stated after provisions ₹42.61 million (31 March 2021:42.62 million, 31 March 2020: ₹14.33 million, 31 March 2019 (Proforma): Nil )for write-downs to net realisable value and provision for slow-moving and obsolete items.
Nil units (31 March 2021:Nil units; 31 March 2020:Nil units; 31 March 2019 (Proforma): 405,694.32 units) in Birla Sun Life Cash PlusNil units (31 March 2021:Nil units; 31 March 2020: Nil unit; 31 March 2019 (Proforma): 401,780.06 units) in ICICI Prudential Liquid FundNil units (31 March 2021:Nil units; 31 March 2020: Nil unit; 31 March 2019 (Proforma): 20,066.08 units) in Axis liquid FundNil units (31 March 2021:Nil units; 31 March 2020: Nil unit; 31 March 2019 (Proforma): 38,353.67 units) Reliance Liquid Fund Treasury PlanNil units (31 March 2021:Nil units; 31 March 2020: Nil unit; 31 March 2019 (Proforma): 31,625.85 units) in UTI Liquid cash planNil units (31 March 2021:Nil units; 31 March 2020: Nil unit; 31 March 2019 (Proforma): 401,752.62 units) Aditya Birla Sun Life Savings FundNil units (31 March 2021:117,486.89 units; 31 March 2020: 111,079.49, 31 March 2019 (Proforma): Nil unit) in Aditya Birla Sun Overnight Fund - Reg - Growth
214
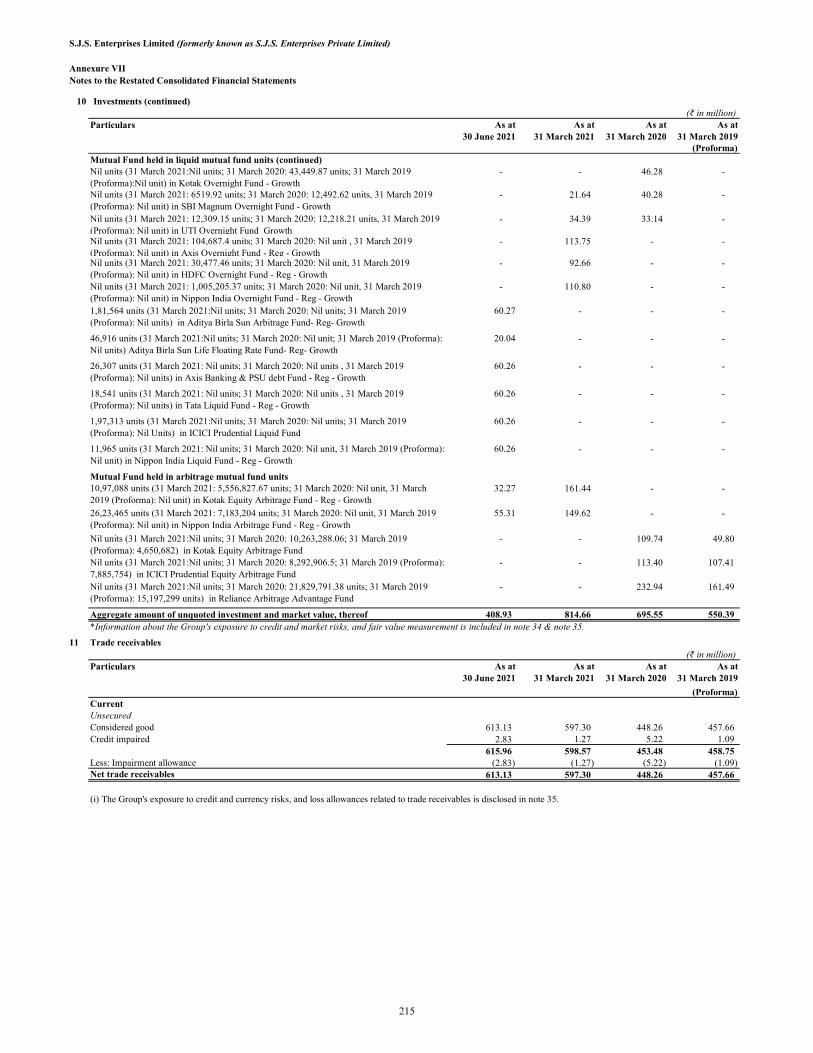
S.J.S. Enterprises Limited (formerly known as S.J.S. Enterprises Private Limited)
Annexure VIINotes to the Restated Consolidated Financial Statements
10 Investments (continued)(₹ in million)
Particulars As at30 June 2021
As at31 March 2021
As at31 March 2020
As at31 March 2019
(Proforma)Mutual Fund held in liquid mutual fund units (continued)
- - 46.28 -
- 21.64 40.28 -
- 34.39 33.14 -
- 113.75 - -
- 92.66 - -
- 110.80 - -
60.27 - - -
20.04 - - -
60.26 - - -
60.26 - - -
60.26 - - -
60.26 - - -
Mutual Fund held in arbitrage mutual fund units32.27 161.44 - -
55.31 149.62 - -
- - 109.74 49.80
- - 113.40 107.41
- - 232.94 161.49
Aggregate amount of unquoted investment and market value, thereof 408.93 814.66 695.55 550.39 *Information about the Group's exposure to credit and market risks, and fair value measurement is included in note 34 & note 35.
11 Trade receivables(₹ in million)
Particulars As at30 June 2021
As at31 March 2021
As at31 March 2020
As at31 March 2019
(Proforma)CurrentUnsecured
Trade receivables - othersConsidered good 613.13 597.30 448.26 457.66 Credit impaired 2.83 1.27 5.22 1.09
615.96 598.57 453.48 458.75 Provision for Bad DebtLess: Impairment allowance (2.83) (1.27) (5.22) (1.09)
Net trade receivables 613.13 597.30 448.26 457.66
(i) The Group's exposure to credit and currency risks, and loss allowances related to trade receivables is disclosed in note 35.
Nil units (31 March 2021:Nil units; 31 March 2020: 43,449.87 units; 31 March 2019 (Proforma):Nil unit) in Kotak Overnight Fund - GrowthNil units (31 March 2021: 6519.92 units; 31 March 2020: 12,492.62 units, 31 March 2019 (Proforma): Nil unit) in SBI Magnum Overnight Fund - GrowthNil units (31 March 2021: 12,309.15 units; 31 March 2020: 12,218.21 units, 31 March 2019 (Proforma): Nil unit) in UTI Overnight Fund GrowthNil units (31 March 2021: 104,687.4 units; 31 March 2020: Nil unit , 31 March 2019 (Proforma): Nil unit) in Axis Overnight Fund - Reg - Growth
26,23,465 units (31 March 2021: 7,183,204 units; 31 March 2020: Nil unit, 31 March 2019 (Proforma): Nil unit) in Nippon India Arbitrage Fund - Reg - Growth
Nil units (31 March 2021:Nil units; 31 March 2020: 10,263,288.06; 31 March 2019 (Proforma): 4,650,682) in Kotak Equity Arbitrage FundNil units (31 March 2021:Nil units; 31 March 2020: 8,292,906.5; 31 March 2019 (Proforma): 7,885,754) in ICICI Prudential Equity Arbitrage FundNil units (31 March 2021:Nil units; 31 March 2020: 21,829,791.38 units; 31 March 2019 (Proforma): 15,197,299 units) in Reliance Arbitrage Advantage Fund
11,965 units (31 March 2021: Nil units; 31 March 2020: Nil unit, 31 March 2019 (Proforma): Nil unit) in Nippon India Liquid Fund - Reg - Growth
Nil units (31 March 2021: 30,477.46 units; 31 March 2020: Nil unit, 31 March 2019 (Proforma): Nil unit) in HDFC Overnight Fund - Reg - GrowthNil units (31 March 2021: 1,005,205.37 units; 31 March 2020: Nil unit, 31 March 2019 (Proforma): Nil unit) in Nippon India Overnight Fund - Reg - Growth
10,97,088 units (31 March 2021: 5,556,827.67 units; 31 March 2020: Nil unit, 31 March 2019 (Proforma): Nil unit) in Kotak Equity Arbitrage Fund - Reg - Growth
1,81,564 units (31 March 2021:Nil units; 31 March 2020: Nil units; 31 March 2019 (Proforma): Nil units) in Aditya Birla Sun Arbitrage Fund- Reg- Growth
46,916 units (31 March 2021:Nil units; 31 March 2020: Nil unit; 31 March 2019 (Proforma): Nil units) Aditya Birla Sun Life Floating Rate Fund- Reg- Growth
26,307 units (31 March 2021: Nil units; 31 March 2020: Nil units , 31 March 2019 (Proforma): Nil units) in Axis Banking & PSU debt Fund - Reg - Growth
18,541 units (31 March 2021: Nil units; 31 March 2020: Nil units , 31 March 2019 (Proforma): Nil units) in Tata Liquid Fund - Reg - Growth
1,97,313 units (31 March 2021:Nil units; 31 March 2020: Nil units; 31 March 2019 (Proforma): Nil Units) in ICICI Prudential Liquid Fund
215

S.J.S. Enterprises Limited (formerly known as S.J.S. Enterprises Private Limited)
Annexure VIINotes to the Restated Consolidated Financial Statements
11 Trade receivables (continued)
(ii) Ageing for trade receivables from the due date of payment for each of the category is as follows:
Particulars
Unbilled Revenue
Current (not past due) Less than 6
months6 Months to 1 Year 1 - 2 Years 2 -3 Years
More than 3 Years Total
30 June 2021Undisputed
Considered good 5.46 477.99 127.98 1.70 - - - 613.13 Credit impaired - 0.94 1.39 0.21 0.29 - - 2.83
DisputedConsidered good - - - - - - - - Credit impaired - - - - - - - -
5.46 478.93 129.37 1.91 0.29 - - 615.96
31 March 2021Undisputed
Considered good - 541.99 55.18 0.13 - - - 597.30 Credit impaired - 0.35 0.62 0.03 0.27 - - 1.27
DisputedConsidered good - - - - - - - - Credit impaired - - - - - - - -
- 542.34 55.80 0.16 0.27 - - 598.57
31 March 2020Undisputed
Considered good - 389.34 57.06 1.86 - - - 448.26 Credit impaired - 0.49 1.14 0.73 1.91 0.95 - 5.22
DisputedConsidered good - - - - - - - - Credit impaired - - - - - - - -
- 389.83 58.20 2.59 1.91 0.95 - 453.48
31 March 2019 (Proforma)Undisputed
Considered good - 399.41 55.95 2.30 - - - 457.66 Credit impaired - 0.07 0.49 0.28 0.25 - - 1.09
DisputedConsidered good - - - - - - - - Credit impaired - - - - - - - -
- 399.48 56.44 2.58 0.25 - - 458.75
12 Cash and cash equivalents(₹ in million)
Particulars As at30 June 2021
As at31 March 2021
As at31 March 2020
As at31 March 2019
(Proforma)Balances with banks:
Balances with bank in current accoutn- in current accounts 66.33 196.13 72.09 19.35 EEFC Accounts- in Exchange earner's foreign currency accounts 31.05 16.37 31.86 6.07 - Deposits with original maturity of less than 3 months- Deposits with original maturity of less than 3 months 83.76 3.40 3.40 3.40 Cash in handCash on hand 0.26 0.22 0.26 0.19
181.40 216.12 107.61 29.01
13 Bank balance other than cash and cash equivalents(₹ in million)
Particulars As at30 June 2021
As at31 March 2021
As at31 March 2020
As at31 March 2019
(Proforma)CurrentOther bank balances
Deposits with remaining maturity for less than 12 months 176.85 159.94 - -
176.85 159.94 - -
*Includes ₹ 0.62 million as at 30 June 2021, which represents restricted bank balances in favour of Axis Bank as collateral security against Bank Guarantee given to MPCBfor subsidiary. The amount of Bank Guarantee is ₹ 0.5 million.
Outstanding for following periods from due date of payment
In deposit accounts (with original maturity of more than 3 months and less than 12 months)*
*Includes Fixed Deposit of ₹ 12 million as restricted bank balances under lien in favour of ICICI Bank as collateral security against cash credit facilities taken bysubsidiary as on 30 June 2021.
216
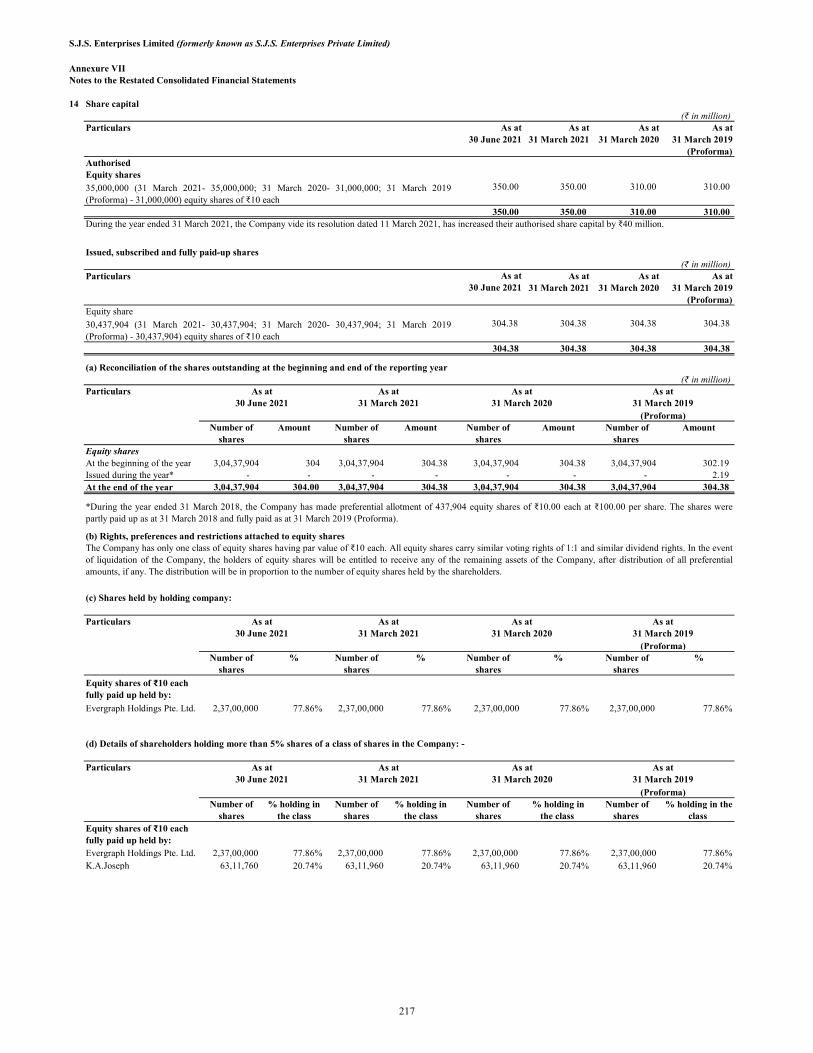
S.J.S. Enterprises Limited (formerly known as S.J.S. Enterprises Private Limited)
Annexure VIINotes to the Restated Consolidated Financial Statements
14 Share capital(₹ in million)
Particulars As at30 June 2021
As at31 March 2021
As at31 March 2020
As at31 March 2019
(Proforma)Authorised Equity shares
350.00 350.00 310.00 310.00
350.00 350.00 310.00 310.00
Issued, subscribed and fully paid-up shares(₹ in million)
Particulars As at30 June 2021
As at31 March 2021
As at31 March 2020
As at31 March 2019
(Proforma)Equity share
30,437,904 equity shares of Rs 10 each, fully paid up.
304.38 304.38 304.38 304.38
304.38 304.38 304.38 304.38
(a) Reconciliation of the shares outstanding at the beginning and end of the reporting year(₹ in million)
Particulars As at31 March 2019
(Proforma)Number of
sharesAmount Number of
sharesAmount Number of
shares Amount Number of
shares Amount
Equity sharesAt the beginning of the year 3,04,37,904 304 3,04,37,904 304.38 3,04,37,904 304.38 3,04,37,904 302.19 Issued during the year* - - - - - - - 2.19 At the end of the year 3,04,37,904 304.00 3,04,37,904 304.38 3,04,37,904 304.38 3,04,37,904 304.38
(c) Shares held by holding company:
Particulars As at31 March 2019
(Proforma)Number of
shares% Number of
shares% Number of
shares % Number of
shares %
Equity shares of ₹10 each fully paid up held by:
Evergraph Holdings Pte. Ltd. 2,37,00,000 77.86% 2,37,00,000 77.86% 2,37,00,000 77.86% 2,37,00,000 77.86%
(d) Details of shareholders holding more than 5% shares of a class of shares in the Company: -
Particulars As at31 March 2020
As at31 March 2019
(Proforma)Number of
shares% holding in
the classNumber of
shares% holding in
the classNumber of
shares % holding in
the class Number of
shares % holding in the
class Equity shares of ₹10 each fully paid up held by:Evergraph Holdings Pte. Ltd. 2,37,00,000 77.86% 2,37,00,000 77.86% 2,37,00,000 77.86% 2,37,00,000 77.86%K.A.Joseph 63,11,760 20.74% 63,11,960 20.74% 63,11,960 20.74% 63,11,960 20.74%
35,000,000 (31 March 2021- 35,000,000; 31 March 2020- 31,000,000; 31 March 2019(Proforma) - 31,000,000) equity shares of ₹10 each
30,437,904 (31 March 2021- 30,437,904; 31 March 2020- 30,437,904; 31 March 2019(Proforma) - 30,437,904) equity shares of ₹10 each
(b) Rights, preferences and restrictions attached to equity sharesThe Company has only one class of equity shares having par value of ₹10 each. All equity shares carry similar voting rights of 1:1 and similar dividend rights. In the eventof liquidation of the Company, the holders of equity shares will be entitled to receive any of the remaining assets of the Company, after distribution of all preferentialamounts, if any. The distribution will be in proportion to the number of equity shares held by the shareholders.
*During the year ended 31 March 2018, the Company has made preferential allotment of 437,904 equity shares of ₹10.00 each at ₹100.00 per share. The shares werepartly paid up as at 31 March 2018 and fully paid as at 31 March 2019 (Proforma).
During the year ended 31 March 2021, the Company vide its resolution dated 11 March 2021, has increased their authorised share capital by ₹40 million.
As at31 March 2020
As at31 March 2021
As at31 March 2020
As at31 March 2021
As at30 June 2021
As at30 June 2021
As at30 June 2021
As at31 March 2021
217
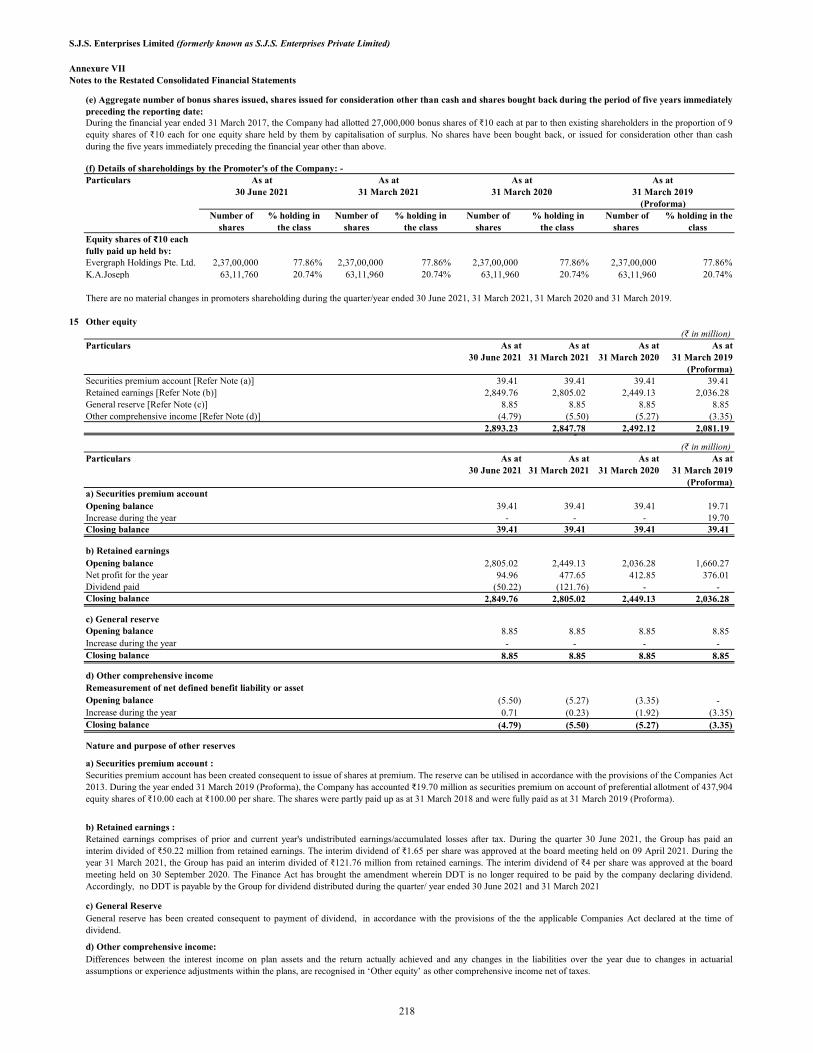
S.J.S. Enterprises Limited (formerly known as S.J.S. Enterprises Private Limited)
Annexure VIINotes to the Restated Consolidated Financial Statements
Particulars
(Proforma)Number of
shares% holding in
the classNumber of
shares% holding in
the classNumber of
shares % holding in
the class Number of
shares % holding in the
class Equity shares of ₹10 each fully paid up held by:Evergraph Holdings Pte. Ltd. 2,37,00,000 77.86% 2,37,00,000 77.86% 2,37,00,000 77.86% 2,37,00,000 77.86%K.A.Joseph 63,11,760 20.74% 63,11,960 20.74% 63,11,960 20.74% 63,11,960 20.74%
15 Other equity(₹ in million)
Particulars As at30 June 2021
As at31 March 2021
As at31 March 2020
As at31 March 2019
(Proforma)Securities premium accountSecurities premium account [Refer Note (a)] 39.41 39.41 39.41 39.41 Retained earningsRetained earnings [Refer Note (b)] 2,849.76 2,805.02 2,449.13 2,036.28 General ReserveGeneral reserve [Refer Note (c)] 8.85 8.85 8.85 8.85
Other comprehensive income [Refer Note (d)] (4.79) (5.50) (5.27) (3.35) 2,893.23 2,847.78 2,492.12 2,081.19
- - -
(₹ in million)Particulars As at
30 June 2021As at
31 March 2021As at
31 March 2020As at
31 March 2019(Proforma)
a) Securities premium accountOpening balance 39.41 39.41 39.41 19.71 Increase during the year - - - 19.70 Closing balance 39.41 39.41 39.41 39.41
b) Retained earningsOpening balance 2,805.02 2,449.13 2,036.28 1,660.27 Net profit for the year 94.96 477.65 412.85 376.01 Dividend paid (50.22) (121.76) - - Closing balance 2,849.76 2,805.02 2,449.13 2,036.28
c) General reserveOpening balance 8.85 8.85 8.85 8.85 Increase during the year - - - - Closing balance 8.85 8.85 8.85 8.85
d) Other comprehensive incomeRemeasurement of net defined benefit liability or assetOpening balance (5.50) (5.27) (3.35) - Increase during the year 0.71 (0.23) (1.92) (3.35) Closing balance (4.79) (5.50) (5.27) (3.35)
Nature and purpose of other reserves
a) Securities premium account :
b) Retained earnings :
c) General Reserve
d) Other comprehensive income:Differences between the interest income on plan assets and the return actually achieved and any changes in the liabilities over the year due to changes in actuarialassumptions or experience adjustments within the plans, are recognised in ‘Other equity’ as other comprehensive income net of taxes.
General reserve has been created consequent to payment of dividend, in accordance with the provisions of the the applicable Companies Act declared at the time ofdividend.
During the financial year ended 31 March 2017, the Company had allotted 27,000,000 bonus shares of ₹10 each at par to then existing shareholders in the proportion of 9equity shares of ₹10 each for one equity share held by them by capitalisation of surplus. No shares have been bought back, or issued for consideration other than cashduring the five years immediately preceding the financial year other than above.
Securities premium account has been created consequent to issue of shares at premium. The reserve can be utilised in accordance with the provisions of the Companies Act2013. During the year ended 31 March 2019 (Proforma), the Company has accounted ₹19.70 million as securities premium on account of preferential allotment of 437,904equity shares of ₹10.00 each at ₹100.00 per share. The shares were partly paid up as at 31 March 2018 and were fully paid as at 31 March 2019 (Proforma).
Retained earnings comprises of prior and current year's undistributed earnings/accumulated losses after tax. During the quarter 30 June 2021, the Group has paid aninterim divided of ₹50.22 million from retained earnings. The interim dividend of ₹1.65 per share was approved at the board meeting held on 09 April 2021. During theyear 31 March 2021, the Group has paid an interim divided of ₹121.76 million from retained earnings. The interim dividend of ₹4 per share was approved at the boardmeeting held on 30 September 2020. The Finance Act has brought the amendment wherein DDT is no longer required to be paid by the company declaring dividend.Accordingly, no DDT is payable by the Group for dividend distributed during the quarter/ year ended 30 June 2021 and 31 March 2021
(f) Details of shareholdings by the Promoter's of the Company: -As at
30 June 2021As at
31 March 2021As at
31 March 2020As at
31 March 2019
There are no material changes in promoters shareholding during the quarter/year ended 30 June 2021, 31 March 2021, 31 March 2020 and 31 March 2019.
(e) Aggregate number of bonus shares issued, shares issued for consideration other than cash and shares bought back during the period of five years immediatelypreceding the reporting date:
218
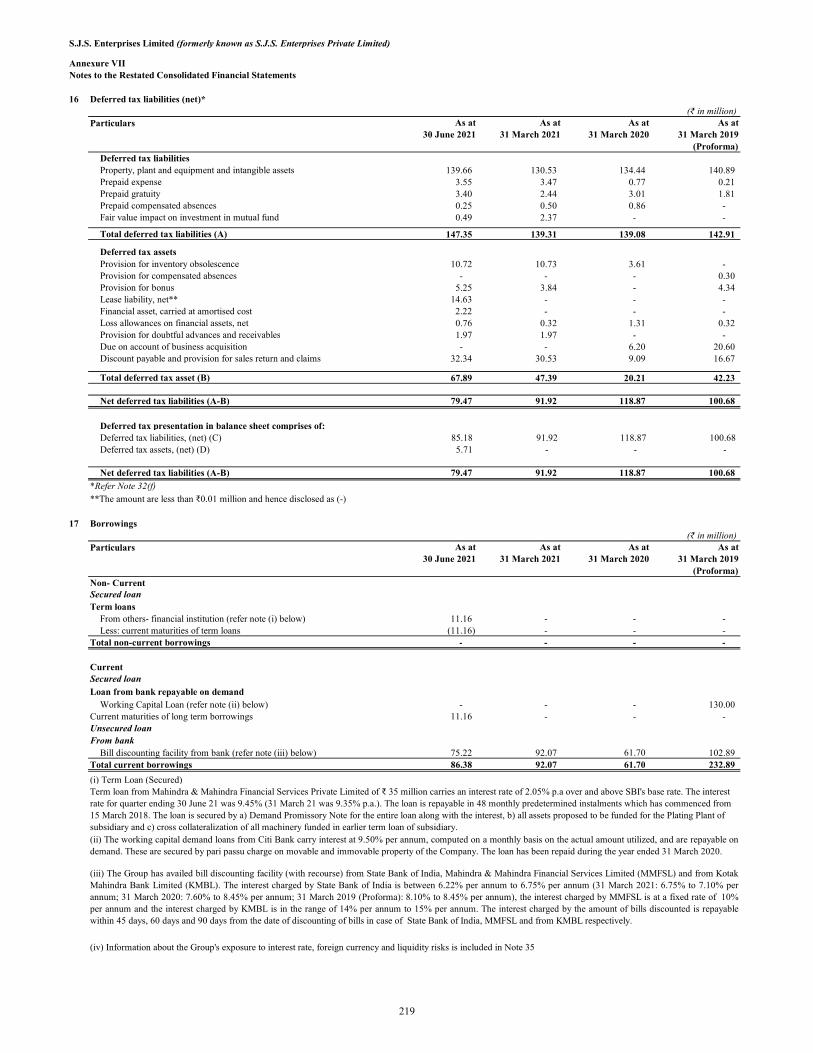
S.J.S. Enterprises Limited (formerly known as S.J.S. Enterprises Private Limited)
Annexure VIINotes to the Restated Consolidated Financial Statements
16 Deferred tax liabilities (net)*(₹ in million)
Particulars As at30 June 2021
As at31 March 2021
As at31 March 2020
As at31 March 2019
(Proforma)Deferred tax liabilitiesProperty, plant and equipment and intangible assets 139.66 130.53 134.44 140.89 Prepaid expense 3.55 3.47 0.77 0.21 Prepaid gratuity 3.40 2.44 3.01 1.81 Prepaid compensated absences 0.25 0.50 0.86 - Fair value impact on investment in mutual fund 0.49 2.37 - -
Total deferred tax liabilities (A) 147.35 139.31 139.08 142.91
Deferred tax assetsProvision for inventory obsolescence 10.72 10.73 3.61 - Provision for compensated absences - - - 0.30 Provision for bonus 5.25 3.84 - 4.34 Lease liability, net** 14.63 - - - Financial asset, carried at amortised cost 2.22 - - - Loss allowances on financial assets, net 0.76 0.32 1.31 0.32 Provision for doubtful advances and receivables 1.97 1.97 - - Due on account of business acquisition - - 6.20 20.60 Discount payable and provision for sales return and claims 32.34 30.53 9.09 16.67
Total deferred tax asset (B) 67.89 47.39 20.21 42.23
Net deferred tax liabilities (A-B) 79.47 91.92 118.87 100.68
Deferred tax presentation in balance sheet comprises of: Deferred tax liabilities, (net) (C) 85.18 91.92 118.87 100.68 Deferred tax assets, (net) (D) 5.71 - - -
Net deferred tax liabilities (A-B) 79.47 91.92 118.87 100.68
*Refer Note 32(f)
17 Borrowings(₹ in million)
Particulars As at30 June 2021
As at31 March 2021
As at31 March 2020
As at31 March 2019
(Proforma)Non- CurrentSecured loanTerm loans
From others (refer note (ii) below)From others- financial institution (refer note (i) below) 11.16 - - - Less: current maturities of term loans (Refer note no. 3.3)Less: current maturities of term loans (11.16) - - -
Total non-current borrowings - - - -
CurrentSecured loan
Loan from bank repayable on demand Working Capital LoanWorking Capital Loan (refer note (ii) below) - - - 130.00
Current maturities of long term borrowings 11.16 - - - Unsecured loanFrom bank
Bill discounting facility from bankBill discounting facility from bank (refer note (iii) below) 75.22 92.07 61.70 102.89 Total current borrowings 86.38 92.07 61.70 232.89
(i) Term Loan (Secured)
**The amount are less than ₹0.01 million and hence disclosed as (-)
Term loan from Mahindra & Mahindra Financial Services Private Limited of ₹ 35 million carries an interest rate of 2.05% p.a over and above SBI's base rate. The interest rate for quarter ending 30 June 21 was 9.45% (31 March 21 was 9.35% p.a.). The loan is repayable in 48 monthly predetermined instalments which has commenced from 15 March 2018. The loan is secured by a) Demand Promissory Note for the entire loan along with the interest, b) all assets proposed to be funded for the Plating Plant of subsidiary and c) cross collateralization of all machinery funded in earlier term loan of subsidiary.(ii) The working capital demand loans from Citi Bank carry interest at 9.50% per annum, computed on a monthly basis on the actual amount utilized, and are repayable ondemand. These are secured by pari passu charge on movable and immovable property of the Company. The loan has been repaid during the year ended 31 March 2020.
(iii) The Group has availed bill discounting facility (with recourse) from State Bank of India, Mahindra & Mahindra Financial Services Limited (MMFSL) and from KotakMahindra Bank Limited (KMBL). The interest charged by State Bank of India is between 6.22% per annum to 6.75% per annum (31 March 2021: 6.75% to 7.10% perannum; 31 March 2020: 7.60% to 8.45% per annum; 31 March 2019 (Proforma): 8.10% to 8.45% per annum), the interest charged by MMFSL is at a fixed rate of 10%per annum and the interest charged by KMBL is in the range of 14% per annum to 15% per annum. The interest charged by the amount of bills discounted is repayablewithin 45 days, 60 days and 90 days from the date of discounting of bills in case of State Bank of India, MMFSL and from KMBL respectively.
(iv) Information about the Group's exposure to interest rate, foreign currency and liquidity risks is included in Note 35
219

S.J.S. Enterprises Limited (formerly known as S.J.S. Enterprises Private Limited)
Annexure VIINotes to the Restated Consolidated Financial Statements
17 Borrowings (continued)
(₹ in million)Quarter ended
Particulars Amount as per books of account
Amount as reported in the quarterly return/ statement
Amount of difference
Reason for material discrepancy
Parent Company:Citi Bank 30 June
2021 Inventory 327.38 325.09 2.29 The variance is on
account of toolingstock not included insubmission to bank.
Trade receivables 456.49 452.81 3.68 Advance fromcustomer have beenclassified as otherliabilities in the bookswhereas the samehave been netted offwhile submitting thereturn to bank.
Subsidary Company:ICICI Bank 30 June
2021 Inventory 122.93 117.27 5.66 The variance is on
account of toolingstock not included insubmission to bank.
Trade receivables 156.64 128.24 28.40 Bills discounted withrecourse have beenreclassified asborrowings in thebooks whereas thesame have been nettedoff while submittingthe return to bank
Parent Company:Citi Bank 31 March
2021 Inventory 332.34 332.34 - No Variance
Trade receivables 598.41 537.85 60.56 The variance is oncertain year endadjustment carriedpost filing of returnswith the banks.
Citi Bank 31 December
Inventory 263.82 279.15 -15.33
Trade receivables 554.55 506.80 47.75
State Bank of India and Citi Bank 30 September 2020
Inventory 282.68 291.29 -8.61 The variance is oncertain period endadjustment carriedpost filing of returnswith the banks.
Trade receivables 580.80 580.76 0.04 No material variance
State Bank of India and Citi Bank 30 June 2020
Inventory 236.35 242.67 -6.32 The variance is oncertain period endadjustment carriedpost filing of returnswith the banks.
Trade receivables 293.97 291.28 2.69
The variance is oncertain period endadjustment carriedpost filing of returnswith the banks.
The variance is oncertain period endadjustment carriedpost filing of returnswith the banks.
Name of bank
(v) The Group is filing monthly statement of inventories and trade receivables to SBI, Citi Bank and ICICI Bank for cash credit facility and working capital loan. The below is summary of quarterly reconcliation of statement filed to the banks and books of accounts :
220
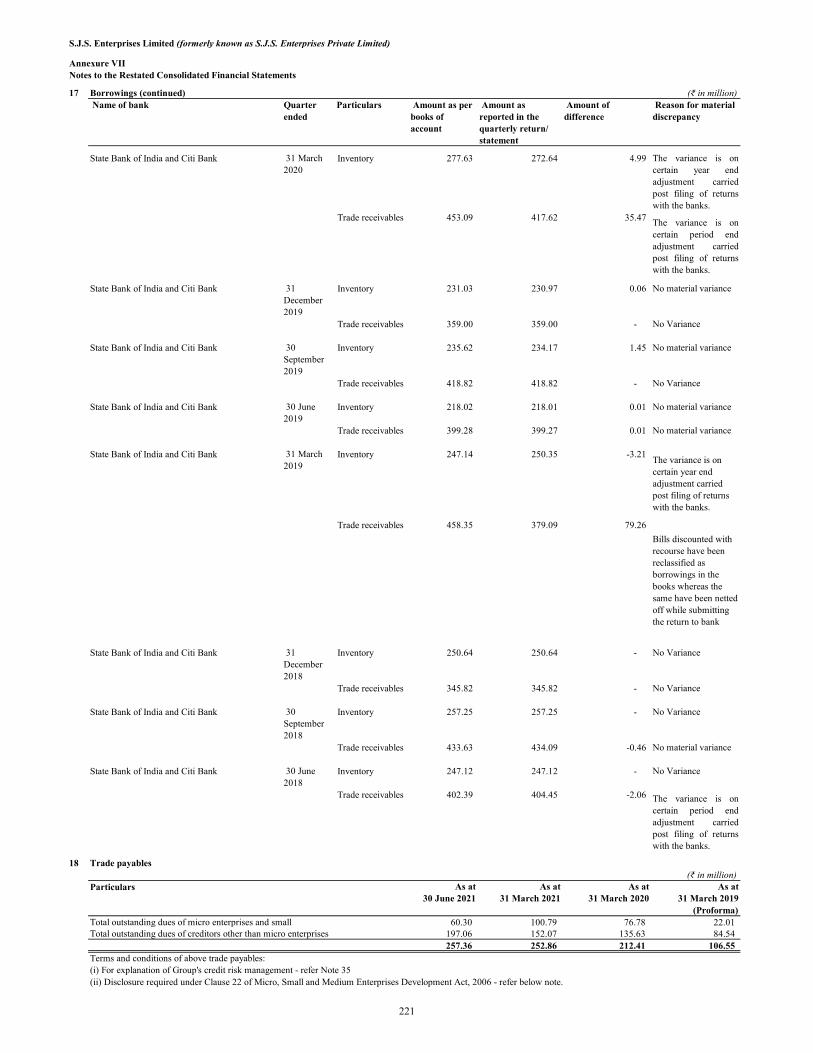
S.J.S. Enterprises Limited (formerly known as S.J.S. Enterprises Private Limited)
Annexure VIINotes to the Restated Consolidated Financial Statements
17 Borrowings (continued) (₹ in million)Quarter ended
Particulars Amount as per books of account
Amount as reported in the quarterly return/ statement
Amount of difference
Reason for material discrepancy
State Bank of India and Citi Bank 31 March 2020
Inventory 277.63 272.64 4.99 The variance is oncertain year endadjustment carriedpost filing of returnswith the banks.
Trade receivables 453.09 417.62 35.47
State Bank of India and Citi Bank 31 December 2019
Inventory 231.03 230.97 0.06 No material variance
Trade receivables 359.00 359.00 - No Variance
State Bank of India and Citi Bank 30 September 2019
Inventory 235.62 234.17 1.45 No material variance
Trade receivables 418.82 418.82 - No Variance
State Bank of India and Citi Bank 30 June 2019
Inventory 218.02 218.01 0.01 No material variance
Trade receivables 399.28 399.27 0.01 No material variance
State Bank of India and Citi Bank 31 March 2019
Inventory 247.14 250.35 -3.21 The variance is on certain year end adjustment carried post filing of returns with the banks.
Trade receivables 458.35 379.09 79.26
Bills discounted with recourse have been reclassified as borrowings in the books whereas the same have been netted off while submitting the return to bank
State Bank of India and Citi Bank 31 December 2018
Inventory 250.64 250.64 - No Variance
Trade receivables 345.82 345.82 - No Variance
State Bank of India and Citi Bank 30 September 2018
Inventory 257.25 257.25 - No Variance
Trade receivables 433.63 434.09 -0.46 No material variance
State Bank of India and Citi Bank 30 June 2018
Inventory 247.12 247.12 - No Variance
Trade receivables 402.39 404.45 -2.06
18 Trade payables(₹ in million)
Particulars As at30 June 2021
As at31 March 2021
As at31 March 2020
As at31 March 2019
(Proforma)Total outstanding dues of micro enterprises and small enterprises MSME 60.30 100.79 76.78 22.01
Total outstanding dues of creditors other than micro and small enterprises 197.06 152.07 135.63 84.54 257.36 252.86 212.41 106.55
Terms and conditions of above trade payables:(i) For explanation of Group's credit risk management - refer Note 35(ii) Disclosure required under Clause 22 of Micro, Small and Medium Enterprises Development Act, 2006 - refer below note.
Total outstanding dues of micro enterprises and small Total outstanding dues of creditors other than micro enterprises
Name of bank
with the banks.
The variance is oncertain period endadjustment carriedpost filing of returnswith the banks.
The variance is oncertain period endadjustment carriedpost filing of returnswith the banks.
221

S.J.S. Enterprises Limited (formerly known as S.J.S. Enterprises Private Limited)
Annexure VIINotes to the Restated Consolidated Financial Statements18 Trade payables (continued)
(₹ in million)Particulars As at
30 June 2021As at
31 March 2021As at
31 March 2020As at
31 March 2019(Proforma)
60.30 100.79 76.78 22.01 - - - -
66.31 405.13 261.21 96.41
- - -
- - -
- - -
* denotes principle paid(iii) Ageing for trade payable from the due date of payment for each of the category is as follows:
Not due Less than 1 year 1-2 years 2-3 years More than 3 years Total
30 June 2021Micro enterprises and small enterprises - 59.20 1.10 - - - 60.30 Creditors other than micro enterprises and small enterprises 25.08 83.94 87.96 0.01 0.07 197.06Disputed dues of micro enterprises and small enterprises - - - - - - - Disputed dues of creditors other than micro enterprises and small enterprises - - - - - - -
25.08 143.14 89.06 0.01 - 0.07 257.36
31 March 2021Micro enterprises and small enterprises - 98.69 2.10 - - 100.79Creditors other than micro enterprises and small enterprises 10.15 95.93 45.99 - - 152.07Disputed dues of micro enterprises and small enterprises - - - - - - - Disputed dues of creditors other than micro enterprises and small enterprises - - - - - - -
10.15 194.62 48.09 - - - 252.86
31 March 2020Micro enterprises and small enterprises - 49.44 27.34 - - 76.78 Creditors other than micro enterprises and small enterprises 6.99 82.99 45.73 -0.08 - - 135.63 Disputed dues of micro enterprises and small enterprises - - - - - - - Disputed dues of creditors other than micro enterprises and small enterprises - - - - - - -
6.99 132.43 73.07 -0.08 - - 212.41
31 March 2019Micro enterprises and small enterprises - 21.06 0.95 - - - 22.01Creditors other than micro enterprises and small enterprises 8.95 58.37 17.22 - - - 84.54Disputed dues of micro enterprises and small enterprises - - - - - - - Disputed dues of creditors other than micro enterprises and small enterprises - - - - - - -
8.95 79.43 18.17 - - - 106.55
Interest due on the above. Principal amount due to micro and small enterprises.
The principal amount and the interest due thereon remaining unpaid to any supplier as at the end of each accounting year:
(iv) The amount of further interest remaining due and payable even in the succeeding years, until such date when the interest dues as above are actually paid to the small enterprise for the purpose of disallowance as a deductible expenditure under Section 23 of the MSMED Act, 2006.
(iii) The amount of interest accrued and remaining unpaid at the end of each accounting year.
(i) The amount of interest paid by the buyer in terms of Section 16 of the MSMED Act, 2006 along with the amounts of the payment made to the supplier beyond the appointed day during each accounting year.*
(ii) The amount of interest due and payable for the period of delay in making payment (which has been paid but beyond appointed day during the year) but without adding the interest specified under the MSMED Act, 2006.
The above disclosures are provided by the Group based on the information available with the Group in respect of the registration status of its vendors/ suppliers.
Particulars Outstanding for following periods from due date of paymentAccrued expenses
222

S.J.S. Enterprises Limited (formerly known as S.J.S. Enterprises Private Limited)
Annexure VIINotes to the Restated Consolidated Financial Statements
19 Other financial liabilities(₹ in million)
Particulars As at30 June 2021
As at31 March 2021
As at31 March 2020
As at31 March 2019
(Proforma)Non-currentDue on account of business acquisition [refer Note 42] - - - 24.57
- - - 24.57
CurrentInterest accrued
Interest accrued but not due on borrowingsInterest accrued but not due on borrowings - - 0.01 0.10
OthersEmployee benefits payableEmployee related liabilities 71.30 40.47 21.05 23.23 Retention MoneyRetention money 0.30 0.30 0.55 6.49 Liability for Business AcquisitionDue on account of business acquisition [refer Note 42] - - 24.57 46.17 Payables on purchase of property, plant and equipmentCapital creditors 18.20 20.42 10.91 25.33 Provision for discount - currentDiscount Payable 115.27 108.62 26.82 47.73
IPO Expenses payable ( refer Note 37) 13.52 - - - Other liabilitiesOthers 0.34 - - -
218.93 169.81 83.91 149.05
Information about the Group's exposure to interest rate, foreign currency and liquidity risks is included in Note 35
20 Provisions(₹ in million)
Particulars As at30 June 2021
As at31 March 2021
As at31 March 2020
As at31 March 2019
(Proforma)CurrentProvision for employee benefits
Provision for Compensated AbsencesProvision for compensated absence 2.18 - - 1.04 Others*
Provision for claimProvision for claim 2.21 2.21 0.25 2.20 Provision for returnProvision for return 13.13 10.41 9.03 7.27
17.52 12.62 9.28 10.51
Movement in other provisions for quarter ended 30 June 2021(₹ in million)
Particulars As at31 March
2021
Additions due to acquisition (refer
Note 42)
Provision made during the
quarter
Provision utilised during the quarter
Provision reversed during the quarter
As at30 June 2021
Provision for claim 2.21 - - - - 2.21 Provision for return 10.41 1.77 3.94 (2.99) - 13.13
12.62 1.77 3.94 (2.99) - 15.34
Movement in other provisions for the year ended 31 March 2021(₹ in million)
Particulars As at31 March 2020
Provision made during the year
Provision utilised during the year
Provision reversed during the year
As at31 March 2021
Provision for claim 0.25 2.21 (0.25) - 2.21 Provision for return 9.03 10.41 (4.44) (4.59) 10.41
9.28 12.62 (4.69) (4.59) 12.62 Movement in other provisions for the year ended 31 March 2020
(₹ in million)Particulars As at
31 March 2019 (Proforma)
Provision made during the year
Provision utilised during the year
Provision reversed during the year
As at31 March 2020
Provision for claim 2.20 0.25 (0.85) (1.35) 0.25 Provision for return 7.27 9.03 (6.07) (1.20) 9.03
9.47 9.28 (6.92) (2.55) 9.28
Movement in other provisions for the year ended 31 March 2019(₹ in million)
Particulars As at 01 April 2018
(Proforma)
Provision made during the year
Provision utilised during the year
Provision reversed during the year
As at31 March 2019
(Proforma)Provision for claim - 2.20 - - 2.20 Provision for return 8.54 7.27 (5.27) (3.27) 7.27
8.54 9.47 (5.27) (3.27) 9.47
*This represents provision made for expected sales returns and claim by the customers. Revenue is adjusted for the expected value of return and claims. It is expected to beutilised within 12 months from the end of the year. The provision is based on estimates made of historical data.
223

S.J.S. Enterprises Limited (formerly known as S.J.S. Enterprises Private Limited)
Annexure VIINotes to the Restated Consolidated Financial Statements
21 Other liabilities(₹ in million)
Particulars As at30 June 2021
As at31 March 2021
As at31 March 2020
As at31 March 2019
(Proforma)Current
Statutory dues payableStatutory dues payable 17.48 20.50 3.39 14.12 Advances from customersAdvance from customers 49.18 4.00 5.46 0.01 Others liabilitiesOther payables 3.24 - - - Provision for CSR ContributionLiability for CSR Contribution [refer Note 38] 2.45 2.17 1.13 -
72.35 26.67 9.98 14.13
22 LeasesThe Group has recognised right-of-use assets and lease liabilities as below:
(₹ in million)Particulars As at
30 June 2021As at
31 March 2021As at
31 March 2020As at
31 March 2019(Proforma)
Leasehold LandRight of use assets – land 201.22 77.40 35.72 36.08 Accumulated Depreciation- Leasehold Land
Lease liabilitiesLease LiabilityNon-current 148.85 0.08 0.05 0.05 Lease liabilities currentCurrent 27.80 0.04 0.02 0.02
Right-of-use assets: The details of the right-of-use asset held by the Group is as follows:(₹ in million)
Particulars As at30 June 2021
As at31 March 2021
As at31 March 2020
As at31 March 2019
(Proforma)Opening balance 77.40 35.72 36.08 36.44
Amortisation of ROU assetsDepreciation charge for the year (3.24) (0.36) (0.36) (0.36) Additions to right of use asset* - 42.04 - -
Right-of-use assetsAdditions to right of use asset due to acquisition (refer Note 42) 127.06 - - - Closing balance 201.22 77.40 35.72 36.08
Amounts recognised in statement of profit or loss:(₹ in million)
Particulars For the quarter ended For the year ended For the year ended For the year ended30 June 2021 31 March 2021 31 March 2020 31 March 2019
(Proforma)Interest on lease liabilities* 4.40 - - - Expenses relating to short-term leases 1.18 2.47 2.05 4.47 Other income - Finance income (0.29) - - -
5.29 2.47 2.05 4.47 * The amount are less than INR 0.01 million and hence disclosed as (-)
Amounts recognised in statement of cashflows:
(₹ in million)Particulars As at
30 June 2021As at
31 March 2021As at
31 March 2020As at
31 March 2019(Proforma)
Less than one year 27.80 0.04 - - one to five years 138.86 0.04 0.05 0.04 more than five years 111.46 0.41 0.38 0.39 Less: Imputed interest (101.47) (0.37) (0.36) (0.36)
176.65 0.12 0.07 0.07
The Group has certain warehouse and guest house on lease with contract terms of less than one year. These leases are classified as short-term. The Group has elected not torecognise right-of-use assets and lease liabilities for these leases.
The table below provides details regarding the contractual maturities of lease liabilities as at 30 June 2021, 31 March 2021, 31 March 2020 and 31 March 2019 (Proforma).
When measuring lease liabilities for leases that were classified as operating leases, the Group discounted lease payments using its incremental borrowing rate at date ofcommencement of lease. The weighted-average rate considered is 8.70% p.a. to 10% p.a.
*During the year 31 March 2021, the Company had entered into a lease cum sale agreement with Karnataka Industrial Area Development Board (KIADB) for 2 acres ofland for a period of 15 years. As per the lease cum sale agreement, the KIADB shall sell the land to the Company on the completion of 15 years, upon lessee performing allthe conditions mentioned in the agreement and committed no breach thereof. Management expects that all the conditions stipulated in the agreement will be fulfilled andmanagement has intention to buy the land at the end of 15 years. Accordingly, no depreciation has been charged on land taken on lease from KIADB.
During the quarter, the Group had no cash outflow related to right-of-use asset (Cash outflow of ₹2.39 million during 31 March 2021 for right-of-use asset; Cash inflowduring 31 March 2020 on account of refund of capital advance: ₹5.7 million and cash outflow on account of capital advance during 31 March 2019 (Proforma): ₹13.23million).During the quarter, for short term leases the Group had a cash outflow of ₹1.18 million (31 March 2021: ₹2.47 million, 31 March 2020: ₹2.05 million, 31 March 2019(Proforma): ₹4.47 million). During the quarter, the Group had cash outflow of ₹6.95 million ( 31 March 2021: Nil, 31 March 2020: Nil, 31 March 2019 (Proforma): Nil)for payment of principle and interest on lease liability.
224

S.J.S. Enterprises Limited (formerly known as S.J.S. Enterprises Private Limited)
Annexure VIINotes to the Restated Consolidated Financial Statements
23 Revenue from operations(₹ in million)
Particulars For quarter ended For the year ended For the year ended For the year ended30 June 2021 31 March 2021 31 March 2020 31 March 2019
(Proforma)Discount Revenue from contract with customers Sale of manufactured goodsSale of products 738.91 2,477.69 2,131.47 2,357.94 Sale of services Sale of services 1.86 29.46 22.14 11.16
Other operating revenues:Duty drawbackExport incentive benefit 0.42 3.82 3.33 - Other operating revenuesScrap sales 1.50 5.19 4.79 3.42
Gross Revenue from operations 742.69 2,516.16 2,161.73 2,372.52
Reconciling the amount of revenue recognised in the statement of profit and loss with the contracted price(₹ in million)
Other operating revenuesParticulars For quarter ended For the year ended For the year ended For the year ended Sale of services 30 June 2021 31 March 2021 31 March 2020 31 March 2019
(Proforma) Sale of manufactured goodsRevenue as per contract price 746.76 2,578.78 2,153.07 2,409.48 Discount Reduction towards discount (6.90) (95.27) (13.77) (47.54)
Reduction towards sales return (0.95) (5.82) (7.83) (4.00) Revenue from contract with customers 738.91 2,477.69 2,131.47 2,357.94
Contract balances(₹ in million)
Particulars As at As at As at As at30 June 2021 31 March 2021 31 March 2020 31 March 2019
(Proforma)Trade receivables 613.13 597.30 448.26 457.66 Advance from customers 49.18 4.00 5.46 0.01
24 Other income(₹ in million)
Particulars For quarter ended For the year ended For the year ended For the year ended30 June 2021 31 March 2021 31 March 2020 31 March 2019
(Proforma)Interest income:
Interest Income- Bank DepositOn deposits with bank 2.29 4.44 0.17 0.20 Interest income - Income tax refundOn income tax refund - 1.99 - - Others- Other IncomeOn others 0.69 0.62 0.47 0.24 Dividend incomeDividend income - - 30.05 24.42
Other non-operating income:Profit on measurement at fair value (Mutual fund)Fair value gain on current investment measured at FVTPL 1.95 9.43 0.75 0.08 Gain / Loss on redemption of MF (Net)Gain/(loss) on sale of current investments measured at FVTPL 1.28 18.08 0.79 (0.70) Foreign exchange gain, netNet gain on foreign currency transactions 3.82 - 14.85 8.47 Liabilities no longer required, written backLiabilities no longer required, written back - 0.28 3.27 2.09
Other non-operating incomeMiscellaneous 0.22 0.54 0.65 0.31 10.25 35.38 51.00 35.11
25 Cost of raw material consumed(₹ in million)
Particulars For quarter ended For the year ended For the year ended For the year ended30 June 2021 31 March 2021 31 March 2020 31 March 2019
(Proforma)Inventory of materials at the beginning of the year# 172.35 136.12 126.70 121.63 Addition in opening raw material due to acquistion (refer Note 42) 28.34 - - -
Add: PurchasesAdd: Purchases 314.48 1,026.52 854.11 953.19 Less: Inventory of materials at the end of the year# 195.02 172.35 136.12 126.70
320.15 990.29 844.69 948.12 # Net of provision for obsolescence
While disclosing the aggregate amount of transaction price yet to be recognised as revenue towards unsatisfied (or partially satisfied) performance obligations, along withthe broad time band for the expected time to recognize those revenues, the Group has applied the practical expedient in Ind AS 115. Accordingly, the Group has notdisclosed the aggregate transaction price allocated to unsatisfied (or partially satisfied) performance obligations which pertain to contracts where revenue recognisedcorresponds to the value transferred to customer typically involving event based contracts.
225
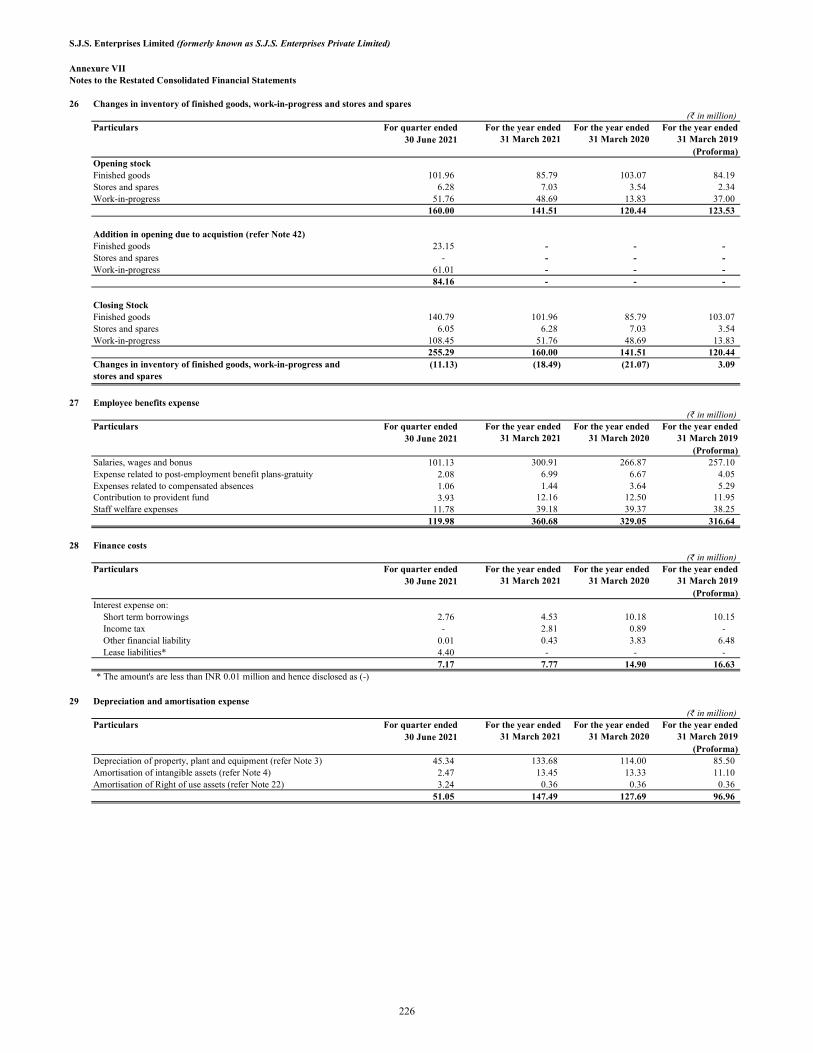
S.J.S. Enterprises Limited (formerly known as S.J.S. Enterprises Private Limited)
Annexure VIINotes to the Restated Consolidated Financial Statements
26 Changes in inventory of finished goods, work-in-progress and stores and spares(₹ in million)
Particulars For quarter ended For the year ended For the year ended For the year ended30 June 2021 31 March 2021 31 March 2020 31 March 2019
(Proforma)Opening stockFinished goods 101.96 85.79 103.07 84.19 Stores and spares 6.28 7.03 3.54 2.34 Work-in-progress 51.76 48.69 13.83 37.00
160.00 141.51 120.44 123.53
Addition in opening due to acquistion (refer Note 42)Finished goods 23.15 - - - Stores and spares - - - - Work-in-progress 61.01 - - -
84.16 - - -
Closing StockFinished goods 140.79 101.96 85.79 103.07 Stores and spares 6.05 6.28 7.03 3.54 Work-in-progress 108.45 51.76 48.69 13.83
255.29 160.00 141.51 120.44 (11.13) (18.49) (21.07) 3.09
27 Employee benefits expense(₹ in million)
Particulars For quarter ended For the year ended For the year ended For the year ended30 June 2021 31 March 2021 31 March 2020 31 March 2019
(Proforma)Salaries and Wages Salaries, wages and bonus 101.13 300.91 266.87 257.10 Gratuity ExpenseExpense related to post-employment benefit plans-gratuity 2.08 6.99 6.67 4.05 Leave SalaryExpenses related to compensated absences 1.06 1.44 3.64 5.29 Contn to FundsContribution to provident fund 3.93 12.16 12.50 11.95 Staff Welfare ExpensesStaff welfare expenses 11.78 39.18 39.37 38.25
119.98 360.68 329.05 316.64
28 Finance costs(₹ in million)
Particulars For quarter ended For the year ended For the year ended For the year ended30 June 2021 31 March 2021 31 March 2020 31 March 2019
(Proforma)Interest expense on:
Interest on borrowingsShort term borrowings 2.76 4.53 10.18 10.15 Interest on payment of income taxIncome tax - 2.81 0.89 - Interest on other financial liabilityOther financial liability 0.01 0.43 3.83 6.48 Interest on Lease liabilitesLease liabilities* 4.40 - - -
7.17 7.77 14.90 16.63 * The amount's are less than INR 0.01 million and hence disclosed as (-)
29 Depreciation and amortisation expense(₹ in million)
Particulars For quarter ended For the year ended For the year ended For the year ended30 June 2021 31 March 2021 31 March 2020 31 March 2019
(Proforma)DepreciationDepreciation of property, plant and equipment (refer Note 3) 45.34 133.68 114.00 85.50 AmortisationAmortisation of intangible assets (refer Note 4) 2.47 13.45 13.33 11.10 Amortisation of ROU assetsAmortisation of Right of use assets (refer Note 22) 3.24 0.36 0.36 0.36
51.05 147.49 127.69 96.96
Changes in inventory of finished goods, work-in-progress and stores and spares
226
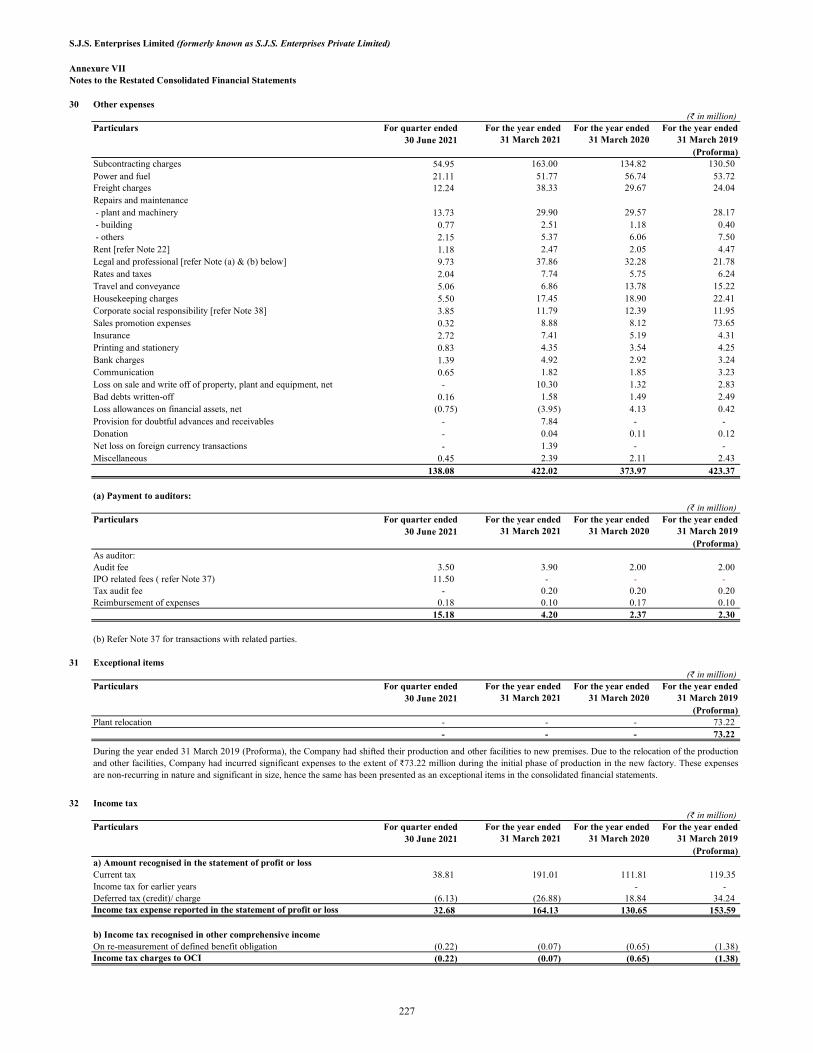
S.J.S. Enterprises Limited (formerly known as S.J.S. Enterprises Private Limited)
Annexure VIINotes to the Restated Consolidated Financial Statements
30 Other expenses(₹ in million)
Particulars For quarter ended For the year ended For the year ended For the year ended30 June 2021 31 March 2021 31 March 2020 31 March 2019
(Proforma)Subcontracting chargesSubcontracting charges 54.95 163.00 134.82 130.50 Power and fuelPower and fuel 21.11 51.77 56.74 53.72 Courier and freight Freight charges 12.24 38.33 29.67 24.04 Repairs and maintenanceRepairs and maintenance - plant and machinery - plant and machinery 13.73 29.90 29.57 28.17 - building - building 0.77 2.51 1.18 0.40 - others - others 2.15 5.37 6.06 7.50
Rent [refer Note 22] 1.18 2.47 2.05 4.47 Legal and professional Legal and professional [refer Note (a) & (b) below] 9.73 37.86 32.28 21.78 Rates and taxesRates and taxes 2.04 7.74 5.75 6.24 Travel and conveyanceTravel and conveyance 5.06 6.86 13.78 15.22 Housekeeping chargesHousekeeping charges 5.50 17.45 18.90 22.41 Corporate social responsibility (refer note 34)Corporate social responsibility [refer Note 38] 3.85 11.79 12.39 11.95
Sales promotion expensesSales promotion expenses 0.32 8.88 8.12 73.65 Insurance Insurance 2.72 7.41 5.19 4.31
Printing and stationeryPrinting and stationery 0.83 4.35 3.54 4.25 Bank chargesBank charges 1.39 4.92 2.92 3.24 CommunicationCommunication 0.65 1.82 1.85 3.23 Loss on sale and written off of property, plant and equipmentLoss on sale and write off of property, plant and equipment, net - 10.30 1.32 2.83 Bad debts written-offBad debts written-off 0.16 1.58 1.49 2.49 Provision for bad and doubtful debtsLoss allowances on financial assets, net (0.75) (3.95) 4.13 0.42 Advances written off Provision for doubtful advances and receivables - 7.84 - - Donation Donation - 0.04 0.11 0.12 Foreign exchange gain, netNet loss on foreign currency transactions - 1.39 - - Miscellaneous expensesMiscellaneous 0.45 2.39 2.11 2.43
138.08 422.02 373.97 423.37
(a) Payment to auditors:(₹ in million)
Particulars For quarter ended For the year ended For the year ended For the year ended30 June 2021 31 March 2021 31 March 2020 31 March 2019
(Proforma)As auditor:Audit fee 3.50 3.90 2.00 2.00 IPO related fees ( refer Note 37) 11.50 - - - Tax audit fee - 0.20 0.20 0.20 Reimbursement of expenses 0.18 0.10 0.17 0.10
15.18 4.20 2.37 2.30
(b) Refer Note 37 for transactions with related parties.
31 Exceptional items(₹ in million)
Particulars For quarter ended For the year ended For the year ended For the year ended30 June 2021 31 March 2021 31 March 2020 31 March 2019
(Proforma)Plant relocationPlant relocation - - - 73.22
- - - 73.22
32 Income tax(₹ in million)
Particulars For quarter ended For the year ended For the year ended For the year ended30 June 2021 31 March 2021 31 March 2020 31 March 2019
(Proforma)a) Amount recognised in the statement of profit or loss
Current tax Current tax 38.81 191.01 111.81 119.35 Income tax for earlier yearsIncome tax for earlier years - - Deferred tax charge/ (credit)Deferred tax (credit)/ charge (6.13) (26.88) 18.84 34.24
Income tax expense reported in the statement of profit or loss 32.68 164.13 130.65 153.59
b) Income tax recognised in other comprehensive incomeIncome tax effectOn re-measurement of defined benefit obligation (0.22) (0.07) (0.65) (1.38)
Income tax charges to OCI (0.22) (0.07) (0.65) (1.38)
During the year ended 31 March 2019 (Proforma), the Company had shifted their production and other facilities to new premises. Due to the relocation of the productionand other facilities, Company had incurred significant expenses to the extent of ₹73.22 million during the initial phase of production in the new factory. These expensesare non-recurring in nature and significant in size, hence the same has been presented as an exceptional items in the consolidated financial statements.
227

S.J.S. Enterprises Limited (formerly known as S.J.S. Enterprises Private Limited)
Annexure VIINotes to the Restated Consolidated Financial Statements
32 Income tax (continued)
c) Reconciliation of tax expense and tax based on accounting profit:Profit before income tax expense 127.64 641.78 543.50 529.60 Tax at the Indian tax rate of 25.17% (2021: 25.17%) 32.13 161.54 136.80 154.22 Tax effect of:
0.86 3.03 3.16 5.17 Tax effect on donation - 0.01 (1.22) (1.71)
- - (6.21) (0.75) Lower tax rate on capital gains (0.09) (0.65) (6.30) (6.93) Other deductions (0.22) 0.20 4.42 3.59 Income tax expense 32.68 164.13 130.65 153.59
(₹ in million)Particulars As at As at As at As at
30 June 2021 31 March 2021 31 March 2020 31 March 2019(Proforma)
Non currentAdvance income-tax, netIncome tax asset 19.13 16.36 54.83 54.48
CurrentProvision for tax, net of advance taxCurrent income tax liabilities 50.38 37.21 29.83 16.47
Net income tax (liability)/asset at the end (31.25) (20.85) 25.00 38.01
(₹ in million)Particulars For the quarter ended For the year ended For the year ended For the year ended
30 June 2021 31 March 2021 31 March 2020 31 March 2019(Proforma)
Net income tax asset at the beginning (20.85) 25.00 38.01 (28.64)Additions due to acquisition (refer Note 42) (7.69) - - - Current income tax expense (38.81) (191.01) (111.81) (119.35)Interest on income tax paid - (2.81) (0.89) - Income tax paid (including interest) 36.10 183.07 99.69 186.00 Refund received (including interest) - (37.09) - - Interest income on tax refund - 1.99 - - Net income tax (liability) /asset at the end (31.25) (20.85) 25.00 38.01
f) Deferred tax
For the quarter ended 30 June 2021(₹ in million)
Particulars As at Recognised in OtherRecognised in Statement As at31 March 2021 Comprehensive Income of Profit and Loss 30 June 2021
Deferred tax liability 130.53 12.26 - (3.13) 139.66
Prepaid expense 3.47 - - 0.08 3.55 2.37 - - (1.88) 0.49
Prepaid gratuity 2.44 (0.03) (0.22) 0.77 3.40 Prepaid compensated absences 0.50 (0.86) - 0.61 0.25
139.31 11.37 (0.22) (3.55) 147.35
Deferred tax asset 10.73 - - (0.01) 10.72
Provision for bonus 3.84 - - 1.41 5.25 Lease liability, net* - 14.47 - 0.16 14.63 Financial asset, carried at amortised cost 2.3 (0.08) 2.22
0.32 0.65 - (0.21) 0.76 1.97 - - - 1.97
Due on account of business acquisition - - - - - 30.53 0.49 - 1.32 32.34
47.39 17.91 - 2.59 67.89
Deferred tax liability, net 91.92 (6.54) (0.22) (6.13) 79.47
Expenditure for which deduction is not allowed under Income Tax
Property, plant and equipment and
Fair value impact on investment in
Provision for inventory obsolescence
Loss allowances on financial assets, netProvision for doubtful advances and
Discount payable and provision for sales
* The amount are less than ₹0.01 million and hence disclosed as (-)
Additions due to acquisition (refer Note
42)
Change in tax rate for future period considered for deferred tax
d) The following table provides the details of income tax liabilies and assets as of 30 June 2021, 31 March 2021, 31 March 2020 and 31 March 2019:
e) The gross movement in the income tax (liability) / asset for quarter ended 30 June 2021 and the years ended 31 March 2021, 31 March 2020 and 31 March2019 (Proforma) is as follows:
228
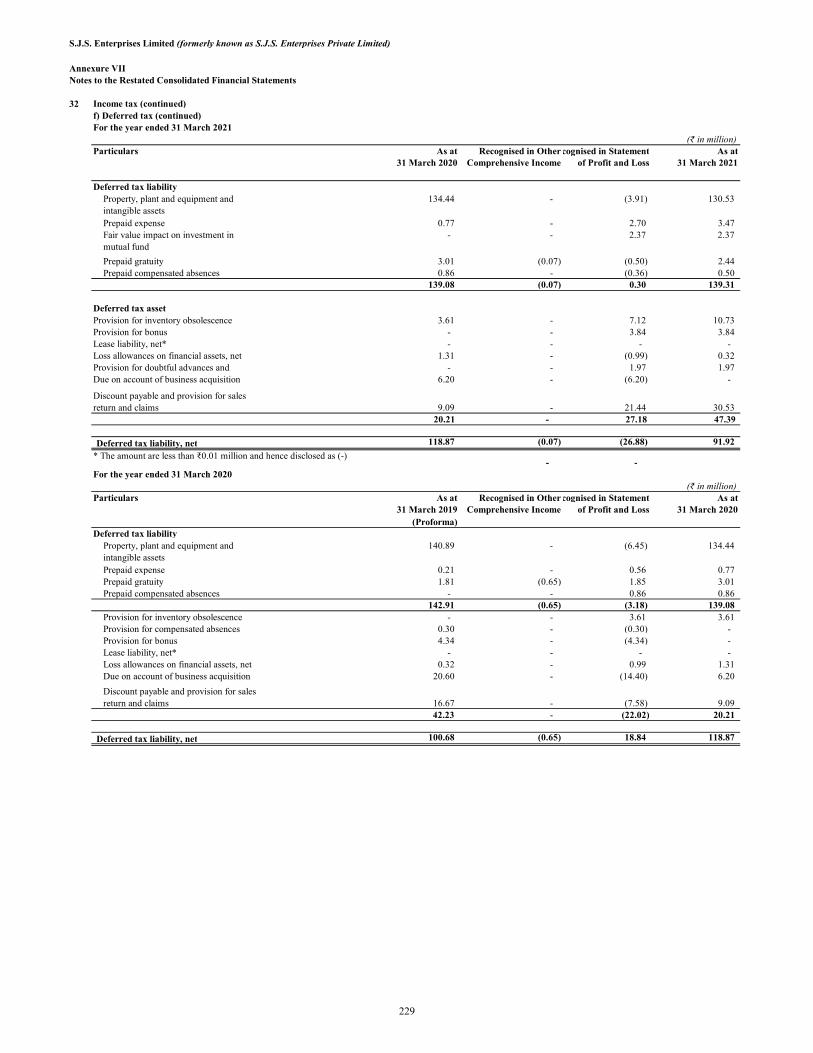
S.J.S. Enterprises Limited (formerly known as S.J.S. Enterprises Private Limited)
Annexure VIINotes to the Restated Consolidated Financial Statements
32 Income tax (continued)f) Deferred tax (continued)For the year ended 31 March 2021
(₹ in million)Particulars As at Recognised in OtherRecognised in Statement As at
31 March 2020 Comprehensive Income of Profit and Loss 31 March 2021
Deferred tax liability 134.44 - (3.91) 130.53
Prepaid expense 0.77 - 2.70 3.47 - - 2.37 2.37
Prepaid gratuity 3.01 (0.07) (0.50) 2.44 Prepaid compensated absences 0.86 - (0.36) 0.50
139.08 (0.07) 0.30 139.31
Deferred tax asset 3.61 - 7.12 10.73
Provision for bonus - - 3.84 3.84 Lease liability, net* - - - -
1.31 - (0.99) 0.32 - - 1.97 1.97
Due on account of business acquisition 6.20 - (6.20) -
9.09 - 21.44 30.53 20.21 - 27.18 47.39
Deferred tax liability, net 118.87 (0.07) (26.88) 91.92
- - For the year ended 31 March 2020
(₹ in million)Particulars As at Recognised in OtherRecognised in Statement As at
31 March 2019 Comprehensive Income of Profit and Loss 31 March 2020(Proforma)
Deferred tax liability 140.89 - (6.45) 134.44
Prepaid expense 0.21 - 0.56 0.77 Prepaid gratuity 1.81 (0.65) 1.85 3.01 Prepaid compensated absences - - 0.86 0.86
142.91 (0.65) (3.18) 139.08 Provision for inventory obsolescence - - 3.61 3.61 Provision for compensated absences 0.30 - (0.30) - Provision for bonus 4.34 - (4.34) - Lease liability, net* - - - -
0.32 - 0.99 1.31 20.60 - (14.40) 6.20
16.67 - (7.58) 9.09 42.23 - (22.02) 20.21
Deferred tax liability, net 100.68 (0.65) 18.84 118.87
Discount payable and provision for sales return and claims
* The amount are less than ₹0.01 million and hence disclosed as (-)
Property, plant and equipment and intangible assets
Property, plant and equipment and intangible assets
Fair value impact on investment in mutual fund
Provision for inventory obsolescence
Loss allowances on financial assets, net
Loss allowances on financial assets, netDue on account of business acquisition
Provision for doubtful advances and
Discount payable and provision for sales return and claims
229

S.J.S. Enterprises Limited (formerly known as S.J.S. Enterprises Private Limited)
Annexure VIINotes to the Restated Consolidated Financial Statements
- - 32 Income tax (continued)
f) Deferred tax (continued)For the year ended 31 March 2019 (Proforma)
(₹ in million)Particulars As at Recognised in OtherRecognised in Statement As at
01 April 2018 Comprehensive Income of Profit and Loss 31 March 2019(Proforma) (Proforma)
Deferred tax liability 87.78 - 53.11 140.89
Prepaid expense - - 0.21 0.21 Prepaid gratuity (0.91) (1.38) 4.10 1.81
86.87 (1.38) 57.42 142.91
Deferred tax assetProvision for compensated absences 0.54 - (0.24) 0.30 Provision for bonus - - 4.34 4.34 Lease liability, net - - - - Loss allowances on financial assets, net 0.23 - 0.09 0.32 Due on account of business acquisition - - 20.60 20.60
18.28 (1.61) 16.67 19.05 - 23.18 42.23
Deferred tax liability, net 67.82 (1.38) 34.24 100.68
33 Earnings per share ['EPS']The following reflects the income and share data used in the basic and diluted EPS computations:
(₹ in million)Particulars For quarter ended For the year ended For the year ended For the year ended
30 June 2021 31 March 2021 31 March 2020 31 March 2019(Proforma)
Reconciliation of earningsProfit after tax attributable to equity holders of the Parent Company (a) 94.96 477.65 412.85 376.01
Total profit for the quarter/year 94.96 477.65 412.85 376.01
Reconciliation of basic and diluted shares used in computing earnings per share :3,04,37,904 3,04,37,904 3,04,37,904 3,04,37,904 3,04,37,904 3,04,37,904 3,04,37,904 3,04,37,904
Earnings per share :Basic Earning per share (in ₹) (a/b) 3.12 15.69 13.56 12.35 Diluted Earning per share (in ₹) (a/c) 3.12 15.69 13.56 12.35
* The amount are less than ₹0.01 million and hence disclosed as (-)
Property, plant and equipment and intangible assets
Weighted average number of shares outstanding during the year for basic EPS (b)Weighted average number of shares outstanding during the year for
Discount payable and provision for sales return and claims
230
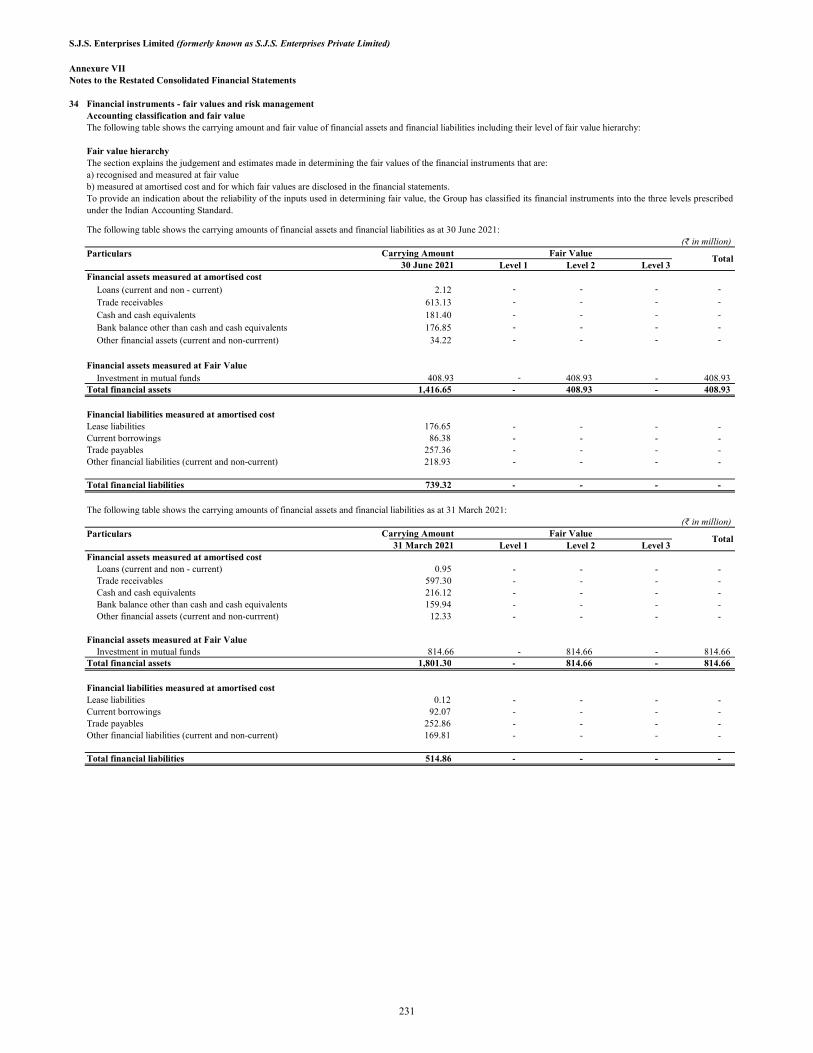
S.J.S. Enterprises Limited (formerly known as S.J.S. Enterprises Private Limited)
Annexure VIINotes to the Restated Consolidated Financial Statements
34 Financial instruments - fair values and risk management Accounting classification and fair value
Fair value hierarchy
(₹ in million)Carrying Amount Fair Value
30 June 2021 Level 1 Level 2 Level 3 Financial assets measured at amortised cost
Loans (current and non - current) 2.12 - - - -
Trade receivables 613.13 - - - -
Cash and cash equivalents 181.40 - - - -
Bank balance other than cash and cash equivalents 176.85 - - - -
Other financial assets (current and non-currrent) 34.22 - - - -
Financial assets measured at Fair ValueInvestment in mutual funds 408.93 - 408.93 - 408.93
Total financial assets 1,416.65 - 408.93 - 408.93
Financial liabilities measured at amortised costLease liabilities 176.65 - - - - Current borrowings 86.38 - - - - Trade payables 257.36 - - - - Other financial liabilities (current and non-current) 218.93 - - - -
Total financial liabilities 739.32 - - - -
(₹ in million)Carrying Amount Fair Value
31 March 2021 Level 1 Level 2 Level 3 Financial assets measured at amortised cost
Loans (current and non - current) 0.95 - - - - Trade receivables 597.30 - - - - Cash and cash equivalents 216.12 - - - - Bank balance other than cash and cash equivalents 159.94 - - - - Other financial assets (current and non-currrent) 12.33 - - - -
Financial assets measured at Fair ValueInvestment in mutual funds 814.66 - 814.66 - 814.66
Total financial assets 1,801.30 - 814.66 - 814.66
Financial liabilities measured at amortised costLease liabilities 0.12 - - - - Current borrowings 92.07 - - - - Trade payables 252.86 - - - - Other financial liabilities (current and non-current) 169.81 - - - -
Total financial liabilities 514.86 - - - -
The following table shows the carrying amount and fair value of financial assets and financial liabilities including their level of fair value hierarchy:
The section explains the judgement and estimates made in determining the fair values of the financial instruments that are:a) recognised and measured at fair valueb) measured at amortised cost and for which fair values are disclosed in the financial statements.To provide an indication about the reliability of the inputs used in determining fair value, the Group has classified its financial instruments into the three levels prescribedunder the Indian Accounting Standard.
The following table shows the carrying amounts of financial assets and financial liabilities as at 31 March 2021:
Particulars Total
The following table shows the carrying amounts of financial assets and financial liabilities as at 30 June 2021:
Particulars Total
231

S.J.S. Enterprises Limited (formerly known as S.J.S. Enterprises Private Limited)
Annexure VIINotes to the Restated Consolidated Financial Statements
34 Financial instruments - fair values and risk management (continued)
(₹ in million)Carrying Amount Fair Value
31 March 2020 Level 1 Level 2 Level 3 Financial assets measured at amortised cost
Loans (current and non - current) 0.74 - - - - Trade receivables 448.26 - - - - Cash and cash equivalents 107.61 - - - - Bank balance other than cash and cash equivalents - - - - - Other financial assets (current and non-currrent) 12.82 - - - -
Financial assets measured at fair valueInvestment in mutual funds 695.55 - 695.55 - 695.55
Total financial assets 1,264.98 - 695.55 - 695.55
Financial liabilities measured at amortised costLease liabilities 0.07 - - - - Current borrowings 61.70 - - - - Trade payables 212.41 - - - - Other financial liabilities (current and non-current) 83.91 - - - - Total financial liabilities 358.09 - - - -
(₹ in million)Carrying Amount Fair Value
31 March 2019(Proforma)
Level 1 Level 2 Level 3
Financial assets measured at amortised costLoans (current and non - current) 0.91 - - - - Trade receivables 457.66 - - - - Cash and cash equivalents 29.01 - - - - Bank balance other than cash and cash equivalents - - - - - Other financial assets (current and non-currrent) 8.94 - - - -
Financial assets measured at fair valueInvestment in mutual funds 550.39 - 550.39 - 550.39
Total financial assets 1,046.91 - 550.39 - 550.39
Financial liabilities measured at amortised costLease liabilities 0.07 - - - - Current borrowings 232.89 - - - - Trade payables 106.55 - - - - Other financial liabilities (current and non-current) 173.62 - - - - Total financial liabilities 513.13 - - - -
Fair value hierarchy
Fair valuation method
Financial assets:
Financial liabilities:
The following table shows the carrying amounts of financial assets and financial liabilities as at 31 March 2020:
Particulars Total
The following table shows the carrying amounts of financial assets and financial liabilities as at 31 March 2019 (Proforma):
Particulars Total
Level 1: Level 1 hierarchy includes financial instruments measured using quoted prices.
Level 3: If one or more of the significant inputs is not based on observable market data, the instrument is included in level 3.
Level 2: The fair value of financial instruments that are not traded in an active market (for example, traded bonds, over-the-counter derivatives) is determined usingvaluation techniques which maximize the use of observable market data and rely as little as possible on entity-specific estimates. If all significant inputs required to fairvalue an instrument are observable, the instrument is included in level 2. This includes investment in mutual funds. The fair values of investments in units of mutual fundare based on the Net Asset Value (NAV) as per the fund statement.
The fair value of the financial assets and liabilities is included at the amount at which the instrument could be exchanged in a current transaction between willing parties,other than in a forced or liquidation sale. The following methods and assumptions were used to estimate the fair values. Investments in mutual funds carried at fair valueare generally based on the Net Asset Value (NAV) as per the fund statement.
Fair value of all the above financial assets are measured at balance sheet date value, as most of them are settled within a short period and so their fair value are assumed tobe almost equal to the balance sheet date value.
Borrowing: It includes cash credit and bill discounting facilities (short term borrowings). Short term borrowings are classified and subsequently measured in theconsolidated financial statements at amortised cost. Considering that the interest rate on short term borrowings is reset on a periodic basis, the carrying amount of the shortterm borrowings would be a reasonable approximation of its fair value.
Trade payables and other financial liabilities: Fair values of trade payables and other financials liabilities are measured at balance sheet date value, as most of them aresatisfied within a short period and so their fair values are assumed almost equal to balance sheet date values.
232
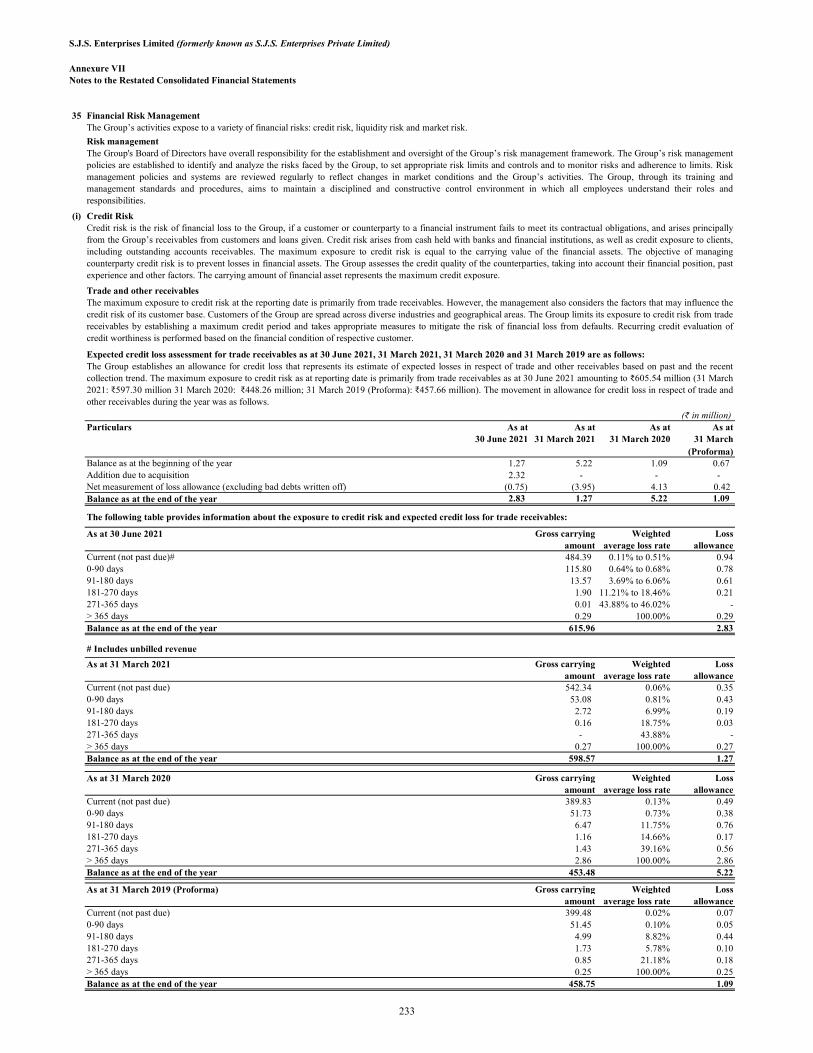
S.J.S. Enterprises Limited (formerly known as S.J.S. Enterprises Private Limited)
Annexure VIINotes to the Restated Consolidated Financial Statements
35 Financial Risk Management
Risk management
(i) Credit Risk
Trade and other receivables
(₹ in million)Particulars As at
30 June 2021As at
31 March 2021As at
31 March 2020As at
31 March (Proforma)
Balance as at the beginning of the year 1.27 5.22 1.09 0.67 Addition due to acquisition 2.32 - - - Net measurement of loss allowance (excluding bad debts written off) (0.75) (3.95) 4.13 0.42 Balance as at the end of the year 2.83 1.27 5.22 1.09
The following table provides information about the exposure to credit risk and expected credit loss for trade receivables:
As at 30 June 2021 Gross carrying amount
Weighted average loss rate
Loss allowance
Current (not past due)# 484.39 0.11% to 0.51% 0.94 0-90 days 115.80 0.64% to 0.68% 0.78 91-180 days 13.57 3.69% to 6.06% 0.61 181-270 days 1.90 11.21% to 18.46% 0.21 271-365 days 0.01 43.88% to 46.02% - > 365 days 0.29 100.00% 0.29 Balance as at the end of the year 615.96 2.83
# Includes unbilled revenue
As at 31 March 2021 Gross carrying amount
Weighted average loss rate
Loss allowance
Current (not past due) 542.34 0.06% 0.35 0-90 days 53.08 0.81% 0.43 91-180 days 2.72 6.99% 0.19 181-270 days 0.16 18.75% 0.03 271-365 days - 43.88% - > 365 days 0.27 100.00% 0.27 Balance as at the end of the year 598.57 1.27
As at 31 March 2020 Gross carrying amount
Weighted average loss rate
Loss allowance
Current (not past due) 389.83 0.13% 0.49 0-90 days 51.73 0.73% 0.38 91-180 days 6.47 11.75% 0.76 181-270 days 1.16 14.66% 0.17 271-365 days 1.43 39.16% 0.56 > 365 days 2.86 100.00% 2.86 Balance as at the end of the year 453.48 5.22
As at 31 March 2019 (Proforma) Gross carrying amount
Weighted average loss rate
Loss allowance
Current (not past due) 399.48 0.02% 0.07 0-90 days 51.45 0.10% 0.05 91-180 days 4.99 8.82% 0.44 181-270 days 1.73 5.78% 0.10 271-365 days 0.85 21.18% 0.18 > 365 days 0.25 100.00% 0.25 Balance as at the end of the year 458.75 1.09
The Group’s activities expose to a variety of financial risks: credit risk, liquidity risk and market risk.
The Group's Board of Directors have overall responsibility for the establishment and oversight of the Group’s risk management framework. The Group’s risk managementpolicies are established to identify and analyze the risks faced by the Group, to set appropriate risk limits and controls and to monitor risks and adherence to limits. Riskmanagement policies and systems are reviewed regularly to reflect changes in market conditions and the Group’s activities. The Group, through its training andmanagement standards and procedures, aims to maintain a disciplined and constructive control environment in which all employees understand their roles andresponsibilities.
Credit risk is the risk of financial loss to the Group, if a customer or counterparty to a financial instrument fails to meet its contractual obligations, and arises principallyfrom the Group’s receivables from customers and loans given. Credit risk arises from cash held with banks and financial institutions, as well as credit exposure to clients,including outstanding accounts receivables. The maximum exposure to credit risk is equal to the carrying value of the financial assets. The objective of managingcounterparty credit risk is to prevent losses in financial assets. The Group assesses the credit quality of the counterparties, taking into account their financial position, pastexperience and other factors. The carrying amount of financial asset represents the maximum credit exposure.
The maximum exposure to credit risk at the reporting date is primarily from trade receivables. However, the management also considers the factors that may influence thecredit risk of its customer base. Customers of the Group are spread across diverse industries and geographical areas. The Group limits its exposure to credit risk from tradereceivables by establishing a maximum credit period and takes appropriate measures to mitigate the risk of financial loss from defaults. Recurring credit evaluation ofcredit worthiness is performed based on the financial condition of respective customer.
Expected credit loss assessment for trade receivables as at 30 June 2021, 31 March 2021, 31 March 2020 and 31 March 2019 are as follows:The Group establishes an allowance for credit loss that represents its estimate of expected losses in respect of trade and other receivables based on past and the recentcollection trend. The maximum exposure to credit risk as at reporting date is primarily from trade receivables as at 30 June 2021 amounting to ₹605.54 million (31 March2021: ₹597.30 million 31 March 2020: ₹448.26 million; 31 March 2019 (Proforma): ₹457.66 million). The movement in allowance for credit loss in respect of trade andother receivables during the year was as follows.
233
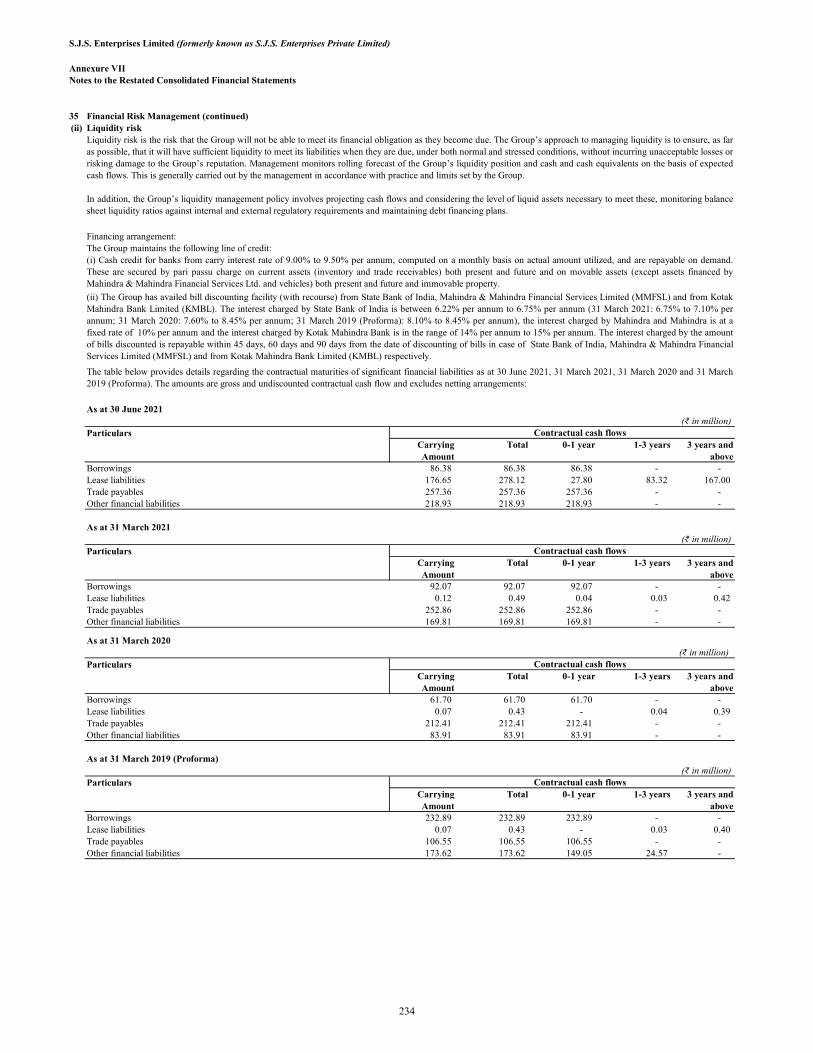
S.J.S. Enterprises Limited (formerly known as S.J.S. Enterprises Private Limited)
Annexure VIINotes to the Restated Consolidated Financial Statements
35 Financial Risk Management (continued)(ii) Liquidity risk
Financing arrangement:
As at 30 June 2021(₹ in million)
Contractual cash flowsCarrying Amount
Total 0-1 year 1-3 years 3 years and above
Borrowings 86.38 86.38 86.38 - - Lease liabilities 176.65 278.12 27.80 83.32 167.00 Trade payables 257.36 257.36 257.36 - - Other financial liabilities 218.93 218.93 218.93 - -
As at 31 March 2021(₹ in million)
Contractual cash flowsCarrying Amount
Total 0-1 year 1-3 years 3 years and above
Borrowings 92.07 92.07 92.07 - - Lease liabilities 0.12 0.49 0.04 0.03 0.42 Trade payables 252.86 252.86 252.86 - - Other financial liabilities 169.81 169.81 169.81 - -
As at 31 March 2020(₹ in million)
Contractual cash flowsCarrying Amount
Total 0-1 year 1-3 years 3 years and above
Borrowings 61.70 61.70 61.70 - - Lease liabilities 0.07 0.43 - 0.04 0.39 Trade payables 212.41 212.41 212.41 - - Other financial liabilities 83.91 83.91 83.91 - -
As at 31 March 2019 (Proforma)(₹ in million)
Contractual cash flowsCarrying Amount
Total 0-1 year 1-3 years 3 years and above
Borrowings 232.89 232.89 232.89 - - Lease liabilities 0.07 0.43 - 0.03 0.40 Trade payables 106.55 106.55 106.55 - - Other financial liabilities 173.62 173.62 149.05 24.57 -
Particulars
Particulars
Particulars
Liquidity risk is the risk that the Group will not be able to meet its financial obligation as they become due. The Group’s approach to managing liquidity is to ensure, as faras possible, that it will have sufficient liquidity to meet its liabilities when they are due, under both normal and stressed conditions, without incurring unacceptable losses orrisking damage to the Group’s reputation. Management monitors rolling forecast of the Group’s liquidity position and cash and cash equivalents on the basis of expectedcash flows. This is generally carried out by the management in accordance with practice and limits set by the Group.
In addition, the Group’s liquidity management policy involves projecting cash flows and considering the level of liquid assets necessary to meet these, monitoring balancesheet liquidity ratios against internal and external regulatory requirements and maintaining debt financing plans.
The Group maintains the following line of credit:(i) Cash credit for banks from carry interest rate of 9.00% to 9.50% per annum, computed on a monthly basis on actual amount utilized, and are repayable on demand.These are secured by pari passu charge on current assets (inventory and trade receivables) both present and future and on movable assets (except assets financed byMahindra & Mahindra Financial Services Ltd. and vehicles) both present and future and immovable property.
(ii) The Group has availed bill discounting facility (with recourse) from State Bank of India, Mahindra & Mahindra Financial Services Limited (MMFSL) and from KotakMahindra Bank Limited (KMBL). The interest charged by State Bank of India is between 6.22% per annum to 6.75% per annum (31 March 2021: 6.75% to 7.10% perannum; 31 March 2020: 7.60% to 8.45% per annum; 31 March 2019 (Proforma): 8.10% to 8.45% per annum), the interest charged by Mahindra and Mahindra is at afixed rate of 10% per annum and the interest charged by Kotak Mahindra Bank is in the range of 14% per annum to 15% per annum. The interest charged by the amountof bills discounted is repayable within 45 days, 60 days and 90 days from the date of discounting of bills in case of State Bank of India, Mahindra & Mahindra FinancialServices Limited (MMFSL) and from Kotak Mahindra Bank Limited (KMBL) respectively.
The table below provides details regarding the contractual maturities of significant financial liabilities as at 30 June 2021, 31 March 2021, 31 March 2020 and 31 March2019 (Proforma). The amounts are gross and undiscounted contractual cash flow and excludes netting arrangements:
Particulars
234

S.J.S. Enterprises Limited (formerly known as S.J.S. Enterprises Private Limited)
Annexure VIINotes to the Restated Consolidated Financial Statements
35 Financial Risk Management (continued)(iii) Market risk
A) Currency risk
Exposure to currency riskThe summary quantitative data about the Group’s exposure to currency risk as reported to management is as follows:
(₹ in million)Particulars Currency As at As at As at As at
30 June 2021 31 March 2021 31 March 2020 31 March 2019(Proforma)
Amount in foreign currency
Amount in ₹
Amount in foreign currency
Amount in ₹ Amount in foreign currency
Amount in ₹ Amount in foreign currency
Amount in ₹
USD 1.98 146.96 1.60 117.61 1.36 102.53 1.12 77.41 EURO* - 0.32 - - - 0.49 - 0.05
USD 0.04 3.18 0.07 5.15 0.08 6.03 0.10 6.91 EURO - 0.09 0.02 1.72 0.04 3.32 - -
JPY 0.02 0.01 0.03 0.02 - - 0.06 0.04 USD 0.41 30.81 0.22 16.14 0.42 31.73 0.09 6.04
EURO* - 0.24 - 0.23 - 0.13 - 0.03 Liability for capital goods USD 0.20 14.67 0.24 17.64 0.03 2.26 0.03 2.07
* The amount's are less than INR 0.01 million and hence disclosed as (-)
Sensitivity analysis
(₹ in million)
Strengthening Weakening Strengthening Weakening30 June 2021
USD (1% movement) 1.60 (1.60) 1.20 (1.20) EURO (1% movement) - - - - JPY (1% movement)* - - - -
31 March 2021USD (1% movement) 1.11 (1.11) 0.83 (0.83) EURO (1% movement) (0.01) 0.01 (0.01) 0.01 JPY (1% movement)* - - - -
31 March 2020USD (1% movement) 1.26 (1.26) 0.94 (0.94) EURO (1% movement) (0.03) 0.03 (0.02) 0.02
31 March 2019 (Proforma)USD (1% movement) 0.74 (0.74) 0.52 (0.52) EURO (1% movement)* - - - - JPY (1% movement)* - - - - * The amount's are less than INR 0.01 million and hence disclosed as (-)
B) Interest rate risk
(₹ in million) Particulars As at
30 June 2021Variable amount of borrowings 11.16
Interest rate sensitivity
(₹ in million) Particulars For the year ended
30 June 2021Increase in 50 basis points 0.04 Decrease in 50 basis points (0.04)
Market risk is the risk that the fair value of future cash flows of a financial instrument will fluctuate because of changes in market prices. Market risk comprises three typesof risk: interest rate risk, currency risk and equity price risk as discussed below:
The Group is exposed to currency risk to the extent that there is a mismatch between the currencies in which sales and purchases are denominated and the respectivefunctional currency of the Group. The functional currency of the Group is primarily INR. The currencies in which these transactions are primarily denominated are USD,EUR, JPY etc.
Management monitors the movement in foreign currency and the Group’s exposure in each of the foreign currency. Based on the analysis and study of movement inforeign currency, the Group decides to exchange its foreign currency.
Trade receivablesTrade payables
Bank accounts - EEFC
A reasonably possible strengthening (weakening) of the USD, EURO and JPY against INR at 30 June 2021, 31 March 2021, 31 March 2020 and 31 March 2019(Proforma) would have affected the measurement of financial instruments denominated in foreign currency and affected equity and profit and loss by the amounts shownbelow. This analysis assumes that all other variables, in particular interest rates, remain constant.
Particulars Profit and loss Equity, net of tax
Exposure to the risk of changes in market interest rates relates primarily to the Group's long-term debt obligations with floating interest rates.
The Group manages its interest rate risk by having a balanced portfolio of fixed and variable rate loans and borrowings. Its policy is to borrow funds at fixed and floating rate of interest (SBI Base rate).
The following table demonstrates the sensitivity to a reasonably possible change in interest rates on that portion of loans and borrowings affected. With all other variables held constant, the subsidiary’s profit before tax is affected through the impact on floating rate borrowings, as follows:
235
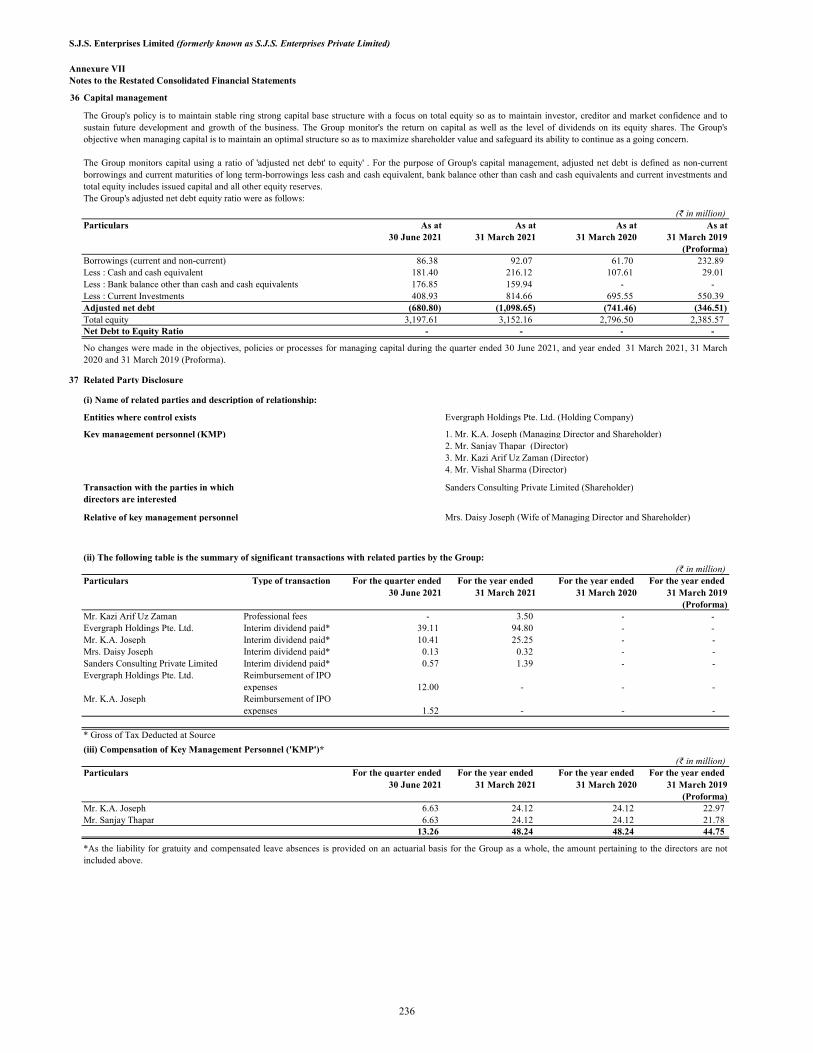
S.J.S. Enterprises Limited (formerly known as S.J.S. Enterprises Private Limited)
Annexure VIINotes to the Restated Consolidated Financial Statements
36 Capital management
(₹ in million)As at
30 June 2021As at
31 March 2021As at
31 March 2020As at
31 March 2019(Proforma)
86.38 92.07 61.70 232.89 181.40 216.12 107.61 29.01
Less : Bank balance other than cash and cash equivalents 176.85 159.94 - - Less : Current Investments 408.93 814.66 695.55 550.39
(680.80) (1,098.65) (741.46) (346.51) 3,197.61 3,152.16 2,796.50 2,385.57
- - - -
37 Related Party Disclosure
(i) Name of related parties and description of relationship:
Entities where control exists Evergraph Holdings Pte. Ltd. (Holding Company)
Key management personnel (KMP) 1. Mr. K.A. Joseph (Managing Director and Shareholder)2. Mr. Sanjay Thapar (Director)3. Mr. Kazi Arif Uz Zaman (Director)4. Mr. Vishal Sharma (Director)
Transaction with the parties in which directors are interested
Sanders Consulting Private Limited (Shareholder)
Relative of key management personnel Mrs. Daisy Joseph (Wife of Managing Director and Shareholder)
(ii) The following table is the summary of significant transactions with related parties by the Group:(₹ in million)
Particulars Type of transaction For the quarter ended For the year ended For the year ended For the year ended 30 June 2021 31 March 2021 31 March 2020 31 March 2019
(Proforma)Mr. Kazi Arif Uz Zaman Professional fees - 3.50 - - Evergraph Holdings Pte. Ltd. Interim dividend paid* 39.11 94.80 - - Mr. K.A. Joseph Interim dividend paid* 10.41 25.25 - - Mrs. Daisy Joseph Interim dividend paid* 0.13 0.32 - - Sanders Consulting Private Limited Interim dividend paid* 0.57 1.39 - - Evergraph Holdings Pte. Ltd. Reimbursement of IPO
expenses 12.00 - - - Mr. K.A. Joseph Reimbursement of IPO
expenses 1.52 - - -
* Gross of Tax Deducted at Source
(iii) Compensation of Key Management Personnel ('KMP')*(₹ in million)
Particulars For the quarter ended For the year ended For the year ended For the year ended 30 June 2021 31 March 2021 31 March 2020 31 March 2019
(Proforma)Mr. K.A. Joseph 6.63 24.12 24.12 22.97 Mr. Sanjay Thapar 6.63 24.12 24.12 21.78
13.26 48.24 48.24 44.75
Adjusted net debtTotal equityNet Debt to Equity Ratio
No changes were made in the objectives, policies or processes for managing capital during the quarter ended 30 June 2021, and year ended 31 March 2021, 31 March2020 and 31 March 2019 (Proforma).
*As the liability for gratuity and compensated leave absences is provided on an actuarial basis for the Group as a whole, the amount pertaining to the directors are notincluded above.
The Group's policy is to maintain stable ring strong capital base structure with a focus on total equity so as to maintain investor, creditor and market confidence and tosustain future development and growth of the business. The Group monitor's the return on capital as well as the level of dividends on its equity shares. The Group'sobjective when managing capital is to maintain an optimal structure so as to maximize shareholder value and safeguard its ability to continue as a going concern.
The Group monitors capital using a ratio of 'adjusted net debt' to equity' . For the purpose of Group's capital management, adjusted net debt is defined as non-currentborrowings and current maturities of long term-borrowings less cash and cash equivalent, bank balance other than cash and cash equivalents and current investments andtotal equity includes issued capital and all other equity reserves. The Group's adjusted net debt equity ratio were as follows:
Particulars
Borrowings (current and non-current)Less : Cash and cash equivalent
236
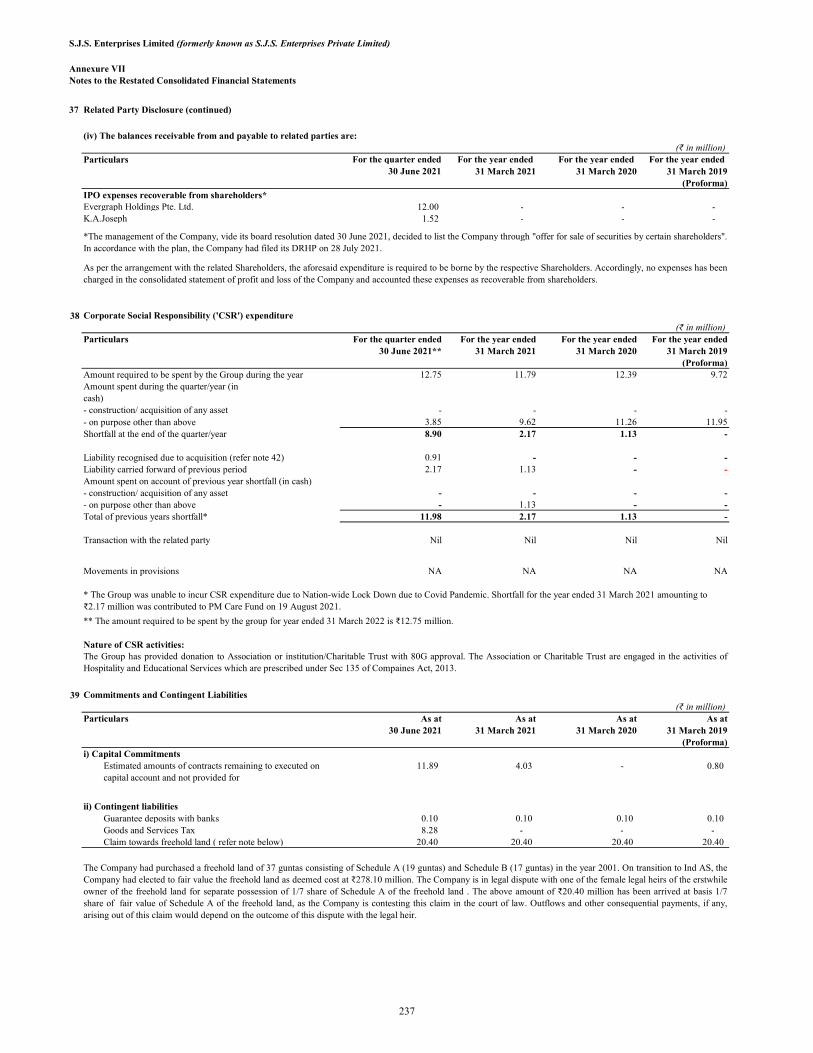
S.J.S. Enterprises Limited (formerly known as S.J.S. Enterprises Private Limited)
Annexure VIINotes to the Restated Consolidated Financial Statements
37 Related Party Disclosure (continued)
(iv) The balances receivable from and payable to related parties are:(₹ in million)
Particulars For the quarter ended For the year ended For the year ended For the year ended 30 June 2021 31 March 2021 31 March 2020 31 March 2019
(Proforma)IPO expenses recoverable from shareholders*Evergraph Holdings Pte. Ltd. 12.00 - - - K.A.Joseph 1.52 - - -
38 Corporate Social Responsibility ('CSR') expenditure(₹ in million)
Particulars For the quarter ended 30 June 2021**
For the year ended 31 March 2021
For the year ended 31 March 2020
For the year ended 31 March 2019
(Proforma) 12.75 11.79 12.39 9.72
Amount spent during the quarter/year (in cash)- construction/ acquisition of any asset - - - - - on purpose other than above 3.85 9.62 11.26 11.95
8.90 2.17 1.13 -
Liability recognised due to acquisition (refer note 42) 0.91 - - - Liability carried forward of previous period 2.17 1.13 - - Amount spent on account of previous year shortfall (in cash)- construction/ acquisition of any asset - - - - - on purpose other than above - 1.13 - -
11.98 2.17 1.13 -
Nil Nil Nil Nil
NA NA NA NA
** The amount required to be spent by the group for year ended 31 March 2022 is ₹12.75 million.
39 Commitments and Contingent Liabilities(₹ in million)
Particulars As at30 June 2021
As at31 March 2021
As at31 March 2020
As at31 March 2019
(Proforma)i) Capital Commitments
11.89 4.03 - 0.80
ii) Contingent liabilitiesGuarantee deposits with banks 0.10 0.10 0.10 0.10 Goods and Services Tax 8.28 - - - Claim towards freehold land ( refer note below) 20.40 20.40 20.40 20.40
Estimated amounts of contracts remaining to executed on capital account and not provided for
The Company had purchased a freehold land of 37 guntas consisting of Schedule A (19 guntas) and Schedule B (17 guntas) in the year 2001. On transition to Ind AS, theCompany had elected to fair value the freehold land as deemed cost at ₹278.10 million. The Company is in legal dispute with one of the female legal heirs of the erstwhileowner of the freehold land for separate possession of 1/7 share of Schedule A of the freehold land . The above amount of ₹20.40 million has been arrived at basis 1/7share of fair value of Schedule A of the freehold land, as the Company is contesting this claim in the court of law. Outflows and other consequential payments, if any,arising out of this claim would depend on the outcome of this dispute with the legal heir.
Amount required to be spent by the Group during the year
Shortfall at the end of the quarter/year
Total of previous years shortfall*
Nature of CSR activities:
Transaction with the related party
Movements in provisions
The Group has provided donation to Association or institution/Charitable Trust with 80G approval. The Association or Charitable Trust are engaged in the activities ofHospitality and Educational Services which are prescribed under Sec 135 of Compaines Act, 2013.
*The management of the Company, vide its board resolution dated 30 June 2021, decided to list the Company through "offer for sale of securities by certain shareholders". In accordance with the plan, the Company had filed its DRHP on 28 July 2021.
As per the arrangement with the related Shareholders, the aforesaid expenditure is required to be borne by the respective Shareholders. Accordingly, no expenses has beencharged in the consolidated statement of profit and loss of the Company and accounted these expenses as recoverable from shareholders.
* The Group was unable to incur CSR expenditure due to Nation-wide Lock Down due to Covid Pandemic. Shortfall for the year ended 31 March 2021 amounting to ₹2.17 million was contributed to PM Care Fund on 19 August 2021.
237
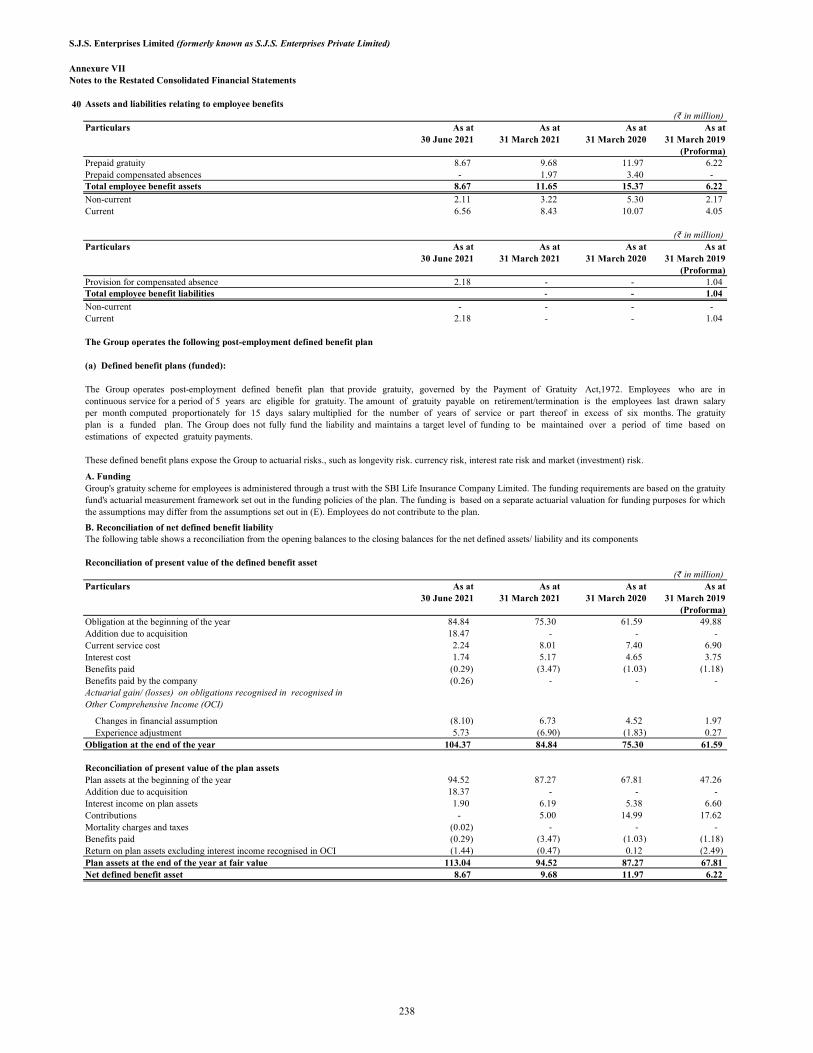
S.J.S. Enterprises Limited (formerly known as S.J.S. Enterprises Private Limited)
Annexure VIINotes to the Restated Consolidated Financial Statements
40 Assets and liabilities relating to employee benefits(₹ in million)
Particulars As at30 June 2021
As at31 March 2021
As at31 March 2020
As at31 March 2019
(Proforma)Prepaid gratuity 8.67 9.68 11.97 6.22 Prepaid compensated absences - 1.97 3.40 - Total employee benefit assets 8.67 11.65 15.37 6.22
Non-current 2.11 3.22 5.30 2.17 Current 6.56 8.43 10.07 4.05
(₹ in million)Particulars As at
30 June 2021As at
31 March 2021As at
31 March 2020As at
31 March 2019(Proforma)
Provision for compensated absence 2.18 - - 1.04 Total employee benefit liabilities - - 1.04
Non-current - - - - Current 2.18 - - 1.04
The Group operates the following post-employment defined benefit plan
(a) Defined benefit plans (funded):
B. Reconciliation of net defined benefit liability
Reconciliation of present value of the defined benefit asset(₹ in million)
Particulars As at30 June 2021
As at31 March 2021
As at31 March 2020
As at31 March 2019
(Proforma)Obligation at the beginning of the year 84.84 75.30 61.59 49.88 Addition due to acquisition 18.47 - - - Current service cost 2.24 8.01 7.40 6.90 Interest cost 1.74 5.17 4.65 3.75 Benefits paid (0.29) (3.47) (1.03) (1.18)Benefits paid by the company (0.26) - - -
Changes in financial assumption (8.10) 6.73 4.52 1.97 Experience adjustment 5.73 (6.90) (1.83) 0.27
Obligation at the end of the year 104.37 84.84 75.30 61.59
Reconciliation of present value of the plan assetsPlan assets at the beginning of the year 94.52 87.27 67.81 47.26 Addition due to acquisition 18.37 - - - Interest income on plan assets 1.90 6.19 5.38 6.60 Contributions - 5.00 14.99 17.62 Mortality charges and taxes (0.02) - - - Benefits paid (0.29) (3.47) (1.03) (1.18)Return on plan assets excluding interest income recognised in OCI (1.44) (0.47) 0.12 (2.49)Plan assets at the end of the year at fair value 113.04 94.52 87.27 67.81 Net defined benefit asset 8.67 9.68 11.97 6.22
The Group operates post-employment defined benefit plan that provide gratuity, governed by the Payment of Gratuity Act,1972. Employees who are incontinuous service for a period of 5 years arc eligible for gratuity. The amount of gratuity payable on retirement/termination is the employees last drawn salaryper month computed proportionately for 15 days salary multiplied for the number of years of service or part thereof in excess of six months. The gratuityplan is a funded plan. The Group does not fully fund the liability and maintains a target level of funding to be maintained over a period of time based onestimations of expected gratuity payments.
These defined benefit plans expose the Group to actuarial risks., such as longevity risk. currency risk, interest rate risk and market (investment) risk.
A. Funding Group's gratuity scheme for employees is administered through a trust with the SBI Life Insurance Company Limited. The funding requirements are based on the gratuityfund's actuarial measurement framework set out in the funding policies of the plan. The funding is based on a separate actuarial valuation for funding purposes for whichthe assumptions may differ from the assumptions set out in (E). Employees do not contribute to the plan.
The following table shows a reconciliation from the opening balances to the closing balances for the net defined assets/ liability and its components
Actuarial gain/ (losses) on obligations recognised in recognised in Other Comprehensive Income (OCI)
238

S.J.S. Enterprises Limited (formerly known as S.J.S. Enterprises Private Limited)
Annexure VIINotes to the Restated Consolidated Financial Statements
40 Assets and liabilities relating to employee benefits (continued)C. (i) Expense recognised in the statement of profit or loss
(₹ in million)Particulars For the quarter ended
30 June 2021**For the year ended
31 March 2021For the year ended
31 March 2020For the year
ended31 March 2019
(Proforma)Current service cost 2.24 8.01 7.40 6.90 Interest cost 1.74 5.17 4.65 3.75 Interest Income (1.90) (6.19) (5.38) (6.60)Net gratuity Cost 2.08 6.99 6.67 4.05
(ii)Remeasurement recognised in other comprehensive Income(₹ in million)
Particulars For the quarter ended 30 June 2021**
For the year ended31 March 2021
For the year ended31 March 2020
For the year ended
31 March 2019(Proforma)
Actuarial loss on defined benefit obligation (2.37) (0.18) 2.69 2.24 Return on plan assets, excluding interest income 1.44 0.48 (0.12) 2.49
(0.93) 0.30 2.57 4.73
D. Plan assets(₹ in million)
Particulars As at30 June 2021
As at31 March 2021
As at31 March 2020
As at31 March 2019
(Proforma)Insurance fund 113.04 94.52 87.27 67.81
113.04 94.52 87.27 67.81
E. Defined benefit obligation(i)Actuarial Assumption:
(₹ in million)Particulars As at
30 June 2021As at
31 March 2021As at
31 March 2020As at
31 March 2019(Proforma)
Rate of return on plan assets 6.40% to 7.03% 7.03% 7.61% 7.60%Discounting rate 6.40% to 6.82% 7.03% 6.66% 7.61%Future salary growth 6.00% to 10.00% 12.00% 10.00% 10.00%Attrition rate 12.00% to 13.00% 13.98% 13.90% 12.00%Weighted average duration of Defined benefit obligation(in years) 6.7 to 10.63 9.86 10.63 10.70Retirement age 58 Years 58 Years 58 Years 58 YearsNotes:
(ii)Sensitivity analysis
(₹ in million)Particulars As at
30 June 2021As at
31 March 2021As at
31 March 2020As at
31 March 2019(Proforma)
Projected benefit obligation on Current assumption 104.37 84.84 75.30 61.59 Impact of change in discount rate by +1% (7.96) (7.03) (6.09) (5.29)Impact of change in discount rate by -1% 9.18 8.13 7.06 6.17 Impact of change in salary rate by +1% 6.18 4.74 4.77 4.35 Impact of change in salary rate by -1% (6.02) (4.78) (4.61) (4.07)Impact of change in employee turnover rate by +1% (1.21) (1.73) (1.19) (0.78)Impact of change in employee turnover rate by -1% 1.38 1.94 1.35 0.89 Impact of change in mortality rate by +1% (0.03) (0.04) (0.03) (0.02)Impact of change in mortality rate by -1% - - - -
(b) Defined contribution plan:
Reasonably possible changes at the reporting date to one of the relevant actuarial assumptions, holding other assumptions constant, would have affected the definedbenefit obligation by the amounts shown below:
The Group makes contributions for qualifying employees to Provident Fund and other defined contribution plans. During the quarter, the Group recognised ₹3.92 million(31 March 2021 : ₹12.16 million, 31 March 2020 : ₹12.50 million and 31 March 2019 (Proforma) : ₹11.95 million) towards defined contribution plans.
(i) The discount rate is based on the prevailing market yield on Governmental Securities as at the balance sheet date for the estimate defined obligations.(ii)The expected return on plan assets is determined considering several applicable factors mainly the composition of the plan assets held, assessed risk of assetmanagement. historical results of the return on plan assets and the Group's policy for plan asset management.(iii)The estimate of future salary increases considered in actuarial valuation takcs in to account inflation, seniority, promotion and other relevant factors such assupply and demand in the employment market.
239

S.J.S. Enterprises Limited (formerly known as S.J.S. Enterprises Private Limited)
Annexure VIINotes to the Restated Consolidated Financial Statements
41 Segment Information
A Geographical information
Revenue from operations(₹ in million)
Particulars For the quarter ended For the year ended For the year ended For the year ended30 June 2021 31 March 2021 31 March 2020 31 March 2019
(Proforma)Revenue from external customersIndia 612.34 2,112.31 1,839.90 2,139.60 Rest of the world 130.35 403.85 321.83 232.92 Total 742.69 2,516.16 2,161.73 2,372.52
Non current assetsAll non –current assets other than financial instruments of the Group are located in India.
B Major customer
(₹ in million)Particulars For the quarter ended For the year ended For the year ended For the year ended
30 June 2021 31 March 2021 31 March 2020 31 March 2019(Proforma)
Customer A 119.15 540.64 518.60 797.00 Customer B 49.32 298.33 333.04 386.19 Customer C 44.49 283.25 163.34 171.35 Customer D 83.77 270.08 146.01 75.15 Customer E 77.67 188.20 131.27 133.81 Total 374.40 1,580.50 1,292.26 1,563.50
42 Business combinations and Business acquisition
a)
(₹ in million)Particulars AmountIntangible assets
Customer relationships 37.56 Non-compete 12.20
Total fair value of net assets acquired (A) 49.76
Fair value of purchase consideration (B) 89.27
Goodwill arising on acquisition (C) = (B-A) 39.51 The aforesaid goodwill is not deductible under Income Tax Act, 1961.
The Company had entered into a Settlement and Termination agreement ('Agreement') dated 18 April 2018, and acquired the business of Delta Ram Enterprises, SirishaEnterprises and SM Enterprises ('Selling parties') effective 1 May 2018 ('Acquisition date'). The Selling parties were earlier acting as sole selling agents of the Companyand were providing end-to-end customer relationship and marketing services to the Company. The acquisition was made to gain the synergies of the business and thecustomers developed by the Selling parties and hence the management concluded this transaction to be a business combination as per Ind AS 103. Pursuant to thisAgreement, the Company has acquired the business of the Selling parties for a total cash consideration of ₹100 million to be paid over a period of 2 years in 24 equalinstallment effective 01 October 2018.
The geographical information analyses the Group's revenue by the Group's country of domicile (i.e. India) and other countries. In presenting the geographical information,segment revenue has been based on the geographical location of the customer and segment assets which have been based on the geographical location of the assets.
The Group is engaged in the manufacturing and selling of self-adhesive labels like automotive dials, overlays, badges and logos for automotive electronics and appliancesindustry. The Board of Directors being the Chief Operating Decision Maker (CODM) evaluates the Group's performance and allocates resources based on an analysis ofvarious performance indicators by industry classes. All operating segments operating results are reviewed regularly by CODM to make decisions about resources to beallocated to the segments and assess their performance. CODM believes that these are governed by same set of risks and returns hence, CODM reviews them as onecomponent. Further, the economic environment in which the Group operates is significantly similar and not subject to materially different risk and rewards. The revenues,total expenses and net profit as per the Statement of profit and loss represents the revenue, total expenses and net profit of the sole reportable segment.
Following is the breakup of customer individually accounted for more than 10% of the revenue from external customers during the quarter ended 30 June 2021 and year ended 31 March 2021, 31 March 2020 and 31 March 2019 (Proforma).
The Company had conducted the fair valuation of the business on the date of acquisition and accordingly have recognised the following assets and liabilities at theacquisition date:
240
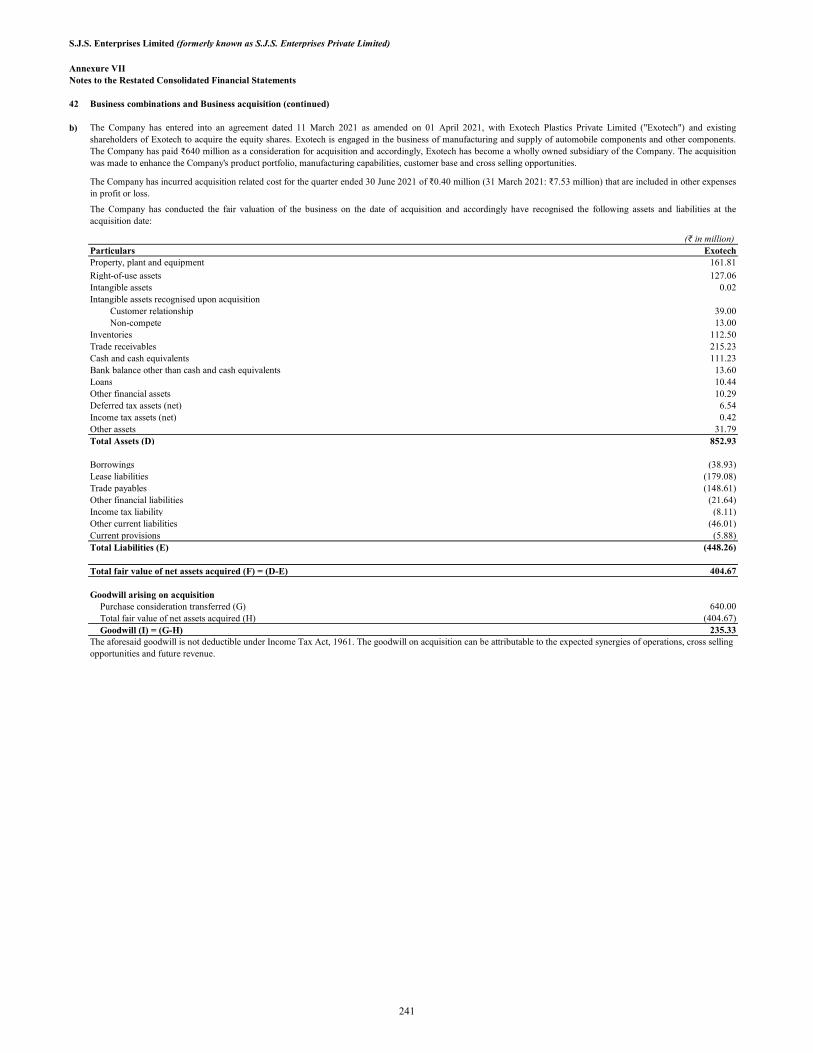
S.J.S. Enterprises Limited (formerly known as S.J.S. Enterprises Private Limited)
Annexure VIINotes to the Restated Consolidated Financial Statements
42 Business combinations and Business acquisition (continued)
b)
(₹ in million)Particulars ExotechProperty, plant and equipment 161.81
Right-of-use assets 127.06Intangible assets 0.02Intangible assets recognised upon acquisition
Customer relationship 39.00Non-compete 13.00
Inventories 112.50Trade receivables 215.23Cash and cash equivalents 111.23Bank balance other than cash and cash equivalents 13.60Loans 10.44Other financial assets 10.29Deferred tax assets (net) 6.54Income tax assets (net) 0.42Other assets 31.79Total Assets (D) 852.93
Borrowings (38.93)Lease liabilities (179.08)Trade payables (148.61)Other financial liabilities (21.64)Income tax liability (8.11)Other current liabilities (46.01)Current provisions (5.88)Total Liabilities (E) (448.26)
Total fair value of net assets acquired (F) = (D-E) 404.67
Goodwill arising on acquisitionPurchase consideration transferred (G) 640.00 Total fair value of net assets acquired (H) (404.67)Goodwill (I) = (G-H) 235.33
The aforesaid goodwill is not deductible under Income Tax Act, 1961. The goodwill on acquisition can be attributable to the expected synergies of operations, cross selling opportunities and future revenue.
The Company has conducted the fair valuation of the business on the date of acquisition and accordingly have recognised the following assets and liabilities at theacquisition date:
The Company has entered into an agreement dated 11 March 2021 as amended on 01 April 2021, with Exotech Plastics Private Limited ("Exotech") and existingshareholders of Exotech to acquire the equity shares. Exotech is engaged in the business of manufacturing and supply of automobile components and other components.The Company has paid ₹640 million as a consideration for acquisition and accordingly, Exotech has become a wholly owned subsidiary of the Company. The acquisitionwas made to enhance the Company's product portfolio, manufacturing capabilities, customer base and cross selling opportunities.
The Company has incurred acquisition related cost for the quarter ended 30 June 2021 of ₹0.40 million (31 March 2021: ₹7.53 million) that are included in other expensesin profit or loss.
241

S.J.S. Enterprises Limited (formerly known as S.J.S. Enterprises Private Limited)
Annexure VIINotes to the Restated Consolidated Financial Statements
43 Additional Information pursuant to paragraph 2 of division II of Schedule III to Companies Act, 2013 'General Instruction for preparation of restated consolidated financial Statements:
30 June 2021 31 March 2021 31 March 2020 31 March 2019(Proforma)
Exotech Plastics Private Limited (Exotech)*Manufacture of automobile components India 100% Nil Nil Nil
*The Group has acquired Exotech during the quarter ended June 30, 2021, refer Note 42 for details.
Additional information pursuant to paragraph 2 of division II of Schedule III to Companies Act, 2013 'General instructions for preparation of restated consolidated Financial Statements
As a % of Consolidated net
assetsAmount
As a % of Consolidated profit or loss Amount
As a % of Consolidated OCI Amount
As a % of Consolidated TCI Amount
Parent company100% 3,203.43 106% 100.59 127% 0.90 106% 101.49
SubsidiaryExotech Plastics Private Limited (Exotech) 11% 346.85 -6% (5.63) -27% (0.19) -6% (5.82)
Other adjustments: -11% (352.67) 0% - 0% - 0% -
Total 100% 3,197.61 100% 94.96 100% 0.71 100% 95.67
Interest in other entities
For the quarter ended June 30, 2021
Name of entity
S.J.S. Enterprises Limited (formerly known as S.J.S. Enterprises Private Limited)
Ownership interest held by the groupPrincipal activity
Country of Incorporation
Particulars
Net assets i.e. total assets minus total liabilities
Share in profit or loss Share in other comprehensive income Share in total comprehensive income
242
S.J.S. Enterprises Limited (formerly known as S.J.S. Enterprises Private Limited)
Annexure VIINotes to the Restated Consolidated Financial Statements
44 First-time adoption of Ind-AS
A
ii) Business Combination
B
Optional exemptions availed:
As stated in Note 1, the Parent Company has prepared its first financials statements in accordance with Ind AS. For the purposes of transition from previous GAAP to IndAS, the Parent Company has followed the guidance prescribed in Ind AS 101 - First Time adoption of Indian Accounting Standards ("Ind AS 101"), with effect from 1 April,2019 ("transition date"). For the year ended 31 March 2020, the Parent Company had prepared its financials statements in accordance with Company's (Accounts) Rules2014, notified under section 133 of the Act and other relevant provisions of the Act ("previous GAAP" or "Indian GAAP").
The accounting policies set out in Note 2 have been applied in preparing the restated consolidated financial statements for the year ended 31 March 2021 including thecomparative information the year ended 31 March 2020 and 31 March 2019 (Proforma).
The restated consolidated financial statements for the year ended 31 March 2019 have been prepared on Proforma basis in accordance with requirements of SEBI Circulardated 31 March 2016 and Guidance Note On Reports in Company Prospectus issued by the Institute of Chartered Accountants of India. For the purpose of Proforma restatedconsolidated financial statements as at and for the year ended 31 March 2019, the Parent Company has followed the same accounting policy and accounting policy choices(both mandatory exceptions and optional exemptions availed as per Ind AS 101) as initially adopted on the transition date i.e. 01 April 2019.
ln preparing its Ind AS Balance Sheet as at 01 April 2019 and in presenting the comparative information for the year ended 31 March 2020, the Parent Company hasadjusted amounts reported previously in consolidated financial statements prepared in accordance with previous GAAP. This note explains the principal adjustments madeby the Parent Company in restating its consolidated financial statements prepared in accordance with previous GAAP, and how the transition from previous GAAP to Ind AShas affected the Parent Company's financial position and financial performance. There were no significant reconciling items between cash flows prepared under IndianGAAP and those prepared under Ind AS, except ones that are disclosed in Note C (5) below.
Optional exemptions availed and mandatory exceptions In preparing the Ind AS consolidated financial statements, the Parent Company has applied the below mentioned optional exemptions and mandatory exceptions.
(i) Property, plant and equipment and intangible assets: As per Ind AS 101 an entity may elect to:
(a) measure an item of property, plant and equipment at the date of transition at its fair value and use that fair value as its deemed cost at that date; (b) use the previous GAAP revaluation of an item of property, plant and equipment at or before the date of transition as deemed cost at the date of the revaluation, providedthe revaluation was, at the date of the revaluation, broadly comparable to: -fair value; -or cost or depreciated cost under Ind AS adjusted to reflect, for example, changes in a general or specific price index, The elections under (a) and (b) above are also available for intangible assets that meets the recognition criteria in Ind AS 38, Intangible Assets, (including reliablemeasurement of original cost); and criteria in Ind AS 38 for revaluation (including the existence of an active market). (c) use carrying values of property, plant and equipment and intangible assets as on the date of transition to Ind AS (which are measured in accordance with previous GAAPand after making adjustment relating to decommissioning liability prescribed under Ind AS 101) if there has been no change in its functional currency on the date oftransition.
As permitted by Ind AS 101, the Parent Company has elected to fair value its freehold land and uses that fair value as its deemed cost at the date of transition, viz,, 01 April2019. With respect to the remaining item of property, plant and equipment and intangible assets, the Parent Company has elected to value them in accordance with Ind AS16 and Ind AS 38 respectively.
Mandatory exemptions availed:
Ind AS 101 also allows first-time adopters can claim mandatory exceptions to be applied for retrospective application of certain requirements under Ind AS for transitionfrom the previous GAAP (IGAAP):
As per Ind AS, at the date of transition an entity may elect not to restate business combination that occurred before the date of transition. If the entity restate any businesscombination that occurred before the date of transition, then it restates all later business combinations. The Parent Company has elected to apply Ind AS 103, BusinessCombinations retrospectively to past business combinations that occurred before the Ind AS transition date of 01 April 2019, from 01 April 2018.
243

S.J.S. Enterprises Limited (formerly known as S.J.S. Enterprises Private Limited)
44 First-time adoption of Ind-AS (continued)
-Fair valuation of financial instruments carried at fair value through profit and loss or fair value through other comprehensive income, -Impairment of financial assets based on expected credit loss model, -Determination of the discounted value for financial instruments carried at amortised cost, and
Upon the assessment of the estimate made under previous GAAP, the Parent Company has concluded that there was no necessity to revise such estimates under Ind AS,other than those which are required due to application of Ind AS.
(ii) Derecognition of financial assets and liabilities: As per Ind AS 101 an entity should apply the recognition requirements in Ind AS 109, Financial Instruments, prospectively for transaction occurring after the date oftransition to Ind AS. However an entity may apply the derecognition requirements retrospectively from a date chosen by it if the information needed to apply Ind AS 109 tofinancial assets and financial liabilities derecognized as a result of past transaction were obtained at the time of initially accounting for those transactions.
The Parent Company has chosen to avail the exception to apply the derecognition provision of Ind AS 101 prospectively from the date of transition.
(iii) Classification and measurement of financial assets: Ind AS 101 requires an entity to classify and measure its financial assets into amortised cost, fair value through profit or loss or fair value through other comprehensiveincome based on the business model assessment and solely payment of principal and interest ("SPPI") criterion based on facts and circumstances that exist at the date oftransition. Further, the standard permits measurement of financial assets accounted at amortised cost based on the facts and circumstances existing at the date of transition ifretrospective application is impracticable.
Accordingly, the Parent Company has determined the classification of financial assets based on facts and circumstances that exist on the date of transition. Measurement ofthe financial assets accounted at amortised cost has been done retrospectively.
(i) Estimates: As per Ind AS 101, an entity's estimates in accordance with Ind AS at the date of transition to Ind AS shall be consistent with estimates made for the same date in accordancewith previous GAAP (after adjustments to reflect any difference in accounting policies), unless there is objective evidence that those estimates were in error. However, theestimates should be adjusted to reflect any differences in accounting policies.
As per Ind AS 101, where application of Ind AS requires an entity to make certain estimates that were not required under previous GAAP, those estimates should be made toreflect conditions that existed at the date of transition (for preparing opening Ind AS balance sheet) or at the end of the comparative period (for presenting comparativeinformation as per Ind AS).
Ind AS estimated as at 01 April 2019 are consistent with the estimates as at the same date made in conformity with previous GAAP. The Parent Company made estimates forfollowing items in accordance with Ind AS at the date of transition as these were not required under previous GAAP:
244
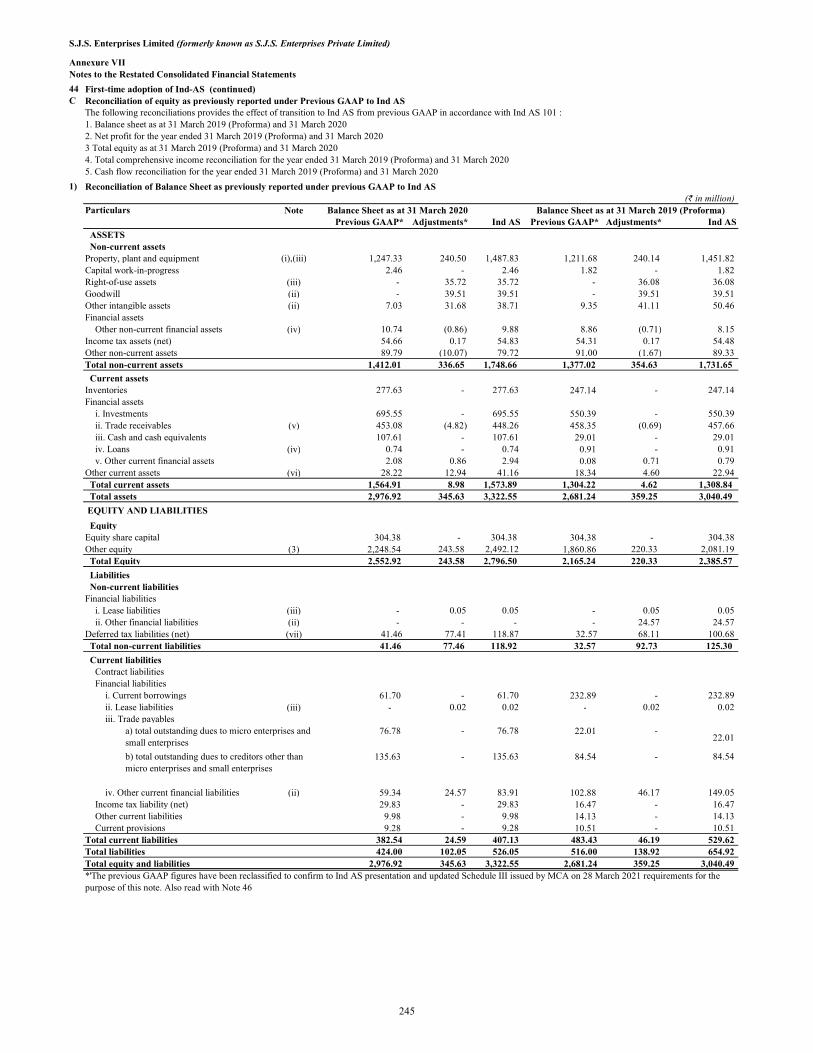
S.J.S. Enterprises Limited (formerly known as S.J.S. Enterprises Private Limited)
Annexure VIINotes to the Restated Consolidated Financial Statements
44 First-time adoption of Ind-AS (continued)C Reconciliation of equity as previously reported under Previous GAAP to Ind AS
1) Reconciliation of Balance Sheet as previously reported under previous GAAP to Ind AS (₹ in million)
Particulars Balance Sheet as at 31 March 2020 Balance Sheet as at 31 March 2019 (Proforma)Previous GAAP* Adjustments* Ind AS Previous GAAP* Adjustments* Ind AS
ASSETS Non-current assetsProperty, plant and equipment (i),(iii) 1,247.33 240.50 1,487.83 1,211.68 240.14 1,451.82 Capital work-in-progress 2.46 - 2.46 1.82 - 1.82 Right-of-use assets (iii) - 35.72 35.72 - 36.08 36.08 Goodwill (ii) - 39.51 39.51 - 39.51 39.51 Other intangible assets (ii) 7.03 31.68 38.71 9.35 41.11 50.46 Financial assets
Other non-current financial assets (iv) 10.74 (0.86) 9.88 8.86 (0.71) 8.15 Income tax assets (net) 54.66 0.17 54.83 54.31 0.17 54.48 Other non-current assets 89.79 (10.07) 79.72 91.00 (1.67) 89.33 Total non-current assets 1,412.01 336.65 1,748.66 1,377.02 354.63 1,731.65
Current assetsInventories 277.63 - 277.63 247.14 - 247.14 Financial assets
i. Investments 695.55 - 695.55 550.39 - 550.39 ii. Trade receivables (v) 453.08 (4.82) 448.26 458.35 (0.69) 457.66 iii. Cash and cash equivalents 107.61 - 107.61 29.01 - 29.01 iv. Loans (iv) 0.74 - 0.74 0.91 - 0.91 v. Other current financial assets 2.08 0.86 2.94 0.08 0.71 0.79
Other current assets (vi) 28.22 12.94 41.16 18.34 4.60 22.94 Total current assets 1,564.91 8.98 1,573.89 1,304.22 4.62 1,308.84 Total assets 2,976.92 345.63 3,322.55 2,681.24 359.25 3,040.49
EQUITY AND LIABILITIES
EquityEquity share capital 304.38 - 304.38 304.38 - 304.38 Other equity (3) 2,248.54 243.58 2,492.12 1,860.86 220.33 2,081.19 Total Equity 2,552.92 243.58 2,796.50 2,165.24 220.33 2,385.57
Liabilities Non-current liabilitiesFinancial liabilities
i. Lease liabilities (iii) - 0.05 0.05 - 0.05 0.05 ii. Other financial liabilities (ii) - - - - 24.57 24.57
Deferred tax liabilities (net) (vii) 41.46 77.41 118.87 32.57 68.11 100.68 Total non-current liabilities 41.46 77.46 118.92 32.57 92.73 125.30
Current liabilitiesContract liabilitiesFinancial liabilities
i. Current borrowings 61.70 - 61.70 232.89 - 232.89 ii. Lease liabilities (iii) - 0.02 0.02 - 0.02 0.02 iii. Trade payables
76.78 - 76.78 22.01 - 22.01
135.63 - 135.63 84.54 - 84.54
iv. Other current financial liabilities (ii) 59.34 24.57 83.91 102.88 46.17 149.05 Income tax liability (net) 29.83 - 29.83 16.47 - 16.47 Other current liabilities 9.98 - 9.98 14.13 - 14.13 Current provisions 9.28 - 9.28 10.51 - 10.51
Total current liabilities 382.54 24.59 407.13 483.43 46.19 529.62 Total liabilities 424.00 102.05 526.05 516.00 138.92 654.92 Total equity and liabilities 2,976.92 345.63 3,322.55 2,681.24 359.25 3,040.49
The following reconciliations provides the effect of transition to Ind AS from previous GAAP in accordance with Ind AS 101 :1. Balance sheet as at 31 March 2019 (Proforma) and 31 March 20202. Net profit for the year ended 31 March 2019 (Proforma) and 31 March 20203 Total equity as at 31 March 2019 (Proforma) and 31 March 20204. Total comprehensive income reconciliation for the year ended 31 March 2019 (Proforma) and 31 March 20205. Cash flow reconciliation for the year ended 31 March 2019 (Proforma) and 31 March 2020
Note
a) total outstanding dues to micro enterprises and small enterprises
b) total outstanding dues to creditors other than micro enterprises and small enterprises
*'The previous GAAP figures have been reclassified to confirm to Ind AS presentation and updated Schedule III issued by MCA on 28 March 2021 requirements for the purpose of this note. Also read with Note 46
245
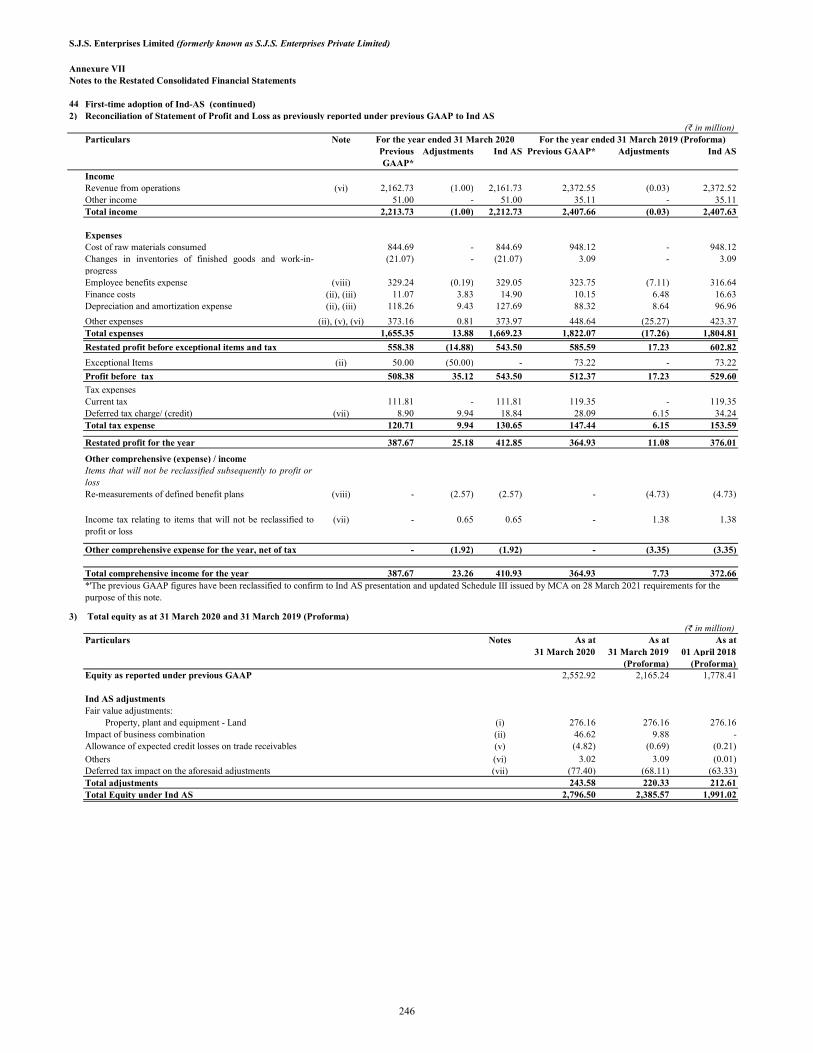
S.J.S. Enterprises Limited (formerly known as S.J.S. Enterprises Private Limited)
Annexure VIINotes to the Restated Consolidated Financial Statements
44 First-time adoption of Ind-AS (continued)2) Reconciliation of Statement of Profit and Loss as previously reported under previous GAAP to Ind AS
(₹ in million)Particulars For the year ended 31 March 2020 For the year ended 31 March 2019 (Proforma)
Previous GAAP*
Adjustments Ind AS Previous GAAP* Adjustments Ind AS
IncomeRevenue from operations (vi) 2,162.73 (1.00) 2,161.73 2,372.55 (0.03) 2,372.52 Other income 51.00 - 51.00 35.11 - 35.11 Total income 2,213.73 (1.00) 2,212.73 2,407.66 (0.03) 2,407.63
ExpensesCost of raw materials consumed 844.69 - 844.69 948.12 - 948.12 Changes in inventories of finished goods and work-in-progress
(21.07) - (21.07) 3.09 - 3.09
Employee benefits expense (viii) 329.24 (0.19) 329.05 323.75 (7.11) 316.64 Finance costs (ii), (iii) 11.07 3.83 14.90 10.15 6.48 16.63 Depreciation and amortization expense (ii), (iii) 118.26 9.43 127.69 88.32 8.64 96.96
Other expenses (ii), (v), (vi) 373.16 0.81 373.97 448.64 (25.27) 423.37 Total expenses 1,655.35 13.88 1,669.23 1,822.07 (17.26) 1,804.81
Restated profit before exceptional items and tax 558.38 (14.88) 543.50 585.59 17.23 602.82
Exceptional Items (ii) 50.00 (50.00) - 73.22 - 73.22
Profit before tax 508.38 35.12 543.50 512.37 17.23 529.60
Tax expensesCurrent tax 111.81 - 111.81 119.35 - 119.35 Deferred tax charge/ (credit) (vii) 8.90 9.94 18.84 28.09 6.15 34.24 Total tax expense 120.71 9.94 130.65 147.44 6.15 153.59
Restated profit for the year 387.67 25.18 412.85 364.93 11.08 376.01
Other comprehensive (expense) / incomeItems that will not be reclassified subsequently to profit orlossRe-measurements of defined benefit plans (viii) - (2.57) (2.57) - (4.73) (4.73)
Income tax relating to items that will not be reclassified toprofit or loss
(vii) - 0.65 0.65 - 1.38 1.38
Other comprehensive expense for the year, net of tax - (1.92) (1.92) - (3.35) (3.35)
Total comprehensive income for the year 387.67 23.26 410.93 364.93 7.73 372.66
3) Total equity as at 31 March 2020 and 31 March 2019 (Proforma)(₹ in million)
Particulars Notes As at As at As at 31 March 2020 31 March 2019 01 April 2018
(Proforma) (Proforma)Equity as reported under previous GAAP 2,552.92 2,165.24 1,778.41
Ind AS adjustmentsFair value adjustments:
Property, plant and equipment - Land (i) 276.16 276.16 276.16 Impact of business combination (ii) 46.62 9.88 - Allowance of expected credit losses on trade receivables (v) (4.82) (0.69) (0.21)
Others (vi) 3.02 3.09 (0.01)Deferred tax impact on the aforesaid adjustments (vii) (77.40) (68.11) (63.33)Total adjustments 243.58 220.33 212.61 Total Equity under Ind AS 2,796.50 2,385.57 1,991.02
Note
*'The previous GAAP figures have been reclassified to confirm to Ind AS presentation and updated Schedule III issued by MCA on 28 March 2021 requirements for the purpose of this note.
246
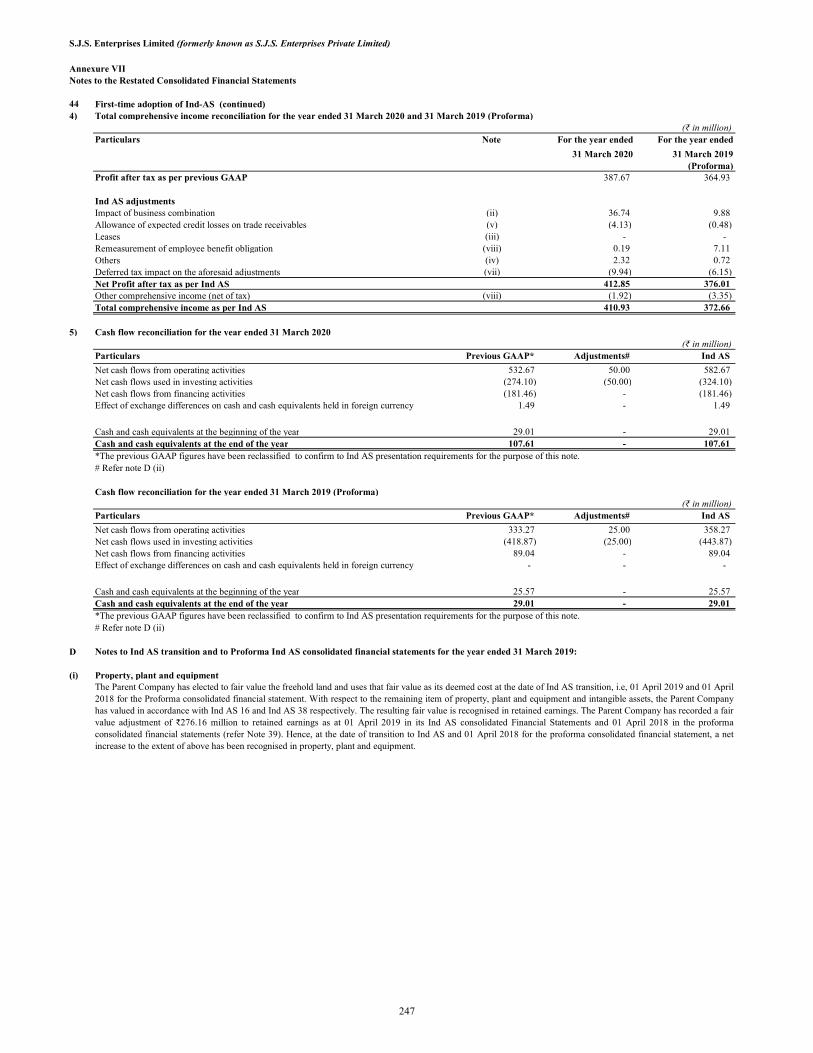
S.J.S. Enterprises Limited (formerly known as S.J.S. Enterprises Private Limited)
Annexure VIINotes to the Restated Consolidated Financial Statements
44 First-time adoption of Ind-AS (continued)4) Total comprehensive income reconciliation for the year ended 31 March 2020 and 31 March 2019 (Proforma)
(₹ in million)Particulars Note For the year ended For the year ended
31 March 2020 31 March 2019(Proforma)
Profit after tax as per previous GAAP 387.67 364.93
Ind AS adjustmentsImpact of business combination (ii) 36.74 9.88 Allowance of expected credit losses on trade receivables (v) (4.13) (0.48)Leases (iii) - - Remeasurement of employee benefit obligation (viii) 0.19 7.11 Others (iv) 2.32 0.72 Deferred tax impact on the aforesaid adjustments (vii) (9.94) (6.15)Net Profit after tax as per Ind AS 412.85 376.01 Other comprehensive income (net of tax) (viii) (1.92) (3.35)Total comprehensive income as per Ind AS 410.93 372.66
5) Cash flow reconciliation for the year ended 31 March 2020(₹ in million)
Particulars Previous GAAP* Adjustments# Ind AS
Net cash flows from operating activities 532.67 50.00 582.67 Net cash flows used in investing activities (274.10) (50.00) (324.10)Net cash flows from financing activities (181.46) - (181.46)
1.49 - 1.49
Cash and cash equivalents at the beginning of the year 29.01 - 29.01 Cash and cash equivalents at the end of the year 107.61 - 107.61 *The previous GAAP figures have been reclassified to confirm to Ind AS presentation requirements for the purpose of this note.# Refer note D (ii)
Cash flow reconciliation for the year ended 31 March 2019 (Proforma)(₹ in million)
Particulars Previous GAAP* Adjustments# Ind AS
Net cash flows from operating activities 333.27 25.00 358.27 Net cash flows used in investing activities (418.87) (25.00) (443.87)Net cash flows from financing activities 89.04 - 89.04
- - -
Cash and cash equivalents at the beginning of the year 25.57 - 25.57 Cash and cash equivalents at the end of the year 29.01 - 29.01 *The previous GAAP figures have been reclassified to confirm to Ind AS presentation requirements for the purpose of this note.# Refer note D (ii)
D
(i) Property, plant and equipment
Effect of exchange differences on cash and cash equivalents held in foreign currency
Effect of exchange differences on cash and cash equivalents held in foreign currency
The Parent Company has elected to fair value the freehold land and uses that fair value as its deemed cost at the date of Ind AS transition, i.e, 01 April 2019 and 01 April2018 for the Proforma consolidated financial statement. With respect to the remaining item of property, plant and equipment and intangible assets, the Parent Companyhas valued in accordance with Ind AS 16 and Ind AS 38 respectively. The resulting fair value is recognised in retained earnings. The Parent Company has recorded a fairvalue adjustment of ₹276.16 million to retained earnings as at 01 April 2019 in its Ind AS consolidated Financial Statements and 01 April 2018 in the proformaconsolidated financial statements (refer Note 39). Hence, at the date of transition to Ind AS and 01 April 2018 for the proforma consolidated financial statement, a netincrease to the extent of above has been recognised in property, plant and equipment.
Notes to Ind AS transition and to Proforma Ind AS consolidated financial statements for the year ended 31 March 2019:
247

S.J.S. Enterprises Limited (formerly known as S.J.S. Enterprises Private Limited)
Annexure VIINotes to the Restated Consolidated Financial Statements
D Notes to Ind AS transition and to Proforma consolidated Ind AS financial statements for the year ended 31 March 2019 (continued)
(ii) Business combination
(iii) Leases
(iv) Other financial assets
(v) Trade receivable
(vi) Others
(vii) Deferred tax liabilities
(viii) Remeasurement of post employee benefits expense
Under the previous GAAP, the Parent Company has recorded the amount paid towards acquisition of business from Delta Ram Enterprises, Sirisha Enterprises and SMEnterprises ('Selling parties') as sales commission charges in the Statement of profit and loss as an exceptional item. Under Ind AS - 103, the Parent Company hasaccounted the business combination using acquisition method. The excess of consideration paid and fair value of identifiable assets recorded as goodwill on the date ofacquisition. Refer Note 4, 19 & 42.On the date of Ind AS transition following adjustment were made against retained earnings:1. (₹8.64 million) is on account of amortization of Intangible assets (customer relationship and non compete fees). 2. ₹25.00 million is on account of reversal of sales commission expenses.3. (₹6.48 million) is on account of discounting of consideration payable
As at ended 31 March 2020 following adjustments were made against retained earnings:1. (₹9.43 million) is on account of amortization of Intangible assets (customer relationship and non compete fees). 2. ₹50.00 million is on account of reversal of sales commission expenses.3. (₹3.83 million) is on account of discounting of consideration payable.
As at ended 31 March 2019 (Proforma) following adjustments were made against retained earnings:1. (₹8.64 million) is on account of amortization of Intangible assets (customer relationship and non compete fees). 2. ₹25.00 million is on account of reversal of sales commission expenses.3. (₹6.48 million) is on account of discounting of consideration payable.
Cash flow impactUnder the previous GAAP, the exceptional item of ₹50 million for the year ended 31 March 2020 and ₹25 million for the year ended 31 March 2019 (Proforma) wasconsidered as operating cashflow, on transition to Ind AS the amount paid toward business acquisition was shown as an investing activity in Statement of Cash Flows forthe year ended 31 March 2020 and 31 March 2019 (Proforma).
Under the previous GAAP, lessee classified a lease as an operating or a finance lease based on whether or not the lease transferred substantially all risk and rewardsincidental to the ownership of an asset. Operating lease were expensed in the statement of profit and loss. Pursuant to application of Ind AS - 116, for operating leasesother than those for which the Parent Company has opted for short-term or low value exemption, the Parent Company has recorded a right-of-use assets of ₹36.08million as on 31 March 2019 (Proforma) (31 March 2020: ₹35.72 million) and lease liabilities of ₹0.07 million as on 31 March 2019 (Proforma) (31 March 2020: ₹0.07million). Right-of-use asset is amortised over the lease term or useful life of the leased assets whichever is lower and lease liabilities is subsequently measured atamortised cost and interest expense is recognized. For the year ended 31 March 2019 (Proforma), the Parent Company has recognized ₹0.02 million in retained earningand for the year ended 31 March 2020, the Parent Company has recognized ₹0.36 million in Statement of profit and loss towards amortisation of right of use asset andinterest expense of lease liability.
The Parent Company has measured the right-of-use asset at the date of transition at its carrying amount as if Ind AS - 116 had been applied since the commencementdate of the lease and the lease liability is measured at present value of the remaining lease payments since the date of commencement.
The movement in other financial assets is arising mainly on account of reclassification of security deposit from non-current to current basis the lease term schedule.
Under previous GAAP, the Parent Company has created provision for impairment of receivables based on the incurred loss model. Under Ind AS, impairment loss hasbeen determined as per Expected credit loss (ECL) model over and above the amount carried under IGAAP based on specific identification of such provision required.The provision required under Ind AS - ECL is recognized as retained earnings on date of transition and subsequently in the statement of profit and loss account. For theyear ended 31 March 2019 (Proforma) the Parent Company has provided for ECL through retained earnings ₹0.69 million and during the year 31 March 2020 the ParentCompany has further provided ₹4.13 million to statement of profit and loss towards increase in allowance of ECL.
Indian GAAP requires deferred tax accounting using the income statement approach, which focuses on differences between taxable profits and accounting profits for theperiod. Ind-AS 12 requires entities to account for deferred taxes using the balance sheet approach, which focuses on temporary differences between the carrying amountof an asset or liability in the balance sheet and its tax base. The application of Ind-AS 12 approach has resulted in recognition of deferred tax on new temporarydifferences which was not required under Indian GAAP. In addition, the various transitional adjustments lead to temporary differences.
Under Ind AS, remeasurements i.e. actuarial gains and losses and the return on plan asset, excluding amounts included in the net interest expense on the net definedbenefit liability are recognized in other comprehensive income instead of profit or loss. Under the previous GAAP, these remeasurements were forming part of the profitor loss for the year.
Others include amount towards deferred expense impact related to business support expenditure, leases and reconciliation of prepaid compensated absences.
248

S.J.S. Enterprises Limited (formerly known as S.J.S. Enterprises Private Limited)
Annexure VIINotes to the Restated Consolidated Financial Statements
45 Events after the reporting period
46
As per our report of even date attachedfor B S R & Co. LLP for and on behalf of Board of Directors of Chartered Accountants S.J.S. Enterprises LimitedFirm's registration number: 101248W/W-100022 (formerly known as S.J.S. Enterprises Private Limited)
Umang Banka K A Joseph Sanjay Thapar Thabraz HushainPartner Managing Director CEO and Director Company SecretaryMembership number: 223018 DIN : 00784084 DIN : 01029851 PAN : ABVPW4613PPlace: Bengaluru Place: Bengaluru Place: Bengaluru Place: BengaluruDate: 11 October 2021 Date: 11 October 2021 Date: 11 October 2021 Date: 11 October 2021
Amit Kumar GargChief Financial Officer PAN : AAIPG1333LPlace: BengaluruDate: 11 October 2021
Previous year figures have been regrouped/reclassifed where ever necessary to confirm with amendments in schedule III to the Companies Act 2013, issued by MCAvide notification dated 24 March 2021.
Subesequent to the quarter ended 30 June 2021, the Board of Directors of the Company vide its board meeting dated 24 September 2021 has proposed an interimdividend of ₹60.88 million i.e. ₹2.00 per share.
249
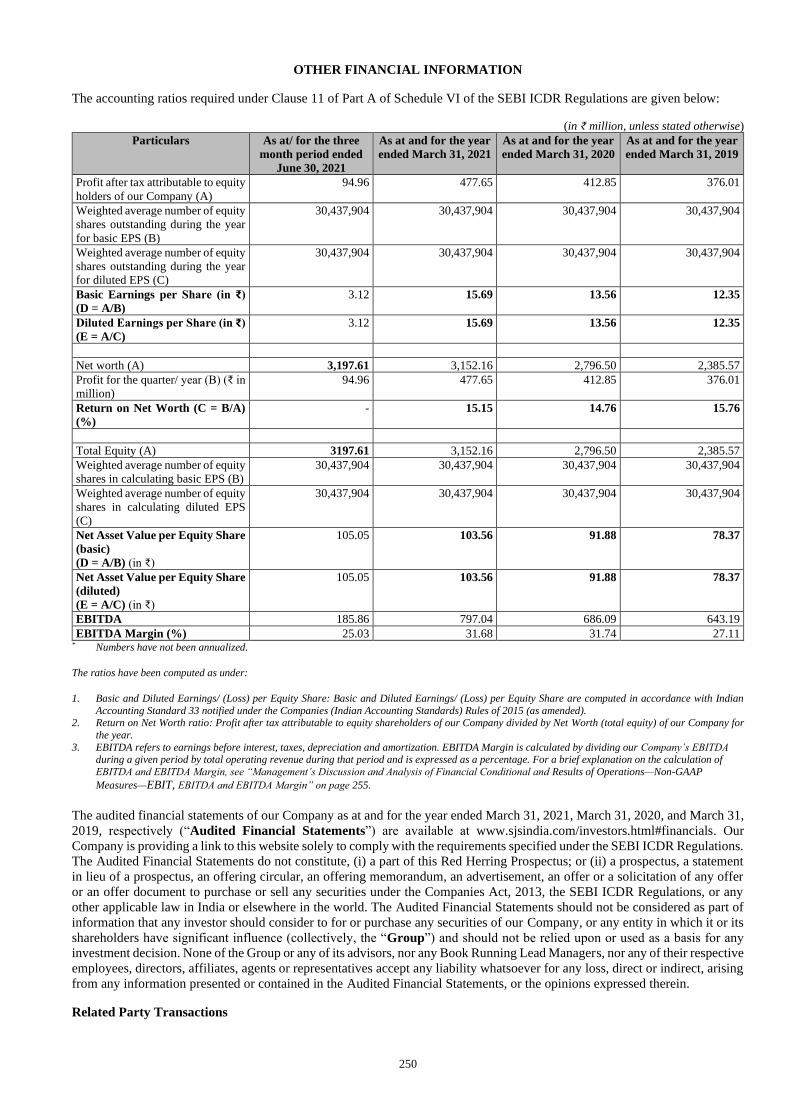
250
OTHER FINANCIAL INFORMATION
The accounting ratios required under Clause 11 of Part A of Schedule VI of the SEBI ICDR Regulations are given below:
(in ₹ million, unless stated otherwise)
Particulars As at/ for the three
month period ended
June 30, 2021
As at and for the year
ended March 31, 2021
As at and for the year
ended March 31, 2020
As at and for the year
ended March 31, 2019
Profit after tax attributable to equity
holders of our Company (A)
94.96 477.65 412.85 376.01
Weighted average number of equity
shares outstanding during the year
for basic EPS (B)
30,437,904 30,437,904 30,437,904 30,437,904
Weighted average number of equity
shares outstanding during the year
for diluted EPS (C)
30,437,904 30,437,904 30,437,904 30,437,904
Basic Earnings per Share (in ₹)
(D = A/B)
3.12 15.69 13.56 12.35
Diluted Earnings per Share (in ₹)
(E = A/C)
3.12 15.69 13.56 12.35
Net worth (A) 3,197.61 3,152.16 2,796.50 2,385.57
Profit for the quarter/ year (B) (₹ in
million)
94.96 477.65 412.85 376.01
Return on Net Worth (C = B/A)
(%)
- 15.15 14.76 15.76
Total Equity (A) 3197.61 3,152.16 2,796.50 2,385.57
Weighted average number of equity
shares in calculating basic EPS (B)
30,437,904 30,437,904 30,437,904 30,437,904
Weighted average number of equity
shares in calculating diluted EPS
(C)
30,437,904 30,437,904 30,437,904 30,437,904
Net Asset Value per Equity Share
(basic)
(D = A/B) (in ₹)
105.05 103.56 91.88 78.37
Net Asset Value per Equity Share
(diluted)
(E = A/C) (in ₹)
105.05 103.56 91.88 78.37
EBITDA 185.86 797.04 686.09 643.19
EBITDA Margin (%) 25.03 31.68 31.74 27.11 * Numbers have not been annualized.
The ratios have been computed as under:
1. Basic and Diluted Earnings/ (Loss) per Equity Share: Basic and Diluted Earnings/ (Loss) per Equity Share are computed in accordance with Indian
Accounting Standard 33 notified under the Companies (Indian Accounting Standards) Rules of 2015 (as amended). 2. Return on Net Worth ratio: Profit after tax attributable to equity shareholders of our Company divided by Net Worth (total equity) of our Company for
the year. 3. EBITDA refers to earnings before interest, taxes, depreciation and amortization. EBITDA Margin is calculated by dividing our Company’s EBITDA
during a given period by total operating revenue during that period and is expressed as a percentage. For a brief explanation on the calculation of
EBITDA and EBITDA Margin, see “Management’s Discussion and Analysis of Financial Conditional and Results of Operations—Non-GAAP
Measures—EBIT, EBITDA and EBITDA Margin” on page 255.
The audited financial statements of our Company as at and for the year ended March 31, 2021, March 31, 2020, and March 31,
2019, respectively (“Audited Financial Statements”) are available at www.sjsindia.com/investors.html#financials. Our
Company is providing a link to this website solely to comply with the requirements specified under the SEBI ICDR Regulations.
The Audited Financial Statements do not constitute, (i) a part of this Red Herring Prospectus; or (ii) a prospectus, a statement
in lieu of a prospectus, an offering circular, an offering memorandum, an advertisement, an offer or a solicitation of any offer
or an offer document to purchase or sell any securities under the Companies Act, 2013, the SEBI ICDR Regulations, or any
other applicable law in India or elsewhere in the world. The Audited Financial Statements should not be considered as part of
information that any investor should consider to for or purchase any securities of our Company, or any entity in which it or its
shareholders have significant influence (collectively, the “Group”) and should not be relied upon or used as a basis for any
investment decision. None of the Group or any of its advisors, nor any Book Running Lead Managers, nor any of their respective
employees, directors, affiliates, agents or representatives accept any liability whatsoever for any loss, direct or indirect, arising
from any information presented or contained in the Audited Financial Statements, or the opinions expressed therein.
Related Party Transactions
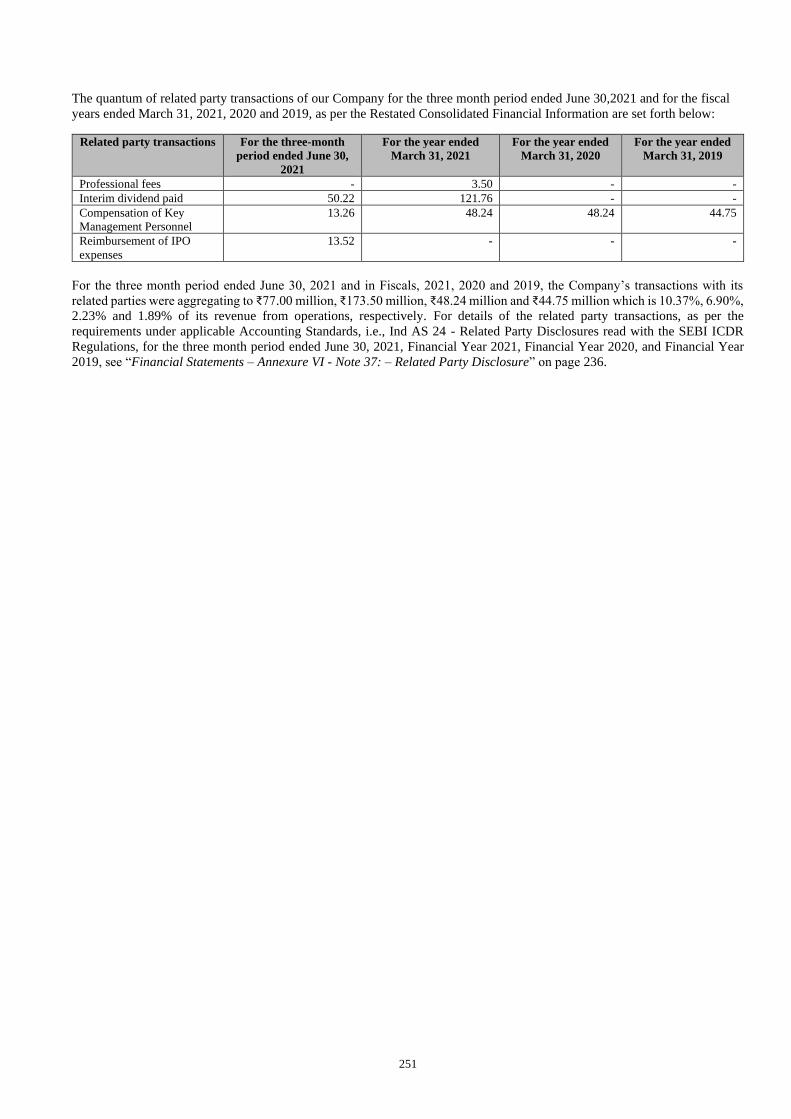
251
The quantum of related party transactions of our Company for the three month period ended June 30,2021 and for the fiscal
years ended March 31, 2021, 2020 and 2019, as per the Restated Consolidated Financial Information are set forth below:
Related party transactions For the three-month
period ended June 30,
2021
For the year ended
March 31, 2021
For the year ended
March 31, 2020
For the year ended
March 31, 2019
Professional fees - 3.50 - -
Interim dividend paid 50.22 121.76 - -
Compensation of Key
Management Personnel
13.26 48.24 48.24 44.75
Reimbursement of IPO
expenses
13.52 - - -
For the three month period ended June 30, 2021 and in Fiscals, 2021, 2020 and 2019, the Company’s transactions with its
related parties were aggregating to ₹77.00 million, ₹173.50 million, ₹48.24 million and ₹44.75 million which is 10.37%, 6.90%,
2.23% and 1.89% of its revenue from operations, respectively. For details of the related party transactions, as per the
requirements under applicable Accounting Standards, i.e., Ind AS 24 - Related Party Disclosures read with the SEBI ICDR
Regulations, for the three month period ended June 30, 2021, Financial Year 2021, Financial Year 2020, and Financial Year
2019, see “Financial Statements – Annexure VI - Note 37: – Related Party Disclosure” on page 236.
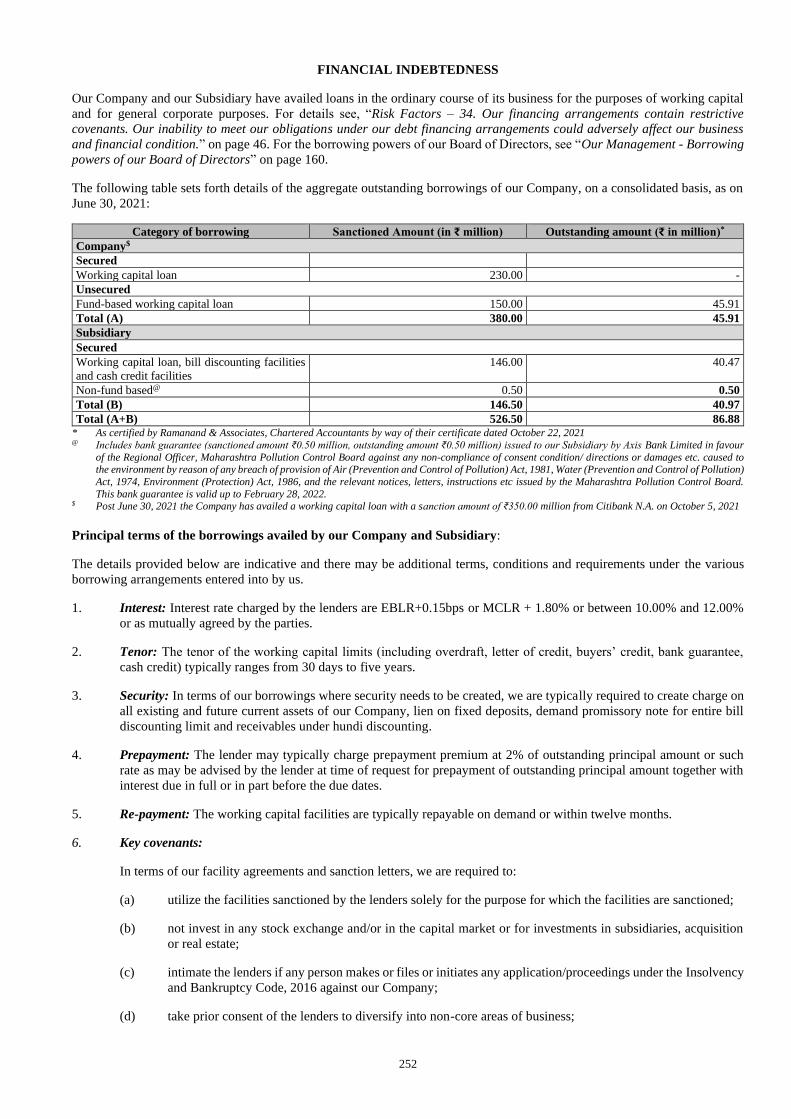
252
FINANCIAL INDEBTEDNESS
Our Company and our Subsidiary have availed loans in the ordinary course of its business for the purposes of working capital
and for general corporate purposes. For details see, “Risk Factors – 34. Our financing arrangements contain restrictive
covenants. Our inability to meet our obligations under our debt financing arrangements could adversely affect our business
and financial condition.” on page 46. For the borrowing powers of our Board of Directors, see “Our Management - Borrowing
powers of our Board of Directors” on page 160.
The following table sets forth details of the aggregate outstanding borrowings of our Company, on a consolidated basis, as on
June 30, 2021:
Category of borrowing Sanctioned Amount (in ₹ million) Outstanding amount (₹ in million)*
Company$
Secured
Working capital loan 230.00 -
Unsecured
Fund-based working capital loan 150.00 45.91
Total (A) 380.00 45.91
Subsidiary
Secured
Working capital loan, bill discounting facilities
and cash credit facilities
146.00 40.47
Non-fund based@ 0.50 0.50
Total (B) 146.50 40.97
Total (A+B) 526.50 86.88 * As certified by Ramanand & Associates, Chartered Accountants by way of their certificate dated October 22, 2021 @ Includes bank guarantee (sanctioned amount ₹0.50 million, outstanding amount ₹0.50 million) issued to our Subsidiary by Axis Bank Limited in favour
of the Regional Officer, Maharashtra Pollution Control Board against any non-compliance of consent condition/ directions or damages etc. caused to the environment by reason of any breach of provision of Air (Prevention and Control of Pollution) Act, 1981, Water (Prevention and Control of Pollution)
Act, 1974, Environment (Protection) Act, 1986, and the relevant notices, letters, instructions etc issued by the Maharashtra Pollution Control Board.
This bank guarantee is valid up to February 28, 2022. $ Post June 30, 2021 the Company has availed a working capital loan with a sanction amount of ₹350.00 million from Citibank N.A. on October 5, 2021
Principal terms of the borrowings availed by our Company and Subsidiary:
The details provided below are indicative and there may be additional terms, conditions and requirements under the various
borrowing arrangements entered into by us.
1. Interest: Interest rate charged by the lenders are EBLR+0.15bps or MCLR + 1.80% or between 10.00% and 12.00%
or as mutually agreed by the parties.
2. Tenor: The tenor of the working capital limits (including overdraft, letter of credit, buyers’ credit, bank guarantee,
cash credit) typically ranges from 30 days to five years.
3. Security: In terms of our borrowings where security needs to be created, we are typically required to create charge on
all existing and future current assets of our Company, lien on fixed deposits, demand promissory note for entire bill
discounting limit and receivables under hundi discounting.
4. Prepayment: The lender may typically charge prepayment premium at 2% of outstanding principal amount or such
rate as may be advised by the lender at time of request for prepayment of outstanding principal amount together with
interest due in full or in part before the due dates.
5. Re-payment: The working capital facilities are typically repayable on demand or within twelve months.
6. Key covenants:
In terms of our facility agreements and sanction letters, we are required to:
(a) utilize the facilities sanctioned by the lenders solely for the purpose for which the facilities are sanctioned;
(b) not invest in any stock exchange and/or in the capital market or for investments in subsidiaries, acquisition
or real estate;
(c) intimate the lenders if any person makes or files or initiates any application/proceedings under the Insolvency
and Bankruptcy Code, 2016 against our Company;
(d) take prior consent of the lenders to diversify into non-core areas of business;

253
(e) take prior consent of the lenders for change in capital structure, change in shareholding pattern and
management control in our Company;
(f) take prior consent from the lenders for entering into any scheme for merger, amalgamation, compromise or
reconstruction;
(g) take prior consent of lenders before modification / amendment of the constitutional documents of our
Company or change in constitution of our Company;
(h) take prior consent of lenders before effecting dividend payout, capital withdrawal; and
(i) take prior written permission for any reduction or change in promoter shareholding or change in promoter
directorship resulting in change of management control.
7. Events of Default:
In terms of the facility agreements and sanction letters, the following, among others, constitute events of default:
(a) failure and/or breach by our Company to perform any of the obligations or terms or conditions applicable
under the deed/other documents/any other agreement with any person including non-payment in full of any
part of the obligations when due or when demanded by the lender;
(b) any misrepresentation or misstatement under the agreement;
(c) event of death, winding up, failure in business, insolvency, bankruptcy, or initiations of any
proceedings/actions/notices for any of them including insolvency and bankruptcy under IBC/actions/notices,
change or termination of employment/profession/business for any reason whatsoever or change in
constitution, management or existing ownership or control of the identified obligor including by reason of
liquidation, amalgamation, merger, reconstruction;
(d) inability of the borrower to repay debts to any person or any steps being taken by any person, accelerating
the payment obligations of the borrower or declaration by any person of an event of default under their
respective agreement with our Company;
(e) issuance of any demand notice by any of the creditors (whether operational or financial) under the IBC;
(f) our Company ceasing or threatening to cease to carry on its business; and
(g) material change in the our ownership or management, in the opinion of the lender, which would prejudicially
affect the interest of the lender.
8. Consequences of occurrence of events of default:
In terms of the facility agreements and sanction letters, in case of an occurrence of any event of default set out above,
our lenders may, among others:
(a) declare that the dues and all obligations shall immediately become due and payable irrespective of any agreed
maturity;
(b) enforce their security; and
(c) convert, at their option, whole or part of outstanding due amounts under the facility into equity shares of our
Company at face value and/or formulate mechanism for resolution of the stressed asset.
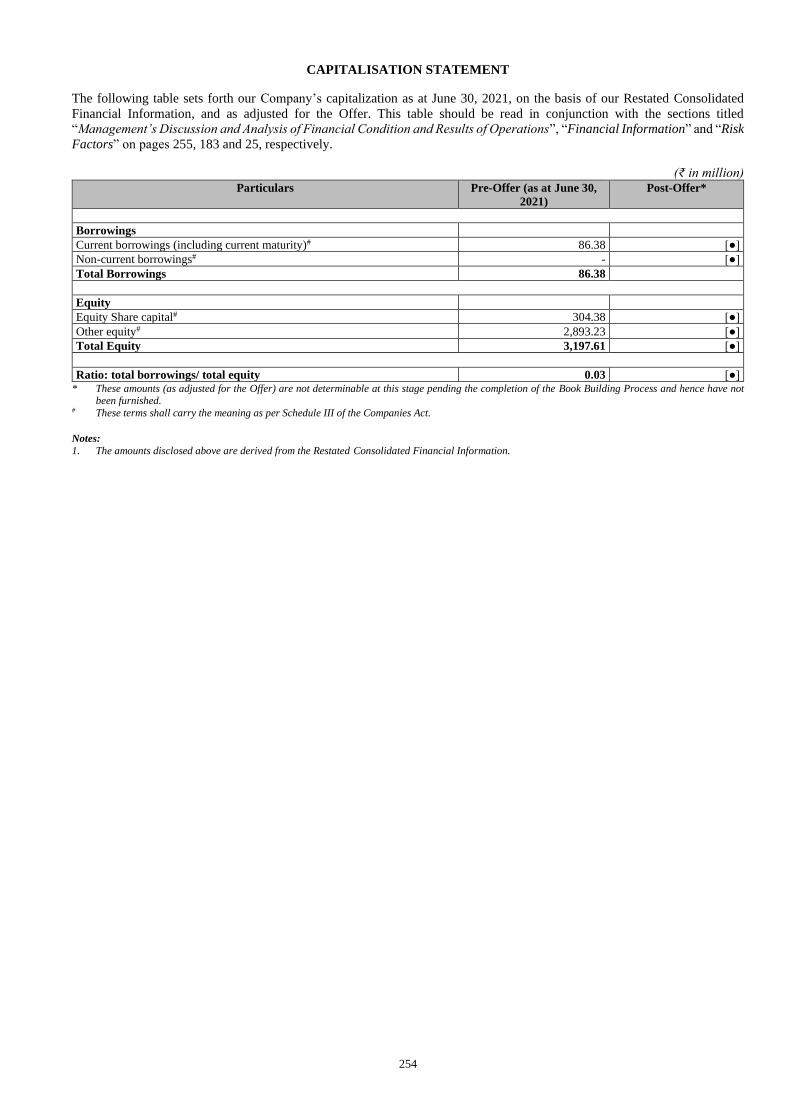
254
CAPITALISATION STATEMENT
The following table sets forth our Company’s capitalization as at June 30, 2021, on the basis of our Restated Consolidated
Financial Information, and as adjusted for the Offer. This table should be read in conjunction with the sections titled
“Management’s Discussion and Analysis of Financial Condition and Results of Operations”, “Financial Information” and “Risk
Factors” on pages 255, 183 and 25, respectively.
(₹ in million) Particulars Pre-Offer (as at June 30,
2021)
Post-Offer*
Borrowings
Current borrowings (including current maturity)# 86.38 [●]
Non-current borrowings# - [●]
Total Borrowings 86.38
Equity
Equity Share capital# 304.38 [●]
Other equity# 2,893.23 [●]
Total Equity 3,197.61 [●]
Ratio: total borrowings/ total equity 0.03 [●] * These amounts (as adjusted for the Offer) are not determinable at this stage pending the completion of the Book Building Process and hence have not
been furnished. # These terms shall carry the meaning as per Schedule III of the Companies Act.
Notes:
1. The amounts disclosed above are derived from the Restated Consolidated Financial Information.

255
MANAGEMENT’S DISCUSSION AND ANALYSIS OF FINANCIAL CONDITION AND RESULTS OF
OPERATIONS
The following discussion of our financial condition and results of operations should be read in conjunction with our Restated
Consolidated Financial Information, including the respective schedules, annexures and notes thereto, and the related auditors’
examination reports thereon, included in “Financial Information” on page 183. Unless otherwise stated, the financial
information used in this section is derived from our Restated Consolidated Financial Information.
Our Proforma Condensed Consolidated Financial Information included in this Red Herring Prospectus shows the impact of
the Exotech Acquisition on our Company, its financial performance for the year ended March 31, 2021 and financial condition
as at March 31, 2021, as if the acquisition had been completed at an earlier date selected in accordance with the SEBI ICDR
Regulations. For further information, see “—Exotech Acquisition and Basis of Preparation of the Proforma Condensed
Consolidated Financial Information” on page 255. Our Restated Consolidated Financial Information as at and for the three month
period ended June 30, 2021 (which includes the financial performance and financial condition of Exotech) may not be comparable to
our Restated Consolidated Financial Information for prior periods.
In this Red Herring Prospectus, unless specified otherwise, any reference to “the Company” or “our Company” refers to S.J.S.
Enterprises Limited, on a standalone basis, and a reference to “we”, “us” or “our”: (1) for any period prior to April 1, 2021
is a reference to our Company on a standalone basis, and (2) for any period after April 1, 2021 is a reference to our Company
together with our Subsidiary, on a consolidated basis. Additionally, please refer to “Definitions and Abbreviations” on page 1
for certain terms used in this section.
This discussion contains forward-looking statements and reflects our current views with respect to future events and financial
performance. Actual results may differ materially from those anticipated in these forward-looking statements. Given these
uncertainties, prospective investors are cautioned not to place undue reliance on such forward-looking statements. Factors
that could cause or contribute to such differences include, but are not limited to, those discussed in “Risk Factors” and “Our
Business” on pages 25 and 120, respectively. Also see “Forward Looking Statements” on page 23.
Our Fiscal commences on April 1 and ends on March 31 of the immediately subsequent year, and references to a particular
Fiscal are to the 12 months ended March 31 of that particular year.
The industry related information contained in this section is derived or extracted from the CRISIL Report which has been
commissioned, and paid for, by our Company for the purposes of confirming our understanding of the aesthetics industry
exclusively in connection with the Offer. See “Industry Overview” on page 96 for more information relating to the markets
covered by the CRISIL Report and the size of the aesthetics industry. Also see “Risk Factors—47. This Red Herring Prospectus
contains information from industry sources including the industry report prepared by CRISIL which has been commissioned, and paid
for, by our Company for the purpose of this Red Herring Prospectus. Investors are advised not to place undue reliance on such
information.” on page 50.
Overview
Our Company is one of the leading players in the Indian decorative aesthetics industry in terms of revenue in Fiscal 2020 and
as at March 31, 2021, offered the widest range of aesthetics products in India, according to the CRISIL Report. We are a
“design-to-delivery” aesthetics solutions provider with the ability to design, develop and manufacture a diverse product
portfolio for a wide range of customers primarily in the automotive and consumer appliance industries. Our Company supplied
over 115 million parts with more than 6,000 SKUs in Fiscal 2021 to around 170 customers in approximately 90 cities across
20 countries. We differentiate ourselves on the basis of the wide range of our product portfolio, quality of our product offerings,
our product design and development capabilities and the strength of our relationships with customers located across various
industries globally.
In addition to manufacturing aesthetics products that cater to the requirements for two-wheeler, passenger vehicle and consumer
appliance industries, we also manufacture a wide range of aesthetics products that cater to the requirements of the commercial
vehicles, medical devices, farm equipment and sanitary ware industries. Our product offerings include decals and body graphics,
2D appliques and dials, 3D appliques and dials, 3D lux badges, domes, overlays, aluminium badges, IML/IMD(s), lens mask
assembly and chrome-plated, printed and painted injection moulded plastic parts. We also offer a variety of accessories for the
two-wheelers’ and passenger vehicles’ aftermarket under our “Transform” brand.
Our key customer base includes:
• well-known automotive OEMs such as Suzuki, Mahindra & Mahindra, John Deere, Volkswagen, Ashok Leyland, Honda
Motorcycle, Bajaj Auto, Royal Enfield and TVS Motors;
• Tier-1 automotive component suppliers such as Marelli, Visteon, Brembo and Mindarika;
• well-known consumer durables/appliances manufacturers such as Whirlpool, Panasonic, Samsung, Eureka Forbes, Godrej
and Liebherr;
• medical devices manufacturers such as Sensa Core; and

256
• sanitary ware manufacturers such as Geberit.
We have developed long-standing relationships with several customers. As at June 30, 2021, our Company’s relationship with
its 10 largest customers in terms of revenue averaged approximately 15 years. We believe that this is attributable to our
collaborative design and product development approach and high product quality. We also credit our customer loyalty to our
ability to offer “design-to-delivery” aesthetics solutions with the use of sophisticated equipment and application of new
techniques.
In the three month period ended June 30, 2021 and Fiscals 2021, 2020 and 2019, our Company’s sales to OEMs contributed
66.23%, 69.94%, 69.75% and 74.26%, respectively and our Company’s sales to Tier-1 suppliers contributed 33.49%, 29.70%,
29.88% and 25.60%, respectively, to our Company’s revenue from operations in those periods. In the three month period ended
June 30, 2021 and Fiscals 2021, 2020 and 2019, our Company’s sales of products and services to two-wheeler OEMs and Tier-
1 suppliers contributed 49.49%, 58.01%, 61.29% and 69.99% and our Company’s sales of products and services to passenger
vehicle OEMs and Tier-1 suppliers contributed 21.46%, 16.63%, 14.73% and 10.22%, to our Company’s revenue from
operations, respectively, with a majority of the remaining portion being contributed by sales to consumer appliance
manufacturers. Our Subsidiary, Exotech, which we acquired on April 5, 2021, caters to requirements in the two-wheelers,
passenger vehicles, consumer durables/appliances, farm equipment and sanitary ware industries for chrome-plated, printed and
painted injection moulded plastic parts. The acquisition has enhanced our product suite and customer base and provided us
cross-selling opportunities to our existing and future customer base.
According to the CRISIL Report, the demand for aesthetics in India is expected to grow at a CAGR of approximately 20.00%
over the Fiscal 2021 to Fiscal 2026 period to reach approximately ₹49.20 billion by Fiscal 2026 and is expected to surpass
volume growth in demand for two-wheelers, passenger vehicles and consumer durables over that period. We expect the global
aesthetics industry to follow a similar trend. According to the CRISIL Report, the aesthetics products industry is expected to
benefit from the increasing use by consumers of premium, aesthetically superior and technologically advanced products, which
are characterized by relatively higher pricing and higher growth potential. According to the CRISIL Report, use of
technologically advanced and higher value aesthetic products in end industries is contributing to increased realizations for
aesthetic product manufacturers. Examples of this trend include use of IML/IMD components in passenger vehicles interiors,
3D appliques instead of 2D appliques in passenger vehicles and hybrid analogue-digital dials instead of analogue dials in two-
wheelers.
With significant experience in the aesthetics industry and track record of supplying premium products, we believe that we are
well positioned to benefit from these growth trends. We have demonstrated the ability to offer premium products through our
design capabilities. For instance, we successfully diversified our product portfolio with IMLs/IMDs, 3D appliques, lens mask
assemblies and optical plastics in anticipation of, and to benefit from, these trends.
We manufacture our products from modern manufacturing facilities located in Bengaluru and Pune in India, with the facility
in Pune acquired as part of the recent acquisition of our Subsidiary. As at June 30, 2021, the annual production capacity of the
Bengaluru and Pune facilities was 209.70 million and 29.50 million products, respectively. In the three month period ended
June 30, 2021, our Company and our Subsidiary produced 21.27 million and 3.95 million products, respectively, resulting in
capacity utilization rates of 10.14% and 13.38% respectively, and their revenue from operations during the three month period
ended June 30, 2021 were ₹568.07million and ₹174.62 million, respectively. Further, in Fiscal 2021, our Company and our
Subsidiary produced 91.94 million and 15.60 million products, respectively, resulting in capacity utilization rates of 44.07%
and 52.88% respectively, and their revenue from operations during Fiscal 2021 were ₹2,516.16 million and ₹685.26 million,
respectively. We incurred capital expenditure in Fiscals 2018 and 2019 for our Bengaluru facility, with advanced equipment
and technology systems. As a result, we believe that the annual production capacity at our Bengaluru facility can be increased
to 209.70 million products without significant additional capital expenditure.
Our Company has a strong focus on new product development. It has a dedicated NPD team and an in-house styling studio with
design, development, engineering and technological capabilities, which enables us to co-design new products with customers
in the product development process. We also conceptualize new designs at the design studio in our Company’s Bengaluru
facility. Our products are subject to stringent quality checks and testing in laboratories at our facilities. We have an established
supply chain and a well distributed delivery mechanism. Our Company has implemented systems for ERP and our Subsidiary
has implemented automation and centralized control through SCADA system.
We have received various awards and recognitions from our customers, including for excellence in supply, quality,
performance, delivery and price competitiveness, which is a testimony to the value we offer our customers. Our Company has
received awards from ACMA and recognition from the QCFI, an industry body.
K.A. Joseph, our Managing Director and one of our Promoters, has over 34 years of experience in the aesthetics printing
business and has been instrumental in the establishment and growth of our business. Sanjay Thapar, our Chief Executive Officer,
has over 30 years of experience in the automotive industry and has been associated with our Company since 2015. He has led,
and has shaped, our Company’s product strategy and international business expansion in recent years. We have a professional
management team with extensive experience across various industries and a proven track record of performance. As at June 30,
2021, our Company had 509 permanent employees and our Subsidiary had 105 permanent employees. Our Company also
257
received the “Great Workplace” award in the category of “Small and Mid-Sized Organizations” by Great Place to Work
Institute, India in 2020 and 2019. See “History and Certain Corporate Matters—Awards, certifications, accreditations and
recognitions received by our Company” on page 154 for further details.
Despite the initial impact of the COVID-19 pandemic that resulted in a slowdown in the automotive and consumer appliance
industries, our Company was able to grow its overall business and operations in Fiscal 2021, with its revenue from operations
aggregating ₹2,516.16 million, reflecting a year-on-year growth of 16.40%. There has been a second wave of COVID-19 in
India which has had a temporary impact on our business and operations, as well as the business and operations of our customers
and suppliers. It is difficult for us to predict the impact that the second or any subsequent wave of COVID-19 pandemic will
have on us, our customers or suppliers in Fiscal 2022 and future operating periods and we continue to monitor its impact. We,
however, believe that our Company will not experience the same effects on its business, operations and financial performance
as a result of the second or any subsequent wave of COVID-19 compared to those that it did during the first wave of COVID-
19 in the first quarter of Fiscal 2021. The industries that we cater to may also experience comparatively improved business
conditions in Fiscal 2022, according to the CRISIL Report. For further details, see “—Principal Factors affecting our Financial
Condition and Results of Operations—Impact of the COVID-19 Pandemic” on page 255.
See “—Principal Factors affecting our Financial Condition and Results of Operations—Our financial and operational
performance” on page 255 for a summary of our Company’s financial and operational performance.
Exotech Acquisition and Basis of Preparation of the Proforma Condensed Consolidated Financial Information
Our Company acquired our Subsidiary, Exotech on April 5, 2021. Since the Exotech Acquisition was a material acquisition for
our Company, our Proforma Condensed Consolidated Financial Information has been prepared, for illustrative purposes only,
by adjusting the restated financial information prepared for the purposes of inclusion in this Red Herring Prospectus, in order
to illustrate the impact that the Exotech Acquisition would have had on our Company’s results of operations for the year ended
March 31, 2021 and the financial position as at March 31, 2021 of our Company as at March 31, 2021 had the Exotech
Acquisition been completed at an earlier date selected in accordance with the SEBI ICDR Regulations. The Proforma
Condensed Consolidated Financial Information comprise the proforma condensed consolidated balance sheet as at March 31,
2021 and the proforma condensed consolidated statement of profit and loss (including other comprehensive income) for the
year ended March 31, 2021, read with select explanatory notes thereto and have been prepared in accordance with Ind AS, the
Guidance Note and the relevant provisions of the SEBI ICDR Regulations. These were prepared by our management by making
proforma adjustments to:
(a) the restated statement of asset and liabilities of our Company as at March 31, 2021 and the restated statement of profit
and loss (including other comprehensive income) of our Company for the year ended March 31, 2021 (which are forming
part of this Red Herring Prospectus); and
(b) the audited statement of asset and liabilities and statement of profit and loss (including other comprehensive income) of
Exotech as at and for the year ended March 31, 2021.
The adjustments set forth in our Proforma Condensed Consolidated Financial Information are based upon available information
and assumptions that our management believes to be reasonable. Our Proforma Condensed Consolidated Financial Information
should be read in conjunction with the “Basis of Preparation of the Proforma Condensed Consolidated Financial Information”
appearing in “Proforma Condensed Consolidated Financial Information” included on page 291, including for details in
connection with the proforma adjustments.
Our Proforma Condensed Consolidated Financial Information is not a substitute for our past results and may not necessarily be
indicative of what our actual results of operations, financial position and cash flows would have been for such period or as at
such date, nor are they intended to be indicative of expected results or operations in the future periods or our future financial
position. Our Proforma Condensed Consolidated Financial Information does not include all of the information required for
financial statements under Ind AS. It does not include any adjustment for liabilities or related costs that may result from the
Exotech Acquisition, nor do they reflect any adjustments for potential synergies therefrom. Certain liabilities and related costs
may ultimately be recorded for costs associated with the Exotech Acquisition, and there can be no assurance that any synergies
will be achieved. Further, our Proforma Condensed Consolidated Financial Information was not prepared in accordance with
auditing or other standards and practices generally accepted in other jurisdictions or in connection with an offering registered
with the SEC under the U.S. Securities Act, and consequently, does not comply with the presentation of proforma financial
information in accordance with those standards and practices.
Accordingly, the degree of reliance placed by investors on our Proforma Condensed Consolidated Financial Information or the
Restated Consolidated Financial Information should be limited.
Also see “History and Certain Corporate Matters—Material acquisitions or divestments of business or undertakings, mergers,
amalgamations or revaluation of assets in the last 10 years” and “Risk Factors—37. The Proforma Condensed Consolidated
Financial Information included in this Red Herring Prospectus to reflect the impact of the Exotech Acquisition is not indicative
of our future financial condition or financial performance.” on pages 154 and 47, respectively.

258
Non-GAAP Measures
We use certain supplemental non-GAAP measures to review and analyse our financial and operating performance from period
to period, and to evaluate our business. Although these non-GAAP measures are not a measure of performance calculated in
accordance with applicable accounting standards, our management believes that they are useful to an investor in evaluating us
because they are widely used measures to evaluate a company’s operating and financial performance. Presentation of these
non-GAAP financial measures and key performance indicators should not be considered in isolation from, or as a substitute for,
analysis of our historical financial performance, as reported and presented in our Restated Consolidated Financial Information
or the Proforma Condensed Consolidated Financial Information set out in this Red Herring Prospectus.
These non-GAAP financial measures are not defined under Ind AS, are not presented in accordance with Ind AS and have
limitations as analytical tools which indicate, among other things, that they do not reflect our cash expenditures or future
requirements for capital expenditure or contractual commitments; changes in, or cash requirements for, our working capital
needs; and the finance cost, or the cash requirements necessary to service our debt. Although depreciation and amortization are
non-cash charges, the assets being depreciated and amortized will often have to be replaced in the future, and these measures
do not reflect any cash requirements for such replacements. These non-GAAP financial measures may differ from similar titled
information used by other companies, including peer companies, who may calculate such information differently and hence
their comparability with those used by us may be limited. Therefore, these non-GAAP financial measures and key performance
indicators should not be viewed as substitutes for performance or profitability measures under Ind AS or as indicators of our
operating performance, cash flows, liquidity or profitability.
Set out below are definitions of certain key non-GAAP financial measures and key performance indicators such as FCFF, EBIT,
EBITDA, EBITDA Margin, PAT Margin, RoE, RoCE , Net Worth, Capital Employed and RoNW presented in this Red Herring
Prospectus, along with a brief explanation of their calculation. Certain other non-GAAP financial measures such as NAV are
defined in “Definitions and Abbreviations” on page 1.
RoNW and Net Worth
“RoNW” is defined as profit after tax attributable to equity shareholders divided by Net Worth (total equity) for the year. “Net
Worth” is defined as the aggregate of share capital and other equity. The table below reconciles our profit for the quarter/ year
to RoNW, for the periods indicated.
Particulars Three month
period ended June
30, 2021
Fiscal 2021 Fiscal 2020 Fiscal 2019
(₹ million)
Profit for the quarter/ year (A) 94.96 477.65 412.85 376.01
Share Capital 304.38
304.38 304.38 304.38
Other Equity 2,893.23 2,847.78 2,492.12 2,081.19
Net Worth (B) 3,197.61 3,152.16 2,796.50 2,385.57
Return on Net Worth (A/B) (%) - 15.15 14.76 15.76
Weights - 3 2 1
Weighted Average (%) - 15.12 - -
EBIT, EBITDA and EBITDA margin
“EBIT” is defined as earnings before interest and taxes. “EBITDA” is defined as earnings before interest, taxes, depreciation
and amortization. “EBITDA Margin” is defined as our EBITDA during a given period as a percentage of revenue from
operations during that period. “PAT Margin” is calculated by dividing our profit for the quarter/ year by revenue from
operations during that period, and is expressed as a percentage. The table below reconciles our profit for the quarter/ year to
EBIT and EBITDA, for the periods indicated, and sets out our EBITDA Margin and PAT Margin, for the periods indicated.
Particulars Three month
period ended
June 30, 2021
Proforma
Fiscal 2021
Fiscal 2021 Fiscal 2020 Fiscal 2019
(₹ million)
Profit for the quarter/ year (A) 94.96 519.81 477.65 412.85 376.01
Add:
Finance cost 7.17 31.71 7.77 14.90 16.63
Tax expense 32.68 178.15 164.13 130.65 153.59
EBIT (B) 134.81 729.67 649.55 558.40 546.23
Add:
Depreciation and amortization expense 51.05 205.72 147.49 127.69 96.96
EBITDA (C) 185.86 935.39 797.04 686.09 643.19
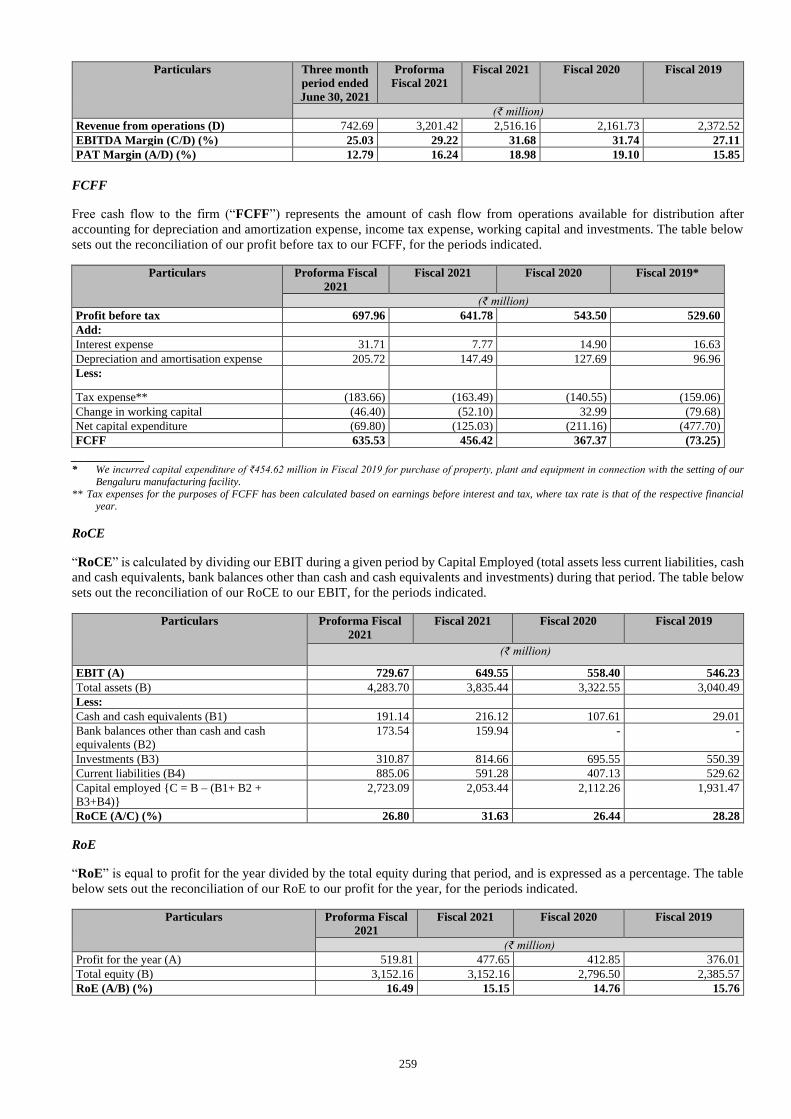
259
Particulars Three month
period ended
June 30, 2021
Proforma
Fiscal 2021
Fiscal 2021 Fiscal 2020 Fiscal 2019
(₹ million)
Revenue from operations (D) 742.69 3,201.42 2,516.16 2,161.73 2,372.52
EBITDA Margin (C/D) (%) 25.03 29.22 31.68 31.74 27.11
PAT Margin (A/D) (%) 12.79 16.24 18.98 19.10 15.85
FCFF
Free cash flow to the firm (“FCFF”) represents the amount of cash flow from operations available for distribution after
accounting for depreciation and amortization expense, income tax expense, working capital and investments. The table below
sets out the reconciliation of our profit before tax to our FCFF, for the periods indicated.
Particulars Proforma Fiscal
2021
Fiscal 2021 Fiscal 2020 Fiscal 2019*
(₹ million)
Profit before tax 697.96 641.78 543.50 529.60
Add:
Interest expense 31.71 7.77 14.90 16.63
Depreciation and amortisation expense 205.72 147.49 127.69 96.96
Less:
Tax expense** (183.66) (163.49) (140.55) (159.06)
Change in working capital (46.40) (52.10) 32.99 (79.68)
Net capital expenditure (69.80) (125.03) (211.16) (477.70)
FCFF 635.53 456.42 367.37 (73.25)
___________ * We incurred capital expenditure of ₹454.62 million in Fiscal 2019 for purchase of property, plant and equipment in connection with the setting of our
Bengaluru manufacturing facility.
** Tax expenses for the purposes of FCFF has been calculated based on earnings before interest and tax, where tax rate is that of the respective financial year.
RoCE
“RoCE” is calculated by dividing our EBIT during a given period by Capital Employed (total assets less current liabilities, cash
and cash equivalents, bank balances other than cash and cash equivalents and investments) during that period. The table below
sets out the reconciliation of our RoCE to our EBIT, for the periods indicated.
Particulars Proforma Fiscal
2021
Fiscal 2021 Fiscal 2020 Fiscal 2019
(₹ million)
EBIT (A) 729.67 649.55 558.40 546.23
Total assets (B) 4,283.70 3,835.44 3,322.55 3,040.49
Less:
Cash and cash equivalents (B1) 191.14 216.12 107.61 29.01
Bank balances other than cash and cash
equivalents (B2)
173.54 159.94 - -
Investments (B3) 310.87 814.66 695.55 550.39
Current liabilities (B4) 885.06 591.28 407.13 529.62
Capital employed {C = B – (B1+ B2 +
B3+B4)}
2,723.09 2,053.44 2,112.26 1,931.47
RoCE (A/C) (%) 26.80 31.63 26.44 28.28
RoE
“RoE” is equal to profit for the year divided by the total equity during that period, and is expressed as a percentage. The table
below sets out the reconciliation of our RoE to our profit for the year, for the periods indicated.
Particulars Proforma Fiscal
2021
Fiscal 2021 Fiscal 2020 Fiscal 2019
(₹ million)
Profit for the year (A) 519.81 477.65 412.85 376.01
Total equity (B) 3,152.16 3,152.16 2,796.50 2,385.57
RoE (A/B) (%) 16.49 15.15 14.76 15.76
260
Principal Factors affecting our Financial Condition and Results of Operations
Our financial condition and results of operations are affected by numerous factors and uncertainties, including those discussed
in the section “Risk Factors” beginning on page 25. The following is a discussion of certain factors that have had, and we expect
will continue to have, a significant effect on our financial condition and results of operations:
The impact of COVID-19
In response to the outbreak of COVID-19, the governments of many countries, including India, have taken preventive or
protective actions, such as prohibiting people from assembling in heavily populated areas, instituting quarantines, issuing
advisories and imposing country or state wide lockdowns, including restrictions on travel and temporary closure of business
operations, restricting the types of businesses that may continue to operate, ‘stay-at-home’ orders, and enforcing increased
remote working protocols. The resultant disruptions to the supply chain, consumer spending and industrial production in India
and the affected countries has precipitated an economic slowdown in those economies which, if prolonged, could cause a global
recession. Supply of raw materials from our domestic and international suppliers were also briefly impacted. Such disruptions
in operations impacted our Company’s and our Subsidiary’s business performance. The ongoing impact of the COVID-19
pandemic and resulting government actions on our business and operations, includes, but is not limited to implementation of
staggered or altered work shifts and other social distancing efforts at our manufacturing facilities and labour shortages, which
could result in decreased productivity and a slowdown in our operations. Other effects include extension on credit terms offered
to certain customers and the inability to collect full or partial payments from customers due to deterioration in customer liquidity.
There have been instances of resurgence of the COVID-19 pandemic around the world, which has brought about fresh
lockdowns and caused further disruptions to economies. Since April 2021, there was a substantial increase in the number of
COVID-19 cases in India, leading to reintroduction of movement restrictions to limit the spread and impact of the COVID-19
pandemic by the governments in various states of India, including those by the states of Karnataka and Maharashtra where we
operate. As a result, our business and operations, as well as the business of our customers and suppliers, were temporarily
affected for a few days during this period. This may also affect the underlying assumptions and estimates with respect to demand
for our products and services in the future or our ability to meet demands of our customers and may increase our costs of
production. It is difficult for us to predict the impact that the second or any subsequent wave of COVID-19 pandemic will have
on us, our customers or suppliers in Fiscal 2022 and future operating periods and we continue to monitor its impact. We,
however, believe that we will not experience the same effects on our business, operations and financial performance as a result
of the second or any subsequent wave of COVID-19 compared to those that it did during the first wave of COVID-19 in first
quarter of Fiscal 2021 and the industries that we cater to may also experience comparatively improved business conditions in
Fiscal 2022.
General economic conditions
Our performance and growth will depend to a large extent on the health of the economies in which we operate. While our
Company is incorporated in India, our products are sold in, among other regions, India, the rest of Asia, the United States,
Europe, Africa, the Middle East and Latin America. We are therefore dependent on domestic, regional and global economic
and market conditions. Our business, results of operation and financial condition could be influenced by factors such as inflation,
access to capital and borrowing costs, trade policies in terms of tariff and non-tariff barriers, India’s trade deficit, fluctuations
in global commodity and crude oil prices, fluctuations in India’s foreign exchange reserves or currency exchange rates, among
others.
Progress of vaccination in some countries, and better-than-expected data on economic recovery from various parts of the world
have resulted in the International Monetary Fund (“IMF”) raising its estimates of world economic growth. IMF’s global
economic growth estimate for calendar year 2021 is at 5.50% and for 2022, at 4.20%. With recovery in demand, oil prices are
expected to rise in 2021. Non-oil commodity prices are also expected to increase, with those of metals projected to show strong
appreciation in 2021. Nevertheless, even with anticipated recovery, IMF does not expect output gaps to close until after 2022.
Consistent with negative output gaps, it also forecasts subdued inflation during 2021 and 2022 in both, advanced and emerging
economies in comparison with their historical averages. In 2021, trade growth is expected to rebound over 8.00 % due to the
low base effect, and then moderate to approximately 6.30% in 2022. IMF expects growth in 2021 to be higher for emerging
and developing markets. (Source: CRISIL Report.)
According to the CRISIL Report, India’s GDP growth will rebound to 9.50% in Fiscal 2022 over a low base of Fiscal 2021
supported by government’s vaccination drive, focus on infrastructure spends, global economic recovery and rising consumer
confidence. CRISIL also expects India’s GDP to grow at an average of 6.60% between Fiscal 2023 and Fiscal 2026.
Performance of the automotive and consumer appliance industries
Sales to two-wheeler OEMs and Tier-1 suppliers contributed 49.49%, 58.01%, 61.29% and 69.99%, while sales to passenger
vehicle OEMs and Tier-1 suppliers contributed 21.46%, 16.63%, 14.73% and 10.22%, to our revenue from operations in the
three month period ended June 30, 2021 and Fiscals 2021, 2020 and 2019, respectively. During those periods, sales to consumer
appliance manufacturers contributed 28.97%, 25.00%, 23.61% and 19.64% to our revenue from operations, respectively. As a

261
result, we are affected by the general macro-economic conditions, trends and conditions in the automotive and consumer
appliance industries, which tend to be affected directly by changes in general economic conditions and other factors. Some of
the general macro-economic factors impacting these industries and which can affect demand for our products and as a result
for our business include widespread or prolonged changes in consumer confidence, employment levels, exchange rates, interest
rates, inflation rates, fuel prices, financing options, labour relations issues, technological developments, regulatory requirements
and trade agreements.
Any disruption that changes the way these industries operate could affect our customers if they are unable to anticipate and act
upon these changes. For example, heightened uncertainty and higher unemployment rates on account of the COVID-19
pandemic have driven lower household disposable incomes. These factors and a rise in inflation may result in a reduced
consumer demand for passenger automobiles, consumer appliances and other related products that our customers manufacture
or assemble, which may adversely affect their production plans. According to the CRISIL Report, the market for two-wheelers,
four-wheelers and consumer appliances experienced decreased production volume in India by around 13.00%, 10.00% and
19.00%, respectively, in Fiscal 2021.
According to the CRISIL Report, in Fiscal 2022, a gradual improvement in consumer confidence amid expectations of a faster
economic growth will revive vehicle sales. In addition to this, consumer preference for own vehicle for personal mobility
supported by lower financing costs and new model launches is likely to support underlying demand for passenger vehicles.
Indian two-wheeler and passenger vehicle production is expected to grow at a CAGR of 10.00% to 12.00% between Fiscal
2022 and Fiscal 2026. Indian sales of two-wheeler and passenger vehicles are estimated to grow at a CAGR of 11.00% to 13.00%
and 10.00% to 11.00%, respectively, during this period. Exports of two-wheeler and passenger vehicles are estimated to grow
at a CAGR of 9.00% to 10.00% and 11.00% to 13.00%, respectively, during this period. According to the CRISIL Report, the
market size of the consumer appliances industry is expected to grow at a CAGR of 12% to 14% during the period between
Fiscal 2021 and Fiscal 2026, on a lower base of Fiscal 2021.
In the three month period ended June 30, 2021 and in Fiscals 2021, 2020 and 2019, 17.55%, 16.05%, 14.89% and 9.82%,
respectively, of our revenue from operations were derived from sales to customers outside India (i.e., rest of the world). Our
export sales are dependent upon the policies of the governments of the importing countries and any changes to the policies of
these countries relating to the exports from India, or the quality, characteristics and variety of the products exported by us to
such countries could impact our revenues from exports. Our business could also be impacted by any regulatory development or
change in the GoI’s policies on export including export duties and other forms of export restrictions.
Recent trends in the aesthetics industry
Our results of operations are significantly influenced by the trends in the aesthetics industry globally and in India and we expect
that the market opportunity will drive the growth of our business in future periods. We believe that with our experience in the
aesthetics industry and track record of supplying premium products, we are well positioned to take advantage of certain
favourable trends.
The Indian aesthetics products industry generated ₹19.90 billion in revenue in Fiscal 2021, according to the CRISIL Report.
According to that report, as the Indian market is currently under penetrated with respect to aesthetic content in the products in
comparison to global counterparts across automobiles and consumer durables, the growth of the Indian decorative aesthetics
market in value terms is expected to surpass volume growth in demand for two-wheeler, passenger vehicle and consumer
durables over the Fiscal 2021 to Fiscal 2026 period. Accordingly, while demand in India from two-wheelers, passenger vehicles
and consumer durables is expected to grow at a CAGR of 10.00% to 12.00% each in volume terms over the Fiscal 2021 to
Fiscal 2026 period, the demand for aesthetics is expected to grow faster, i.e., at a CAGR of approximately 20.00% over the
same period to reach approximately ₹49.20 billion by Fiscal 2026 and we expect the global aesthetics industry to follow a
similar trend. The size of decorative aesthetics market for passenger vehicles in countries such as the U.S., the European Union
and the U.K, which represented 32.00% of global passenger vehicle sales in 2019, was estimated to be U.S.$2.70 billion during
that period.
The demand for aesthetic products is expected to recover and grow by approximately 17.00% in Fiscal 2022, as the demand
and production of two-wheelers, passenger vehicles and consumer durables recover from the impact of the COVID-19 pandemic.
Two-wheelers and passenger vehicles will continue to dominate the demand accounting for approximately 45.00% to 47.00%
of the decorative aesthetic market each in Fiscal 2026 whereas consumer durables will contribute approximately 8.00% to 9.00%
to the overall demand. Demand for decorative aesthetics is expected to grow fastest in passenger vehicles at a CAGR of
approximately 25.00%, followed by a CAGR of 19.00% and 16.00% in consumer durables and two-wheelers, respectively.
According to the CRISIL Report, consumers increasingly prefer premium, aesthetically superior and technologically advanced
products for two-wheelers, passenger vehicles and consumer durables, driven by rising disposable income and exposure to
developed markets. Accordingly, manufacturers of automobiles and consumer durables are focusing on improving the overall
aesthetics of their products. This has also led to a growing trend towards the use of superior aesthetics products such as optical
plastics and chrome plated parts. Advances in technology is resulting in use of newer and higher value aesthetic products in
end industries and consequently increased realizations for aesthetic product manufacturers. According to the CRISIL Report,
some of the emerging industry trends include, among others, the use of visually and aesthetically superior 3D appliques instead
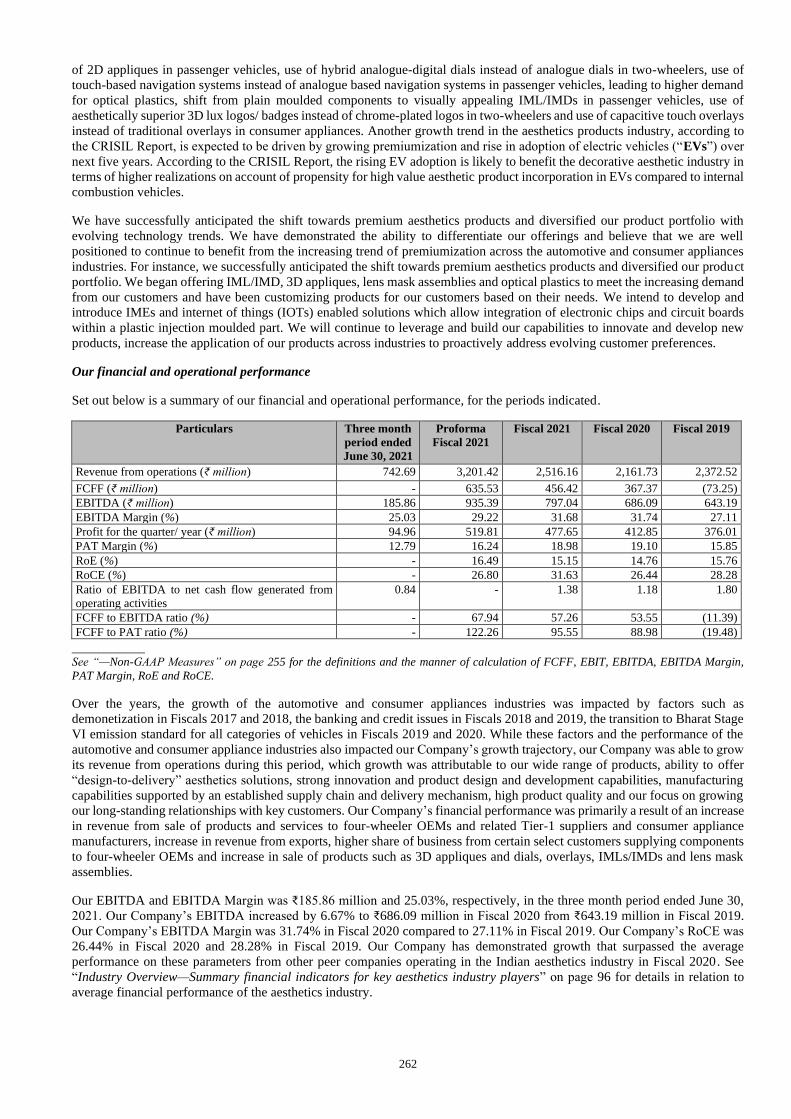
262
of 2D appliques in passenger vehicles, use of hybrid analogue-digital dials instead of analogue dials in two-wheelers, use of
touch-based navigation systems instead of analogue based navigation systems in passenger vehicles, leading to higher demand
for optical plastics, shift from plain moulded components to visually appealing IML/IMDs in passenger vehicles, use of
aesthetically superior 3D lux logos/ badges instead of chrome-plated logos in two-wheelers and use of capacitive touch overlays
instead of traditional overlays in consumer appliances. Another growth trend in the aesthetics products industry, according to
the CRISIL Report, is expected to be driven by growing premiumization and rise in adoption of electric vehicles (“EVs”) over
next five years. According to the CRISIL Report, the rising EV adoption is likely to benefit the decorative aesthetic industry in
terms of higher realizations on account of propensity for high value aesthetic product incorporation in EVs compared to internal
combustion vehicles.
We have successfully anticipated the shift towards premium aesthetics products and diversified our product portfolio with
evolving technology trends. We have demonstrated the ability to differentiate our offerings and believe that we are well
positioned to continue to benefit from the increasing trend of premiumization across the automotive and consumer appliances
industries. For instance, we successfully anticipated the shift towards premium aesthetics products and diversified our product
portfolio. We began offering IML/IMD, 3D appliques, lens mask assemblies and optical plastics to meet the increasing demand
from our customers and have been customizing products for our customers based on their needs. We intend to develop and
introduce IMEs and internet of things (IOTs) enabled solutions which allow integration of electronic chips and circuit boards
within a plastic injection moulded part. We will continue to leverage and build our capabilities to innovate and develop new
products, increase the application of our products across industries to proactively address evolving customer preferences.
Our financial and operational performance
Set out below is a summary of our financial and operational performance, for the periods indicated.
Particulars Three month
period ended
June 30, 2021
Proforma
Fiscal 2021
Fiscal 2021 Fiscal 2020 Fiscal 2019
Revenue from operations (₹ million) 742.69 3,201.42 2,516.16 2,161.73 2,372.52
FCFF (₹ million) - 635.53 456.42 367.37 (73.25)
EBITDA (₹ million) 185.86 935.39 797.04 686.09 643.19
EBITDA Margin (%) 25.03 29.22 31.68 31.74 27.11
Profit for the quarter/ year (₹ million) 94.96 519.81 477.65 412.85 376.01
PAT Margin (%) 12.79 16.24 18.98 19.10 15.85
RoE (%) - 16.49 15.15 14.76 15.76
RoCE (%) - 26.80 31.63 26.44 28.28
Ratio of EBITDA to net cash flow generated from
operating activities
0.84 - 1.38 1.18 1.80
FCFF to EBITDA ratio (%) - 67.94 57.26 53.55 (11.39)
FCFF to PAT ratio (%) - 122.26 95.55 88.98 (19.48)
___________ See “—Non-GAAP Measures” on page 255 for the definitions and the manner of calculation of FCFF, EBIT, EBITDA, EBITDA Margin,
PAT Margin, RoE and RoCE.
Over the years, the growth of the automotive and consumer appliances industries was impacted by factors such as
demonetization in Fiscals 2017 and 2018, the banking and credit issues in Fiscals 2018 and 2019, the transition to Bharat Stage
VI emission standard for all categories of vehicles in Fiscals 2019 and 2020. While these factors and the performance of the
automotive and consumer appliance industries also impacted our Company’s growth trajectory, our Company was able to grow
its revenue from operations during this period, which growth was attributable to our wide range of products, ability to offer
“design-to-delivery” aesthetics solutions, strong innovation and product design and development capabilities, manufacturing
capabilities supported by an established supply chain and delivery mechanism, high product quality and our focus on growing
our long-standing relationships with key customers. Our Company’s financial performance was primarily a result of an increase
in revenue from sale of products and services to four-wheeler OEMs and related Tier-1 suppliers and consumer appliance
manufacturers, increase in revenue from exports, higher share of business from certain select customers supplying components
to four-wheeler OEMs and increase in sale of products such as 3D appliques and dials, overlays, IMLs/IMDs and lens mask
assemblies.
Our EBITDA and EBITDA Margin was ₹185.86 million and 25.03%, respectively, in the three month period ended June 30,
2021. Our Company’s EBITDA increased by 6.67% to ₹686.09 million in Fiscal 2020 from ₹643.19 million in Fiscal 2019.
Our Company’s EBITDA Margin was 31.74% in Fiscal 2020 compared to 27.11% in Fiscal 2019. Our Company’s RoCE was
26.44% in Fiscal 2020 and 28.28% in Fiscal 2019. Our Company has demonstrated growth that surpassed the average
performance on these parameters from other peer companies operating in the Indian aesthetics industry in Fiscal 2020. See
“Industry Overview—Summary financial indicators for key aesthetics industry players” on page 96 for details in relation to
average financial performance of the aesthetics industry.

263
According to the CRISIL Report, the domestic production for two-wheelers, passenger vehicles and large consumer durables
declined by approximately 13.00%, 10.00% and 19.00%, respectively, in Fiscal 2021 due to the impact of the COVID-19
pandemic. Despite the resultant slowdown in these industries and the temporary effects of COVID-19 on its operations, our
Company was able to grow its overall business and operations, with a growth of 16.40% in its revenue from operations to
₹2,516.16 million in Fiscal 2021 from ₹2,161.73 million in Fiscal 2020, a 16.17% growth in EBITDA to ₹797.04 million in
Fiscal 2021 from ₹689.09 million in Fiscal 2020 and a 15.70% growth in profit for the year to ₹477.65 million in Fiscal 2021
from ₹412.85 million in Fiscal 2020. Our Company’s EBITDA Margin increased marginally to 31.68% in Fiscal 2021 from
31.74% in Fiscal 2020, which was primarily due to a combination of operating efficiency improvements, alternative and cheaper
sourcing arrangements and value-added engineering.
As at June 30, 2021, we had a strong balance sheet with total equity of ₹3,197.61 million and low leverage levels, with
borrowings (current and non-current) of ₹86.38 million, which only comprised working capital facilities. As at June 30, 2021,
the aggregate of our cash and cash equivalents of ₹181.40 million, bank balance other than cash and cash equivalents of ₹176.85
million and investments in mutual funds of ₹408.93 million was ₹767.18 million. Our cash flows from operating activities were
₹220.52 million, ₹579.38 million, ₹582.67 million and ₹358.27 million in the three month period ended June 30, 2021 and in
Fiscals 2021, 2020 and 2019, respectively.
Relationship with, and purchasing pattern of, our significant customers
As at June 30, 2021, our Company sold products to around 175 customers in approximately 90 cities across 20 countries,
including those with end-use in India, North America, Italy, Russia, Japan, Thailand, South Africa and Poland. As at June 30,
2021, our Subsidiary sold products to more than 72 customers in India including those with end-use in automobile, agricultural
machinery and sanitary ware industries. Sales to our top five customers (based on revenue in three month period ended June
30, 2021) represented 63.91% of our revenue from operations in that period. Sales to our Company’s top five customers (based
on revenue in Fiscal 2021) represented 62.66%, 59.73% and 65.90% of its revenue from operations in Fiscals 2021, 2020 and
2019, respectively, and sales to our Company’s top 10 customers (based on revenue in Fiscal 2021) represented 87.33%, 86.40%
and 85.66% of its revenue from operations in Fiscals 2021, 2020 and 2019, respectively. Out of customers accounting for more
than 10% of the revenue from operations in Fiscal 2021, sales to our Company’s top customer accounted for 21.49%, 23.99%
and 33.59% of its revenue from operations in Fiscals 2021, 2020 and 2019, respectively.
Since we are dependent on certain key customers for a significant portion of our sales, the loss of any of such customers or a
reduction in demand from such customers, and the customer accounting for more than 10% in particular, for any reason,
including due to loss of contracts, delay in fulfilling existing orders, failure to negotiate acceptable terms in negotiations,
disputes or a loss of market share or a downturn in such customers’ business, if not suitably replaced with another customer,
could adversely affect our business and results of operations. The volume and timing of sales to our customers may vary due to
variation in demand for our customers’ products, their attempts to manage their inventory, design changes, changes in their
product mix, manufacturing and growth strategy. Our revenues and profitability may also be adversely affected if there’s a
reduction in our customers’ production volumes or if there is a significant reduction in the volume of our business with such
customers, or if our customers prefer our competitors over us, and we may not remain the exclusive aesthetics products and
solutions provider for certain of our customers.
We do not have firm commitment or long-term supply agreements with our customers, and instead rely on letters of intent,
purchase orders, statements of work and customer schedules to govern the volume, price and other terms of the development
program and sales, which may be amended or cancelled prior to finalization. Any failure to meet our customers’ expectations
could result in the cancellation of orders. Our customers may terminate their arrangements with us for cause or otherwise for,
among others, our non-compliance with contractual obligations such as standards for product quality and quantity as well as
delivery schedules, and in certain cases have no liability to pay for or reimburse lost profits, unabsorbed overheads, capital
investments made by us, product development and engineering costs, facilities and equipment rental and other related costs
such as penalties or administrative charges incurred directly or indirectly by us in connection with cancelled orders. In addition,
we do not have exclusive contracts with any of our large customers, which entitles them to replace us with another supplier
under certain circumstances.
As at June 30, 2021, our Company’s relationship with its 10 largest customers in terms of revenue has averaged approximately
15 years. Our long-standing relationships are largely attributable to our collaborative design and product development approach.
We also credit our customer loyalty to our ability to offer “design-to-delivery” aesthetics solutions. Our Company’s robust
account management processes has resulted in an increase in the number of customers with whom it had over ₹100.00 million
in yearly annual sales from five in Fiscal 2016 to eight in the three month period ended June 30, 2021, as a result deepening
their relationship with our Company and us becoming an integral part of their supply chain.
We aim to be a market-leader in our product categories and pursue cross-selling opportunities to expand to other product lines
and geographic areas. Due to the nature of their products, passenger vehicles and consumer appliances offer more opportunities
for integration of aesthetic products such as IML/IMD interior components, instrument clusters, optical plastics for touch based
navigation systems, chrome-plated parts and accessories and capacitive touch overlays. In addition to the automotive, consumer
durables/appliances, medical devices, farm equipment and sanitary ware industries, which we currently focus on, we also intend
to pursue opportunities in other industries such as outdoor equipment and FMCG.
264
Our recent acquisition and inorganic growth plans
Our Company completed the Exotech Acquisition on April 5, 2021, which has enhanced our product portfolio, increased our
manufacturing capabilities and increased our customer base. As a result, our Restated Consolidated Financial Information as at
and for the three month period ended June 30, 2021 (which includes the financial performance and financial condition of
Exotech) may not be comparable to our Restated Consolidated Financial Information for prior periods.
According to the CRISIL Report, while chrome-plated parts constituted the second largest product segment within the overall
aesthetics market in India in Fiscal 2021, it is expected to be the largest product segment within the overall aesthetics market
in India in Fiscal 2026. In addition, the trend of increasing chrome-plated part intensity in a vehicle is likely to continue. As a
result, demand for chrome-plated parts from OEMs is likely to grow rapidly in future. According to the CRISIL Report, the
demand for chrome-plated parts comprised 23.00% to 25.00% of the total demand in India for decorative aesthetics in Fiscal
2021, which is expected to increase to 26.00% to 28.00% of the total demand in India for decorative aesthetics by Fiscal 2026.
We expect to leverage our existing capabilities, product offerings and customer base to capitalize on this market opportunity.
We have started offering products that use chrome-plated, printed and painted injection moulded plastic parts, such as wheel
covers, radiator grills and door handles, following the acquisition of our Subsidiary. We expect that the combination of
decorative printing and injection moulding with plastic chrome-plating capabilities will help us provide diversified aesthetic
products to customers. The acquisition has also helped reduce the risk of product substitution for us. For example, we would
be able to attract and retain customers that may consider switching 3D lux badges with chrome-plated plastic parts.
Exotech’s customers include leading passenger vehicles automotive OEMs and Tier-1 suppliers and customers in the two-
wheelers, passenger vehicles, consumer durables/appliances, farm equipment and sanitary ware industries. This provides us the
opportunity to cross-sell our Company’s existing products as well as our Subsidiary’s products across a diversified customer
base.
Although we intend to continue to grow organically, we believe that inorganic growth opportunities may act as an enabler for
growing our businesses. We intend to continue to evaluate, and selectively pursue, inorganic opportunities where products,
resources, capabilities, operations and strategies are complementary and that will diversify our product portfolio, provide us
access to a wider customer base, help us expand into new markets and geographies and consolidate our existing capabilities.
These opportunities could be by way of strategic alliances, acquisitions, joint ventures, technological collaborations, partner
tie-ups and other strategic and business combinations.
Cost of raw materials and employee benefits expense
We use a variety of raw materials to manufacture our aesthetic products. The principal raw materials and components we use
include plastics, copper, nickel, aluminium, paints, inks, chemicals, adhesives, plastic polymers such as PVC, metallized
polyester, PET, PC in the form of films, sheets and resins. Our Company’s total cost of raw materials consumed constituted
36.70% of our Company’s revenue from operations in the three month period ended June 30, 2021, and 46.99% of our
Company’s total expenses in that period. Our total cost of raw materials consumed constituted 39.36%, 39.07% and 39.96% of
our revenue from operations in the Fiscals 2021, 2020 and 2019, respectively, and 51.85%, 50.60% and 52.53%, respectively,
of our total expenses in those periods. Our Subsidiary’s total cost of raw materials, including changes in inventories of finished
goods and work-in-progress, accounted for 57.04% and 54.56% of the revenue from operations in the three month period ended
June 30, 2021 and the Fiscal 2021, respectively. Purchases from our Company’s top 10 suppliers constituted 58.76%, 62.48%,
64.26% and 78.53% of the total cost of raw materials in the three month period ended June 30, 2021 and Fiscals 2021, 2020
and 2019, respectively. In the three month period ended June 30, 2021, approximately 37.70% of the raw materials that our
Company sources are imported from vendors outside India whereas the remaining 62.30% of raw materials and components
are procured from Indian vendors. Further, in Fiscal 2021, approximately 33.74% of the raw materials that our Company sources
are imported from vendors outside India whereas the remaining 66.26% of raw materials and components are procured from
Indian vendors. Our Subsidiary purchases raw materials from India.
Volatility in commodity prices can affect our raw material costs. Further, volatility in fuel prices can also affect commodity
prices worldwide which may increase our raw material costs. We do not currently have long term contracts or exclusive supply
arrangements with any of our suppliers and we purchase the raw materials on spot order basis. Any significant disruptions in
the sourcing and/or supply of our raw materials could affect the availability of key materials at reasonable prices.
Employee benefit expenses constituted 16.15%, 14.33%, 15.22% and 13.35% of our revenue from operations in the three month
period ended June 30, 2021 and Fiscals 2021, 2020 and 2019, respectively. Our work force is a critical factor in maintaining
quality and safety, which strengthen our competitive position. Our employee benefits expenses generally comprise (i) salaries,
wages and bonus paid to our employees; (ii) contribution to provident fund; and (iii) employee welfare expenses. Since our
workforce requirements are ultimately dependent upon our production volumes, the use of temporary workers allows us the
flexibility to expand or reduce our workforce depending upon business volume. We employ a significant number of employees
based on short-term contracts to maintain operational flexibility.
Capacity utilization
265
Capacity utilization is affected by the demand and supply balance, which in turn affects our profit margin. High capacity
utilization allows us to optimize costs, resulting in a high profit margin. Our actual production levels and utilization rates may
differ from the estimated manufacturing capacities of our facilities. We manufacture our products from manufacturing facilities
located in Bengaluru and Pune in India, with the facility in Pune acquired as part of the recent acquisition of our Subsidiary. As
at June 30, 2021, the annual production capacity of the Bengaluru and Pune manufacturing facilities was 209.70 million and
29.50 million products, respectively. During the three month period ended June 30, 2021, our Company and our Subsidiary
produced 21.27 million and 3.95 million products, respectively, resulting in capacity utilization rates of 10.14% and 13.38%
respectively, and their revenue from operations during the three month period ended June 30, 2021 were ₹568.07 million and
₹174.62 million, respectively. Further, in Fiscal 2021, our Company and our Subsidiary produced 93.50 million and 13.50
million products, respectively, resulting in capacity utilization rates of 44.07% and 52.88%, respectively, and their revenue
from operations during Fiscal 2021 were ₹2,516.16 million and ₹685.26 million, respectively. We incurred capital expenditure
in Fiscals 2018 and 2019 for our Bengaluru manufacturing facility, with advanced equipment and technology systems.
Cyclical and seasonal variations
Our sales are also affected by inventory levels and production levels of automotive and consumer appliance manufacturers. We
cannot predict when manufacturers will decide to either build or reduce inventory levels or whether new inventory levels will
approximate historical inventory levels. This may result in variability in demand for our products and, as a result, our sales and
profitability. The automobile industry is also subject to seasonal characteristics. Generally, demand for our products increases
during the automotive industry’s festive selling season from September until January. Demand for our products generally
decreases during the months of May to August each year due to the impact of scheduled customer plant shutdowns and inventory
rationalization at OEMs for vacations and changeovers in production lines for new models in December.
Basis of preparation of Restated Consolidated Financial Information
Our Restated Consolidated Financial Information has been compiled from the audited consolidated financial statements of our
Company as at and for the the three month period ended June 30, 2021 and as at and for the financial years ended March 31,
2021, March 31, 2020, and March 31, 2019. The Restated Consolidated Financial Information does not reflect the effects of
events that occurred subsequent to the respective dates of board meeting on the audited financial statements mentioned above.
Basis of Consolidation
Our Company consolidates all entities which are controlled by it. Our Company establishes control when it has power over the
entity, is exposed, or has rights, to variable returns from its involvement with the entity and has the ability to affect the entity’s
returns by using its power over relevant activities of the entity. Entities controlled by our Company are consolidated from the
date control commences until the date control ceases. All inter-company transactions, balances and income and expenses are
eliminated in full on consolidation.
Our Company combines the financial statements of the parent and its subsidiaries line by line adding together like items of
assets, liabilities, equity, income and expenses. Inter-company transactions, balances and unrealised gains on transactions
between group companies are eliminated. Unrealised losses are also eliminated unless the transaction provides evidence of an
impairment of the transferred asset. Accounting policies of subsidiaries have been changed where necessary to ensure
consistency with the policies adopted by our Company.
If our Company loses control over a subsidiary, it derecognises the related assets (including goodwill), liabilities, non-
controlling interest and other components of equity, while any resultant gain or loss is recognised in statement of profit and
loss. Any investment retained is recognised at fair value. The subsidiary company which is included in the consolidation and
our Company’s holdings therein is as under:
S. No. Name of Entity (Nature of Business) Country of
Incorporation
Company’s Effective
Shareholding (%)
1 Exotech Plastics Private Limited (Manufacturing of automobile
components)
India 100%
Transition from Indian GAAP to Ind AS
Our Company transitioned to the Ind AS with a transition date of April 1, 2019. Our Company’s financial statements as at and
for the financial year ended March 31, 2021 are the first that we have prepared in accordance with Ind AS. The restated
consolidated financial statements as at and for the three month period ended June 30, 2021 and as at and for the financial years
ended March 31, 2021 and March 31, 2020 have been compiled by our management from the audited financial statements of
our Company as at and for the three month period ended June 30, 2021 and as at and for the financial year ended March 31,
2021 which include the comparative Ind AS financial statements as at and for the year ended March 31, 2020 prepared in
accordance with Ind AS. The proforma restated financial statements as at and for the year ended March 31, 2019 have been
compiled by our management from the audited financial statements of our Company as at and for the year ended March 31,
266
2019 prepared in accordance with the Indian GAAP and have been prepared by making Ind AS adjustments in accordance with
the provisions of SEBI Circular SEBI/HO/CFD/DIL/CIR/P/2016/47 dated March 31, 2016 and the Guidance Note.
For the purposes of transition from the Indian GAAP to Ind AS, our Company has followed the guidance prescribed in Ind AS
101 – First Time adoption of Indian Accounting Standards (“Ind AS 101”), with effect from April 1, 2019 and for the purpose
of proforma restated financial statements as at and for the year ended March 31, 2019, our Company has followed the same
accounting policy and accounting policy choices (both mandatory exceptions and optional exemptions availed as per Ind AS
101) as were initially adopted on the transition date, i.e., April 1, 2019.
For preparing its Ind AS balance sheet as at April 1, 2019 and in presenting the comparative information for the year ended
March 31, 2020, our Company has adjusted amounts reported previously in financial statements prepared in accordance with
the Indian GAAP. Note 44 included in Annexure VII to the Restated Consolidated Financial Information explains the principal
adjustments made by our Company in restating its financial statements prepared in accordance with Indian GAAP, and effect
of transition from the Indian GAAP to Ind AS on Company’s financial position and financial performance and cash flows. In
preparing the Ind AS financial statements, our Company has certain optional exemptions and mandatory exceptions. See Note
44 included in Annexure VII to the Restated Consolidated Financial Information for further details in connection with
reconciliation of balance sheet, statement of profit and loss and statement of cash flows between Indian GAAP and Ind AS.
Restatement Adjustments
The Restated Consolidated Financial Information has been prepared so as to contain information/disclosures and incorporating
adjustments set out below in accordance with the SEBI ICDR Regulations:
(a) adjustments for audit qualification requiring corrective adjustment in the financial statements, if any;
(b) adjustments for the material amounts in respective years to which they relate, if any;
(c) adjustments for previous years identified and adjusted in arriving at the profits or losses of the years to which they relate
irrespective of the year in which the event triggering the profit or loss occurred, if any;
(d) adjustments to the profits or losses of the earlier years and of the year in which the change in the accounting policy has
taken place is recomputed to reflect what the profits or losses of those years would have been if a uniform accounting
policy was followed in each of these years, if any;
(e) adjustments for reclassification of the corresponding items of income, expenses, assets and liabilities, in order to bring
them in line with the groupings as per the audited financial statements of the Company for the year ended March 31,
2019 (proforma) and the requirements of the SEBI ICDR Regulations, if any; and
(f) the resultant tax impact due to the aforesaid adjustments, if any.
Annexure VI to the Restated Consolidated Financial Information explains the principal adjustments made by us to our audited
financial statements for preparation of the Restated Consolidated Financial Information.
Critical accounting estimates, assumptions and judgments
The preparation of Restated Consolidated Financial Information in conformity with Ind AS requires management to make
judgments, estimates and assumptions that affect the application of accounting policies and the reported amounts of assets,
liabilities, income and expenses and disclosure of contingent liabilities at the end of the reporting period and reported amount
of income and expenses for end of the reporting period. Actual results may differ from these estimates.
The estimates and underlying assumptions are reviewed on an ongoing basis. They are based on historical experience and other
factors that are believed to be reasonable under the circumstance. Revisions to accounting estimates are recognised in the year
in which the estimates are revised, and future periods are affected.
Assumptions, Judgments, and estimation
Information about assumptions and estimation uncertainties that have a significant risk of resulting in a material adjustment in
the amounts recognised in the Restated Consolidated Financial Information is included in the following notes:
• Notes 2(c) and 2(d) – Useful life of property, plant and equipment and intangible assets;
• Note 2(g) – Impairment test of financials assets;
• Note 2(k) – Measurement of defined benefit obligations: key actuarial assumptions;
• Note 2(m) – Lease classification;
• Note 2(o) – Recognition and measurement of provisions and contingencies: key assumptions about the likelihood and
magnitude of an outflow of resources.
267
Current and non-current classification
We present assets and liabilities in the balance sheet based on current and non-current classification.
An asset is treated as current when it is:
• expected to be realized or intended to be sold or consumed in normal operating cycle;
• held primarily for the purpose of trading;
• expected to be realized within 12 months after the reporting period; or
• cash or cash equivalent unless restricted from being exchanged or used to settle a liability for at least 12 months after the
reporting period.
All other assets are classified as non-current.
A liability is treated as current when:
• it is expected to be settled in normal operating cycle;
• it is held primarily for the purpose of trading;
• it is due to be settled within 12 months after the reporting period; or
• there is no unconditional right to defer the settlement of the liability for at least 12 months after the reporting period.
All other liabilities are classified as non-current.
Deferred tax assets and liabilities are classified as non-current assets and non-current liabilities.
The operating cycle is the time between the acquisition of assets for processing and their realization in cash and cash equivalents.
We have identified 12 months as our operating cycle.
Fair value measurement
Certain of our accounting policies and disclosures require the measurement of fair values, for both financial and non-financial
assets and liabilities.
We have an established control framework with respect to the measurement of fair values. The valuation team regularly reviews
significant unobservable inputs and valuation adjustments.
Fair values are categorized into different levels in a fair value hierarchy based on the inputs used in the valuation techniques as
follows:
- Level 1: quoted prices (unadjusted) in active markets for identical assets or liabilities.
- Level 2: inputs other than quoted prices included in Level 1 that are observable for the asset or liability, either directly (i.e.
as prices) or indirectly (i.e. derived from prices).
- Level 3: inputs for the asset or liability that are not based on observable market data (unobservable inputs).
When measuring the fair value of an asset or a liability, we use observable market data as far as possible. If the inputs used to
measure the fair value of an asset or a liability fall into different levels of the fair value hierarchy, then the fair value
measurement is categorized in its entirety in the same level of the fair value hierarchy as the lowest level input that is significant
to the entire measurement.
We recognize transfers between levels of the fair value hierarchy at the end of the reporting period during which the change
has occurred.
Summary of Significant Accounting Policies
The significant accounting policies have been set forth below and are consistently applied by us in preparation of the Restated
Consolidated Financial Information. Unless otherwise stated, these policies are consistent with those adopted in the preparation
of financial statements for the three month period ended June 30, 2021.
Revenue Recognition
Sale of products
268
Revenue is recognized upon transfer of control of promised goods or services to customer in an amount that reflects the
consideration we expect to receive in exchange for those goods or services. We recognize revenue to depict the transfer of
promised goods or services to customers in an amount that reflects the consideration to which the entity expects to be entitled
in exchange for those goods or services.
Revenue is measured at fair value of the consideration received or receivable, after deduction of any trade discounts, volume
rebates and any taxes or duties collected on behalf of the government which are levied on sales such as goods and services tax,
etc. For certain contracts that permits the customer to return an item, revenue is recognized to the extent that it is probable that
a significant reversal in the amount of cumulative revenue recognized will not occur and is reassessed at the end of each
reporting period. Revenue from sale of products is recognized at the point in time when control is transferred to customer. Costs
that relate directly to a contract and incurred in securing a contract are recognized as an asset and amortized over the contract
term as reduction in revenue.
Further, revenue from sale of products is recognized based on a five-step methodology which is set out below.
• Step 1: Identify the contract(s) with a customer
• Step 2: Identify the performance obligation in contract
• Step 3: Determine the transaction price
• Step 4: Allocate the transaction price to the performance obligations in the contract
• Step 5: Recognize revenue when (or as) the entity satisfies a performance obligation
Contracts are subject to modification to account for changes in contract specification and requirements. We review modification
to contract in conjunction with the original contract, basis which the transaction price could be allocated to a new performance
obligation, or transaction price of an existing obligation could undergo a change. In the event transaction price is revised for
existing obligation, a cumulative adjustment is accounted for.
Contract balances
Trade receivables
A trade receivable is recognized if the amount of consideration is unconditional (i.e., only the passage of time is required before
payment of the consideration is due).
Unbilled revenue/contract assets
Unbilled revenue/contract assets are recognized when there is excess of revenue earned over billings on contracts. Contract
assets are classified as unbilled receivables (only act of invoicing is pending) when there is unconditional right to receive cash,
and only passage of time is required, as per contractual terms. Unearned or deferred revenue is recognized when there are
billings in excess of revenues.
Sale of services
Revenue with respect to sale of services is recognized when the services are rendered and no significant uncertainty exists
regarding the collection of consideration.
Export incentives
Government incentives are accrued for based on fulfilment of eligibility criteria for availing the incentives and when there is
no uncertainty in receiving the same.
Variable consideration
If the consideration in a contract includes a variable amount, we estimate the amount of consideration to which it will be entitled
in exchange for transferring the goods to the customer. The variable consideration is estimated at contract inception and
constrained until it is highly probable that a significant revenue reversal in the amount of cumulative revenue recognized will
not occur when the associated uncertainty with the variable consideration is subsequently resolved.
Other income
Other income comprises interest income on deposits, gains / (losses) on disposal of financial assets and non-financial assets. It
is recognized on accrual basis except where the receipt of income is uncertain. Interest income is recognized using the effective
interest method. The ‘effective interest rate’ is the rate that exactly discounts the estimated future cash payments or receipts
over the expected life of the financial instrument to:
269
• the gross carrying amount of the financial asset; or
• the amortized cost of the financial liability.
Dividend income
Dividend income is accounted when the right to receive the dividend is established.
Business Combination
In accordance with Ind AS 103, we account for the business combinations (other than common control business combinations)
using the acquisition method when control is transferred to us. The cost of an acquisition is measured as the fair value of the
assets given, equity instruments issued, and liabilities incurred or assumed at the date of exchange. The cost of acquisition also
includes the fair value of any contingent consideration. Identifiable assets acquired and liabilities and contingent liabilities
assumed in a business combination are measured initially at their fair value on the date of acquisition. Transaction costs are
expensed as incurred, except to the extent related to the issue of debt or equity securities.
Goodwill:
The excess of the cost of acquisition over our share in the fair value of the acquiree’s identifiable assets, liabilities and contingent
liabilities is recognized as goodwill. If the excess is negative, it is considered as a bargain purchase gain. Goodwill is tested for
impairment on an annual basis and whenever there is an indication that goodwill may be impaired, relying on a number of
factors including operating results, business plans and future cash flows.
Other intangible assets:
Intangible assets acquired in a business combination are measured at fair value as at the date of acquisition. Following initial
recognition, intangible assets are carried at cost less accumulated amortization and impairment losses, if any. The amortization
of an intangible asset with a finite useful life reflects the manner in which the economic benefit is expected to be generated and
is included in depreciation and amortization expenses in the statements of profit and loss. The estimated useful life of
amortizable intangibles are reviewed and where appropriate are adjusted, annually.
Property, plant and equipment
On transition to Ind AS, we have elected to fair value certain items of property, plant and equipment and uses that fair value as
its deemed cost at the date of transition, i.e., April 1, 2019. The remaining item of property, plant and equipment are valued in
accordance with Ind AS 16 - Property, plant and equipment.
Post transition to Ind AS, property, plant and equipment, excluding freehold land, are carried at cost less accumulated
depreciation and impairment losses, if any. The cost of property, plant and equipment comprises its purchase price net of any
trade discounts and rebates, any import duties and other taxes (other than those subsequently recoverable from the tax
authorities), any directly attributable expenditure on making the asset ready for its intended use, other incidental expenses.
The cost of a self-constructed item of property, plant and equipment comprises the cost of materials, direct labour, and any
other costs directly attributable to bringing the item to working condition for its intended use and estimated costs of dismantling
and removing them and restoring the site on which it is located.
If significant parts of an item of property, plant and equipment have different useful lives, then they are accounted for as separate
items (major components) of property, plant and equipment.
Subsequent expenditure is capitalized only if it is probable that the future economic benefits associated with the expenditure
will flow to us and such expenditure can be measured reliably.
Depreciation and useful lives
Depreciable amount for assets is the cost of asset less its estimated residual value. Depreciation on property, plant and equipment
is calculated on a straight-line basis using the rates arrived at based on the useful lives estimated by the management. Based on
the internal technical assessment, the management believes that the useful lives as given below, which are different from those
prescribed in Part C of Schedule II of the Companies Act, best represent the period over which management expects to use
these assets.
Property, Plant and Equipment Useful Life
Building 30 years
Plant and machineries 15 years
Electrical Installations 10 years
Furniture and fixtures 10 years
Vehicle 8 years
270
Property, Plant and Equipment Useful Life
Office equipment 5 years
Computers 3 years
Servers 3 years
Freehold land is not depreciated. The estimated useful lives, residual values and depreciation method are reviewed at the end
of each reporting period, with the effect of any changes in estimate accounted for on a prospective basis.
A property, plant and equipment is eliminated from the financial statements on disposal or when no further benefit is expected
from its use and disposal. Assets retired from active use and held for disposal are generally stated at the lower of their net book
value and net realizable value. Any gain or losses arising from disposal of property, plant and equipment is recognized in the
statement of profit and loss.
Advance paid towards the acquisition of property, plant and equipment outstanding at each balance sheet date classified as
capital advances under other non-current assets and the cost of the assets not put to use before such date are disclosed under
capital work in progress.
Intangible assets
On transition to Ind AS, we valued intangible assets in accordance with Ind AS 38 - Intangible Assets.
Post transition to Ind AS, intangible assets with finite useful lives that are acquired separately are carried at cost less
accumulated amortization and accumulated impairment losses. Intangible assets are amortized over their respective individual
estimated useful lives on a straight-line basis, from the date that they are available for use. The estimated useful life of an
identifiable intangible asset is based on a number of factors including the effects of obsolescence, demand, competition, and
other economic factors (such as the stability of the industry, and known technological advances), and the level of maintenance
expenditures required to obtain the expected future cash flows from the asset.
The useful lives of intangible assets that is considered for amortization of intangible assets are as follows:
Intangible Asset Useful Life
Customer relationship 7 years
Computer software 3 years
Technical know-how 3 years
Non-compete 3 years
An intangible asset is de-recognized on disposal, or when no future economic benefits are expected from use or disposal. Gains
or losses arising from de-recognition of an intangible asset, measured as the difference between the net disposal proceeds and
the carrying amount of the asset are recognized in statement of profit and loss when the asset is de-recognized.
Impairment of non-financial assets
Goodwill
Goodwill is tested for impairment on an annual basis and whenever there is an indication that goodwill may be impaired, relying
on a number of factors including operating results, business plans and future cash flows. For the purpose of impairment testing,
goodwill acquired in a business combination is allocated to our cash generating units (“CGU”) or groups of CGU's expected to
benefit from the synergies arising from the business combination. A CGU is the smallest identifiable group of assets that
generates cash inflows that are largely independent of the cash inflows from other assets or group of assets. Impairment occurs
when the carrying amount of a CGU including the goodwill, exceeds the estimated recoverable amount of the CGU. The
recoverable amount of a CGU is the higher of its fair value less cost to sell and its value-in-use. Value-in-use is the present
value of future cash flows expected to be derived from the CGU. Total impairment loss of a CGU is allocated first to reduce
the carrying amount of goodwill allocated to the CGU and then to the other assets of the CGU pro-rata on the basis of the
carrying amount of each asset in the CGU. An impairment loss on goodwill is recognised in the restated consolidated statement
of profit and loss and is not reversed in the subsequent period.
Intangible assets and property, plant and equipment
Intangible assets and property, plant and equipment are evaluated for recoverability whenever events or changes in
circumstances indicate that their carrying amounts may not be recoverable. For the purpose of impairment testing, the
recoverable amount (i.e., the higher of the fair value less cost to sell and the value in- use) is determined on an individual asset
basis unless the asset does not generate cash flows that are largely independent of those from other assets. In such cases, the
recoverable amount is determined for the cash generating unit to which the asset belongs.
If such assets are considered to be impaired, the impairment to be recognized in the statement of profit and loss is measured by
the amount by which the carrying value of the assets exceeds the estimated recoverable amount of the asset. An impairment

271
loss is reversed in the statement of profit and loss if there has been a change in the estimates used to determine the recoverable
amount.
The carrying amount of the asset is increased to its revised recoverable amount, provided that this amount does not exceed the
carrying amount that would have been determined (net of any accumulated amortization or depreciation) had no impairment
loss been recognized for the asset in prior years.
Inventories
Inventories are valued at the lower of cost and net realizable value. Cost of inventories comprises purchase price, costs of
conversion and other costs incurred in bringing the inventories to their present location and condition. In determining the cost,
weighted average cost is used. Net realizable value is the estimated selling price in the ordinary course of business, less
estimated costs to sell. The comparison of cost and net realizable value is made on an item-by-item basis.
The method of determination of cost is as follows:
• Raw materials and components– on a weighted average basis.
• Stores and spares – on a weighted average basis.
• Work-in-progress – includes cost of conversion.
• Finished goods – includes cost of conversion.
• Good in transit- at purchase cost.
The net realizable value of work-in-progress is determined with reference to the net realizable value of related finished goods.
Raw materials and other supplies held for use in production of inventories are not written down below cost except in cases
where material prices have declined, and it is estimated that the cost of the finished products will exceed their net realizable
value. Fixed production overheads are allocated on the basis of normal capacity of production facilities. The provision for
inventory obsolescence is assessed periodically and is provided as considered necessary.
Cash and cash equivalents
Cash and cash equivalent includes cash on hand, other short-term, highly liquid investments with original maturities of three
months or less that are readily convertible to known amounts of cash and which are subject to an insignificant risk of changes
in value, and bank overdrafts.
Cash flow statement
Cash flows are reported using the indirect method, whereby net profit before taxes for the period is adjusted for the effects of
transactions of a non-cash nature, any deferrals or accruals of past or future operating cash receipts or payments and item of
income or expenses associated with investing or financing cash flows. The cash flows from our operating, investing and
financing activities are segregated.
Cash dividend to equity holders of our Company
We recognize a liability to make cash distributions to equity holders when the distribution is authorized, and the distribution is
no longer at the discretion of Company. Final dividends on shares are recorded as a liability on the date of approval by the
shareholders and interim dividends are recorded as a liability on the date of declaration by our Board of Directors.
Foreign currency transactions and translations
Foreign currency are translated into the functional currency using the exchange rates at the dates of the transactions. Foreign
currency denominated monetary assets and liabilities are translated into relevant functional currency at exchange rates in effect
at the balance sheet date. Foreign exchange gains and losses resulting from the settlement of such transactions and from the
translation of monetary assets and liabilities denominated in foreign currencies at year end exchange rates are generally
recognized in statement of profit and loss. Non-monetary assets and non-monetary liabilities denominated in foreign currency
and measured at fair value are translated at the exchange rate prevalent at the date when the fair value was determined. Non-
monetary assets and non-monetary liabilities denominated in a foreign currency and measured at historical cost are translated
at the exchange rate prevalent at the date of transaction. Translation differences on assets and liabilities carried at fair value are
reported as part of the fair value gain or loss and are generally recognized in statement of profit and loss, except exchange
differences arising from the translation of the following items which are recognized in OCI:
• equity investments at fair value through OCI
272
• a financial liability designated as a hedge of the net investment in a foreign operation to the extent that the hedge is
effective; and
• qualifying cash flow hedges to the extent that the hedges are effective.
Employee benefits
(i) Defined contribution plan
A defined contribution plan is a post-employment benefit plan under which an entity pays specified contributions to a
separate entity and has no obligation to pay any further amounts. We make specified monthly contributions towards
employee provident fund to Government administered provident fund scheme which is a defined contribution plan.
Our contribution is recognized as an expense in the statement of profit and loss during the period in which the employee
renders the related service.
(ii) Defined benefit plan
Our gratuity plan is a defined benefit plan. The present value of gratuity obligation under such defined benefit plans
is determined based on actuarial valuations carried out by an independent actuary using the projected unit credit
method, which recognizes each period of service as giving rise to additional unit of employee benefit entitlement and
measure each unit separately to build up the final obligation. The obligation is measured at the present value of
estimated future cash flows. The discount rates used for determining the present value of obligation under defined
benefit plans, is based on the market yields on Government securities as at the balance sheet date, having maturity
periods approximating to the terms of related obligations.
Actuarial gains or losses are recognized in other comprehensive income. Further, the profit or loss does not include an
expected return on plan assets. Instead net interest recognized in profit or loss is calculated by applying the discount
rate used to measure the defined benefit obligation to the net defined benefit liability or asset. The actual return on
plan assets above or below the discount rate is recognized as part of re-measurement of net defined liability or asset
through other comprehensive income.
Re-measurements comprising actuarial gains or losses and return on plan assets (excluding amounts included in net
interest on the net defined benefit liability) are not reclassified to profit or loss in subsequent periods.
Our gratuity scheme is administered through a third party trust and the provision for the same is determined on the
basis of actuarial valuation carried out by an independent actuary. Provision is made for the shortfall, if any, between
the amounts required to be contributed to meet the accrued liability for gratuity as determined by actuarial valuation
and the available corpus of the funds.
(iii) Short-term employee benefits
All employee benefits falling due wholly within 12 months of rendering the services are classified as short term
employee benefits, which include benefits such as salaries, wages and performance incentives and are recognized as
expenses in the period in which the employee renders the related service.
Short term employee benefits are measured on an undiscounted basis and are expensed as the related service is
provided. A liability is recognized for the amount expected to be paid e.g. short term performance incentive, if we
have a present legal or constructive obligation to pay this amount as a result of past services provided by the employee
and the amount of obligation can be estimated reliably.
When the benefits of a plan are changed or when a plan is curtailed, the resulting change in benefit that relates to past
service (‘past service cost’ or ‘past service gain’) or the gain or loss on curtailment is recognized immediately in profit
or loss. We recognize gains and losses on the settlement of a defined benefit plan when the settlement occurs.
(iv) Compensated absences
Compensated absences which are not expected to occur within 12 months after the end of the period in which the
employee renders the related services are recognized at an actuarially determined liability at the present value of the
defined benefit obligation at the balance sheet date. In respect of compensated absences expected to occur within 12
months after the end of the period in which the employee renders the related services, liability for short-term employee
benefits is measured at the undiscounted amount of the benefits expected to be paid in exchange for the related service.
Borrowing Costs
Borrowing costs are interest and other costs (including exchange differences relating to foreign currency borrowings to the
extent that they are regarded as an adjustment to interest costs) incurred in connection with the borrowing of funds. Borrowing

273
costs allocated to and utilized for qualifying assets pertaining to the period from commencement of activities directly
attributable to the acquisition, construction or production of up to the date of capitalization of such asset are added to the cost
of the assets. Qualifying asset is an asset that necessarily takes a substantial period of time to get ready for its intended use.
Borrowing cost also includes exchange differences to the extent regarded as an adjustment to the borrowing costs. All other
borrowing costs are expensed in the period in which they occur.
Leases
We have applied Ind AS 116 using the retrospective approach, hence, the comparative information has been restated.
We assess at contract inception whether a contract is, or contains, a lease, that is if the contract conveys the right to control the
use of an identified asset for a period of time in exchange for consideration.
Company as a lessee
We account for each lease component within the contract as a lease separately from non-lease components of the contract and
allocates the consideration in the contract to each lease component on the basis of the relative stand-alone price of the lease
component and the aggregate stand-alone price of the non-lease components.
We recognize a right-of-use (“ROU”) asset and a lease liability at the lease commencement date. The ROU asset is initially
measured at cost, which comprises the initial amount of the lease liability adjusted for any lease payments made at or before
the commencement date, plus any initial direct costs incurred and an estimate of costs to dismantle and remove the underlying
asset or to restore the underlying asset or the site on which it is located, less any lease incentives received. The ROU asset is
subsequently depreciated using the straight-line method from the commencement date to the end of the lease term.
The lease liability is initially measured at the present value of the lease payments that are not paid at the commencement date,
discounted using our incremental borrowing rate. It is re-measured when there is a change in future lease payments arising from
a change in an index or rate, if there is a change in our estimate of the amount expected to be payable under a residual value
guarantee, or if we change its assessment of whether we will exercise a purchase, extension or termination option.
When the lease liability is re-measured in this way, a corresponding adjustment is made to the carrying amount of the right-of-
use asset, or is recorded in profit or loss if the carrying amount of the right-of-use asset has been reduced to zero.
We have elected not to recognize right-of-use assets and lease liabilities for short-term leases that have a lease term of 12
months or less and leases of low-value assets. We recognize the lease payments associated with these leases as an expense over
the lease term.
We apply the short-term lease recognition exemption to all assets that have a lease term of 12 months or less from the
commencement date. The lease payments associated with these leases are recognized as an expense on a straight-line basis over
the lease term. Further, leases for which the underlying asset is of low value has been recognized immediately in the statement
of profit and loss.
Taxation
Income tax expense comprises current and deferred income tax. Income tax expense is recognized in net profit in the statement
of profit and loss except to the extent it relates to items recognized directly in equity, in which case it is recognized in other
comprehensive income.
Current income tax for current and prior periods is recognized at the amount expected to be paid or recovered from the tax
authorities, using the tax rates and tax laws that have been enacted or substantively enacted by the reporting date.
Deferred income tax assets and liabilities are recognized for all temporary differences arising between the tax bases of assets
and liabilities and their carrying amounts in the financial statements except for the cases mentioned below. Deferred income
tax assets and liabilities are measured using tax rates and tax laws that have been enacted or substantively enacted by the balance
sheet date and are expected to apply to taxable income in the years in which those temporary differences are expected to be
recovered or settled. The effect of changes in tax rates on deferred income tax assets and liabilities is recognized as income or
expense in the period that includes the enactment or substantive enactment date.
Deferred tax is not recognized for temporary differences arising on the initial recognition of assets and liabilities in a transaction
that is not a business combination and that affects neither accounting nor taxable profits nor loss at the time of the transaction.
Deferred tax assets are recognized to the extent that it is probable that future taxable profits will be available against which they
can be used. We recognize a deferred tax asset only to the extent that it has sufficient taxable temporary differences or there is
convincing other evidence that sufficient taxable profits will be available against which such deferred tax can be realized.
Deferred tax assets, unrecognized or recognized, are reviewed at each reporting date and are recognized/reduced to the extent
that it is probable/no longer probable respectively that the related tax benefit will be realized.
274
Minimum alternative tax (“MAT”) paid in accordance with the tax laws, which gives rise to future economic benefits in the
form of adjustment of future tax liability, is considered as an asset if there is convincing evidence that we will pay normal
income tax in future years. Ind AS 12 defines deferred tax to include carry forward of unused tax credits that are carried forward
by the entity for a specified period of time. Accordingly, MAT credit entitlement is grouped with deferred tax assets (net) in
the balance sheet.
We offset, the current tax assets and liabilities (on a year on year basis) and deferred tax assets and liabilities, where we have a
legally enforceable right and where we intend to settle such assets and liabilities on a net basis.
Provisions and Contingent Liabilities
(i) Provision
Provisions are recognized when we have a present obligation (legal or constructive) as a result of a past event, it is
probable that an outflow of resources embodying economic benefits will be required to settle the obligation and a
reliable estimate can be made of the amount of the obligation. When we expect some or all of a provision to be
reimbursed, the expense relating to a provision is presented in the statement of profit and loss net of any reimbursement.
If the effect of the time value of money is material, provisions are discounted using a current pre-tax rate that reflects,
when appropriate, the risks specific to the liability. When discounting is used, the increase in the provision due to the
passage of time is recognized as a finance cost. Expected future operating losses are not provided for.
(ii) Onerous contract
Provision for onerous contracts, i.e., contracts where the expected unavoidable cost of meeting the obligations under
the contract exceed the economic benefits expected to be received under it, are recognized when it is probable that an
outflow of resources embodying economic benefits will be required to settle a present obligation as a result of an
obligating event based on a reliable estimate of such obligation.
(iii) Contingent liabilities
A disclosure for contingent liabilities is made where there is a possible obligation or a present obligation that may
probably not require an outflow of resources. When there is a possible or a present obligation where the likelihood of
outflow of resources is remote, no provision or disclosure is made.
Changes in Accounting Policies in the Last Three Financial Years
The financial statements for the year ended March 31, 2021 are our first financial statements prepared in accordance with Ind
AS. Other than as required for the preparation of our Restated Consolidated Financial Information, there have been no changes
in our accounting policies in the three month period ended June 30, 2021 and Fiscals 2019, 2020 and 2021.
Recent Accounting Pronouncements
The Ministry of Company Affairs, Government of India (“MCA”) notifies new standards or amendments to the existing
standards. There is no such notification which would have been applicable from July 1, 2021.
MCA issued notifications dated March 24, 2021 to amend Schedule III to the Companies Act, 2013 to enhance the disclosures
required to be made by us in our financial statements. These amendments are applicable to us for the financial period starting
April 1, 2021 and we have complied with the disclosure requirements.
Segment reporting
Operating segments are reported in a manner consistent with the internal reporting provided to the Chief Operating Decision
Maker (“CODM”). We have identified one reportable segment based on the dominant source, nature of risks and return and
the internal organization and management structure and for which discrete financial information is available. The CODM
monitors the operating results of the entity as a whole for the purpose of making decisions about resource allocation and
performance assessment.
Principal Components of Statement of Profit and Loss
Total income
Our total income comprises (i) revenue from operations; and (ii) other income.
Revenue from operations
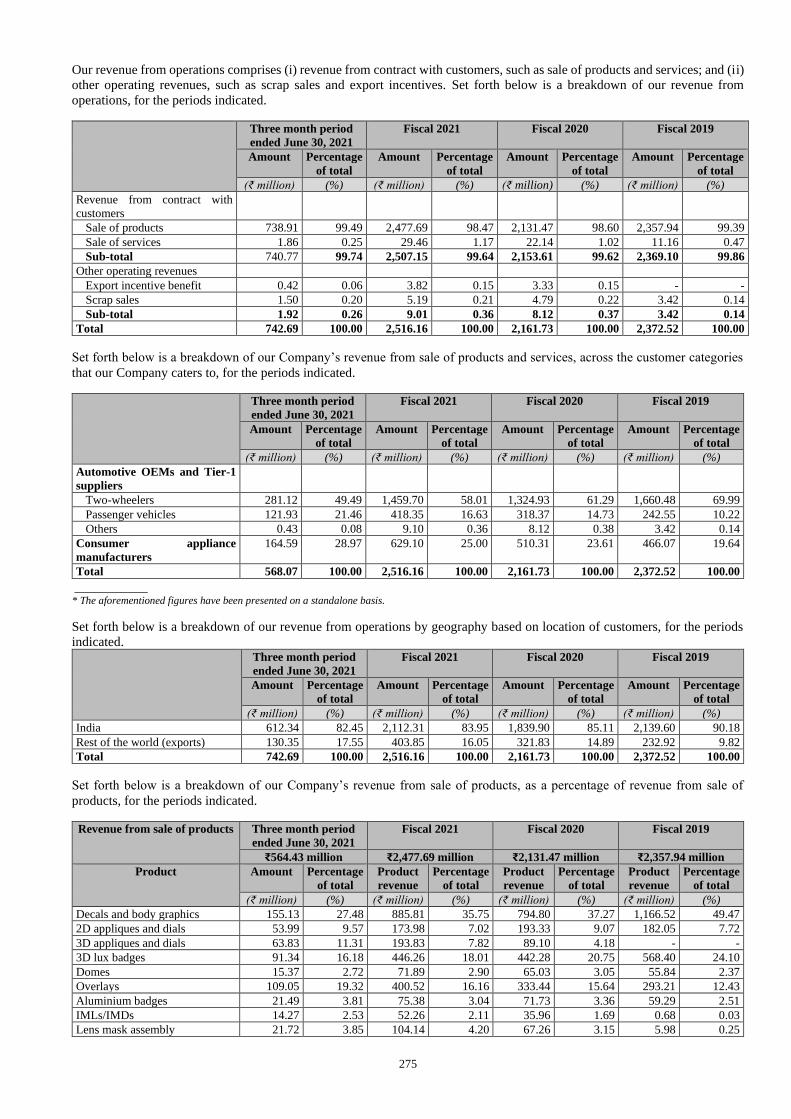
275
Our revenue from operations comprises (i) revenue from contract with customers, such as sale of products and services; and (ii)
other operating revenues, such as scrap sales and export incentives. Set forth below is a breakdown of our revenue from
operations, for the periods indicated.
Three month period
ended June 30, 2021
Fiscal 2021 Fiscal 2020 Fiscal 2019
Amount Percentage
of total
Amount Percentage
of total
Amount Percentage
of total
Amount Percentage
of total
(₹ million) (%) (₹ million) (%) (₹ million) (%) (₹ million) (%)
Revenue from contract with
customers
Sale of products 738.91 99.49 2,477.69 98.47 2,131.47 98.60 2,357.94 99.39
Sale of services 1.86 0.25 29.46 1.17 22.14 1.02 11.16 0.47
Sub-total 740.77 99.74 2,507.15 99.64 2,153.61 99.62 2,369.10 99.86
Other operating revenues
Export incentive benefit 0.42 0.06 3.82 0.15 3.33 0.15 - -
Scrap sales 1.50 0.20 5.19 0.21 4.79 0.22 3.42 0.14
Sub-total 1.92 0.26 9.01 0.36 8.12 0.37 3.42 0.14
Total 742.69 100.00 2,516.16 100.00 2,161.73 100.00 2,372.52 100.00
Set forth below is a breakdown of our Company’s revenue from sale of products and services, across the customer categories
that our Company caters to, for the periods indicated.
Three month period
ended June 30, 2021
Fiscal 2021 Fiscal 2020 Fiscal 2019
Amount Percentage
of total
Amount Percentage
of total
Amount Percentage
of total
Amount Percentage
of total
(₹ million) (%) (₹ million) (%) (₹ million) (%) (₹ million) (%)
Automotive OEMs and Tier-1
suppliers
Two-wheelers 281.12 49.49 1,459.70 58.01 1,324.93 61.29 1,660.48 69.99
Passenger vehicles 121.93 21.46 418.35 16.63 318.37 14.73 242.55 10.22
Others 0.43 0.08 9.10 0.36 8.12 0.38 3.42 0.14
Consumer appliance
manufacturers
164.59 28.97 629.10 25.00 510.31 23.61 466.07 19.64
Total 568.07 100.00 2,516.16 100.00 2,161.73 100.00 2,372.52 100.00
___________ * The aforementioned figures have been presented on a standalone basis.
Set forth below is a breakdown of our revenue from operations by geography based on location of customers, for the periods
indicated. Three month period
ended June 30, 2021
Fiscal 2021 Fiscal 2020 Fiscal 2019
Amount Percentage
of total
Amount Percentage
of total
Amount Percentage
of total
Amount Percentage
of total
(₹ million) (%) (₹ million) (%) (₹ million) (%) (₹ million) (%)
India 612.34 82.45 2,112.31 83.95 1,839.90 85.11 2,139.60 90.18
Rest of the world (exports) 130.35 17.55 403.85 16.05 321.83 14.89 232.92 9.82
Total 742.69 100.00 2,516.16 100.00 2,161.73 100.00 2,372.52 100.00
Set forth below is a breakdown of our Company’s revenue from sale of products, as a percentage of revenue from sale of
products, for the periods indicated.
Revenue from sale of products Three month period
ended June 30, 2021
Fiscal 2021 Fiscal 2020 Fiscal 2019
₹564.43 million ₹2,477.69 million ₹2,131.47 million ₹2,357.94 million
Product Amount Percentage
of total
Product
revenue
Percentage
of total
Product
revenue
Percentage
of total
Product
revenue
Percentage
of total
(₹ million) (%) (₹ million) (%) (₹ million) (%) (₹ million) (%)
Decals and body graphics 155.13 27.48 885.81 35.75 794.80 37.27 1,166.52 49.47
2D appliques and dials 53.99 9.57 173.98 7.02 193.33 9.07 182.05 7.72
3D appliques and dials 63.83 11.31 193.83 7.82 89.10 4.18 - -
3D lux badges 91.34 16.18 446.26 18.01 442.28 20.75 568.40 24.10
Domes 15.37 2.72 71.89 2.90 65.03 3.05 55.84 2.37
Overlays 109.05 19.32 400.52 16.16 333.44 15.64 293.21 12.43
Aluminium badges 21.49 3.81 75.38 3.04 71.73 3.36 59.29 2.51
IMLs/IMDs 14.27 2.53 52.26 2.11 35.96 1.69 0.68 0.03
Lens mask assembly 21.72 3.85 104.14 4.20 67.26 3.15 5.98 0.25
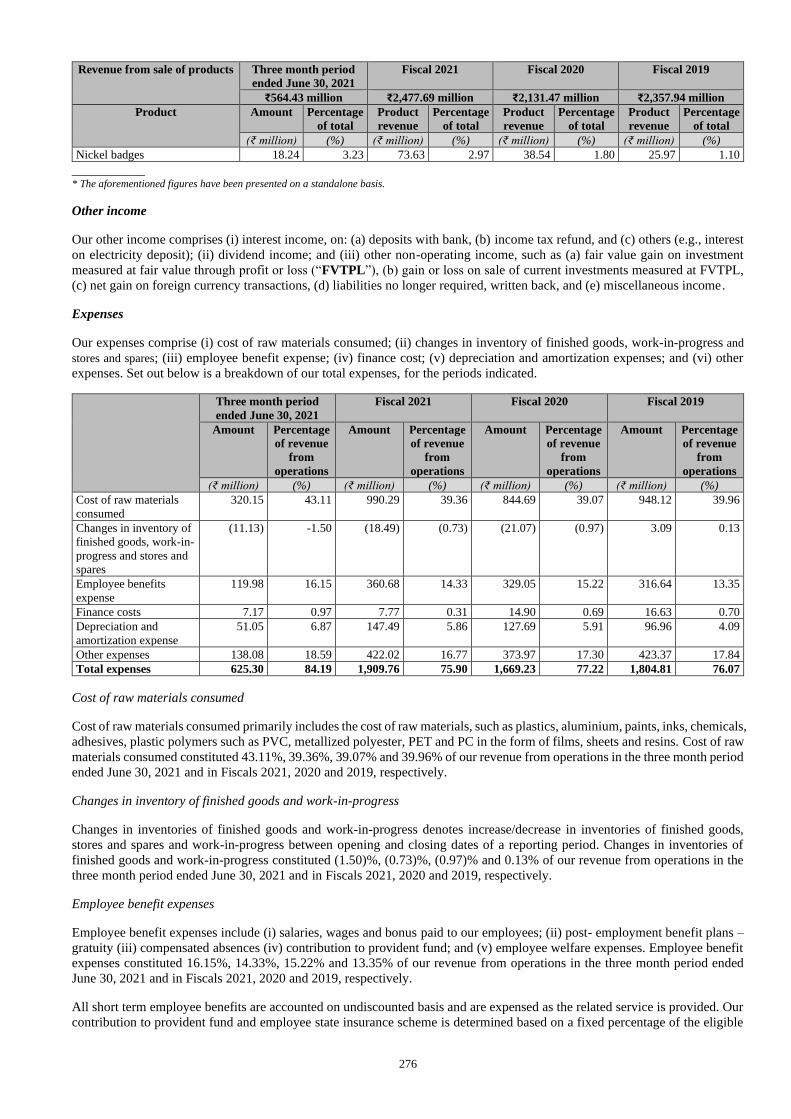
276
Revenue from sale of products Three month period
ended June 30, 2021
Fiscal 2021 Fiscal 2020 Fiscal 2019
₹564.43 million ₹2,477.69 million ₹2,131.47 million ₹2,357.94 million
Product Amount Percentage
of total
Product
revenue
Percentage
of total
Product
revenue
Percentage
of total
Product
revenue
Percentage
of total
(₹ million) (%) (₹ million) (%) (₹ million) (%) (₹ million) (%)
Nickel badges 18.24 3.23 73.63 2.97 38.54 1.80 25.97 1.10
___________ * The aforementioned figures have been presented on a standalone basis.
Other income
Our other income comprises (i) interest income, on: (a) deposits with bank, (b) income tax refund, and (c) others (e.g., interest
on electricity deposit); (ii) dividend income; and (iii) other non-operating income, such as (a) fair value gain on investment
measured at fair value through profit or loss (“FVTPL”), (b) gain or loss on sale of current investments measured at FVTPL,
(c) net gain on foreign currency transactions, (d) liabilities no longer required, written back, and (e) miscellaneous income.
Expenses
Our expenses comprise (i) cost of raw materials consumed; (ii) changes in inventory of finished goods, work-in-progress and
stores and spares; (iii) employee benefit expense; (iv) finance cost; (v) depreciation and amortization expenses; and (vi) other
expenses. Set out below is a breakdown of our total expenses, for the periods indicated.
Three month period
ended June 30, 2021
Fiscal 2021 Fiscal 2020 Fiscal 2019
Amount Percentage
of revenue
from
operations
Amount Percentage
of revenue
from
operations
Amount Percentage
of revenue
from
operations
Amount Percentage
of revenue
from
operations
(₹ million) (%) (₹ million) (%) (₹ million) (%) (₹ million) (%)
Cost of raw materials
consumed
320.15 43.11 990.29 39.36 844.69 39.07 948.12 39.96
Changes in inventory of
finished goods, work-in-
progress and stores and
spares
(11.13) -1.50 (18.49) (0.73) (21.07) (0.97) 3.09 0.13
Employee benefits
expense
119.98 16.15 360.68 14.33 329.05 15.22 316.64 13.35
Finance costs 7.17 0.97 7.77 0.31 14.90 0.69 16.63 0.70
Depreciation and
amortization expense
51.05 6.87 147.49 5.86 127.69 5.91 96.96 4.09
Other expenses 138.08 18.59 422.02 16.77 373.97 17.30 423.37 17.84
Total expenses 625.30 84.19 1,909.76 75.90 1,669.23 77.22 1,804.81 76.07
Cost of raw materials consumed
Cost of raw materials consumed primarily includes the cost of raw materials, such as plastics, aluminium, paints, inks, chemicals,
adhesives, plastic polymers such as PVC, metallized polyester, PET and PC in the form of films, sheets and resins. Cost of raw
materials consumed constituted 43.11%, 39.36%, 39.07% and 39.96% of our revenue from operations in the three month period
ended June 30, 2021 and in Fiscals 2021, 2020 and 2019, respectively.
Changes in inventory of finished goods and work-in-progress
Changes in inventories of finished goods and work-in-progress denotes increase/decrease in inventories of finished goods,
stores and spares and work-in-progress between opening and closing dates of a reporting period. Changes in inventories of
finished goods and work-in-progress constituted (1.50)%, (0.73)%, (0.97)% and 0.13% of our revenue from operations in the
three month period ended June 30, 2021 and in Fiscals 2021, 2020 and 2019, respectively.
Employee benefit expenses
Employee benefit expenses include (i) salaries, wages and bonus paid to our employees; (ii) post- employment benefit plans –
gratuity (iii) compensated absences (iv) contribution to provident fund; and (v) employee welfare expenses. Employee benefit
expenses constituted 16.15%, 14.33%, 15.22% and 13.35% of our revenue from operations in the three month period ended
June 30, 2021 and in Fiscals 2021, 2020 and 2019, respectively.
All short term employee benefits are accounted on undiscounted basis and are expensed as the related service is provided. Our
contribution to provident fund and employee state insurance scheme is determined based on a fixed percentage of the eligible
277
employees’ salary and charged to the statement of profit and loss. We have categorized our provident fund and the employee
state insurance scheme as a defined contribution plan since we have no further obligations beyond these contributions. Our
liability towards gratuity, comprising defined benefit plans and compensated absences, comprising other long-term benefit
plans is accounted for on the basis of an independent actuarial valuation done periodically. Service costs and net interest expense
are charged to statement of profit and loss, and actuarial gains/losses (together with return on plan assets which are above or
below the discount rate) are charged to the other comprehensive income. Gratuity liability is funded annually by payments to
third party trust. Staff welfare expenses include training, staff insurance, canteen services and other welfare expenses, among
others.
Finance costs
Finance costs includes interest expense on: (i) borrowings, (ii) bill discounting; (iii) income tax paid; (iv) other financial liability;
and (v) lease liabilities. Finance costs constituted 0.97%, 0.31%, 0.69% and 0.70% of our revenue from operations in the three
month period ended June 30, 2021 and in Fiscals 2021, 2020 and 2019, respectively.
Depreciation and amortization expenses
Depreciation and amortization expenses include (i) depreciation expenses of our property, plant and equipment; (ii)
amortization expenses of intangible assets; and (iii) amortization expenses of right of use (“ROU”) assets. Depreciation and
amortization expenses constituted 6.87%, 5.86%, 5.91% and 4.09% of our revenue from operations in the three month period
ended June 30, 2021 and in Fiscals 2021, 2020 and 2019, respectively.
Other expenses
Other expenses comprise expenses towards: (i) sub-contracting charges; (ii) power and fuel; (iii) repairs and maintenance; (iv)
freight charges; (v) rent; (vi) legal and professional fees; (vii) rates and taxes (viii) travel and conveyance; (ix) housekeeping
charges; (x) corporate social responsibility expenses; (xi) sales promotion expenses; (xii) insurance; (xiii) printing and
stationery; (xiv) bank charges; (xv) communication; (xvi) loss on sale and write off of property, plant and equipment; (xviii)
bad debts written-off; (xix) loss allowances on financial assets, net; (xx) provision for doubtful advances and receivables; (xxi)
donation; (xxii) net loss on foreign currency transactions; and (xxiii) miscellaneous expenses.
Key components of other expenses are explained below:
(i) Sub-contracting charges comprise payments made to contractors for supply of products;
(ii) Power and fuel expenses comprise payments made to landlords/ lessors/ electricity boards towards utility expenses.
(iii) Freight expenses comprise payments made for outward freight operations, i.e., transporting our finished products from
our manufacturing facilities to our customers;
(iv) Legal and professional expenses comprise payments made to auditors, lawyers and other professional services; and
(v) Repairs and maintenance of plant and machinery comprise payments for common area maintenance charges, annual
maintenance charges for equipment and general repair and maintenance.
Tax expenses
Our tax expenses represents the tax payable on the current period’s taxable income based on the applicable income tax rate
adjusted by income tax payable for earlier years and deferred tax charges or credit (reflecting the tax effects of timing differences
between accounting income and taxable income for the period). Tax expenses constituted 4.40%, 6.52%, 6.04% and 6.47% of
our revenue from operations in the three month period ended June 30, 2021 and in Fiscals 2021, 2020 and 2019, respectively.
The deferred tax charge or credit and the corresponding deferred tax liabilities or assets are recognized using the tax rates that
have been enacted or substantively enacted by the balance sheet date and are expected to apply to taxable income in the years
in which those temporary differences are expected to be recovered or settled. Deferred tax liabilities are generally recognized
for all taxable temporary differences. Deferred tax assets are generally recognized for all deductible temporary differences to
the extent that it is probable that taxable profits will be available against the deductible temporary differences that can be utilized.
Deferred tax is reviewed at each balance sheet date and written down or written up to reflect the amount that is reasonably
certain, as the case may be, to be realized.
Results of operations based on our Restated Consolidated Financial Information
Set forth below is certain select financial information based on our Restated Consolidated Financial Information for the three
month period ended June 30, 2021 and for Fiscals 2021, 2020 and 2019, the components of which are also expressed as a
percentage of our total income, for the periods indicated.

278
Three month period
ended June 30, 2021
Fiscal 2021 Fiscal 2020 Fiscal 2019
Amount % of total
income
Amount % of total
income
Amount % of total
income
Amount % of total
income
(₹ million) (%) (₹ million) (%) (₹ million) (%) (₹ million) (%)
Income
Revenue from operations 742.69 98.64 2,516.16 98.61 2,161.73 97.70 2,372.52 98.54
Revenue from contract with
customers
- Sale of products 738.91 98.14 2,477.69 97.11 2,131.47 96.32 2,357.94 97.94
- Sale of services 1.86 0.25 29.46 1.15 22.14 1.00 11.16 0.46
Other operating revenues
- Export incentive benefit 0.42 0.06 3.82 0.15 3.33 0.15 - -
- Scrap sales 1.50 0.20 5.19 0.21 4.79 0.22 3.42 0.14
Other income 10.25 1.36 35.38 1.39 51.00 2.30 35.11 1.46
Total income 752.94 100.00 2,551.54 100.00 2,212.73 100.00 2,407.63 100.00
Expenses
Cost of raw materials consumed 320.15 42.52 990.29 38.81 844.69 38.17 948.12 39.38
Changes in inventories of
finished goods and work-in-
progress
(11.13) (1.48) (18.49) (0.72) (21.07) (0.95) 3.09 0.13
Employee benefits expense 119.98 15.93 360.68 14.14 329.05 14.87 316.64 13.15
Finance costs 7.17 0.95 7.77 0.30 14.90 0.67 16.63 0.69
Depreciation and amortization
expense
51.05 6.78 147.49 5.78 127.69 5.77 96.96 4.03
Other expenses 138.08 18.34 422.02 16.54 373.97 16.90 423.37 17.58
Total expenses 625.30 83.05 1,909.76 74.85 1,669.23 75.44 1,804.81 74.96
Profit before exceptional items
and tax
127.64 16.95 641.78 25.15 543.50 24.56 602.82 25.04
Exceptional items - - - - - - 73.22 3.04
Profit before tax 127.64 16.95 641.78 25.15 543.50 24.56 529.60 22.00
Tax expense
Current tax 38.81 5.15 191.01 7.49 111.81 5.05 119.35 4.96
Deferred tax charge/(credit) (6.13) (0.81) (26.88) (1.05) 18.84 0.85 34.24 1.42
Total tax expense 32.68 4.34 164.13 6.43 130.65 5.90 153.59 6.38
Profit after tax 94.96 12.61 477.65 18.72 412.85 18.66 376.01 15.62
Other comprehensive
(expense)/ income
Items that will not be reclassified
subsequently to profit or loss
- Re-measurements of defined
benefit plans
0.93 0.12 (0.30) (0.01) (2.57) (0.12) (4.73) (0.20)
- Income tax relating to items that
will not be reclassified to profit or
loss
(0.22) (0.03) 0.07 0.00 0.65 0.03 1.38 0.06
Other comprehensive expense for
the quarter/year, net of tax
0.71 0.09 (0.23) (0.01) (1.92) (0.09) (3.35) (0.14)
Total comprehensive income for
the quarter/year
95.67 12.71 477.42 18.71 410.93 18.57 372.66 15.48
Three month period ended June 30, 2021
Income
Total income
Our total income was ₹752.94 million in the three month period ended June 30, 2021 primarily as a result of our revenue from
operations.
Revenue from operations
Our revenue from operations was ₹742.69 million in the three month period ended June 30, 2021, which was primarily due to
sale of our products of ₹738.91 million in that period, generated through contracts with the relevant customers and after
adjusting for discount provided to the relevant customers, which was primarily a result of a combination of factors such as sale
of products and services to four-wheeler OEMs and related Tier-1 suppliers and to consumer appliance companies, sale of
products such as Decals and body graphics, overlays, 3D lux badges and 3D appliques and dials and sales to customers outside
India.
279
Other income
Our other income was ₹10.25 million in the three month period ended June 30, 2021 primarily due to income received from
deposits with banks and net foreign exchange gain during this period.
Expenses
Total expenses
Our total expenses was ₹625.30 million in in the three month period ended June 30, 2021 primarily due to the cost of raw
materials consumed, other expenses, employee benefits expense, depreciation and amortization expense and finance costs.
Cost of raw materials consumed
Our cost of raw materials consumed was ₹320.15 million in the three month period ended June 30, 2021 and constituted 43.11%
of our revenue from operations in that period.
Other expenses
Our other expenses were ₹138.08 million in the three month period ended June 30, 2021 and constituted 18.59% of our revenue
from operations in that period.
Employee benefits expense
Our employee benefit expenses were ₹119.98 million in the three month period ended June 30, 2021 and constituted 16.15%
of our revenue from operations in that period.
Depreciation and amortization expenses
Our depreciation and amortization expenses were ₹51.05 million in the three month period ended June 30, 2021 and constituted
6.87% of our revenue from operations in that period.
Finance costs
Our finance costs were ₹7.17 million in the three month period ended June 30, 2021 and constituted 0.97% of our revenue from
operations in that period.
Profit before tax
As a result of the foregoing factors, our profit before tax was ₹127.64 million in the three month period ended June 30, 2021 .
Taxation
Our tax expense in the three month period ended June 30, 2021 was ₹32.68 million.
Profit for the period
As a result of the foregoing factors, our profit for the three month period ended June 30, 2021 was ₹94.96 million.
Fiscal 2021 compared to Fiscal 2020
Income
Total income
Our Company’s total income increased by 15.31% to ₹2,551.54 million in Fiscal 2021 from ₹2,212.73 million in Fiscal 2020
primarily as a result of an increase in our Company’s revenue from operations.
Revenue from operations
Our Company’s revenue from operations increased by 16.40% to ₹2,516.16 million in Fiscal 2021 from ₹2,161.73 million in
Fiscal 2020, which was primarily due to an increase in sale of its products by 16.24% to ₹2,477.69 million in Fiscal 2021 from
₹2,131.47 million in Fiscal 2020 and an increase in sale of its services by 33.06% to ₹29.46 million in Fiscal 2021 from ₹22.14
million in Fiscal 2020, generated through contracts with the relevant customers and after adjusting for discount provided to the
relevant customers.
280
The overall increase in our Company’s revenues from sale of its products and services was primarily a result of a combination
of factors such as (a) a 31.40% increase in revenue from sale of products and services to four-wheeler OEMs and related Tier-
1 suppliers and a 23.28% in revenue from sale of products and services to consumer appliance companies compared to a 10.17%
increase in revenue from sale of products and services to two-wheeler OEMs and related Tier-1 suppliers; (b) higher share of
business from existing large customers and certain select customers supplying components to four-wheeler OEMs; (c) increase
in sale of products such as 3D appliques and dials, overlays, IMLs/IMDs and lens mask assemblies; and (d) an increase of
25.49% in revenue from sales to customers outside India (i.e., rest of the world) compared to an increase of 14.81% in revenue
from sales within India.
Our Company’s other operating revenues increased by 10.96% to ₹9.01 million in Fiscal 2021 from ₹8.12 million in Fiscal
2020 which was attributable to 8.35% increase in sale of scrap to ₹5.19 million in Fiscal 2021 from ₹4.79 million in Fiscal 2020
and a marginal increase in export incentives.
Other income
Our Company’s other income accounted for 1.39% of our Company’s total income in Fiscal 2021, compared to 2.30% in Fiscal
2020. Our Company’s other income decreased by 30.63% to ₹35.38 million in Fiscal 2021 from ₹51.00 million in Fiscal 2020,
primarily due to no income received from dividends on investments and no net gain on foreign currency transactions compared
to the previous year, which decreases were partially offset by an increase in the interest income from deposits with banks and
gain on sale of investments (measured at FVTPL) and fair value gain on investment measured at FVTPL. This is primarily due
to foreign exchange gain in previous year and foreign exchange loss in the current year.
Expenses
Total expenses
Our Company’s total expenses increased by 14.41% to ₹1,909.76 million in Fiscal 2021 from ₹1,669.23 million in Fiscal 2020,
primarily as a result of an increase in the cost of raw materials consumed, employee benefits expense, depreciation and
amortization expense and other expenses. This increase was commensurate with the growth in our Company’s business. Our
Company’s total expenses accounted for 75.90% of our Company’s revenue from operations in Fiscal 2021, compared to
77.22% in Fiscal 2020.
Cost of raw materials consumed
Our Company’s cost of raw materials consumed increased by 17.24% to ₹990.29 million in Fiscal 2021 from ₹844.69 million
in Fiscal 2020 in proportion with the growth in our Company’s business during this period and primarily due to an increase in
our Company’s requirement for raw materials in order to meet orders for our Company’s products. Our Company’s cost of raw
materials consumed accounted for (i) 39.36% of our Company’s revenue from operations in Fiscal 2021, compared to 39.07%
in Fiscal 2020, and (ii) 51.85% of our Company’s total expenses in Fiscal 2021, compared to 50.60% in Fiscal 2020.
Change in inventories of finished goods
Our Company’s opening stock of: (i) finished goods was ₹85.79 million as at March 31, 2021, while it was ₹103.07 million as
at March 31, 2020; (ii) stores and spares was ₹7.03 million as at March 31, 2021, while it was ₹3.54 million as at March 31,
2020; and (iii) work-in-progress was ₹48.69 million as at March 31, 2021, while it was ₹13.83 million as at March 31, 2020.
Our Company’s closing stock of: (i) finished goods was ₹101.96 million as at March 31, 2021, while it was ₹85.79 million as
at March 31, 2020; (ii) stores and spares was ₹6.28 million as at March 31, 2021, while it was ₹7.03 million as at March 31,
2020; (iii) work-in-progress was ₹51.76 million as at March 31, 2021, while it was ₹48.69 million as at March 31, 2020.
The 12.24% decrease in changes in inventories to ₹(18.49) million in Fiscal 2021 from ₹(21.07) million in Fiscal 2020 was
primarily a result of higher inventories of work-in-progress and finished goods in proportion with the growth in our Company’s
business and to avoid any probable irregularity in supply due to the COVID-19 lockdown.
Employee benefits expense
Our Company’s employee benefits expense increased by 9.61% to ₹360.68 million in Fiscal 2021 from ₹329.05 million in
Fiscal 2020, primarily as a result of an increase of 12.76% in the salary, wages and bonus to ₹300.91 million in Fiscal 2021
from ₹266.86 million in Fiscal 2020 which increase was primarily attributable to an increase in number of employees from 482
as at March 31, 2020 to 488 as at March 31, 2021 and ex-gratia payments to employees.
The increase in our Company’s employee benefits expense was less consistent with the growth in our Company’s business, and
as a result, our Company’s employees benefits expenses decreased to (i) 14.33% of our Company’s revenue from operations in
Fiscal 2021, compared to 5.22% in Fiscal 2020, and (ii) 18.89% of our Company’s total expense in Fiscal 2021, compared to
19.71% in Fiscal 2020.
281
Finance costs
Our Company’s finance costs decreased by 47.85% to ₹7.77 million in Fiscal 2021 from ₹14.90 million in Fiscal 2020 primarily
as a result of repayment of working capital loan during Fiscal 2020 and other financial liability which was partially offset by
an interest on income tax paid.
Depreciation and amortization expenses
Depreciation and amortization expenses increased by 15.51% to ₹147.49 million in Fiscal 2021 from ₹127.69 million in Fiscal
2020 due to an increase in the assets that qualified for depreciation and a marginal increase in amortization of intangible assets
during this period.
Our Company’s depreciation and amortization expenses accounted for (i) 5.86% of our Company’s revenue from operations in
Fiscal 2021, compared to 5.91% in Fiscal 2020, and (ii) 7.72% of our Company’s total expense in Fiscal 2021, compared to
7.65% in Fiscal 2020.
Other expenses
Our Company’s other expenses increased by 12.85% to ₹422.02 million in Fiscal 2021 from ₹373.97 million in Fiscal 2020.
Our Company’s other expenses accounted for (i) 16.77% of our Company’s revenue from operations in Fiscal 2021, compared
to 17.30% in Fiscal 2020, and (ii) 22.10% of our Company’s total expenses in Fiscal 2021, compared to 22.40% in Fiscal 2020.
The increase in our Company’s other expenses was primarily attributable to: (a) an increase in (i) sub-contracting charges by
20.90% to ₹163.00 million in Fiscal 2021 from ₹134.82 million in Fiscal 2020; (ii) freight and courier expenses by 29.19% to
₹38.33 million in Fiscal 2021 from ₹29.67 million in Fiscal 2020; and (iii) the rent expenses by 20.49% to ₹2.47 million in
Fiscal 2021 from ₹2.05 million in Fiscal 2020, which were in proportion with the growth in our Company’s business, and (b)
an increase in: (i) loss on sale and write off of property, plant and equipment by 680.30% to ₹10.30 million in Fiscal 2021 from
₹1.32 million in Fiscal 2020; and (ii) rates and taxes by 34.61% to ₹7.74 million in Fiscal 2021 from ₹5.75 million in Fiscal
2020, which increases were partially offset by a decrease in (a) power and fuel by 8.76% to ₹51.77 million in Fiscal 2021 from
₹56.74 million in Fiscal 2020 and (b) loss allowances on financial assets by 196.13% to ₹(3.95) million in Fiscal 2021 from
₹4.13 million in Fiscal 2020.
Profit before tax
As a result of the foregoing factors, our Company’s profit before tax increased by 18.08% to ₹641.78 million in Fiscal 2021
from ₹543.50 million in Fiscal 2020 which, as a percentage of total income, increased to a profit of 25.15% in Fiscal 2021 from
24.56% in Fiscal 2020.
Taxation
Our Company’s total tax expense increased by 25.63% to ₹164.13 million in Fiscal 2021 from ₹130.65 million in Fiscal 2020.
The increase in income tax expense was a result of an increase in current tax by 70.83% to ₹191.01 million in Fiscal 2021 from
₹111.81 million in Fiscal 2020 which was offset by deferred tax credit of ₹26.88 million in Fiscal 2021 from a deferred tax
charge of ₹18.84 million in Fiscal 2020. The effective tax rate for our Company was 25.17% in each of Fiscals 2021 and 2020.
Profit for the year
As a result of the foregoing factors, our Company’s profit for the year increased by 15.70% to ₹477.65 million in Fiscal 2021
from ₹412.85 million in Fiscal 2020.
Fiscal 2020 compared to Fiscal 2019
Income
Total income
Our Company’s total income reduced by 8.10% to ₹2,212.73 million in Fiscal 2020 from ₹2,407.63 million in Fiscal 2019
primarily as a result of a decrease in our Company’s revenue from operations.
Revenue from operations
Our Company’s revenue from operations decreased by 8.88% to ₹2,161.73 million in Fiscal 2020 from ₹2,372.52 million in
Fiscal 2019, which was primarily due to a decrease in sale of our Company’s products by 9.60% to ₹2,131.47 million in Fiscal
2020 from ₹2,357.94 million in Fiscal 2019, which was partially offset by an increase in sale of our Company’s services by
98.39% to ₹22.14 million in Fiscal 2020 from ₹11.16 million in Fiscal 2019, generated through contracts with the relevant
customers and after adjusting for discount provided to the relevant customers.
282
The decrease in our Company’s revenues from sale of our Company’s products was primarily a result of a combination of
factors such as: (a) a general slowdown in the automotive and consumer appliance industries due to the effect of banking and
credit crises and inventory adjustment on account of migration to BS-VI emission standards between Fiscals 2018 and 2020,
which was particularly reflected in reduced sale of products by two-wheeler OEMs and related Tier-1 suppliers (according to
the CRISIL Report, domestic sales of two-wheelers and passenger vehicles reduced by approximately 18.00% and 15.00%,
respectively, in Fiscal 2020 compared to the previous year) and a consequent reduction in sales of decals and body graphics
and 3D lux badges; and (b) towards the end of Fiscal 2020, an effective shutdown of large segments of the global economy due
to the impact of COVID-19 pandemic, which included the industries in which our Company’s customers operate and the effects
of the COVID-19 pandemic which resulted in brief disruption in the supply of raw materials from our Company’s domestic
and international suppliers and temporary closure of our Company’s Bengaluru manufacturing facility resulting in delays in the
delivery of certain orders towards the end of Fiscal 2020.
The increase in our Company’s revenues from sale of our Company’s services was primarily a result of our Company’s
increased focus on providing design services and collaboration with customers for product design, development, engineering
and manufacturing.
Our Company’s other operating revenues increased by 137.42% to ₹8.12 million in Fiscal 2020 from ₹3.42 million in Fiscal
2019, which was attributable to 40.06% to ₹4.79 million in Fiscal 2020 from ₹3.42 million in Fiscal 2019 which was due to
sale of scrap and commencement of receipt of export incentives of ₹3.33 million in Fiscal 2020.
Other income
Our Company’s other income accounted for 2.30% of our Company’s total income in Fiscal 2020, compared to 1.46% in Fiscal
2019. Our Company’s other income increased by 45.26% to ₹51.00 million in Fiscal 2020 from ₹35.11 million in Fiscal 2019,
primarily due to an increase in income we received from dividends on investments, net gain on foreign currency transactions
and miscellaneous income.
Expenses
Total expenses
Our Company’s total expenses decreased by 7.51% to ₹1,669.23 million in Fiscal 2020 from ₹1,804.81 million in Fiscal 2019,
primarily as a result of a decrease in the cost of raw materials consumed, finance costs, other expenses and a credit of changes
in inventories of finished goods and work-in-progress. This decrease was commensurate with the contraction in our Company’s
business. Our Company’s total expenses accounted for 77.22% of our Company’s revenue from operations in Fiscal 2020,
compared to 76.07% in Fiscal 2019.
Cost of materials consumed
Our Company’s cost of raw materials consumed decreased by 10.91% to ₹844.69 million in Fiscal 2020 from ₹948.12 million
in Fiscal 2019 primarily due to reduction our Company’s sales commensurate with the reduced demand for our Company’s
products during this period and consequent decrease in its raw material requirements.
Our Company’s cost of raw materials consumed accounted for (i) 39.07% of our Company’s revenue from operations in Fiscal
2020, compared to 39.96% in Fiscal 2019, and (ii) 50.60% of our Company’s total expense in Fiscal 2020, compared to 52.53%
in Fiscal 2019.
Change in inventories of finished goods
Our Company’s opening stock of (i) finished goods was ₹103.07 million as at March 31, 2020, while it was ₹84.19 million as
at March 31, 2019; (ii) stores and spares was ₹3.54 million as at March 31, 2020, while it was ₹2.34 million as at March 31,
2019; (iii) work-in-progress was ₹13.83 million as at March 31, 2020, while it was ₹37.00 million as at March 31, 2019.
Our Company’s closing stock of (i) finished goods was ₹85.79 million as at March 31, 2020, while it was ₹103.07 million as
at March 31, 2019; (ii) stores and spares was ₹7.03 million as at March 31, 2020, while it was ₹3.54 million as at March 31,
2019; (iii) work-in-progress was ₹48.69 million as at March 31, 2020, while it was ₹13.83 million as at March 31, 2019.
The decrease in changes in inventories to ₹(21.07) million in Fiscal 2020 from ₹3.09 million in Fiscal 2019 was primarily a
result of higher inventories of work-in-progress goods and stores and spares in proportion with the contraction in our Company’s
business during this period.
Employee benefits expense
Our Company’s employee benefit expense increased by 3.92% to ₹329.05 million in Fiscal 2020 from ₹316.64 million in Fiscal
2019, primarily as a result of an increase in the salary, wages and bonus and contribution to provident fund due to an increase
in number of employees and annual increments paid to employees. Our Company’s employee benefits expense accounted for

283
(i) 15.22% of our Company’s revenue from operations in Fiscal 2020, compared to 13.35% in Fiscal 2019, and (ii) 19.71% of
our Company’s total expense in Fiscal 2020, compared to 17.54% in Fiscal 2019.
Finance costs
Our Company’s finance costs decreased by 10.40% to ₹14.90 million in Fiscal 2020 from ₹16.63 million in Fiscal 2019
primarily as a result of a decrease in interest expense on bill discounting and other financial liability, which was partially offset
by an increase in interest expense on borrowings.
Depreciation and amortization expenses
Depreciation and amortization expenses increased by 31.69% to ₹127.69 million in Fiscal 2020 from ₹96.96 million in Fiscal
2019 due to an increase in the assets that qualified for depreciation and amortization of intangible assets during this period.
Our Company’s depreciation and amortization expenses accounted for (i) 5.91% of our Company’s revenue from operations in
Fiscal 2020, compared to 4.09% in Fiscal 2019, and (ii) 7.65% of our Company’s total expense in Fiscal 2020, compared to
5.37% in Fiscal 2019.
Other expenses
Our Company’s other expenses decreased by 11.67% to ₹373.97 million in Fiscal 2020 from ₹423.37 million in Fiscal 2019.
Our Company’s other expenses accounted for (i) 17.30% of our Company’s revenue from operations in Fiscal 2020 compared
to 17.84% in Fiscal 2019, and (ii) 22.40% of our Company’s total expenses in Fiscal 2020, compared to 23.46% in Fiscal 2019.
The decrease in our Company’s other expenses was primarily attributable to a decrease in sales promotion expenses by 88.97%
to ₹8.12 million in Fiscal 2020 from ₹73.65 million in Fiscal 2019. The sales promotion expenses in Fiscal 2019 were primarily
under an agreement to pay sales commission to an agent and decrease in rent expenses by 48.21% to ₹2.05 million in Fiscal
2020 from ₹4.47 million in Fiscal 2019. This was partially offset by an increase in freight and courier charges by 23.42% to
₹29.67 million in Fiscal 2020 from ₹24.04 million in Fiscal 2019 and increase in loss allowances on financial assets to ₹4.13
million in Fiscal 2020 from ₹0.42 million in Fiscal 2019.
Profit before exception items and tax
As a result of the foregoing factors, our Company’s profit before exceptional items and tax decreased by 9.84% to ₹543.50
million in Fiscal 2020 from ₹602.82 million in Fiscal 2019, which as a percentage of total income decreased to a profit of 24.56%
in Fiscal 2020 from 25.04% in Fiscal 2019.
Exceptional Item
In Fiscal 2019, our Company relocated its production and other facilities to its existing Bengaluru facility due to which our
Company incurred significant plant relocation expenses to the extent of ₹73.22 million during that period, which expenses
related to contracts with employees, raw material cost, salaries to employees, repairs and maintenance of machinery, power
charges and transportation expenses, among other things, and which constituted 3.04% of our Company’s revenue from
operations in Fiscals 2019. These expenses are non-recurring in nature and significant in size and were therefore presented as
an exceptional items in our Company’s financial statements.
Taxation
Our Company’s total tax expense decreased by 14.94% to ₹130.65 million in Fiscal 2020 from ₹153.59 million in Fiscal 2019.
The decrease in income tax expense was a result of a decrease in current tax by 6.32% to ₹111.81 million in Fiscal 2020 from
₹119.35 million in Fiscal 2019 and decrease in deferred tax charge by 44.98% to ₹18.84 million in Fiscal 2020 from ₹34.24
million in Fiscal 2019. The effective tax rate for our Company was 25.17% in Fiscals 2020 and 29.12% in Fiscal 2019.
Profit for the year
As a result of the foregoing factors, our Company’s profit for the year increased by 9.80% to ₹412.85 million in Fiscal 2020
from ₹376.01 million in Fiscal 2019.
Results of Operations based on our Proforma Condensed Consolidated Financial Information
The following table sets forth select financial data from our condensed consolidated statement of proforma profit and loss for
the year ended March 31, 2021:

284
Particulars S.J.S. Enterprises
Limited
Standalone
Exotech Plastics
Private Limited
Standalone
Proforma
Adjustments
Proforma
Consolidated
(₹ million)
(A) (B) (C) (D=A+B+C)
Income
Revenue from operations 2,516.16 685.26 - 3,201.42
Other income 35.38 64.15 - 99.53
Total income 2,551.54 749.41 - 3,300.95
Expenses
Cost of raw materials consumed 990.29 383.26 - 1,373.55
Changes in inventories of finished goods and work-in-
progress
(18.49) (9.35) - (27.84)
Employee benefits expense 360.68 82.21 - 442.89
Finance costs 7.77 23.94 - 31.71
Depreciation and amortization expense 147.49 48.33 9.90 205.72
Other expenses 422.02 154.94 - 576.96
Total expenses 1,909.76 683.33 9.90 2,602.99
Profit before tax 641.78 66.08 (9.90) 697.96
Tax expenses
Current tax 191.01 13.81 - 204.82
Deferred tax (credit)/charge (26.88) 0.21 - (26.67)
Income tax expense 164.13 14.02 - 178.15
Profit for the year 477.65 52.06 (9.90) 519.81
Financial condition, liquidity and capital resources
Historically, our primary liquidity requirements have been to finance our working capital needs for our operations and capital
expenditures. We had met these requirements through cash flows from operations and borrowings. Cash in the form of cash on
hand, cheques on hand, current accounts and foreign currency accounts at banks and other balances held with banks as short
term deposits together represent our cash and cash equivalents.
As at June 30, 2021, we had ₹181.40 million in cash and cash equivalents and ₹176.85 million as bank balances other than cash
and cash equivalents. We also held liquid funds, through our investments in mutual funds in order to maximize the return on
investments in mutual funds. Such investments in mutual funds were ₹408.93 million, ₹814.66 million, ₹695.55 million and
₹550.39 million in the three month period ended June 30, 2021 and in the Fiscals 2021, 2020 and 2019, respectively. The cash
surplus available to us and our credit facilities were able to meet all our additional working capital and capital expenditure
requirements in the three month period ended June 30, 2021 and Fiscals 2021, 2020 and 2019. We financed the Exotech
Acquisition primarily through sale of a portion of our investments in mutual funds.
We believe that we have sufficient liquidity for our present requirements and anticipated requirements for capital expenditure
and working capital for 12 months following the date of this Red Herring Prospectus.
Cash flows based on our Restated Consolidated Financial Information
The table below sets forth our cash flows for the periods indicated:
Particulars Three month
period ended
June 30, 2021
Fiscal 2021 Fiscal 2020 Fiscal 2019
(₹ million)
Net cash flows generated from operating activities 220.52 579.38 582.67 358.27
Net cash flows used in investing activities (251.44) (374.49) (324.10) (443.87)
Net cash flows (used in)/ from financing activities (115.06) (95.93) (181.46) 89.04
Net increase in cash and cash equivalents (145.98) 108.96 77.11 3.44
Effects of exchange gain on cash and cash equivalents 0.03 (0.45) 1.49 -
Cash and cash equivalents at the beginning of the year 216.12 107.61 29.01 25.57
Cash Acquired as part of business combination 111.23
Cash and cash equivalents at the end of the quarter/ year 181.40 216.12 107.61 29.01
Cash flows from operating activities
Three month period ended June 30, 2021
Net cash flow generated from operating activities in the three month period ended June 30, 2021 was ₹220.52 million, while
profit before tax was ₹127.64 million. The difference was primarily attributable to depreciation and amortization expenses of
285
₹51.05 million and interest expense of ₹7.17 million. These were partially offset by interest income of ₹2.98 million, unrealised
foreign exchange gain (net) of ₹2.34 million, changes in fair value of financial assets of ₹1.95 million and gain on sale of
investments (measured at FVTPL) of ₹1.28 million. Further, there were also working capital adjustments/ changes in operating
assets and liabilities for trade receivables of ₹201.44 million, financial liabilities of ₹41.37 million and provisions of ₹2.00
million. These were offset by adjustment for changes in trade payables of ₹143.25 million, non-financial assets of ₹11.05
million, inventories of ₹5.46 million, financial assets of ₹3.29 million, other non-financial liabilities of ₹1.24 million and loans
of ₹0.62 million. There was also income tax paid (net of refunds) of ₹36.10 million.
Fiscal 2021
Net cash flow generated from operating activities in Fiscal 2021 was ₹579.38 million, while profit before tax was ₹641.78
million. The difference was attributable to depreciation and amortization expenses of ₹147.49 million, loss on sale and write
off of property, plant and equipment of ₹10.30 million, provision for doubtful receivables of ₹7.84 million, interest expense of
₹7.77 million and bad debts written off of ₹1.58 million. These were partially offset by gain on sale of investments (measured
at FVTPL) of ₹18.08 million, changes in fair value of financial assets of ₹9.43 million, interest income of ₹7.05 million, reversal
of loss allowance on financial assets of ₹3.95 million, unrealised foreign exchange gain (net) of ₹0.49 million and liability no
longer required (written back) of ₹0.28 million. Further there were also working capital adjustments/ changes in operating assets
and liabilities for provisions of ₹3.34 million, trade payables of ₹39.77 million, financial liabilities of ₹101.22 million, other
non-financial liabilities of ₹16.69 million, loans of ₹(0.21) million and financial assets of ₹3.45 million. These were offset by
adjustment for changes in trade receivables of ₹144.75 million, inventories of ₹54.72 million and non-financial assets of ₹16.89
million. There was also income tax paid (net of refunds) of ₹145.98 million.
Fiscal 2020
Net cash flow generated from operating activities in Fiscal 2020 was ₹582.67 million, while profit before tax was ₹543.50
million. The difference was attributable to depreciation and amortization expenses of ₹127.69 million, interest expense of
₹14.90 million, loss allowances on financial assets (net) of ₹4.13 million, bad debt written off of ₹1.49 million and loss on sale
and write off of property, plant and equipment of ₹1.32 million. These were partially offset by dividend income of ₹30.05
million, unrealized foreign exchange gain (net) of ₹8.16 million, liability no longer required (written back) of ₹3.27 million,
gain on sale of investments (measured at FVTPL) of ₹0.79 million, changes in fair value of financial assets of ₹0.75 million
and interest income of ₹0.64 million. Further there were also working capital adjustments/ changes in operating assets and
liabilities for trade payables of ₹111.11 million, trade receivables of ₹8.47 million and loans of ₹0.17 million. These were offset
by adjustment for changes in inventories of ₹30.49 million, non-financial assets of ₹23.93 million, provisions of ₹1.23 million,
other non-financial liabilities of ₹4.15 million, financial liabilities of ₹23.09 million, financial assets of ₹3.87 million. There
was also income tax paid (net of refunds) of ₹99.69 million.
Fiscal 2019
Net cash flow generated from operating activities in Fiscal 2019 was ₹358.27 million, while profit before tax was ₹529.60
million. The difference was attributable to depreciation and amortization expenses of ₹96.96 million, interest expense of ₹16.63
million, loss on sale and write off of property, plant and equipment of ₹2.83 million, bad debt written off of ₹2.49 million,
unrealized foreign exchange loss (net) of ₹1.10 million, loss on sale of investments (measured at FVTPL) of ₹0.70 million and
loss allowances on financial assets (net) of ₹0.42 million. These were partially offset by dividend income of ₹24.42 million,
liability no longer required (written back) of ₹2.09 million, interest income of ₹0.20 million and changes in fair value of
financial assets of ₹0.08 million. Further there were also working capital adjustments/ changes in operating assets and liabilities
for trade receivables of ₹22.99 million, other non-financial liabilities of ₹4.82 million, and non-financial assets of ₹0.08 million.
These were offset by adjustment for changes in trade payables of ₹104.02 million, financial liabilities of ₹0.56 million,
provisions of ₹2.22 million, loans of ₹0.50 million, and inventories of ₹1.98 million. There was also income tax paid (net of
refunds) of ₹185.99 million.
Cash flows from investing activities
Three month period ended June 30, 2021
Net cash flow used in investing activities in the three month period ended June 30, 2021 was ₹251.44 million, which reflected
payment for acquisition of subsidiary of ₹640.00 million, investment in mutual funds of ₹394.98 million, investment in term
deposits of ₹163.24 million and purchase of property, plant and equipment and intangible assets of ₹21.66 million. These were
partially offset by proceeds from sale of mutual funds of ₹803.95 million, maturity of term deposits of ₹159.93 million and
interest received on deposits of ₹4.56 million.
Fiscal 2021
Net cash flow used in investing activities in Fiscal 2021 was ₹374.49 million, which reflected investment in mutual funds of
₹1,735.53 million, investment in term deposits of ₹224.56 million, purchase of property, plant and equipment and intangible
assets of ₹99.65 million, payment for acquisition of business of ₹25.00 million and purchase of right to use asset of ₹2.39
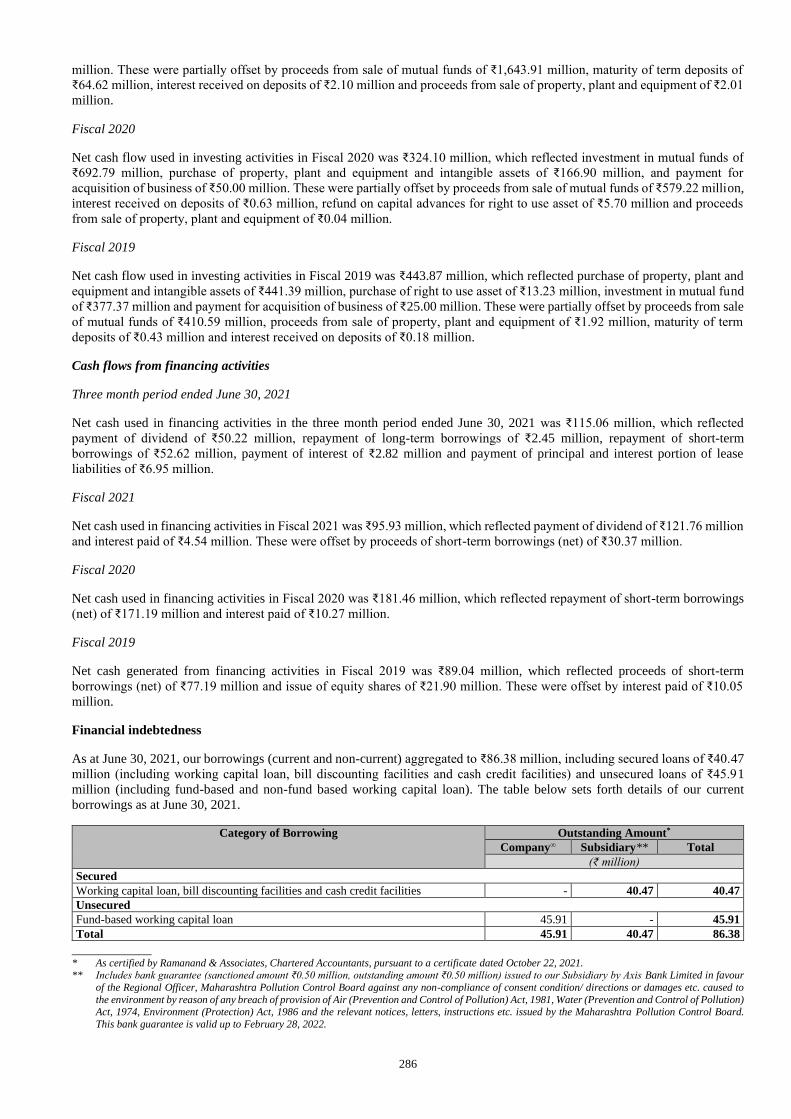
286
million. These were partially offset by proceeds from sale of mutual funds of ₹1,643.91 million, maturity of term deposits of
₹64.62 million, interest received on deposits of ₹2.10 million and proceeds from sale of property, plant and equipment of ₹2.01
million.
Fiscal 2020
Net cash flow used in investing activities in Fiscal 2020 was ₹324.10 million, which reflected investment in mutual funds of
₹692.79 million, purchase of property, plant and equipment and intangible assets of ₹166.90 million, and payment for
acquisition of business of ₹50.00 million. These were partially offset by proceeds from sale of mutual funds of ₹579.22 million,
interest received on deposits of ₹0.63 million, refund on capital advances for right to use asset of ₹5.70 million and proceeds
from sale of property, plant and equipment of ₹0.04 million.
Fiscal 2019
Net cash flow used in investing activities in Fiscal 2019 was ₹443.87 million, which reflected purchase of property, plant and
equipment and intangible assets of ₹441.39 million, purchase of right to use asset of ₹13.23 million, investment in mutual fund
of ₹377.37 million and payment for acquisition of business of ₹25.00 million. These were partially offset by proceeds from sale
of mutual funds of ₹410.59 million, proceeds from sale of property, plant and equipment of ₹1.92 million, maturity of term
deposits of ₹0.43 million and interest received on deposits of ₹0.18 million.
Cash flows from financing activities
Three month period ended June 30, 2021
Net cash used in financing activities in the three month period ended June 30, 2021 was ₹115.06 million, which reflected
payment of dividend of ₹50.22 million, repayment of long-term borrowings of ₹2.45 million, repayment of short-term
borrowings of ₹52.62 million, payment of interest of ₹2.82 million and payment of principal and interest portion of lease
liabilities of ₹6.95 million.
Fiscal 2021
Net cash used in financing activities in Fiscal 2021 was ₹95.93 million, which reflected payment of dividend of ₹121.76 million
and interest paid of ₹4.54 million. These were offset by proceeds of short-term borrowings (net) of ₹30.37 million.
Fiscal 2020
Net cash used in financing activities in Fiscal 2020 was ₹181.46 million, which reflected repayment of short-term borrowings
(net) of ₹171.19 million and interest paid of ₹10.27 million.
Fiscal 2019
Net cash generated from financing activities in Fiscal 2019 was ₹89.04 million, which reflected proceeds of short-term
borrowings (net) of ₹77.19 million and issue of equity shares of ₹21.90 million. These were offset by interest paid of ₹10.05
million.
Financial indebtedness
As at June 30, 2021, our borrowings (current and non-current) aggregated to ₹86.38 million, including secured loans of ₹40.47
million (including working capital loan, bill discounting facilities and cash credit facilities) and unsecured loans of ₹45.91
million (including fund-based and non-fund based working capital loan). The table below sets forth details of our current
borrowings as at June 30, 2021.
Category of Borrowing Outstanding Amount*
Company∞ Subsidiary** Total
(₹ million)
Secured
Working capital loan, bill discounting facilities and cash credit facilities - 40.47 40.47
Unsecured
Fund-based working capital loan 45.91 - 45.91
Total 45.91 40.47 86.38
____________ * As certified by Ramanand & Associates, Chartered Accountants, pursuant to a certificate dated October 22, 2021. ** Includes bank guarantee (sanctioned amount ₹0.50 million, outstanding amount ₹0.50 million) issued to our Subsidiary by Axis Bank Limited in favour
of the Regional Officer, Maharashtra Pollution Control Board against any non-compliance of consent condition/ directions or damages etc. caused to
the environment by reason of any breach of provision of Air (Prevention and Control of Pollution) Act, 1981, Water (Prevention and Control of Pollution) Act, 1974, Environment (Protection) Act, 1986 and the relevant notices, letters, instructions etc. issued by the Maharashtra Pollution Control Board.
This bank guarantee is valid up to February 28, 2022.
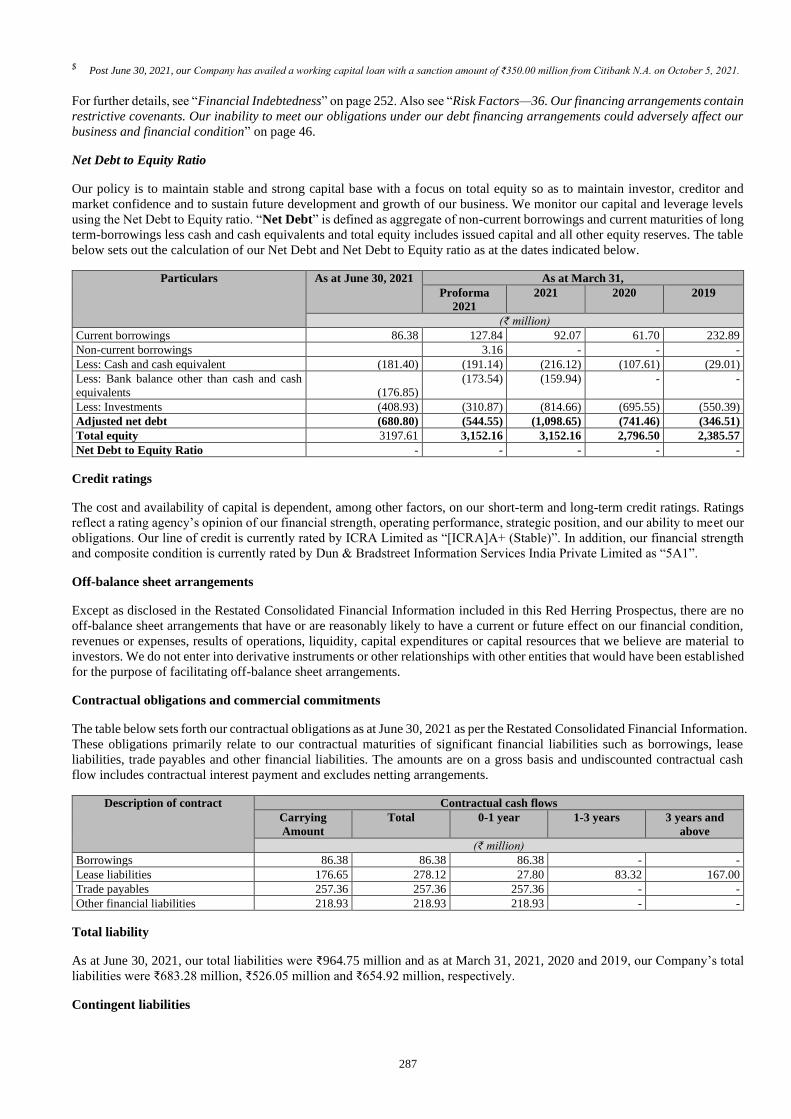
287
$ Post June 30, 2021, our Company has availed a working capital loan with a sanction amount of ₹350.00 million from Citibank N.A. on October 5, 2021.
For further details, see “Financial Indebtedness” on page 252. Also see “Risk Factors—36. Our financing arrangements contain
restrictive covenants. Our inability to meet our obligations under our debt financing arrangements could adversely affect our
business and financial condition” on page 46.
Net Debt to Equity Ratio
Our policy is to maintain stable and strong capital base with a focus on total equity so as to maintain investor, creditor and
market confidence and to sustain future development and growth of our business. We monitor our capital and leverage levels
using the Net Debt to Equity ratio. “Net Debt” is defined as aggregate of non-current borrowings and current maturities of long
term-borrowings less cash and cash equivalents and total equity includes issued capital and all other equity reserves. The table
below sets out the calculation of our Net Debt and Net Debt to Equity ratio as at the dates indicated below.
Particulars As at June 30, 2021 As at March 31,
Proforma
2021
2021 2020 2019
(₹ million)
Current borrowings 86.38 127.84 92.07 61.70 232.89
Non-current borrowings 3.16 - - -
Less: Cash and cash equivalent (181.40) (191.14) (216.12) (107.61) (29.01)
Less: Bank balance other than cash and cash
equivalents (176.85)
(173.54) (159.94) - -
Less: Investments (408.93) (310.87) (814.66) (695.55) (550.39)
Adjusted net debt (680.80) (544.55) (1,098.65) (741.46) (346.51)
Total equity 3197.61 3,152.16 3,152.16 2,796.50 2,385.57
Net Debt to Equity Ratio - - - - -
Credit ratings
The cost and availability of capital is dependent, among other factors, on our short-term and long-term credit ratings. Ratings
reflect a rating agency’s opinion of our financial strength, operating performance, strategic position, and our ability to meet our
obligations. Our line of credit is currently rated by ICRA Limited as “[ICRA]A+ (Stable)”. In addition, our financial strength
and composite condition is currently rated by Dun & Bradstreet Information Services India Private Limited as “5A1”.
Off-balance sheet arrangements
Except as disclosed in the Restated Consolidated Financial Information included in this Red Herring Prospectus, there are no
off-balance sheet arrangements that have or are reasonably likely to have a current or future effect on our financial condition,
revenues or expenses, results of operations, liquidity, capital expenditures or capital resources that we believe are material to
investors. We do not enter into derivative instruments or other relationships with other entities that would have been established
for the purpose of facilitating off-balance sheet arrangements.
Contractual obligations and commercial commitments
The table below sets forth our contractual obligations as at June 30, 2021 as per the Restated Consolidated Financial Information.
These obligations primarily relate to our contractual maturities of significant financial liabilities such as borrowings, lease
liabilities, trade payables and other financial liabilities. The amounts are on a gross basis and undiscounted contractual cash
flow includes contractual interest payment and excludes netting arrangements.
Description of contract Contractual cash flows
Carrying
Amount
Total 0-1 year 1-3 years 3 years and
above
(₹ million)
Borrowings 86.38 86.38 86.38 - -
Lease liabilities 176.65 278.12 27.80 83.32 167.00
Trade payables 257.36 257.36 257.36 - -
Other financial liabilities 218.93 218.93 218.93 - -
Total liability
As at June 30, 2021, our total liabilities were ₹964.75 million and as at March 31, 2021, 2020 and 2019, our Company’s total
liabilities were ₹683.28 million, ₹526.05 million and ₹654.92 million, respectively.
Contingent liabilities
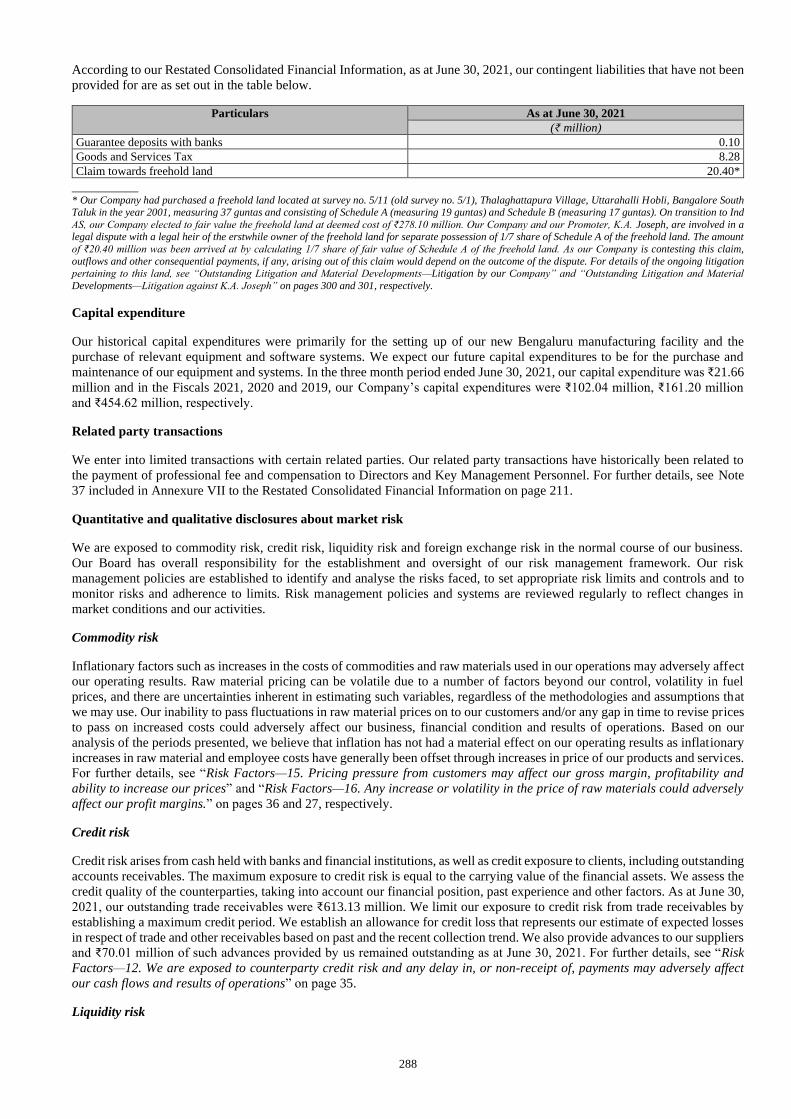
288
According to our Restated Consolidated Financial Information, as at June 30, 2021, our contingent liabilities that have not been
provided for are as set out in the table below.
Particulars As at June 30, 2021
(₹ million)
Guarantee deposits with banks 0.10
Goods and Services Tax 8.28
Claim towards freehold land 20.40*
__________ * Our Company had purchased a freehold land located at survey no. 5/11 (old survey no. 5/1), Thalaghattapura Village, Uttarahalli Hobli, Bangalore South Taluk in the year 2001, measuring 37 guntas and consisting of Schedule A (measuring 19 guntas) and Schedule B (measuring 17 guntas). On transition to Ind
AS, our Company elected to fair value the freehold land at deemed cost of ₹278.10 million. Our Company and our Promoter, K.A. Joseph, are involved in a legal dispute with a legal heir of the erstwhile owner of the freehold land for separate possession of 1/7 share of Schedule A of the freehold land. The amount
of ₹20.40 million was been arrived at by calculating 1/7 share of fair value of Schedule A of the freehold land. As our Company is contesting this claim,
outflows and other consequential payments, if any, arising out of this claim would depend on the outcome of the dispute. For details of the ongoing litigation pertaining to this land, see “Outstanding Litigation and Material Developments—Litigation by our Company” and “Outstanding Litigation and Material
Developments—Litigation against K.A. Joseph” on pages 300 and 301, respectively.
Capital expenditure
Our historical capital expenditures were primarily for the setting up of our new Bengaluru manufacturing facility and the
purchase of relevant equipment and software systems. We expect our future capital expenditures to be for the purchase and
maintenance of our equipment and systems. In the three month period ended June 30, 2021, our capital expenditure was ₹21.66
million and in the Fiscals 2021, 2020 and 2019, our Company’s capital expenditures were ₹102.04 million, ₹161.20 million
and ₹454.62 million, respectively.
Related party transactions
We enter into limited transactions with certain related parties. Our related party transactions have historically been related to
the payment of professional fee and compensation to Directors and Key Management Personnel. For further details, see Note
37 included in Annexure VII to the Restated Consolidated Financial Information on page 211.
Quantitative and qualitative disclosures about market risk
We are exposed to commodity risk, credit risk, liquidity risk and foreign exchange risk in the normal course of our business.
Our Board has overall responsibility for the establishment and oversight of our risk management framework. Our risk
management policies are established to identify and analyse the risks faced, to set appropriate risk limits and controls and to
monitor risks and adherence to limits. Risk management policies and systems are reviewed regularly to reflect changes in
market conditions and our activities.
Commodity risk
Inflationary factors such as increases in the costs of commodities and raw materials used in our operations may adversely affect
our operating results. Raw material pricing can be volatile due to a number of factors beyond our control, volatility in fuel
prices, and there are uncertainties inherent in estimating such variables, regardless of the methodologies and assumptions that
we may use. Our inability to pass fluctuations in raw material prices on to our customers and/or any gap in time to revise prices
to pass on increased costs could adversely affect our business, financial condition and results of operations. Based on our
analysis of the periods presented, we believe that inflation has not had a material effect on our operating results as inflationary
increases in raw material and employee costs have generally been offset through increases in price of our products and services.
For further details, see “Risk Factors—15. Pricing pressure from customers may affect our gross margin, profitability and
ability to increase our prices” and “Risk Factors—16. Any increase or volatility in the price of raw materials could adversely
affect our profit margins.” on pages 36 and 27, respectively.
Credit risk
Credit risk arises from cash held with banks and financial institutions, as well as credit exposure to clients, including outstanding
accounts receivables. The maximum exposure to credit risk is equal to the carrying value of the financial assets. We assess the
credit quality of the counterparties, taking into account our financial position, past experience and other factors. As at June 30,
2021, our outstanding trade receivables were ₹613.13 million. We limit our exposure to credit risk from trade receivables by
establishing a maximum credit period. We establish an allowance for credit loss that represents our estimate of expected losses
in respect of trade and other receivables based on past and the recent collection trend. We also provide advances to our suppliers
and ₹70.01 million of such advances provided by us remained outstanding as at June 30, 2021. For further details, see “Risk
Factors—12. We are exposed to counterparty credit risk and any delay in, or non-receipt of, payments may adversely affect
our cash flows and results of operations” on page 35.
Liquidity risk
289
Our management monitors rolling forecast of our liquidity position and cash and cash equivalents on the basis of expected cash
flows. In addition, our liquidity management policy involves projecting cash flows and considering the level of liquid assets
necessary to meet these, monitoring balance sheet liquidity ratios against internal and external regulatory requirements and
maintaining debt financing plans.
Market risk
Market risk is the risk that changes in market prices, such as foreign exchange rates, interest rates and equity prices will affect
our income or the value of our holdings of financial instruments. Market risk is attributable to all market risk sensitive financial
instruments including foreign currency receivables and payables and long term debt. The objective of market risk management
is to manage and control market risk exposures within acceptable parameters, while optimizing the return.
Currency risk
We are exposed to currency risk to the extent that there is a mismatch between the currencies in which sales, purchases and
borrowings are denominated and our functional currency. We have not entered into any hedging arrangements to help mitigate
the effects of fluctuations in exchange rates to the extent we are unable to match any foreign exchange expenses with earnings.
Our management monitors the movement in foreign currency and our exposure in each of the foreign currency. For further
details, see “Risk Factors—26. We are exposed to risks relating to fluctuations in foreign currency exchange rates” on page 35.
Interest rate risk
Interest rate risk is the risk that the fair value or future cash flows of a financial instrument will fluctuate because of changes in
market interest rates. As we do not have any floating interest rate borrowings or deposits, it is not exposed to interest rate risk.
Other qualitative factors
Dependence on a few customers
See “Risk Factors —4. Loss of any of our key customers or significant reduction in production and sales of, or demand for our
products from, our significant customers may materially and adversely affect our business and financial performance” on page
28 and “Risk Factors—5. We depend significantly on customers in the automotive industry and consumer appliance industry
and a decline in their performance, in India or globally, could adversely affect our business and profitability” on page 29.
Unusual or infrequent events of transactions
Except as described in this Red Herring Prospectus, there have been no other events or transactions that, to our knowledge, may
be described as “unusual” or “infrequent”.
Known trends or uncertainties
Our business has been affected and we expect will continue to be affected by the trends identified above in the heading
titled “Principal Factors Affecting Our Financial Condition and Results of Operations” on page 260 and the uncertainties
described in the section titled “Risk Factors” beginning on page 25. To our knowledge, except as described or anticipated in
this Red Herring Prospectus, there are no known factors which we expect will have a material adverse impact on our revenues
or income from continuing operations.
Future relationship between cost and income
Other than as described in this Red Herring Prospectus, including disclosure regarding the impact of COVID-19 on
our operations, to the knowledge of our management, there are no known factors that might affect the future relationship
between costs and revenues.
New products or business segments
Other than as described in “Our Business—Our Business Strategy” on page 120, there are no new products or business segments
in which we operate.
Seasonality of business
Our business is subject to seasonal variations due to the seasonal nature of automotive sales and production. See “Risk Factors—
21. The cyclical and seasonal nature of automotive sales and production could adversely affect our business.” on page 39.
290
Significant economic changes
We have evaluated the possible effects that may result from the COVID-19 pandemic on the carrying amounts of our assets
and liabilities and our internal financial controls. We have considered internal and external sources of information as at the date
of approval of the Restated Consolidated Financial Information in determining the possible impact, if any, of the resurgence of
the COVID-19 pandemic on the carrying amounts of its trade receivables, inventories, financial and non-financial assets. We
have been prudent in applying judgments and making estimates. Based on its evaluation, we do not expect any material impact
on the Restated Consolidated Financial Information; however, the eventual outcome of impact of COVID-19 pandemic may be
different from those estimated on the date of its approval as the COVID-19 situation evolves in India and globally. We will
continue to closely monitor any material changes to future economic conditions.
Other than as described above and under the headings titled “Our Business—Impact of the COVID-19 pandemic”, “—
Principal Factors Affecting Our Financial Condition and Results of Operations—The impact of COVID-19” and “Risk
Factors—3. The coronavirus disease (COVID-19) and the measures taken by the government to curb its spread could materially
and adversely affect our business, financial condition and results of operations. The extent to which the COVID-19 pandemic
will impact our business, operations and financial performance is uncertain and cannot be predicted.” on pages 146, 250 and
26, respectively, to the knowledge of our management, there are no other significant economic changes that materially affect
or are likely to affect income from continuing operations.
Qualifications by the Statutory Auditors which have not been given effect to in the Restated Consolidated Financial
Information
There are no qualifications by the Statutory Auditors which have not been given effect to in the Restated Consolidated Financial
Information. For details in relation to statements or comments included in the Companies (Auditor’s Report) Order, 2016 which
do not require any adjustments in the Restated Consolidated Financial Information, please refer to “Restated Consolidated
Financial Information—Annexure VI-Part A: Restatement adjustment to audited financial statement—Non-adjusting items” on
page 208.
Significant developments after June 30, 2021
Declaration of interim dividend of ₹60.88 million, i.e., ₹2.00 per Equity Share pursuant to meeting of the board of directors
held on September 24, 2021: See “Dividend Policy” on page 182.
Impact of COVID-19 pandemic on our business and operations: See “—Significant Economic Changes” on page 290.
Except as stated above and in this Red Herring Prospectus, to our knowledge, no circumstances have arisen since the date of
the Restated Consolidated Financial Information as disclosed in this Red Herring Prospectus which materially and adversely
affect or are likely to affect our operations or profitability, or the value of our assets or our ability to pay our material liabilities
within the next 12 months.

291
SECTION VI: PROFORMA CONDENSED CONSOLIDATED FINANCIAL INFORMATION
(The remainder of this page is intentionally left blank)

INDEPENDENT AUDITOR’S ASSURANCE REPORT ON THE COMPILATION OF
PROFORMA CONDENSED CONSOLIDATED FINANCIAL INFORMATION INCLUDED IN
THE RED HERRING PROSPECTUS AND PROSPECTUS
The Board of Directors
S.J.S Enterprises Limited
(formerly known as S.J.S Enterprises Private Limited)
Sy. Nos- 28/P 16 Agra Village and
Sy. Nos 85/P6 BM Kaval Village
Kengeri Hobli,
Bengaluru 560 082
Karnataka, India.
11 October 2021
Report on the compilation of Proforma Condensed Consolidated Financial Information included
in the Red Herring Prospectus and Prospectus prepared by S.J.S. Enterprises Limited
1. We have completed our assurance engagement to report on the compilation of proforma condensed
consolidated financial information of S.J.S Enterprises Limited (formerly known as S.J.S Enterprises
Private Limited) (the “ Company”) prepared by the management of the Company (the
“Management”). The proforma condensed consolidated financial information consists of the
proforma condensed consolidated balance sheet as at 31 March 2021, the proforma condensed
consolidated statement of profit and loss ( including other comprehensive income) for the year ended
31 March 2021 and select explanatory notes (collectively, the “Proforma Condensed Consolidated
Financial Information”), as set out in the Red Herring Prospectus (the “RHP”, and together with the
prospectus referred to as the “Offer Documents” and each an “Offer Document”) and prospectus
prepared by the Company in connection with its proposed Initial Public Offer of equity shares
(“IPO”). The applicable criteria on the basis of which the management of Company has compiled
the Proforma Condensed Consolidated Financial Information are specified in clause (11)(I)(B)(iii)
of Part A of Schedule VI Securities and Exchange Board of India (Issue of Capital and Disclosure
Requirements) Regulations, 2018, as amended to date (the “ICDR Regulations”) issued by
Securities and Exchange Board of India (the “SEBI”) and described in note 2 of the Proforma
Condensed Consolidated Financial Information. Because of its nature, the Proforma Condensed
Consolidated Financial Information does not represent the Company’s actual financial position and
financial performance.
292
2. The Proforma Condensed Consolidated Financial Information has been compiled by the
Management to illustrate the impact of the acquisition of Exotech Plastics Private Limited (“EPPL”)
set out in note 2 of the Proforma Condensed Consolidated Financial Information on the Company’s
financial position as at 31 March 2021 and the Company’s financial performance for the year ended
31 March 2021 as if the acquisition had taken place as at and for the year ended 31 March 2021. As
part of this process, information about the Company’s financial position, financial performance has
been extracted by the Management from the Company’s restated financial statements for the year
ended 31 March 2021. Information about EPPL has been extracted and compiled by the Company
from the audited financial statements of EPPL as at and for the year ended 31 March 2021 prepared
in accordance with the accounting principles generally accepted in India, including the Indian
Accounting Standards (“Ind AS”) specified under Section 133 of the Companies Act 2013, as
amended (the “Act”)
Management’s Responsibility for the Proforma Condensed Consolidated Financial Information
3. Management is responsible for compiling the Proforma Condensed Consolidated Financial
Information on the basis as set out in note 2 to the Proforma Condensed Consolidated Financial
Information which has been approved by the board of directors of the Company (the “Board”) on
19 July 2021. This responsibility includes the responsibility for designing, implementing and
maintaining internal control relevant for compiling the Proforma Condensed Consolidated Financial
Information on the basis as set out in note 2 to the Proforma Condensed Consolidated Financial
Information that is free from material misstatement, whether due to fraud or error. The Management
is also responsible for identifying and ensuring that the Company complies with the laws and
regulations applicable to its activities, including compliance with the provisions of the laws and
regulations for the compilation of Proforma Condensed Consolidated Financial Information.
Auditor’s Responsibilities
4. Our responsibility is to express an opinion, as required by ICDR Regulations, about whether the
Proforma Condensed Consolidated Financial Information has been compiled, in all material
respects, by the management on the basis as set out in note 2 to the Proforma Condensed
Consolidated Financial Information.
5. We conducted our engagement in accordance with Standard on Assurance Engagements (SAE)
3420, Assurance Engagements to Report on the Compilation of Pro Forma Financial Information
Included in a Prospectus, issued by the Institute of Chartered Accountants of India (“ICAI”). This
Standard requires that the Auditor comply with ethical requirements and plan and perform
procedures to obtain reasonable assurance about whether the management has compiled, in all
material respects, the proforma condensed consolidated financial information on the basis set out in
note 2 to the Proforma Condensed Consolidated Financial Information.
6. For purposes of this engagement, we are not responsible for updating or reissuing any reports or
opinions on any historical financial information used in compiling the Proforma Condensed
Consolidated Financial Information, nor have we, in the course of this engagement, performed an
293

audit or review of the financial information used in compiling the Proforma Condensed Consolidated
Financial Information.
7. Our work has not been carried out in accordance with the auditing or other standards and practices
generally accepted in other jurisdictions and accordingly should not be relied upon as if it had been
carried out in accordance with those standards and practices. Our work was performed solely to
assist you in meeting your responsibilities in relation to your compliance with the ICDR Regulations
in connection with the proposed IPO.
8. The purpose of the Proforma Condensed Consolidated Financial Information included in the Offer
Document is solely to illustrate the impact of the above mentioned acquisition of EPPL on
unadjusted restated financial information of the Company as if the acquisition of EPPL had occurred
at an earlier date selected for purposes of the illustration. Accordingly, we do not provide any
assurance that the actual outcome of the above mentioned acquisition as at and for the year ended
31 March 2021 would have been as presented.
9. A reasonable assurance engagement is to report on whether the Proforma Condensed Consolidated
Financial Information has been compiled, in all material respects, on the basis of the applicable
criteria involves performing procedures to assess whether the applicable criteria used by the
Management in the compilation of the Proforma Condensed Consolidated Financial Information
provide a reasonable basis for presenting the significant effects directly attributable to the above
mentioned acquisition, and to obtain sufficient appropriate evidence about whether:
The related proforma adjustments give appropriate effect to those criteria; and
The Proforma Condensed Consolidated Financial Information reflects the proper
application of those adjustments to the unadjusted financial information.
10. The procedures selected depend on the Auditor’s judgement, having regard to the Auditor’s
understanding of the nature of the Company, the event or transaction in respect of which the
Proforma Condensed Consolidated Financial Information has been compiled, and other relevant
engagement circumstances.
11. This report should not in any way be construed as re-issuance or re-dating of any of the previous
audit reports issued by us on the financial statements of the Company or EPPL, as the case may be
referred in paragraph 2 above. We have no responsibility to update our report for events and
circumstances occurring after the date of the report.
12. The engagement also involves evaluating the overall presentation of the Proforma Condensed
Consolidated Financial Information.
13. We believe that the evidence we have obtained is sufficient and appropriate to provide a basis for
our opinion.
Opinion
14. In our opinion, the Proforma Condensed Consolidated Financial Information has been compiled, in
all material respects, on the basis set out in note 2 of the Proforma Condensed Consolidated Financial
Information.
294
Restriction of use
15. Our report is intended solely for use of the Board of Directors for inclusion in the Offer Documents
in connection with the proposed IPO. Our report should not be used, referred to, or distributed for
any other purpose except with our prior consent in writing. The Proforma Condensed Consolidated
Financial Information is not a complete set of financial statements of the Company prepared in
accordance with the Ind AS prescribed under Section 133 of the Act, as applicable and is not
intended to give a true and fair view of the financial position of the Company as at 31 March, 2021,
and of its financial performance (including other comprehensive income) for the year ended 31
March, 2021 in accordance with the Ind AS prescribed under Section 133 of the Act, as applicable.
As a result, this Proforma Condensed Consolidated Financial Information may not be suitable for
any other purpose. Accordingly, we do not accept or assume any liability or any duty of care for any
other purpose or to any other person to whom this report is shown or into whose hands it may come
without our prior consent in writing.
for B S R & Co. LLP
Chartered Accountants
ICAI Firm Registration Number: 101248W/W-100022
Umang Banka
Partner
Membership Number: 223018
ICAI UDIN: 21223018AAAADB7900
Place: Bengaluru
Date: 11 October 2021
295
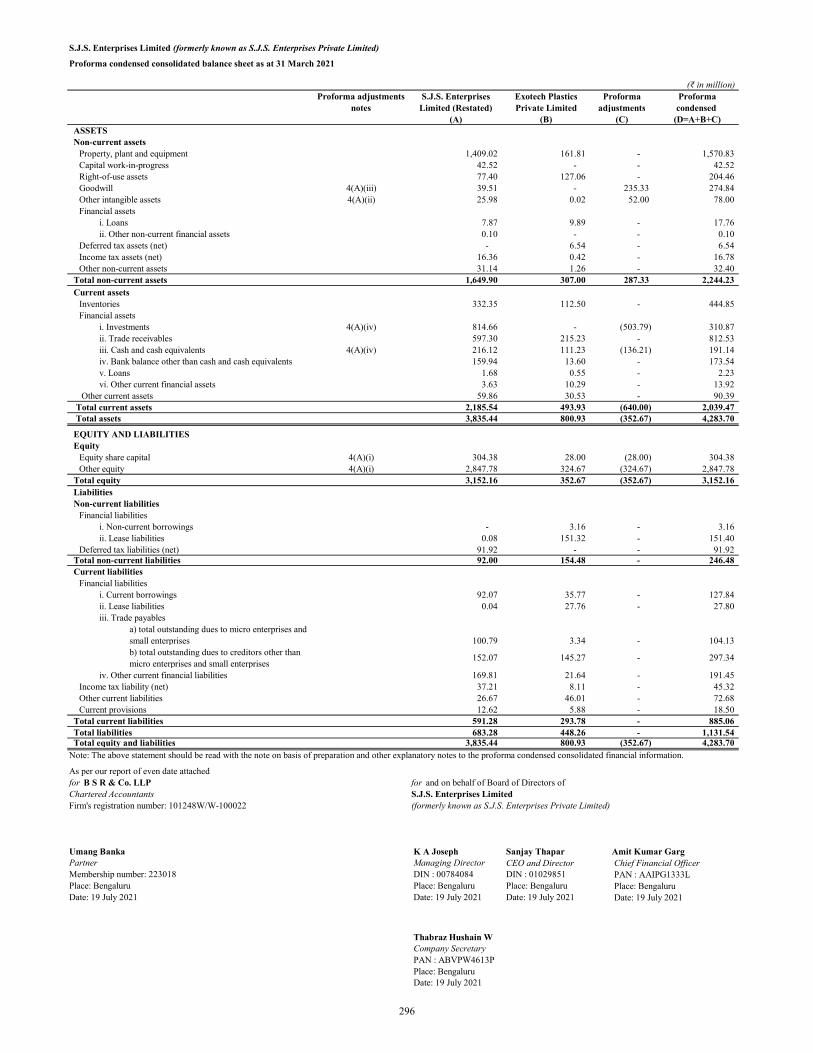
S.J.S. Enterprises Limited (formerly known as S.J.S. Enterprises Private Limited)
Proforma condensed consolidated balance sheet as at 31 March 2021
(₹ in million)S.J.S. Enterprises
Limited (Restated)Exotech Plastics Private Limited
Proforma adjustments
Proforma condensed
(A) (B) (C) (D=A+B+C) ASSETS Non-current assets
Property, plant and equipment 1,409.02 161.81 - 1,570.83 Capital work-in-progress 42.52 - - 42.52 Right-of-use assets 77.40 127.06 - 204.46 Goodwill 4(A)(iii) 39.51 - 235.33 274.84 Other intangible assets 4(A)(ii) 25.98 0.02 52.00 78.00 Financial assets
i. Loans 7.87 9.89 - 17.76 ii. Other non-current financial assets 0.10 - - 0.10
Deferred tax assets (net) - 6.54 - 6.54 Income tax assets (net) 16.36 0.42 - 16.78 Other non-current assets 31.14 1.26 - 32.40
Total non-current assets 1,649.90 307.00 287.33 2,244.23 Current assets
Inventories 332.35 112.50 - 444.85 Financial assets
i. Investments 4(A)(iv) 814.66 - (503.79) 310.87 ii. Trade receivables 597.30 215.23 - 812.53 iii. Cash and cash equivalents 4(A)(iv) 216.12 111.23 (136.21) 191.14 iv. Bank balance other than cash and cash equivalents 159.94 13.60 - 173.54 v. Loans 1.68 0.55 - 2.23 vi. Other current financial assets 3.63 10.29 - 13.92
Other current assets 59.86 30.53 - 90.39 Total current assets 2,185.54 493.93 (640.00) 2,039.47 Total assets 3,835.44 800.93 (352.67) 4,283.70
EQUITY AND LIABILITIES Equity
Equity share capital 4(A)(i) 304.38 28.00 (28.00) 304.38 Other equity 4(A)(i) 2,847.78 324.67 (324.67) 2,847.78
Total equity 3,152.16 352.67 (352.67) 3,152.16 Liabilities Non-current liabilities
Financial liabilitiesi. Non-current borrowings - 3.16 - 3.16 ii. Lease liabilities 0.08 151.32 - 151.40
Deferred tax liabilities (net) 91.92 - - 91.92 Total non-current liabilities 92.00 154.48 - 246.48 Current liabilities
Financial liabilitiesi. Current borrowings 92.07 35.77 - 127.84 ii. Lease liabilities 0.04 27.76 - 27.80 iii. Trade payables
a) total outstanding dues to micro enterprises and small enterprises 100.79 3.34 - 104.13 b) total outstanding dues to creditors other than micro enterprises and small enterprises
152.07 145.27 - 297.34
iv. Other current financial liabilities 169.81 21.64 - 191.45 Income tax liability (net) 37.21 8.11 - 45.32 Other current liabilities 26.67 46.01 - 72.68 Current provisions 12.62 5.88 - 18.50
Total current liabilities 591.28 293.78 - 885.06 Total liabilities 683.28 448.26 - 1,131.54 Total equity and liabilities 3,835.44 800.93 (352.67) 4,283.70
As per our report of even date attachedfor B S R & Co. LLP for and on behalf of Board of Directors of Chartered Accountants S.J.S. Enterprises LimitedFirm's registration number: 101248W/W-100022 (formerly known as S.J.S. Enterprises Private Limited)
Umang Banka K A Joseph Sanjay Thapar Amit Kumar GargPartner Managing Director CEO and Director Membership number: 223018 DIN : 00784084 DIN : 01029851Place: Bengaluru Place: Bengaluru Place: BengaluruDate: 19 July 2021 Date: 19 July 2021 Date: 19 July 2021
Thabraz Hushain WCompany SecretaryPAN : ABVPW4613PPlace: BengaluruDate: 19 July 2021
PAN : AAIPG1333L Place: Bengaluru Date: 19 July 2021
Proforma adjustments notes
Note: The above statement should be read with the note on basis of preparation and other explanatory notes to the proforma condensed consolidated financial information.
Chief Financial Officer
296
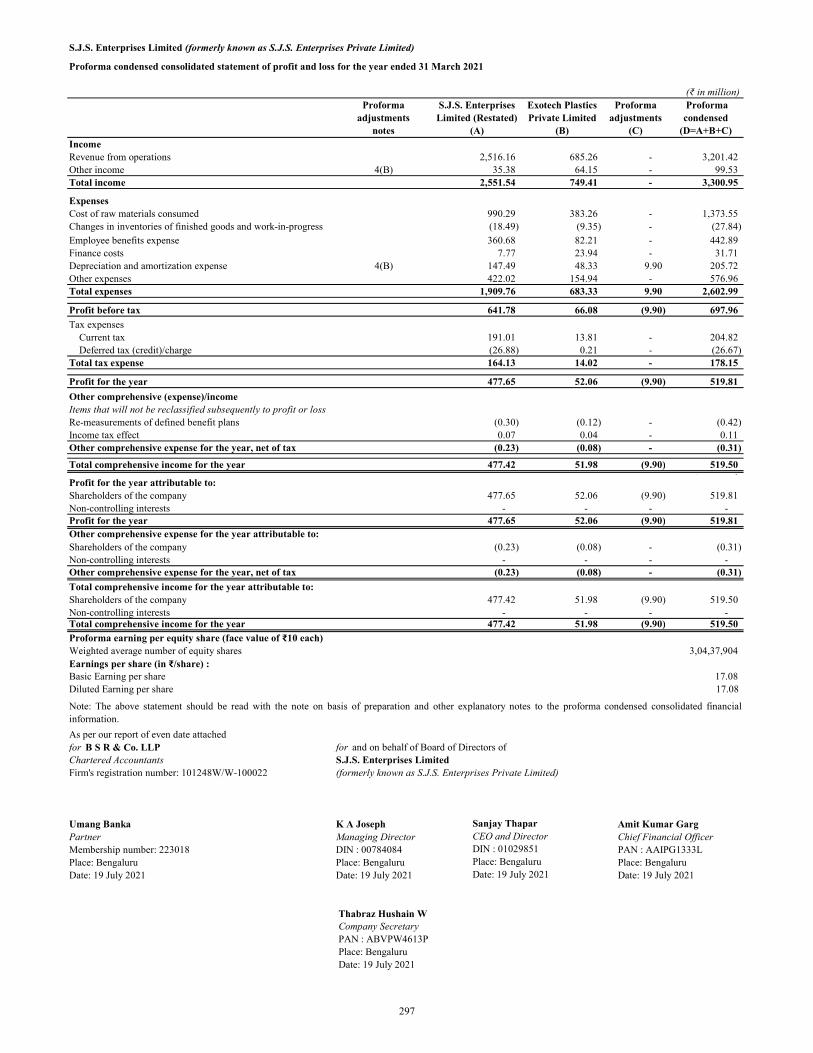
S.J.S. Enterprises Limited (formerly known as S.J.S. Enterprises Private Limited)
Proforma condensed consolidated statement of profit and loss for the year ended 31 March 2021
(₹ in million)Proforma
adjustments notes
S.J.S. Enterprises Limited (Restated)
(A)
Exotech Plastics Private Limited
(B)
Proforma adjustments
(C)
Proforma condensed
(D=A+B+C) IncomeRevenue from operations 2,516.16 685.26 - 3,201.42 Other income 4(B) 35.38 64.15 - 99.53 Total income 2,551.54 749.41 - 3,300.95
ExpensesCost of raw materials consumed 990.29 383.26 - 1,373.55 Changes in inventories of finished goods and work-in-progress (18.49) (9.35) - (27.84) Employee benefits expense 360.68 82.21 - 442.89 Finance costs 7.77 23.94 - 31.71 Depreciation and amortization expense 4(B) 147.49 48.33 9.90 205.72 Other expenses 422.02 154.94 - 576.96 Total expenses 1,909.76 683.33 9.90 2,602.99
Profit before tax 641.78 66.08 (9.90) 697.96
Tax expensesCurrent tax 191.01 13.81 - 204.82 Deferred tax (credit)/charge (26.88) 0.21 - (26.67)
Total tax expense 164.13 14.02 - 178.15
Profit for the year 477.65 52.06 (9.90) 519.81
Other comprehensive (expense)/incomeItems that will not be reclassified subsequently to profit or lossRe-measurements of defined benefit plans (0.30) (0.12) - (0.42) Income tax effect 0.07 0.04 - 0.11 Other comprehensive expense for the year, net of tax (0.23) (0.08) - (0.31)
Total comprehensive income for the year 477.42 51.98 (9.90) 519.50 (continued)Profit for the year attributable to:
Shareholders of the company 477.65 52.06 (9.90) 519.81 Non-controlling interests - - - - Profit for the year 477.65 52.06 (9.90) 519.81 Other comprehensive expense for the year attributable to: Shareholders of the company (0.23) (0.08) - (0.31) Non-controlling interests - - - - Other comprehensive expense for the year, net of tax (0.23) (0.08) - (0.31)
Total comprehensive income for the year attributable to:Shareholders of the company 477.42 51.98 (9.90) 519.50 Non-controlling interests - - - - Total comprehensive income for the year 477.42 51.98 (9.90) 519.50
Proforma earning per equity share (face value of ₹10 each)Weighted average number of equity shares 3,04,37,904 Earnings per share (in ₹/share) :Basic Earning per share 17.08 Diluted Earning per share 17.08
As per our report of even date attachedfor B S R & Co. LLP for and on behalf of Board of Directors ofChartered Accountants S.J.S. Enterprises LimitedFirm's registration number: 101248W/W-100022 (formerly known as S.J.S. Enterprises Private Limited)
Umang Banka K A Joseph Amit Kumar GargPartner Managing DirectorMembership number: 223018 DIN : 00784084Place: Bengaluru Place: BengaluruDate: 19 July 2021 Date: 19 July 2021
Thabraz Hushain WCompany SecretaryPAN : ABVPW4613PPlace: BengaluruDate: 19 July 2021
Date: 19 July 2021
Note: The above statement should be read with the note on basis of preparation and other explanatory notes to the proforma condensed consolidated financialinformation.
Chief Financial Officer PAN : AAIPG1333L Place: Bengaluru
Sanjay Thapar CEO and Director DIN : 01029851 Place: Bengaluru Date: 19 July 2021
297

S.J.S. Enterprises Limited (formerly known as S.J.S. Enterprises Private Limited)
1. Background of transaction and of entities forming part of proforma condensed consolidated financial information
2. Basis of preparation
3. Proforma adjustment related to accounting policies
4. Proforma adjustments related to acquisitionA) The following adjustments have been made to proforma condensed consolidated balance sheet:
(i) Shareholder’s funds of Exotech and the Company are as under: (₹ in million)Particulars 31 March 2021
Equity share capital
Other equity
Shareholder's funds of the Company 304.38 2,847.78 Shareholder's funds of Exotech 28.00 324.67
332.38 3,172.45
Cancellation of Equity of Exotech resulting out of proforma adjustments (28.00) (324.67) Net change in shareholder's fund (28.00) (324.67) Total shareholder's funds 304.38 2,847.78
b) the audited balance sheet and statement of profit and loss of Exotech as at and for the year ended 31 March 2021 have been prepared in accordance with IndianAccounting Standards (Ind AS) as per the Companies (Indian Accounting Standards) Rules 2015 notified under Section 133 of the Companies Act 2013 (‘the Act’)and other relevant provisions of the Act.
a) the restated statement of asset and liabilities of the Company as at 31 March 2021 and the restated statement of profit and loss of the Company for the year ended31 March 2021 prepared in accordance with SEBI Regulations.
Notes to the proforma condensed consolidated financial information as at and for the year ended 31 March 2021
S.J.S. Enterprises Limited (formerly known as S.J.S. Enterprises Private Limited) ("the Company") is a Company, incorporated and domiciled in India. TheCompany was formed as a partnership firm in 1987 and was converted to private limited company in 2005. The Company is engaged in the business ofmanufacturing self-adhesive labels like automotive dials, overlays, badges and logos for the automotive, electronics and appliances industry. The registered office ofthe Company is in Kengeri, Bengaluru, Karnataka, India.
The Company along with Exotech is hereinafter collectively referred to as the ‘Group'.
On 05 April 2021, the Company has acquired the entire equity shares from the existing equity shareholders of Exotech Plastics Private Limited ("Exotech"), acompany engaged in the business of manufacturing and supply of automobile components and other components. The Company has paid ₹640 million as aconsideration for acquisition and accordingly, Exotech has become a wholly owned subsidiary of the Company.
Exotech Plastics Private Limited ('Exotech') is a private company incorporated under the provisions of the Companies Act, 1956 on 17 July 1996. Exotech is engagedin the business of manufacturing and supply of automobile components and other components.
The proforma condensed consolidated financial information has been prepared by the management of the Company in accordance with the requirements of paragraph11 of item (I) (B) (iii) of Schedule VI of the Securities and Exchange Board of India (Issue of Capital and Disclosure Requirements) Regulations, 2018, as amendedto date (the “SEBI Regulations”) issued by the Securities and Exchange Board of India (the “SEBI”) to reflect the impact of a material acquisitions, as defined inSEBI Regulations, made after the date of the latest annual audited financial statements of the Company, viz., 31 March 2021.
c) The proforma condensed consolidated financial information does not include any adjustment for liabilities or related costs that may result from acquisition ofExotech, nor do they reflect any adjustments for potential synergies that may result from acquisition of Exotech.
The proforma condensed condolidated financial information have been compiled to reflect the respective accounting policies adopted by the Company and Exotechand hence, there are no adjustments related to uniformity of accounting policies in this proforma condensed consolidated financial information. In respect of valuationof inventories, while the Company uses weighted average cost method, Exotech uses first-in first-out method which, as per the management, reflects the appropriatevalues of inventories in line with the pattern of usage, prices of inputs prevailing in market etc.
The proforma condensed consolidated financial information of the Company comprising the proforma condensed consolidated balance sheet as at 31 March 2021, the proforma condensed consolidated statement of profit and loss for the year ended 31 March 2021, read with the selected explanatory notes to the proforma condensedconsolidated financial information (collectively "proforma condensed consolidated financial information"), has been prepared as per the requirements of SEBIRegulations to reflect acquisition of Exotech. Because of their nature, the proforma condensed consolidated financial information addresses a hypothetical situationand therefore, do not represent the Company's actual consolidated financial position as at 31 March 2021 nor does it represent the Company’s consolidated financialresults for the year ended 31 March 2021. They purport to indicate the results of operations that would have resulted had the acquisition been completed at thebeginning of the period presented and the consolidated financial position had the acquisition been completed as at the year end, but are not intended to be indicativeof expected results or operations in the future periods or the future financial position of the Company.
The proforma adjustments are based upon available information and assumptions that the management of the Company believes to be reasonable. Such proformacondensed financial information has not been prepared in accordance with standards and practices generally accepted in other jurisdictions and accordingly shouldnot be relied upon as if it had been carried out in accordance with those standards and practices. Accordingly, the degree of reliance placed by investors in otherjurisdictions on such proforma information should be even more limited.
The proforma condensed consolidated financial information prepared by the management is based on:
298
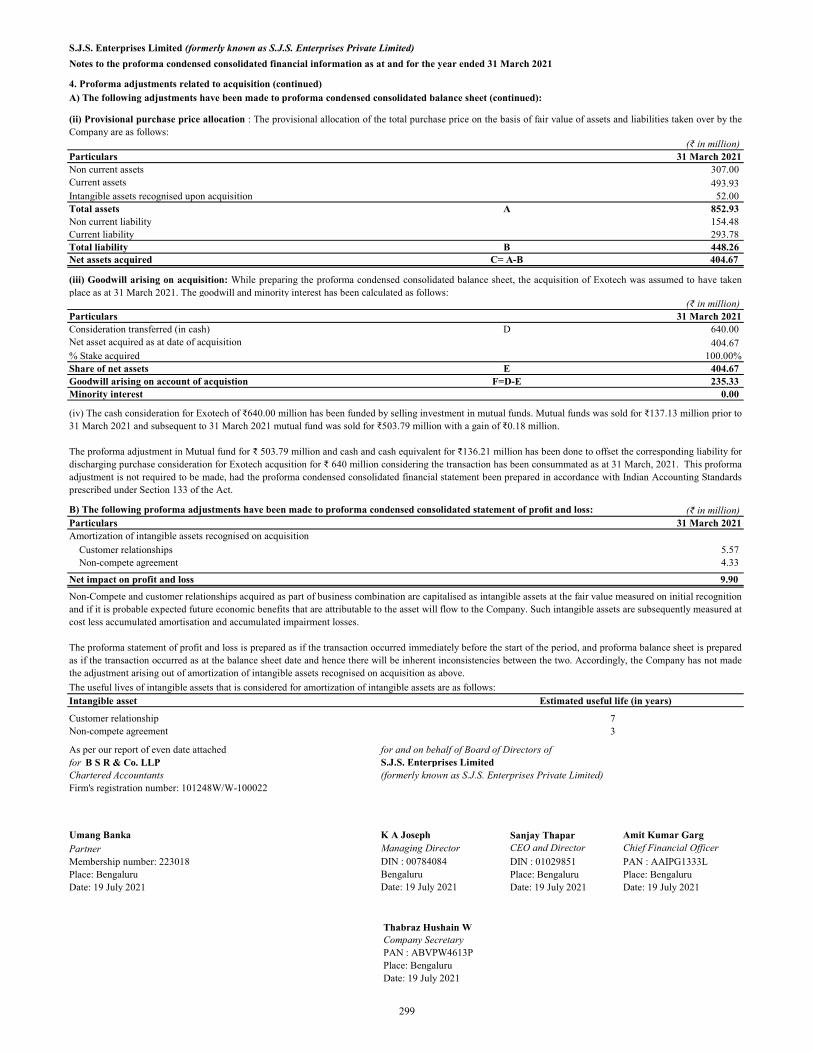
S.J.S. Enterprises Limited (formerly known as S.J.S. Enterprises Private Limited)
Notes to the proforma condensed consolidated financial information as at and for the year ended 31 March 2021
4. Proforma adjustments related to acquisition (continued)A) The following adjustments have been made to proforma condensed consolidated balance sheet (continued):
(₹ in million)Particulars 31 March 2021Non current assets 307.00 Current assets 493.93 Intangible assets recognised upon acquisition 52.00 Total assets A 852.93 Non current liability 154.48 Current liability 293.78 Total liability B 448.26 Net assets acquired C= A-B 404.67
(₹ in million)Particulars 31 March 2021Consideration transferred (in cash) D 640.00 Net asset acquired as at date of acquisition 404.67 % Stake acquired 100.00%Share of net assets E 404.67 Goodwill arising on account of acquistion F=D-E 235.33 Minority interest 0.00
B) The following proforma adjustments have been made to proforma condensed consolidated statement of profit and loss: (₹ in million)Particulars 31 March 2021Amortization of intangible assets recognised on acquisition
Customer relationships 5.57 Non-compete agreement 4.33
Net impact on profit and loss 9.90
Intangible asset Estimated useful life (in years)
Customer relationship 7Non-compete agreement 3
As per our report of even date attached for and on behalf of Board of Directors of for B S R & Co. LLP S.J.S. Enterprises LimitedChartered Accountants (formerly known as S.J.S. Enterprises Private Limited)Firm's registration number: 101248W/W-100022
Umang Banka K A Joseph Amit Kumar GargPartner Managing DirectorMembership number: 223018 DIN : 00784084Place: Bengaluru BengaluruDate: 19 July 2021 Date: 19 July 2021
Thabraz Hushain WCompany SecretaryPAN : ABVPW4613PPlace: BengaluruDate: 19 July 2021
Non-Compete and customer relationships acquired as part of business combination are capitalised as intangible assets at the fair value measured on initial recognitionand if it is probable expected future economic benefits that are attributable to the asset will flow to the Company. Such intangible assets are subsequently measured atcost less accumulated amortisation and accumulated impairment losses.
The proforma statement of profit and loss is prepared as if the transaction occurred immediately before the start of the period, and proforma balance sheet is preparedas if the transaction occurred as at the balance sheet date and hence there will be inherent inconsistencies between the two. Accordingly, the Company has not madethe adjustment arising out of amortization of intangible assets recognised on acquisition as above.
The useful lives of intangible assets that is considered for amortization of intangible assets are as follows:
(iii) Goodwill arising on acquisition: While preparing the proforma condensed consolidated balance sheet, the acquisition of Exotech was assumed to have takenplace as at 31 March 2021. The goodwill and minority interest has been calculated as follows:
(iv) The cash consideration for Exotech of ₹640.00 million has been funded by selling investment in mutual funds. Mutual funds was sold for ₹137.13 million prior to31 March 2021 and subsequent to 31 March 2021 mutual fund was sold for ₹503.79 million with a gain of ₹0.18 million.
The proforma adjustment in Mutual fund for ₹ 503.79 million and cash and cash equivalent for ₹136.21 million has been done to offset the corresponding liability fordischarging purchase consideration for Exotech acqusition for ₹ 640 million considering the transaction has been consummated as at 31 March, 2021. This proformaadjustment is not required to be made, had the proforma condensed consolidated financial statement been prepared in accordance with Indian Accounting Standardsprescribed under Section 133 of the Act.
(ii) Provisional purchase price allocation : The provisional allocation of the total purchase price on the basis of fair value of assets and liabilities taken over by theCompany are as follows:
Chief Financial Officer PAN : AAIPG1333L Place: Bengaluru Date: 19 July 2021
Sanjay Thapar CEO and Director DIN : 01029851 Place: Bengaluru Date: 19 July 2021
299
300
SECTION VII: LEGAL AND OTHER INFORMATION
OUTSTANDING LITIGATION AND MATERIAL DEVELOPMENTS
Except as disclosed in this section, there are no outstanding (i) criminal proceedings; (ii) actions taken by regulatory or
statutory authorities; (iii) litigation involving claims related to direct and indirect taxes (disclosed in a consolidated manner);
and (iv) other pending litigation as determined to be material as per the materiality policy adopted pursuant to the Board
resolution dated July 19, 2021, in each case involving our Company, its Subsidiary, Promoters and Directors (“Relevant
Parties”) and disciplinary action including penalty imposed by SEBI or Stock Exchanges against the Promoters in the last five
Financial Years, including outstanding action.
For the purpose of identification of material litigation in (iv) above, our Board has considered and adopted the following policy
on materiality with regard to outstanding litigation to be disclosed by our Company in this Red Herring Prospectus pursuant
to the Board resolution dated July 19, 2021.
All outstanding litigation, including any legal proceedings involving the Relevant Parties, other than criminal proceedings,
actions by regulatory authorities and statutory authorities, disciplinary actions including any penalty imposed by SEBI or Stock
Exchanges against the Promoters in the last five financial years including any outstanding action, and tax matters (direct or
indirect), would be considered ‘material’ if: (i) the monetary amount of claim by or against the entity or person in any such
pending proceeding is in excess of 1% of the PAT of our Company as per the latest annual Restated Consolidated Financial
Information i.e., 1% of the restated PAT of our Company for the Fiscal 2021 (being ₹4.78 million); or (ii) where monetary
liability is not quantifiable or any other outstanding litigation, the outcome of any such pending proceedings may have a
material bearing on the business, operations, performance, prospects or reputation of our Company.
It is clarified that for the above purposes, pre-litigation notices received by Relevant Parties from third parties (other than
show cause notices issued by statutory/ regulatory/ tax authorities or notices threatening criminal action), have not been
considered as litigation until such time that the Relevant Parties are impleaded as defendants in litigation proceedings before
any judicial forum.
Our Group Company is not involved in any pending litigation which has material impact on our Company.
Except as stated in this section, there are no outstanding material dues to creditors of our Company. For this purpose, our
Board has considered and adopted a policy of materiality for identification of material outstanding dues to creditors, by way
of its resolution dated July 19, 2021. In terms of this materiality policy, outstanding dues to any creditor of our Company having
a monetary value which exceeds 5% of the trade payables of our Company as at June 30, 2021, as set out in the Restated
Consolidated Financial Information, shall be considered as ‘material’. Accordingly, for the purposes of this Red Herring
Prospectus, any outstanding dues as on June 30, 2021, exceeding ₹12.87 million have been considered as material outstanding
dues.
For outstanding dues to any micro, small or medium enterprise, the disclosure shall be based on information available with
our Company regarding the status of the creditor as defined under the Micro, Small and Medium Enterprises Development Act,
2006 as amended, read with the rules and notification thereunder, as has been relied upon by the Auditors.
Litigation involving our Company
Litigation against our Company
Criminal Litigation
Nil
Civil Litigation
Hemavathi has filed a plaint under Section 26 read with Order VII, Rule 1 of the Code of Civil Procedure, 1908 (“CPC”) under
an original suit bearing no. 728/2016 (“OS”) in the Court of the Principal Civil Bangalore Rural District at Bangalore against
our Company and the Commissioner, KIADB, Metro Rail project (“KIADB Commissioner”), praying to permanently restrain
the KIADB Commissioner from disbursing the compensation amount of ₹12.33 million (after deducting tax on the
compensation amount of ₹13.87 million) (“Compensation Amount”) to our Company in relation to acquisition of a portion in
the property located at 5/11 (old survey no. 5/1), Thalaghattapura Village, Uttarahalli Hobli, Bangalore South Taluk (“Suit
Property”) by Bangalore Metro Rail Corporation Limited, pending disposal of the original suit bearing no. 614/2011. For
further details of the Suit Property and the Compensation Amount, see “- Litigation by our Company – Civil Litigation” and “–
Litigation involving our Promoters - Litigation against K.A. Joseph – Civil Litigation”. By way of a memo dated June 29, 2017,
our Company has submitted to the Court of the Additional Civil Judge (Junior Division), Bangalore Rural District that the OS
should be dismissed as infructuous. The matter is currently pending.
Actions taken by Regulatory or Statutory Authorities
301
Nil
Litigation by our Company
Criminal Litigation
Nil
Civil Litigation
1. Our Company has filed a plaint under Order VII Rule I of the CPC under an original suit bearing no. 26542/2011 (the
“OS”) against H.V. Aswath and A. Srinath (“Defendants”) in the Court of City Civil Judge, Bangalore City
(“CCCJ”), seeking temporary injunction to restrain the Defendants from encumbering or alienating the suit schedule
properties situated at Survey Nos. 36/2 and 36/3, Thalaghattapura Village, Uttarahalli Hobli, Bangalore South Taluk
measuring 3 acres and 4 guntas, and 0.36 guntas, respectively (“Suit Property”), until disposal of the OS and recovery
of ₹15.00 million paid as advance money for leasing of the Suit Property to the Defendants by our Company (the
“Advance Money”) with interest and costs (together with Advance Money, “Suit Claim”) from the Defendants. The
Defendants have received the Advance Money pursuant to a memorandum of understanding dated April 8, 2010
(“MoU’) for lease of four acres of land to our Company for construction of a factory covering 150,000 square feet,
pursuant to which the Defendants agreed to, inter alia, convert the Suit Property for industrial purposes within a period
of three months. Subsequently, the Defendants received (i) an order from the Special Deputy Commissioner, Bangalore
District dated January 31, 2011 for conversion of agricultural land to industrial land for 0.30 guntas of land in Survey
No. 36/3, and (ii) a letter from Bangalore-Mysore Infrastructure Corridor local plan authority dated August 7, 2010
with conditions for regularisation of development in agricultural zone to a maximum floor area of 150 square meters
in respect of area up to two hectares of land and with additional height restrictions in Survey No. 36/2. Consequently,
our Company has requested for refund of the Advance Money by way of a letter to the Defendants dated July 25, 2011
(“Refund Letter”) due to failure of the Defendants to satisfy the terms of the MoU. H.V. Aswath, one of the
Defendants, replied to the Refund Letter on August 3, 2011, stating that the Suit Claim be set aside due to alleged loss
suffered by him on removal of trees and plantation in the Suit Property for conversion from non-agricultural land and
further claimed ₹0.24 million for such losses. On non-receipt of the Advance Money from the Defendants, our
Company has filed the OS. Subsequent to the institution of the OS, interlocutory applications were filed by our
Company against the Defendants in the CCCJ under Order 39, Rules 1 and 2 of the CPC read with Section 151 of the
CPC, praying for (i) an interim injunction restraining the Defendants from creating any encumbrance in respect of the
Suit Property (“IA I”), and (ii) an interim order on attachment of property before judgment in the OS (“IA II”).
Further, the Defendants filed an interlocutory application under Section 151 of the CPC seeking direction to our
Company to deposit ₹0.67 million every month in the CCCJ towards alleged damages caused to the Suit Property by
our Company (“IA IV). The XIII Additional City Civil Judge, Mayo Hall Unit, Bangalore, by way of an order dated
January 29, 2013 (“Order”), allowed IA II. As a consequence of allowing IA II, IA I and IA IV were dismissed.
Subsequently, the Defendants filed an application with miscellaneous first appeal no. 1590/2013 (“MFA”) in the High
Court of Karnataka at Bangalore (“High Court”) praying for a stay on the Order and our Company filed a
memorandum of objection against the MFA in the High Court. The matter is currently pending.
2. Our Company and K.A. Joseph have filed land acquisition claims bearing reference nos. 123/2016 and 126/2016
(“LACs”) against the Special Land Acquisition Officer, KIADB (“SLAO”) in the Court of City Civil Judge (CCH-
17) at Bengaluru (“CCCJ”) in relation to suit schedule property situated in 5/11 (old survey no. 5/1), Thalaghattapura
Village, Uttarahalli Hobli, Bangalore South Taluk (the “Suit Property”). On July 11, 2015 the Bangalore Metro Rail
Corporation Limited (“BMRCL”) issued an intimation (“Intimation”) to our Company stating that two portions of
the Suit Property measuring 13 square meters and 142 square meters, respectively, were required be acquired for the
purposes of the second phase of the metro rail project. The Intimation called upon our Company to produce documents
to assist in the computation of compensation payable for acquisition of the portion in the Suit Property (“Acquisition”).
Accordingly, KIADB and BMRCL arrived at a compensation of ₹13.87 million (“Compensation”). Subsequently,
Hemavathi has filed an interlocutory application in original suit bearing reference no. 614/2011 in the Court of Civil
Judge at Bangalore praying for a temporary injunction to restrain our Company from withdrawing the compensation
arising out of the Acquisition. Thereafter, KIADB deposited the entire compensation amount of ₹12.33 million (after
deducting tax on the Compensation) (“Compensation Amount”) with the Hon’ble Principal Judge, City Civil Court,
Bangalore. Accordingly, our Company and K.A. Joseph have filed the LACs for payment of the Compensation
Amount deposited by the acquisition authority in favour of our Company along with accrued interest and other
statutory benefits. Thereafter, our Company and K.A. Joseph have filed applications under Section 151 of the CPC,
read with Section 30 and 30-A of the Land Acquisition Act, 1961 in the CCCJ, praying for apportioning an amount
equivalent to 6/7th of the Compensation Amount, pending closure of the LACs. The matters are currently pending.
Also, see “—Litigation against K.A. Joseph—Civil Litigation” on page 301.
Litigation involving our Promoters
Litigation involving K.A. Joseph
302
Litigation against K.A. Joseph
Criminal Litigation
Nil
Civil Litigation
Hemavathi and others (“Plaintiffs”) filed an original suit bearing no. 614/2011 (the “OS”) in the Court of Civil Judge at
Bangalore (“CCJ”) against one of our Promoters, K.A. Joseph and certain other individuals (“Defendants’) seeking an interim
order restraining the Defendants, their agents or anyone claiming through them from alienating the suit schedule property
situated in 5/11 (old survey no. 5/1), Thalaghapattapura Village, Uttarahalli Hobli, Bangalore South Taluk measuring 37 guntas
and consisting of Schedule A (measuring 19 guntas) and Schedule B (measuring 18 guntas) (the “Suit Property”) pending
disposal of the OS. Hemavathi by way of the OS has claimed separate possession of 1/7th share of Schedule A of the Suit
Property. Our Promoter, K.A. Joseph with certain other parties had purchased the Suit Property from some of the Defendants
pursuant to a sale deed dated July 13, 2001 for construction of an industrial building on the Suit Property. Subsequently the
Suit Property was treated as the property/ asset of our Company, then known as SJS Enterprises, a partnership firm. On
conversion of SJS Enterprises into a private limited company, the khata of the Suit Property mutated in the name of our
Company. Accordingly, the Suit Property is shown as an asset of the Company in its books of account. K.A. Joseph, with
certain other parties, has subsequently filed an application dated June 27, 2019 under Order VII, Rule 11 (a) and (d) of the CPC,
seeking rejection of the OS. The matter is currently pending.
Actions taken by Regulatory or Statutory Authorities
Nil
Litigation by K.A. Joseph
Criminal Litigation
Nil
Civil Litigation
For details in relation to the civil litigation filed by K.A. Joseph, please refer to “- Litigation involving our Company - Litigation
by our Company – Civil Litigation” on page 300.
Litigation involving Evergraph
Criminal Litigation
Nil
Civil Litigation
Nil
Actions taken by Regulatory or Statutory Authorities
Nil
Litigation involving our Directors
Litigation against our Directors
Criminal Litigation
Nil
Civil Litigation
In relation to the civil litigation against our Director, KA Joseph, please refer to “- Litigation involving our Promoters – Civil
Litigation” on page 301.
Actions taken by Regulatory or Statutory Authorities
Nil

303
Litigation by our Directors
Criminal Litigation
Nil
Civil Litigation
For details in relation to the civil litigation filed by K.A. Joseph, please refer to “- Litigation involving our Company - Litigation
by our Company – Civil Litigation” on page 300.
Litigation involving our Subsidiary
Litigation against our Subsidiary
Criminal Litigation
Nil
Civil Litigation
Nil
Actions taken by Regulatory or Statutory Authorities
Nil
Litigation by our Subsidiary
Criminal Litigation
Nil
Civil Litigation
Nil
Tax Claims
Except as disclosed below, there are no outstanding litigations involving claims related to direct and indirect taxes involving
our Company, Promoters, Directors and Subsidiary.
Nature of case Number of cases Amount involved (in ₹ million)*
Litigation involving our Company
Direct Tax 4 16.32
Indirect Tax 2 4.43
Litigation involving our Promoters
Direct Tax Nil NA
Indirect Tax Nil NA
Litigation involving our Directors
Direct Tax Nil NA
Indirect Tax Nil NA
Litigation involving our Subsidiary
Direct Tax 12 0.95 * To the extent quantifiable, excluding interest and penalty thereon.
Description of certain tax matters above the materiality threshold
For the assessment year 2009-2010, the Income Tax Appellate Tribunal, “C” Bench, Bangalore (“IT Tribunal”) has passed an
order dated December 28, 2015 pursuant to a hearing on December 1, 2015 allowing our Company’s appeal for statistical
purposes against issues raised by the relevant revenue personnel in relation to, inter alia, reimbursement of expenses paid to
Serigraph Inc. amounting to ₹0.24 million and disallowance of commission paid to Murali Rajagopalachari and Serigraph Inc
amounting to ₹11.25 million. Subsequently, our Company has written to the Deputy Commissioner of Income Tax, Circle
6(1)(1), Bangalore on June 8, 2020, requesting for release of pending refunds for the relevant years with applicable interest and
to be granted an opportunity of hearing. Our Company has not received any further communication in relation to this matter.

304
Outstanding dues to Creditors
As at June 30, 2021, our Company has 345 creditors, and the aggregate outstanding dues to these creditors by our Company
are ₹234.60 million. Further, our Company owes an amount of ₹45.28 million to micro, small and medium enterprises as
defined under the Micro, Small and Medium Enterprises Development Act, 2006.
Details of outstanding dues owed to micro, small and medium enterprises and other creditors as at June 30, 2021 are set out
below:
Types of Creditors Number of Creditors Amount involved (in ₹ million)
Material Creditors 2 31.76
Micro, Small and Medium Enterprises 88 45.28
Other Creditors 255 157.56
Total Outstanding Dues 345 234.60 Note: The total of the trade payables as per Restated Consolidated Financial Information is ₹257.36 million is including ₹22.76 million provisions for accrued expenses as the individual vendor is not identified and hence the same is not covered in the count of creditors.
As per the materiality policy, creditors of our Company to whom our Company owes an amount having a monetary value
exceeding 5% of the total trade payables of our Company as at June 30, 2021, (i.e., an amount exceeding ₹12.87 million) have
been considered as ‘material’. As at June 30, 2021, our Company has two material creditors.
The details pertaining to net outstanding dues towards our material creditors are available on the website of our Company at
www.sjsindia.com/investors.html#corporate-governance.
It is clarified that such details available on our website do not form a part of this Red Herring Prospectus and investors should
not make any investment decision based on information available on the website of our Company. Anyone placing reliance on
any other source of information, including our Company’s website, would be doing so at their own risk.
Material Developments
Other than as stated in “Management’s Discussion and Analysis of Financial Condition and Results of Operations” on page
290, there have not arisen, since the date of the last financial statement disclosed in this Red Herring Prospectus, any
circumstances which materially and adversely affect, or are likely to affect, our trading, our profitability or the value of our
assets or our ability to pay our liabilities within the next 12 months.

305
GOVERNMENT AND OTHER APPROVALS
We have set out below an indicative list of approvals, licenses, consents, registrations and permits obtained by our Company
and Subsidiary which are considered material and necessary for the purpose of undertaking our business activities. In view of
these key approvals, licenses, consents, registrations and permits our Company and Subsidiary can undertake this Offer and
can undertake its business activities. Other than as stated below, no further material approvals, licenses, consents, registrations
and permits from any regulatory authority are required to undertake the Offer or continue such business activities. In addition,
certain of our key approvals, licenses, consents, registrations and permits may have expired or may expire in the ordinary
course of business, from time to time and our Company and Subsidiary have either already made an application to the
appropriate authorities for renewal of such key approvals, licenses, consents, registrations and permits or are in the process
of making such renewal applications.
I. Incorporation Details of our Company
1. Certificate of incorporation dated June 21, 2005 issued by the RoC to our Company.
2. Fresh certificate of incorporation dated June 4, 2021 issued by the RoC, consequent upon change in our name from
S.J.S. Enterprises Private Limited to S.J.S. Enterprises Limited, pursuant to conversion of our Company from a private
limited company to a public limited company.
3. Our Company was allotted a corporate identity number U51909KA2005PLC036601.
4. For incorporation details of our Subsidiary, see “History and Certain Corporate Matters – Our Subsidiary” on page
154.
II. Approvals in relation to the Offer
For details regarding the approvals and authorizations obtained by our Company in relation to the Offer, see “Other
Regulatory and Statutory Disclosures – Authority for the Offer” on page 307.
III. Material approvals in relation to our business operations
Our Company and our Subsidiary are required to obtain certain material approvals and licenses under applicable laws,
rules and regulations in order to operate our manufacturing plants situated in the states of Karnataka and Maharashtra,
respectively, details of which are set out below:
Plant of our Company situated in Karnataka
Our Company has obtained certain licenses and approvals in relation to our manufacturing facility situated at Kengeri
Hobli, Bengaluru, which include, consent to establish and consent to operate from the state pollution control board
under the Air Act, Water Act and Hazardous Waste Rules; licenses from the Department of Factories, Boilers,
Industrial Safety & Health, Government of Karnataka under the Factories Act, 1948 and Karnataka Factories Rules,
1969; fire safety recommendation from Karnataka Fire and Emergency Services Department under the National
Building Code, 2016; and certifications from the Additional Chief Electrical Inspector, Electrical Inspectorate,
Government of Karnataka under the Central Electricity Authority (Measures Relating to Safety & Electric Supply)
Regulation, 2010 for electric installations.
Further, we have obtained the authorized economic operator certificate (importer and exporter) from Central Board of
Indirect Taxes and Customs, Ministry of Finance, and registration cum membership certificate from the Plastics Export
Promotion Council and central excise registration certificate from Central Board of Excise and Customs.
Plant of our Subsidiary situated in Maharashtra
Our Subsidiary has obtained certain licenses and approvals in relation to our manufacturing facility situated at Taluka
Shirur, Maharashtra, including, among others, consent to establish and consent to operate from the Maharashtra
Pollution Control Board under the Air Act, Water Act and Hazardous Waste Rules; licenses from the Deputy Director,
Directorate of Industrial Safety & Health (Labour Department), Government of Maharashtra under the Factories Act,
1948; fire no objection certificate from Maharashtra Industrial Development Corporation, and certifications from the
Chief Electrical Inspector under the Electricity Act, 2003 for electrical installations.
IV. Key tax related registrations of our Company and our Subsidiary
1. The permanent account number of our Company is AAJCS0794B and of our Subsidiary is AAACE2275Q.
2. The tax deduction account number of our Company is BLRS19909B and of our Subsidiary is PNEE00556D.

306
3. The importer-exporter code of our Company is 0794009336 and of our Subsidiary is 0396049851.
4. Enrolment number of our Company under Karnataka Tax on Profession, Trades, Callings and Employments
Act, 1976 is 29540389655.
5. The goods and services tax registration number of our Company and the Subsidiary, as per the states where
our business operation exist, are as follows:
State Registration Number
Company
Karnataka 29AAJCS0794B1Z8
Maharashtra 27AAJCS0794B1ZC
Tamil Nadu 33AAJCS0794B3ZH
Haryana 06AAJCS0794B1ZG
Subsidiary
Maharashtra 27AAACE2275Q1Z8
Tamil Nadu 33AAACE2275Q2ZE
V. Key approvals obtained for business operations:
Our Company also holds a legal entity identifier code 984500E74D93F3F04562 issued by India LEI (an official LEI
code registration agent recognised by the Global Legal Entity Identifier Foundation).
VI. Labour Related Approvals of our Company and our Subsidiary
Our Company and our Subsidiary have obtained the relevant registrations under the Employees’ State Insurance Act,
1948, and our Company has obtained the relevant registration under the Contract Labour (Regulation and Abolition)
Act, 1970. We have also been allotted a code under the Employees’ Provident Funds and Miscellaneous Provisions
Act, 1952.
VII. Intellectual Property Rights
Our Company has obtained registration for the trademark “SJS” bearing number 3934622 under Class 16 which is
valid until September 4, 2028. Our Company has also obtained and renewed registration for the logo “ ” bearing
number 1765292 under Class 16 which is valid until December 18, 2028. Further, our Company has filed a trademark
application on July 2, 2021 for the “Transform” device mark under Class 16.
Our Company has also obtained registration for its domain name “sjsindia.com” on February 20, 1997 and is valid
until February 21, 2022.
307
OTHER REGULATORY AND STATUTORY DISCLOSURES
Authority for the Offer
Our Board has approved the Offer pursuant to the resolution passed at its meeting held on June 30, 2021. The Draft Red Herring
Prospectus has been approved pursuant to a resolution passed by the Board on July 27, 2021. Our Board has approved this Red
Herring Prospectus pursuant to its resolution dated October 22, 2021.
Each of the Selling Shareholders has, severally and not jointly, confirmed and approved its participation in the Offer for Sale
in relation to its portion of Offered Shares. For details, see “The Offer” on page 59.
The Selling Shareholders, severally and not jointly, confirm that they have authorised and consented to participate in the Offer
for Sale, and to offer their respective portion of the Offered Shares, as part of the Offer for Sale. For further details, see “The
Offer” on page 59.
The Equity Shares being offered by the Selling Shareholders in the Offer for Sale have been held by them for a period of at
least one year prior to the filing of the Draft Red Herring Prospectus with SEBI, calculated in the manner as set out under
Regulation 8 of the SEBI ICDR Regulations and are eligible for being offered in the Offer for Sale. Except as set out in “Capital
Structure” on page 78, each of the Selling Shareholders have confirmed that they have not been prohibited from dealings in the
securities market and the Equity Shares proposed to be offered by them in the Offer for Sale are free from any lien, encumbrance,
transfer restrictions or third party rights.
Our Board has taken on record the approval for the Offer for Sale by the Selling Shareholders pursuant to its resolution dated
July 12, 2021 and October 11, 2021.
Prohibition by SEBI or other Governmental Authorities
Our Company, the Selling Shareholders, Promoters, members of our Promoter Group, Directors, persons in control of our
Company and of our Promoters and Selling Shareholders are not prohibited from accessing the capital market or debarred from
buying, selling or dealing in securities under any order or direction passed by SEBI or any securities market regulator in any
other jurisdiction or any other authority/court.
None of the companies with which our Promoters or Directors are associated with as promoters, directors or persons in control
have been debarred from accessing capital markets under any order or direction passed by SEBI or any other authorities.
Each Selling Shareholder, severally and not jointly, confirms that it has not been prohibited from accessing the capital market
or debarred from buying, selling or dealing in securities under any order or direction passed by SEBI or any other governmental
authority in India.
Directors associated with the Securities Market
None of our Directors are associated with securities market related business, in any manner. No outstanding action has been
initiated against them by SEBI in the five years preceding the date of this Red Herring Prospectus.
Confirmation under Companies (Significant Beneficial Owners) Rules, 2018
Our Company, Promoters, members of our Promoter Group, and each of the Selling Shareholders, severally and not jointly,
have confirmed that they are in compliance with the Companies (Significant Beneficial Owners) Rules, 2018, to the extent
applicable, as at the date of this Red Herring Prospectus.
Eligibility for the Offer
Our Company is eligible for the Offer in accordance with the Regulation 6(1) of the SEBI ICDR Regulations, and is in
compliance with the conditions specified therein in the following manner:
• Our Company has net tangible assets of at least ₹ 30 million, calculated on a restated basis, in each of the preceding
three full financial years, i.e., as at and for the financial years ended March 31, 2021, March 31, 2020 and March 31,
2019;
• Our Company has an average operating profit of at least ₹ 150 million, calculated on a restated basis, during the
preceding three full financial years, i.e. financial years ended March 31, 2021, March 31, 2020 and March 31, 2019,
with operating profit in each of these preceding three financial years;
• Our Company has a Net Worth of at least ₹ 10 million, calculated on a restated basis in each of the preceding three
full financial years, i.e. financial years ended March 31, 2021, March 31, 2020 and March 31, 2019; and

308
• our Company has not changed its name in the last one year.
Our Company’s operating profit, Net Worth and net tangible assets derived from the Restated Consolidated Financial
Information included in this Red Herring Prospectus as at, and for the financial years ended March 31, 2021, March 31, 2020
and March 31, 2019 (proforma) are set forth below:
Derived from our Restated Consolidated Financial Information:
(₹ in million) S. No. Particulars As at and for the Fiscal ended
March 31, 2021 March 31, 2020 March 31, 2019
(proforma)
A. Net tangible assets(1) 3,086.67 2,718.28 2,295.60
B. Net worth(2) 3,152.16 2,796.50 2,385.57
C. Operating profits(3) 614.17 507.40 511.12 (1) Net tangible assets, as restated, means the sum of all net assets of the Company and excluding intangible assets, each on restated basis and as defined in
Indian Accounting Standard 38. (2) Net worth, as restated, has been defined as the aggregate of share capital and other equity (including capital redemption reserve, debenture redemption
reserve and share options outstanding account) on restated basis. (3) Operating profit, as restated, has been calculated as net profit before tax excluding other income and finance cost, each on a restated basis.
The status of compliance of our Company with the conditions as specified under Regulations 5 and 7(1) of the SEBI ICDR
Regulations are as follows:
(i) Our Company, our Promoters, members of our Promoter Group, the Selling Shareholders and our Directors are not
debarred from accessing the capital markets by SEBI;
(ii) The companies with which our Promoters or our Directors are associated as a promoter or director or persons in control
are not debarred from accessing the capital markets by SEBI;
(iii) Neither our Company, nor any of our Promoters, or Directors is a wilful defaulter (as defined in the SEBI ICDR
Regulations);
(iv) None of our Promoters or Directors has been declared as a Fugitive Economic Offender;
(v) Except for Equity Shares to be granted pursuant to exercise of employee stock options under ESOP 2021, there are no
outstanding convertible securities of our Company or any other right which would entitle any person with any option
to receive Equity Shares of our Company as on the date of filing of this Red Herring Prospectus;
(vi) Our Company along with Registrar to the Offer has entered into tripartite agreements dated April 19, 2021 and March
16, 2021 with NSDL and CDSL respectively, for dematerialisation of the Equity Shares;
(vii) The Equity Shares of our Company held by our Promoters are in the dematerialised form;
(viii) All the Equity Shares are fully paid-up and there are no partly paid-up Equity Shares as at the date of filing of this Red
Herring Prospectus;
(ix) Our Company has received in-principle approvals from BSE and NSE for the listing of the Equity Shares pursuant to
their letters dated August 17, 2021 and August 16, 2021, respectively; and
(x) Our Company has appointed NSE as the Designated Stock Exchange.
DISCLAIMER CLAUSE OF SEBI
IT IS TO BE DISTINCTLY UNDERSTOOD THAT SUBMISSION OF THE DRAFT RED HERRING PROSPECTUS
TO SECURITIES AND EXCHANGE BOARD OF INDIA (“SEBI”) SHOULD NOT, IN ANY WAY, BE DEEMED OR
CONSTRUED THAT THE SAME HAS BEEN CLEARED OR APPROVED BY SEBI. SEBI DOES NOT TAKE ANY
RESPONSIBILITY EITHER FOR THE FINANCIAL SOUNDNESS OF ANY SCHEME OR THE PROJECT FOR
WHICH THE OFFER IS PROPOSED TO BE MADE OR FOR THE CORRECTNESS OF THE STATEMENTS
MADE OR OPINIONS EXPRESSED IN THE DRAFT RED HERRING PROSPECTUS. THE BOOK RUNNING
LEAD MANAGERS, BEING AXIS CAPITAL LIMITED, IIFL SECURITIES LIMITED AND EDELWEISS
FINANCIAL SERVICES LIMITED (“BRLMS”), HAVE CERTIFIED THAT THE DISCLOSURES MADE IN THE
DRAFT RED HERRING PROSPECTUS ARE GENERALLY ADEQUATE AND ARE IN CONFORMITY WITH
THE SEBI ICDR REGULATIONS. THIS REQUIREMENT IS TO FACILITATE INVESTORS TO TAKE AN
INFORMED DECISION FOR MAKING AN INVESTMENT IN THE PROPOSED OFFER.
309
IT SHOULD ALSO BE CLEARLY UNDERSTOOD THAT WHILE THE COMPANY IS PRIMARILY
RESPONSIBLE FOR THE CORRECTNESS, ADEQUACY AND DISCLOSURE OF ALL RELEVANT
INFORMATION IN THE DRAFT RED HERRING PROSPECTUS, THE BRLMS ARE EXPECTED TO EXERCISE
DUE DILIGENCE TO ENSURE THAT THE COMPANY DISCHARGES ITS RESPONSIBILITIES ADEQUATELY
IN THIS BEHALF AND TOWARDS THIS PURPOSE, THE BRLMS HAVE FURNISHED TO SEBI, A DUE
DILIGENCE CERTIFICATE DATED JULY 27, 2021 IN THE FORMAT PRESCRIBED UNDER SCHEDULE V
(FORM A) OF THE SEBI ICDR REGULATIONS.
THE FILING OF THIS DRAFT RED HERRING PROSPECTUS DOES NOT, HOWEVER, ABSOLVE THE
COMPANY FROM ANY LIABILITIES UNDER THE COMPANIES ACT, 2013, OR FROM THE REQUIREMENT
OF OBTAINING SUCH STATUTORY OR OTHER CLEARANCES AS MAY BE REQUIRED FOR THE PURPOSE
OF THE OFFER. SEBI FURTHER RESERVES THE RIGHT TO TAKE UP AT ANY POINT OF TIME, WITH THE
BRLMS, ANY IRREGULARITIES OR LAPSES IN THIS DRAFT RED HERRING PROSPECTUS.
All legal requirements pertaining to the Offer will be complied with at the time of filing of this Red Herring Prospectus with
the Registrar of Companies in terms of Section 32 of the Companies Act, 2013 and at the time of filing of the Prospectus with
the Registrar of Companies in terms of sections 26, 32, 33(1) and 33(2) of the Companies Act, 2013.
Disclaimer from our Company, our Directors, the Selling Shareholders and BRLMs
Our Company, the Selling Shareholders, our Directors and the BRLMs accept no responsibility for statements made otherwise
than in this Red Herring Prospectus or in the advertisements or any other material issued by or at our instance and anyone
placing reliance on any other source of information, including our Company’s website www.sjsindia.com, or the respective
websites of any affiliate of our Company would be doing so at his or her own risk.
The BRLMs accepts no responsibility, save to the limited extent as provided in the Offer Agreement, and as will be provided
for in the Underwriting Agreement.
All information shall be made available by our Company, Selling Shareholders and the BRLMs to the Bidders and the public
at large and no selective or additional information would be made available for a section of the investors in any manner
whatsoever, including at road show presentations, in research or sales reports, at the Bidding Centres or elsewhere.
Bidders will be required to confirm and will be deemed to have represented to our Company, the Selling Shareholders, the
Underwriters and their respective directors, officers, agents, affiliates and representatives that they are eligible under all
applicable laws, rules, regulations, guidelines and approvals to acquire the Equity Shares and will not sell, pledge or transfer
the Equity Shares to any person who is not eligible under any applicable laws, rules, regulations, guidelines and approvals to
acquire the Equity Shares. Our Company, each of the Selling Shareholders, the Underwriters and their respective directors,
officers, agents, affiliates and representatives accept no responsibility or liability for advising any investor on whether such
investor is eligible to acquire the Equity Shares.
The BRLMs and their respective associates and affiliates in their capacity as principals or agents may engage in transactions
with, and perform services for, our Company, the Selling Shareholders, our Promoters, members of our Promoter Group and
our Group Company, and their respective directors and officers, affiliates, associates or third parties in the ordinary course of
business and have engaged, or may in the future engage, in commercial banking and investment banking transactions with our
Company, the Selling Shareholders, our Promoters, members of our Promoter Group and our Group Company, and their
respective directors and officers, affiliates, associates or third parties, for which they have received, and may in the future
receive, compensation.
Disclaimer in respect of Jurisdiction
The Offer is being made in India to persons resident in India (who are competent to contract under the Indian Contract Act,
1872, including Indian nationals resident in India, HUFs, companies, other corporate bodies and societies registered under the
applicable laws in India and authorised to invest in shares, domestic Mutual Funds, Indian financial institutions, commercial
banks, regional rural banks, co-operative banks (subject to RBI permission), or trusts under applicable trust law and who are
authorised under their constitution to hold and invest in equity shares, state industrial development corporations, insurance
companies registered with IRDAI, provident funds (subject to applicable law) and pension funds, National Investment Fund,
insurance funds set up and managed by army, navy or air force of Union of India, insurance funds set up and managed by the
Department of Posts, GoI, systemically important NBFCs registered with the RBI) and permitted Non-Residents including FPIs
and Eligible NRIs and AIFs that they are eligible under all applicable laws and regulations to purchase the Equity Shares.
This Red Herring Prospectus does not constitute an offer to sell or an invitation to subscribe to Equity Shares offered hereby,
in any jurisdiction to any person to whom it is unlawful to make an offer or invitation in such jurisdiction. Any person into
whose possession this Red Herring Prospectus comes is required to inform him or herself about, and to observe, any such
restrictions. Any dispute arising out of the Offer will be subject to the jurisdiction of appropriate court(s) in Mumbai only. This
Red Herring Prospectus does not constitute an invitation to subscribe to or purchase the Equity Shares in the Offer in any
310
jurisdiction, including India. No action has been, or will be, taken to permit a public offering in any jurisdiction where action
would be required for that purpose, except that the Draft Red Herring Prospectus has been filed with the SEBI for its
observations. Accordingly, the Equity Shares represented thereby may not be issued, directly or indirectly, and this Red Herring
Prospectus may not be distributed in any jurisdiction, except in accordance with the legal requirements applicable in such
jurisdiction. Neither the delivery of this Red Herring Prospectus nor any offer or sale hereunder shall, under any circumstances,
create any implication that there has been no change in the affairs of our Company, Group Company or the Selling Shareholders
since the date of this Red Herring Prospectus or that the information contained herein is correct as at any time subsequent to
this date. Invitations to subscribe to or purchase the Equity Shares in the Offer will be made only pursuant to this Red Herring
Prospectus if the recipient is in India or the preliminary offering memorandum for the Offer, which comprises this Red Herring
Prospectus and the preliminary international wrap for the Offer, if the recipient is outside India.
No person outside India is eligible to Bid for Equity Shares in the Offer unless that person has received the preliminary
offering memorandum for the Offer, which contains the selling restrictions for the Offer outside India.
The Equity Shares offered in the Offer have not been and will not be registered under the U.S. Securities Act or any
state securities laws in the United States, and unless so registered, may not be offered or sold within the United States,
except pursuant to an exemption from, or in a transaction not subject to, the registration requirements of the U.S.
Securities Act and in accordance with any applicable U.S. state securities laws. Accordingly, the Equity Shares are being
offered and sold only outside the United States in ‘offshore transactions’ in compliance with Regulation S under the U.S.
Securities Act and the applicable laws of the jurisdictions where such offers and sales are made.
The Equity Shares have not been and will not be registered, listed or otherwise qualified in any other jurisdiction outside
India and may not be offered or sold, and Bids may not be made by persons in any such jurisdiction, except in compliance
with the applicable laws of such jurisdiction.
Bidders are advised to ensure that any Bid from them does not exceed investment limits or the maximum number of
Equity Shares that can be held by them under applicable law. Further, each Bidder where required must agree in the
Allotment Advice that such Bidder will not sell or transfer any Equity Shares or any economic interest therein, including
any off-shore derivative instruments, such as participatory notes, issued against the Equity Shares or any similar
security, other than in accordance with applicable laws.
Disclaimer Clause of BSE
As required, a copy of the Draft Red Herring Prospectus has been submitted to BSE. The disclaimer clause as intimated by BSE
to our Company is set forth below:
“BSE Limited (“the Exchange”) has given vide its letter dated August 17, 2021 permission to this Company to use the
Exchange’s name in this offer document as one of the stock exchanges on which this company’s securities are proposed to be
listed. The Exchange has scrutinized this offer document for its limited internal purpose of deciding on the matter of granting
the aforesaid permission to this Company. The Exchange does not in any manner: -
a) warrant, certify or endorse the correctness or completeness of any of the contents of this offer document; or
b) warrant that this Company’s securities will be listed or will continue to be listed on the Exchange; or
c) take any responsibility for the financial or other soundness of this Company, its promoters, its management or any scheme
or project of this Company;
and it should not for any reason be deemed or construed that this offer document has been cleared or approved by the Exchange.
Every person who desires to apply for or otherwise acquires any securities of this Company may do so pursuant to independent
inquiry, investigation and analysis and shall not have any claim against the Exchange whatsoever by reason of any loss which
may be suffered by such person consequent to or in connection with such subscription/acquisition whether by reason of anything
stated or omitted to be stated herein or for any other reason whatsoever.”
Disclaimer Clause of NSE
As required, a copy of the Draft Red Herring Prospectus has been submitted to NSE. The disclaimer clause as intimated by
NSE to our Company is set forth below:
“As required, a copy of this Offer Document has been submitted to National Stock Exchange of India Limited (hereinafter
referred to as NSE). NSE has given vide its letter Ref.: NSE/LIST/1113 dated August 16, 2021 permission to the Issuer to use
the Exchange’s name in this Offer Document as one of the Stock Exchanges on which this Issuer’s securities are proposed to
be listed. The Exchange has scrutinized this draft offer document for its limited internal purpose of deciding on the matter of
granting the aforesaid permission to this Issuer. It is to be distinctly understood that the aforesaid permission given by NSE
should not in any way be deemed or construed that the offer document has been cleared or approved by NSE; nor does it in
311
any manner warrant, certify or endorse the correctness or completeness of any of the contents of this offer document; nor does
it warrant that this Issuer’s securities will be listed or will continue to be listed on the Exchange; nor does it take any
responsibility for the financial or other soundness of this Issuer, its promoters, its management or any scheme or project of this
Issuer.
Every person who desires to apply for or otherwise acquire any securities of this Issuer may do so pursuant to independent
inquiry, investigation and analysis and shall not have any claim against the Exchange whatsoever by reason of any loss which
may be suffered by such person consequent to or in connection with such subscription /acquisition whether by reason of
anything stated or omitted to be stated herein or any other reason whatsoever.”
Listing
The Equity Shares offered through this Red Herring Prospectus and the Prospectus are proposed to be listed on BSE and NSE.
Applications will be made to the Stock Exchanges for obtaining permission for listing and trading of the Equity Shares. NSE
will be the Designated Stock Exchange with which the Basis of Allotment will be finalised.
If the permission to deal in and for an official quotation of the Equity Shares is not granted by the Stock Exchanges, our
Company shall forthwith repay, without interest, all monies received from the applicants in pursuance of this Red Herring
Prospectus in accordance with applicable law. Our Company shall ensure that all steps for the completion of the necessary
formalities for listing and commencement of trading of Equity Shares at the Stock Exchanges are taken within such time
prescribed by SEBI. If our Company does not Allot Equity Shares pursuant to the Offer within such timeline as prescribed by
SEBI, it shall repay without interest all monies received from Bidders, failing which interest shall be due to be paid to the
Bidders at the rate of 15% per annum for the delayed period or such other rate prescribed by SEBI.
The Selling Shareholders undertake to provide such reasonable assistance as may be requested by our Company, to the extent
such assistance is required from the Selling Shareholders in relation to their respective proportion of the Offered Shares to
facilitate the process of listing and commencement of trading of the Equity Shares on the Stock Exchanges within such time
prescribed by SEBI.
Consents
Consents in writing of each of the Selling Shareholders, our Directors, our Company Secretary and Compliance Officer, Legal
Counsel to our Company as to Indian Law, Legal Counsel to the Selling Shareholders as to Indian Law, Legal Counsel to the
BRLMs as to Indian Law, Bankers to our Company, the BRLMs, Registrar to the Offer, Statutory Auditors, Independent
Chartered Accountant and Independent Chartered Engineer, in their respective capacities, have been obtained, and such
consents have not been withdrawn up to the time of delivery of this Red Herring Prospectus. Further, consents in writing of the
Syndicate Member, Share Escrow Agent, Escrow Collection Bank/ Refund Bank/ Public Offer Account/ Sponsor Bank, to act
in their respective capacities, have been obtained and filed along with a copy of this Red Herring Prospectus with the RoC as
required under the Companies Act, 2013 and such consents have not be withdrawn up to the time of delivery of this Red Herring
Prospectus for filing with the RoC.
Expert to the Offer
Except as stated below, our Company has not obtained any expert opinions:
Our Company has received written consent dated October 22, 2021 from our Statutory Auditors, namely, B S R & Co. LLP,
Chartered Accountants, holding a valid peer review certificate from the ICAI, to include their name in this Red Herring
Prospectus as required under Section 26(5) of the Companies Act read with SEBI ICDR Regulations and as an “expert” as
defined under section 2(38) of the Companies Act, 2013 to the extent and in their capacity as our Statutory Auditors, and in
respect of their (i) examination report, dated October 11, 2021 on our Restated Consolidated Financial Information; (ii)
assurance report on the compilation of our Proforma Condensed Consolidated Financial Information , dated October 11, 2021
on our Proforma Condensed Consolidated Financial Information; and (iii) their report dated October 22, 2021 on the statement
of possible special tax benefits included in this Red Herring Prospectus and such consent has not been withdrawn as on the date
of this Red Herring Prospectus.
In addition, (i) our Company has received written consent dated July 29, 2021 from G. Shankar Rao, as chartered engineer to
include his name as an “expert” under Section 2(38) of the Companies Act, 2013, and other applicable provisions of the
Companies Act, 2013 in his capacity as a ‘chartered engineer’, in respect of the certificate dated July 29, 2021, and such consent
has not been withdrawn as on the date of this Red Herring Prospectus, and (ii) our Company has received written consent dated
July 27, 2021 from Ramanand & Associates, Chartered Accountants, as the chartered accountants to include its name as an
“expert” under Section 2(38) of the Companies Act, 2013, and other applicable provisions of the Companies Act, 2013 in his
capacity as an independent chartered accountant, in respect of the certificates dated October 22, 2021, and such consent has not
been withdrawn as on the date of this Red Herring Prospectus.
The term “expert” shall not be construed to mean an expert as defined under the U.S. Securities Act.

312
Particulars regarding public or rights issues during the last five years
Our Company has not made any public or rights issue of Equity Shares during the five years immediately preceding the date of
this Red Herring Prospectus.
Particulars regarding capital issues by our Company and listed promoters, group companies, subsidiaries or associate
entities during the last three years
Other than as disclosed in “Capital Structure” on page 78, our Company has not made any capital issues during the three years
preceding the date of this Red Herring Prospectus.
Our Company does not have any listed promoters, group companies, subsidiaries or associates.
Commission and Brokerage paid on previous issues of the Equity Shares in the last five years
No sum has been paid or has been payable as commission or brokerage for subscribing to or procuring or agreeing to procure
subscription for any of the Equity Shares in the last five years.
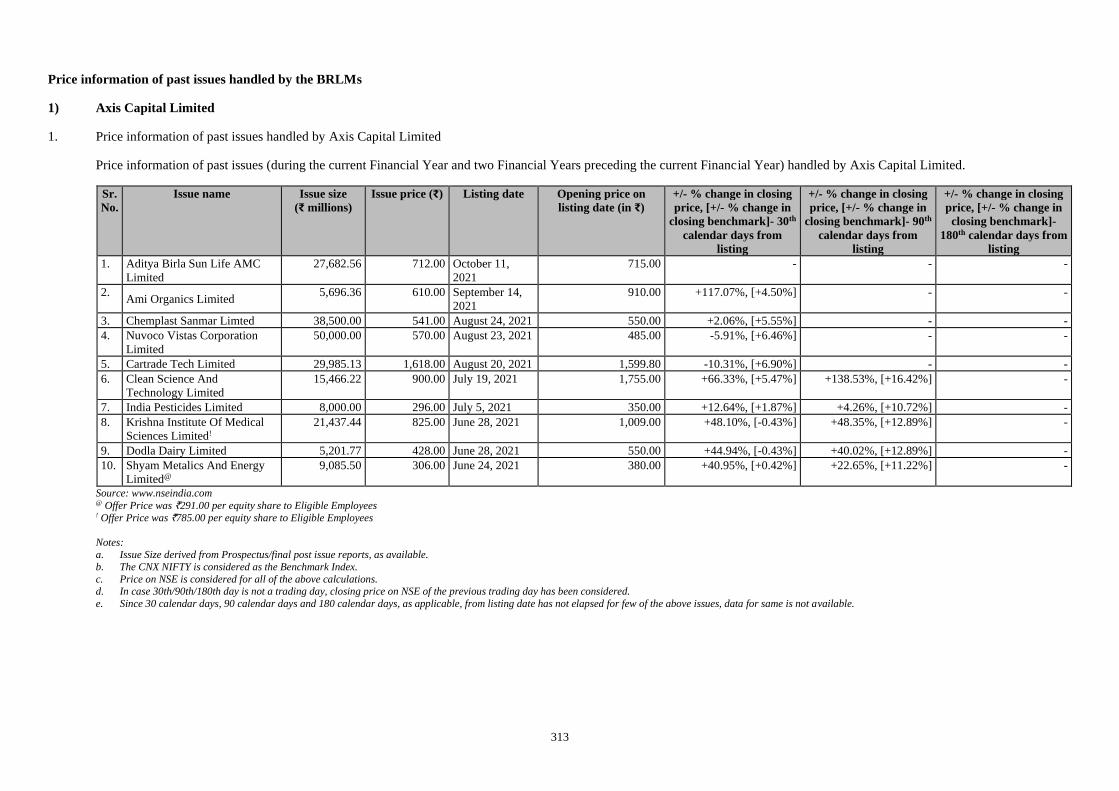
313
Price information of past issues handled by the BRLMs
1) Axis Capital Limited
1. Price information of past issues handled by Axis Capital Limited
Price information of past issues (during the current Financial Year and two Financial Years preceding the current Financial Year) handled by Axis Capital Limited.
Sr.
No.
Issue name Issue size
(₹ millions)
Issue price (₹) Listing date Opening price on
listing date (in ₹)
+/- % change in closing
price, [+/- % change in
closing benchmark]- 30th
calendar days from
listing
+/- % change in closing
price, [+/- % change in
closing benchmark]- 90th
calendar days from
listing
+/- % change in closing
price, [+/- % change in
closing benchmark]-
180th calendar days from
listing
1. Aditya Birla Sun Life AMC
Limited
27,682.56 712.00 October 11,
2021
715.00 - - -
2. Ami Organics Limited
5,696.36 610.00 September 14,
2021
910.00 +117.07%, [+4.50%] - -
3. Chemplast Sanmar Limted 38,500.00 541.00 August 24, 2021 550.00 +2.06%, [+5.55%] - -
4. Nuvoco Vistas Corporation
Limited
50,000.00 570.00 August 23, 2021 485.00 -5.91%, [+6.46%] - -
5. Cartrade Tech Limited 29,985.13 1,618.00 August 20, 2021 1,599.80 -10.31%, [+6.90%] - -
6. Clean Science And
Technology Limited
15,466.22 900.00 July 19, 2021 1,755.00 +66.33%, [+5.47%] +138.53%, [+16.42%] -
7. India Pesticides Limited 8,000.00 296.00 July 5, 2021 350.00 +12.64%, [+1.87%] +4.26%, [+10.72%] -
8. Krishna Institute Of Medical
Sciences Limited!
21,437.44 825.00 June 28, 2021 1,009.00 +48.10%, [-0.43%] +48.35%, [+12.89%] -
9. Dodla Dairy Limited 5,201.77 428.00 June 28, 2021 550.00 +44.94%, [-0.43%] +40.02%, [+12.89%] -
10. Shyam Metalics And Energy
Limited@
9,085.50 306.00 June 24, 2021 380.00 +40.95%, [+0.42%] +22.65%, [+11.22%] -
Source: www.nseindia.com @ Offer Price was `291.00 per equity share to Eligible Employees ! Offer Price was `785.00 per equity share to Eligible Employees
Notes:
a. Issue Size derived from Prospectus/final post issue reports, as available.
b. The CNX NIFTY is considered as the Benchmark Index.
c. Price on NSE is considered for all of the above calculations. d. In case 30th/90th/180th day is not a trading day, closing price on NSE of the previous trading day has been considered.
e. Since 30 calendar days, 90 calendar days and 180 calendar days, as applicable, from listing date has not elapsed for few of the above issues, data for same is not available.
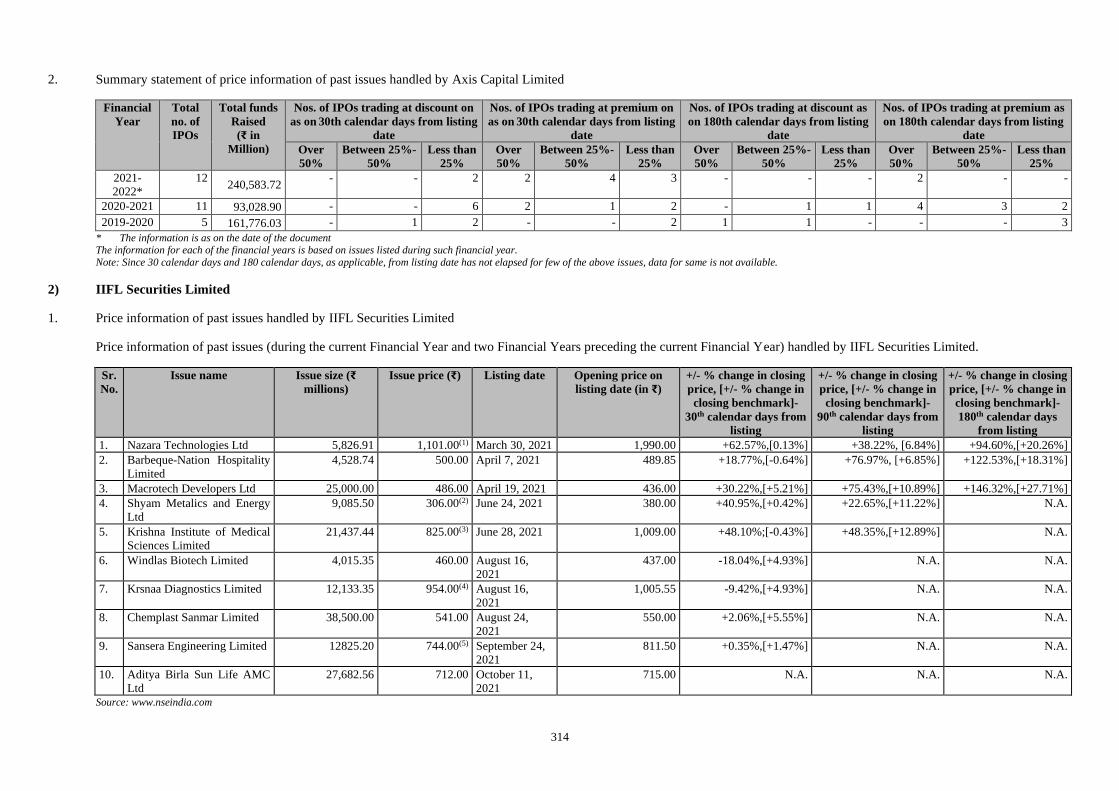
314
2. Summary statement of price information of past issues handled by Axis Capital Limited
Financial
Year
Total
no. of
IPOs
Total funds
Raised
(₹ in
Million)
Nos. of IPOs trading at discount on
as on 30th calendar days from listing
date
Nos. of IPOs trading at premium on
as on 30th calendar days from listing
date
Nos. of IPOs trading at discount as
on 180th calendar days from listing
date
Nos. of IPOs trading at premium as
on 180th calendar days from listing
date
Over
50%
Between 25%-
50%
Less than
25%
Over
50%
Between 25%-
50%
Less than
25%
Over
50%
Between 25%-
50%
Less than
25%
Over
50%
Between 25%-
50%
Less than
25%
2021-
2022*
12 240,583.72
- - 2 2 4 3 - - - 2 - -
2020-2021 11 93,028.90 - - 6 2 1 2 - 1 1 4 3 2
2019-2020 5 161,776.03 - 1 2 - - 2 1 1 - - - 3
* The information is as on the date of the document The information for each of the financial years is based on issues listed during such financial year.
Note: Since 30 calendar days and 180 calendar days, as applicable, from listing date has not elapsed for few of the above issues, data for same is not available.
2) IIFL Securities Limited
1. Price information of past issues handled by IIFL Securities Limited
Price information of past issues (during the current Financial Year and two Financial Years preceding the current Financial Year) handled by IIFL Securities Limited.
Sr.
No.
Issue name Issue size (₹
millions)
Issue price (₹) Listing date Opening price on
listing date (in ₹)
+/- % change in closing
price, [+/- % change in
closing benchmark]-
30th calendar days from
listing
+/- % change in closing
price, [+/- % change in
closing benchmark]-
90th calendar days from
listing
+/- % change in closing
price, [+/- % change in
closing benchmark]-
180th calendar days
from listing
1. Nazara Technologies Ltd 5,826.91 1,101.00(1) March 30, 2021 1,990.00 +62.57%,[0.13%] +38.22%, [6.84%] +94.60%,[+20.26%]
2. Barbeque-Nation Hospitality
Limited
4,528.74 500.00 April 7, 2021 489.85 +18.77%,[-0.64%] +76.97%, [+6.85%] +122.53%,[+18.31%]
3. Macrotech Developers Ltd 25,000.00 486.00 April 19, 2021 436.00 +30.22%,[+5.21%] +75.43%,[+10.89%] +146.32%,[+27.71%]
4. Shyam Metalics and Energy
Ltd
9,085.50 306.00(2) June 24, 2021 380.00 +40.95%,[+0.42%] +22.65%,[+11.22%] N.A.
5. Krishna Institute of Medical
Sciences Limited
21,437.44 825.00(3) June 28, 2021 1,009.00 +48.10%;[-0.43%] +48.35%,[+12.89%] N.A.
6. Windlas Biotech Limited 4,015.35 460.00 August 16,
2021
437.00 -18.04%,[+4.93%] N.A. N.A.
7. Krsnaa Diagnostics Limited 12,133.35 954.00(4) August 16,
2021
1,005.55 -9.42%,[+4.93%] N.A. N.A.
8. Chemplast Sanmar Limited 38,500.00 541.00 August 24,
2021
550.00 +2.06%,[+5.55%] N.A. N.A.
9. Sansera Engineering Limited 12825.20 744.00(5) September 24,
2021
811.50 +0.35%,[+1.47%] N.A. N.A.
10. Aditya Birla Sun Life AMC
Ltd
27,682.56 712.00 October 11,
2021
715.00 N.A. N.A. N.A.
Source: www.nseindia.com
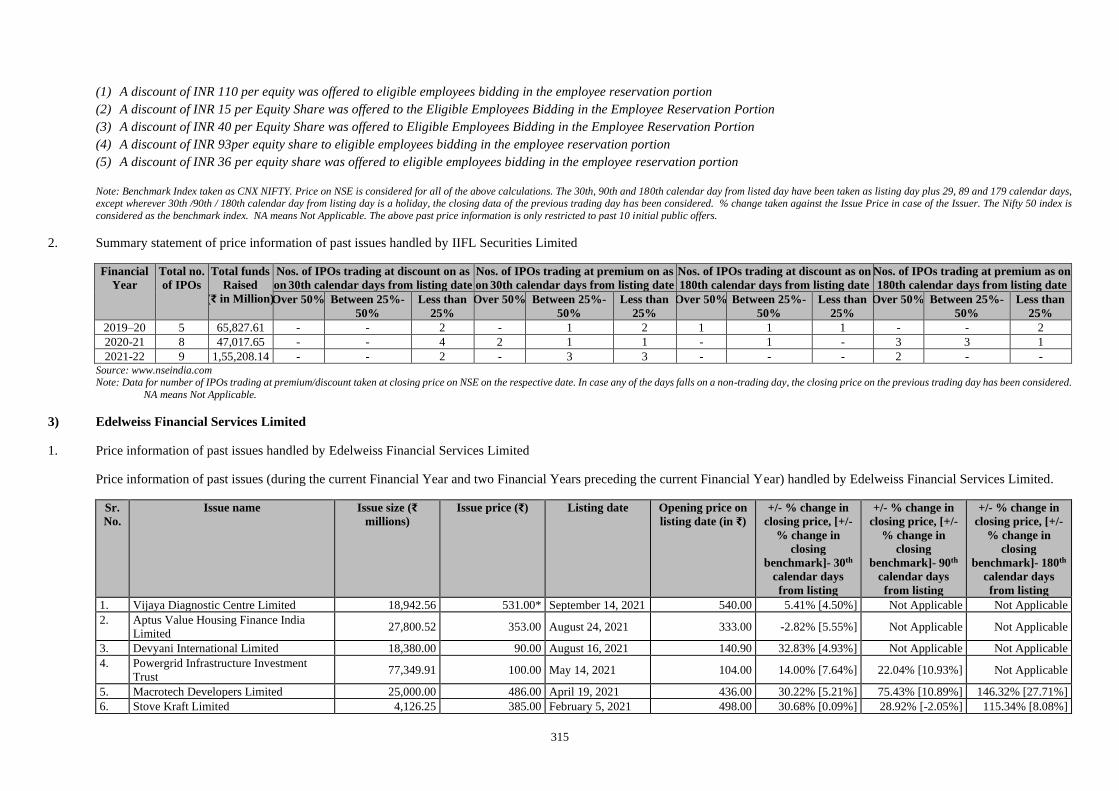
315
(1) A discount of INR 110 per equity was offered to eligible employees bidding in the employee reservation portion
(2) A discount of INR 15 per Equity Share was offered to the Eligible Employees Bidding in the Employee Reservation Portion
(3) A discount of INR 40 per Equity Share was offered to Eligible Employees Bidding in the Employee Reservation Portion
(4) A discount of INR 93per equity share to eligible employees bidding in the employee reservation portion
(5) A discount of INR 36 per equity share was offered to eligible employees bidding in the employee reservation portion
Note: Benchmark Index taken as CNX NIFTY. Price on NSE is considered for all of the above calculations. The 30th, 90th and 180th calendar day from listed day have been taken as listing day plus 29, 89 and 179 calendar days, except wherever 30th /90th / 180th calendar day from listing day is a holiday, the closing data of the previous trading day has been considered. % change taken against the Issue Price in case of the Issuer. The Nifty 50 index is
considered as the benchmark index. NA means Not Applicable. The above past price information is only restricted to past 10 initial public offers.
2. Summary statement of price information of past issues handled by IIFL Securities Limited
Financial
Year
Total no.
of IPOs
Total funds
Raised
(₹ in Million)
Nos. of IPOs trading at discount on as
on 30th calendar days from listing date
Nos. of IPOs trading at premium on as
on 30th calendar days from listing date
Nos. of IPOs trading at discount as on
180th calendar days from listing date
Nos. of IPOs trading at premium as on
180th calendar days from listing date
Over 50% Between 25%-
50%
Less than
25%
Over 50% Between 25%-
50%
Less than
25%
Over 50% Between 25%-
50%
Less than
25%
Over 50% Between 25%-
50%
Less than
25%
2019–20 5 65,827.61 - - 2 - 1 2 1 1 1 - - 2
2020-21 8 47,017.65 - - 4 2 1 1 - 1 - 3 3 1
2021-22 9 1,55,208.14 - - 2 - 3 3 - - - 2 - - Source: www.nseindia.com Note: Data for number of IPOs trading at premium/discount taken at closing price on NSE on the respective date. In case any of the days falls on a non-trading day, the closing price on the previous trading day has been considered.
NA means Not Applicable.
3) Edelweiss Financial Services Limited
1. Price information of past issues handled by Edelweiss Financial Services Limited
Price information of past issues (during the current Financial Year and two Financial Years preceding the current Financial Year) handled by Edelweiss Financial Services Limited.
Sr.
No.
Issue name Issue size (₹
millions)
Issue price (₹) Listing date Opening price on
listing date (in ₹)
+/- % change in
closing price, [+/-
% change in
closing
benchmark]- 30th
calendar days
from listing
+/- % change in
closing price, [+/-
% change in
closing
benchmark]- 90th
calendar days
from listing
+/- % change in
closing price, [+/-
% change in
closing
benchmark]- 180th
calendar days
from listing
1. Vijaya Diagnostic Centre Limited 18,942.56 531.00* September 14, 2021 540.00 5.41% [4.50%] Not Applicable Not Applicable
2. Aptus Value Housing Finance India
Limited 27,800.52 353.00 August 24, 2021 333.00 -2.82% [5.55%] Not Applicable Not Applicable
3. Devyani International Limited 18,380.00 90.00 August 16, 2021 140.90 32.83% [4.93%] Not Applicable Not Applicable
4. Powergrid Infrastructure Investment
Trust 77,349.91 100.00 May 14, 2021 104.00 14.00% [7.64%] 22.04% [10.93%] Not Applicable
5. Macrotech Developers Limited 25,000.00 486.00 April 19, 2021 436.00 30.22% [5.21%] 75.43% [10.89%] 146.32% [27.71%]
6. Stove Kraft Limited 4,126.25 385.00 February 5, 2021 498.00 30.68% [0.09%] 28.92% [-2.05%] 115.34% [8.08%]

316
Sr.
No.
Issue name Issue size (₹
millions)
Issue price (₹) Listing date Opening price on
listing date (in ₹)
+/- % change in
closing price, [+/-
% change in
closing
benchmark]- 30th
calendar days
from listing
+/- % change in
closing price, [+/-
% change in
closing
benchmark]- 90th
calendar days
from listing
+/- % change in
closing price, [+/-
% change in
closing
benchmark]- 180th
calendar days
from listing
7. Indigo Paints Limited^ 11,691.24 1,490.00^ February 2, 2021 2,607.50 75.72% [4.08%] 55.40% [-0.11%] 74.84% [7.61%]
8. Burger King India Limited 8,100.00 60.00 December 14, 2020 112.50 146.5% [7.41%] 135.08% [10.86%] 168.25% [16.53%]
9. Equitas Small Finance Bank Limited 5,176.00 33.00 November 2, 2020 31.10 5.45% [12.34%] 19.55% [16.84%] 68.18% [25.38%]
10. Mazagon Dock Shipbuilders Limited 4,436.86 145.00 October 12, 2020 214.90 18.90% [5.87%] 52.90% [20.25%] 45.79% [24.34%]
Source: www.nseindia.com ^ Indigo Paints Limited - A discount of ₹ 148 per equity share was offered to eligible employees bidding in the employee reservation portion. All calculations are based on the offer price of ₹1490 per equity share *Vijaya Diagnostic Centre Limited - A discount of ₹ 52 per equity share was offered to eligible employees bidding in the employee reservation portion. All calculations are based on the offer price of ₹531 per equity share
Notes:
1. Based on date of listing. 2. % of change in closing price on 30th / 90th / 180th calendar day from listing day is calculated vs issue price. % change in closing benchmark index is calculated based on closing index on listing day vs closing index on
30th/ 90th / 180th calendar day from listing day.
3. Wherever 30th/ 90th / 180th calendar day from listing day is a holiday, the closing data of the previous trading day has been considered. 4. The Nifty 50 index is considered as the benchmark index
5. Not Applicable. – Period not completed
6. Disclosure in Table-1 restricted to 10 issues.
2. Summary statement of price information of past issues handled by Edelweiss Financial Services Limited
Financial
Year
Total
no. of
IPOs
Total funds
Raised
(₹ in Million)
Nos. of IPOs trading at discount on
as on 30th calendar days from listing
date
Nos. of IPOs trading at premium on
as on 30th calendar days from listing
date
Nos. of IPOs trading at discount as
on 180th calendar days from listing
date
Nos. of IPOs trading at premium as
on 180th calendar days from listing
date
Over
50%
Between 25%-
50%
Less than
25%
Over
50%
Between 25%-
50%
Less than
25%
Over
50%
Between 25%-
50%
Less than
25%
Over
50%
Between 25%-
50%
Less than
25%
2021-22* 5 1,67,472.99 - - 1 - 2 2 - - - 1 - -
2020-21 7 45,530.35 - - 1 3 1 2 - - 1 5 1 -
2019-20 3 23,208.49 - - - - 1 2 - 1 - 1 - 1
1. The information is as on the date of the document
2. Based on date of listing. 3. Wherever 30th and 180th calendar day from listing day is a holiday, the closing data of the previous trading day has been considered.
4. The Nifty 50 index is considered as the Benchmark Index.
* For the financial year 2021-22- 5 issues have been completed of which 2 issues have completed 180 calendar days and 2 issue has completed 90 calendar days.
317
Track record of past issues handled by the BRLMs
For details regarding the track record of the BRLMs, as specified in the SEBI circular dated January 10, 2012, bearing reference
number CIR/MIRSD/1/2012, please see the websites of the BRLMs, as provided in the table below.
S. No. Name of the BRLM Website
1. Axis Capital Limited www.axiscapital.co.in
2. IIFL Securities Limited www.iiflcap.com
3. Edelweiss Financial Services Limited www.edelweissfin.com
Stock Market Data of Equity Shares
This being an initial public offer of Equity Shares of our Company, the Equity Shares are not listed on any stock exchange and
accordingly, no stock market data is available for the Equity Shares.
Mechanism for Redressal of Investor Grievances
The Registrar Agreement provides for the retention of records with the Registrar to the Offer for a period of at least eight years
from the date of listing and commencement of trading of the Equity Shares on the Stock Exchanges, to enable the investors to
approach the Registrar to the Offer for redressal of their grievances.
In terms of SEBI circular SEBI/HO/CFD/DIL2/CIR/P/2018/22 dated February 15, 2018, SEBI circular
SEBI/HO/CFD/DIL2/CIR/P/2021/2480/1/M dated March 16, 2021, as amended pursuant to SEBI circular
SEBI/HO/CFD/DIL2/P/CIR/2021/570 dated June 2, 2021 and subject to applicable law, any ASBA Bidder whose Bid has not
been considered for Allotment, due to failure on the part of any SCSB, shall have the option to seek redressal of the same by
the concerned SCSB within three months of the date of listing of the Equity Shares. SCSBs are required to resolve these
complaints within 15 days, failing which the concerned SCSB would have to pay interest at the rate of 15% per annum for any
delay beyond this period of 15 days.
Further, the investors shall be compensated by the SCSBs in accordance with SEBI circular
SEBI/HO/CFD/DIL2/CIR/P/2021/2480/1/M dated March 16, 2021 in the events of delayed unblock for
cancelled/withdrawn/deleted applications, blocking of multiple amounts for the same UPI application, blocking of more amount
than the application amount, delayed unblocking of amounts for non-allotted/partially-allotted applications, for the stipulated
period. In an event there is a delay in redressal of the investor grievance in relation to unblocking of amounts, the Book Running
Lead Managers shall compensate the investors at the rate higher of ₹ 100 or 15% per annum of the application amount for the
period of such delay. Compensation for UPI bids shall be invoked for delayed unblocks from T+4 days.
All grievances in relation to the Bidding process may be addressed to the Registrar to the Offer with a copy to the relevant
Designated Intermediary to whom the Bid cum Application Form was submitted. The Bidder should give full details such as
name of the sole or first Bidder, Bid cum Application Form number, Bidder DP ID, Client ID, UPI ID, PAN, date of the
submission of Bid cum Application Form, address of the Bidder, number of the Equity Shares applied for and the name and
address of the Designated Intermediary where the Bid cum Application Form was submitted by the Bidder.
The Registrar to the Offer shall obtain the required information from the SCSBs and Sponsor Bank for addressing any
clarifications or grievances of ASBA Bidders. Our Company, the BRLMs and the Registrar to the Offer accept no responsibility
for errors, omissions, commission or any acts of SCSBs including any defaults in complying with its obligations under
applicable SEBI ICDR Regulations. Investors can contact our Company Secretary and Compliance Officer or the Registrar to
the Offer in case of any pre-Offer or post-Offer related problems such as non-receipt of letters of Allotment, non-credit of
allotted Equity Shares in the respective beneficiary account, non-receipt of refund intimations and non-receipt of funds by
electronic mode.
Anchor Investors are required to address all grievances in relation to the Offer to the BRLMs.
Further, the Bidder shall also enclose a copy of the Acknowledgment Slip duly received from the concerned Designated
Intermediary in addition to the information mentioned herein.
Our Company does not have any listed group companies.
Our Company does not have any listed subsidiaries.
Disposal of Investor Grievances by our Company
Our Company has obtained authentication on the SCORES and shall comply with the SEBI circular (CIR/OIAE/1/2014) dated
December 18, 2014 in relation to redressal of investor grievances through SCORES.

318
Our Company estimates that the average time required by our Company or the Registrar to the Offer or the SCSB in case of
ASBA Bidders, for the redressal of routine investor grievances shall be 10 Working Days from the date of receipt of the
complaint. In case of non-routine complaints and complaints where external agencies are involved, our Company will seek to
redress these complaints as expeditiously as possible.
Our Company and Subsidiary have not received any investor grievances in the last three Financial Years prior to the filing of
the Draft Red Herring Prospectus and this Red Herring Prospectus. As at the date of the Draft Red Herring Prospectus and this
Red Herring Prospectus, there are no outstanding investor grievances.
Our Company has also appointed Thabraz Hushain W., Company Secretary of our Company, as the Compliance Officer for the
Offer. For details, see “General Information” on page 71.
Our Company has constituted a Stakeholders’ Relationship Committee comprising of Matthias Frenzel (Chairman), K.A.
Joseph, Kazi Arif Uz Zaman and Sanjay Thapar as members. For details, see “Our Management - Stakeholders’ Relationship
Committee” on page 160.
319
SECTION VIII: OFFER INFORMATION
TERMS OF THE OFFER
The Equity Shares being offered and Allotted pursuant to the Offer shall be subject to the provisions of the Companies Act,
SEBI ICDR Regulations, SCRA, SCRR, the MoA, AoA, SEBI Listing Regulations, the terms of this Red Herring Prospectus,
the Prospectus, the abridged prospectus, Bid cum Application Form, the Revision Form, the CAN/Allotment Advice and other
terms and conditions as may be incorporated in other documents/ certificates that may be executed in respect of the Offer. The
Equity Shares shall also be subject to laws as applicable, guidelines, rules, notifications and regulations relating to the issue of
capital and listing and trading of securities issued from time to time by SEBI, the Government of India, the Stock Exchanges,
the RBI, RoC and/or other authorities, as in force on the date of the Offer and to the extent applicable or such other conditions
as may be prescribed by the SEBI, the Government of India, the Stock Exchanges, the RoC and/or any other authorities while
granting its approval for the Offer.
Ranking of the Equity Shares
The Allottees upon Allotment of Equity Shares under the Offer will be entitled to dividend and other corporate benefits, if any,
declared by our Company after the date of Allotment. The Equity Shares transferred in the Offer shall be pari passu with the
existing Equity Shares in all respects including dividends. For further details, see “Description of Equity Shares and Terms of
Articles of Association” on page 342.
Mode of Payment of Dividend
Our Company shall pay dividends, if declared, to the Shareholders in accordance with the provisions of the Companies Act,
the Memorandum and Articles of Association and provisions of the SEBI Listing Regulations and any other guidelines or
directions which may be issued by the Government in this regard. Dividends, if any, declared by our Company after the date of
Allotment (pursuant to the transfer of Equity Shares from the Offer for Sale), will be payable to the Bidders who have been
Allotted Equity Shares in the Offer, for the entire year, in accordance with applicable laws. For further details, in relation to
dividends, see “Dividend Policy” and “Description of Equity Shares and Terms of Articles of Association” on pages 182 and
342, respectively.
Face Value, Offer Price and Price Band
The face value of each Equity Share is ₹10 and the Offer Price at the lower end of the Price Band is ₹[●] per Equity Share and
at the higher end of the Price Band is ₹[●] per Equity Share. The Anchor Investor Offer Price is ₹[●] per Equity Share.
The Price Band and the minimum Bid Lot size for the Offer will be decided by our Company and the Selling Shareholders in
consultation with the BRLMs, and advertised in all editions of The Financial Express, an English national daily newspaper, all
editions of Jansatta, a Hindi national daily newspaper and regional edition of Vishwavani, a Kannada national daily newspaper,
Kannada being the regional language of Karnataka, where our Registered and Corporate Office is located, each with wide
circulation, at least two Working Days prior to the Bid/ Offer Opening Date and shall be made available to the Stock Exchanges
for the purpose of uploading the same on their websites. The Price Band, along with the relevant financial ratios calculated at
the Floor Price and at the Cap Price, shall be pre-filled in the Bid cum Application Forms available on the respective websites
of the Stock Exchanges.
At any given point of time, there shall be only one denomination for the Equity Shares.
The Offer
The Offer comprises an Offer for Sale by the Selling Shareholders.
Expenses for the Offer shall be shared amongst our Company and the Selling Shareholders in the manner specified in “Objects
of the Offer - Offer Expenses” on page 59.
Compliance with disclosure and accounting norms
Our Company shall comply with all disclosure and accounting norms as specified by SEBI from time to time.
Rights of the Equity Shareholders
Subject to applicable laws, rules, regulations and guidelines and the Articles of Association, our equity Shareholders shall have
the following rights:
• Right to receive dividends, if declared;
• Right to attend general meetings and exercise voting rights, unless prohibited by law;

320
• Right to vote on a poll either in person or by proxy, in accordance with the provisions of the Companies Act;
• Right to receive offers for rights shares and be allotted bonus shares, if announced;
• Right to receive surplus on liquidation, subject to any statutory and preferential claim being satisfied;
• Right of free transferability, subject to applicable laws including any RBI rules and regulations; and
• Such other rights, as may be available to a shareholder of a listed public company under the Companies Act, the SEBI
Listing Regulations and the Articles of Association of our Company.
For a detailed description of the main provisions of the Articles of Association of our Company relating to voting rights,
dividend, forfeiture and lien, transfer, transmission and/or consolidation/splitting, see “Description of Equity Shares and Terms
of Articles of Association” on page 342.
Allotment only in dematerialised form
Pursuant to Section 29 of the Companies Act, 2013 and the SEBI ICDR Regulations, the Equity Shares shall be Allotted only
in dematerialised form. As per the SEBI ICDR Regulations, the trading of the Equity Shares shall only be in dematerialised
form on the Stock Exchanges. In this context, our Company has entered into the following agreements with the respective
Depositories and Registrar to the Offer:
• Tripartite agreement dated April 19, 2021 amongst our Company, NSDL and Registrar to the Offer; and
• Tripartite agreement dated March 16, 2021 amongst our Company, CDSL and Registrar to the Offer.
Market Lot and Trading Lot
Since trading of the Equity Shares is in dematerialised form, the tradable lot is one Equity Share. Allotment in the Offer will be
in multiples of one Equity Share subject to a minimum Allotment of [●] Equity Shares.
Joint Holders
Subject to the provisions of the Articles of Association, where two or more persons are registered as the holders of the Equity
Shares, they will be deemed to hold such Equity Shares as joint tenants with benefits of survivorship.
Nomination facility to investors
In accordance with Section 72 of the Companies Act, 2013, read with the Companies (Share Capital and Debentures) Rules,
2014, the sole Bidder, or the first Bidder along with other joint Bidders, may nominate any one person in whom, in the event
of the death of sole Bidder or in case of joint Bidders, death of all the Bidders, as the case may be, the Equity Shares Allotted,
if any, shall vest. A person, being a nominee, entitled to the Equity Shares by reason of the death of the original holder(s), shall
be entitled to the same advantages to which he or she would be entitled if he or she were the registered holder of the Equity
Share(s). Where the nominee is a minor, the holder(s) may make a nomination to appoint, in the prescribed manner, any person
to become entitled to Equity Share(s) in the event of his or her death during the minority. A nomination shall stand rescinded
upon a sale/transfer/alienation of Equity Share(s) by the person nominating. A buyer will be entitled to make a fresh nomination
in the manner prescribed. Fresh nomination can be made only on the prescribed form available on request at our Registered and
Corporate Office or to the registrar and transfer agents of our Company.
Any person who becomes a nominee by virtue of the provisions of Section 72 of the Companies Act, 2013 shall upon the
production of such evidence as may be required by the Board, elect either:
a) to register himself or herself as the holder of the Equity Shares; or
b) to make such transfer of the Equity Shares, as the deceased holder could have made.
Further, the Board may at any time give notice requiring any nominee to choose either to be registered himself or herself or to
transfer the Equity Shares, and if the notice is not complied with within a period of 90 days, the Board may thereafter withhold
payment of all dividends, bonuses or other monies payable in respect of the Equity Shares, until the requirements of the notice
have been complied with.
Since the Allotment of Equity Shares in the Offer will be made only in dematerialised mode, there is no need to make a separate
nomination with our Company. Nominations registered with respective Depository Participant of the Bidder would prevail. If
the Bidder wants to change the nomination, they are requested to inform their respective Depository Participant.
Our Company shall comply with such disclosure and accounting norms as may be specified by SEBI from time to time.
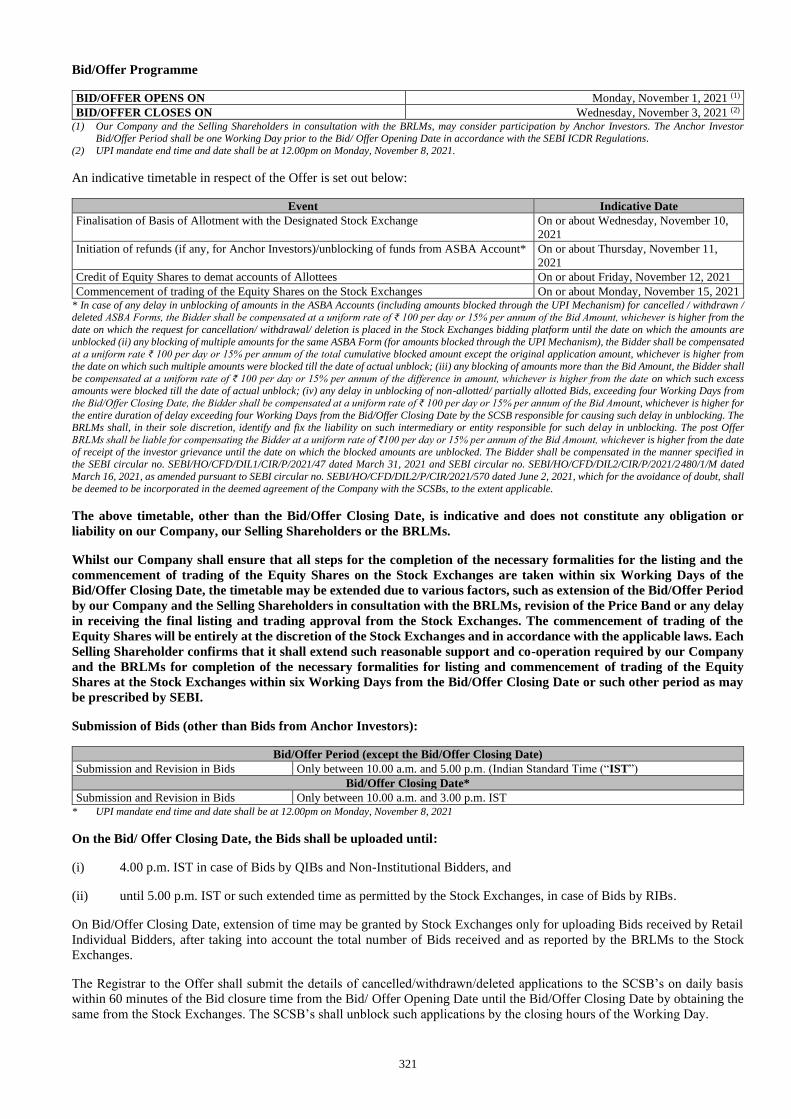
321
Bid/Offer Programme
BID/OFFER OPENS ON Monday, November 1, 2021 (1)
BID/OFFER CLOSES ON Wednesday, November 3, 2021 (2) (1) Our Company and the Selling Shareholders in consultation with the BRLMs, may consider participation by Anchor Investors. The Anchor Investor
Bid/Offer Period shall be one Working Day prior to the Bid/ Offer Opening Date in accordance with the SEBI ICDR Regulations.
(2) UPI mandate end time and date shall be at 12.00pm on Monday, November 8, 2021.
An indicative timetable in respect of the Offer is set out below:
Event Indicative Date
Finalisation of Basis of Allotment with the Designated Stock Exchange On or about Wednesday, November 10,
2021
Initiation of refunds (if any, for Anchor Investors)/unblocking of funds from ASBA Account* On or about Thursday, November 11,
2021
Credit of Equity Shares to demat accounts of Allottees On or about Friday, November 12, 2021
Commencement of trading of the Equity Shares on the Stock Exchanges On or about Monday, November 15, 2021 * In case of any delay in unblocking of amounts in the ASBA Accounts (including amounts blocked through the UPI Mechanism) for cancelled / withdrawn / deleted ASBA Forms, the Bidder shall be compensated at a uniform rate of ₹ 100 per day or 15% per annum of the Bid Amount, whichever is higher from the
date on which the request for cancellation/ withdrawal/ deletion is placed in the Stock Exchanges bidding platform until the date on which the amounts are
unblocked (ii) any blocking of multiple amounts for the same ASBA Form (for amounts blocked through the UPI Mechanism), the Bidder shall be compensated at a uniform rate ₹ 100 per day or 15% per annum of the total cumulative blocked amount except the original application amount, whichever is higher from
the date on which such multiple amounts were blocked till the date of actual unblock; (iii) any blocking of amounts more than the Bid Amount, the Bidder shall
be compensated at a uniform rate of ₹ 100 per day or 15% per annum of the difference in amount, whichever is higher from the date on which such excess amounts were blocked till the date of actual unblock; (iv) any delay in unblocking of non-allotted/ partially allotted Bids, exceeding four Working Days from
the Bid/Offer Closing Date, the Bidder shall be compensated at a uniform rate of ₹ 100 per day or 15% per annum of the Bid Amount, whichever is higher for
the entire duration of delay exceeding four Working Days from the Bid/Offer Closing Date by the SCSB responsible for causing such delay in unblocking. The BRLMs shall, in their sole discretion, identify and fix the liability on such intermediary or entity responsible for such delay in unblocking. The post Offer
BRLMs shall be liable for compensating the Bidder at a uniform rate of ₹100 per day or 15% per annum of the Bid Amount, whichever is higher from the date
of receipt of the investor grievance until the date on which the blocked amounts are unblocked. The Bidder shall be compensated in the manner specified in the SEBI circular no. SEBI/HO/CFD/DIL1/CIR/P/2021/47 dated March 31, 2021 and SEBI circular no. SEBI/HO/CFD/DIL2/CIR/P/2021/2480/1/M dated
March 16, 2021, as amended pursuant to SEBI circular no. SEBI/HO/CFD/DIL2/P/CIR/2021/570 dated June 2, 2021, which for the avoidance of doubt, shall
be deemed to be incorporated in the deemed agreement of the Company with the SCSBs, to the extent applicable.
The above timetable, other than the Bid/Offer Closing Date, is indicative and does not constitute any obligation or
liability on our Company, our Selling Shareholders or the BRLMs.
Whilst our Company shall ensure that all steps for the completion of the necessary formalities for the listing and the
commencement of trading of the Equity Shares on the Stock Exchanges are taken within six Working Days of the
Bid/Offer Closing Date, the timetable may be extended due to various factors, such as extension of the Bid/Offer Period
by our Company and the Selling Shareholders in consultation with the BRLMs, revision of the Price Band or any delay
in receiving the final listing and trading approval from the Stock Exchanges. The commencement of trading of the
Equity Shares will be entirely at the discretion of the Stock Exchanges and in accordance with the applicable laws. Each
Selling Shareholder confirms that it shall extend such reasonable support and co-operation required by our Company
and the BRLMs for completion of the necessary formalities for listing and commencement of trading of the Equity
Shares at the Stock Exchanges within six Working Days from the Bid/Offer Closing Date or such other period as may
be prescribed by SEBI.
Submission of Bids (other than Bids from Anchor Investors):
Bid/Offer Period (except the Bid/Offer Closing Date)
Submission and Revision in Bids Only between 10.00 a.m. and 5.00 p.m. (Indian Standard Time (“IST”)
Bid/Offer Closing Date*
Submission and Revision in Bids Only between 10.00 a.m. and 3.00 p.m. IST * UPI mandate end time and date shall be at 12.00pm on Monday, November 8, 2021
On the Bid/ Offer Closing Date, the Bids shall be uploaded until:
(i) 4.00 p.m. IST in case of Bids by QIBs and Non-Institutional Bidders, and
(ii) until 5.00 p.m. IST or such extended time as permitted by the Stock Exchanges, in case of Bids by RIBs.
On Bid/Offer Closing Date, extension of time may be granted by Stock Exchanges only for uploading Bids received by Retail
Individual Bidders, after taking into account the total number of Bids received and as reported by the BRLMs to the Stock
Exchanges.
The Registrar to the Offer shall submit the details of cancelled/withdrawn/deleted applications to the SCSB’s on daily basis
within 60 minutes of the Bid closure time from the Bid/ Offer Opening Date until the Bid/Offer Closing Date by obtaining the
same from the Stock Exchanges. The SCSB’s shall unblock such applications by the closing hours of the Working Day.
322
It is clarified that Bids not uploaded on the electronic bidding system or in respect of which the full Bid Amount is not
blocked by SCSBs or not blocked under the UPI Mechanism in the relevant ASBA Account, as the case may be, would
be rejected.
Due to limitation of time available for uploading the Bids on the Bid/Offer Closing Date, Bidders are advised to submit their
Bids one day prior to the Bid/Offer Closing Date. Any time mentioned in this Red Herring Prospectus is IST. Bidders are
cautioned that, in the event a large number of Bids are received on the Bid/Offer Closing Date, some Bids may not get uploaded
due to lack of sufficient time. Such Bids that cannot be uploaded will not be considered for allocation under the Offer. Bids
will be accepted only during Working Days during the Bid/ Offer Period.
Our Company and the Selling Shareholders, in consultation with the BRLMs reserve the right to revise the Price Band during
the Bid/Offer Period. The revision in the Price Band shall not exceed 20% on either side, i.e. the Floor Price can move up or
down to the extent of 20% of the Floor Price and the Cap Price will be revised accordingly, but the Floor Price shall not be less
than the face value of the Equity Shares.
In case of revision in the Price Band, the Bid/Offer Period shall be extended for at least three additional Working Days
after such revision, subject to the Bid/Offer Period not exceeding 10 Working Days. In cases of force majeure, banking
strike or similar circumstances, our Company and the Selling Shareholders in consultation with the BRLMs, for reasons
to be recorded in writing, extend the Bid/Offer Period for a minimum of three Working Days, subject to the Bid/ Offer
Period not exceeding 10 Working Days. Any revision in Price Band, and the revised Bid/Offer Period, if applicable, shall
be widely disseminated by notification to the Stock Exchanges, by issuing a press release and also by indicating the
change on the terminal of the Syndicate Member and by intimation to the Designated Intermediaries.
In case of discrepancy in data entered in the electronic book vis-vis data contained in the Bid cum Application Form for a
particular Bidder, the details as per the Bid file received from the Stock Exchanges shall be taken as the final data for the
purpose of Allotment.
Minimum Subscription
The requirement of minimum subscription is not applicable to the Offer in accordance with the SEBI ICDR Regulations.
However, if our Company does not make the minimum Allotment as specified under terms of the Rule 19(2)(b) of the SCRR,
including devolvement of Underwriters, if any, within 60 days from the date of Bid/ Offer Closing Date, the Selling
Shareholders, to the extent applicable, and our Company shall forthwith refund the entire subscription amount received, in
accordance with applicable law including the SEBI circular bearing no. SEBI/HO/CFD/DIL1/CIR/P/2021/47 dated March 31,
2021. If there is a delay beyond the prescribed time, the Selling Shareholders, to the extent applicable, and our Company shall
pay interest prescribed under the applicable law.
Further, our Company and the Selling Shareholders shall ensure that the number of prospective Allottees to whom the Equity
Shares will be Allotted shall not be less than 1,000 in compliance with Regulation 49(1) of SEBI ICDR Regulations, failing
which, the entire application money shall be unblocked in the respective ASBA Accounts of the Bidders. In case of delay, if
any, in unblocking the ASBA Accounts within such timeline as prescribed under applicable laws, our Company and the Selling
Shareholders shall be liable to pay interest on the application money in accordance with applicable laws. In case of an under
subscription in the Offer, the Equity Shares proposed for sale by each Selling Shareholder shall be in proportion to the Offered
Shares by such Selling Shareholder.
The Selling Shareholders shall reimburse, in proportion to their respective Offered Shares, any expenses and interest incurred
by our Company on behalf of the Selling Shareholders for any delays in making refunds as required under the Companies Act
and any other applicable law, provided that the Selling Shareholders shall not be responsible or liable for payment of such
expenses or interest, unless such delay is solely and directly attributable to an act or omission of the respective Selling
Shareholder.
Arrangements for Disposal of Odd Lots
There are no arrangements for disposal of odd lots since our Equity Shares will be traded in dematerialised form only and
market lot for our Equity Shares will be one Equity Share.
New Financial Instruments
Our Company is not issuing any new financial instruments through this Offer.
Restrictions, if any on Transfer and Transmission of Equity Shares
Except for lock-in of the pre-Offer capital of our Company, lock-in of our Promoters’ minimum contribution under the SEBI
ICDR Regulations and the Anchor Investor lock-in as provided in “Capital Structure” on page 78 and except as provided under
the Articles of Association, there are no restrictions on transfer of the Equity Shares. Further, there are no restrictions on
323
transmission of any shares of our Company and on their consolidation or splitting, except as provided in the Articles of
Association. For details, see “Description of Equity Shares and Terms of Articles of Association” on page 342.
Withdrawal of the Offer
Our Company and the Selling Shareholders, in consultation with the BRLMs, reserve the right not to proceed with the Offer,
after the Bid/ Offer Opening Date but before the Allotment. In such an event, our Company would issue a public notice in the
newspapers in which the pre-Offer advertisements were published, within two days of the Bid/ Offer Closing Date or such other
time as may be prescribed by SEBI, providing reasons for not proceeding with the Offer and inform the Stock Exchanges
promptly on which the Equity Shares are proposed to be listed. The BRLMs, through the Registrar to the Offer, shall notify the
SCSBs and the Sponsor Company, to unblock the bank accounts of the ASBA Bidders within one Working Day from the date
of receipt of such notification and also inform the Bankers to the Offer to process refunds to the Anchor Investors, as the case
may be.
If our Company and the Selling Shareholders, in consultation with the Book Running Lead Managers withdraws the Offer after
the Bid/ Offer Closing Date and thereafter determines that it will proceed with an issue of the Equity Shares, our Company shall
file a fresh draft red herring prospectus with SEBI. Notwithstanding the foregoing, this Offer is also subject to obtaining (i) the
final listing and trading approvals of the Stock Exchanges, which our Company shall apply for after Allotment; and (ii) the final
RoC approval of the Prospectus after it is filed with the RoC. If Allotment is not made within the prescribed time period under
applicable law, the entire subscription amount received will be refunded/unblocked within the time prescribed under applicable
law.
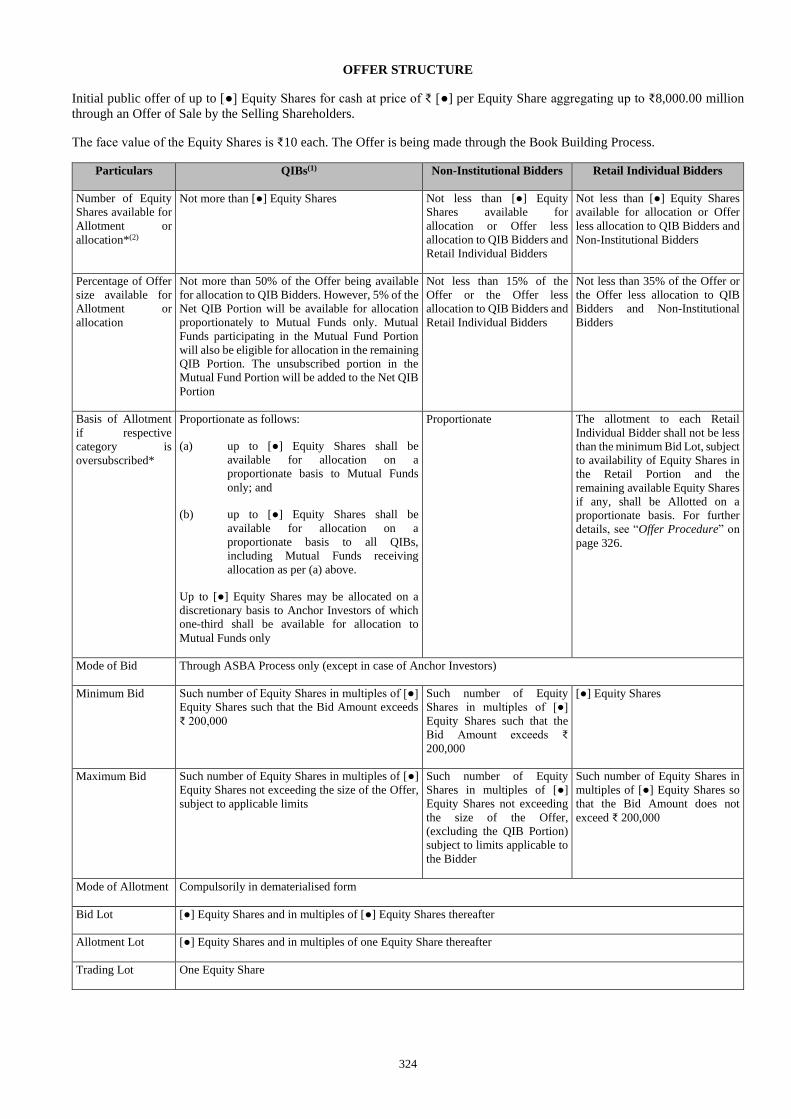
324
OFFER STRUCTURE
Initial public offer of up to [●] Equity Shares for cash at price of ₹ [●] per Equity Share aggregating up to ₹8,000.00 million
through an Offer of Sale by the Selling Shareholders.
The face value of the Equity Shares is ₹10 each. The Offer is being made through the Book Building Process.
Particulars QIBs(1) Non-Institutional Bidders Retail Individual Bidders
Number of Equity
Shares available for
Allotment or
allocation*(2)
Not more than [●] Equity Shares Not less than [●] Equity
Shares available for
allocation or Offer less
allocation to QIB Bidders and
Retail Individual Bidders
Not less than [●] Equity Shares
available for allocation or Offer
less allocation to QIB Bidders and
Non-Institutional Bidders
Percentage of Offer
size available for
Allotment or
allocation
Not more than 50% of the Offer being available
for allocation to QIB Bidders. However, 5% of the
Net QIB Portion will be available for allocation
proportionately to Mutual Funds only. Mutual
Funds participating in the Mutual Fund Portion
will also be eligible for allocation in the remaining
QIB Portion. The unsubscribed portion in the
Mutual Fund Portion will be added to the Net QIB
Portion
Not less than 15% of the
Offer or the Offer less
allocation to QIB Bidders and
Retail Individual Bidders
Not less than 35% of the Offer or
the Offer less allocation to QIB
Bidders and Non-Institutional
Bidders
Basis of Allotment
if respective
category is
oversubscribed*
Proportionate as follows:
(a) up to [●] Equity Shares shall be
available for allocation on a
proportionate basis to Mutual Funds
only; and
(b) up to [●] Equity Shares shall be
available for allocation on a
proportionate basis to all QIBs,
including Mutual Funds receiving
allocation as per (a) above.
Up to [●] Equity Shares may be allocated on a
discretionary basis to Anchor Investors of which
one-third shall be available for allocation to
Mutual Funds only
Proportionate The allotment to each Retail
Individual Bidder shall not be less
than the minimum Bid Lot, subject
to availability of Equity Shares in
the Retail Portion and the
remaining available Equity Shares
if any, shall be Allotted on a
proportionate basis. For further
details, see “Offer Procedure” on
page 326.
Mode of Bid Through ASBA Process only (except in case of Anchor Investors)
Minimum Bid Such number of Equity Shares in multiples of [●]
Equity Shares such that the Bid Amount exceeds
₹ 200,000
Such number of Equity
Shares in multiples of [●]
Equity Shares such that the
Bid Amount exceeds ₹
200,000
[●] Equity Shares
Maximum Bid Such number of Equity Shares in multiples of [●]
Equity Shares not exceeding the size of the Offer,
subject to applicable limits
Such number of Equity
Shares in multiples of [●]
Equity Shares not exceeding
the size of the Offer,
(excluding the QIB Portion)
subject to limits applicable to
the Bidder
Such number of Equity Shares in
multiples of [●] Equity Shares so
that the Bid Amount does not
exceed ₹ 200,000
Mode of Allotment Compulsorily in dematerialised form
Bid Lot [●] Equity Shares and in multiples of [●] Equity Shares thereafter
Allotment Lot [●] Equity Shares and in multiples of one Equity Share thereafter
Trading Lot One Equity Share
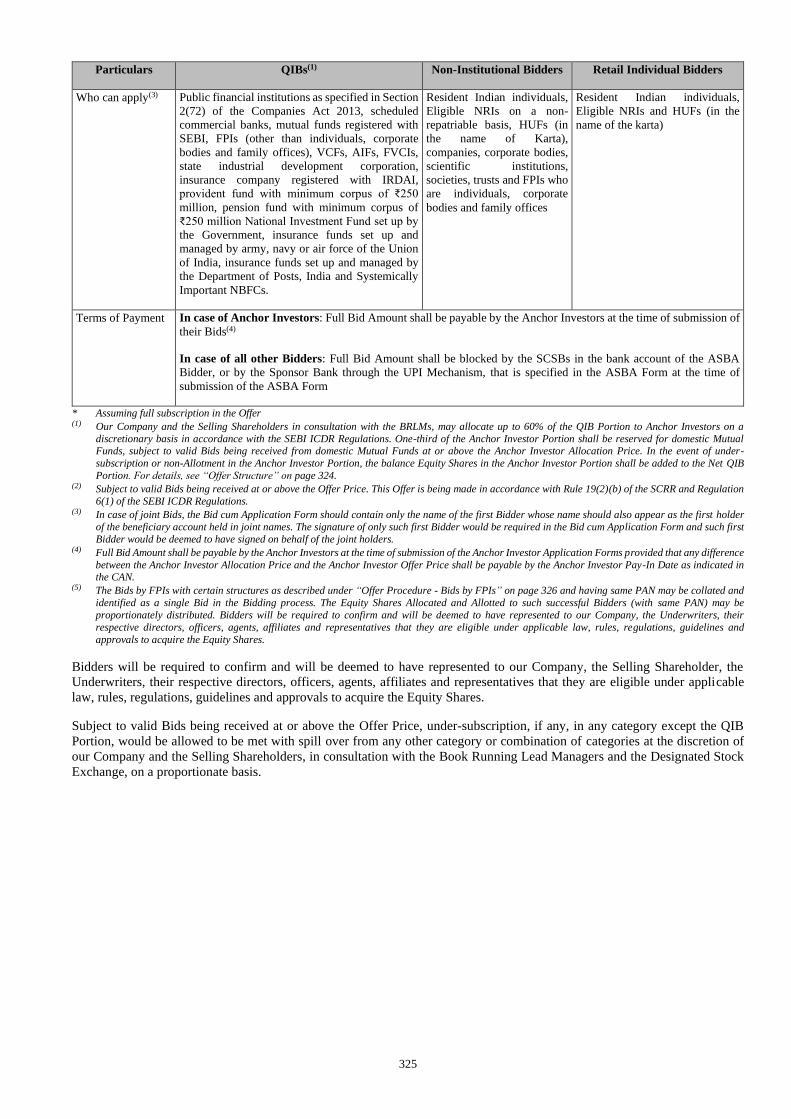
325
Particulars QIBs(1) Non-Institutional Bidders Retail Individual Bidders
Who can apply(3) Public financial institutions as specified in Section
2(72) of the Companies Act 2013, scheduled
commercial banks, mutual funds registered with
SEBI, FPIs (other than individuals, corporate
bodies and family offices), VCFs, AIFs, FVCIs,
state industrial development corporation,
insurance company registered with IRDAI,
provident fund with minimum corpus of ₹250
million, pension fund with minimum corpus of
₹250 million National Investment Fund set up by
the Government, insurance funds set up and
managed by army, navy or air force of the Union
of India, insurance funds set up and managed by
the Department of Posts, India and Systemically
Important NBFCs.
Resident Indian individuals,
Eligible NRIs on a non-
repatriable basis, HUFs (in
the name of Karta),
companies, corporate bodies,
scientific institutions,
societies, trusts and FPIs who
are individuals, corporate
bodies and family offices
Resident Indian individuals,
Eligible NRIs and HUFs (in the
name of the karta)
Terms of Payment In case of Anchor Investors: Full Bid Amount shall be payable by the Anchor Investors at the time of submission of
their Bids(4)
In case of all other Bidders: Full Bid Amount shall be blocked by the SCSBs in the bank account of the ASBA
Bidder, or by the Sponsor Bank through the UPI Mechanism, that is specified in the ASBA Form at the time of
submission of the ASBA Form
* Assuming full subscription in the Offer (1) Our Company and the Selling Shareholders in consultation with the BRLMs, may allocate up to 60% of the QIB Portion to Anchor Investors on a
discretionary basis in accordance with the SEBI ICDR Regulations. One-third of the Anchor Investor Portion shall be reserved for domestic Mutual Funds, subject to valid Bids being received from domestic Mutual Funds at or above the Anchor Investor Allocation Price. In the event of under-
subscription or non-Allotment in the Anchor Investor Portion, the balance Equity Shares in the Anchor Investor Portion shall be added to the Net QIB
Portion. For details, see “Offer Structure” on page 324. (2) Subject to valid Bids being received at or above the Offer Price. This Offer is being made in accordance with Rule 19(2)(b) of the SCRR and Regulation
6(1) of the SEBI ICDR Regulations. (3) In case of joint Bids, the Bid cum Application Form should contain only the name of the first Bidder whose name should also appear as the first holder
of the beneficiary account held in joint names. The signature of only such first Bidder would be required in the Bid cum Application Form and such first
Bidder would be deemed to have signed on behalf of the joint holders. (4) Full Bid Amount shall be payable by the Anchor Investors at the time of submission of the Anchor Investor Application Forms provided that any difference
between the Anchor Investor Allocation Price and the Anchor Investor Offer Price shall be payable by the Anchor Investor Pay-In Date as indicated in the CAN.
(5) The Bids by FPIs with certain structures as described under “Offer Procedure - Bids by FPIs” on page 326 and having same PAN may be collated and
identified as a single Bid in the Bidding process. The Equity Shares Allocated and Allotted to such successful Bidders (with same PAN) may be
proportionately distributed. Bidders will be required to confirm and will be deemed to have represented to our Company, the Underwriters, their
respective directors, officers, agents, affiliates and representatives that they are eligible under applicable law, rules, regulations, guidelines and
approvals to acquire the Equity Shares.
Bidders will be required to confirm and will be deemed to have represented to our Company, the Selling Shareholder, the
Underwriters, their respective directors, officers, agents, affiliates and representatives that they are eligible under applicable
law, rules, regulations, guidelines and approvals to acquire the Equity Shares.
Subject to valid Bids being received at or above the Offer Price, under-subscription, if any, in any category except the QIB
Portion, would be allowed to be met with spill over from any other category or combination of categories at the discretion of
our Company and the Selling Shareholders, in consultation with the Book Running Lead Managers and the Designated Stock
Exchange, on a proportionate basis.
326
OFFER PROCEDURE
All Bidders should read the General Information Document which highlights the key rules, processes and procedures applicable
to public issues in general in accordance with the provisions of the Companies Act, the SCRA, the SCRR and the SEBI ICDR
Regulations which is part of the abridged prospectus accompanying the Bid cum Application Form. The General Information
Document is available on the websites of the Stock Exchanges and the BRLMs. Please refer to the relevant provisions of the
General Information Document which are applicable to the Offer, including in relation to the process for Bids by Retail
Individual Bidders through the UPI Mechanism.
Additionally, all Bidders may refer to the General Information Document for information in relation to (i) category of investors
eligible to participate in the Offer; (ii) maximum and minimum Bid size; (iii) price discovery and allocation; (iv) payment
instructions for ASBA Bidders/Applicants; (v) issuance of CAN and Allotment in the Offer; (vi) general instructions (limited to
instructions for completing the Bid cum Application Form); (vii) submission of Bid cum Application Form; (viii) other
instructions (limited to joint bids in cases of individual, multiple bids and instances when an application would be rejected on
technical grounds); (ix) applicable provisions of the Companies Act, 2013 relating to punishment for fictitious applications;
(x) mode of making refunds; (xi) Designated Date; (xii) disposal of applications; and (xiii) interest in case of delay in allotment
or refund.
SEBI vide its circular no. SEBI/HO/CFD/DIL2/CIR/P/2018/138 dated November 1, 2018 read with its circular no.
SEBI/HO/CFD/DIL2/CIR/P/2019/50 dated April 3, 2019, has introduced an alternate payment mechanism using Unified
Payments Interface (“UPI”) and consequent reduction in timelines for listing in a phased manner. From January 1, 2019, the
UPI Mechanism for RIBs applying through Designated Intermediaries was made effective along with the existing process and
existing timeline of T+6 days. (“UPI Phase I”). The UPI Phase I was effective until June 30, 2019.
With effect from July 1, 2019, SEBI vide its circular no. SEBI/HO/CFD/DIL2/CIR/P/2019/76 dated June 28, 2019, read with
circular bearing number SEBI/HO/CFD/DIL2/CIR/P/2019/85 dated July 26, 2019 with respect to Bids by RIBs through
Designated Intermediaries (other than SCSBs), the existing process of physical movement of forms from such Designated
Intermediaries to SCSBs for blocking of funds has been discontinued and only the UPI Mechanism for such Bids with existing
timeline of T+6 days was mandated for a period of three months or launch of five main board public issues, whichever is later
(“UPI Phase II”). Subsequently, however, SEBI vide its circular no. SEBI/HO/CFD/DIL2/CIR/P/2020/50 dated March 30,
2020 extended the timeline for implementation of UPI Phase II until further notice. The final reduced timeline will be made
effective using the UPI Mechanism for applications by RIBs (“UPI Phase III”), as may be prescribed by SEBI. The Offer will
be undertaken pursuant to the processes and procedures under UPI Phase II, subject to any circulars, clarification or
notification issued by the SEBI from time to time. Further, SEBI vide its circular no.
SEBI/HO/CFD/DIL2/CIR/P/2021/2480/1/M dated March 16, 2021, as amended pursuant to SEBI circular no.
SEBI/HO/CFD/DIL2/P/CIR/2021/570 dated June 2, 2021, has introduced certain additional measures for streamlining the
process of initial public offers and redressing investor grievances. This circular is effective for initial public offers opening
on/or after May 1, 2021, except as amended pursuant to SEBI circular SEBI/HO/CFD/DIL2/P/CIR/2021/570 dated June 2,
2021, and the provisions of this circular, as amended, are deemed to form part of this Red Herring Prospectus.
Our Company, the Selling Shareholders and the BRLMs do not accept any responsibility for the completeness and accuracy of
the information stated in this section and are not liable for any amendment, modification or change in the applicable law which
may occur after the date of this Red Herring Prospectus. Bidders are advised to make their independent investigations and
ensure that their Bids are submitted in accordance with applicable laws and do not exceed the investment limits or maximum
number of the Equity Shares that can be held by them under applicable law or as specified in this Red Herring Prospectus and
the Prospectus.
Further, our Company and the Members of the Syndicate are not liable for any adverse occurrences consequent to the
implementation of the UPI Mechanism for application in the Offer.
Book Building Procedure
The Offer is being made in terms of Rule 19(2)(b) of the SCRR, through the Book Building Process in accordance with
Regulation 6(1) of the SEBI ICDR Regulations wherein not more than 50% of the Offer shall be allocated on a proportionate
basis to QIBs, provided that our Company and the Selling Shareholders in consultation with the BRLMs, allocate up to 60% of
the QIB Portion to Anchor Investors on a discretionary basis in accordance with the SEBI ICDR Regulations, of which one-
third shall be reserved for domestic Mutual Funds, subject to valid Bids being received from domestic Mutual Funds at or above
the Anchor Investor Allocation Price. In the event of under-subscription, or non-allotment in the Anchor Investor Portion, the
balance Equity Shares shall be added to the Net QIB Portion. Further, 5% of the Net QIB Portion shall be available for allocation
on a proportionate basis only to Mutual Funds, and the remainder of the Net QIB Portion shall be available for allocation on a
proportionate basis to all QIBs (other than Anchor Investors), including Mutual Funds, subject to valid Bids being received at
or above the Offer Price. Further, not less than 15% of the Offer shall be available for allocation on a proportionate basis to
Non-Institutional Bidders and not less than 35% of the Offer shall be available for allocation to Retail Individual Bidders in
accordance with the SEBI ICDR Regulations, subject to valid Bids being received at or above the Offer Price.
327
Under-subscription, if any, in any category, except in the QIB Portion, would be allowed to be met with spill over from any
other category or combination of categories of Bidders at the discretion of our Company and the Selling Shareholders in
consultation with the BRLMs and the Designated Stock Exchange subject to receipt of valid Bids received at or above the Offer
Price. Under-subscription, if any, in the QIB Portion, would not be allowed to be met with spill-over from any other category
or a combination of categories.
The Equity Shares, on Allotment, shall be traded only in the dematerialised segment of the Stock Exchanges.
Investors should note that the Equity Shares will be Allotted to all successful Bidders only in dematerialised form. The
Bid cum Application Forms which do not have the details of the Bidders’ depository account, including DP ID, Client
ID, PAN and UPI ID, for RIBs Bidding using the UPI Mechanism, shall be treated as incomplete and will be rejected.
Bidders will not have the option of being Allotted Equity Shares in physical form. However, they may get the Equity
Shares rematerialized subsequent to Allotment of the Equity Shares in the Offer, in compliance with Applicable Law.
Phased implementation of Unified Payments Interface
SEBI has issued the UPI Circulars in relation to streamlining the process of public issue of inter alia, equity shares. Pursuant to
the UPI Circulars, the UPI Mechanism has been introduced in a phased manner as a payment mechanism (in addition to
mechanism of blocking funds in the account maintained with SCSBs under ASBA) for applications by RIBs through Designated
Intermediaries with the objective to reduce the time duration from public issue closure to listing from six Working Days to up
to three Working Days. Considering the time required for making necessary changes to the systems and to ensure complete and
smooth transition to the UPI payment mechanism, the UPI Circulars have introduced the UPI Mechanism in three phases in the
following manner:
Phase I: This phase was applicable from January 1, 2019 until March 31, 2019 or floating of five main board public issues,
whichever was later. Subsequently, the timeline for implementation of Phase I was extended until June 30, 2019. Under this
phase, a RIB had the option to submit the ASBA Form with any of the Designated Intermediary and use his/ her UPI ID for the
purpose of blocking of funds. The time duration from public issue closure to listing continued to be six Working Days.
Phase II: This phase has become applicable from July 1, 2019 and was to initially continue for a period of three months or
floating of five main board public issues, whichever is later. SEBI vide its circular no. SEBI/HO/CFD/DCR2/CIR/P/2019/133
dated November 8, 2019 has decided to extend the timeline for implementation of UPI Phase II until March 31, 2020.
Subsequently, SEBI vide its circular no. SEBI/HO/CFD/DIL2/CIR/P/2020/50 dated March 30, 2020 extended the timeline for
implementation of UPI Phase II until further notice. Under this phase, submission of the ASBA Form by RIBs through
Designated Intermediaries (other than SCSBs) to SCSBs for blocking of funds has been discontinued and replaced by the UPI
Mechanism. However, the time duration from public issue closure to listing continues to be six Working Days during this phase.
Phase III: The commencement period of Phase III is yet to be notified. In this phase, the time duration from public issue closure
to listing would be reduced to three Working Days. Accordingly, upon commencement of Phase III, the reduced time duration
shall be applicable for the Offer.
Pursuant to the UPI Circulars, SEBI has set out specific requirements for redressal of investor grievances for applications that
have been made through the UPI Mechanism. The requirements of the UPI Circulars include, appointment of a nodal officer
by the SCSB and submission of their details to SEBI, the requirement for SCSBs to send SMS alerts for the blocking and
unblocking of UPI mandates, the requirement for the Registrar to submit details of cancelled, withdrawn or deleted applications,
and the requirement for the bank accounts of unsuccessful Bidders to be unblocked no later than one day from the date on which
the Basis of Allotment is finalised. Failure to unblock the accounts within the timeline would result in the SCSBs being
penalised under the relevant securities law. Additionally, if there is any delay in the redressal of investors’ complaints, the
relevant SCSB as well as the post – Offer BRLM will be required to compensate the concerned investor.
For further details, refer to the “General Information Document” available on the websites of the Stock Exchanges and the
BRLMs.
Bid cum Application Form
Copies of the Bid cum Application Form (other than for Anchor Investors) and the abridged prospectus will be available with
the Designated Intermediaries at the Bidding Centres, and our Registered and Corporate Office. An electronic copy of the Bid
cum Application Form will also be available for download on the websites of NSE (www.nseindia.com) and BSE
(www.bseindia.com) at least one day prior to the Bid/ Offer Opening Date.
Copies of the Anchor Investor Application Form will be available at the office of the BRLMs.
All Bidders (other than Anchor Investors) shall mandatorily participate in the Offer only through the ASBA process. Anchor
Investors are not permitted to participate in the Offer through the ASBA process. The RIBs can additionally Bid through the
UPI Mechanism.
328
RIBs Bidding using the UPI Mechanism must provide the valid UPI ID in the relevant space provided in the Bid cum
Application Form and the Bid cum Application Forms that do not contain the UPI ID are liable to be rejected.
ASBA Bidders (not using the UPI Mechanism) must provide bank account details and authorisation to block funds in their
respective ASBA Accounts in the relevant space provided in the ASBA Form and the ASBA Forms that do not contain such
details are liable to be rejected.
ASBA Bidders shall ensure that the Bids are made on ASBA Forms bearing the stamp of the Designated Intermediary, submitted
at the Bidding Centres only (except in case of electronic ASBA Forms) and the ASBA Forms not bearing such specified stamp
are liable to be rejected. RIBs using UPI Mechanism, may submit their ASBA Forms, including details of their UPI IDs, with
the Syndicate, sub-Syndicate members, Registered Brokers, RTAs or CDPs. RIBs authorising an SCSB to block the Bid
Amount in the ASBA Account may submit their ASBA Forms with the SCSBs (except RIBs using the UPI Mechanism). ASBA
Bidders must ensure that the ASBA Account has sufficient credit balance such that an amount equivalent to the full Bid Amount
can be blocked by the SCSB or the Sponsor Bank, as applicable at the time of submitting the Bid.
The prescribed colour of the Bid cum Application Form for the various categories is as follows:
Category Colour of Bid cum Application
Form*
Resident Indians, including resident QIBs, Non-Institutional Bidders, Retail Individual Bidders and
Eligible NRIs applying on a non-repatriation basis
White
Eligible NRIs, FVCIs, FPIs and registered bilateral and multilateral institutions applying on a repatriation
basis
Blue
Anchor Investors White * Excluding electronic Bid cum Application Forms
Notes:
(1) Electronic Bid cum Application forms and the abridged prospectus will also be available for download on the website of NSE (www.nseindia.com) and BSE (www.bseindia.com)
(2) Bid cum Application Forms for Anchor Investors shall be available at the office of the BRLMs
In case of ASBA forms, the relevant Designated Intermediaries shall upload the relevant bid details in the electronic bidding
system of the Stock Exchanges. For ASBA Forms (other than RIBs using UPI Mechanism) Designated Intermediaries (other
than SCSBs) shall submit/ deliver the ASBA Forms to the respective SCSB where the Bidder has an ASBA bank account and
shall not submit it to any non-SCSB bank or any Escrow Collection Bank.
The Sponsor Bank shall host a web portal for intermediaries (closed user group) from the date of Bid/ Offer Opening Date until
the date of listing of the Equity Shares with details of statistics of mandate blocks/unblocks, performance of apps and UPI
handles, down-time/network latency (if any) across intermediaries and any such processes having an impact/bearing on the
Offer Bidding process.
Electronic registration of Bids
a. The Designated Intermediary may register the Bids using the on-line facilities of the Stock Exchanges. The Designated
Intermediaries can also set up facilities for off-line electronic registration of Bids, subject to the condition that they
may subsequently upload the off-line data file into the on-line facilities for Book Building on a regular basis before
the closure of the Offer.
b. On the Bid/Offer Closing Date, the Designated Intermediaries may upload the Bids until such time as may be permitted
by the Stock Exchanges and as disclosed in this Red Herring Prospectus.
c. Only Bids that are uploaded on the Stock Exchanges Platform are considered for allocation/Allotment. The Designated
Intermediaries are given until 1:00 pm on the next Working Day following the Bid/Offer Closing Date to modify select
fields uploaded in the Stock Exchange Platform during the Bid/Offer Period after which the Stock Exchange(s) send
the bid information to the Registrar to the Offer for further processing.
Participation by Promoters and members of the Promoter Group of our Company, the BRLMs and the Syndicate
Member
The BRLMs and the Syndicate Member shall not be allowed to purchase Equity Shares in the Offer in any manner, except
towards fulfilling their underwriting obligations. However, the associates and affiliates of the BRLMs and the Syndicate
Member may Bid for Equity Shares in the Offer, either in the QIB Portion or in the Non-Institutional Portion as may be
applicable to such Bidders, where the allocation is on a proportionate basis and such subscription may be on their own account
or on behalf of their clients. All categories of investors, including associates or affiliates of the BRLMs and Syndicate Member,
shall be treated equally for the purpose of allocation to be made on a proportionate basis.
329
Neither (i) the BRLMs or any associates of the BRLMs (except Mutual Funds sponsored by entities which are associates of the
BRLMs or insurance companies promoted by entities which are associate of BRLMs or AIFs sponsored by the entities which
are associate of the BRLMs or FPIs (other than individuals, corporate bodies and family offices) sponsored by the entities which
are associates of the BRLMs) nor (ii) any “person related to our Promoters/ Promoter Group” shall apply in the Offer under the
Anchor Investor Portion.
For the purposes of this section, a QIB who has any of the following rights shall be deemed to be a “person related to our
Promoters/ Promoter Group”: (a) rights under a shareholders’ agreement or voting agreement entered into with our Promoters
or Promoter Group; (b) veto rights; or (c) right to appoint any nominee director on our Board.
Further, an Anchor Investor shall be deemed to be an associate of the BRLMs, if: (a) either of them controls, directly or
indirectly through its subsidiary or holding company, not less than 15% of the voting rights in the other; or (b) either of them,
directly or indirectly, by itself or in combination with other persons, exercises control over the other; or (c) there is a common
director, excluding a nominee director, amongst the Anchor Investor and the BRLMs.
Our Promoters and members of our Promoter Group will not participate in the Offer, except in their capacity as Selling
Shareholders tendering Equity Shares in the Offer for Sale.
Bids by Mutual Funds
With respect to Bids by Mutual Funds, a certified copy of their SEBI registration certificate must be lodged along with the Bid
cum Application Form. Failing this, our Company and the Selling Shareholders in consultation with the BRLMs reserve the
right to reject any Bid without assigning any reason thereof.
Bids made by asset management companies or custodians of Mutual Funds shall specifically state names of the concerned
schemes for which such Bids are made.
In case of a Mutual Fund, a separate Bid can be made in respect of each scheme of the Mutual Fund registered with SEBI and
such Bids in respect of more than one scheme of the Mutual Fund will not be treated as multiple Bids provided that the Bids
clearly indicate the scheme concerned for which the Bid has been made.
No Mutual Fund scheme shall invest more than 10% of its NAV in equity shares or equity related instruments of any single
company provided that the limit of 10% shall not be applicable for investments in case of index funds or sector or industry
specific schemes. No Mutual Fund under all its schemes should own more than 10% of any company’s paid-up share capital
carrying voting rights.
Bids by Eligible NRIs
Eligible NRIs may obtain copies of Bid cum Application Form from the Designated Intermediaries. Only Bids accompanied
by payment in Indian Rupees or freely convertible foreign exchange will be considered for Allotment. Eligible NRI Bidders
bidding on a repatriation basis by using the Non-Resident Forms should authorise their respective SCSB (if they are Bidding
directly through the SCSB) or confirm or accept the UPI Mandate Request (in case of Bidding through the UPI Mechanism) to
block their Non- Resident External (“NRE”) accounts, or Foreign Currency Non-Resident (“FCNR”) Accounts, and eligible
NRI Bidders bidding on a non-repatriation basis by using Resident Forms should authorise their respective SCSB (if they are
Bidding directly through SCSB) or confirm or accept the UPI Mandate Request (in case of Bidding through the UPI Mechanism)
to block their Non-Resident Ordinary (“NRO”) accounts for the full Bid Amount, at the time of the submission of the Bid cum
Application Form. NRIs applying in the Offer through the UPI Mechanism are advised to enquire with the relevant bank,
whether their account is UPI linked, prior to submitting a Bid cum Application Form.
Eligible NRIs Bidding on non-repatriation basis are advised to use the Bid cum Application Form for residents (White in
colour). Eligible NRIs Bidding on a repatriation basis are advised to use the Bid cum Application Form meant for Non-Residents
(Blue in colour).
For details of investment by NRIs, see “Restrictions on Foreign Ownership of Indian Securities” on page 340. Participation of
Eligible NRIs shall be subject to the FEMA Non-debt Instruments Rules.
Bids by HUFs
Bids by Hindu Undivided Families or HUFs, should be made in the individual name of the Karta. The Bidder/Applicant should
specify that the Bid is being made in the name of the HUF in the Bid cum Application Form/Application Form as follows:
“Name of sole or first Bidder/Applicant: XYZ Hindu Undivided Family applying through XYZ, where XYZ is the name of the
Karta”. Bids/Applications by HUFs will be considered at par with Bids/Applications from individuals.
Bids by FPIs
330
In case of Bids made by FPIs, a certified copy of the certificate of registration issued under the SEBI FPI Regulations is required
to be attached to the Bid cum Application Form, failing which our Company reserves the right to reject any Bid without
assigning any reason.
To ensure compliance with the above requirement, SEBI, pursuant to its circular dated July 13, 2018, has directed that at the
time of finalisation of the Basis of Allotment, the Registrar shall (i) use the PAN issued by the Income Tax Department of India
for checking compliance for a single FPI; and (ii) obtain validation from Depositories for the FPIs who have invested in the
Offer to ensure there is no breach of the investment limit, within the timelines for issue procedure, as prescribed by SEBI from
time to time.
Bids by following FPIs, submitted with the same PAN but with different beneficiary account numbers, Client IDs and DP IDs
shall not be treated as multiple Bids:
• FPIs which utilise the multi investment manager structure;
• Offshore derivative instruments which have obtained separate FPI registration for ODI and proprietary derivative
investments;
• Sub funds or separate class of investors with segregated portfolio who obtain separate FPI registration;
• FPI registrations granted at investment strategy level/sub fund level where a collective investment scheme or fund has
multiple investment strategies/sub-funds with identifiable differences and managed by a single investment manager;
• Multiple branches in different jurisdictions of foreign bank registered as FPIs;
• Government and Government related investors registered as Category 1 FPIs; and
• Entities registered as collective investment scheme having multiple share classes.
The Bids belonging to any of the above mentioned seven structures and having same PAN may be collated and identified as a
single Bid in the Bidding process. The Equity Shares allotted in the Bid may be proportionately distributed to the applicant FPIs
(with same PAN).
FPIs are permitted to participate in the Offer subject to compliance with conditions and restrictions which may be specified by
the Government from time to time. In terms of the FEMA Non-debt Instruments Rules, for calculating the aggregate holding
of FPIs in a company, holding of all registered FPIs shall be included.
Subject to compliance with all applicable Indian laws, rules, regulations, guidelines and approvals in terms of Regulation 21 of
the SEBI FPI Regulations, an FPI, may issue, subscribe to or otherwise deal in offshore derivative instruments (as defined under
the SEBI FPI Regulations as any instrument, by whatever name called, which is issued overseas by a FPI against securities held
by it in India, as its underlying) directly or indirectly, only in the event (i) such offshore derivative instruments are issued only
by persons registered as Category I FPIs; (ii) such offshore derivative instruments are issued only to persons eligible for
registration as Category I FPIs; (iii) such offshore derivative instruments are issued after compliance with ‘know your client’
norms; and (iv) such other conditions as may be specified by SEBI from time to time.
An FPI issuing offshore derivate instruments is also required to ensure that any transfer of offshore derivative instruments
issued by, or on behalf of it subject to, inter alia, the following conditions:
(a) such offshore derivative instruments are transferred to persons subject to fulfilment of SEBI FPI Regulations; and
(b) prior consent of the FPI is obtained for such transfer, except when the persons to whom the offshore derivative
instruments are to be transferred are pre-approved by the FPI.
The FPIs who wish to participate in the Offer are advised to use the Bid cum Application Form for non-residents.
Further, Bids received from FPIs bearing the same PAN shall be treated as multiple Bids and are liable to be rejected, except
for Bids from FPIs that utilize the multiple investment manager structure in accordance with the Operational Guidelines for
FPIs and Designated Depository Participants issued to facilitate implementation of SEBI FPI Regulations (such structure
referred to as “MIM Structure”), provided such Bids have been made with different beneficiary account numbers, Client IDs
and DP IDs. Accordingly, it should be noted that multiple Bids received from FPIs, who do not utilize the MIM Structure, and
bear the same PAN, are liable to be rejected. In order to ensure valid Bids, FPIs making multiple Bids using the same PAN,
and with different beneficiary account numbers, Client IDs and DP IDs, are required to provide a confirmation in the Bid cum
Application Forms that the relevant FPIs making multiple Bids utilize the MIM Structure and indicate the names of their
respective investment managers in such confirmations. In the absence of such confirmation from the relevant FPIs, such
multiple Bids shall be rejected.

331
Please note that in terms of the General Information Document, the maximum Bid by any Bidder including QIB Bidder should
not exceed the investment limits prescribed for them under applicable laws. Further, MIM Bids by an FPI Bidder utilising the
MIM Structure shall be aggregated for determining the permissible maximum Bid. Further, please note that as disclosed in this
Red Herring Prospectus read with the General Information Document, Bid Cum Application Forms are liable to be rejected in
the event that the Bid in the Bid cum Application Form “exceeds the Offer size and/or investment limit or maximum number of
the Equity Shares that can be held under applicable laws or regulations or maximum amount permissible under applicable
laws or regulations, or under the terms of this Red Herring Prospectus.”
For example, an FPI must ensure that any Bid by a single FPI and/ or an investor group (which means the same multiple entities
having common ownership directly or indirectly of more than 50% or common control) (collective, the “FPI Group”) shall be
below 10% of the total paid-up Equity Share capital of our Company on a fully diluted basis. Any Bids by FPIs and/ or the FPI
Group (including but not limited to (a) FPIs Bidding through the MIM Structure; or (b) FPIs with separate registrations for
offshore derivative instruments and proprietary derivative instruments) for 10% or more of our total paid-up post Offer Equity
Share capital shall be liable to be rejected.
For details of investment by FPIs, see “Restrictions on Foreign Ownership of Indian Securities” on page 340. Participation of
FPIs shall be subject to the FEMA Non-debt Instruments Rules.
All non-resident investors should note that refunds (in case of Anchor Investors), dividends and other distributions, if
any, will be payable in Indian Rupees only and net of bank charges and commission.
Bids by SEBI registered VCFs, AIFs and FVCIs
The SEBI VCF Regulations and the SEBI FVCI Regulations prescribe, among other things, the investment restrictions on VCFs
and FVCIs registered with SEBI. While the SEBI VCF Regulations have since been repealed, the funds registered as VCFs
under the SEBI VCF Regulations continue to be regulated by such regulations until the existing fund or scheme managed by
the fund is wound up. The holding in any company by any individual VCF or FVCIs registered with SEBI should not exceed
25% of the corpus of the VCF of FVCI. Further, VCFs and FVCIs can invest only up to 33.33% of the investible funds in
various prescribed instruments, including in public offering.
Further, the SEBI AIF Regulations prescribe, among other things, the investment restrictions on AIFs. Category I and II AIFs
cannot invest more than 25% of the investible funds in one investee company directly or through investment in the units of
other AIFs. A Category III AIF cannot invest more than 10% of the investible funds in one investee company directly or through
investment in the units of other AIFs. AIFs which are authorised under the fund documents to invest in units of AIFs are
prohibited from offering their units for subscription to other AIFs. A VCF registered as a Category I AIF, as defined in the
SEBI AIF Regulations, cannot invest more than one-third of its investible funds by way of subscription to an initial public
offering of a venture capital undertaking. Additionally, the VCFs which have not re-registered as an AIF under the SEBI AIF
Regulations shall continue to be regulated by the SEBI VCF Regulations until the existing fund or scheme managed by the fund
is wound up.
All non-resident investors should note that refunds (in case of Anchor Investors), dividends and other distributions, if
any, will be payable in Indian Rupees only and net of bank charges and commission.
Our Company or the BRLMs will not be responsible for loss, if any, incurred by the Bidder on account of conversion of foreign
currency.
Bids by limited liability partnerships
In case of Bids made by limited liability partnerships registered under the Limited Liability Partnership Act, 2008, a certified
copy of certificate of registration issued under the Limited Liability Partnership Act, 2008, must be attached to the Bid cum
Application Form. Failing this, our Company and the Selling Shareholders in consultation with the BRLMs reserve the right to
reject any Bid without assigning any reason thereof.
Bids by banking companies
In case of Bids made by banking companies registered with RBI, certified copies of: (i) the certificate of registration issued by
RBI, and (ii) the approval of such banking company’s investment committee are required to be attached to the Bid cum
Application Form, failing which our Company and the Selling Shareholders in consultation with the BRLMs reserve the right
to reject any Bid without assigning any reason.
Bids by SCSBs
SCSBs participating in the Offer are required to comply with applicable law, including the terms of the SEBI circulars (Nos.
CIR/CFD/DIL/12/2012 and CIR/CFD/DIL/1/2013) dated September 13, 2012 and January 2, 2013. Such SCSBs are required
to ensure that for making applications on their own account using ASBA, they should have a separate account in their own

332
name with any other SEBI registered SCSBs. Further, such account shall be used solely for the purpose of making application
in public issues and clear demarcated funds should be available in such account for such applications.
Bids by insurance companies
In case of Bids made by insurance companies registered with the IRDAI, a certified copy of certificate of registration issued by
IRDAI must be attached to the Bid cum Application Form. Failing this, our Company and the Selling Shareholders in
consultation with the BRLMs reserve the right to reject any Bid without assigning any reason thereof.
The exposure norms for insurers, prescribed under the Insurance Regulatory and Development Authority of India (Investment)
Regulations, 2016, as amended, are broadly set forth below:
(a) equity shares of a company: the lower of 10%* of the outstanding equity shares (face value) or 10% of the respective
fund in case of life insurer or 10% of investment assets in case of general insurer or reinsurer or health insurer;
(b) the entire group of the investee company: not more than 15% of the respective fund in case of a life insurer or 15% of
investment assets in case of a general insurer or reinsurer or health insurer or 15% of the investment assets in all
companies belonging to the group, whichever is lower; and
(c) the industry sector in which the investee company operates: not more than 15% of the fund of a life insurer or a general
insurer or a reinsurer or health insurer or 15% of the investment asset, whichever is lower.
The maximum exposure limit, in the case of an investment in equity shares, cannot exceed the lower of an amount of 10% of
the investment assets of a life insurer or general insurer and the amount calculated under (a), (b) and (c) above, as the case may
be.
*The above limit of 10% shall stand substituted as 15% of outstanding equity shares (face value) for insurance companies with
investment assets of ₹2,500,000 million or more and 12% of outstanding equity shares (face value) for insurers with investment
assets of ₹500,000 million or more but less than ₹2,500,000 million.
Insurance companies participating in the Offer shall comply with all applicable regulations, guidelines and circulars issued by
IRDAI from time to time.
Bids by provident funds/pension funds
In case of Bids made by provident funds/pension funds, subject to applicable laws, with minimum corpus of ₹250 million, a
certified copy of a certificate from a chartered accountant certifying the corpus of the provident fund/pension fund must be
attached to the Bid cum Application Form. Failing this, our Company and the Selling Shareholders in consultation with the
BRLMs reserve the right to reject any Bid, without assigning any reason thereof.
Bids under Power of Attorney
In case of Bids made pursuant to a power of attorney or by limited companies, corporate bodies, registered societies, Eligible
FPIs, Mutual Funds, insurance companies, insurance funds set up by the army, navy or air force of the India, insurance funds
set up by the Department of Posts, India or the National Investment Fund and provident funds with a minimum corpus of ₹250
million (subject to applicable law) and pension funds with a minimum corpus of ₹250 million, a certified copy of the power of
attorney or the relevant resolution or authority, as the case may be, along with a certified copy of the memorandum of association
and articles of association and/or bye laws must be lodged along with the Bid cum Application Form. Failing this, our Company
and the Selling Shareholders in consultation with the BRLMs reserve the right to accept or reject any Bid in whole or in part,
in either case, without assigning any reason thereof.
Our Company and the Selling Shareholders in consultation with the BRLMs in their absolute discretion, reserve the right to
relax the above condition of simultaneous lodging of the power of attorney along with the Bid cum Application Form subject
to the terms and conditions that our Company and the Selling Shareholders in consultation with the BRLMs may deem fit.
Bids by Systemically Important Non-Banking Financial Companies
In case of Bids made by Systemically Important NBFCs registered with RBI, certified copies of: (i) the certificate of registration
issued by RBI, (ii) certified copy of its last audited financial statements on a standalone basis and a net worth certificate from
its statutory auditor, and (iii) such other approval as may be required by the Systemically Important NBFCs, are required to be
attached to the Bid cum Application Form. Failing this, our Company and the Selling Shareholders in consultation with the
BRLMs, reserve the right to reject any Bid without assigning any reason thereof. Systemically Important NBFCs participating
in the Offer shall comply with all applicable regulations, guidelines and circulars issued by RBI from time to time.
The investment limit for Systemically Important NBFCs shall be as prescribed by RBI from time to time.
333
In accordance with existing regulations issued by the RBI, OCBs cannot participate in the Offer.
The above information is given for the benefit of the Bidders. Our Company, the Selling Shareholders and the BRLMs
are not liable for any amendments or modification or changes in applicable laws or regulations, which may occur after
the date of this Red Herring Prospectus. Bidders are advised to make their independent investigations and ensure that
any single Bid from them does not exceed the applicable investment limits or maximum number of the Equity Shares
that can be held by them under applicable law or regulation or as specified in this Red Herring Prospectus and the
Prospectus.
General Instructions
Do’s:
1. Investors must ensure that their PAN is linked with Aadhaar and are in compliance with Central Board of Direct Taxes
notification dated February 13, 2020 and press release dated June 25, 2021.
2. Check if you are eligible to apply as per the terms of this Red Herring Prospectus and under applicable law, rules,
regulations, guidelines and approvals. All Bidders (other than Anchor Investors) should submit their Bids through the
ASBA process only;
3. Ensure that you have Bid within the Price Band;
4. Read all the instructions carefully and complete the Bid cum Application Form, as the case may be, in the prescribed
form;
5. Ensure that you (other than in the case of Anchor Investors) have mentioned the correct ASBA Account number if you
are not an RIB using the UPI Mechanism in the Bid cum Application Form and if you are an RIB using the UPI
Mechanism ensure that you have mentioned the correct UPI ID (with maximum length of 45 characters including the
handle), in the Bid cum Application Form;
6. RIBs using UPI Mechanism through the SCSBs and mobile applications shall ensure that the name of the bank appears
in the list of SCSBs which are live on UPI, as displayed on the SEBI website. RIBs shall ensure that the name of the
app and the UPI handle which is used for making the application appears in Annexure ‘A’ to the SEBI circular no.
SEBI/HO/CFD/DIL2/COR/P/2019/85 dated July 26, 2019;
7. Ensure that your Bid cum Application Form bearing the stamp of a Designated Intermediary is submitted to the
Designated Intermediary at the Bidding Centre (except in case of electronic Bids) within the prescribed time. Bidders
(other than Anchor Investors) shall submit the Bid cum Application Form in the manner set out in the General
Information Document;
8. Ensure that you have funds equal to the Bid Amount in the ASBA Account maintained with the SCSB, before
submitting the ASBA Form to any of the Designated Intermediaries;
9. RIBs using UPI Mechanism, may submit their ASBA Forms with the Syndicate Member, Registered Brokers, RTAs
or CDPs and should ensure that the ASBA Form contains the stamp of such Designated Intermediary;
10. Ensure that the signature of the First Bidder in case of joint Bids, is included in the Bid cum Application Forms. If the
first Bidder is not the ASBA Account holder, ensure that the Bid cum Application Form is signed by the ASBA
Account holder. Ensure that you have mentioned the correct bank account number in the Bid cum Application Form;
11. Ensure that you request for and receive a stamped acknowledgement counterfoil of the Bid cum Application Form for
all your Bid options from the concerned Designated Intermediary, if applicable;
12. Ensure that the name(s) given in the Bid cum Application Form is/are exactly the same as the name(s) in which the
beneficiary account is held with the Depository Participant. In case of joint Bids, the Bid cum Application Form should
contain only the name of the First Bidder whose name should also appear as the first holder of the beneficiary account
held in joint names. Ensure that the signature of the First Bidder is included in the Bid cum Application Forms;
13. RIBs Bidding in the Offer to ensure that they shall use only their own ASBA Account or only their own bank account
linked UPI ID which is UPI 2.0 certified by NPCI (only for RIBs using the UPI Mechanism) to make an application
in the Offer and not ASBA Account or bank account linked UPI ID of any third party;
14. Ensure that you submit the revised Bids to the same Designated Intermediary, through whom the original Bid was
placed and obtain a revised acknowledgment;
334
15. Retail Individual Bidders not using the UPI Mechanism, should submit their Bid cum Application Form directly with
SCSBs and/or the designated branches of SCSBs;
16. Ensure that you have correctly signed the authorisation/undertaking box in the Bid cum Application Form, or have
otherwise provided an authorisation to the SCSB or Sponsor Bank, as applicable, via the electronic mode, for blocking
funds in the ASBA Account equivalent to the Bid Amount mentioned in the Bid cum Application Form, as the case
may be, at the time of submission of the Bid. In case of RIBs submitting their Bids and participating in the Offer
through the UPI Mechanism, ensure that you authorise the UPI Mandate Request raised by the Sponsor Bank for
blocking of funds equivalent to Bid Amount and subsequent debit of funds in case of Allotment;
17. Except for Bids (i) on behalf of the Central or State Governments and the officials appointed by the courts, who, in
terms of the SEBI circular no. MRD/DoP/Cir-20/2008 dated June 30, 2008, may be exempt from specifying their PAN
for transacting in the securities market, (ii) submitted by investors who are exempt from the requirement of
obtaining/specifying their PAN for transacting in the securities market, and (iii) Bids by persons resident in the state
of Sikkim, who, in terms of a SEBI circular dated July 20, 2006, may be exempted from specifying their PAN for
transacting in the securities market, all Bidders should mention their PAN allotted under the IT Act. The exemption
for the Central or the State Government and officials appointed by the courts and for investors residing in the State of
Sikkim is subject to (a) the Demographic Details received from the respective depositories confirming the exemption
granted to the beneficiary owner by a suitable description in the PAN field and the beneficiary account remaining in
“active status”; and (b) in the case of residents of Sikkim, the address as per the Demographic Details evidencing the
same. All other applications in which PAN is not mentioned will be rejected;
18. Ensure that the Demographic Details are updated, true and correct in all respects;
19. Ensure that thumb impressions and signatures other than in the languages specified in the Eighth Schedule to the
Constitution of India are attested by a Magistrate or a Notary Public or a Special Executive Magistrate under official
seal;
20. Ensure that the category and the investor status is indicated in the Bid cum Application Form;
21. Ensure that in case of Bids under power of attorney or by limited companies, corporates, trust, etc., relevant documents
are submitted;
22. Ensure that Bids submitted by any person resident outside India is in compliance with applicable foreign and Indian
laws;
23. Since the Allotment will be in demat form only, ensure that the Bidder’s depository account is active, the correct DP
ID, Client ID, the PAN, UPI ID, if applicable, are mentioned in their Bid cum Application Form and that the name of
the Bidder, the DP ID, Client ID, the PAN and UPI ID, if applicable, entered into the online IPO system of the Stock
Exchanges by the relevant Designated Intermediary, as applicable, matches with the name, DP ID, Client ID, PAN
and UPI ID, if applicable, available in the depository database;
24. Ensure that when applying in the Offer using UPI, the name of your SCSB appears in the list of SCSBs displayed on
the SEBI website which are live on UPI. Further, also ensure that the name of the app and the UPI handle being used
for making the application is also appearing in Annexure ‘A’ to the SEBI circular no.
SEBI/HO/CFD/DIL2/CIR/P/2019/85 dated July 26, 2019;
25. RIBs who wish to revise their Bids using the UPI Mechanism, should submit the revised Bid with the Designated
Intermediaries, pursuant to which RIBs should ensure acceptance of the UPI Mandate Request received from the
Sponsor Bank to authorise blocking of funds equivalent to the revised Bid Amount in the RIB’s ASBA Account;
26. Anchor Investors should submit the Anchor Investor Application Forms to the BRLMs;
27. Ensure that you have accepted the UPI Mandate Request received from the Sponsor Bank prior to 12:00 p.m. of the
Working Day immediately after the Bid/ Offer Closing Date;
28. FPIs making MIM Bids using the same PAN, and different beneficiary account numbers, Client IDs and DP IDs, are
required to submit a confirmation that their Bids are under the MIM structure and indicate the name of their investment
managers in such confirmation which shall be submitted along with each of their Bid cum Application Forms. In the
absence of such confirmation from the relevant FPIs, such MIM Bids shall be rejected;
29. RIBs shall ensure that details of the Bid are reviewed and verified by opening the attachment in the UPI Mandate
Request and then proceed to authorise the UPI Mandate Request using his/her UPI PIN. Upon the authorisation of the
mandate using his/her UPI PIN, an RIB may be deemed to have verified the attachment containing the application

335
details of the RIB in the UPI Mandate Request and have agreed to block the entire Bid Amount and authorised the
Sponsor Bank to block the Bid Amount mentioned in the Bid Cum Application Form; and
30. Ensure that while Bidding through a Designated Intermediary, the Bid cum Application Form (other than for Anchor
Investors and RIBs bidding using the UPI Mechanism) is submitted to a Designated Intermediary in a Bidding Centre
and that the SCSB where the ASBA Account, as specified in the ASBA Form, is maintained has named at least one
branch at that location for the Designated Intermediary to deposit ASBA Forms (a list of such branches is available on
the website of SEBI at www.sebi.gov.in).
The Bid cum Application Form is liable to be rejected if the above instructions, as applicable, are not complied with. Application
made using incorrect UPI handle or using a bank account of an SCSB or SCSBs which is not mentioned in the Annexure ‘A’
to the SEBI circular no. SEBI/HO/CFD/DIL2/CIR/P/2019/85 dated July 26, 2019 is liable to be rejected.
Don’ts:
1. Do not Bid for lower than the minimum Bid size;
2. Do not Bid for a Bid Amount exceeding ₹200,000 (for Bids by Retail Individual Bidders);
3. Do not pay the Bid Amount in cheques, demand drafts or by cash, money order, postal order or by stock invest;
4. Do not send Bid cum Application Forms by post; instead submit the same to the Designated Intermediary only;
5. Do not Bid at Cut-off Price (for Bids by QIBs and Non-Institutional Bidders);
6. Do not instruct your respective banks to release the funds blocked in the ASBA Account under the ASBA process;
7. Do not submit the Bid for an amount more than funds available in your ASBA account.
8. Do not submit Bids on plain paper or on incomplete or illegible Bid cum Application Forms or on Bid cum Application
Forms in a colour prescribed for another category of a Bidder;
9. In case of ASBA Bidders, do not submit more than one ASBA Forms per ASBA Account;
10. If you are a RIB and are using UPI mechanism, do not submit more than one ASBA Form for each UPI ID;
11. Anchor Investors should not Bid through the ASBA process;
12. Do not submit the ASBA Forms to any Designated Intermediary that is not authorised to collect the relevant ASBA
Forms or to our Company;
13. Do not Bid on a Bid cum Application Form that does not have the stamp of the relevant Designated Intermediary;
14. Do not submit the General Index Register (GIR) number instead of the PAN;
15. Do not submit incorrect details of the DP ID, Client ID, PAN and UPI ID, if applicable, or provide details for a
beneficiary account which is suspended or for which details cannot be verified by the Registrar to the Offer;
16. Do not submit a Bid in case you are not eligible to acquire Equity Shares under applicable law or your relevant
constitutional documents or otherwise;
17. Do not Bid if you are not competent to contract under the Indian Contract Act, 1872 (other than minors having valid
depository accounts as per Demographic Details provided by the depository);
18. Do not submit a Bid/revise a Bid Amount, with a price less than the Floor Price or higher than the Cap Price;
19. Do not submit a Bid using UPI ID, if you are not a RIB;
20. Do not Bid on another ASBA Form or the Anchor Investor Application Form, as the case may be, after you have
submitted a Bid to any of the Designated Intermediaries;
21. Do not Bid for Equity Shares in excess of what is specified for each category;
22. Do not fill up the Bid cum Application Form such that the Equity Shares Bid for, exceeds the Offer size and/or
investment limit or maximum number of the Equity Shares that can be held under applicable laws or regulations or
maximum amount permissible under applicable laws or regulations, or under the terms of this Red Herring Prospectus;

336
23. Do not withdraw your Bid or lower the size of your Bid (in terms of quantity of the Equity Shares or the Bid Amount)
at any stage, if you are a QIB or a Non-Institutional Bidder. Retail Individual Bidders can revise or withdraw their
Bids on or before the Bid/Offer Closing Date;
24. Do not submit Bids to a Designated Intermediary at a location other than the Bidding Centres;
25. If you are an RIB which is submitting the ASBA Form with any of the Designated Intermediaries and using your UPI
ID for the purpose of blocking of funds, do not use any third party bank account or third party linked bank account
UPI ID;
26. Do not link the UPI ID with a bank account maintained with a bank that is not UPI 2.0 certified by the NPCI in case
of Bids submitted by RIBs using the UPI Mechanism;
27. Do not submit more than one Bid cum Application Form for each UPI ID in case of RIBs Bidding using the UPI
Mechanism;
28. Do not submit a Bid cum Application Form with a third-party UPI ID or using a third party bank account (in case of
Bids submitted by Retail Individual Bidders using the UPI Mechanism);
29. RIBs Bidding through the UPI Mechanism using the incorrect UPI handle or using a bank account of an SCSB or bank
which is not mentioned in the list provided on the SEBI website is liable to be rejected; and
30. Do not Bid if you are an OCB.
The Bid cum Application Form is liable to be rejected if the above instructions, as applicable, are not complied with.
Further, in case of any pre-Offer or post Offer related issues regarding share certificates/demat credit/refund orders/unblocking
etc., investors can reach out to our Company Secretary and Compliance Officer. For details of our Company Secretary and
Compliance Officer, see “General Information” on page 71.
For helpline details of the BRLMs pursuant to the SEBI/HO.CFD.DIL2/CIR/P/2021/2480/1/M dated March 16, 2021, see
“General Information - Book Running Lead Managers” on page 71.
Further, in case of any pre-issue or post issue related issues regarding share certificates/demat credit/refund orders/unblocking
etc., investors shall reach out the Company Secretary and Compliance Officer. For details of the Company Secretary and
Compliance Officer, see “General Information” on page 71.
In case of any delay in unblocking of amounts in the ASBA Accounts (including amounts blocked through the UPI Mechanism)
for cancelled / withdrawn / deleted ASBA Forms, the Bidder shall be compensated at a uniform rate of ₹ 100 per day or 15%
per annum of the Bid Amount, whichever is higher from the date on which the request for cancellation/ withdrawal/ deletion is
placed in the Stock Exchanges bidding platform until the date on which the amounts are unblocked (ii) any blocking of multiple
amounts for the same ASBA Form (for amounts blocked through the UPI Mechanism), the Bidder shall be compensated at a
uniform rate ₹ 100 per day or 15% per annum of the total cumulative blocked amount except the original application amount,
whichever is higher from the date on which such multiple amounts were blocked till the date of actual unblock; (iii) any blocking
of amounts more than the Bid Amount, the Bidder shall be compensated at a uniform rate of ₹ 100 per day or 15% per annum
of the difference in amount, whichever is higher from the date on which such excess amounts were blocked till the date of
actual unblock; (iv) any delay in unblocking of non-allotted/ partially allotted Bids, exceeding four Working Days from the
Bid/Offer Closing Date, the Bidder shall be compensated at a uniform rate of ₹ 100 per day or 15% per annum of the Bid
Amount, whichever is higher for the entire duration of delay exceeding four Working Days from the Bid/Offer Closing Date
by the SCSB responsible for causing such delay in unblocking. The BRLMs shall, in their sole discretion, identify and fix the
liability on such intermediary or entity responsible for such delay in unblocking. The post Offer BRLMs shall be liable for
compensating the Bidder at a uniform rate of ₹100 per day or 15% per annum of the Bid Amount, whichever is higher from the
date of receipt of the investor grievance until the date on which the blocked amounts are unblocked. The Bidder shall be
compensated in the manner specified in the SEBI circular no. SEBI/HO/CFD/DIL1/CIR/P/2021/47 dated March 31, 2021 and
SEBI circular no. SEBI/HO/CFD/DIL2/CIR/P/2021/2480/1/M dated March 16, 2021, as amended pursuant to SEBI circular
no. SEBI/HO/CFD/DIL2/P/CIR/2021/570 dated June 2, 2021, which for the avoidance of doubt, shall be deemed to be
incorporated in the deemed agreement of the Company with the SCSBs, to the extent applicable.
Further, Investors shall be entitled to compensation in the manner specified in the SEBI circular no.
SEBI/HO/CFD/DIL2/CIR/P/2021/2480/1/M dated March 16, 2021 read with SEBI circular no.
SEBI/HO/CFD/DIL1/CIR/P/2021/47 dated March 31, 2021 in case of delays in resolving investor grievances in relation to
blocking/unblocking of funds.
Names of entities responsible for finalising the basis of allotment in a fair and proper manner

337
The authorised employees of the Designated Stock Exchange, along with the BRLMs and the Registrar, shall ensure that the
Basis of Allotment is finalised in a fair and proper manner in accordance with the procedure specified in SEBI ICDR
Regulations.
Method of allotment as may be prescribed by SEBI from time to time
Our Company will not make any allotment in excess of the Equity Shares through this Red Herring Prospectus and the
Prospectus except in case of oversubscription for the purpose of rounding off to make allotment, in consultation with the
Designated Stock Exchange.
The allotment of Equity Shares to applicants other than to the Retail Individual Bidders and Anchor Investors shall be on a
proportionate basis within the respective investor categories and the number of securities allotted shall be rounded off to the
nearest integer, subject to minimum allotment being equal to the minimum application size as determined and disclosed.
The allotment of Equity Shares to each Retail Individual Bidders shall not be less than the minimum bid lot, subject to the
availability of shares in Retail Individual Bidders Portion, and the remaining available Equity Shares, if any, shall be allotted
on a proportionate basis.
Payment into Escrow Account(s) for Anchor Investors
Our Company and the Selling Shareholders in consultation with the BRLMs, in their absolute discretion, will decide the list of
Anchor Investors to whom the CAN will be sent, pursuant to which the details of the Equity Shares allocated to them in their
respective names will be notified to such Anchor Investors. For Anchor Investors, the payment instruments for payment into
the Escrow Account(s) should be drawn in favour of:
(a) In case of resident Anchor Investors: “S.J.S. ENTERPRISES LIMITED– Anchor R”
(b) In case of Non-Resident Anchor Investors: “S.J.S. ENTERPRISES LIMITED– Anchor NR”
Anchor Investors should note that the escrow mechanism is not prescribed by SEBI and has been established as an arrangement
between our Company, the Selling Shareholders and the Syndicate, the Escrow Collection Bank and the Registrar to the Offer
to facilitate collections of Bid amounts from Anchor Investors.
Pre-Offer Advertisement
Subject to Section 30 of the Companies Act, 2013, our Company shall, after filing this Red Herring Prospectus with the RoC,
publish a pre- Offer advertisement, in the form prescribed by the SEBI ICDR Regulations, in: (i) all editions of The Financial
Express, an English national daily newspaper, all editions of Jansatta, a Hindi national daily newspaper and regional edition of
Vishwavani, a Kannada national daily newspaper, Kannada being the regional language of Karnataka, where our Registered
and Corporate Office is located, each with wide circulation.
In the pre-Offer advertisement, we shall state the Bid/ Offer Opening Date and the Bid/ Offer Closing Date. This advertisement,
subject to the provisions of Section 30 of the Companies Act, 2013, shall be in the format prescribed in Part A of Schedule X
of the SEBI ICDR Regulations.
The above information is given for the benefit of the Bidders/applicants. Our Company, the Selling Shareholders and
the members of the Syndicate are not liable for any amendments or modification or changes in applicable laws or
regulations, which may occur after the date of this Red Herring Prospectus. Bidders/applicants are advised to make
their independent investigations and ensure that the number of Equity Shares Bid for do not exceed the prescribed
limits under applicable laws or regulations.
Signing of the Underwriting Agreement and the RoC Filing
(a) Our Company, the Selling Shareholders and the Underwriters intend to enter into an Underwriting Agreement on or
immediately after the finalisation of the Offer Price but prior to the filing of Prospectus.
(b) After signing the Underwriting Agreement, an updated Red Herring Prospectus will be filed with the RoC in
accordance with applicable law, which then would be termed as the ‘Prospectus’. The Prospectus will contain details
of the Offer Price, the Anchor Investor Offer Price, Offer size, and underwriting arrangements and will be complete
in all material respects.
Impersonation
Attention of the applicants is specifically drawn to the provisions of sub-section (1) of Section 38 of the Companies Act, which
is reproduced below:
338
“Any person who:
(a) makes or abets making of an application in a fictitious name to a company for acquiring, or subscribing for, its
securities; or
(b) makes or abets making of multiple applications to a company in different names or in different combinations of his
name or surname for acquiring or subscribing for its securities; or
(c) otherwise induces directly or indirectly a company to allot, or register any transfer of, securities to him, or to any
other person in a fictitious name,
shall be liable for action under Section 447.”
The liability prescribed under Section 447 of the Companies Act, for fraud involving an amount of at least ₹ 1 million or 1%
of the turnover of our Company, whichever is lower, includes imprisonment for a term which shall not be less than six months
extending up to 10 years and fine of an amount not less than the amount involved in the fraud, extending up to three times such
amount (provided that where the fraud involves public interest, such term shall not be less than three years.) Further, where the
fraud involves an amount less than ₹1 million or one per cent of the turnover of the company, whichever is lower, and does not
involve public interest, any person guilty of such fraud shall be punishable with imprisonment for a term which may extend to
five years or with fine which may extend to ₹5 million or with both.
Undertakings by our Company
Our Company undertakes the following:
• adequate arrangements shall be made to collect all Bid cum Application Forms submitted by Bidders (including
Anchor Investor Application Form from Anchor Investors);
• the complaints received in respect of the Offer shall be attended to by our Company expeditiously and satisfactorily;
• all steps for completion of the necessary formalities for listing and commencement of trading at all the Stock
Exchanges where the Equity Shares are proposed to be listed shall be taken within six Working Days of the Bid/Offer
Closing Date or such other period as may be prescribed by the SEBI;
• if Allotment is not made within the prescribed time period under applicable law, the entire subscription amount
received will be refunded/unblocked within the time prescribed under applicable law. If there is delay beyond the
prescribed time, our Company shall pay interest prescribed under the Companies Act, 2013, the SEBI ICDR
Regulations and applicable law for the delayed period;
• the funds required for making refunds (to the extent applicable) as per the mode(s) disclosed shall be made available
to the Registrar to the Offer by our Company;
• where refunds (to the extent applicable) are made through electronic transfer of funds, a suitable communication shall
be sent to the applicant within the time prescribed under applicable law, giving details of the bank where refunds shall
be credited along with amount and expected date of electronic credit of refund;
• except for Equity Shares that may be allotted pursuant to the exercise of employee stock options granted under the
ESOP 2021, no further issue of the Equity Shares shall be made until the Equity Shares offered through this Red
Herring Prospectus are listed or until the Bid monies are unblocked in ASBA Account/refunded on account of non-
listing, under-subscription, etc.;
• Our Company and the Selling Shareholders in consultation with the BRLMs, reserve the right not to proceed with the
Offer, in whole or in part thereof, to the extent of the Offered Shares, after the Bid/ Offer Opening Date but before the
Allotment. In such an event, our Company would issue a public notice in the newspapers in which the pre-Offer
advertisements were published, within two days of the Bid/ Offer Closing Date or such other time as may be prescribed
by SEBI, providing reasons for not proceeding with the Offer and inform the Stock Exchanges promptly on which the
Equity Shares are proposed to be listed; and
• If our Company and the Selling Shareholders in consultation with the BRLMs withdraw the Offer after the Bid/ Offer
Closing Date and thereafter determines that it will proceed with an issue of the Equity Shares, our Company shall file
a fresh draft red herring prospectus with SEBI.
Undertakings by each of the Selling Shareholders
339
Each of the Selling Shareholders confirm and undertakes in respect of itself as a ‘selling shareholder’ and its respective portion
of the Equity Shares offered by it in the Offer for Sale that:
• they are the legal and beneficial owner of the Offered Shares, and hold clear and marketable title to their respective
portions of the Offered Shares;
• the Equity Shares offered for sale by each of the Selling Shareholders in the Offer are eligible for being offered in the
Offer for Sale in terms of Regulation 8 of the SEBI ICDR Regulations;
• except as set out in “Capital Structure” on page 78, the Equity Shares being offered for sale by the Selling Shareholders
pursuant to the Offer are free and clear of any pre-emptive rights, liens, mortgages, charges, pledges or any other
encumbrances and shall be in dematerialised form at the time of transfer;
• it shall deposit its Equity Shares offered for sale in the Offer in an escrow demat in accordance with the share escrow
agreement executed between the parties to such share escrow agreement;
• that it shall provide such reasonable assistance to our Company and the BRLMs in redressal of such investor grievances
that pertain to the Equity Shares held by it and being offered pursuant to the Offer;
• it shall provide such reasonable cooperation to our Company in relation to the Equity Shares offered by it in the Offer
for Sale for the completion of the necessary formalities for listing and commencement of trading at the Stock
Exchanges; and
• it shall not have recourse to the proceeds of the Offer until final approval for trading of the Equity Shares from the
Stock Exchanges has been received.
The decisions with respect to the Price Band, Offer Size, Offer Price (including the Anchor Investor Offer Price), allocation to
Anchor Investors and the Bid/Offer Period will be taken by our Company and the Selling Shareholders in consultation with the
BRLMs.
Utilisation of Offer Proceeds
Our Board of Directors certifies and declares that all monies received out of the Offer shall be credited/transferred to a separate
bank account other than the bank account referred to in sub-section 3 of Section 40 of the Companies Act, 2013. Each of the
Selling Shareholders, severally and not jointly, specifically undertake that all monies received out of the Offer shall be
credited/transferred to a separate bank account other than the bank account referred to in sub-section (3) of Section 40 of the
Companies Act.

340
RESTRICTIONS ON FOREIGN OWNERSHIP OF INDIAN SECURITIES
Foreign investment in Indian securities is regulated through the Industrial Policy, 1991 of the Government of India and FEMA.
While the Industrial Policy, 1991 prescribes the limits and the conditions subject to which foreign investment can be made in
different sectors of the Indian economy, FEMA regulates the precise manner in which such investment may be made. Under
the Industrial Policy, unless specifically restricted, foreign investment is freely permitted in all sectors of the Indian economy
up to any extent and without any prior approvals, but the foreign investor is required to follow certain prescribed procedures
for making such investment. The RBI and the concerned ministries/departments are responsible for granting approval for
foreign investment. The Government has from time to time made policy pronouncements on foreign direct investment (“FDI”)
through press notes and press releases. The DPIIT, issued the Consolidated FDI Policy Circular of 2020 (“FDI Policy”), which,
with effect from October 15, 2020 consolidated and superseded all previous press notes, press releases, circulars and
clarifications on FDI issued by DPIIT that were in force and effect as on October 15, 2020. The FDI Policy will be valid until
the DPIIT issues an updated circular.
The transfer of shares between an Indian resident and a non-resident does not require the prior approval of the RBI, provided
that (i) the activities of the investee company are under the automatic route under the FDI Policy and transfer does not attract
the provisions of the Takeover Regulations; (ii) the non-resident shareholding is within the sectoral limits under the FDI policy;
and (iii) the pricing is in accordance with the guidelines prescribed by the SEBI/RBI.
As per the existing policy of the Government of India, OCBs cannot participate in the Offer.
Foreign Exchange Laws
The foreign investment in our Company is governed by inter alia the FEMA, as amended, the FEMA Non-debt Instruments
Rules, the FDI Policy issued and amended by way of press notes.
Our Company is engaged in the manufacturing of premium aesthetic products. Currently, foreign direct investment in the
manufacturing sector is up to 100% under the automatic route. In terms of the FEMA Non-debt Instruments Rules, a person
resident outside India may make investments into India, subject to certain terms and conditions, and provided that an entity of
a country, which shares land border with India or the beneficial owner of an investment into India who is situated in or is a
citizen of any such country, shall invest only with government approval.
Further, in accordance with Press Note No. 3 (2020 Series), dated April 17, 2020 issued by the DPIIT and the the Foreign
Exchange Management (Non-debt Instruments) Amendment Rules, 2020 which came into effect from April 22, 2020, any
investment, subscription, purchase or sale of equity instruments by entities of a country which shares land border with India or
where the beneficial owner of an investment into India is situated in or is a citizen of any such country (“Restricted Investors”),
will require prior approval of the Government of India, as prescribed in the FDI Policy and the FEMA Non-Debt Instruments
Rules. Further, in the event of transfer of ownership of any existing or future foreign direct investment in an entity in India,
directly or indirectly, resulting in the beneficial ownership falling within the aforesaid restriction/ purview, such subsequent
change in the beneficial ownership will also require approval of the Government of India. Furthermore, on April 22, 2020, the
Ministry of Finance, Government of India has also made a similar amendment to the FEMA Rules. Pursuant to the Foreign
Exchange Management (Non-debt Instruments) (Fourth Amendment) Rules, 2020 issued on December 8, 2020, a multilateral
bank or fund, of which India is a member, shall not be treated as an entity of a particular country nor shall any country be treated
as the beneficial owner of the investments of such bank of fund in India. Each Bidder should seek independent legal advice
about its ability to participate in the Offer. In the event such prior approval of the Government of India is required, and such
approval has been obtained, the Bidder shall intimate our Company and the Registrar in writing about such approval along with
a copy thereof within the Offer Period.
Investment by Eligible NRIs
In accordance with the FEMA Non-Debt Instruments Rules, the total holding by any individual NRI, on a repatriation basis,
shall not exceed 5% of the total paid-up equity capital on a fully diluted basis or shall not exceed 5% of the paid-up value of
each series of debentures or preference shares or share warrants issued by an Indian company and the total holdings of all NRIs
and OCIs put together, on a repatriation or non-repatriation basis, shall not exceed 10% of the total paid-up equity capital on a
fully diluted basis or shall not exceed 10% of the paid-up value of each series of debentures or preference shares or share
warrant. Provided that the aggregate ceiling of 10% may be raised to 24% if a special resolution to that effect is passed by the
general body of the Indian company.
Our Company has, pursuant to a Board resolution dated July 19, 2021 and Shareholders resolution dated July 22, 2021,
increased the limit of investment of NRIs on a repatriation basis under Schedule III of the FEMA Non-Debt Instruments Rules
to up to 24% of the paid-up equity share capital of our Company, provided that the shareholding of each NRI in our Company
shall not exceed 5% of the equity share capital or such other limit as may be stipulated by the RBI.
341
Investment by FPIs
In terms of the SEBI FPI Regulations, the investment in Equity Shares by a single FPI or an investor group (which means
multiple entities registered as FPIs and directly or indirectly having common ownership of more than 50% or common control)
must be below 10% of our post-Offer equity share capital. Further, in terms of the FEMA Non-debt Instruments Rules, the total
holding by each FPI or an investor group shall be below 10% of the total paid-up equity share capital of our Company and the
total holdings of all FPIs put together can be up to the sectoral cap applicable to the sector in which our Company operates (i.e.,
up to 100%), as prescribed under the FEMA Non-debt Instruments Rules.
In case the total holding of an FPI increases beyond 10% of the total paid-up equity share capital, on a fully diluted basis or
10% or more of the paid-up value of any series of debentures or preference shares or share warrants issued that may be issued
by our Company, the total investment made by the FPI will be re-classified as FDI subject to the conditions as specified by
SEBI and the RBI in this regard and our Company and the investor will be required to comply with applicable reporting
requirements.
The Equity Shares offered in the Offer have not been and will not be registered under the Securities Act or any state
securities laws in the United States, and unless so registered, may not be offered or sold within the United States, except
pursuant to an exemption from, or in a transaction not subject to, the registration requirements of the Securities Act
and in accordance with any applicable U.S. state securities laws. Accordingly, the Equity Shares are being offered and
sold outside the United States in ‘offshore transactions’ in reliance on Regulation S under the Securities Act and the
applicable laws of the jurisdictions where such offers and sales are made.
The Equity Shares have not been and will not be registered, listed or otherwise qualified in any other jurisdiction outside
India and may not be offered or sold, and Bids may not be made by persons in any such jurisdiction, except in compliance
with the applicable laws of such jurisdiction.
The above information is given for the benefit of the Bidders. Our Company and the BRLMs are not liable for any
amendments or modification or changes in applicable laws or regulations, which may occur after the date of this Red
Herring Prospectus. Bidders are advised to make their independent investigations and ensure that the number of Equity
Shares Bid for do not exceed the applicable limits under laws or regulations.
342
SECTION IX: DESCRIPTION OF EQUITY SHARES AND TERMS OF ARTICLES OF ASSOCIATION
Capitalized terms used in this section have the meanings that have been given to such terms in the Articles of Association of
our Company. Pursuant to Schedule I of the Companies Act, 2013 and the SEBI ICDR Regulations, the main provisions of the
Articles of Association of our Company are detailed below.
The Articles of Association of our Company comprise of three parts, Part A, Part B and Part C which parts shall, unless the
context otherwise requires, co-exist with each other. In case of any inconsistency, contradiction, conflict or overlap between
Part A, Part B and Part C, the provisions of Part C shall, subject to applicable law, prevail and be applicable. In case of any
inconsistency, contradiction, conflict or overlap between Part A and Part B, the provisions of Part B shall, subject to applicable
law, prevail and be applicable. However, Part B and Part C shall automatically terminate and cease to have any force and
effect from the date of listing of Equity Shares of our Company on a recognized stock exchange in India pursuant to an initial
public offering of the Equity Shares of our Company without any further action, including any corporate action, by our
Company or by the Shareholders. The Articles of Association have been approved by the Board and our Shareholders pursuant
to their resolutions dated June 30, 2021 and July 1, 2021, respectively.
All special rights available to our Shareholders will fall away upon listing of the Equity Shares apart from director nomination
rights of our Promoters, which shall be subject to approval of our Shareholders by way of a special resolution, in a general
meeting post listing of the Equity Shares, wherein appropriate disclosure in this regard shall be given to the Shareholders.
PART A
Authorised Share Capital
The authorised share capital of our Company shall be such amount, divided into such class(es), denomination(s) and number
of Shares in our Company as stated in Clause V of the Memorandum of Association, with power to increase or reduce such
capital from time to time and power to divide the Equity Shares in the capital for the time being into other classes and to attach
thereto respectively such preferential, convertible, deferred, qualified, or other special rights, privileges, conditions or
restrictions and to vary, modify or abrogate the same in such manner as may be determined by or in accordance with the Articles
of Association of our Company, subject to the provisions of applicable law for the time being in force.
Alteration of Capital
Our Company may, by ordinary resolution, from time to time, alter the conditions of MoA as follows:
a. Issue share warrants;
b. Convert Equity Shares into stock;
c. Reduce its Equity Share capital, its capital redemption reserve account, and any share premium account; and
d. Buy back its Equity Shares
Further Issue of Shares
Subject to the provisions of the Companies Act, 2013, and these Articles, the shares in the capital of our Company for the time
being shall be under the control of the Board who may issue, allot or otherwise dispose of the same or any of them to such
persons, in such proportion and on such terms and conditions and either at a premium or at par or at a discount and at such time
as they may from time to time think fit and with the sanction of our Company in the general meeting to give to any person the
option or right to call for any shares either at par or premium during such time and for such consideration as the Board think
fit.
Forfeiture and Lien
Our Company shall subject to applicable law have a first and paramount lien on every share / debenture (not being a fully paid
share / debenture) registered in the name of each member (whether solely or jointly with others) and upon the proceeds of sale
thereof for all moneys (whether presently payable or not) called, or payable at a fixed time, in respect of that share / debenture
and no equitable interest in any share shall be created upon the footing and condition that this article will have full effect. Our
Company may sell, in such manner as the Board thinks fit, any shares on which our Company has a lien: provided that no sale
shall be made unless a sum in respect of which the lien exists in payable or until the expiration of 14 days’ after a notice in
writing stating and demanding payment of such part of the amount in respect of which the lien exists as is presently payable,
has been given to the registered holder of the share or the person entitled thereto by reason of his death or insolvency.
Share Certificates
343
Every member of our Company shall be entitled, without payment to one or more certificates in marketable lots, for all the
shares of each class or denomination registered in his name, or if the Directors approve, to several certificates, each for one or
more of such shares and our Company shall complete and have ready for delivery such certificates, unless prohibited by any
provision of law or any order of court, tribunal or other authority having jurisdiction, within two (2) months from the date of
allotment, or within one (1) month of the receipt of application of registration of transfer, transmission, sub division,
consolidation or renewal of any of its shares as the case maybe. The provisions of the Companies Act, 2013, shall be complied
with in the issue, reissue, renewal of share certificates and the format, sealing and signing of the certificates and records of the
certificates issued shall be maintained in accordance with the said Companies Act, 2013.
Every certificate of shares shall be under the Seal of our Company and shall specify the shares to which it relates and the amount
paid-up thereon.
If any certificate be worn out, defaced, mutilated or torn or if there be no further space on the back thereof for endorsement of
transfer, then upon production and surrender thereof to our Company, a new certificate may be issued in lieu thereof, and if any
certificate is lost or destroyed then upon proof thereof to the satisfaction of our Company and on execution of such indemnity
as our Company deem adequate, being given, a new certificate in lieu thereof shall be given to the party entitled to such lost or
destroyed certificate.
No fee shall be charged for sub-division and consolidation of share / debenture certificates and for sub-division of letters of
allotment, split and consolidation.
Transfer of Shares
The instrument of transfer of any share shall be in writing and all the provisions of the Companies Act, 2013, shall be duly
complied with in respect of all transfer of shares and registration thereof. Our Company shall use the form of transfer, as
prescribed under the Companies Act, 2013, in all cases. In case of transfer of shares, where our Company has not issued any
certificates and where the shares are held in dematerialized form, the provisions of the Depositories Act, 1996 shall apply. The
Board may decline to recognize any instrument of transfer unless the instrument of transfer is in the form prescribed under the
Companies Act, 2013, is in respect of only one class of shares and is accompanied by the certificate of shares to which it relates,
and such other evidence as the Board may reasonably require to show the right of the transferor to make the transfer.
Transmission of shares
The executors or administrators or the holders of a succession certificate issued in respect of the shares of a deceased Member
and not being one of several joint holders shall be the only person whom our Company shall recognize as having any title to
the shares registered in the name of such Members and in case of the death of one or more of the joint holders of any registered
share, the survivor or survivors shall be entitled to the title or interest in such shares but nothing herein contained shall be taken
to release the estate of a deceased joint holder from any liability on shares held by him jointly with any other person. Before
recognizing any legal representative or heir or a person otherwise claiming title to the shares our Company may require him to
obtain a grant of probate or letters of administration or succession certificate or other legal representation as the case may be
from a competent court, provided nevertheless that in any case where the Board in its absolute discretion think fit, it shall be
lawful for the Board to dispense with production of the probate or letter of administration or a secession certificate or such other
legal representation upon such terms as to indemnity or otherwise as the Board may consider desirable.
Any person becoming entitled to shares in consequence of the death, lunacy, bankruptcy or insolvency of any Members, or by
any lawful means other than by a transfer in accordance with these Articles, may with the consent of the Board (which it shall
not be under any obligation to give), upon producing such evidence as the Board thinks sufficient, that he sustains the character
in respect of which he proposes to act under this Article, or of his title, elect to either be registered himself as holder of the
shares or elect to have some person nominated by him and approved by the Board, registered as such holder or to make such
transfer of the share as the deceased or insolvent member could have made. If the person so becoming entitled shall elect to be
registered as holder of the share himself, he shall deliver or send to our Company a notice in writing signed by him stating that
he so elects. Provided, nevertheless, if such person shall elect to have his nominee registered, he shall testify that election by
executing in favour of his nominee an instrument of transfer in accordance with the provision herein contained and until he
does so he shall not be freed from any liability in respect of the shares.
Borrowing Powers
The Board may, from time to time and at its discretion, raise or borrow or secure the payment of any sums or sum of money for
the purposes of our Company in such manner and upon such terms and conditions in all respects as it thinks fit.
General Meetings
All General Meetings of our Company other than the Annual General Meeting shall be called an Extra-ordinary General
Meeting. The notice of a General Meeting shall be given to the Members of our Company, legal representative of any deceased
344
Shareholder or the assignee of an insolvent member of our Company the Directors of our Company and the auditors for the
time being of our Company.
Meetings of Directors
The Board of Directors shall meet at least once in every three months with a maximum gap of 120 days between two meetings
of the Board for the dispatch of business, adjourn and otherwise regulate its meetings and proceedings as it thinks fit in
accordance with the Companies Act, 2013, provided that at least four such meetings shall be held in every year. Notice of at
least seven days, in writing of every meeting of the Board shall be given to every Director and every alternate Director at his
usual address whether in India or abroad.
The quorum for a meeting of the Board shall be one third of its total strength (any fraction contained in that one-third being
rounded off as one) or two Directors whichever is higher and the participation of the Directors by video conferencing or by
other audio visual means shall also be counted for the purposes of quorum. If within half an hour from the time appointed for a
meeting of the Board, a quorum is not present, the meeting, shall stand adjourned to the same day in the next week at the same
time and place or to such other day and at such other time and place as the Directors may determine.
Managing Directors
Subject to the provisions of Section 196, 197 and 203 of the Companies Act, 2013 and of the Articles of Association, the Board
shall have the power to appoint from time to time any full time employee of our Company as managing director/ whole time
director or executive director or manager of our Company.
Appointment of Directors
Subject to the applicable provisions of the Companies Act, 2013, the number of Directors of our Company shall not be less
than 3 (three) and not more than 15 (fifteen). Our Company shall also comply with the provisions of the Companies
(Appointment and Qualification of Directors) Rules, 2014 and the provisions of the SEBI Listing Regulations. The Board shall
have an optimum combination of executive and Independent Directors with at least 1 (one) woman Director, as may be
prescribed by law from time to time.
Votes of Members
On a show of hands every Member present in person and being a holder of Equity Shares shall have one vote and every person
present either as a Proxy on behalf of a holder of Equity Shares or as a duly authorized representative of a body corporate being
a holder of Equity Shares, if he is not entitled to vote in his own right, shall have one vote.
On a poll, the voting rights of holder of Equity Shares shall be in proportion to his share in the paid-up Equity Share capital of
our Company. A Member may exercise his vote at a meeting by electronic means in accordance with the Companies Act, 2013,
and shall vote only once.
A person becoming entitled to a share shall not before being registered as Member in respect of the share be entitled to exercise
in respect thereof any right conferred by membership in relation to meeting of our Company.
No Member shall be entitled to exercise any voting rights either personally or by Proxy at any meeting of our Company in
respect of any shares registered in his name on which any calls or other sums presently payable by him have not been paid or
in regard to which our Company has exercised any right or lien.
Dividend
Our Company in General Meeting may declare the dividends, but no dividend shall exceed the amount recommended by the
Board. The Board may from time to time pay to the Members such interim dividends of such amount on such class of shares
and at such times as it may think fit.
All dividends shall be apportioned and paid proportionately to the amounts paid or credited as paid on the shares during any
portion or portions of the period in respect of which the dividend is paid; but if any share is issued on terms providing that it
shall rank for dividend as from a particular date such share shall rank for dividend accordingly.
No dividend shall bear interest against our Company.
Unpaid or Unclaimed Dividend
Any dividend remaining unpaid or unclaimed after having been declared shall be dealt in accordance with the provisions of the
applicable law.

345
Where our Company has declared a dividend but which has not been paid or claimed within 30 days from the date of declaration
to any shareholder entitled to the payment of the dividend, our Company shall within seven days from the date of expiry of the
said period of 30 days, open a special account in that behalf in any scheduled bank and transfer to such account, the total amount
of the dividend which remains unpaid or in relation to which no divided warrant has been posted.
Any money transferred to the said special account of our Company which remains unpaid or unclaimed for a period of seven
years from the date of such transfer, shall be transferred by our Company to the fund known as “Investors Education and
Protection Fund” established under the Companies Act, 2013.
No unclaimed or unpaid dividend shall be forfeited by the Board before the claim becomes barred by law and our Company
shall comply with the provisions of the applicable laws in respect of such dividend.
Winding Up
Subject to the provisions of applicable law, the assets of our Company shall, on its winding up, be applied in satisfaction of its
liabilities pari passu and, subject to such application, such assets shall be distributed among the Members according to their
rights and interests in our Company.
Indemnity
Subject to the provisions the Companies Act, 2013, our Company shall indemnify every Director and Officer of our Company
against any liability incurred by them in defending any proceedings, whether civil or criminal, in which judgment is given in
their favour or in which they are acquitted or in which relief is granted to them by the court or the tribunal. However, such
indemnification shall not apply in respect of any cost or loss or expenses to the extent it is finally judicially determined to have
resulted from the negligence, willful misconduct or bad faith acts or omissions of such Director.
PART B
Part B of the AoA of our Company provides for the rights and obligations of the parties to the S.J.S. Shareholders’ Agreement,
as amended by the Waiver and Termination Agreement.
In case of inconsistency or contradiction, conflict or overlap between Part A and Part B, the provisions of Part B shall, subject
to applicable law, prevail and be applicable. However, Part B shall automatically terminate and cease to have any force and
effect from the date of listing of Equity Shares of our Company on a recognized stock exchange in India pursuant to the Offer
and the provisions of Part A shall continue to be in effect and be in force, without any further corporate or other action, by our
Company or by its Shareholders.
Part C
Part C of the AoA of our Company provides for certain actions in relation to the restricted account maintained by our Company
with Kotak Mahindra Bank Limited in relation to a borrowing facility availed by Evergraph.

346
SECTION X: OTHER INFORMATION
MATERIAL CONTRACTS AND DOCUMENTS FOR INSPECTION
The copies of the following contracts which have been entered or are to be entered into by our Company (not being contracts
entered into in the ordinary course of business carried on by our Company or contracts entered into more than two years before
the date of this Red Herring Prospectus) which are or may be deemed material have been attached to the copy of this Red
Herring Prospectus and will be attached to the Prospectus filed/ to be filed, as the case may be with the RoC. Copies of the
contracts and also the documents for inspection referred to hereunder, may be inspected at the Registered and Corporate Office
between 10 a.m. and 5 p.m. on all Working Days from date of this Red Herring Prospectus until the Bid/ Offer Closing Date.
a) Material Contracts for the Issue
a) Offer Agreement dated July 27, 2021 between our Company, Selling Shareholders and the Book Running
Lead Managers.
b) Registrar Agreement dated July 23, 2021 between our Company, Selling Shareholders and the Registrar to
the Offer.
c) Cash Escrow and Sponsor Bank Agreement dated October 21, 2021 between our Company, Selling
Shareholders, the Registrar to the Offer, the Book Running Lead Managers, and the Bankers to the Offer.
d) Syndicate Agreement dated October 20, 2021 between our Company, Selling Shareholders, the Book
Running Lead Managers and Syndicate Member.
e) Share Escrow Agreement dated October 20, 2021 between our Company, Selling Shareholders and the Share
Escrow Agent.
f) Underwriting Agreement dated [●] between our Company, Selling Shareholders and the Underwriters.
b) Material Documents
a) Deed of partnership dated June 10, 1987 executed between Sumathi Sivakumar, K.A. Joseph and V.
Srinivasan, read with, inter alia, the deed of partnership dated April 1, 1992 executed between Sumathi
Sivakumar, V. Srinivasan and K.A. Joseph, the deed of partnership dated April 1, 1993 executed between
Sumathi Sivakumar, V. Srinivasan and K.A. Joseph, the deed of partnership dated November 10, 1993
executed between Sumathi Sivakumar, K.A. Joseph and V. Srinivasan, the revised deed of partnership dated
February 1, 2005 executed between Sumathi Sivakumar, V. Srinivasan, K.A. Joseph, S. Sivakumar, Vishnu
Sivakumar, Sharada Srinivasan and Daisy Joseph, and deed of co-partnery dated March 25, 2005 executed
between Sumathi Sivakumar, V. Srinivasan, K.A. Joseph, S. Sivakumar, Vishnu Sivakumar, Sharada
Srinivasan and Daisy Joseph.
b) Certified copies of the updated Memorandum and Articles of Association of our Company as amended from
time to time.
c) Certificate of incorporation dated June 21, 2005 upon incorporation and a fresh certificate of incorporation
dated June 4, 2021 consequent upon conversion to a public limited company.
d) Resolution of the Board dated June 30, 2021, authorising the Offer and other related matters.
e) Board resolution dated July 27, 2021 approving the Draft Red Herring Prospectus.
f) Board resolution dated October 22, 2021 approving this Red Herring Prospectus for filing with the RoC and
subsequently with SEBI and the Stock Exchanges.
g) Resolution of the board of directors of Evergraph dated October 11, 2021 approving the Offer and related
matters.
h) Consent letters of the Selling Shareholders, consenting to participate in the Offer for Sale.
i) Copies of the annual reports of our Company for the Fiscals 2021, 2020 and 2019.
j) Consent letter dated October 22, 2021 from our Statutory Auditors namely B S R & Co. LLP, Chartered
Accountants, to include their name in this Red Herring Prospectus as an “expert” as defined under Section
2(38) of the Companies Act, 2013, in respect of the examination report dated October 11, 2021 issued by it
on our Restated Consolidated Financial Information, assurance report on the compilation of our Proforma
347
Condensed Consolidated Financial Information dated October 11, 2021 on our Proforma Condensed
Consolidated Financial Information and the statement of possible special tax benefits dated October 22, 2021
included in this Red Herring Prospectus.
k) The examination report of the Statutory Auditor dated October 11, 2021 on the Restated Consolidated
Financial Information.
l) Assurance report on the compilation of our Proforma Condensed Consolidated Financial Information of the
Statutory Auditor dated October 11, 2021 on the Proforma Condensed Consolidated Financial Information.
m) The statement of possible special tax benefits dated October 22, 2021 from the Statutory Auditors.
n) Consent letters of the Selling Shareholders, our Directors, our Company Secretary and Compliance Officer,
the Book Running Lead Managers, the Syndicate Member, Legal Counsel to our Company as to Indian Law,
Legal Counsel to the Selling Shareholders as to Indian Law, Legal Counsel to the Book Running Lead
Managers as to Indian Law, Registrar to the Offer, Independent Chartered Accountant and Independent
Chartered Engineer, Bankers to our Company, Escrow Collection Banks, Public Offer Banks, Refund Banks,
Sponsor Bank, to act in their respective capacities.
o) Report titled “Assessment of Select Aesthetic Components” issued in June 2021, by CRISIL Research.
p) Consent letter dated October 20, 2021 of CRISIL Research in respect of the CRISIL Report.
q) Letter of appointment dated February 27, 2021, for appointment of CRISIL Research to issue the CRISIL
Report
r) Consent letter dated July 29, 2021 from G. Shankar Rao, as chartered engineer to include his name as an
“expert” as defined under Section 2(38) and other applicable provisions of the Companies Act, 2013 in his
capacity as a ‘chartered engineer’, in respect of the certificate dated July 29, 2021 received from him.
s) Shareholders’ agreement dated July 2, 2015 executed between our Company, Evergraph and K.A. Joseph, as
amended on September 21, 2015 and September 14, 2020.
t) Waiver and Termination Agreement dated July 1, 2021, executed between our Company, Evergraph and K.A.
Joseph.
u) Letter agreement dated July 2, 2015 to record the mutual understanding between V. Srinivasan, S. Sivakumar,
Daisy Joseph, K.A. Joseph, our Company and Evergraph, as amended by the waiver and termination letter
dated July 6, 2021 entered into between Daisy Joseph, K.A. Joseph, Evergraph and our Company.
v) Share purchase agreement dated March 11, 2021 and as amended on April 1, 2021 entered into among our
Company, our Subsidiary, Rajiv Kothari, Umesh Kothari and Exotech Exports and Investments Private
Limited.
w) SJS Enterprises - Employee Stock Option Plan 2021.
x) Due diligence certificate dated July 27, 2021 addressed to SEBI from the Book Running Lead Managers.
y) In-principle listing approvals dated August 17, 2021 and August 16, 2021, issued by BSE and NSE,
respectively.
z) SEBI observation letter, bearing reference number SEBI/HO/CFD/DIL2/OW/P/2021/19709/1 dated August
17, 2021.
aa) SEBI observation letter, bearing reference number SEBI/HO/CFD/DIL2/P/W/2021/27056/1 dated October
5, 2021.
bb) Tripartite agreement between our Company, CDSL and the Registrar to the Offer dated March 16, 2021.
cc) Tripartite agreement between our Company, NSDL and the Registrar to the Offer dated April 19, 2021.
Any of the contracts or documents mentioned in this Red Herring Prospectus may be amended or modified at any time if so
required in the interest of our Company or if required by the other parties, without reference to our Shareholders, subject to
compliance with the provisions contained in the Companies Act and other relevant statutes.
348
DECLARATION
We hereby certify and declare that all relevant provisions of the Companies Act and the rules, guidelines/regulations issued by
the Government of India or the guidelines/regulations issued by the SEBI, established under Section 3 of the SEBI Act, as the
case may be, have been complied with and no statement made in this Red Herring Prospectus is contrary to the provisions of
the Companies Act, the SCRA, the SCRR, the SEBI Act or rules made or guidelines or regulations issued thereunder, as the
case may be. We further certify that all statements in this Red Herring Prospectus are true and correct.
SIGNED BY THE DIRECTOR OF OUR COMPANY
________________________________________
Ramesh Chandra Jain
Chairman and Non-Executive Independent Director
Date: October 22, 2021
Place: Gurugram
349
DECLARATION
We hereby certify and declare that all relevant provisions of the Companies Act and the rules, guidelines/regulations issued by
the Government of India or the guidelines/regulations issued by the SEBI, established under Section 3 of the SEBI Act, as the
case may be, have been complied with and no statement made in this Red Herring Prospectus is contrary to the provisions of
the Companies Act, the SCRA, the SCRR, the SEBI Act or rules made or guidelines or regulations issued thereunder, as the
case may be. We further certify that all statements in this Red Herring Prospectus are true and correct.
SIGNED BY THE DIRECTOR OF OUR COMPANY
________________________________________
K.A. Joseph
Managing Director
Date: October 22, 2021
Place: Bengaluru

350
DECLARATION
We hereby certify and declare that all relevant provisions of the Companies Act and the rules, guidelines/regulations issued by
the Government of India or the guidelines/regulations issued by the SEBI, established under Section 3 of the SEBI Act, as the
case may be, have been complied with and no statement made in this Red Herring Prospectus is contrary to the provisions of
the Companies Act, the SCRA, the SCRR, the SEBI Act or rules made or guidelines or regulations issued thereunder, as the
case may be. We further certify that all statements in this Red Herring Prospectus are true and correct.
SIGNED BY THE DIRECTOR OF OUR COMPANY
________________________________________
Sanjay Thapar
Executive Director
Date: October 22, 2021
Place: Pune

351
DECLARATION
We hereby certify and declare that all relevant provisions of the Companies Act and the rules, guidelines/regulations issued by
the Government of India or the guidelines/regulations issued by the SEBI, established under Section 3 of the SEBI Act, as the
case may be, have been complied with and no statement made in this Red Herring Prospectus is contrary to the provisions of
the Companies Act, the SCRA, the SCRR, the SEBI Act or rules made or guidelines or regulations issued thereunder, as the
case may be. We further certify that all statements in this Red Herring Prospectus are true and correct.
SIGNED BY THE DIRECTOR OF OUR COMPANY
________________________________________
Kevin K. Joseph
Executive Director
Date: October 22, 2021
Place: Bengaluru

352
DECLARATION
We hereby certify and declare that all relevant provisions of the Companies Act and the rules, guidelines/regulations issued by
the Government of India or the guidelines/regulations issued by the SEBI, established under Section 3 of the SEBI Act, as the
case may be, have been complied with and no statement made in this Red Herring Prospectus is contrary to the provisions of
the Companies Act, the SCRA, the SCRR, the SEBI Act or rules made or guidelines or regulations issued thereunder, as the
case may be. We further certify that all statements in this Red Herring Prospectus are true and correct.
SIGNED BY THE DIRECTOR OF OUR COMPANY
________________________________________
Kazi Arif Uz Zaman
Nominee Director
Date: October 22, 2021
Place: Bengaluru

353
DECLARATION
We hereby certify and declare that all relevant provisions of the Companies Act and the rules, guidelines/regulations issued by
the Government of India or the guidelines/regulations issued by the SEBI, established under Section 3 of the SEBI Act, as the
case may be, have been complied with and no statement made in this Red Herring Prospectus is contrary to the provisions of
the Companies Act, the SCRA, the SCRR, the SEBI Act or rules made or guidelines or regulations issued thereunder, as the
case may be. We further certify that all statements in this Red Herring Prospectus are true and correct.
SIGNED BY THE DIRECTOR OF OUR COMPANY
________________________________________
Vishal Sharma
Nominee Director
Date: October 22, 2021
Place: Gurugram
354
DECLARATION
We hereby certify and declare that all relevant provisions of the Companies Act and the rules, guidelines/regulations issued by
the Government of India or the guidelines/regulations issued by the SEBI, established under Section 3 of the SEBI Act, as the
case may be, have been complied with and no statement made in this Red Herring Prospectus is contrary to the provisions of
the Companies Act, the SCRA, the SCRR, the SEBI Act or rules made or guidelines or regulations issued thereunder, as the
case may be. We further certify that all statements in this Red Herring Prospectus are true and correct.
SIGNED BY THE DIRECTOR OF OUR COMPANY
________________________________________
Veni Thapar
Non-Executive Independent Director
Date: October 22, 2021
Place: New Delhi

355
DECLARATION
We hereby certify and declare that all relevant provisions of the Companies Act and the rules, guidelines/regulations issued by
the Government of India or the guidelines/regulations issued by the SEBI, established under Section 3 of the SEBI Act, as the
case may be, have been complied with and no statement made in this Red Herring Prospectus is contrary to the provisions of
the Companies Act, the SCRA, the SCRR, the SEBI Act or rules made or guidelines or regulations issued thereunder, as the
case may be. We further certify that all statements in this Red Herring Prospectus are true and correct.
SIGNED BY THE DIRECTOR OF OUR COMPANY
________________________________________
Matthias Frenzel
Non-Executive Independent Director
Date: October 22, 2021
Place: Kode – Sweden

356
DECLARATION
We hereby certify and declare that all relevant provisions of the Companies Act and the rules, guidelines/regulations issued by
the Government of India or the guidelines/regulations issued by the SEBI, established under Section 3 of the SEBI Act, as the
case may be, have been complied with and no statement made in this Red Herring Prospectus is contrary to the provisions of
the Companies Act, the SCRA, the SCRR, the SEBI Act or rules made or guidelines or regulations issued thereunder, as the
case may be. We further certify that all statements in this Red Herring Prospectus are true and correct.
SIGNED BY THE CHIEF FINANCIAL OFFICER OF OUR COMPANY
________________________________________
Amit Kumar Garg
Chief Financial Officer
Date: October 22, 2021
Place: New Delhi

357
DECLARATION
K.A. Joseph, confirms and certifies that all statements and undertakings specifically made or confirmed by him in this Red
Herring Prospectus about or in relation to himself, as a Selling Shareholder and his portion of the Offered Shares, are true and
correct. K.A. Joseph assumes no responsibility as a Selling Shareholder, for any other statements, including, any of the
statements made or confirmed by or relating to the Company or any other person(s) in this Red Herring Prospectus.
_____________________________
Name: K.A. Joseph
Place: Bengaluru
Date: October 22, 2021

358
DECLARATION
Evergraph Holdings Pte. Ltd., acting through the undersigned, confirms and certifies that all statements and undertakings
specifically made or confirmed by it in this Red Herring Prospectus about or in relation to itself, as a Selling Shareholder and
its portion of the Offered Shares, are true and correct. Evergraph Holdings assumes no responsibility as a Selling Shareholder,
for any other statements, including, any of the statements made or confirmed by or relating to the Company or any other
person(s) in this Red Herring Prospectus.
_____________________________
Name: Shelly Smith
Designation: Director
Place: Singapore
Date: October 22, 2021