brilliant performers. meopta
TRANSCRIPT
ONTARIOBIRDSBrilliant Performers.
Meopta® sports optics.
MeoStar® B18x32 | 10x32 7x42 | 8x42 | 10x42 | 10x42HD
MeoStar® S2 82 HDBody: Angled | StraightEyepieces: 30x60 WA | 20x70
MeoPix® iScoping AdapterFits eyepiece dia.: 42mm | 44mm | 49mm | 53mm | 55mm | 55.3mm
iPho
ne is
a tr
adem
ark
of A
pple
Inc.
, reg
iste
red
in th
e U.
S. a
nd o
ther
cou
ntrie
s.
B1
EUROPEAN OPTICS | SINCE 1933
53mm | 55mm 55.3mm 55mm | 55.3mm
MeoStar8x32 7x42 7x42
MeoStarBody: Angled Eyepieces: 30x60 WA
7x42 7x42
MeoStar
| 866-966-0406 | www.canodi.ca | www.meoptasportsoptics.com
In a recent Outdoor Life optics test the new MeoStar® B1 10x42 HD binocular defeated Austria and Germany’s finest
taking the coveted “Editor’s Choice” award while Field & Stream awarded the 10x42 HD “Best of the Best” for 2012 along with our MeoPix® iScoping Adapter. Our S2 spotter and B1 binocular HD optics system features fluoride objective lens elements for pin point resolution, increased contrast, vivid color fidelity and elimination of chromatic aberration in challenging lighting conditions. Built in Europe and backed by Meopta’s lifetime transferable warranty. Meopta. A better view of the world... since 1933.
Scan to read reviewCornell Lab of OrnithologyLiving Bird MagazineS2 82 HD / MeoPix Review
JOURNAL OF THE ONTARIO FIELD ORNITHOLOGISTS
VOLUME 31 NUMBER 3DECEMBER 2013
VOLUME 31 NUMBER 3DECEMBER 2013 PAGES 121 — 176
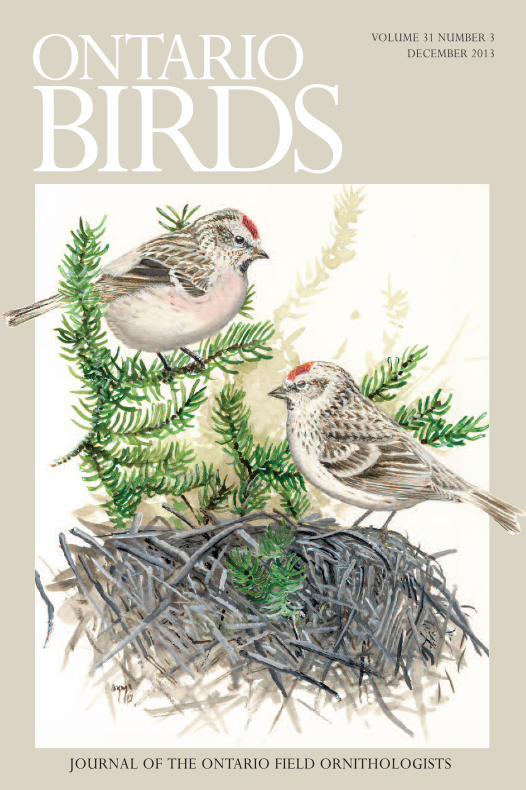
Cover Illustration: Hoary Redpolls by Barry Kent MacKay
ISSN 0822-3890 Publications Mail Agreement No. 40046348
ONTARIOBIRDSARTICLES122 First Documented Nests of Hoary Redpoll in Ontario
By Peter S. Burke, Jon D. McCracken, Colin D. Jones, Martyn E. Obbard, Donald A. Sutherland and Ron Ridout
136 Bank Swallow Colonies along the Saugeen River, 2009-2013By Mike Cadman and Zoé Lebrun-Southcott
148 Seven Years Later: Kirtland’s Warbler at Garrison Petawawa, 2006- 2013By Tammy Richard
160 Sex-related dietary differences in Great Gray Owls in Finland and the USABy Heimo Mikkola, Risto Tornberg and David E. Willard
172 Distinguished Ornithologist: Jon McCrackenBy Erica Dunn
First Documented Nestsof Hoary Redpoll inOntarioPeter S. Burke, Jon D. McCracken, Colin D. Jones, Martyn E. Obbard, Donald A. Sutherland and Ron Ridout
122 Ontario Birds August 2013
Volume 31 Number 3 123
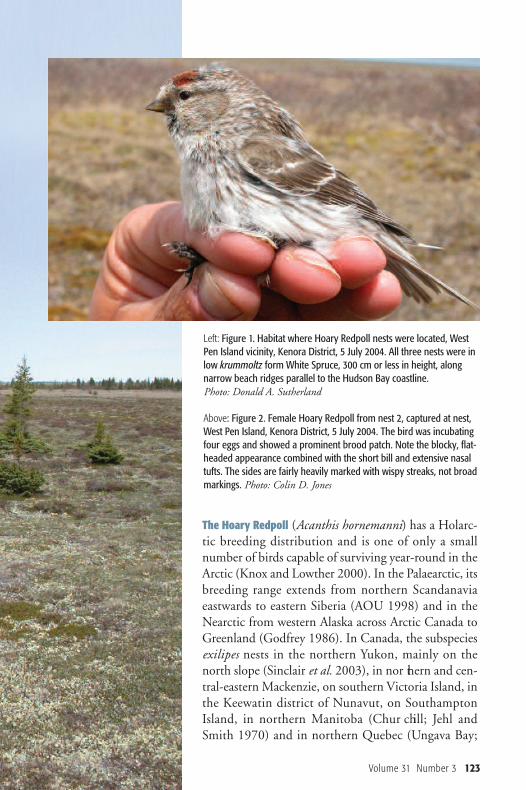
The Hoary Redpoll (Acanthis hornemanni) has a Holarc-tic breeding distribution and is one of only a smallnumber of birds capable of surviving year-round in theArctic (Knox and Lowther 2000). In the Palaearctic, itsbreeding range extends from northern Scandanaviaeastwards to eastern Siberia (AOU 1998) and in theNearctic from western Alaska across Arctic Canada toGreenland (Godfrey 1986). In Canada, the subspeciesexilipes nests in the northern Yukon, mainly on thenorth slope (Sinclair et al. 2003), in nor thern and cen-tral-eastern Mackenzie, on southern Victoria Island, inthe Keewatin district of Nunavut, on SouthamptonIsland, in northern Manitoba (Chur c hill; Jehl andSmith 1970) and in northern Quebec (Ungava Bay;
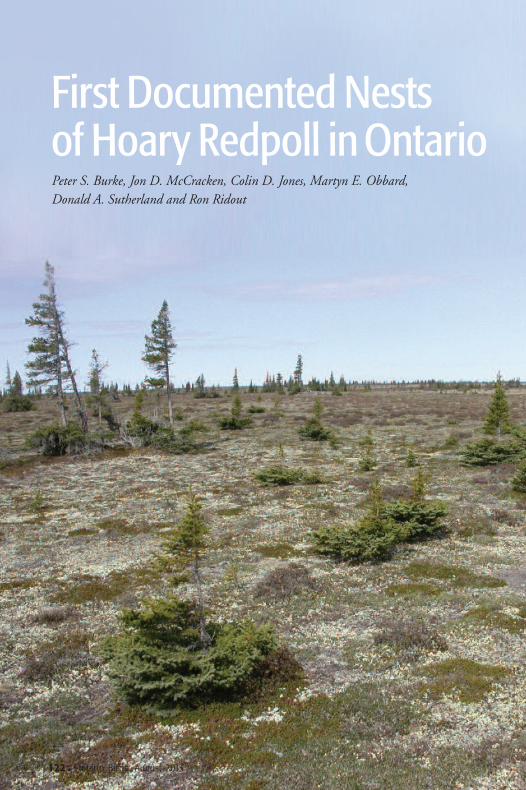
Left: Figure 1. Habitat where Hoary Redpoll nests were located, WestPen Island vicinity, Kenora District, 5 July 2004. All three nests were inlow krummoltz form White Spruce, 300 cm or less in height, along narrow beach ridges parallel to the Hudson Bay coastline. Photo: Donald A. Sutherland
Above: Figure 2. Female Hoary Redpoll from nest 2, captured at nest,West Pen Island, Kenora District, 5 July 2004. The bird was incubatingfour eggs and showed a prominent brood patch. Note the blocky, flat-headed appearance combined with the short bill and extensive nasaltufts. The sides are fairly heavily marked with wispy streaks, not broadmarkings. Photo: Colin D. Jones
Lanoue and Seutin 1996). The larger,paler subspecies hornemanni breeds far-ther north on the Nun avut islands ofEllesmere, Axel Hei berg (Parmelee andMacDonald 1960), Dev on, Bylot andBaffin (Godfrey 1986). The taxonomy of redpolls remains
incompletely known and subject todebate. Proposals vary from one speciesknown as Common Redpoll (A. flam-mea) with large phenotypic variability(Salo monsen 1951, Troy 1985, Marthin-sen et al. 2008) to as many as four species(A. flammea, A. exilipes, A. rostrata, A.hornemanni) as suggested by Herremans(1990). Currently, two polytypic species,each with two subspecies, are recognizedin North America (AOU 1998, Chesseret al. 2009): Common Redpoll (A. f.flam mea, A. f. rostrata) and Hoary Red-poll (A. h. hornemanni, A. h. exilipes). InBritain, an additional former subspeciesof the Common Redpoll (A. cabaret,Lesser Redpoll) recently gained specificstatus (Lifjeld and Bjerke 1996, Sangsteret al. 2001). In areas of sympatry between A. h.
exilipes and A. f. flammea, a continuumof phenotypes from the palest exilipes tothe darkest flammea led Troy (1985) toconclude that there is actually one high-ly variable species involved. However, byre-examining the variation and takinginto account sexual and age-specificdimorphism, others have shown thatdark exilipes (usually female or first-yearbirds) can appear much like flammea,and light flammea (older males) canappear much like exilipes. Thus, any trueintermediates may be examples of con-vergence of two distinct species (Molau1985, Knox 1988).
Evidence for hybridization betweenflammea and exilipes lies mainly in indi-viduals showing intermediate characters;no known mixed-pair nests have beendescribed (Knox 1988). Further, differ-ences in the timing of migration, breed-ing habitat, diet, calls, physiology andbehavior exist between the two taxa(Knox 1988, Knox and Lowther 2000).Seutin et al. (1995) found relatively littlegenetic differentiation among the red-polls, but suggested this was not surpris-ing given a large population size, nom -adic breeding strategy and recent evolu-tionary divergence. Marthinsen et al.(2008) also found low genetic differenti-ation and suggested the need for fieldwork in areas of sympatry to help resolveseveral competing hypotheses whichcould account for the low genetic sepa-ration between the two taxa. James (1991) considered Common
Redpoll to be a common summer resi-dent along the Hudson Bay coast ofOntario. Conversely, he regarded HoaryRedpoll as a “rare (and occasional?)”summer resident there, based largely onfield work from the first Ontario Breed-ing Bird Atlas (OBBA1:1981-1985;Cadman et al. 1987). In July 1985, D.Shepherd and G. Poole found probablebreeding evidence for Hoary Redpoll intwo 10 x 10 km squares in the vicinity ofWest Pen Island. They observed whatappeared to be a mated pair and capturedthree adults that exhibited breeding con-dition characters. During the samemonth, an adult Hoary Redpoll wasobserved in willow scrub 40 km west ofCape Henrietta Maria by D. Evered andE. Kiviat (Middleton 1987). In 1990,three birds were observed at the mouth
124 Ontario Birds December 2013

of the Little Shagamu River on 31 May(Wilson and McRae 1993); however,these birds were possibly migrants, as thedate is somewhat earlier than the earliestknown egg dates at Churchill, Manitoba(6 June – 12 July; Jehl 2004). There havebeen a number of subsequent summerrecords of Hoary Redpoll in the northernHudson Bay Lowlands of Ont ario. Theseinclud e three other records from the sec-ond Ontario Breeding Bird Atlas (OBBA)(Cadman et al. 2007) farther east alongthe Hudson Bay coast near BurntpointCreek (55 14.56’ N 84 19.12’ W) andCape Henrietta Maria (55 03.28’ N 8216.65’ W) where evidence of probablebreeding was found, and near the SuttonRiver (55 01.9’ N 82 48.11’ W) whereevidence of possible breeding was found(OBBA2: 2001-2005, database; Cadmanet al. 2007). Compared to Ontario, the Hoary
Red poll breeds more commonly farthernorth at Cape Churchill, Manitoba.However, its numbers fluctuate widelyfrom year to year, such that it may com-prise as much as 50% to as little as 10%of the total redpoll population (Cooke etal.1975). Similarly, Middleton (1987)pro posed that in Ontario Hoary Redpollprobably breeds in low numbers farthersouth on the coastal tundra, based onbreeding evidence from the first OBBA. Until 2004, no nesting of the Hoary
Redpoll had been confirmed for Ontario(Peck and Peck 2006). Here, we present
information on Ontario’s first three nestsof Hoary Redpoll found in the vicinity ofWest Pen Island, Kenora District, withdiscussion of the species’ identificationand comments on its local abundance. From 24 June to 7 July 2004, we con-
ducted field work in the vicinity of thePen Islands in support of the secondOBBA. Our base camp was located on anarrow marine beach ridge running par-allel to the Hudson Bay coast, approxi-mately 8 km SSW of West Pen Island (5647.8’ N 88 57.7’ W). The immediate areais maritime sub-Arctic wet tundra dom -inated by sedges (Carex aquatilis, C. chor-dorrhiza, C. scirpoidea) and interspersedwith low willow (Salix spp.) and BogBirch (Betula pumila) thickets, numerousshallow lakes and ponds, and a parallelseries of old, low gravel beach ridgesextending inland. These ridges support alichen-heath community (John son 1987)dominated by lichens (Cladonia spp.),Mountain Avens (Dryas integrifolia),Black Crowberry (Empet rum nigrum),Alpine Blueberry (Vaccinium uliginosum),Mountain Cranberry (Vaccinium vitis-idaea) and Lapland Rosebay (Rhododen-dron lapponicum). Approximately 7 kminland from the coast, widely scatteredtrees or small copses of ‘krummholz’White Spruce (Picea glauca) becomeincreasingly frequent on the ridges, giv-ing way to lichen-spruce woodland app -rox imately 10 km inland from the coast. We observed Hoary and Common
redpolls the entire duration of our visit,with up to 6 pairs of Hoaries observedand three nests discovered. Behaviour ofone or both of the adults led the observersto the nests; birds were followed at variousdistances until they visited the nest site.
Volume 31 Number 3 125
Until 2004, no nesting ofthe Hoary Redpoll had been confirmed for Ontario.
Several days prior to the discovery ofnest #1, a pair of Hoary Redpolls hadbeen observed in the vicinity. Nest #1 was found in a small spruce on the edgeof a willow thicket by McCracken on 28June 2004, less than 100 m south of ourbase camp. The nest was under freneticconstruction entirely by the female,under the very close attention of themale. Within about 5 minutes of discov-ering the nest, nest building was inter-rupted by the arrival of a NorthernShrike (Lanius excubitor) that flew intothe adjacent willow thicket. This prom -pted immediate mobbing and agitatedbehaviour on the part of the pair ofHoary Redpolls, plus what was presumedto be a male Common Redpoll that
arrived in the company of several Amer-ican Tree Sparrow (Spizella arborea), aWhite-crowned Sparrow (Zonotrichialeucophrys), and a Yellow Warbler (Set -ophaga petechia). Nest #2 was found by Jones and
Burke on 29 June, 6 km northeast of thebase camp. It was visited only twice dueto constraints of time and distance. Nest#3, which was found by Burke roughly300 m east of camp on 6 July, escapeddetection until the second last day offieldwork, despite nearly daily passes ofthe nest tree by all observers. Nest construction (nests #1 and #2)
and brooding of young (nest #3) wereongoing when the nests were discovered.Characteristics for each nest are given inTable 1 and nest chronologies are in Table 2. Dimensions are missing fromnest #1 due to its destruction by a pred-ator (presumed Arctic fox [Vulpes lago-pus]) and were not taken from nest #2.
126 Ontario Birds December 2013
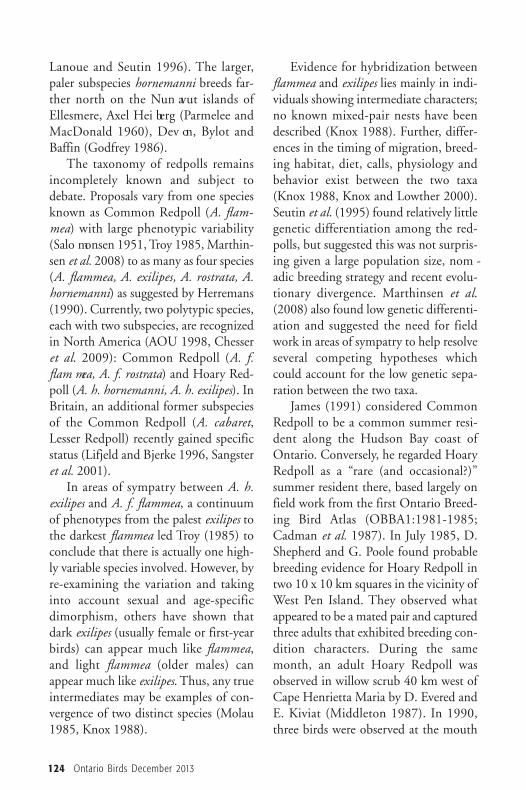
Figure 3. Same female Hoary Redpoll, West PenIsland, Kenora District, 5 July 2004. Again, thebroad, flat crown and fluffy nasal tufts that coverthe base of the bill are apparent here. Photo: Colin D. Jones
Volume 31 Number 3 127
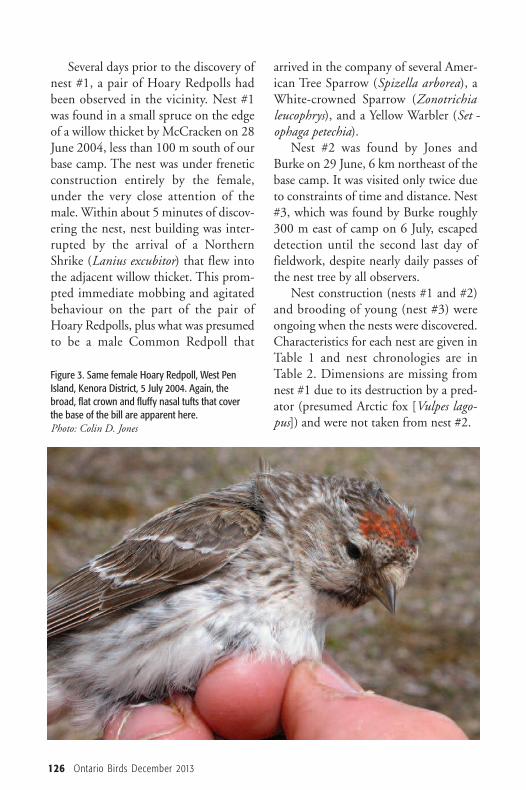
Figure 4. The same female fromWest Pen Island, Kenora District,5 July 2004, showing the rumppattern. Although somewhatobscured by wear, the extensivewhite rump is apparent. Notethe amount of wear on the pri-mary and tail feather tips. Incomparison Common Redpolls,which were also observed daily,lacked the obvious pale rump.Photo: Colin D. Jones
128 Ontario Birds December 2013
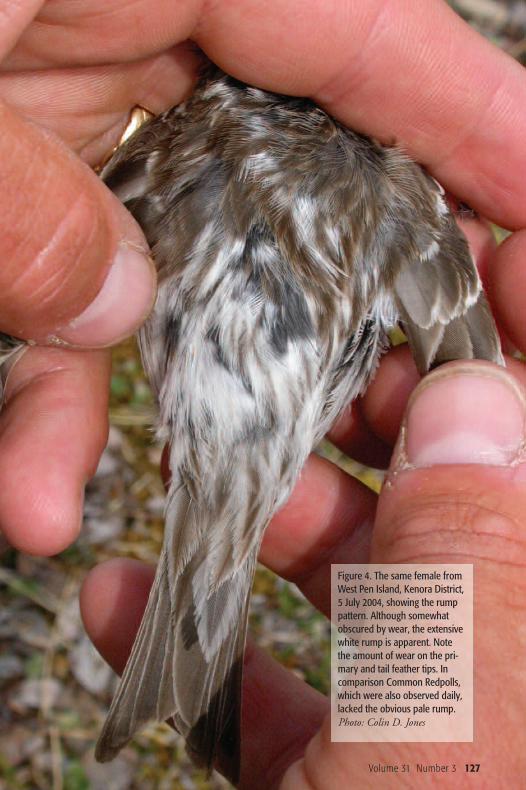
Nest # 1 2 3
UTM Georeference 379849 E 6296225 N 384184 E 6301335 N 381148 E 6295924 N(NAD 83)
Date Found 28 June (JDM) 29 June (CDJ, PSB) 6 July (PSB)
Description of Beach ridge, 6 km inland, Raised beach ridge, 500 m Beach ridge, 6 km inland,nest site heath-covered with occasional inland, with 5 isolated heath-covered and interrupted
krummoltz form White Spruce. krummholtz White Spruce by standing water/willow/birch Large thicket of willow immediately bordering willow/birch scrub swale approx. 3 m tall.adjacent to nest tree. Ridge and wet sedge; 100 m from Occasional krummholtz bordered to north by wet sedge large Snow Goose (Chen White Spruce, reaching 10 mfen and small tundra lake to south. caerulescens) colony. in height. Ridge bordered both
Overgrazed sedge flats sides by wet sedge fen (?)25 m to south. with standing water bodies,
15 m and 35 m to north and south edges of ridge, respectively.
Tree species, White Spruce krummholtz form White Spruce krummholtz White Spruce krummholtz form Height/Nest ~250 cm/60 cm/15cm form 200 cm/125 cm/ 15 cm 300 cm/ 100 cm/ 43 cm Height/Distancefrom trunk
Inner/ Outer N/a 5.2 cm/ 10.1 cmDiameter
Inner/ Outer N/a 4.0 cm/5.7 cmDepth
Outer material Bulky cup constructed of fine grasses, Bulky cup constructed of dead Bulky cup constructed of dead very fine dead twigs and lichen. willow twigs and dead grass twigs, lichens and some
stalks (Fig. 6). sphagnum, much like nest 2(Fig. 7).
Lining Willow catkins, alternate Finer grasses, thickly lined Finer grasses thickly lined with female Willow Ptarmigan with willow catkins and white white feathers and willow catkins. (Lagopus lagopus) feathers, and black featherswhite feathers and feather down
Table 1: Characteristics of three Hoary Redpoll nests at West Pen Island vicinity, 28 June –7 July 2004.
Each nest and its contents were pho-tographed and both sexes were carefullyidentified as Hoary Redpoll. The femaleat nest #2 was captured by mist-net, meas-ured, photographed and released (Figs. 2-4). Measurements taken were: wing chord(relaxed) = 72 mm; tarsus = 17 mm; expo -sed culmen = 5.5 mm. A large brood patchwas visible. Only the male at nest #2 was
photographed (Fig. 5). The presumedmale of nest #3 was determined to be infirst basic (formative) plumage and thusappeared darker than the ‘expected’ clas-sic exilipes male. Females of the other twonests were also photographed and werealso exilipes. In these and other separatesightings, key Hoary Redpoll features suchas: a mainly clear white rump, relatively
Nest Visit 1 Visit 2 Visit 3 Visit 4
1 28 June; female building 1 July; 1 egg in 2 July; 4 eggs in early 3 July; nest depredatednest (about 80% complete); mid-morning. morning (presumed by presumed Arctic female closely attended by Pair present. evidence of egg dumping); Fox (Vulpes lagopus)male; copulation observed. 3 eggs were whitish, 1 egg
had a light bluish cast.
2 29 June; female at nest, 5 July; female incubatingmale attending, nest empty, 4 eggs; female caught,almost fully lined. photographed and released.
Male present briefly.
3 6 July; female brooding 3 7 July; female broodingnestlings approx. 3 days old. 3 nestlings. PresumedPresumed male feeding male feeding female female on nest. on nest.
Volume 31 Number 3 129
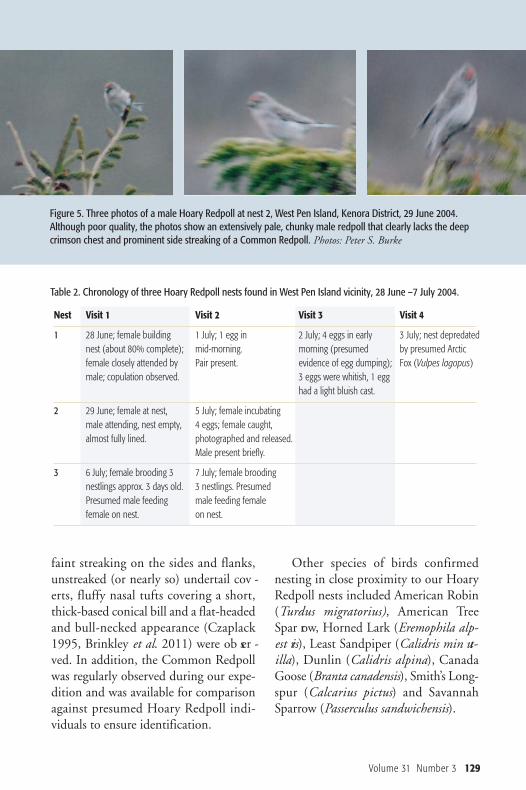
Figure 5. Three photos of a male Hoary Redpoll at nest 2, West Pen Island, Kenora District, 29 June 2004.Although poor quality, the photos show an extensively pale, chunky male redpoll that clearly lacks the deepcrimson chest and prominent side streaking of a Common Redpoll. Photos: Peter S. Burke
Table 2. Chronology of three Hoary Redpoll nests found in West Pen Island vicinity, 28 June –7 July 2004.
faint streaking on the sides and flanks,unstreaked (or nearly so) undertail cov -erts, fluffy nasal tufts covering a short,thick-based conical bill and a flat-headedand bull-necked appearance (Czaplack1995, Brinkley et al. 2011) were ob ser -ved. In addition, the Common Redpollwas regularly observed during our expe-dition and was available for comparisonagainst presumed Hoary Redpoll indi-viduals to ensure identification.
Other species of birds confirmednesting in close proximity to our HoaryRedpoll nests included American Robin(Turdus migratorius), American TreeSpar row, Horned Lark (Eremophila alp -est ris), Least Sandpiper (Calidris min ut -illa), Dunlin (Calidris alpina), CanadaGoose (Branta canadensis), Smith’s Long -spur (Calcarius pictus) and SavannahSparrow (Passerculus sandwichensis).
130 Ontario Birds December 2013
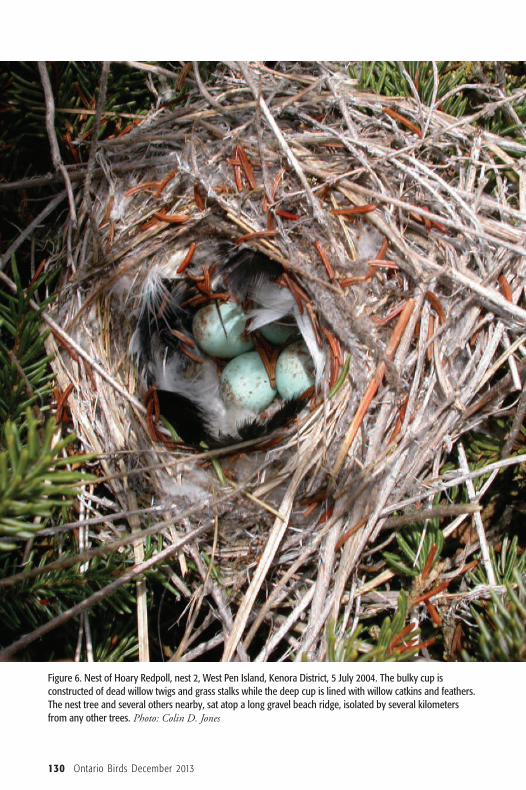
Figure 6. Nest of Hoary Redpoll, nest 2, West Pen Island, Kenora District, 5 July 2004. The bulky cup is constructed of dead willow twigs and grass stalks while the deep cup is lined with willow catkins and feathers.The nest tree and several others nearby, sat atop a long gravel beach ridge, isolated by several kilometersfrom any other trees. Photo: Colin D. Jones
DiscussionThis note documents the southernmostknown nestings of Hoary Redpoll inNorth America. Since annual breedingpopulations of Hoary Redpoll arebelieved to fluctuate widely at a givenlocation (Cooke et al. 1975, Jehl 2004),we suggest that these three nests do notrepresent an expanding southward pop-ulation into Ontario. Instead, breedingoccurrences of the Hoary Redpoll inOntario likely fluctuate in concordance
with regional climate and local availabil-ity of food resources. It is noteworthythat spring and summer 2004 wereexceptionally cold in the Hudson BayLowlands; the average April-June month-ly temperature (-5.9 C) was the coldestfor the 12 years: 1996-2007 (Environ-ment Canada 2013). This may well haveprompted a more southerly influx ofHoary Redpolls than what otherwisemight normally occur. Though limited to only three nests,
our descriptions of nest morphology,placement and height agree with previ-ous studies for Hoary Redpoll (Lanoueand Seutin 1996, Knox and Lowther2000). First nests in May and June aretypically in conifers at Churchill and
Volume 31 Number 3 131
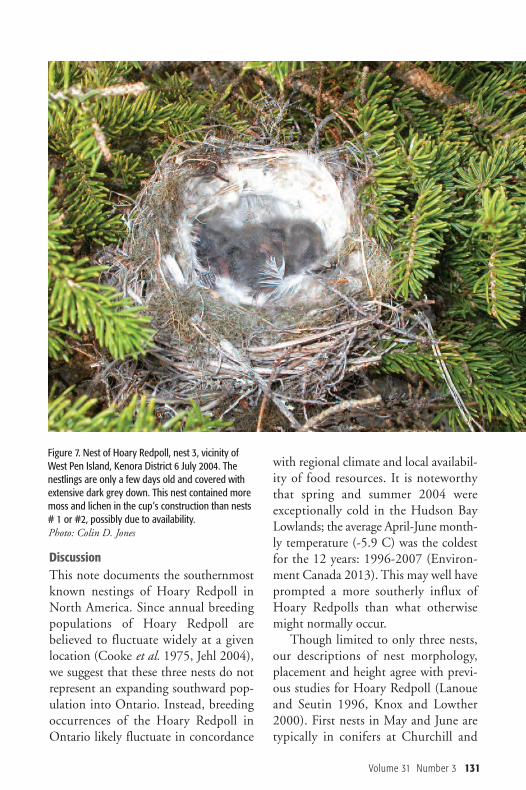
Figure 7. Nest of Hoary Redpoll, nest 3, vicinity ofWest Pen Island, Kenora District 6 July 2004. Thenestlings are only a few days old and covered withextensive dark grey down. This nest contained moremoss and lichen in the cup’s construction than nests# 1 or #2, possibly due to availability. Photo: Colin D. Jones
132 Ontario Birds December 2013
Ungava Bay and later in deciduous trees/shrubs (and even on the ground) in July(Lanoue and Seutin 1996). Redpolls cannest twice in a summer due to short nest-building (4 days), incubation (minimumof 10 days) and fledging stages (9 days)(Lanoue and Seutin 1996). Nest #3 wouldhave been initiated on about 17-19 June
(at the latest), which is still several weekslater than the earliest nests typicallyreported in Quebec and Manitoba. Adelayed spring in 2004 probably account-ed for a late start for almost all birds nest-ing in the West Pen Island area, sincesnow covered much of the northern low-lands until about mid-June (L. Walton,Ontario Ministry of Natural Resources(OMNR), pers. comm.; Burke et al.2006). Moreover, despite our late expedi-tion dates, we found very few passerinenests with young and no instances ofadults carrying food to fledglings.
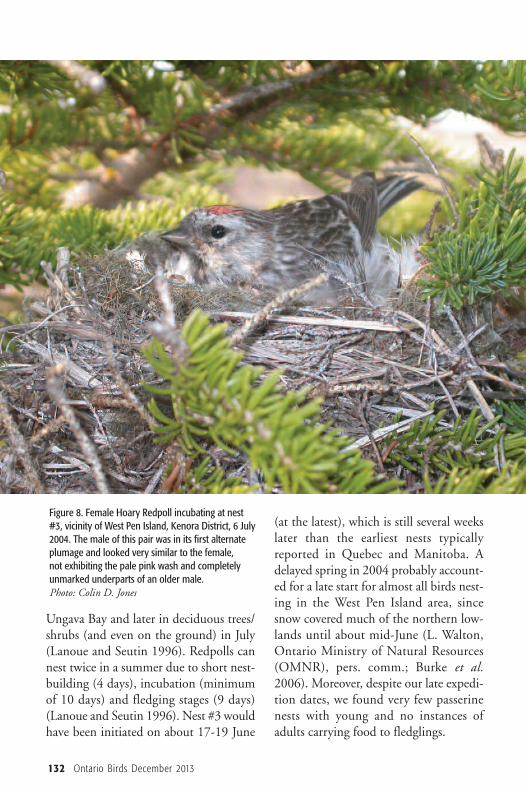
Figure 8. Female Hoary Redpoll incubating at nest#3, vicinity of West Pen Island, Kenora District, 6 July2004. The male of this pair was in its first alternateplumage and looked very similar to the female, not exhibiting the pale pink wash and completelyunmarked underparts of an older male. Photo: Colin D. Jones
In at least some regions, the HoaryRedpoll is not highly territorial and isknown to breed in loose aggregations,sometimes with several pairs nesting inthe same thicket (Lanoue and Seutin1996). Though we did not observe anyevidence of such loose coloniality in thePen Islands region, we found at least sixpairs scattered in the study area and itseems reasonable that more nests werepresent. Although the Common Redpoll was
found in greater numbers than HoaryRedpoll in our study area, we could notdetect any differences in habitat use,which is typical in areas of sympatry(Knox and Lowther 2000). The observa-tion of a male Common Redpoll veryclose to nest #1 on 28 and 29 June andan American Tree Sparrow less than halfa metre from nest #3 on 7 July is proba-bly explained by the redpolls’ lack of ter-ritoriality both inter- and intra-specifi-cally (Knox and Lowther 2000). The increase from 1 to 4 eggs in one
day at nest #1 is perplexing (Table 2).Since there was a very noticeable differ-ence in color in at least one of the eggs(Table 2), coupled with other circum-stances, we presume that egg dumping bya female Common Redpoll occurred.This is in keeping with our observationsof a male Common Redpoll interactingwith the pair of Hoary Redpolls at thisnest on two occasions during the nestbuilding phase.For the most part, species identifica-
tion was rather straightforward, especial-ly when older males were part of a pairand exhibited classic Hoary field marks.The pair at nest #3 was more problemat-ic, since the male was initially thought to
be another female due to its more heavi-ly marked flanks, darker mantle and lackof pink wash to the chest. However,males in first basic (formative) plumagetypically lack the frostiness and pink tothe breast of an older male (Knox 1988)and can appear quite dark in early sum-mer due to feather wear. Other charac-teristics of Hoary Redpolls, such as theunmarked white rump, minimal under-tail streaking, fluffy nasal tufts, flat-head-ed and bull-necked appearance and shortconical bill, were noted on this bird.
AcknowledgementsFieldwork at the Pen Islands in 2004 was madepossible through funding to the OBBA byCanadian Wildlife Service (Ontario Region),Bird Studies Canada’s James L. Baillie Memo-rial Fund for Bird Research and Preservation,Ontario Ministry of Natural Resources, andOntario Nature. Mike Cadman and NicoleKopysh (OBBA) arranged funding for the tripand assisted with logistical arrangements. LyleWalton and Ken Abraham (OMNR) offeredtechnical advice and logistical support. Specialthanks to OMNR Twin Otter pilots FrankAquino and Corey Burella who expertly deliv-ered us to and from our field site safely.
Literature CitedAmerican Ornithologist’s Union, 1998.Check-list of North American Birds, 7th ed.A.O.U. Washington.
Brinkley, E.S., P.A. Buckley, L.R. Bevierand A.M. Byrne. 2011. Photo essay: redpollsfrom Nunavut and Greenland visit Ontario.North American Birds 65:206-215.
Burke, P.S.,M. E. Obbard, D. A. Suther-land, C. D. Jones, J. D. McCracken and R. Ridout. 2006. First documented nest ofStilt Sandpiper in Ontario. Ontario Birds24:75-83.
Volume 31 Number 3 133
Cadman, M.D., P.F.J. Eagles and F.M. Hell -einer (eds.). 1987. Atlas of the Breeding Birdsof Ontario. Federation of Ontario Naturalistsand Long Point Bird Observatory, Universityof Waterloo Press, Waterloo. 617 pp.
Cadman, M.D., D.A. Sutherland, G.G.Beck., D. Lepage and A.R. Courturier (eds.).2007. Atlas of the Breeding Birds of Ontario,2001-2005. Bird Studies Canada, Environ-ment Canada, Ontario Field Ornithologists,Ontario Ministry of Natural Resources andOntario Nature, Toronto, xxii + 706 pp.
Chesser, R.T., R.C. Banks, F.K. Barker, C. Cicero, J.L. Dunn, A.W. Kratt, I.J.Lovett, P.C. Rasmussen, J.V. Remsen, Jr.,J.D. Rising, D.F. Stotz and K. Winker. 2009.Fiftieth Supplement to the American Ornithol-ogists’ Union Check-list of North AmericanBirds. Auk 126:705-714.
Cooke, F., R.K. Ross, R.K. Schmidt and A.J. Pakulak. 1975. Birds of the tundra biomeat Cape Churchill and La Perouse Bay. Canadi-an Field Naturalist 89:413-422.
Czaplack, D. 1995. Identifying Common andHoary Redpolls in winter. Birding 27:446-457.
Environment Canada. 2013. Climate Dataonline. National Climate Data and Informa-tion Archive. http://climate.weatheroffice.gc.ca/climateData/canada_e.html [accessed 12 November 2013]
Godfrey, W.E. 1986. The Birds of Canada.Revised Edition. National Museum of NaturalSciences, Ottawa, Ontario.
Herremans, M. 1990. Taxonomy and evolu-tion in redpolls Carduelis flammea-hornemanni;a multivariate study of their biometry. Ardea78:441-459.
James, R.D. 1991. Annotated checklist of the birds of Ontario. 2nd ed. Royal OntarioMuseum. University of Toronto Press.
Jehl, J.R. 2004. Birdlife of the ChurchillRegion: Status, History, Biology. ChurchillNorthern Studies Centre. Trafford Publishing,Victoria, B.C. 154 pp.
Jehl, J.R. and B.A. Smith. 1970. Birds of the Churchill region, Manitoba. ManitobaMuseum of Man and Nature. Special Publication 1.
Johnson, K.L. 1987. Wildflowers of Churchilland the Hudson Bay Region. Manitoba Muse-um of Man and Nature, Winnipeg, Manitoba.
Knox, A. 1988. The taxonomy of redpolls.Ardea 76:1-26.
Knox, A. and P.E. Lowther. 2000. HoaryRedpoll (Carduelis hornemanni). In The Birdsof North America, No. 341 (A. Poole and F. Gill, editors). The Birds of North America,Inc. Philadelphia, Pennsylvania.
134 Ontario Birds December 2013
Top BirdingWildlife and Culture
Two and Three Week Toursstarting mid 2014
Detlef and Carol DaviesKerikeri, New Zealand
(64) 9407 [email protected]
www.birdingnorthperu.com
NORTH PERU BIRD TOURS
Lanoue A. and G. Seutin. 1996. Hoary Redpoll. Pp. 1192-1193 in The Breeding Birds of Quebec: Atlas of the Breeding Birds of Southern Quebec. Assoc. quebecoise desgroupes d’ornithologues, Province of QuebecSociety for protection of birds, CanadianWildlife Service. Environment Canada, Quebec Region, Montreal.
Lifjeld, J.T., and B.A. Bjerke. 1996. Evidencefor assortative pairing by the cabaret and flam-mea subspecies of the Common Redpoll Car-duelis flammea in SE Norway. Fauna norv. Ser. C., Cinclus 19:1-8.
Marthinsen, G., L. Wennerberg and J. T. Lifjeld. 2008. Low support for separatespecies within the redpoll complex (Carduelisflammea–hornemanni–cabaret) from analysesof mtDNA and microsatellite markers. Molec-ular Phylogenetics and Evolution 47:1005-1017.
Molau, U. 1985. Gråsiskkomplexet i Sverige[The redpoll complex in Sweden]. VårFågelvärld 44:5-20.
Middleton, A.L.A. 1987. Hoary Redpoll.Page 562 In Cadman, M.D., P.F.J. Eagles andF.M. Helleiner (eds.). Atlas of the BreedingBirds of Ontario. University of WaterlooPress, Waterloo. 617 pp.
Parmalee D.F. and S.D. MacDonald. 1960.The birds of west-central Ellesmere Island andadjacent areas. National Museum of CanadaBulletin 169.
Sangster, G., A.G. Knox, A. Helbig and D.T. Parkin. 2001. Taxonomic recommenda-tions for European Birds. Ibis 144:153-159.
Salomonsen, F. 1951. The birds of Green-land. Pt. III. Munksgaard, Copenhagen.
Seutin, G., L.M. Ratcliffe and P.T. Boag.1995. Mitiochondrial DNA homogeneity inthe phenotypically diverse redpoll finch com-plex (Aves: Carduelinae: Carduelis flammea-hornemanni). Evolution 49:962-973.
Sinclair, P.H., W.A. Nixon, C.D. Eckert andN.L. Hughes (eds.). 2003. Birds of the YukonTerritory. University of British ColumbiaPress. Vancouver, BC.
Troy, D.M. 1985. A phenetic analysis of theredpolls Carduelis flammea flammea and C. hornemanni exilipes. Auk 102:82-96.
Wilson, N.C. and D. McRae. 1993. Seasonaland geographical distribution of birds forselected sites in Ontario's Hudson Bay Low-land. Ontario Ministry of Natural Resources,Publication 50333. 145 pp.
Peter S. Burke13 McKenzie AvenueLondon, ON N6C 1V1E-mail: [email protected]
Jon D. McCrackenBird Studies CanadaP.O. Box 160 Port Rowan, ON NOE 1MO
Colin D. JonesOntario Ministry of Natural ResourcesNatural Heritage Information Centre300 Water Street, 2nd Floor NorthPeterborough, ON K9J 8M5
Martyn E. ObbardOntario Ministry of Natural ResourcesWildlife Research and Monitoring SectionTrent University, DNA Building2140 East Bank DrivePeterborough, ON K9J 7B8
Donald A. SutherlandOntario Ministry of Natural ResourcesNatural Heritage Information Centre300 Water Street, 2nd Floor NorthPeterborough, ON K9J 8M5
Ron RidoutBird Studies CanadaP.O. Box 160 Port Rowan, ON NOE 1MO
Volume 31 Number 3 135
136 Ontario Birds December 2013
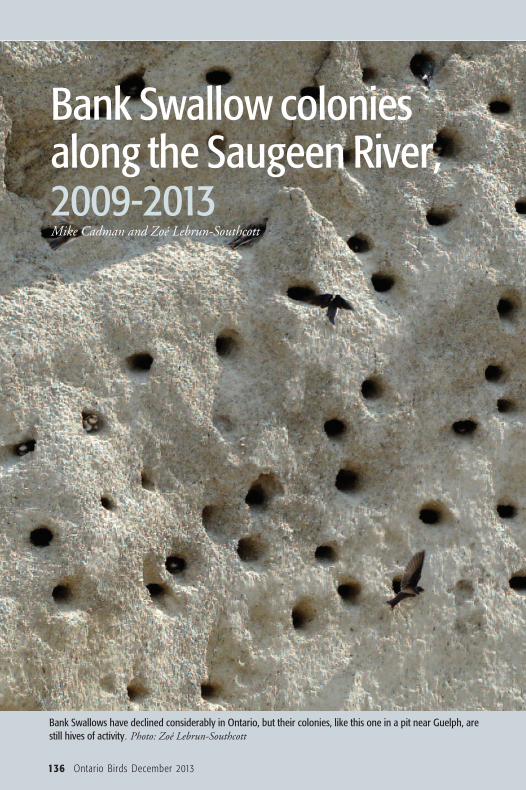
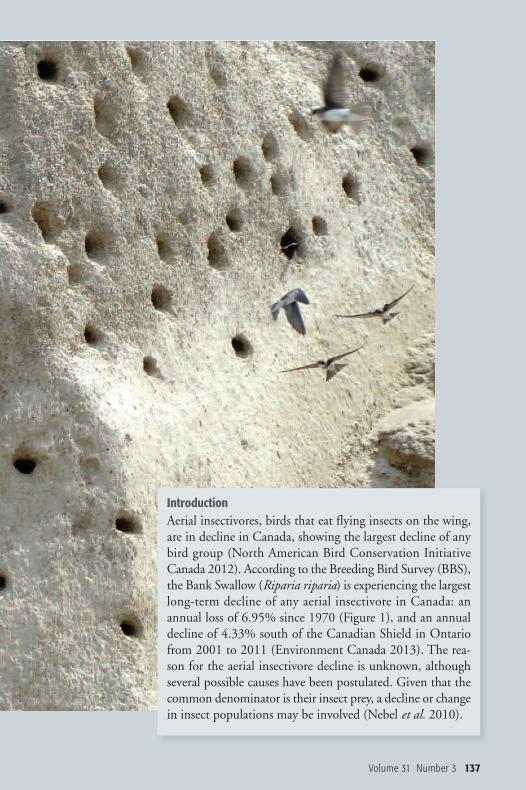
Bank Swallow coloniesalong the Saugeen River,2009-2013Mike Cadman and Zoé Lebrun-Southcott
Bank Swallows have declined considerably in Ontario, but their colonies, like this one in a pit near Guelph, arestill hives of activity. Photo: Zoé Lebrun-Southcott
Volume 31 Number 3 137
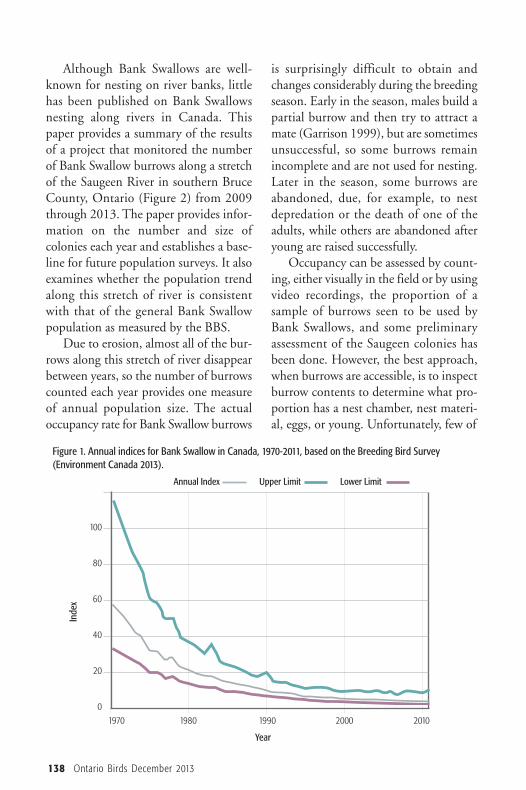
IntroductionAerial insectivores, birds that eat flying insects on the wing,are in decline in Canada, showing the largest decline of anybird group (North American Bird Conservation InitiativeCanada 2012). According to the Breeding Bird Survey (BBS),the Bank Swallow (Riparia riparia) is experiencing the largestlong-term decline of any aerial insectivore in Canada: anannual loss of 6.95% since 1970 (Figure 1), and an annualdecline of 4.33% south of the Canadian Shield in Ontariofrom 2001 to 2011 (Environment Canada 2013). The rea-son for the aerial insectivore decline is unknown, althoughseveral possible causes have been postulated. Given that thecommon denominator is their insect prey, a decline or changein insect populations may be involved (Nebel et al. 2010).
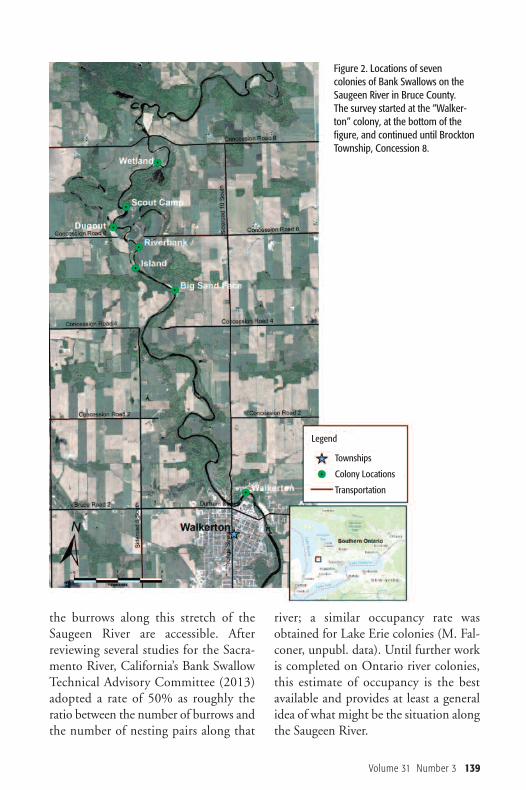
Although Bank Swallows are well-known for nesting on river banks, littlehas been published on Bank Swallowsnesting along rivers in Canada. Thispaper provides a summary of the resultsof a project that monitored the numberof Bank Swallow burrows along a stretchof the Saugeen River in southern BruceCounty, Ontario (Figure 2) from 2009through 2013. The paper provides infor-mation on the number and size ofcolonies each year and establishes a base-line for future population surveys. It alsoexamines whether the population trendalong this stretch of river is consistentwith that of the general Bank Swallowpopulation as measured by the BBS. Due to erosion, almost all of the bur-
rows along this stretch of river disappearbetween years, so the number of burrowscounted each year provides one measureof annual population size. The actualoccupancy rate for Bank Swallow burrows
is surprisingly difficult to obtain andchanges considerably during the breedingseason. Early in the season, males build apartial burrow and then try to attract amate (Garrison 1999), but are sometimesunsuccessful, so some burrows remainincomplete and are not used for nesting.Later in the season, some burrows areabandoned, due, for example, to nestdepredation or the death of one of theadults, while others are abandoned afteryoung are raised successfully.Occupancy can be assessed by count-
ing, either visually in the field or by usingvideo recordings, the proportion of asample of burrows seen to be used byBank Swallows, and some preliminaryassessment of the Saugeen colonies hasbeen done. However, the best approach,when burrows are accessible, is to inspectburrow contents to determine what pro-portion has a nest chamber, nest materi-al, eggs, or young. Unfortunately, few of
138 Ontario Birds December 2013
Figure 1. Annual indices for Bank Swallow in Canada, 1970-2011, based on the Breeding Bird Survey(Environment Canada 2013).
Index
100
80
60
40
20
01970 1980 1990 2000 2010
Annual Index Upper Limit Lower Limit
Year
Volume 31 Number 3 139
the burrows along this stretch of theSaugeen River are accessible. Afterreviewing several studies for the Sacra-mento River, California’s Bank SwallowTechnical Advisory Committee (2013)adopted a rate of 50% as roughly theratio between the number of burrows andthe number of nesting pairs along that
river; a similar occupancy rate wasobtained for Lake Erie colonies (M. Fal-coner, unpubl. data). Until further workis completed on Ontario river colonies,this estimate of occupancy is the bestavailable and provides at least a generalidea of what might be the situation alongthe Saugeen River.
Figure 2. Locations of sevencolonies of Bank Swallows on theSaugeen River in Bruce County. The survey started at the “Walker-ton” colony, at the bottom of thefigure, and continued until BrocktonTownship, Concession 8.
Legend
Townships
Colony Locations
Transportation
140 Ontario Birds December 2013
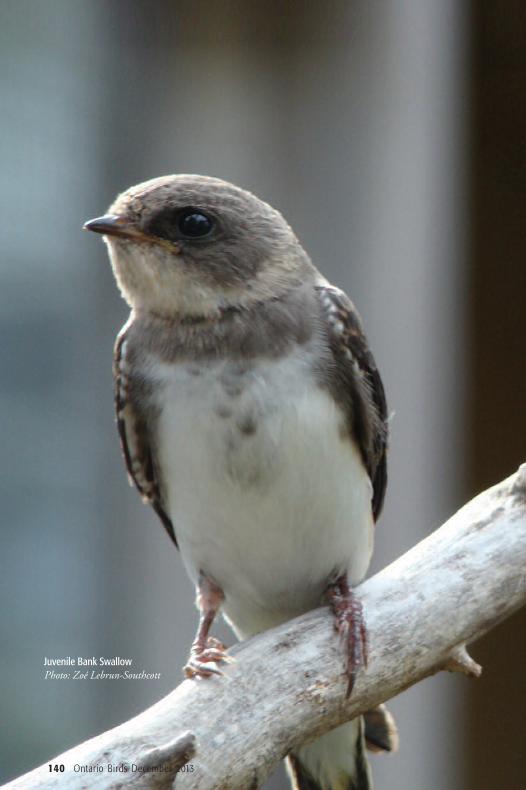
Juvenile Bank Swallow Photo: Zoé Lebrun-Southcott
MethodsIn this paper, a colony is defined as agroup of two or more burrows separatedby more than 100 m from any othergroup of Bank Swallow burrows. The study area extended from the
“Walkerton” col ony, within the city lim-its of Walkerton, downstream to the endof the surveyed section at Concession 8(Brockton Township, Bruce County).This stretch of the river is 14.9 “river km” long, and 8.4 km as the crow flies(Figure 2). From 2009 to 2013, this section of
river was surveyed for Bank Swallowcolonies at least once each year during thebreeding season. The size of Bank Swal-low colonies fluctuates greatly over thesummer due in large part to the ephemer-al nature of the banks in which they nest.Early in the season, colonies increase insize as birds return and burrows are estab-lished. Decreases occur due to erosion,bank collapse, and predation over the sea-son, as well as slumping of burrows later
in the season. In some cases, colony sizeincreases due to re-nesting after erosionhas destroyed burrows. In 2009, a singlesurvey was conducted, three surveys wereconducted in 2010, seven in 2011, threein 2012 and one in 2013. Results fromthese surveys show that the peak numberof total burrows observed along this sec-tion of the Saugeen River usually occursin June, with the highest numbers inmid-late June, though individual coloniesmay peak in number at different times.This paper compares burrow counts fromone visit conducted during the height ofthe breeding season in each of the 5 years:2 July 2009; 25 June 2010; 20 June2011; 24 June 2012 and 13 June 2013. The “Walkerton” colony mentioned
above is road-accessible; the remainingcolonies (Figure 2) were accessed bycanoe, from an access point in Walker-ton. Each survey was conducted by 2 to4 researchers, from roughly 08:00 to15:00. Researchers traveled downstreamby canoe, stopping to observe all coloniesencountered. Burrow counts were con-ducted mostly in the field, throughbinoculars, at a distance of five to 80 m.
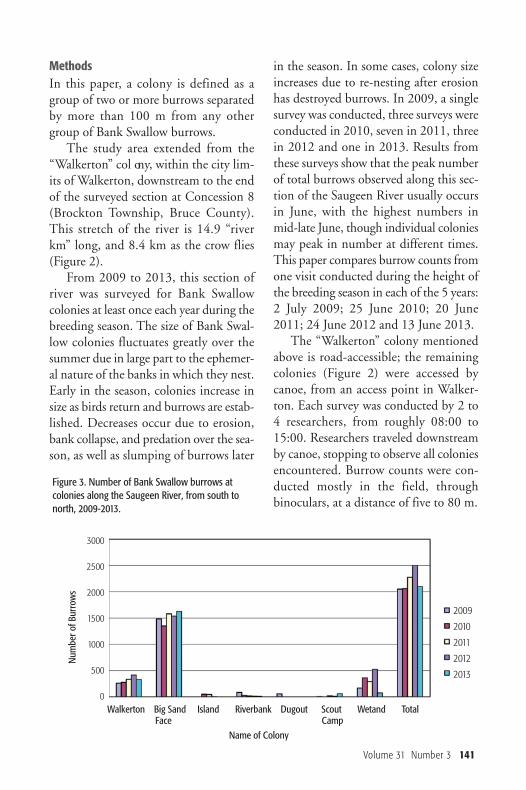
Figure 3. Number of Bank Swallow burrows atcolonies along the Saugeen River, from south tonorth, 2009-2013.
Volume 31 Number 3 141
Num
ber of Burrows
Name of Colony
Walkerton Big Sand Island Riverbank Dugout Scout Wetand TotalFace Camp
3000
2500
2000
1500
1000
500
0
2009
2010
2011
2012
2013
Counts were performed from land,except for one small colony where land-ing was difficult and counting could bedone readily from a canoe. Burrows werecounted individually and in most casesby two observers to ensure that countswere as accurate as possible. The largestcolony, at “Big Sand Face”, was pho-tographed and later counted from digitalphotographs that were printed and mag-nified on screen as required.
ResultsThe number of burrows counted at eachcolony each year from 2009 to 2013 isshown in Figure 3. Seven colonies werelocated, and colony size ranged from
three to 1624 burrows, although threecolony sites had no burrows for at leastone year when these banks appeared tobe unsuitable for nesting. In each of thefive years, the largest colony located wasat “Big Sand Face” (Figure 4). The col -onies were often at bends in the river andwere on the outside of the bends in areaswith large sand deposits. The total number of burrows count-
ed along the river peaked in 2012 at2501 and averaged 2195. Numbers fluc-tuated considerably during the five yearperiod, with changes of as much as 16%between subsequent years, but showedno evidence of decline over the five yearstudy period.
142 Ontario Birds December 2013
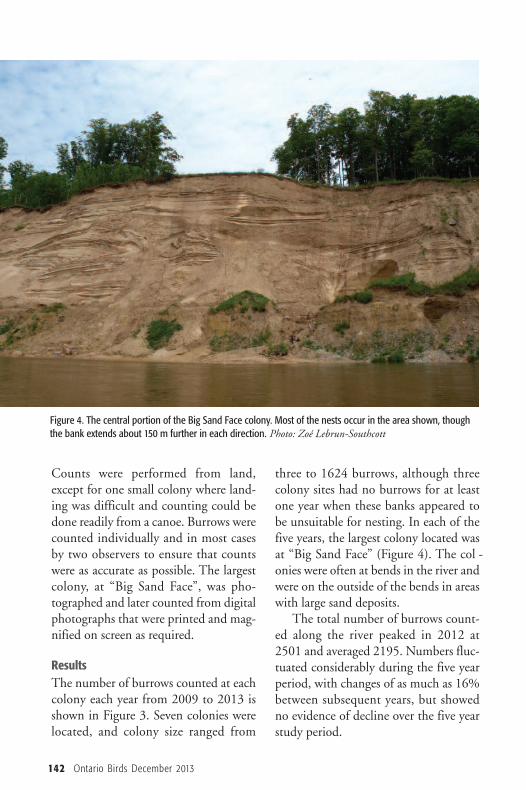
Figure 4. The central portion of the Big Sand Face colony. Most of the nests occur in the area shown, thoughthe bank extends about 150 m further in each direction. Photo: Zoé Lebrun-Southcott
DiscussionThe number of burrows found indicatesan exceptionally large population of BankSwallows along this stretch of the SaugeenRiver, averaging 147 burrows per km overthe entire stretch from the “Walkerton”colony to Concession 8, Brockton Town-ship, and 397 per km over the 4.9 kmfrom the “Big Sand Face” colony to the“Wetland” colony. A similar survey alongthe upstream section of the Saugeen Riverfrom Hanover to Walkerton in August2013 found only 40 burrows in threesmall colonies, averaging 2.3 burrows perkm. A downstream survey from Conces-sion 8, Brockton Township to BruceRoad 17 east of Port Elgin tallied approx-imately 600 burrows along a 44 km
stretch of river in June 2012, or 13.6 bur-rows per km (burrow numbers extractedfrom photographs provided by V. Martin,pers. comm.). The numbers from thisstudy are also large compared to a similarsurvey completed in 2013 along a 12 kmstretch of the Nottawasaga River whichcounted 245 burrows over 12.1 km, or20.2 per km (Canadian Wildlife Service,unpubl. data). The large number of burrows in this
section of the Saugeen River is in largepart due to the “Big Sand Face” col ony,which held an average of 69% of the bur-rows along this entire 14.9 km stretchover the five year period. This is clearlyan unusual and significant breeding site.The sand bank is approximately 400 m
Volume 31 Number 3 143
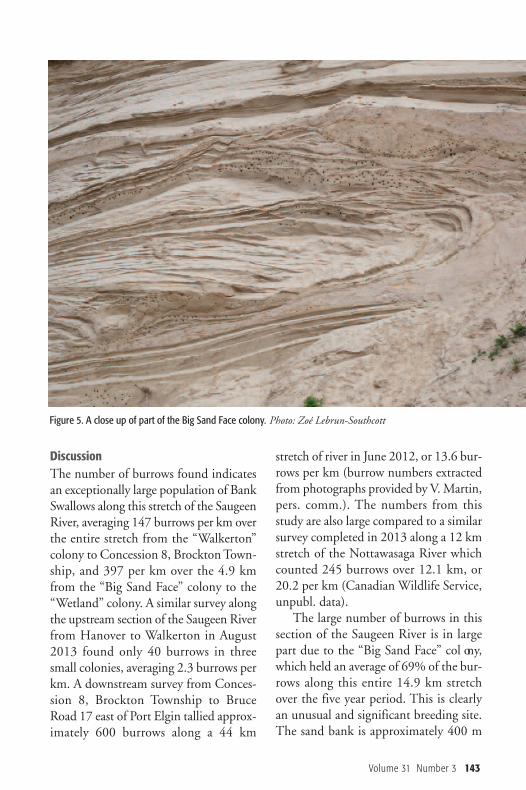
Figure 5. A close up of part of the Big Sand Face colony. Photo: Zoé Lebrun-Southcott
in length and 30 m high at its highestpoint. Within this large sand face, thelocation of “subcolonies” (Figure 5)changes annually, depending on theavailability of near-vertical sand faceswithin the larger bank. It may be thelargest colony on a river in Ontario. Noother river bank colonies of this size havebeen reported to the Ontario NestRecords Scheme (ONRS), though largercolonies have been reported in aggregatepits (ONRS data, pers. obs.) and alongthe shores of Lake Erie (M. Falconer,unpubl. data). Given the large decline in Bank Swal-
lows in Ontario (93% since 1970 accor -ding to BBS data), one might expectlarge areas of unused nesting habitatalong the river; however, this was gener-ally not the case. All of the banks thatappeared to be suitable were occupied by nesting Bank Swallows each year,though not all of the suitable bank wasnecessarily filled to capacity with bur-rows. At the “Big Sand Face” colony thereseemed to be considerable room for moreburrows, even in years with large num-bers of burrows (see Figure 5). Along theriver, banks seemingly too small for BankSwallows were occupied frequently byBelted Kingfishers (Ceryle alcyon) orNorthern Rough-winged Swallows (Stel-gidopteryx serripennis), the latter of whichoften nest in abandoned burrows.Although this five year study provides
only a small snapshot of localized data in comparison to the more than 40 yearsof BBS data, it is difficult to reconcile the huge decline in Bank Swallow popu-lations illustrated by the BBS with thestable population shown along theSaugeen River since 2009. Presumably
the removal of steep cut road-side banksdue to changes in highway standards andan increased use of berms around aggre-gate pits make it harder to view BankSwallows in roadside areas, so numbersfrom the roadside BBS might be expect-ed to decline. The relatively stable num-bers found along the Saugeen River, how-ever, suggest that the river provides acomparatively stable environment forBank Swallows, and that river banks inOntario may be important for sustainingBank Swallow numbers. Continuedmonitoring, and surveys along otherrivers, should help clarify whether thepattern observed in this study is typicalof the Saugeen River over the longer termand how it compares to other Ontariorivers.At three of the colony sites, no bur-
rows were found in some years. Smallcolonies appeared and disappeareddepen ding on the state of the availablebank at these locations. The bankschanged considerably between years, dueto erosion and bank collapse, and weresometimes obstructed by downed trees.On smaller banks, this meant that nosuitable nesting habitat was available insome years. Similarly, along the Sacra-mento River in California, colony per-sistence was shown to be correlated withcolony size (Garcia 2009). Larger colonies were occupied during
all five years of the study. Although thespecific part of the large bank occupiedmay have varied from year to year, therewas always some suitable bank for nest-ing in these locations. Nevertheless, somevery large changes in burrow numbersoccurred between years in large colonies.For example, the number of burrows
144 Ontario Birds December 2013
in the “Wetland” colony de clined from522 in 2012 to 74 in 2013, an 86%decline, due to a considerable reductionin the amount of vertical sand bankbetween years. This colony is on a veryactively eroding cut bank on a curve ofthe river, and sometimes changed con-siderably even during one breeding sea-son. For example, in 2010, we counted360 burrows in this colony on 25 June,but on 29 July, only 31 burrowsremained — the rest having been lostwhen most of the bank collapsed due toundercutting from the river. In 2011, thecolony was back up to 289 burrows.
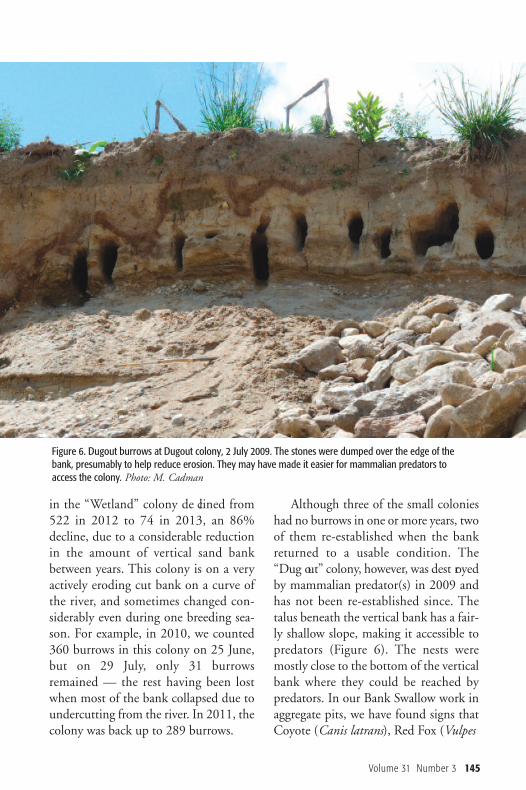
Although three of the small colonieshad no burrows in one or more years, twoof them re-established when the bankreturned to a usable condition. The“Dug out” colony, however, was dest royedby mammalian predator(s) in 2009 andhas not been re-established since. Thetalus beneath the vertical bank has a fair-ly shallow slope, making it accessible topredators (Figure 6). The nests weremostly close to the bottom of the verticalbank where they could be reached bypredators. In our Bank Swallow work inaggregate pits, we have found signs thatCoyote (Canis latrans), Red Fox (Vulpes
Volume 31 Number 3 145
Figure 6. Dugout burrows at Dugout colony, 2 July 2009. The stones were dumped over the edge of thebank, presumably to help reduce erosion. They may have made it easier for mammalian predators toaccess the colony. Photo: M. Cadman
vulpes), Striped Skunk (Mephites mephitis)and Raccoon (Procyon lotor) have depre-dated burrows by excavating them, but we do not know which species was res -ponsible for the predation in Figure 6. A colony might re-establish at this loca-tion when the bank returns to a suitablecondition.The “Riverbank” colony provides a
special case in relation to occupancy rate.Although a small number of burrows werecounted each year, none of these burrowswere seen to be occupied by Bank Swal-lows in 2011, 2012 or 2013, and many ofthe same burrows persisted for severalyears in a row — as viewed from photo-graphs. This is perhaps because the soilhas higher clay content than most of theother colonies, so the bank is much less
susceptible to erosion and collapse, andburrows survive the winter. In othercolonies along this stretch of the SaugeenRiver, which are mostly in banks of sand,almost all of the burrows disappearedbetween years due to erosion. For exam-ple, of the 2,060 burrows counted alongthe river on 25 June 2010, only 48 (2.3%)were still extant on 29 April 2011, and 19of these were in the “Riverbank” colony.Although some burrows in this colonysurvived from one year to the next, theywere not occupied because Bank Swallowsgenerally avoid reusing old nests becauseof increased likelihood of infestation by fleas (Ceratophyllus spp., Haas et al.1980). Northern Rough-winged Swallowswere observed using some of the “River-bank” colony burrows in 2011 and 2012.
146 Ontario Birds December 2013
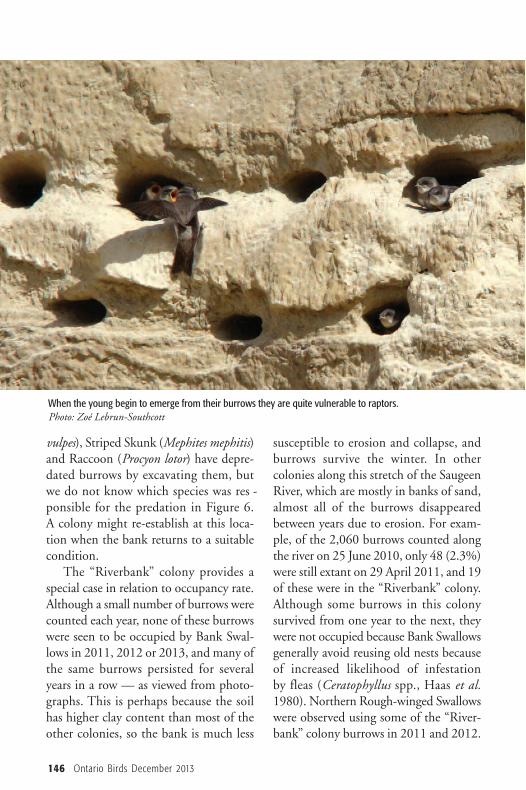
When the young begin to emerge from their burrows they are quite vulnerable to raptors.Photo: Zoé Lebrun-Southcott
In 2014, Canadian Wildlife Serviceand Ontario Ministry of Natural Res -ources will conduct a large scale surveyfor Bank Swallows on Ontario rivers. Theresults should help to elucidate theimpor tance of rivers to Bank Swallows inOntario relative to their numbers in pits(which were surveyed in 2013), and tothe large population along Lake Erie (M.Falconer, unpubl. data) and Lake Ont ario(Ontario Power Generation, unpubl.data) which have been surveyed since2010 and 2007, respectively. If you haveany information about Bank Swallowcolonies on Ontario rivers, please contactthe lead author.
AcknowledgementsThe assistance of the following in surveyingthe colonies along the river is gratefullyacknowledged: Jenn Bock, Meghan Douglas,Kyle Horner, Jessica Klawunn, Tina Knezevic,Lauren Rae, Antonio Salvadori, Kerry Schut-ten, Reinder Westerhoff and Bryan Wyatt.Meghan Douglas and Jessica Klawunn helpedcount burrows from photographs. Thanks toJeff Costa for producing Figure 2. Thanks alsoto Virgil Martin for providing the photo-graphs and location data for colonies along theSaugeen River and to David Featherstone forsimilar assistance along the Nottawasaga River.The advice and support of Ontario’s BankSwallow Working Group is much appreciated.
Literature CitedBank Swallow Technical Advisory Committee. 2013. Bank Swallow (Ripariariparia) Conservation Strategy for the Sacra-mento River Watershed, California. Version1.0. www.sacramentoriver.org/bans/
Environment Canada. 2013. North Ameri-can Breeding Bird Survey – Canadian TrendsWebsite, Data-version 2011. EnvironmentCanada, Gatineau, Quebec, K1A 0H3.
Garcia, D. 2009. Spatial and temporal pat-terns of the Bank Swallow on the SacramentoRiver. MSc. Thesis. California State Universi-ty, Chico, California, USA.
Garrison, B. A. 1999. Bank Swallow (Ripariariparia), The Birds of North America Online(A. Poole, Ed.). Ithaca: Cornell Lab ofOrnithology; Retrieved from the Birds ofNorth America Online: http://bna.birds. cornell.edu/bna/species/414
Haas, G. E., T. Rumfelt and N. Wilson.1980. Fleas (Siphonaptera) from nests andburrows of the Bank Swallow (Riparia riparia)in Alaska. Northwest Sci. 54:210-215.
Nebel, S., A. Mills, J. D. McCracken and P. D. Taylor. 2010. Declines of aerial insecti-vores in North America follow a geographicgradient. Avian Conservation and Ecology -Écologie et conservation des oiseaux 5(2): 1.[online] URL: http://www.ace-eco.org/vol5/iss2/art1/
North American Bird Conservation Initiative Canada. 2012. The State of Canada’s Birds, 2012. Environment Canada,Ottawa, Canada. 36 pp.
Mike CadmanCanadian Wildlife ServiceEnvironment Canada867 Lakeshore RoadBurlington, ON L7R 4A6E-mail: [email protected]
Zoé Lebrun-Southcott307-114 Vaughan RoadToronto, ON M6C 2M1
Volume 31 Number 3 147
148 Ontario Birds December 2013
Kirtland’s Warbler at Garrison Petawawa
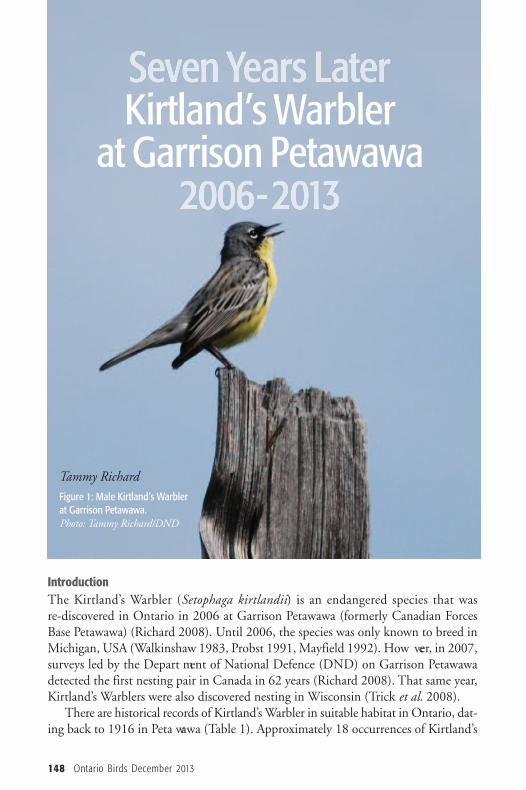
Figure 1: Male Kirtland’s Warblerat Garrison Petawawa. Photo: Tammy Richard/DND
Tammy Richard
IntroductionThe Kirtland’s Warbler (Setophaga kirtlandii) is an endangered species that was re-discovered in Ontario in 2006 at Garrison Petawawa (formerly Canadian ForcesBase Petawawa) (Richard 2008). Until 2006, the species was only known to breed inMichigan, USA (Walkinshaw 1983, Probst 1991, Mayfield 1992). How ever, in 2007,surveys led by the Depart ment of National Defence (DND) on Garrison Petawawadetected the first nesting pair in Canada in 62 years (Richard 2008). That same year,Kirtland’s Warblers were also discovered nesting in Wisconsin (Trick et al. 2008).There are historical records of Kirtland’s Warbler in suitable habitat in Ontario, dat-
ing back to 1916 in Peta wawa (Table 1). Approximately 18 occurrences of Kirtland’s
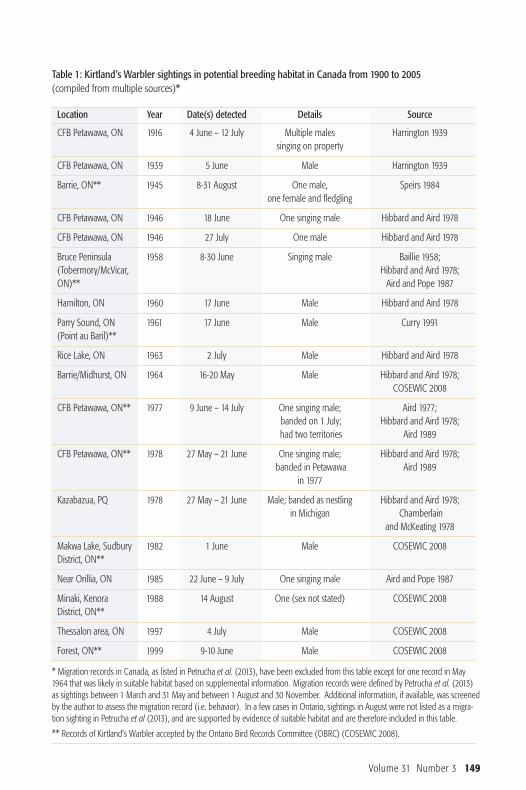
Table 1: Kirtland’s Warbler sightings in potential breeding habitat in Canada from 1900 to 2005 (compiled from multiple sources)*
Location Year Date(s) detected Details Source
CFB Petawawa, ON 1916 4 June – 12 July Multiple males Harrington 1939singing on property
CFB Petawawa, ON 1939 5 June Male Harrington 1939
Barrie, ON** 1945 8-31 August One male, Speirs 1984one female and fledgling
CFB Petawawa, ON 1946 18 June One singing male Hibbard and Aird 1978
CFB Petawawa, ON 1946 27 July One male Hibbard and Aird 1978
Bruce Peninsula 1958 8-30 June Singing male Baillie 1958; (Tobermory/McVicar, Hibbard and Aird 1978;ON)** Aird and Pope 1987
Hamilton, ON 1960 17 June Male Hibbard and Aird 1978
Parry Sound, ON 1961 17 June Male Curry 1991(Point au Baril)**
Rice Lake, ON 1963 2 July Male Hibbard and Aird 1978
Barrie/Midhurst, ON 1964 16-20 May Male Hibbard and Aird 1978; COSEWIC 2008
CFB Petawawa, ON** 1977 9 June – 14 July One singing male; Aird 1977; banded on 1 July; Hibbard and Aird 1978;had two territories Aird 1989
CFB Petawawa, ON** 1978 27 May – 21 June One singing male; Hibbard and Aird 1978; banded in Petawawa Aird 1989
in 1977
Kazabazua, PQ 1978 27 May – 21 June Male; banded as nestling Hibbard and Aird 1978;in Michigan Chamberlain
and McKeating 1978
Makwa Lake, Sudbury 1982 1 June Male COSEWIC 2008District, ON**
Near Orillia, ON 1985 22 June – 9 July One singing male Aird and Pope 1987
Minaki, Kenora 1988 14 August One (sex not stated) COSEWIC 2008District, ON**
Thessalon area, ON 1997 4 July Male COSEWIC 2008
Forest, ON** 1999 9-10 June Male COSEWIC 2008
* Migration records in Canada, as listed in Petrucha et al. (2013), have been excluded from this table except for one record in May1964 that was likely in suitable habitat based on supplemental information. Migration records were defined by Petrucha et al. (2013)as sightings between 1 March and 31 May and between 1 August and 30 November. Additional information, if available, was screenedby the author to assess the migration record (i.e. behavior). In a few cases in Ontario, sightings in August were not listed as a migra-tion sighting in Petrucha et al (2013), and are supported by evidence of suitable habitat and are therefore included in this table.
** Records of Kirtland’s Warbler accepted by the Ontario Bird Records Committee (OBRC) (COSEWIC 2008).
Volume 31 Number 3 149
Warbler in potential breeding habitat aredocumented in Canada between 1900and 2005, however, there are 47 springmig ration records of Kirtland’s Warbler inOntario between 1900 and 2005 and 7fall migration records (Petrucha et al.2013). Kirtland’s Warblers leave the Ba -hamas for their breeding grounds in theUnited States and Canada at the end ofApril and fly through Florida, Georgiaand South Carolina (Walkinshaw 1983).As they move northward, the migrationroute widens in a fan-like pattern acrossseveral U.S. states (Pet rucha et al. 2013).Many spring migrants have been detectedalong the shorelines of the Great Lakesincluding in Toronto, Point Pelee, Ron-deau Provincial Park and Prince EdwardPoint as they move towards their breed-ing grounds (Petrucha et al. 2013). In Michigan, Kirtland’s Warblers
arrive on their breeding grounds at thebeginning of May (Mayfield 1992), usu-ally in the period between the 3rd and12th of May (Mayfield 1960). However,some are documented to have arrived aslate as 5 June in Michigan (Rock well etal. 2012). The total duration of springmigration ranges between 13 and 23 days(Ewert et al. 2012). Once on the breed-ing grounds, males occupy a territorybetween 0.6 ha to more than 10 ha in size,the average being 8.4 ha (Walkinshaw1983). There is strong site fidelity, andmales usually return to the same territo-ries in subsequent years (Walkinshaw1983). Males defend their territory bysinging persistently and chasing awayother male Kirtland’s Warblers along withother bird species (Walkinshaw 1983,Mayfield 1992). Individuals depart from
their breeding grounds in late August orSeptember and return to their winteringgrounds in the Bahamas over 2000 kmaway (Sykes et al. 1989).Historically, the Kirtland’s Warbler
was found in the Petawawa area in suit-able breeding habitat. Harrington (1939)noted that they were “not uncommon” tothe Jack Pine (Pinus banksiana) of Pet a -wawa and suspected that they were breeding on the military base. Singingmales were heard at Garrison Petawawa in1916, 1939, 1946, 1977 and 1978, butnesting was not detected (Harrington1939, Aird 1977, Hibbard and Aird1978, Cadman et al. 1987). Since theirre-discovery in 2006, Kirtland’s Warblershave been surveyed and monitored annu-ally at Garrison Petawawa. The purposeof this paper is to provide information onarrival dates, territory sizes and habitat useof Kirtland’s Warbler at Garrison Peta -wawa.
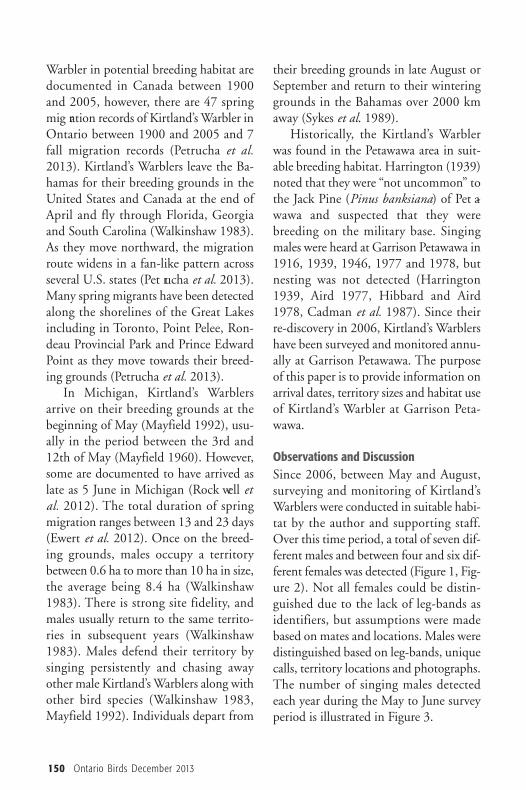
Observations and DiscussionSince 2006, between May and August,surveying and monitoring of Kirtland’sWarblers were conducted in suitable habi-tat by the author and supporting staff.Over this time period, a total of seven dif-ferent males and between four and six dif-ferent females was detected (Figure 1, Fig-ure 2). Not all females could be distin-guished due to the lack of leg-bands asidentifiers, but assumptions were madebased on mates and locations. Males weredistinguished based on leg-bands, uniquecalls, territory locations and photographs.The number of singing males detectedeach year during the May to June surveyperiod is illustrated in Figure 3.
150 Ontario Birds December 2013
Volume 31 Number 3 151
Figure 2: Female Kirtland’s Warbler at GarrisonPetawawa. Photo: Tammy Richard/DND
�
��
��
�
5
4
3
2
1
02006 2007 2008 2009 2010 2011 2012 2013
Year
Num
ber of m
ale Kirtland’s W
arblers
Figure 3: Number of singing male Kirtland’sWarblers detected during the annual survey atGarrison Petawawa.Tammy Richard/DND
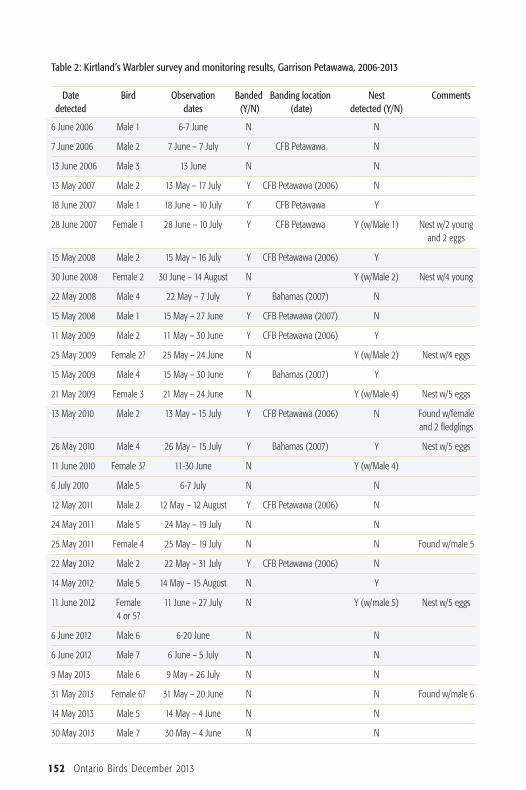
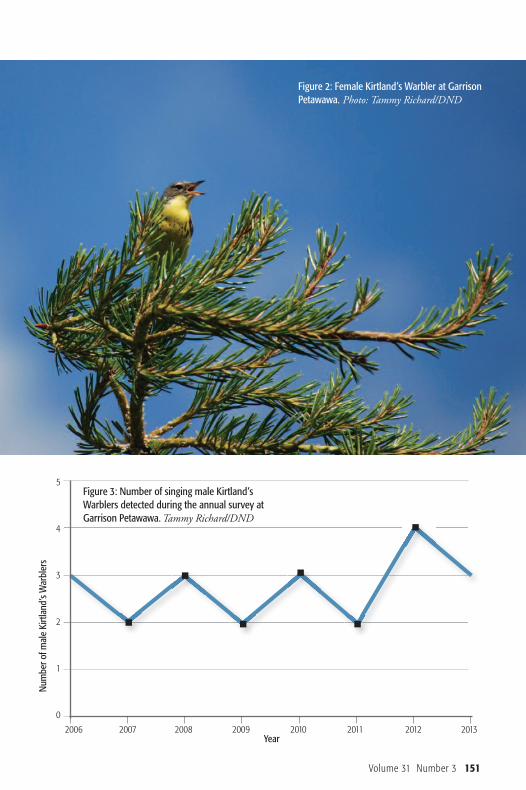
Table 2: Kirtland’s Warbler survey and monitoring results, Garrison Petawawa, 2006-2013
Date Bird Observation Banded Banding location Nest Commentsdetected dates (Y/N) (date) detected (Y/N)
6 June 2006 Male 1 6-7 June N N
7 June 2006 Male 2 7 June – 7 July Y CFB Petawawa N
13 June 2006 Male 3 13 June N N
13 May 2007 Male 2 13 May – 17 July Y CFB Petawawa (2006) N
18 June 2007 Male 1 18 June – 10 July Y CFB Petawawa Y
28 June 2007 Female 1 28 June – 10 July Y CFB Petawawa Y (w/Male 1) Nest w/2 young and 2 eggs
15 May 2008 Male 2 15 May – 16 July Y CFB Petawawa (2006) Y
30 June 2008 Female 2 30 June – 14 August N Y (w/Male 2) Nest w/4 young
22 May 2008 Male 4 22 May – 7 July Y Bahamas (2007) N
15 May 2008 Male 1 15 May – 27 June Y CFB Petawawa (2007) N
11 May 2009 Male 2 11 May – 30 June Y CFB Petawawa (2006) Y
25 May 2009 Female 2? 25 May – 24 June N Y (w/Male 2) Nest w/4 eggs
15 May 2009 Male 4 15 May – 30 June Y Bahamas (2007) Y
21 May 2009 Female 3 21 May – 24 June N Y (w/Male 4) Nest w/5 eggs
13 May 2010 Male 2 13 May – 15 July Y CFB Petawawa (2006) N Found w/female and 2 fledglings
26 May 2010 Male 4 26 May – 15 July Y Bahamas (2007) Y Nest w/5 eggs
11 June 2010 Female 3? 11-30 June N Y (w/Male 4)
6 July 2010 Male 5 6-7 July N N
12 May 2011 Male 2 12 May – 12 August Y CFB Petawawa (2006) N
24 May 2011 Male 5 24 May – 19 July N N
25 May 2011 Female 4 25 May – 19 July N N Found w/male 5
22 May 2012 Male 2 22 May – 31 July Y CFB Petawawa (2006) N
14 May 2012 Male 5 14 May – 15 August N Y
11 June 2012 Female 11 June – 27 July N Y (w/male 5) Nest w/5 eggs4 or 5?
6 June 2012 Male 6 6-20 June N N
6 June 2012 Male 7 6 June – 5 July N N
9 May 2013 Male 6 9 May – 26 July N N
31 May 2013 Female 6? 31 May – 20 June N N Found w/male 6
14 May 2013 Male 5 14 May – 4 June N N
30 May 2013 Male 7 30 May – 4 June N N
152 Ontario Birds December 2013
Volume 31 Number 3 153
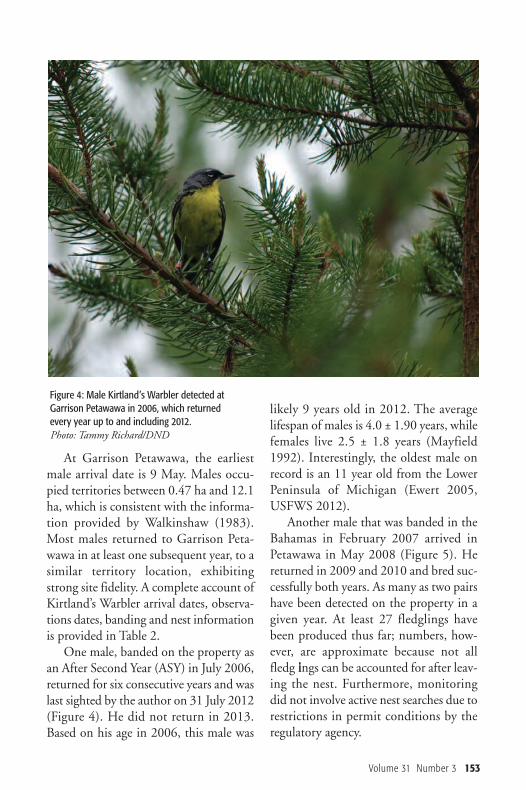
At Garrison Petawawa, the earliestmale arrival date is 9 May. Males occu-pied territories between 0.47 ha and 12.1ha, which is consistent with the informa-tion provided by Walkinshaw (1983).Most males returned to Garrison Peta -wawa in at least one subsequent year, to asimilar territory location, exhibitingstrong site fidelity. A complete account ofKirtland’s Warbler arrival dates, observa-tions dates, banding and nest informationis provided in Table 2.One male, banded on the property as
an After Second Year (ASY) in July 2006,returned for six consecutive years and waslast sighted by the author on 31 July 2012(Figure 4). He did not return in 2013.Based on his age in 2006, this male was
likely 9 years old in 2012. The averagelifespan of males is 4.0 ± 1.90 years, whilefemales live 2.5 ± 1.8 years (Mayfield1992). Interestingly, the oldest male onrecord is an 11 year old from the LowerPeninsula of Michigan (Ewert 2005,USFWS 2012). Another male that was banded in the
Bahamas in February 2007 arrived inPetawawa in May 2008 (Figure 5). Hereturned in 2009 and 2010 and bred suc-cessfully both years. As many as two pairshave been detected on the property in agiven year. At least 27 fledglings havebeen produced thus far; numbers, how-ever, are approximate because not allfledg lings can be accounted for after leav-ing the nest. Furthermore, monitoringdid not involve active nest searches due torestrictions in permit conditions by theregulatory agency.
Figure 4: Male Kirtland’s Warbler detected at Garrison Petawawa in 2006, which returned every year up to and including 2012. Photo: Tammy Richard/DND

154 Ontario Birds December 2013
Volume 31 Number 3 155
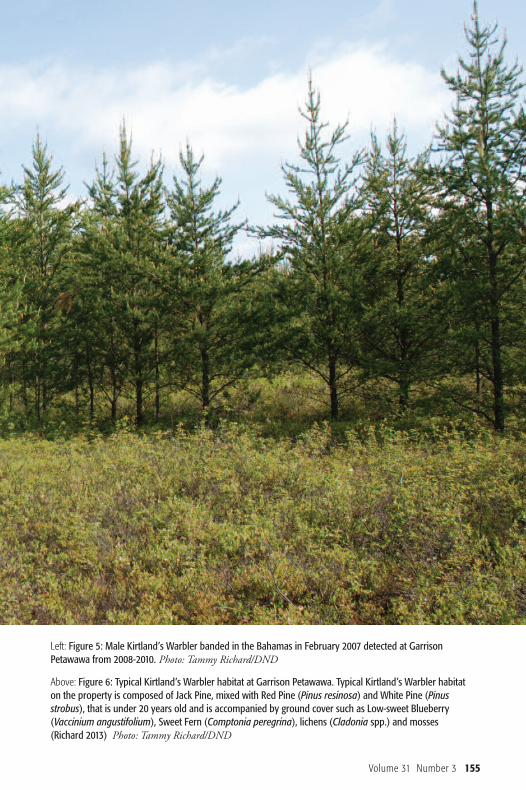
Left: Figure 5: Male Kirtland’s Warbler banded in the Bahamas in February 2007 detected at GarrisonPetawawa from 2008-2010. Photo: Tammy Richard/DND
Above: Figure 6: Typical Kirtland’s Warbler habitat at Garrison Petawawa. Typical Kirtland’s Warbler habitaton the property is composed of Jack Pine, mixed with Red Pine (Pinus resinosa) and White Pine (Pinusstrobus), that is under 20 years old and is accompanied by ground cover such as Low-sweet Blueberry(Vaccinium angustifolium), Sweet Fern (Comptonia peregrina), lichens (Cladonia spp.) and mosses(Richard 2013) Photo: Tammy Richard/DND
156 Ontario Birds December 2013
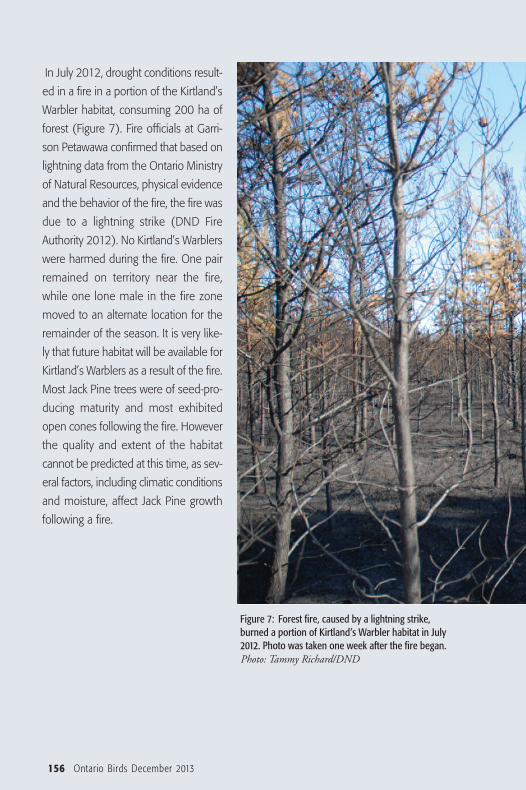
In July 2012, drought conditions result-
ed in a fire in a portion of the Kirtland’s
Warbler habitat, consuming 200 ha of
forest (Figure 7). Fire officials at Garri-
son Petawawa confirmed that based on
lightning data from the Ontario Ministry
of Natural Resources, physical evidence
and the behavior of the fire, the fire was
due to a lightning strike (DND Fire
Authority 2012). No Kirtland’s Warblers
were harmed during the fire. One pair
remained on territory near the fire,
while one lone male in the fire zone
moved to an alternate location for the
remainder of the season. It is very like-
ly that future habitat will be available for
Kirtland’s Warblers as a result of the fire.
Most Jack Pine trees were of seed-pro-
ducing maturity and most exhibited
open cones following the fire. How ever
the quality and extent of the habitat
can not be predicted at this time, as sev-
eral factors, including climatic conditions
and moisture, affect Jack Pine growth
following a fire.
Figure 7: Forest fire, caused by a lightning strike,burned a portion of Kirtland’s Warbler habitat in July2012. Photo was taken one week after the fire began.Photo: Tammy Richard/DND
Volume 31 Number 3 157
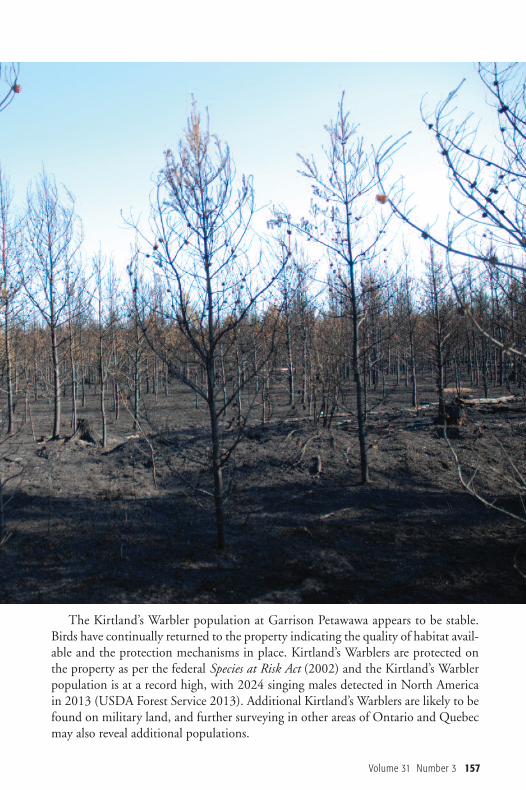
The Kirtland’s Warbler population at Garrison Petawawa appears to be stable.Birds have continually returned to the property indicating the quality of habitat avail-able and the protection mechanisms in place. Kirtland’s Warblers are protected onthe property as per the federal Species at Risk Act (2002) and the Kirtland’s Warblerpopulation is at a record high, with 2024 singing males detected in North Americain 2013 (USDA Forest Service 2013). Additional Kirtland’s Warblers are likely to befound on military land, and further surveying in other areas of Ontario and Quebecmay also reveal additional populations.
AcknowledgementsFinancial support was provided by the Depart-ment of National Defence. The author wishesto thank the following people for their assis-tance in the Kirtland’s Warbler project: C. Macfarlane, A. McCrum, M. Cybulski, B. Doering and M. Perry. Thanks to C. Risley,G. Coady and C. Weseloh for reviewing earlierversions of this article.
Literature CitedAird, P. 1977. Rare bird found in Ontario.Faculty of Forestry and Landscape Architec-ture, University of Toronto. 2 pp.
Aird, P. 1989. The dispersal of the Kirtland’sWarbler: myths and reality. Pp. 32-37 inProceedings of the Kirtland’s Warbler Symposium, Lansing, Michigan Feb. 9-11,1989. U.S. Forest Service. 97 pp.
Aird, P and D. Pope. 1987. Kirtland’s Warbler, pp. 388-389 in: Cadman, M.D.,P.F.J. Eagles and F.M. Helleiner, eds. Atlas ofthe Breeding Birds of Ontario. University ofWaterloo Press, Waterloo, Ontario.
Baillie, J.L. 1958. Kirtland’s Warbler inOntario. 23 June 1958. Unpublished reportobtained from Royal Ontario Museum. 1 pp.
Cadman, M.D., P. Eagles and F. M. Hell -einer (eds.). 1987. Atlas of the Breeding Birdsof Ontario. University of Waterloo Press,Ontario. 611 pp.
Chamberlain, D. and G. McKeating. 1978.The 1978 Kirtland’s Warbler survey inOntario. Ontario Ministry of NaturalResources. Toronto, Ontario. 32 pp.
COSEWIC. 2000. COSEWIC assessmentand update status report on the Kirtland’sWarbler Dendroica kirtlandii, in Canada.Committee on the Status of EndangeredWildlife in Canada, Ottawa. vi + 10 pp.
COSEWIC. 2008. COSEWIC assessmentand update status report on the Kirtland’sWarbler Dendroica kirtlandii, in Canada.Committee on the Status of EndangeredWildlife in Canada, Ottawa. vi + 31 pp.
Curry, R. 1991. Ontario Bird Records Committee Report for 1990. Ontario Birds9:18-44.
DND Fire Authority. 2012. Fire Investiga-tion Report. CFB Petawawa Fire Department,Petawawa. Internal DND report. 13 pp.
Ewert, D. 2005. Report to U.S. Fish andWildlife Service, Federal Endangered SpeciesPermit. The Nature Conservancy, Lansing,Michigan. 8 pp.
Ewert, D., K. Hall, J. Wunderle, D. Currie,S. Rockwell, S. Johnson, and J. White.2012. Duration and rate of spring migrationof Kirtland’s Warblers. Wilson Journal ofOrnithology 124:9-14.
Harrington, P. 1939. Kirtland’s Warbler inOntario. Jack Pine Warbler 17:96-97.
Hibbard, S. and P. Aird. 1978. Records ofthe Kirtland’s Warbler in Canada (Draft).University of Toronto, Toronto.
Mayfield. H.F. 1960. The Kirtland’s Warbler.Cranbrook Institute of Science, BloomfieldHills, Michigan. 242 pp.
Mayfield, H.F. 1992. Kirtland’s Warbler,Setophaga kirtlandii) in: Poole, A., P. Stetten-heim and F. Gill, eds. The Birds of NorthAmerica, No. 19. The Academy of NaturalSciences, Philadelphia, Pennsylvania.
Petrucha, M., P. Sykes, P. Huber, and W. Duncan. 2013. Spring and fall migrationsof Kirtland’s Warbler (Setophaga kirtlandii).North American Birds 66:382-426.
Probst, J. R. 1991. Kirtland’s Warbler. In: The Atlas of Breeding Birds of Michigan (R. Brewer, G. McPeek and R. Adams Jr.,eds.), Michigan State University Press, EastLansing, USA. pp. 414-417.
Richard, T. 2008. Confirmed occurrence and nesting of the Kirtland’s Warbler at CFB Petawawa, Ontario: a first for Canada.Ontario Birds 26:2-15.
158 Ontario Birds December 2013
Richard, T. 2013. Characterization of Kirt-land’s Warbler (Setophaga kirtlandii) habitaton a Canadian military installation. Master’sthesis. Royal Military College of Canada. 100pp + Appendices.
Rockwell, S., C. Bocetti and P. Marra.2012. Carry-over effects of winter climate onspring arrival date and reproductive successin an endangered migratory bird, Kirtland’sWarbler (Setophaga kirtlandii). Auk 129: 744-752.
Speirs, D. H. 1984. The first breeding recordof Kirtland’s Warbler in Ontario. OntarioBirds 2:80-84.
Sykes, P., C. Kepler, A. Jett and M. DeCapita. 1989. Kirtland’s Warblers onthe nesting grounds during post-breedingperiod. Wilson Bulletin 101:545-558.
Trick, J.A., K. Grveles, D. Ditommasa andJ. Robaidek. 2008. The first Wisconsin nest-ing record of Kirtland’s Warbler (Dendroicakirtlandii). Passenger Pigeon 70:93-102.
USDA Forest Service. 2013. 2013 Kirtland’sWarbler Census Results. 29 July 2013.Unpublished report presented at U.S. Kirtland’s Warbler Recovery Team Meeting,Roscommon, Michigan. 1 pp.
USFWS. 2012. Kirtland’s Warbler 5 YearReview: Summary and Evaluation. U.S. Fishand Wildlife Service, East Lansing, Michigan. 68 pp.
Walkinshaw, L.H. 1983. Kirtland’s Warbler:the natural history of an endangered species.Cranbrook Institute of Science, BloomfieldHills, Michigan. 207 pp.
Tammy Richard Wildlife/Species at Risk BiologistDepartment of National DefenceGarrison Petawawa P.O. Box 9999, Stn Main Petawawa, ON K8H 2X3 E-mail: [email protected]
Volume 31 Number 3 159
160 Ontario Birds December 2013
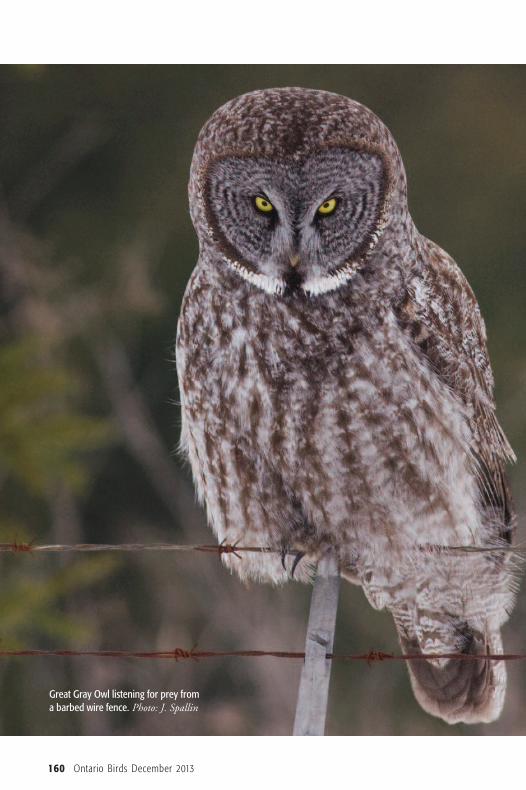
Great Gray Owl listening for prey froma barbed wire fence. Photo: J. Spallin
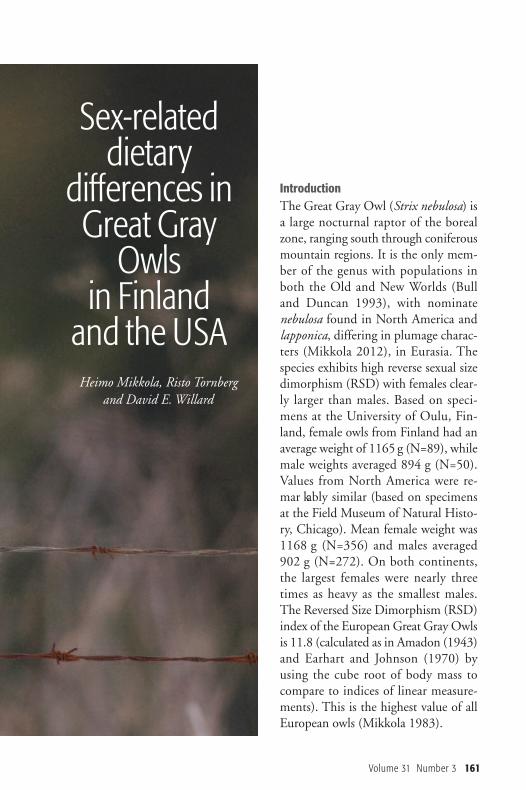
IntroductionThe Great Gray Owl (Strix nebulosa) isa large nocturnal raptor of the borealzone, ranging south through coniferousmountain regions. It is the only mem-ber of the genus with populations inboth the Old and New Worlds (Bulland Duncan 1993), with nominatenebulosa found in North America andlapponica, differing in plumage charac-ters (Mikkola 2012), in Eurasia. Thespecies exhibits high reverse sexual sizedimorphism (RSD) with females clear-ly larger than males. Based on speci-mens at the University of Oulu, Fin-land, female owls from Finland had anaverage weight of 1165 g (N=89), whilemale weights averaged 894 g (N=50).Values from North America were re -mar kably similar (based on specimensat the Field Museum of Natural Histo-ry, Chicago). Mean female weight was1168 g (N=356) and males averaged902 g (N=272). On both continents,the largest females were nearly threetimes as heavy as the smallest males.The Reversed Size Dimorphism (RSD)index of the European Great Gray Owlsis 11.8 (calculated as in Amadon (1943)and Earhart and Johnson (1970) byusing the cube root of body mass tocompare to indices of linear measure-ments). This is the highest value of allEuropean owls (Mikkola 1983).
Volume 31 Number 3 161
Sex-relateddietary
differences in Great GrayOwls
in Finland and the USAHeimo Mikkola, Risto Tornberg
and David E. Willard
There are many studies of owl dietsbased on analysis of prey remains foundin pellets (summarized in Marti et al.1993). Pellets of Great Gray Owls atbreeding sites have provided informationon overall diet (Mikkola and Sulkava1970, Bull and Henjum 1990, Duncan1992, Sulkava and Huhtala 1997), butbecause it is difficult to be certain whichsex produced the pellet, and because themale is almost exclusively responsible forprey deliveries to the nest, these studiescannot address the question of sexual dif-ferences in diet or prey selection. Withthe large amount of sexual size dimor-phism in this species, it seems logical tohypothesize that females should takelarger prey, minimizing intraspecificcompetition, as seen in studies of diurnalraptors (Temeles 1985, Krüger 2005).
Two large samples of Great GrayOwls allow us to test whether there aredietary differences between the sexes.HM and RT analyzed a sample from Fin-land found dead along roads or confis-cated after illegal hunting over a 78 yearspan, 1927– 2005 (specimens in collec-tions of taxidermist Pentti Alaja, Vesantoand the University of Oulu); DWworked with birds from Minnesota andWisconsin found dead during the hugeirruption of the winter of 2004-2005(Svingen and Lind 2005). The source ofmany of these irruptive owls in Min-nesota and Wisconsin would haveundoubtedly referred to breeding popu-lations in the boreal forest regions ofOntario and Manitoba.
162 Ontario Birds December 2013
Materials and MethodsOne hundred and fifty Great Gray Owls from Finland and 675 from Minnesota and Wisconsinwere sexed internally and the contents of their stomachs identified. In Finland, 312 prey itemswere identified from 59 females and 46 males, while there were 1225 prey items from 203 femaleand 148 male stomachs in North America. The remainder of stomachs were either empty or contained no identifiable prey items. The samples from Finland were collected over severaldecades in years of variable prey abundance, whereas those from Minnesota and Wisconsin wereall collected in a single winter, during an irruption when prey was abundant.
For the Finnish prey items, we used average weights given by Siivonen (1967) and Jensen(1994) for small mammals, and for birds, we used Von Haartman et al. (1963-1972). Averageweights for Minnesota and Wisconsin prey items were taken from on-line data provided by theSmithsonian Institution.
We tested differences in the diet between sexes in both countries by Chi-square χ2 tests. We arranged the data according to prey weight classes in order to have sufficient numbers of preyin each cell of the contingency table. These weight categories were: a) < 15g (mostly shrews); b) 16-30g (mostly smaller rodents); c) 31-50g (larger voles, frogs, thrushes); d) 51g and above(water voles, weasels, large birds, hare).
To calculate diet width, we used Levins’ index (Levins 1968) B=1/∑ Pi2, in which Pi is theproportion of the i th prey or prey group.
Volume 31 Number 3 163
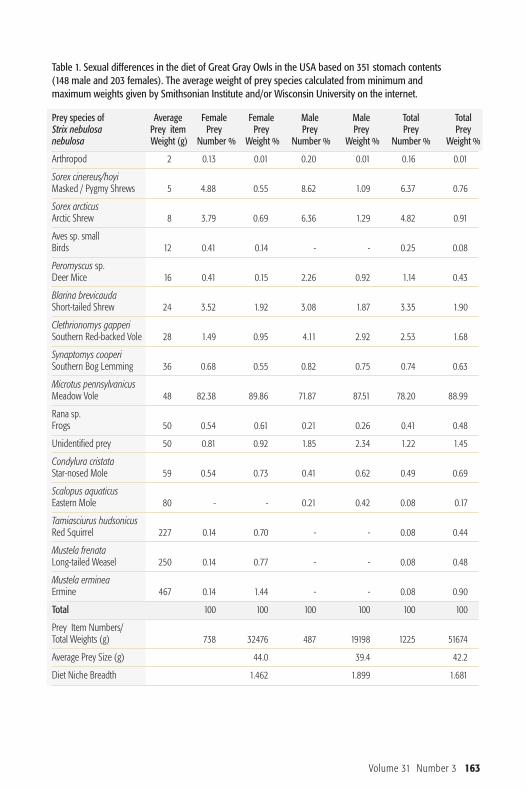
Table 1. Sexual differences in the diet of Great Gray Owls in the USA based on 351 stomach contents (148 male and 203 females). The average weight of prey species calculated from minimum and maximum weights given by Smithsonian Institute and/or Wisconsin University on the internet.
Prey species of Average Female Female Male Male Total TotalStrix nebulosa Prey item Prey Prey Prey Prey Prey Preynebulosa Weight (g) Number % Weight % Number % Weight % Number % Weight %
Arthropod 2 0.13 0.01 0.20 0.01 0.16 0.01
Sorex cinereus/hoyiMasked / Pygmy Shrews 5 4.88 0.55 8.62 1.09 6.37 0.76
Sorex arcticusArctic Shrew 8 3.79 0.69 6.36 1.29 4.82 0.91
Aves sp. smallBirds 12 0.41 0.14 - - 0.25 0.08
Peromyscus sp.Deer Mice 16 0.41 0.15 2.26 0.92 1.14 0.43
Blarina brevicaudaShort-tailed Shrew 24 3.52 1.92 3.08 1.87 3.35 1.90
Clethrionomys gapperiSouthern Red-backed Vole 28 1.49 0.95 4.11 2.92 2.53 1.68
Synaptomys cooperiSouthern Bog Lemming 36 0.68 0.55 0.82 0.75 0.74 0.63
Microtus pennsylvanicusMeadow Vole 48 82.38 89.86 71.87 87.51 78.20 88.99
Rana sp.Frogs 50 0.54 0.61 0.21 0.26 0.41 0.48
Unidentified prey 50 0.81 0.92 1.85 2.34 1.22 1.45
Condylura cristataStar-nosed Mole 59 0.54 0.73 0.41 0.62 0.49 0.69
Scalopus aquaticusEastern Mole 80 - - 0.21 0.42 0.08 0.17
Tamiasciurus hudsonicusRed Squirrel 227 0.14 0.70 - - 0.08 0.44
Mustela frenataLong-tailed Weasel 250 0.14 0.77 - - 0.08 0.48
Mustela ermineaErmine 467 0.14 1.44 - - 0.08 0.90
Total 100 100 100 100 100 100
Prey Item Numbers/Total Weights (g) 738 32476 487 19198 1225 51674
Average Prey Size (g) 44.0 39.4 42.2
Diet Niche Breadth 1.462 1.899 1.681
ResultsIn the sample from Minnesota and Wis-consin (Table 1), the most common preyfor both male and female owls was theMeadow Vole (Mic ro tus pennsylvanicus).Shrews of several species were also com-monly eaten (12% of female, 18% ofmale prey items), but by weight, theircontribution was considerably less im -portant. Only females were documentedtaking prey over 80 g: Red Squirrel(Tam iasciurus hudsonicus), Long-tailedWeasel (Must ela frenata) and Ermine(Mustela erm inea). Previous studies havealso documented Ermine in Great GrayOwl diet (Brunton and Reynolds 1984).
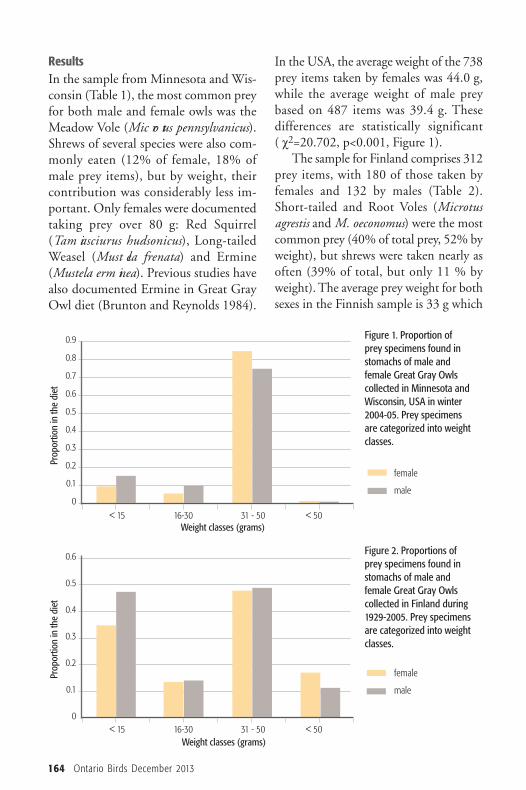
In the USA, the average weight of the 738prey items taken by females was 44.0 g,while the average weight of male preybased on 487 items was 39.4 g. These differences are statistically significant(�χ2=20.702, p<0.001, Figure 1).The sample for Finland comprises 312
prey items, with 180 of those taken byfemales and 132 by males (Table 2).Short-tailed and Root Voles (Microtusagrestis and M. oeconomus) were the mostcommon prey (40% of total prey, 52% byweight), but shrews were taken nearly asoften (39% of total, but only 11 % byweight). The average prey weight for bothsexes in the Finnish sample is 33 g which
164 Ontario Birds December 2013
Figure 1. Proportion ofprey specimens found instomachs of male andfemale Great Gray Owls collected in Minnesota andWisconsin, USA in winter2004-05. Prey specimens are categorized into weightclasses.
Figure 2. Proportions of prey specimens found instomachs of male andfemale Great Gray Owls collected in Finland during1929-2005. Prey specimensare categorized into weightclasses.
< 15 16-30 31 - 50 < 50
Proportion in the diet
Weight classes (grams)
female
male
female
male
0.9
0.8
0.7
0.6
0.5
0.4
0.3
0.2
0.1
0
< 15 16-30 31 - 50 < 50
Proportion in the diet
Weight classes (grams)
0.6
0.5
0.4
0.3
0.2
0.1
0
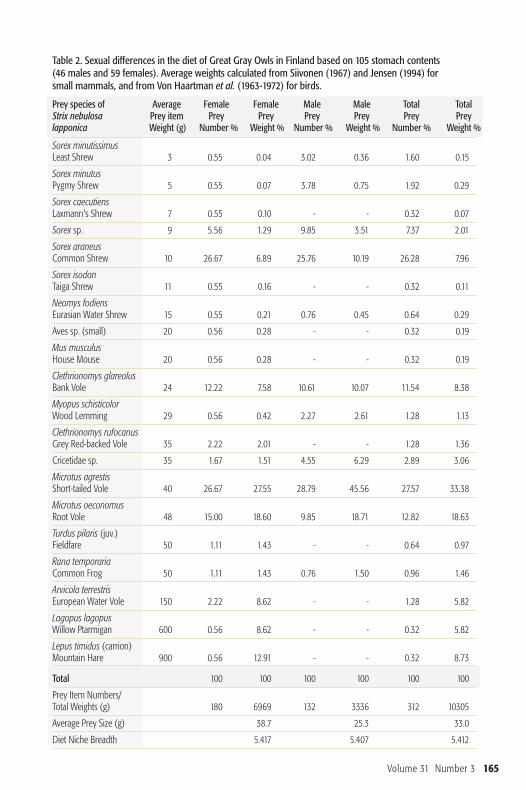
Table 2. Sexual differences in the diet of Great Gray Owls in Finland based on 105 stomach contents (46 males and 59 females). Average weights calculated from Siivonen (1967) and Jensen (1994) for small mammals, and from Von Haartman et al. (1963-1972) for birds.
Prey species of Average Female Female Male Male Total TotalStrix nebulosa Prey item Prey Prey Prey Prey Prey Preylapponica Weight (g) Number % Weight % Number % Weight % Number % Weight %
Sorex minutissimusLeast Shrew 3 0.55 0.04 3.02 0.36 1.60 0.15
Sorex minutusPygmy Shrew 5 0.55 0.07 3.78 0.75 1.92 0.29
Sorex caecutiensLaxmann's Shrew 7 0.55 0.10 - - 0.32 0.07
Sorex sp. 9 5.56 1.29 9.85 3.51 7.37 2.01
Sorex araneusCommon Shrew 10 26.67 6.89 25.76 10.19 26.28 7.96
Sorex isodonTaiga Shrew 11 0.55 0.16 - - 0.32 0.11
Neomys fodiensEurasian Water Shrew 15 0.55 0.21 0.76 0.45 0.64 0.29
Aves sp. (small) 20 0.56 0.28 - - 0.32 0.19
Mus musculusHouse Mouse 20 0.56 0.28 - - 0.32 0.19
Clethrionomys glareolusBank Vole 24 12.22 7.58 10.61 10.07 11.54 8.38
Myopus schisticolorWood Lemming 29 0.56 0.42 2.27 2.61 1.28 1.13
Clethrionomys rufocanusGrey Red-backed Vole 35 2.22 2.01 - - 1.28 1.36
Cricetidae sp. 35 1.67 1.51 4.55 6.29 2.89 3.06
Microtus agrestisShort-tailed Vole 40 26.67 27.55 28.79 45.56 27.57 33.38
Microtus oeconomusRoot Vole 48 15.00 18.60 9.85 18.71 12.82 18.63
Turdus pilaris (juv.)Fieldfare 50 1.11 1.43 - - 0.64 0.97
Rana temporariaCommon Frog 50 1.11 1.43 0.76 1.50 0.96 1.46
Arvicola terrestrisEuropean Water Vole 150 2.22 8.62 - - 1.28 5.82
Lagopus lagopusWillow Ptarmigan 600 0.56 8.62 - - 0.32 5.82
Lepus timidus (carrion)Mountain Hare 900 0.56 12.91 - - 0.32 8.73
Total 100 100 100 100 100 100
Prey Item Numbers/Total Weights (g) 180 6969 132 3336 312 10305
Average Prey Size (g) 38.7 25.3 33.0
Diet Niche Breadth 5.417 5.407 5.412
Volume 31 Number 3 165
is identical to that found in a large(N=5177) sample of prey material frompellets studied in Fenno-Scandia (Mik -kola 1981). Mean weight of prey forfemales in this study was 38.7 g and formales 25.3 g, and although they weremore dramatically different in an absolutesense than the American sample, owingto smaller sample size, they did not differsignificantly (�χ2=3.938, n.s., Figure 2).Many owl stomachs (40% in Min-
nesota and Wisconsin and 30% in Fin-land) were empty or contained only hairor a few unidentified bones, but someindividuals had remarkable numbers ofprey items in their stomachs. A stomachfrom a Finnish fem ale contained 13 preyitems: 7 Common Shrew (Sorex araneus),1 Pygmy Shrew (S. minutus), 1 LeastShrew (S. min utissimus) and 2 Bank Voles(Clethrionomys glareolus). Total weight ofthese prey animals was 126 g. Anotherfemale had 7 Root Voles in the stomach.Total estimated weight of these voles was336 g, helping to explain why this femaleowl was the heaviest ever weighed in Fin-land (1900 g). The highest number ofprey in one stomach from Finland camefrom a male which had 17 items: 13Common Shrew, 1 Pyg my Shrew, 1Com mon Frog (Rana temporaria), 1 BankVole and 1 Short-tailed Vole. Total weightof this stomach content was about 250 g.There were similar individuals in theMinnesota and Wisconsin sample. Onefemale had 13 items (8 Meadow Voles, 2 Southern Red-backed Voles (Myodesgapperi), 2 Cinereous Shrews (Sorex cin -ereus), 1 Short-tailed Shrew (Blarina bre-vicauda) and 1 Star-nosed Mole (Condy-lura cristata); another female stomachcontained remains of 12 Meadow Voles,
for which the total weight was estimatedto be even 576 g. The most prey itemsrecorded in a single stomach in the NorthAmerican sample came from a male with18 items (10 Arctic Shrews (Sor ex arcti-cus), 3 Cinereous Shrews, 3 North Amer-ican Pygmy Shrews (S. hoyi), 1 SouthernRed-backed Vole and 1 Star-nosed Mole).Several male stomachs contained morethan 10 Meadow Voles.When comparing Finnish material
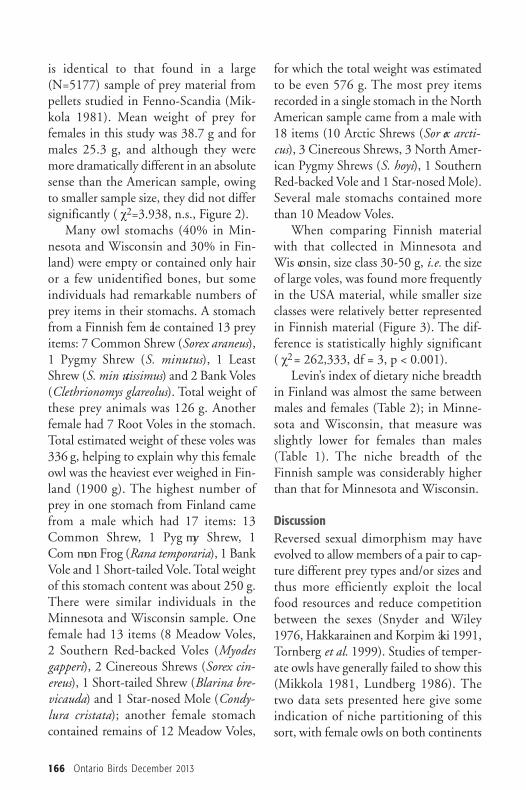
with that collected in Minnesota andWis consin, size class 30-50 g, i.e. the sizeof large voles, was found more frequentlyin the USA material, while smaller sizeclasses were relatively better representedin Finnish material (Figure 3). The dif-ference is statistically highly significant(�χ2= 262,333, df = 3, p < 0.001).Levin’s index of dietary niche breadth
in Finland was almost the same betweenmales and females (Table 2); in Minne -sota and Wisconsin, that measure wasslightly lower for females than males(Table 1). The niche breadth of theFinnish sample was considerably higherthan that for Minnesota and Wisconsin.
DiscussionReversed sexual dimorphism may haveevolved to allow members of a pair to cap-ture different prey types and/or sizes andthus more efficiently exploit the localfood resources and reduce competitionbetween the sexes (Snyder and Wiley1976, Hakkarainen and Korpim äki 1991,Tornberg et al. 1999). Studies of temper-ate owls have generally failed to show this(Mikkola 1981, Lundberg 1986). Thetwo data sets presented here give someindication of niche partitioning of thissort, with female owls on both continents
166 Ontario Birds December 2013
taking slightly larger prey and a broadervariety of prey species although the dif-ferences were only statistically significantin the Minnesota and Wisconsin sample(owing to the larger sample size). Greaterdifferences may be masked by the natureof the samples. Since we are dealing withpartially di gested stomach contents, wehave to rely on average weights of theprey items for this analysis. For most ofthe prey identified there was a range ofweights (e.g. Meadow Voles range inweight from 33 to 65 g), so there is stillthe possibility that males and femalesspecialize at either end of the range. There is some indication of a pattern
like this in the shrews in both the Euro-pean and North American samples. InMinnesota and Wisconsin, shrews 8grams and less make up 15 % of the maleprey items, but only 8.7% of the femalediet, while the larger Short-tailed Shrew(24 g) is about equally represented in thediets of both sexes. In the Finnish sample,nearly 7% of the male prey items wereshrew species weighing less than 5 grams,with only 1.1% of this size in femalestomachs, but females were taking equal
numbers of the larger Common Shrew.Whether smaller males can better justifythe energy expended on capturing smallprey, whether they may be pushed tomicrohabitats with reduced availability oflarger prey or some other explanationneeds further observation and testing. The fact that the average weight of
prey in the Minnesota and Wisconsinsample is somewhat larger than that inFinland (42 vs. 33 g) may simply reflectthe available prey base. In studies fromthe western USA, average prey size wasgreater than in either the Minnesota andWisconsin or Finnish samples. In Ore-gon, pocket gophers (Thomomys spp.)comprised one third of the prey itemsand 69% of the biomass taken by GreatGray Owls, making the average preyweight 54.4 g (Bull et al. 1989). Poc ketgophers were an even greater componentof the diet in California and Idaho, whereaverage prey size was over 80 g (Winter1986, Franklin 1987). These westernpocket gopher specialists recently havebeen described as a third subspecies, Strixnebulosa yose mi tensis (Hull et al. 2010).
Volume 31 Number 3 167
Figure 3. Proportion of prey specimens found instomachs of Great GrayOwls collected in Finlandand Minnesota and Wisconsin, USA during1929-2005. Prey specimensare categorized into weight classes.
< 15 16-30 31 - 50 < 50
Proportion in the diet
Weight classes (grams)
0.9
0.8
0.7
0.6
0.5
0.4
0.3
0.2
0.1
0
Finland
USA
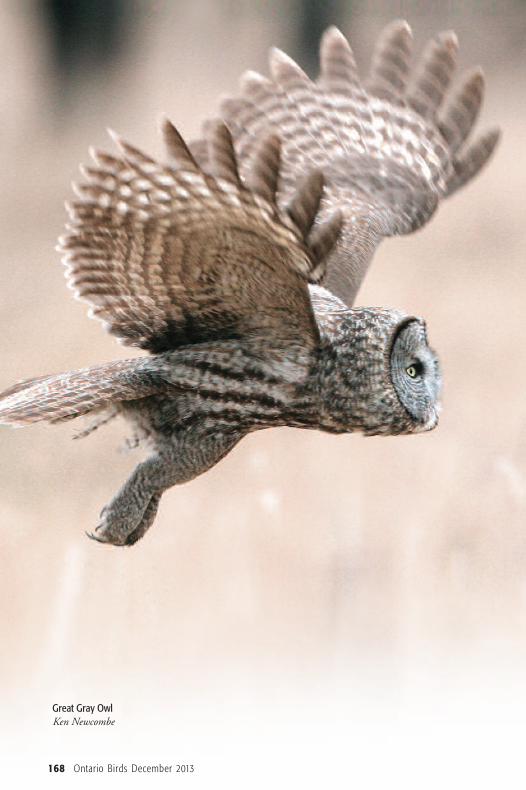
168 Ontario Birds December 2013
Great Gray OwlKen Newcombe
Volume 31 Number 3 169
The much greater niche breadth inFinland may reflect the longer durationof that study, representing samples col-lected over decades and including birdsfrom years when voles were scarce andshrews were plentiful. The samples fromMinnesota and Wisconsin represent aone-time irruption; all collected over one winter when Meadow Voles wereabundant.Owl diets in general are fairly well
known, owing to the ease of findingregurgitated pellets from known speciesand analyzing prey remains in those, butusually there is no way of determiningwhich sex produced them, so they can-not be used to address the question ofsexual differences. Snowy Owls (Bubo scandiacus) are
one of the few owl species that can besexed with some accuracy by plumage,making them a candidate for a field studyof prey partitioning. Boxall and Lein(1982) showed that wintering femaleSnowy Owls in southern Alberta con-sumed a greater diversity of prey thanmales which preyed almost exclusively(85 per cent in numbers) upon NorthAmerican Deer Mouse (Peromyscus man-iculatus) and Meadow Vole (61% and24%, respectively). By numbers, micewere also the most common prey offemales (45%) and voles next (34%), butin addition they preyed upon eleven GrayPartridges (Perdix perdix), and fourweasels (Mustela spp.). Three pellets fromfemales contained remains of White-tailed Jackrabbits (Lepus town sendii), thelargest prey taken by Snowy Owls in thatstudy. None of the pellets from malesincluded remains of any of these largerprey items.
The Boreal Owl (Aegolius funereus) isanother species with high RSD, but thereis very little evidence for dietary separa-tion between sexes (Korpimäki and Hak -karainen 2012). However, in Idaho,USA, wintering female Boreal Owls cap-tured Northern Flying Squirrels (Glau-comys sabrinus) more than males did(Hayward et al. 1993). Of twelve flyingsquirrels (body mass 140 g) found in preyremains, only one was captured by amale. Flying squirrels represented 45 percent of the female prey weight. While thesample is too small to be statistically sig-nificant, it represents another exampleamong owls where the largest prey istaken by females.The Great Gray Owl specimens used
in the current study represent a some-what serendipitous sample, but salvagedbirds such as these may provide the bestavenue to address sexual dietary differ-ences in species where internal examina-tion is the only sure way to determinegender. Salvaged specimens can provideinformation for a variety of studies; thesame USA sample served as the basis fora study on nutritional stress and bodyconditions (Graves et al. 2012).
Literature CitedAmadon, D. 1943. Bird weights as an aid intaxonomy. Wilson Bulletin 55:164-177.
Boxall, P.C. and M.R. Lein. 1982. Feedingecology of Snowy Owls (Nyctea scandiaca)wintering in Southern Alberta. Arctic36:282-290.
Brunton, D.F. and W.D. Reynolds. 1984.Winter predation on an Ermine by a GreatGray Owl. Blue Jay 42(3):171-173.
170 Ontario Birds December 2013
Bull, E.L. and J.R. Duncan. 1993. GreatGray Owl (Strix nebulosa), The Birds ofNorth America Online (A. Poole, Ed.). Ithaca: Cornell Laboratory of Ornithology;Retrieved from the Birds of North AmericaOnline: http://bna.birds.cornell.edu/bna/species/041
Bull, E.L. and M.G. Henjum. 1990. Ecology of the Great Gray Owl. UnitedStates Department of Agriculture, ForestService. Pacific Northwest Research Station.General Technical Report 265:1-39.
Bull, E.L., M.G. Henjum and R.S.Rohweder. 1989. Diet and optimal foragingof Great Gray Owls. Journal of WildlifeManagement 53:47-50.
Duncan, J.R. 1992. Influence of prey abun-dance and snow cover on Great Gray Owlbreeding dispersal. Ph.D. dissertation. University of Manitoba, Winnipeg, Manitoba. 127pp.
Earhart, C.M. and N.K. Johnson. 1970.Size dimorphism and food habits in NorthAmerican owls. Condor 72:251-264.
Franklin, A.B. 1987. Breeding biology of theGreat Gray Owl in southeastern Idaho andnorthwestern Wyoming. M.Sc. thesis. Hum-boldt State University, Arcata, California.
Graves, G.R., S.D. Newsome, D.E. Willard,D.A. Grosshuesch, W.W. Wurzel and M.L. Fogel. 2012. Nutritional stress andbody condition in the Great Gray Owl (Strixnebulosa) during winter irruptive migrations.Canadian Journal of Zoology 90:787-797.
Hakkarainen, H. and E. Korpimäki. 1991.Reversed sexual size dimorphism in Teng-malm’s owl: is small male size adaptive?Oikos 61:337-346.
Hayward, G.D., P.H. Hayward and E.O. Garton. 1993. Ecology of boreal owlsin the Northern Rocky Mountains, USA.Wildlife Monographs 124:1-59.
Hull, J.M., J.J. Keane, W.K. Savage, S.T. Godwin, J.A. Shafer, E.P. Jepsen, R. Gerhardt, C. Stermer and H.B. Ernest.2010. Range-wide genetic differentiationamong North American great gray owls(Strix nebulosa) reveals a distinct lineagerestricted to the Sierra Nevada, California.Molecular Phylogenetics and Evolution56:212-221.
Jensen, B. 1994. Suomen ja PohjolanNisäkkäät. WSOY, Porvoo. 326pp.
Korpimäki, E. and H. Hakkarainen. 2012.The Boreal Owl. Ecology, behavior and con-servation of a forest-dwelling predator. Cam-bridge University Press, Cambridge, England.359pp.
Krüger, O. 2005. The evolution of reversedsexual dimorphism in hawks, falcons andowls: a comparative study. Evolutionary Ecology 19:467-486.
O
B
Birding • Nature • Optics • Books
Steiner
636 Point Pelee Dr. Leamington ON N8H 3V4
Birding • Nature • Optics • BooksCanada’s Largest Selection of Binoculars and Scopes
New Swarovski ATX / STX Modular
Spotting Scopes
SwarovskiKowaZeissLeicaBushnellCelestronMinoxVortexPentaxNikonEagle
KOWA 88mm SCOPES ON SALE
Levins, R. 1968. Evolution in changing environments. Princeton University Press,Princeton, New Jersey. 123pp.
Lundberg, A. 1986. Adaptive advantages ofreversed sexual size dimorphism in Europeanowls. Ornis Scandinavica 17:133-140.
Marti, C.D., E. Korpimäki and F.M. Jaksic.1993. Trophic structure of raptor communi-ties: a three- continent comparison and syn-thesis. Current Ornithology 10:47-137.
Mikkola, H. 1981. Der Bartkauz Strix nebulosa. Die Neue Brehm-Bücherei 538. A. Ziemsen, Verlag, Wittenberg-Lutherstadt.124pp.
Mikkola, H. 1983. Owls of Europe. T. & A.D. Poyser, Calton, United Kingdom.397pp.
Mikkola, H. 2012. Owls of the World. A photographic guide. Christopher Helm,London, England, 512pp.
Mikkola, H. and S. Sulkava. 1970. Food of great grey owls in Fenno-Scandia. BritishBirds 62: 23-27.
Siivonen, L. 1967. Pohjolan nisäkkäät.Otava, Helsinki. 181pp.
Snyder, N.F.R. and J.W. Wiley. 1976. Sexual size dimorphism in hawks and owls ofNorth America. Ornithological Monographs 20:1-96.
Sulkava, S. and K. Huhtala. 1997. The greatgray owl (Strix nebulosa) in the changing for-est environment of Northern Europe. Journalof Raptor Research 31:151-159.
Svingen, P.H. and J.W. Lind. 2005. The2004-2005 influx of Northern Owls Part II.Loon 77(4):194-207.
Temeles, E.J. 1985. Sexual size dimorphismof bird eating hawks: the effect of prey vul-nerability. American Naturalist 125:485-499.
Tornberg, R., M. Mönkkönen and M. Pahkala. 1999. Changes in diet and mor-phology of Finnish goshawks from 1960s to1990s. Oecologia 121:369-376.
Von Haartman, L.G., O.Hilden, P. Linkola,P. Suomalainen and R. Tenovuo. 1963-72.Pohjolan Linnut Värikuvin. Otava, Helsinki.
Winter, J. 1986. Status, distribution andecology of the Great Gray Owl (Strix nebu-losa) in California. M.A. thesis. San FranciscoState University, San Francisco, California.
Heimo Mikkola, University of Eastern Finland, P.O.B. 1625, FIN-70211 Kuopio, Finland. E-mail: [email protected]
Risto Tornberg, University of Oulu, P.O.B.3000, FIN-90014, Oulu, Finland. E-mail: [email protected]
David E. Willard, Field Museum of Natural History, 1400 S Lake Shore Drive,Chicago, Illinois 60605, United States. E-mail: [email protected]
Volume 31 Number 3 171
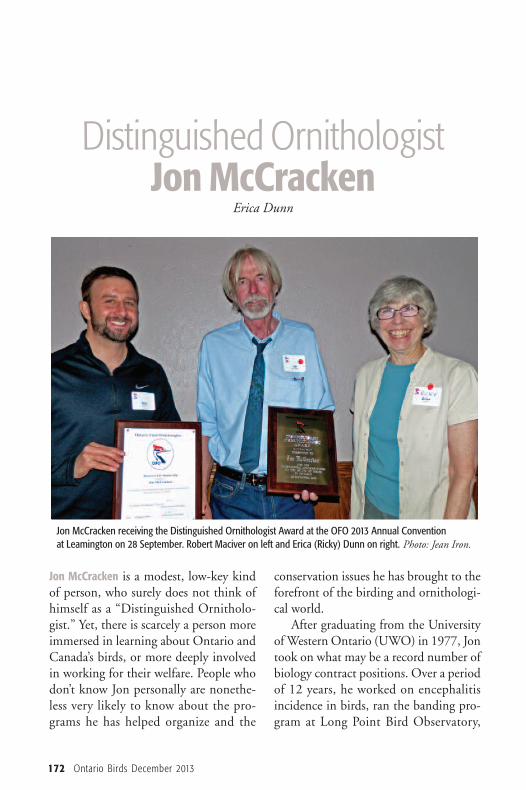
Jon McCracken is a modest, low-key kindof person, who surely does not think ofhimself as a “Distinguished Ornitholo-gist.” Yet, there is scarcely a person moreimmersed in learning about Ontario andCanada’s birds, or more deeply involvedin working for their welfare. People whodon’t know Jon personally are nonethe-less very likely to know about the pro-grams he has helped organize and the
conservation issues he has brought to theforefront of the birding and ornithologi-cal world. After graduating from the University
of Western Ontario (UWO) in 1977, Jontook on what may be a record number ofbiology contract positions. Over a periodof 12 years, he worked on encephalitisincidence in birds, ran the banding pro-gram at Long Point Bird Observatory,
172 Ontario Birds December 2013
Jon McCracken receiving the Distinguished Ornithologist Award at the OFO 2013 Annual Convention at Leamington on 28 September. Robert Maciver on left and Erica (Ricky) Dunn on right. Photo: Jean Iron.
Distinguished OrnithologistJon McCracken
Erica Dunn
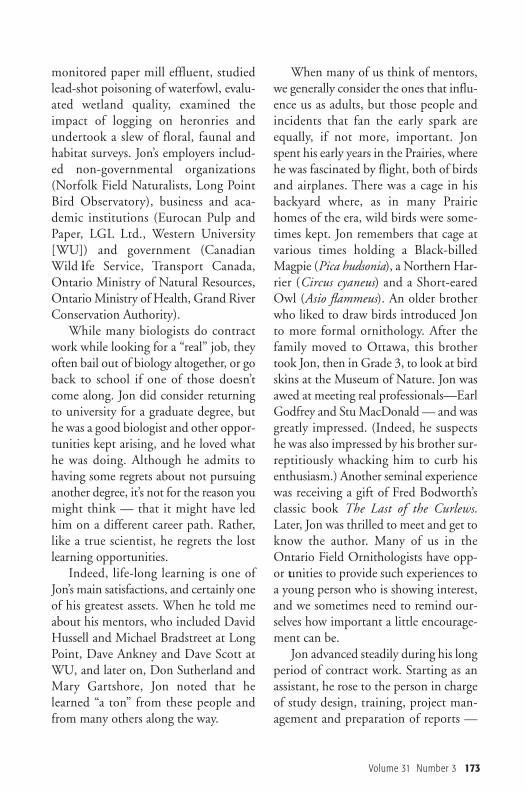
monitored paper mill effluent, studiedlead-shot poisoning of waterfowl, evalu-ated wetland quality, examined theimpact of logging on heronries andundertook a slew of floral, faunal and habitat surveys. Jon’s employers includ-ed non-governmental organizations(Norfolk Field Naturalists, Long PointBird Observatory), business and aca-demic institutions (Eurocan Pulp andPaper, LGL Ltd., Western University[WU]) and government (CanadianWild life Service, Transport Canada,Ontario Ministry of Natural Resources,Ontario Ministry of Health, Grand RiverConservation Authority). While many biologists do contract
work while looking for a “real” job, theyoften bail out of biology altogether, or goback to school if one of those doesn’tcome along. Jon did consider returningto university for a graduate degree, buthe was a good biologist and other oppor-tunities kept arising, and he loved whathe was doing. Although he admits tohaving some regrets about not pursuinganother degree, it’s not for the reason youmight think — that it might have ledhim on a different career path. Rather,like a true scientist, he regrets the lostlearning opportunities. Indeed, life-long learning is one of
Jon’s main satisfactions, and certainly oneof his greatest assets. When he told meabout his mentors, who included DavidHussell and Michael Bradstreet at LongPoint, Dave Ankney and Dave Scott atWU, and later on, Don Sutherland andMary Gartshore, Jon noted that helearned “a ton” from these people andfrom many others along the way.
When many of us think of mentors,we generally consider the ones that influ-ence us as adults, but those people andincidents that fan the early spark areequally, if not more, important. Jonspent his early years in the Prairies, wherehe was fascinated by flight, both of birdsand airplanes. There was a cage in hisbackyard where, as in many Prairiehomes of the era, wild birds were some-times kept. Jon remembers that cage atvarious times holding a Black-billedMagpie (Pica hudsonia), a Northern Har-rier (Circus cyaneus) and a Short-earedOwl (Asio flammeus). An older brotherwho liked to draw birds introduced Jonto more formal ornithology. After thefamily moved to Ottawa, this brothertook Jon, then in Grade 3, to look at birdskins at the Museum of Nature. Jon wasawed at meeting real professionals—EarlGodfrey and Stu MacDonald — and wasgreatly impressed. (Indeed, he suspectshe was also impressed by his brother sur-reptitiously whacking him to curb hisenthusiasm.) Another seminal experiencewas receiving a gift of Fred Bodworth’sclassic book The Last of the Curlews.Later, Jon was thrilled to meet and get toknow the author. Many of us in theOntario Field Ornithologists have opp -or tunities to provide such experiences toa young person who is showing interest,and we sometimes need to remind our-selves how important a little encourage-ment can be.Jon advanced steadily during his long
period of contract work. Starting as anassistant, he rose to the person in chargeof study design, training, project man-agement and preparation of reports —
Volume 31 Number 3 173
all skills he has used daily in the full-timepositions he has held at Bird StudiesCanada since 1989: first as Manager forthe Migration Monitoring Program, thenOntario Programs Manager, and nowNational Programs Manager.Jon’s career at Bird Studies Canada, as
with his earlier contract work, has beenincredibly varied. He has been responsi-ble for special surveys of loons, marshbirds, Red-shouldered Hawks (Buteo lin-eatus), nocturnal owls, certain woodpeck-ers, and programs such as migration mon-itoring, the Ontario Breeding Bird Atlas,Great Backyard Bird Count, training ofLatin American biologists, and a varietyof species-at-risk assessment and recoveryprograms. While the job at Bird StudiesCanada (BSC) is more than full time, it isfar from everything that Jon does. He isalso a val uable member of innumerablecommittees, boards and panels. His cur-riculum vitae lists 28 committees, includ-ing many species-at-risk recovery teams,the North American Banding Counciland the North American OrnithologicalAtlas Committee. Jon is also a subject edi-tor for the journal Avian Conservationand Ecology. Not even included in this list of 28 is
perhaps the most influential group withwhich Jon serves, the Bird Species Spe-cialist Subcommittee of COSEWIC (theCommittee on the Status of EndangeredWildlife in Canada). As co-chair of thissubcommittee, Jon shares the lead inidentifying candidate species for assess-ment, tendering contracts for statusreports of those candidates, evaluatingsubsequent reports and making appro -priate recommendations for officialCOSEWIC status. The work involves
many time-consuming administrativeduties, and Jon gets the job done — but Isuspect his most important contributionis clear-headed thinking about the kindsand quality of evidence needed to confi-dently assign an appropriate conservationstatus.On top of his job at BSC and his com-
mittee service to the ornithological com-munity, Jon is also a prolific writer. Whilehe has relatively few research papers pub-lished in peer-reviewed scientific journals,his bibliography of about 160 articles isreplete with technical reports, species sta-tus assessments, recovery plans, trainingmanuals and data-rich articles that raiseawareness of the informed public aboutbird study and avian conservation issues(including several in Ontario Birds). Hispublications not only reflect the greatvariety of programs and projects in whichhe has been involved (see sample below),but also demonstrate a most enviablefacility for clear communication.One might think that Jon’s adminis-
trative responsibilities, committee workand writing would be sufficient to keephim busy, but he refuses to be cut off fromdoing field work. Jon is out nearly everymorning during the field season, keepingin touch with the birds that his work isreally about.To summarize Jon’s contributions to
ornithology in Ontario and Canada,then, I would say that he is a well-round-ed birder and field man, a talented ad -min ist rator and designer of field pro-grams, an excellent writer and a hands-onconservation biologist — altogether acombination that makes him more thanworthy of the title of “DistinguishedOrnithologist.”
174 Ontario Birds December 2013

Jon’s publications since 2010 illustrate the breadth of his writing:
McCracken, J.D. 2013. The mysteriousdecline of aerial insectivores. pp. 6-9 inM. Bull (ed.), Connecticut State of the Birds:2013. The Seventh Habitat and the Declineof our Aerial Insectivores. ConnecticutAudubon Society, Fairfield, CT. 34 pp.
McCracken, J.D., R.A. Reid, R.B. Renfrew,B. Frei, J.V. Jalava, A. Cowie and A.R. Couturier. 2013. Recovery Strategy for theBobolink (Dolichonyx oryzivorus) and EasternMeadowlark (Sturnella magna) in Ontario.Ontario Recovery Strategy Series. Prepared forthe Ontario Ministry of Natural Res ources,Peterborough, Ontario. viii + 88 pp.
Environment Canada. 2011. Recovery Strategy for the Prothonotary Warbler(Protonotaria citrea) in Canada [Proposed].Species at Risk Act Recovery Strategy Series.Environment Canada, Ottawa. v + 26 pp.
McCracken, J.D. 2010. Long Point BirdObservatory and Bird Studies Canada 50th Anniversary Report: Celebrating half a century of research, conservation, and education. Bird Studies Canada, Port Rowan, ON. 82 pp.
McCracken, J.D. 2010. The plight of theProthonotary. Ontario Field Ornithologists(OFO) News 28(2):1-3.
Calvert, A.M., J. Woodcock and J.D.McCracken. 2010. Contrasting seasonal survivorship of two migratory songbirds win-tering in threatened mangrove forests. AvianConservation and Ecology 5(1): 2. [online]URL: http://www.ace-eco.org/vol5/iss1/art2/
Moore, D.J., D.V. Weseloh, J. McCrackenand C.A. Friis. 2010. Forster’s Terns breedingin Ontario: historical trends and recent sur-veys of eastern Lake St. Clair and Long Point,Lake Erie. Ontario Birds 28:2-18.
Nebel, S., A. Mills, J.D. McCracken andP.D. Taylor. 2010. Declines of aerial insecti-vores follow a geographic gradient. AvianConservation and Ecology 5(2):1. [online]URL: http://www.aceeco.org/vol5/iss2/art1/
Ontario Barn Owl Recovery Team. 2010.Recovery strategy for the Barn Owl (Tyto alba)in Ontario. Ontario Recovery Strategy Series.Prepared for the Ontario Ministry of NaturalResources, Peterborough, Ontario. vi + 31 pp.
Erica DunnEnvironment CanadaNational Wildlife Research CentreCarleton UniversityOttawa, Ontario K1A 0H3 Email: [email protected]
Volume 31 Number 3 175
176 Ontario Birds December 2013
President: Robert Maciver,91 Alderson Dr. Cambridge, Ontario N3C 0E4E-mail: [email protected]
Ontario Field Ornithologists is an organization dedi-cated to the study of birdlife in Ontario. It formed in1982 to unify the ever-growing numbers of fieldornithologists (birders/birdwatchers) across the prov - ince, and to provide a forum for the exchange ofideas and information among its members. TheOntario Field Ornitho lo gists officially oversees theactivities of the Ontario Bird Records Committee(OBRC); publishes a newsletter (OFO News) and ajournal (Ont ar io Birds); oper ates a bird sightings list-serv (ONTBIRDS), coordinated by Mark Cranford;hosts field trips throughout Ontario; and holds anAnnual Convention and Ban quet in the autumn. Cur-rent information on all of its activities is on the OFOwebsite (www.ofo.ca), coordinated by Doug Woods.Com ments or questions can be directed to OFO bye-mail ([email protected]).
All persons interested in bird study, regard less oftheir level of expertise, are invited to become mem-bers of the Ont ario Field Ornithologists. Member shiprates can be obtained from the address below. Allmem bers receive Ontario Birds and OFO News.
Please send membership enquiries to: Ontario Field Ornithol ogists, PO Box 116, Station F,Toron to, Ontario M4Y 2L4.
Editors: Chip Weseloh, 1391 Mount Pleasant Road,Toronto, Ontario M4N 2T7
Glenn Coady, 330 Crystal Beach Boulevard, Whitby, Ontario L1N 9Z7
Chris Risley, 510 Gilmour StreetPeterborough, Ontario K9H 2J9
Copy Editor: Tina Knezevic
Ornithology Consultants: Michel Gosselin,Ross James, Mark Peck
Cover Art: Barry Kent MacKay
Advertising: Claire [email protected]
Design / Production: Judie Shore
The aim of Ontario Birds is to provide a veh icle for documentation of the birds of Ont ario. We encourage the submission of fulllength articles and short notes on the status, distribution, identification, and be hav iour ofbirds in Ont ario, as well as location guides tosignificant Ont ario bird wat ching areas, book reviews, and similar material of interest on Ontario birds.
Submit material for publication by e-mailattach ment (or CD or DVD) to either: [email protected][email protected] [email protected]
Please follow the style of this issue ofOnt arioBirds. All submissions are sub ject to review andediting and may be submitted to peer reviewbeyond that of the editors. For photographicmaterial used in Ontario Birds, the copyright remains in the possession of the photographers.
ONTARIO FIELDORNITHOLOGISTS
ONTARIO BIRDS
Printing: DTP Inc., Richmond Hill, Ontario
50% recycled fibre, 25% post consumer