broadband adoption index - phoenix center for advanced legal
TRANSCRIPT

PHOENIX CENTER POLICY PAPER SERIES
Phoenix Center Policy Paper Number 36:
The Broadband Adoption Index: Improving Measurements and Comparisons of Broadband
Deployment and Adoption
T. Randolph Beard, PhD
George S. Ford, PhD
Lawrence J. Spiwak, Esq.
(July 2009)
© Phoenix Center for Advanced Legal and Economic Public Policy Studies, T. Randolph Beard, George S. Ford, and Lawrence J. Spiwak (2009).

Phoenix Center Policy Paper No. 36 The Broadband Adoption Index: Improving Measurements and Comparisons of Broadband Deployment and Adoption T. Randolph Beard, PhD. George S. Ford, PhD† Lawrence J. Spiwak, Esq.‡ (© Phoenix Center for Advanced Legal & Economic Public Policy Studies, T. Randolph Beard, George S. Ford and Lawrence J. Spiwak (2009).)
Abstract: Countries around the world are increasingly concerned as to whether the adoption of broadband technology by their respective citizens is sufficient to support economic growth and social development. Unfortunately, such concerns are often expressed in terms of where a country ranks among its peers by means of raw adoption numbers. Such raw data are often misleading and incomplete. In this PAPER, we propose a different and more policy-relevant approach to adoption measurement. We develop a value-based Broadband Adoption Index (“BAI”) that compares the actual value to society that results from the adoption of broadband technology to a target level of adoption value. This target level will vary from country to country and is a function of the social value of broadband connectivity, measured as the difference in the social benefits and the costs of broadband. The BAI is specifically designed to accommodate and include the value of different connection modalities like mobile broadband into a single index, something that merely summing the number of connections cannot do. We believe that policymakers can adopt aspects of the BAI approach immediately, with particular attention to collecting and using proper information for policy decisions.
Senior Fellow, Phoenix Center for Advanced Legal & Economic Public Policy Studies; Professor of Economics, Auburn University.
† Chief Economist, Phoenix Center for Advanced Legal & Economic Public Policy Studies.
‡ President, Phoenix Center for Advanced Legal & Economic Public Policy Studies. This paper was sponsored by the Autoridade Nacional de Comuniçacões (ANACOM), the regulatory authority of Portugal, with contributing support from the Agência Nacional de Telecomunicações (ANATEL), the regulatory authority of Brazil. The authors greatly appreciate the advice and counsel they received from ANACOM and ANATEL representatives during this process. However, the views expressed in this paper are the authors’ alone and do not represent the views of ANACOM, ANATEL, the Phoenix Center, its Adjunct Fellows, or any of its individual Editorial Advisory Board members. We are indebted to Professor Michael Stern, Senior Fellow, for his assistance in formulating the economic model presented in this paper.

2 PHOENIX CENTER POLICY PAPER [Number 36
Phoenix Center for Advanced Legal and Economic Public Policy Studies www.phoenix-center.org
TABLE OF CONTENTS:
I. Introduction ................................................................................................ 3 II. The Broadband Adoption Index .............................................................. 8
A. A Measure of Value ............................................................................ 9 B. The Broadband Adoption Index ..................................................... 13 C. Accounting for Heterogeneity ......................................................... 17 D. A Graphical Exposition .................................................................... 19
III. Numerical Simulation of the Broadband Adoption Index ................ 24 A. Setup for Benchmark Case ............................................................... 24 B. Results for Benchmark Case ............................................................ 25 C. Alternative Scenarios ........................................................................ 27
IV. Implementation Guidelines, Suggestions and Applications ............ 30 A. Econometric Implementation of the BAI ....................................... 32
1. Basic Setup ................................................................................... 33 2. Generating the Data Set ............................................................. 34 3. Estimation of the Demand System ........................................... 35 4. Calculation of the BAI ................................................................ 36 5. Subscription Targets at Different Costs ................................... 37 6. Social Premia ............................................................................... 38
B. Comparative Valuation of Broadband Connection Technologies ...................................................................................... 38
C. Simplification of the BAI and Quantity-Based Measures of Adoption ............................................................................................ 43 1. The Single Modality and Per Capita Measures of
Adoption ...................................................................................... 43 2. Two Modalities ........................................................................... 45
D. Endowments and Broadband Adoption Targets .......................... 46 V. Measurement, Multiple Modalities and Public Policy ....................... 48
A. The Model .......................................................................................... 49 B. Caveats and Discussion .................................................................... 53
VI. Policy Recommendations ....................................................................... 54 VII. Conclusion ................................................................................................ 58

Summer 2009] BROADBAND ADOPTION INDEX 3
Phoenix Center for Advanced Legal and Economic Public Policy Studies www.phoenix-center.org
I. Introduction
Policymakers around the globe regard the deployment and adoption of Internet technologies as critically important to the economic and social development of their countries.1 Perhaps rightfully so: the Internet is commonly viewed not only as a general purpose technology that can sharply reduce transaction costs in the modern economy and spur economic growth, but it also is argued to be a forum for increased political discourse, a tool for educational opportunities, and even a platform for social change. As a result, for many policymakers, promoting the deployment and adoption of Internet access technologies is an important public policy.
Given this attention to broadband Internet service—and even efforts in some countries to establish and spend funds efficiently to stimulate broadband deployment, adoption and usage—policymakers have a keen interest in measuring and benchmarking these efforts. It is therefore somewhat surprising that, in general, the current tools used to track Internet deployment and adoption worldwide are so crude. The most commonly-cited statistics on broadband adoption—broadband connections per capita—are published regularly by the Organisation of Economic Co-operation and Development (“OECD”) and the International Telecommunications Union (“ITU”).2 However, as we have discussed in prior research, this approach is inaccurate and can even be misleading, as fixed broadband connections, either at a household or business premise, are routinely the only connection in the household and, in some instances, are shared among multiple users.3 This disconnect renders per capita
1 There is a long list of papers and reports on the economic and social benefits of broadband services. See, e.g., C. Vide Costa, Factores de Adesão à Banda Larga Fixa e Implicações para as Políticas de Promoção da Sociedade de Informação, Unpublished Manuscript (2009); L. Waverman, K. Dasgupta and N. Brooks, CONNECTIVITY SCORECARD 2009 (available at: http://www.connectivityscorecard.org/images/uploads/media/TheConnectivityReport2009.pdf)
2 See OECD Broadband Portal, http://www.oecd.org/document/54/0,3343,en_2649_34225_38690102_1_1_1_1,00.html; http://www.itu.int/ITU-D/ict/index.html.
3 See, e.g., G.S. Ford, T.M. Koutsky and L.J. Spiwak, The Broadband Performance Index: A Policy-Relevant Method of Comparing Broadband Adoption Among Countries, PHOENIX CENTER POLICY
PAPER NO. 29 (July 2007)(available at: http://www.phoenix-center.org/pcpp/PCPP29Final.pdf) (“Ford, Koutsky and Spiwak (2007b)”); G.S. Ford, T.M. Koutsky, and L.J. Spiwak, The Broadband Efficiency Index: What Really Drives Broadband Adoption Across the OECD?, PHOENIX CENTER POLICY
PAPER. NO. 33 (May 2008)(hereinafter “BEI”) (available at: http://www.phoenix-center.org/pcpp/PCPP33Final.pdf); G.S. Ford, Broadband Expectations and the Convergence of Ranks, PHOENIX CENTER POLICY PERSPECTIVE NO. 08-03 (October 2008)(available at: http://www.phoenix-
(Footnote Continued. . . .)

4 PHOENIX CENTER POLICY PAPER [Number 36
Phoenix Center for Advanced Legal and Economic Public Policy Studies www.phoenix-center.org
measures conceptually defective and produces an incorrect index of relative adoption rates. Demographic and economic differences between countries make cross-country comparisons of raw, Internet penetration rates of little policy relevance, even if a penetration rate is properly constructed. Indeed, 91% of the differences in fixed broadband adoption rates in the 30 OECD member countries can be explained by reference solely to differences in income, education, population age, and other demographic factors that bear little relationship to broadband or telecommunications policy.4
More importantly, the method that the OECD currently uses to measure Internet adoption includes only fixed broadband connections and affirmatively excludes the growing class of connections based on mobile broadband technologies.5 Other connection types, such as libraries and public Internet connection centers that serve many end users, are also ignored in the OECD’s analysis. These shared methods of accessing the Internet provide considerable social value, particularly for low income families. The exceedingly narrow view of connectivity is significant because, as the ITU Secretary-General Dr. Hamadoun I. Touré recently said, “[i]n developing countries, wireless broadband technologies are increasingly viewed as the means of achieving
center.org/perspectives/Perspective08-03Final.pdf); G.S. Ford, Normalizing Broadband Connections, PHOENIX CENTER POLICY PERSPECTIVE NO. 09-01 (May 2008)(available at: http://www.phoenix-center.org/perspectives/Perspective09-01Final.pdf). Mobile connections are likewise often shared by members of a household. A recent survey by Anacom, the Portuguese regulator of communication services, indicates that about 9% of mobile connections in that country are used to serve an entire household. This data, from the survey Inquérito aos Serviços de Comunicação Elecrónicas – 2007, was provided to the authors by Anacom. For an analysis of the data, see J. Hauge, M. Jamison, and M. Marcu, Scientific Research Project Coordinated by ICP-Anacom and Anatel with a Focus on Mobile Broadband (April 30, 2009).
4 BEI, id.
5 To see the OECD’s official explination of why they do not count mobile broadband, please visit: http://www.oecd.org/faq/0,3433,en_2649_34225_41541640_1_1_1_1,00.html#41549323. The OECD data does include fixed wireless connections with speeds faster than 256kbps such as satellite, WiMAX, Local Multipoint Distribution Systems (“LMDS”), and Multichannel Multipoint Distribution Systems (“MMDS”). The data does not include end-user mobile broadband connections (such as 3G connections). See http://www.oecd.org/document/54/0,3343,en_2649_34225_38690102_1_1_1_1,00.html. However, according to recent press reports, after receiving comments at the OECD Expert Workshop on Mobile Broadband hosted by ANACOM and ANATEL in Lisbon, the OECD is currently contemplating a new methodology of including mobile broadband in further rankings. See Dugie Standeford, Impact of OECD Plan to Measure Mobile Data Connections Said Unclear, WARREN’S
WASHINGTON INTERNET DAILY (June 5, 2009).

Summer 2009] BROADBAND ADOPTION INDEX 5
Phoenix Center for Advanced Legal and Economic Public Policy Studies www.phoenix-center.org
universal access” to information and communications technologies.6 Because consumers and businesses can access and use the Internet in a number of ways, it is improper to disregard any significant connection modality, even to the point of including some accounting for dial-up access that continues to provide value to millions of subscribers worldwide (as is revealed by their willingness to pay for it). To a rural household or small business, even the most rudimentary form of Internet access may generate a significant amount of economic and social value—value that is not taken into account in any current international or intra-national “rankings” methodologies.
As the bandwidth of mobile broadband technology increases to multiple megabits per second, and as compression algorithms improve, it is increasingly probable that mobile broadband may become an important, if not the primary, method of accessing the Internet for a wide range of users. Mobile broadband is likely to be very important for users who do not own or know how to use a computer, since Internet access is also possible through smart mobile phones and other small, portable devices such as Netbooks. Mobile broadband may also be the most efficient form of connectivity to users who live in areas where wireline telephone or cable networks do not exist and are very costly to construct; or, for those who have access at work or school, or have “mobile lifestyles,” a mobile connection may better satisfy connectivity demands. Mobile broadband is always available, unlike the fixed connections widely used at the home and office. This mobility creates more opportunities for more efficient transactions and information sharing. Indeed, broadband provided over mobile networks may replace fixed connectivity for many users via embedded communications chips in laptops and wireless access cards. The impact of this mobile substitution for broadband service is already being felt in some countries. In Portugal, for example, more than half of all broadband connections are via mobile technologies, and 10% of broadband connected persons in the country use only a mobile technology.7
6 Opening Speech of ITU Secretary-General Dr. Hamadoun I. Touré, 8th ITU Global Symposium for Regulators (Mar. 11, 2008) (available at: http://www.itu.int/net/ITU-SG/speeches/2008/mar11.aspx).
7 In an Anacom report, mobile connections are listed at 2.4 million, with active connections in the quarter of 1.2 million. Fixed broadband connections summed to 1.6 million. Statistical Information, Internet Access Service, 4th Quarter 2008, Anacom Report (February 28, 2009), Tbls. 2, 3, and 4 (available at: http://www.anacom.pt/render.jsp?contentId=837483&languageId=1).

6 PHOENIX CENTER POLICY PAPER [Number 36
Phoenix Center for Advanced Legal and Economic Public Policy Studies www.phoenix-center.org
For these reasons, policymakers seeking to understand and measure the effectiveness of their Internet deployment and adoption programs clearly need a tool that does not simply “count” connections of a particular type, but which takes into account all technologies in a way that measures the value that each broadband technology offers their societies. Broadband matters to economic and social public policy because it generates value. As such, any meaningful performance index of broadband adoption should include the comparative value of various connection modalities, particularly when establishing deployment and adoption targets. In this PAPER, we provide the first such attempt, by deriving a Broadband Adoption Index (“BAI”) that considers these important ideas and accounts for heterogeneous connection modalities.
The BAI is a value-based index of broadband adoption that accounts for both the benefits and costs of adoption and deployment and which also recognizes that these benefits and costs may differ, sometimes substantially, both within and across countries. Simply stated, the BAI compares the actual value of adoption to the target, welfare-maximizing value of adoption. This welfare-maximizing target level of adoption will vary from country to country and is a function of the social value of broadband connectivity, measured as the difference in the social benefits and costs of broadband. A country then can judge its progress against this welfare-maximizing target level of adoption. The BAI is specifically designed to accommodate different connection technologies into a single index, something that merely summing the number of connections cannot do.
The BAI is intended to be used by policymakers in individual countries for performance assessment and the establishment of deployment and adoption targets.8 The index is also well-suited for policy–relevant, cross-country comparisons. Because the index is scaled to a target level of broadband adoption calculated for each country, this method of comparison is a legitimate comparative metric of performance. Each country’s respective target (or optimal) level of broadband Internet adoption will of course vary, since the costs and benefits vary, and the ideal mix of connection modalities will vary by country. In essence, the BAI compares a country’s actual adoption against that country’s ideal, welfare-maximizing broadband adoption rate, which allows one
8 For example, the American Recovery and Reinvestment Act of 2009 requires the U.S. Federal Communications Commission to develop a “national broadband plan” which shall, inter alia, “seek to ensure that all people of the United States have access to broadband capability and shall establish benchmarks for meeting that goal.” American Recovery and Reinvestment Act of 2009, Pub. L. No. 111-5, 123 Stat. 115 (2009), § 6001(k).

Summer 2009] BROADBAND ADOPTION INDEX 7
Phoenix Center for Advanced Legal and Economic Public Policy Studies www.phoenix-center.org
to compare whether, for example, Turkey is closer to reaching the stated objective than, say, Japan. Merely comparing the raw adoption rates of Turkey and Japan—two countries with markedly different population demographics, economies, and population density—provides little information relevant to broadband policy.9 But comparing the BAI of those two countries would, in fact, carry great weight in determining whether one country’s policy structure is more conducive to broadband deployment adoption than the other country’s policy structure.
Taking a BAI-oriented approach naturally should lead policymakers to set and establish particular targets for broadband adoption of various connection modalities, based on the different value that each mode presents. These country-specific targets would necessarily focus on conditions within that country. The BAI is a conceptually valid but admittedly a data-intensive concept. This is, in part, our point. The process of measuring broadband adoption in a meaningful way is not simple. However, even if a country does not today collect all of the data necessary to calculate the target level of adoption in a rigorous way, in most industrialized economies there likely is enough data to guide rough approximations of broadband targets using the principles of the index.
This PAPER is organized as follows. In Section II, we define the Broadband Adoption Index (“BAI”). We provide a general specification of the index and demonstrate how to incorporate heterogeneous modalities into a single index of adoption useable by individual countries to guide policy, yet also providing meaningful comparisons across countries or other geo-political units. A graphical exposition of the BAI is also provided to aid in comprehension.
9 In the United States, the Broadband Data Improvement Act of 2008 requires the U.S. Federal Communications Commission to compare “the extent of broadband service capability (including data transmission speeds and price for broadband service capability) in a total of 75 communities in at least 25 countries abroad for each of the data rate benchmarks for broadband service utilized by the Commission to reflect different speed tiers.” The agency also must “identify relevant similarities and differences in each community, including their market structures, the number of competitors, the number of facilities-based providers, the types of technologies deployed by such providers, the applications and services those technologies enable, the regulatory model under which broadband service capability is provided, the types of applications and services used, business and residential use of such services, and other media available to consumers.” Broadband Data Improvement Act of 2008, Pub. L. 110-385, 122 Stat. 1400 (2008), § 1303.

8 PHOENIX CENTER POLICY PAPER [Number 36
Phoenix Center for Advanced Legal and Economic Public Policy Studies www.phoenix-center.org
In Section III, we demonstrate the properties of the BAI with a numerical simulation. The simulation is based on a simple, linear model of demand and cost; it is not intended to represent a particular country or group of countries, or even real modalities. The purpose of the simulation is to shed significant light on the underlying issues of performance measurement with regard to broadband adoption.
Section IV provides policymakers with suggestions as to how to implement the BAI in practice. Complete implementation of the BAI, either for a specific country or group of countries, would require the collection of relevant market data that includes quantity, price, and cost data for each connection modality. Even without collecting such a rich set of data, policymakers can adopt aspects of the BAI approach immediately, by incorporating the underlying logic of the index in policy decisions. We believe that adopting a BAI approach—that is, generally, a focus on value rather than connection counts—would naturally lead policymakers to establish a series of targets for broadband availability and adoption for each type of connection modality and speed. The mix of those targets will vary from country to country because a technology and adoption mix that maximizes social value in Portugal is apt to be different than that of Denmark and different still for Mexico.
Section V provides a brief theoretical discussion of why consideration of all connection modalities is important when making public policy for broadband deployment and adoption. The key aspect of the BAI approach is to recognize that all methods of accessing the Internet—fixed and mobile—offer positive economic value to society as a whole. Good policy aims at maximizing social value. As such, the policymaker’s task is far more complex and subtle than increasing the number of broadband subscriptions. Not considering alternative forms of access, which is the approach the OECD takes today, can render a perverse assessment of a country’s performance and lead to affirmatively less than optimal public policy decisions.
II. The Broadband Adoption Index
This PAPER provides an economically-meaningful index of broadband adoption by comparing actual adoption to the socially optimal level of adoption. The index is intended to help policymakers establish sensible policy targets for broadband deployment and adoption and to help establish measurement criteria to assess the efficacy of various broadband programs. Such an index could be used by a single government to evaluate its own performance with respect to its choices of adoption targets. If sufficient data were collected, the index may be used for comparisons among OECD member states, the European Union, other

Summer 2009] BROADBAND ADOPTION INDEX 9
Phoenix Center for Advanced Legal and Economic Public Policy Studies www.phoenix-center.org
super-national organizations, or even among the political subdivisions of individual countries.
The approach we take is unique because it focuses upon the value that subscribers (both businesses and consumers) place upon broadband adoption and not only the number of connections. Simply counting broadband Internet connections—the technique currently used by the OECD and ITU—is an insufficient gauge of the importance of broadband to societal well-being. The social value of such connections, not the sheer number of them, is what makes the deployment and adoption of broadband interesting from a policy standpoint. Only by measuring the value that subscribers and society as a whole place upon a broadband Internet subscription and usage can one begin to consider whether a society is realizing the full economic, educational, and social potential that Internet technology offers. Incorporating value into broadband measurement is essential when combining the counts of heterogeneous modalities—such as mobile and fixed broadband— into a single adoption index.
Our approach is largely consistent with the recent trend to increase the sophistication of the analysis of broadband technology. A recent study by Leonard Waverman, Kylan Dasgupta, and Nicholas Brooks, entitled CONNECTIVITY SCORECARD 2009, considers broadband not as an end, but as an input of production for innovation-driven economies.10 As such, broadband is one of many complementary inputs of products, all of which must be optimized in order to maximize the economic potential of an economy. While broadband connectivity is an important factor in the Scorecard, it is by no means the sole factor, and it is by no means the dominant factor. The study is one of a few recent reports that properly considers broadband as one of many important factors contributing to economic development and growth. From the economist’s perspective, success must be measured across all contributing factors, not just one.11
A. A Measure of Value
What is the value of broadband to a society? Does it vary by user, connection speed or method of access? These are the questions that are often asked but
10 Waverman, et al., supra n. 1.
11 Ignoring the level of complementary infrastructures to broadband technology may lead to highly perverse conclusions. Doing so is akin, for example, to comparing the capital-labor ratios of different economies without considering differences in the wage rates.

10 PHOENIX CENTER POLICY PAPER [Number 36
Phoenix Center for Advanced Legal and Economic Public Policy Studies www.phoenix-center.org
nearly always ignored in existing attempts to measure where a country “ranks” among its peers. Stated simply, merely counting broadband connections or penetration, without regard to any consideration of value, assumes that all types of broadband connections are equal and that all societies are equal and identical in how they value Internet access by speed and connection mode; that all users of broadband place equal value upon that connection and all such connections can be produced at equal cost. None of these assumptions are legitimate. Consequently, applying them across the board does not provide a policymaker with the ability to judge whether society is working toward the maximum value it can from broadband technologies. Rather than count connections, a policy-relevant index requires that broadband adoption targets be established by reference to the value that each type of broadband connection modality provides society.
We measure value as follows: If the average value of a connection is v, and there are q connections, then the total value of broadband to a society is simply v·q.12 This value is based on the benefits from consumption less the costs of production. If w is the average end user benefit (i.e., willingness to pay), and c the average incremental cost of production, then the total value of broadband service is simply (w - c)q.13 Many claim broadband has benefits outside those realized by private parties, and these spillovers, or social premia, are easily incorporated into the value calculation.14 We use the term social premia to abstract from the rigid economic concept of externalities.15 Using social premia
12 If the average value of a connection is $100, and there are 100 connections, the total value is $10,000.
13 This total value will be shared among producers and consumers (i.e., producer and consumer surplus). Welfare calculations such as these are based on marginal or incremental costs.
14 These premia include productivity growth, reductions in transactions costs, improvements in market organizations, improved social and political discourse, more efficient education, and so forth. See, e.g., A Framework for Evaluating the Value of Next Generation Networks, Broadband Stakeholder Group (June 2008)(available at: http://www.broadbanduk.org/component/option,com_docman/task,doc_view/gid,1009/Itemid,63); G. Ford, T. Koutsky, and L. Spiwak, The Welfare Impacts of Broadband Network Management: Can Broadband Providers Be Trusted?, PHOENIX CENTER POLICY PAPER NO. 32 (March 2008)(available at: http://www.phoenix-center.org/pcpp/PCPP32Final.pdf); R. Atkinson, The Case for a National Broadband Policy, Information Technology & Innovation Foundation (June 15, 2007)(available at: http://www.itif.org/files/CaseForNationalBroadbandPolicy.pdf).
15 Many of the claimed “externality” benefits of broadband do not, in fact, satisfy the economic definition of “externality.” See, generally, S. Liebowitz and S. Margolis, Network Externalities (Effects), THE NEW PALGRAVE'S DICTIONARY OF ECONOMICS AND THE LAW (1998) (“Network effects should not properly be called network externalities unless the participants in the
(Footnote Continued. . . .)
Summer 2009] BROADBAND ADOPTION INDEX 11
Phoenix Center for Advanced Legal and Economic Public Policy Studies www.phoenix-center.org
allows us to incorporate social value generally without necessarily satisfying the economic criterion of externality.16 With the average social premia equal to e, social value is just (w - c + e)q.17 This latter formulation of value is all inclusive and represents the full social value of broadband connections at some point in time, including the social premia commonly alleged to exist.
The cost of providing a broadband connection differs across users, largely due to the geographic location of the user—i.e., it typically costs more to serve a rural customer than an urban one due to loop lengths, population density, and the lumpiness of investments. Areas without any existing infrastructure are more costly to serve since the entire cost of the network is incremental (as opposed to network upgrades). Likewise, the benefits from connectivity can vary considerably across users. Some benefit from broadband highly, some not so much, and some not at all.18 Even the social premia can vary considerably
market fail to internalize these effects. After all, it would not be useful to have the term ‘externality’ mean something different in this literature than it does in the rest of economics. Unfortunately, the term externality has been used somewhat carelessly in this literature. Although the individual consumers of a product are not likely to internalize the effect of their joining a network on other members of a network, the owner of a network may very well internalize such effects.”)(available at: http://wwwpub.utdallas.edu/~liebowit/palgrave/network.html); W. Baumol and W. Oates, THE THEORY OF ENVIRONMENTAL POLICY (1988), chs. 4 and 6; S. Liebowitz and S. Margolis, Are Network Externalities a New Source of Market Failure, 17 RESEARCH IN LAW AND ECONOMICS 1-22 (1995); D. Chou, and O. Shy, Network Effects Without Network Externalities, 8 INTERNATIONAL
JOURNAL OF INDUSTRIAL ORGANIZATION 259-270 (1990).
16 In some cases, market value is difficult or impossible to observe, particularly in the case of government services. As an example of social premia, there may be significant cost savings in receiving healthcare online rather than travelling to a hospital. In some cases, lives may be saved by such technology, invoking such concepts as the “statistical value of life.” The court systems also save significant funds by using video arraignments, which eliminates the cost and risk of transporting prisoners. These savings may not be revealed in market transactions, but are increases in social value.
17 Baumol and Oates, supra n. 15, at ch. 4 and 6; see also R. Ekelund and R. Tollison, PRIVATE
MARKETS AND PUBLIC CHOICE (2000), 441-7.
18 Survey evidence consistently shows that a non-trivial percentage of populations have no interest in broadband service. See, e.g., J. Horrigan, Obama’s Online Opportunities II, Pew Internet & American Life Project (Jan. 2009), 2 (adding “Usability” and “Relevance”)(available at: http://www.pewinternet.org/pdfs/PIP_Broadband%20Barriers.pdf). A person’s education, Age, and other factors likewise affects the value of broadband. See, e.g., Ford, Koutsky and Spiwak (2008), supra n. 3; see also G.S. Ford, T.M. Koutsky, and L.J. Spiwak, The Demographic and Economic Drivers of Broadband Adoption in the United States, PHOENIX CENTER POLICY PAPER NO. 31 (November 2007)(available at: http://www.phoenix-center.org/pcpp/PCPP31Final.pdf) (“Ford, Koutsky and Spiwak (2007a)”); D.J. Aron and D.E. Burnstein, Broadband Adoption in the United States: An Empirical Analysis (2003) (available at: http://ssrn.com/abstract=386100); M.D. Chinn and R.W.
(Footnote Continued. . . .)

12 PHOENIX CENTER POLICY PAPER [Number 36
Phoenix Center for Advanced Legal and Economic Public Policy Studies www.phoenix-center.org
across users, with some broadband use focused on educational purposes (with presumably high social premia) but some merely on entertainment (with little to no social premia).19
Plainly, with costs and benefits varying, sometimes substantially, it follows that the social value of connections can likewise vary substantially. Extending our notation to account for this fact, we can say that for some individual connection n, of which there are N total, the value of connection n is (wn - cn + en). In this way, each connection can have a unique value whether low, high, or in between. The social value of broadband service, as before, is simply the sum of all these individual values across all N connections.20 Given this basic conceptual setup, it is easy to see that the value of broadband to society depends on how much of it is consumed (the q) and who is doing the consuming (the vn = wn - cn + en).
Policymakers are expected to be interested in maximizing the total value to their countries that broadband technology service offers. The success or failure of broadband policy, and indeed technology policy in general, should be judged by reference to whether social value is maximized. It follows, then, that an
Fairlie, The Determinants of the Global Digital Divide: A Cross-Country Analysis of Computer and Internet Penetration, University of Wisconsin, Department of Economics, Working Paper (2004); H. Gruber and M. Denni, The Diffusion of Broadband Telecommunications: The Role of Competition (2005) (available at: http://ssrn.com/abstract=829504); J. Horrigan, Pew Internet Project Data Memo (April 2004)(available at http://www.pewinternet.org/pdfs/PIP_Broadband04.DataMemo.pdf); S. Lee and M. I. Marcu, An Empirical Analysis of Fixed and Mobile Broadband Diffusion, University of Florida, Department of Economics, PURC Working Paper (2007) (available at: http://www.cba.ufl.edu/purc/purcdocs/papers/0707_Lee_Fixed_and_Mobile.pdf); J.E. Prieger, The Supply Side Of The Digital Divide: Is There Equal Availability In The Broadband Internet Access Market? 41(2) ECONOMIC INQUIRY 346-63 (2003); S. Wallsten, Broadband and Unbundling Regulations in OECD Countries, AEI-BROOKINGS JOINT CENTER WORKING PAPER NO. 06-16 (June 2006) (available at: http://papers.ssrn.com/sol3/papers.cfm?abstract_id=906865).
19 The social benefits of high-definition television delivered over the Internet are presumably entirely private and, as such, do not, as a matter of standard economic theory, warrant government intervention.
20 If we divide this total value by N, then we have the average value per connection. It may be that the value of broadband rises with more subscriptions (the standard form of the “network externality”). Liebowitz and Margolis (1998), supra n. 15. At this point, however, such effect is likely to be trivially small given the existing level of worldwide adoption. At the end of 2008, there were approximately 410 million broadband connections worldwide, indicating that broadband is not in its infancy and exposing weakness in the network externality logic. F. Vanier, World Broadband Statistics: Q4 2008, Point-Topic Ltd. (March 2009).

Summer 2009] BROADBAND ADOPTION INDEX 13
Phoenix Center for Advanced Legal and Economic Public Policy Studies www.phoenix-center.org
appropriate way to measure whether a country’s broadband policy is effective would be to measure or benchmark that country’s actual, realized social value from broadband relative to its maximum social value.
With access to sufficient data, we can generate an index which makes this comparison and measures the degree to which a country is achieving the goal of maximizing the social value of broadband deployment and adoption. Because the social value of different modes of broadband access are different and will vary among societies, such an index would provide a meaningful method of evaluating the evolution of broadband within and across countries by allowing for country-specific targets of adoption.
B. The Broadband Adoption Index
Stated simply, the BAI measures the actual value that a society is currently deriving from broadband against the value-maximizing target level of broadband adoption. By placing reference to value, the index can incorporate every form of network access technology (or modality) in a consistent manner and is both economically meaningful and policy relevant.
Algebraically, the BAI takes this general form:
ValueTarget time at ValueActual t
BAIt , (1)
where t is the time period at which the actual value is measured. Given a single connection modality, if there are qt total connections at time t, the BAI at t can be written as
**qvqv
BAI ttt , (2)
where tv equals the average value of a connection at time t. Equation (2) is a highly general specification of the BAI. The actual value is simply tv ·qt, where
tv is the average value at time t, and qt is the quantity at time t. We do not generally expect either tv or qt to remain constant over time, at least until the target value is reached. We can write the values at the social optimum as v*q*, where v* is the average value and q* is total quantity at the welfare maximum. These optimal values coincide with the level of adoption that maximizes social welfare. Since broadband is likely to be deployed to, and purchased first by, those who value it the most, we generally expect that tv > v* as long as qt < q*. Further, prices for both service and complementary equipment fall over time,
14 PHOENIX CENTER POLICY PAPER [Number 36
Phoenix Center for Advanced Legal and Economic Public Policy Studies www.phoenix-center.org
implying a diminishing average valuation of the service over q. This suggests that the first connections will have higher relative value than later connections, when more marginal users join the network. At the optimum, and probably only at the maximum, tv = v*.
We can and do make the BAI it less general later in the text in order to provide deeper insight into the measurement of performance with regard to broadband adoption, particularly in the presence of multiple connection technologies or modalities. But, there are a number of properties of the index that are worth discussing at this point.
First, by design, the index has a theoretical maximum value of 1.0, where the actual value equals the maximum valuation of broadband connections.21 Unlike per capita normalizations, the index is scaled in a manner that allows for proper cross-country comparisons. Per capita measures are not identically scaled across countries, due to differences in household size and business portfolio (as discussed next).22
Second, by having a common scale in the numerator and denominator (i.e., value weighted quantities), the index can be used to evaluate the relative performance both within and across geo-political units. Despite the obvious desirability of proper scaling, the most commonly used measure of broadband adoption today—fixed connections divided by population, as published semi-annually by the OECD—does not possess this trait. Population is not a “target” for connection counts in any meaningful sense.23 Fixed connections, for example, are shared among many persons within a household and business, and this share rate varies by country.24 The scaling defect of per capita measures is exhibited plainly by the telephones per capita statistics released by the OECD. In the mid-1990’s, the telephone was available and purchased by near everyone in the more
21 We cannot say that the index has a minimal value of 0.0, however, since the social value of some connections may be negative (cn > wn + en).
22 See Ford, Koutsky and Spiwak (2007b), supra n. 17, at Table 2 (discussing the “Broadband Nirvana”).
23 In its recent analysis of these statistics, the ITU makes a similar observation. See ITU, MEASURING THE INFORMATION ECONOMY: THE ICT DEVELOPMENT INDEX (2009) at 17 (arbitrarily setting the “ideal” value of connections per-capita at 60).
24 The share rate for mobile connections is also likely to vary by country. To date, mobile connections are not counted by the OECD.

Summer 2009] BROADBAND ADOPTION INDEX 15
Phoenix Center for Advanced Legal and Economic Public Policy Studies www.phoenix-center.org
advanced economies, yet for none of the countries did the index approach 1.0.25 In the United States, where billions are spent annually to ensure ubiquitous telephone service at affordable rates, the ratio of telephone connections to population was only about 0.49.26 In Sweden, the same ratio was about 0.69. While telephones per capita were much higher in Sweden than in the U.S., the adoption rate of telephone service by households and businesses was not materially different.27 As such, the per capita normalization provides no guidance for establishing a target adoption rate (that is, 1.0 is not a meaningful target), and indicates differences where none exists (or may mask differences that do exist).
A third point of interest is that under the assumption that tv = v* (which is likely an invalid assumption), the BAI devolves into a quantity-based index since the v can be factored out (qt/q*). But, unlike the per capita approach, the target of the BAI is scaled to match that of the numerator, and thus provides a legitimate index of performance. A country with a BAI of 0.33 has a lower performance than a country with a BAI of 0.50. In the per-capita measure of adoption, this ranking is not possible (at least not legitimately, though it is often done, including by the OECD). For example, if all homes in both Portugal (with three persons per home on average) and Sweden (with two persons per home on average) had broadband connections, then the per capita connection rate in Portugal is 0.33 and in Sweden 0.50 (ignoring business connections). Thus, the per capita approach, as adopted by the OECD, indicates a difference where there is no difference at all.
The defect in the per capita normalization of connections is illustrated in Figure 1. For the figure, assume we are counting only fixed connections for households (no business lines). Connections per capita are measured along the horizontal axis, whereas actual penetration of the potential market—households by assumption—is measured along the vertical axis. Consider the case of
25 OECD COMMUNICATIONS OUTLOOK 2007, Ch. 4 (2007).
26 See, e.g., United States Federal Communications Commission, “FCC Consumer Facts: The FCC’s Universal Service Support Mechanisms,” (available at: http://www.fcc.gov/cgb/consumerfacts/universalservice.html); United States Federal Communications Commission, DECEMBER 2008 MONITORING REPORT (Dec. 2008)(available at: http://www.fcc.gov/wcb/iatd/monitor.html); M. Mueller, UNIVERSAL SERVICE: COMPETITION, INTERCONNECTION AND MONOPOLY IN THE MAKING OF THE AMERICAN TELEPHONE SYSTEM (1998).
27 Some of this difference can be attributed to differences in household size (U.S. has about 2.7 people per home, where Sweden about a little over 2.0 per home).

16 PHOENIX CENTER POLICY PAPER [Number 36
Phoenix Center for Advanced Legal and Economic Public Policy Studies www.phoenix-center.org
Country A with an average of about three persons per home and Country B with an average of two persons per home. If all homes in both countries had broadband access—a Broadband Nirvana—then the per capita subscription rate for Country A is 0.33 and for Country B is 0.50. In the figure, the line labeled a-b represents the penetration relationship for Country A whereas the line labeled a-c represents Country B. Note first that the lines a-b and a-c are very different from the line a-d, the latter being the penetration relationship envisioned by the per capita normalization. Even at maximum subscription for each country, the penetration rates are well below 1.0 in per capita terms. Further, even though both countries are at maximum subscription, they have different per capita subscription rates.
Also consider the case where Country A had complete adoption of broadband, but Country B had only about 70% household adoption. While it is clear that Country A is a better performer with respect to adoption, Country B’s per capita subscription rate (0.35 at 70% adoption) would exceed that of Country A. There is, then, a substantial range of per capita subscription rates for which we are misled by the per-capita rankings about the relative performance of these two countries. The scope of the error is marked in the figure as the dark line labeled e-c, assuming a maximum subscription rate for Country A. This deception in the rankings is possible across the entire range of adoption rates (for expositional reasons alone we assume maximum penetration). In fact, in the figure it is easy to see that for all positive and equal market penetrations for the two countries (e.g., point z), the per-capita rates are different. For these two
Figure 1. Per Capita Normalization and the Range of Deception
1.0
d
q/pop 0.33 0.50 a
b c Market Penetr.
e Error in Rankings
z
Summer 2009] BROADBAND ADOPTION INDEX 17
Phoenix Center for Advanced Legal and Economic Public Policy Studies www.phoenix-center.org
countries, the relative per-capita subscription rates never equal the relative actual market penetration rates.
C. Accounting for Heterogeneity
In our view, the principal benefit of the BAI is the fact that it can incorporate every form of network access technology even though those methods may present different quality and value to consumers and society. There are many modalities by which to access the Internet—fiber, copper, digital subscriber line (“DSL”), cable modem, broadband over powerline, WiFi, WiMax, 3G wireless, dial-up access, and so forth. Heterogeneous modalities are not problematic in the BAI framework because value is the standard of measurement, not connections. There are, in essence, many sources of value, not many different connection technologies.
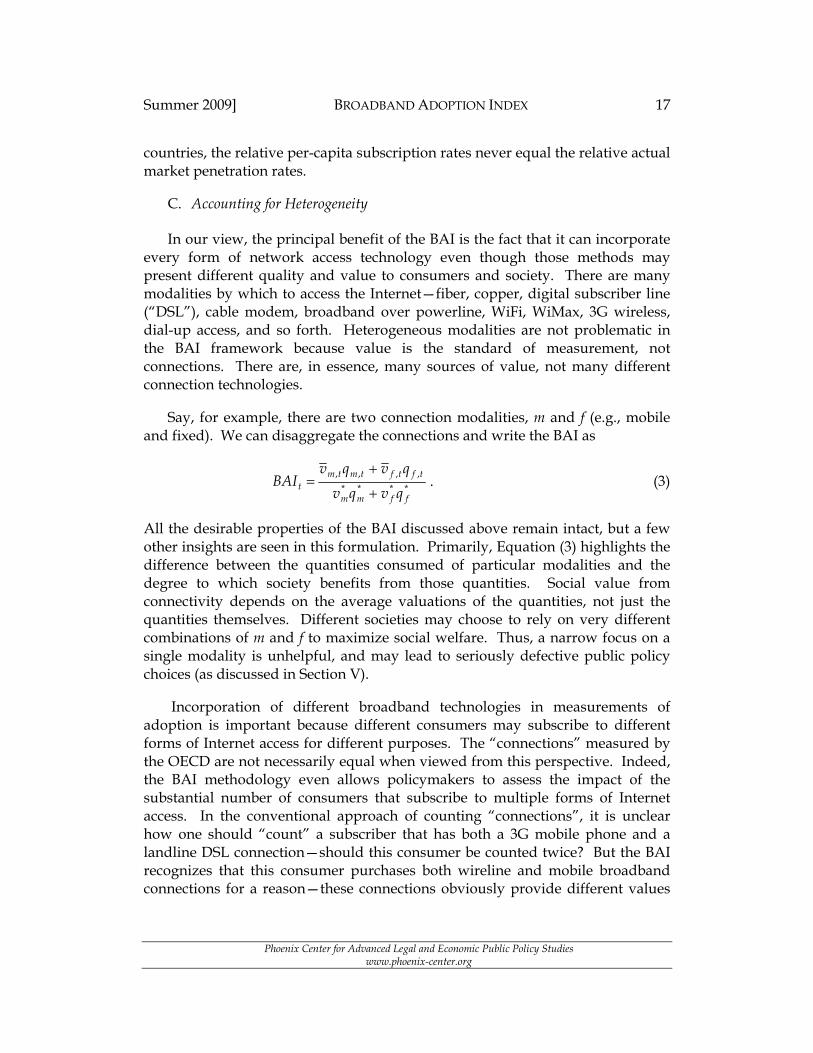
Say, for example, there are two connection modalities, m and f (e.g., mobile and fixed). We can disaggregate the connections and write the BAI as
****
,,,,
ffmm
tftftmtmt qvqv
qvqvBAI
. (3)
All the desirable properties of the BAI discussed above remain intact, but a few other insights are seen in this formulation. Primarily, Equation (3) highlights the difference between the quantities consumed of particular modalities and the degree to which society benefits from those quantities. Social value from connectivity depends on the average valuations of the quantities, not just the quantities themselves. Different societies may choose to rely on very different combinations of m and f to maximize social welfare. Thus, a narrow focus on a single modality is unhelpful, and may lead to seriously defective public policy choices (as discussed in Section V).
Incorporation of different broadband technologies in measurements of adoption is important because different consumers may subscribe to different forms of Internet access for different purposes. The “connections” measured by the OECD are not necessarily equal when viewed from this perspective. Indeed, the BAI methodology even allows policymakers to assess the impact of the substantial number of consumers that subscribe to multiple forms of Internet access. In the conventional approach of counting “connections”, it is unclear how one should “count” a subscriber that has both a 3G mobile phone and a landline DSL connection—should this consumer be counted twice? But the BAI recognizes that this consumer purchases both wireline and mobile broadband connections for a reason—these connections obviously provide different values

18 PHOENIX CENTER POLICY PAPER [Number 36
Phoenix Center for Advanced Legal and Economic Public Policy Studies www.phoenix-center.org
to that consumer, and that value deserves to be measured and evaluated. Unlike the case of connection counts, when welfare serves as the metric for the evaluation of broadband adoption, the problems with adding heterogeneous modalities and multiple modality consumption by a single customer completely disappear. The BAI can be used correctly and without ambiguity.
To see this, suppose in fact that some portion of consumers use two types of broadband modalities (e.g., fixed and mobile). This pattern of consumption generates value for the consumers (and, by implication, for society) in precisely the same manner as the case where this overlap does not occur, with this single modification: the demands for the two types of services being purchased and evaluated are interdependent in the former case. In contrast, if one were to utilize a traditional connection-count method, then the difficult question of how to combine the two sorts of broadband service usages cannot be avoided, and the methodology gives no useful answer. In a sense, one is adding “apples and oranges” in the connection approach. From the welfare point-of-view, however, there are not many modalities, there are merely many ways in which consumers can obtain the “same good,” that is surplus (or value). In the market, the proportions in which the broadband services will be combined, and the precise subset of customers who will buy both, just one or the other, or neither, are precisely equal to those values which utility-maximizing consumers would choose given the prices, and that is reflected correctly in the demand curves for the products and, consequently, in the formulation of the BAI.
The welfare-based approach also allows one to incorporate cost differences across countries. In some less developed countries, for example, wireless and mobile technologies are being deployed rather than fixed wire networks.28 In the absence of a legacy fixed network, the entire construction cost of the fixed line network is incremental, making it very expensive to deploy such networks relative to the value it produces. Wireless networks, which are often cheaper and more scalable, provide more “bang for the buck,” or, in our terminology, provide for a higher social value from broadband connectivity.
While most policy discussions often focus only on the benefits of broadband technology, perhaps more relevant is the relationship between benefits and costs of each connection mode. Even if modality f provides higher end user benefits, if it is also very costly relative to m, then society may be better off with more of modality m and less of f. It is the net value that matters and which policymakers
28 See supra n. 6 and accompanying text.

Summer 2009] BROADBAND ADOPTION INDEX 19
Phoenix Center for Advanced Legal and Economic Public Policy Studies www.phoenix-center.org
should seek to maximize. In other words, in theory, fiber optic networks may be the best available technology, but deployment of fiber to many households may be excessively costly. At some point, social policy should switch to support potentially less-valuable but less costly alternatives. For example, say a fiber connection renders 100 units in private benefits and premia but a DSL connection only provides 70 units of benefit. From a benefit perspective alone, the fiber is preferred. However, if the fiber connection costs 60 units to produce and the DSL connection only costs 20 units, then the net social gain from DSL (50 units) is larger than that of fiber (40 units). In this setting, good public policy chooses the DSL solution. Of course, these numbers will vary widely across geo-political units and even end users.
It is also important to recognize that the uses to which certain technologies may be put vary. Mobile broadband, for instance, does not necessarily require the user to own or even know how to use a computer. In this case, the value of that technology may be higher for wide swatches of the population than fixed, fiber optic connections, even though the connection speed may be lower. At the same time, fixed connections are typically shared, among the members of a household or employees of a business. Mobile connections, on the other hand, are often unique to an individual (through their wireless handset). As a result, a fixed connection may be viewed as more valuable than a mobile connection because it services more users. On the other hand, a mobile connection provides Internet service on the move, and this flexibility has proven highly valuable to end users as demonstrated by the prices paid for the service and the growth in its consumption. In many cases, mobile connections can be shared via 3G dongles or other technologies, as is common, for example, in Portugal.29
As a result, each society attempting to maximize net social value of broadband is going to face an optimal mix of technologies that depend on a number of factors—a mix centered not only on the nature and scope of high-cost areas but also based on demographics such as income, education, and computer ownership. Generalizations across countries are not advised if policy evaluation is the task.
D. A Graphical Exposition
Figure 2 illustrates this concept of social value—as defined here—in a graphical format. The downward sloping curve in the figure labeled w
29 Supra n. 3.

20 PHOENIX CENTER POLICY PAPER [Number 36
Phoenix Center for Advanced Legal and Economic Public Policy Studies www.phoenix-center.org
represents the willingness to pay by end users, and is akin to the standard demand curve of economic analysis. The horizontal line labeled c is the incremental cost of production. We assume for illustrative purposes that incremental costs are constant across all connection quantities q. The social premia is e and positive. A social premia can be included in the analysis either as an increase in willingness to pay (an upward shift in the w curve) or equivalently as a reduction in the incremental cost. Without loss of generality (in the linear framework), we choose the latter, shifting down the cost curve by the social premia. In the value calculation, the wn term is indicated by the line segment between points a and d. Incremental costs, c, are indicated by the line segment h and j, and the social premia, e, by the line segment h to i. The social value of connection n is the segment g to i.
Absent the social premia, the socially optimal level of broadband connectivity is q’, at the intersection of the end user willingness to pay, w, and the incremental cost of production, c. The social value of connection qn is wn - c (the line segment g to h). This outcome is comparable to that of the perfectly competitive equilibrium in the absence of social premia (e). Notably, as long as there is a positive social cost of production, the optimal quantity is less than the maximum quantity (qw=0), which we assume here occurs at a “price” of zero.30 With a positive social premia of size e, the incremental cost curve shifts down from c to
30 There may be end users who have negative valuations for broadband connectivity, so society would have to compensate them to subscribe to service. We ignore that possibility here.
Figure 2. Social Value with Social Premia
wn : segment g.j
q’ q* qw=0
c
w c - e
q qn
vn = wn - cn + en
cn : segment h.j
en : segment h.i
g
h
i
j

Summer 2009] BROADBAND ADOPTION INDEX 21
Phoenix Center for Advanced Legal and Economic Public Policy Studies www.phoenix-center.org
c - e. As expected, the presence of a social premia increases the optimal quantity from the privately optimal quantity q’, to the socially optimal quantity q*. The social value of the nth connection rises by the amount e, and is now vn = wn - cn + en. If costs are zero, then the optimal quantity is qw=0 (the maximum quantity without negative valuations).
Figure 3 illustrates the logic of the BAI assuming two connection modalities, m and f. In Panel A, we have modality m with willingness to pay wm and social cost cm, and social premia em. The optimal quantity of modality m is qm*, and at time t, the quantity consumed is qm,t. In Panel B, we have modality f, with qf*, and at time t, the quantity consumed is qf,t. Neither the cost nor the benefits of the two modalities are equal, and there is no reason to practically believe they ever would be. At time t, the social value of modality m is equal to the trapezoid area A in Panel A, which is the gross end user benefit of areas A + C less the cost of production C. For modality f, the social value is the area labeled G in Panel B. At the social optimal, the social value of modality m is A + B, and for modality f is G + H. Since both modalities have positive social costs, consuming the maximum quantities ( 00 , w
fwm qq ) is not socially desirable. At the maximum
quantities, total social value for modality m is (A + B - F) which is less than the optimal (A + B), and the social value for modality f is (G + H - L) which is less than (G + H). The quantity based measures of broadband adoption used today (by the OECD, for example) implicitly assume that maximal consumption is the goal, which is plainly unreasonable when costs are positive (which they undoubtedly are).

22 PHOENIX CENTER POLICY PAPER [Number 36
Phoenix Center for Advanced Legal and Economic Public Policy Studies www.phoenix-center.org
At time t, the percentage of the total optimal social value available from modality m already obtained is A/(A + B), and for modality f is G/(G + H). As value based measured, we can simply add the two together to create an adoption index across both modalities. We can add the two because we are adding values, not connections. At time t, the adoption index suggested by Equation (3) is simply (A + G)/(A + B + G + H), or the actual value of connections at time t divided by the target value. Matching Figure 3 to Equation (3) is accomplished by noting that tmtm qv ,, /A , tftf qv ,, /G , ** /B)A( mm qv and ** /H)G( ff qv .
We observed earlier that the actual average valuation of a connection will typically be larger than the average valuation at the optimal quantity q*. In Figure 4, we illustrate why this is true, at least in a simple setting. The graph in Figure 4 is similar to those above where we have a downward sloping w curve and constant social cost. Assume, for expositional convenience, that the highest valued users purchase the service first. We will evaluate the average value of a connection at two quantities, q” and q*. At quantity q”, we have an average value of v”, which in the figure is equal to the value (a + b)/2. In other words, the average value is equal to the average of the intercept of the demand curve and the marginal willingness to pay at q”. At the optimum, the average valuation v* is equal to the average of the intercept of the demand curve and the marginal
Figure 3. Social Value with Heterogeneous Modalities
qm* qmw=0
wm
cm - em
qm qm,t
Panel A. Modality m Panel B. Modality f
F
B A
qf,t D E J I
K C
qf* qfw=0
G
H
wf
L cf - ef
qf

Summer 2009] BROADBAND ADOPTION INDEX 23
Phoenix Center for Advanced Legal and Economic Public Policy Studies www.phoenix-center.org
willingness to pay at the optimal, which by definition is the social incremental cost c (which may include e).31
In reality, it may not be that the highest valued users subscribe earliest in the strict sense considered here. Nevertheless, there are many reasons to suspect that the mix of subscribers contains, on average, higher valued users than the mix at the later stages of adoption.32 First, rational network providers will deploy the service first where profits are expected to be highest, such as when demand is high or costs are low. High-cost, and thus lower relative value (ceteris paribus), rural customers are typically the last to be served, if they get service at all. Second, the prices of the service and its complements (computers, routers, and so forth) both decline over time. Falling prices imply the willingness to pay of the marginal user in the future is lower than that in the prior periods. In these and other settings, the average value of service declines as quantity rises toward the optimal, converging to the average valuation at the optimum v*. As the diffusion process approaches maturity, the difference between the actual and
31 In equilibrium, the marginal willingness to pay is equal to the marginal social cost of production (including social premia). Say, for example, there are four potential buyers with valuations 100, 75, 50, and 25. If marginal cost is 50, then three of the four consumers buy the good. The average valuation is (100+75+50)/3 = 75 = (100+50)/2. If the marginal cost is 25, then all four buy and the average net value is (100+75+50+25)/4 = 62.5 = (100+25)/2. These calculations assume a linear willingness to pay curve.
32 E. Rogers, DIFFUSION OF INNOVATION (2003).
Figure 4. Declining Average Valuation
q* w
c
q q”
a
• v” = (a + b)/2
b
c
• v* = (a + c)/2

24 PHOENIX CENTER POLICY PAPER [Number 36
Phoenix Center for Advanced Legal and Economic Public Policy Studies www.phoenix-center.org
optimal average valuations will become small. So, at some point, from a BAI implementation perspective, it may make sense to set the two values equal to reduce the number of parameters.
III. Numerical Simulation of the Broadband Adoption Index
In this Section, we present a numerical simulation of this adoption index. The purpose of the simulation is to demonstrate the theoretical underpinnings of the BAI and to provide an expanded discussion along the lines of the graphical analysis above (particularly Figure 4). Through simulation, we can observe optimal output levels, the diminishing average valuation of connections, and how social values change with changes in either the demand-side or supply-side characteristics of the market. Importantly, this simulation is for illustrative purposes only. Nevertheless, simulations such as this may help in devising the target average values and quantities for the BAI, or for bounding the relationship between average valuations.
A. Setup for Benchmark Case
We again consider a world with two modalities, m and f. Modality m is purchased and used by an individual (a personal connection), whereas modality f is shared among many users (a shared connection). The demand curves are linear. We allow for demand interdependence, with increases in the quantity of m reducing the value of modality f (by a small amount). Notably, this assumption reduces the optimal quantity of m at the optimum, since higher quantities of m reduce the surplus per connection for f. In other words, m imposes a negative spillover due to substitution. We consider the case of no interdependence in alternative scenarios. Again, our effort here is not to provide meaningful values for policy purposes, but to illustrate the inner workings of the BAI. We also make the simplifying assumption that costs are constant across the entire simulated market. We subsume the social premia into incremental costs. The simulation can be made much more complicated, but these assumptions are sufficient to illustrate comparative statics of the BAI.
The market is sized at 2,000 personal units, and the average rate of sharing for fixed connections is 2 personal units, so there are a maximum of 1,000 units of f. We assume that at a “price” of zero, all 2,000 personal units and 1,000 shared units are acquired. The linear demand curves (Dm, Df) have the general form pi = ai - biqi, but in the simulation take the specific forms
mm qp2000100
100 , (4)

Summer 2009] BROADBAND ADOPTION INDEX 25
Phoenix Center for Advanced Legal and Economic Public Policy Studies www.phoenix-center.org
fm
mf qq
qp1000
05.0200)05.0200(
. (5)
The slopes of the curves are set such that the demand curve intersects the quantity axis at the maximum values. We make the simplifying assumption that the value for qf is twice that of qm, since two persons are using it. This assumption will be relaxed in alternative scenarios, but this particular assumption results in the modalities individually having identical total welfare at the maximum quantity (that is, we do not favor one modality over another). Including qm in the demand for qf is based on the assumption that having a connection of modality m reduces the value of also having a connection f. As qm rises, the intercept of the demand for f falls and the slope becomes flatter, ensuring that the curve intersects the horizontal axis at 1,000 units. The substitution effect is small; if qm = 1,000, for example, then the intercept of the demand for f falls from 200 to 150, and the slope is changed so that the curve still intersects the q axis at 1,000. The demand curves are illustrated in Figure 5. The costs are assumed to be cf = 40 and cm = 20.
B. Results for Benchmark Case
Given the demand and cost assumptions, it is straightforward to compute the social value of broadband at any combination of quantities. For these calculations, we scroll through all quantity combinations and assume that the highest valued users subscribe to the services first. Since the incremental costs are positive, the optimal quantities will be such that qf* < 1,000 and qm* < 2,000
Figure 5. Benchmark Demand Relationships
p
q
200-0.05qm
slope = 100/2000
1000 2000
slope = (200-0.05qm)/1000
100
Dm Df

26 PHOENIX CENTER POLICY PAPER [Number 36
Phoenix Center for Advanced Legal and Economic Public Policy Studies www.phoenix-center.org
(see Figure 3). (The maximum subscription is not a valid target as long as the social costs of production, including social premia, are positive.)
Table 1. Benchmark Simulation Results (BAI)
m ↓ f→ 0.1 0.2 0.3 0.4 0.5 0.6 0.7 0.8 0.9 1.0
0.1 30.3 43 53.7 62.4 69.2 73.9 76.7 77.4 76.2 73.1
0.2 42.9 54.7 64.6 72.6 78.8 83.1 85.5 86 84.7 81.4
0.3 53.4 64.3 73.4 80.8 86.4 90.2 92.2 92.5 91 87.7
0.4 61.8 71.8 80.2 86.8 91.9 95.2 96.9 96.9 95.2 91.9
0.5 68.1 77.2 84.8 90.8 95.2 98.1 99.4 99.2 97.3 93.9
0.6 72.3 80.6 87.4 92.7 96.6 99 99.9 99.4 97.4 93.9
0.7 74.5 81.8 87.8 92.5 95.8 97.7 98.3 97.5 95.4 91.9
0.8 74.5 81 86.2 90.2 92.9 94.4 94.6 93.5 91.2 87.7
0.9 72.5 78.1 82.5 85.8 87.9 88.9 88.8 87.5 85 81.4
1.0 68.4 73.1 76.7 79.3 80.9 81.4 80.9 79.3 76.7 73.1
Some results from the simulation are summarized in Table 1. Down the rows
of the table, the share of total m possible connections (not optimal connections) of type m rises from 0.10 to 1.00. So, at 0.50 there are 500 connections of type m (= 0.50·1,000). Across the columns, the share of f connections to total possible f connections rises from 0.10 to 1.00. Each cell of the table contains the BAI as defined in Equation (3) for the indicated joint penetration. Browsing the table shows that the value maximizing amount of broadband in this “country” is about 70% of total possible f connections and about 60% of total possible m connections (BAI = 99.9).33
A number of interesting insights come from this table. First, in the bottom right hand corner of the table, the share of target welfare at 2,000 m connections and 1,000 f connections is provided. As noted above, as long as costs are positive, maximum subscription is not socially desirable, and in this scenario maximum subscription renders only 73.1% of total possible welfare available. Second, we see that a singular focus on either m or f connections does not render a meaningful index of broadband value. It takes both m and f connections to maximize broadband’s social value. This demonstrates plainly why a narrow focus on fixed connections (as with the OECD rankings) is problematic.
33 The exact optimal penetration rates are 0.72 and 0.57.

Summer 2009] BROADBAND ADOPTION INDEX 27
Phoenix Center for Advanced Legal and Economic Public Policy Studies www.phoenix-center.org
Third, we see the effect of assuming the highest valued users adopt first. Even at 10% penetration for both services, 30.3% of total available value is achieved. We note that this is illustrative, but the simulation results demonstrate the consequences of the fact that early adopters are likely to render higher social value. That is, the benefit of broadband is not constant (but declining) in quantity.
Figure 6 illustrates the marginal benefit of additional penetration of modality f, holding m subscriptions at 10% penetration. (These are the first row values from Table 2.) As shown by the curve labeled MVf, increasing penetration is subject to diminishing marginal returns, so as a country approaches maturity, there is less to gain from improvements in subscription. While a product of our chosen design, it seems reasonable to expect, at some point, diminishing (but positive) marginal returns in subscriptions. Once the optimal connection level of about 700 connections is reached, additional connections of type f actually reduce the total value derived from broadband. We believe this result to be of significant policy relevance.
C. Alternative Scenarios
The purpose of the simulation is not to predict the optimal subscription rates of any particular country, but to demonstrate how variations in the relevant factors change these optimal levels. We present three alternative scenarios. First, we allow the cost of m to rise in $5 increments from $20 to $60. As costs rise, net value declines. So this scenario demonstrates the effect on the BAI of changing the relative values of modalities. Second, we allow the cost of f to rise in $5 increments from $40 to $80, a scenario again illustrating the effect on the ideal connection quantities of changes in relative value. Third, we allow the maximum
Figure 6. Marginal Value (MV) of Connections
qf* = 700 MVf
0 qf
MV

28 PHOENIX CENTER POLICY PAPER [Number 36
Phoenix Center for Advanced Legal and Economic Public Policy Studies www.phoenix-center.org
value of m to rise from $100 to $260 in increments of $20. In the baseline simulation, the modality m is basically defined to be half as valuable as modality f as a consequence of connection sharing. This result need not be true, however, if modality m provides something other than an f connection (e.g., mobility). We add a premium to modality m to evaluate the effect of relaxing the strict sharing assumption of the baseline case. Table 2 summarizes the results.
Table 2. Optimal Adoption in Alternative Scenarios
Scenario 1 Cost of m (cm): 20 25 30 35 40 45 50 55 60
qm*/qmw=0 0.57 0.52 0.47 0.42 0.36 0.31 0.26 0.21 0.16
qf*/qfw=0 0.72 0.73 0.74 0.75 0.76 0.76 0.77 0.78 0.78
Scenario 2 Cost of f (cf): 40 45 50 55 60 65 70 75 80
qm*/qmw=0 0.57 0.58 0.58 0.59 0.60 0.60 0.61 0.62 0.64
qf*/qfw=0 0.72 0.68 0.65 0.61 0.57 0.54 0.50 0.46 0.41
Scenario 3 Max Value m 100 120 140 160 180 200 220 240 260
qm*/qmw=0 0.57 0.64 0.70 0.73 0.76 0.79 0.81 0.82 0.84
qf*/qfw=0 0.72 0.71 0.69 0.69 0.68 0.67 0.66 0.66 0.66
As shown in Table 2, as the cost of one modality rises, its optimal share of total connections declines. Take Scenario 1 where the incremental cost cm rises from $20 to $60. In the benchmark case (cm = 20), the optimal share of total connections was 0.57 for modality m and 0.72 for modality f. If cm rises to $40, however, then the optimal share of modality m falls to 0.36 and that of modality f rises to 0.76. At cm = $60, optimal shares are 0.16 and 0.78, respectively. The logic applies in Scenario 2, except cf rises in this case. As cf rises relative to cm, the optimal share of m rises and the optimal share of f declines. At the highest value of cf, the optimal shares for modalities m and f are 0.64 and 0.41. Obviously, if in country A connection modality f has a higher incremental cost than in country B, it is unreasonable to expect them to have the same adoption rates for the two modalities. In fact, that outcome would be inefficient.
In alternative Scenario 3, we let the value of modality m rise relative to f. In the benchmark case, we simply assumed that since f was shared by two users, its value was twice as large. In reality, this assumption is too simplistic, as different modalities can satisfy very different needs. We see that as the value of modality m rises relative to f, its optimal share of possible connections rises. Given substitution between the two, the optimal share of f falls. Note that a 40% value premium on m makes the optimal penetration of m larger than that of f. While

Summer 2009] BROADBAND ADOPTION INDEX 29
Phoenix Center for Advanced Legal and Economic Public Policy Studies www.phoenix-center.org
these outcomes are purely illustrative, the point is important: Differences in values between modalities can result in meaningful differences in socially optimal adoption rates. The simulation reveals again that a narrow focus on quantity counts provide insufficient guidance for policy purposes.
In our benchmark scenario, we assumed that both modalities are costly to produce and that there was substitution between modality m and f. Positive costs lead to optimal quantities less than the theoretical maximum (say, households or population), and the substitution effect strengthens the effect on modality f of favorable changes to the benefits or costs of modality m. In Table 3, we set the costs of both modalities and the substitution effect at zero. The effect of such assumptions is obvious. With zero costs and no demand relationships, maximum consumption is now the optimal for both modalities.34 Neither assumption, however, has any link to reality. Nevertheless, much of the policy debate seems centered on this faulty logical setup, so we present it in the hope that the underlying assumptions are made plain.
Table 3. Benchmark Simulation Results (BAI)
(Zero Costs, No Substitution)
m ↓ f→ 0.1 0.2 0.3 0.4 0.5 0.6 0.7 0.8 0.9 1.0
0.1 19.0 27.5 35.0 41.5 47.0 51.5 55.0 57.5 59.0 59.5
0.2 27.5 36.0 43.5 50.0 55.5 60.0 63.5 66.0 67.5 68.0
0.3 35.0 43.5 51.0 57.5 63.0 67.5 71.0 73.5 75.0 75.5
0.4 41.5 50.0 57.5 64.0 69.5 74.0 77.5 80.0 81.5 82.0
0.5 47.0 55.5 63.0 69.5 75.0 79.5 83.0 85.5 87.0 87.5
0.6 51.5 60.0 67.5 74.0 79.5 84.0 87.5 90.0 91.5 92.0
0.7 55.0 63.5 71.0 77.5 83.0 87.5 91.0 93.5 95.0 95.5
0.8 57.5 66.0 73.5 80.0 85.5 90.0 93.5 96.0 97.5 98.0
0.9 59.0 67.5 75.0 81.5 87.0 91.5 95.0 97.5 99.0 99.5
1.0 59.5 68.0 75.5 82.0 87.5 92.0 95.5 98.0 99.5 100
34 If the good can be produced without costs, then the marginal value of the last unit consumed is also zero. Since we have assumed all potential buyers have non-negative valuations, all potential buyers subscribe at zero price (or cost). If the net substitution relationship remained, then increases in the consumption of modality m would reduce the valuations of modality f, thereby creating negative gross valuations (which are simply a product of the linear simulation).

30 PHOENIX CENTER POLICY PAPER [Number 36
Phoenix Center for Advanced Legal and Economic Public Policy Studies www.phoenix-center.org
We suspect that in some circles the idea of everyone having access to the Internet via all connection modalities seems like Nirvana. However, broadband connections are not socially free goods, and the costs of service must be subtracted from the benefits to get a measure of value.35 Further, if the use of the BAI is to compare countries or regions within a country, then it must be recognized that the costs of different modalities may vary substantially across geo-political units. For example, in some places the costs of fixed modalities may be prohibitively high even under very generous assumptions about benefits. Yet, alternative modalities may be financially feasible and render positive values, confirming once more that all modalities must be accounted for. Likewise, in some cultures, fixed modalities may render very little benefit despite low costs, perhaps given a strong preference for mobility. In many respects, a proper analysis of broadband subscription should give significant weight to the concept of customer sovereignty as to the choice of connection modality.
IV. Implementation Guidelines, Suggestions and Applications
While the BAI is derived from widely accepted economic principles, conceptual validity does not necessarily imply that is it useful in a policy context. Utility requires application. In this Section, we discuss some procedures, including recommendations on data collection, so that the BAI method can be implemented either within a country or for a group of countries. While the gathering of sufficient, reliable data for comprehensive, country-to-country comparisons may be years off, countries may wish to adopt a BAI-type approach domestically by, for example, gathering sufficient data to allow for an analysis of broadband adoption by region, province, or other political subdivision.
Any meaningful index of broadband adoption will be a data intensive endeavor, and measuring broadband adoption is not a straightforward process. Simple measures, while desirable from an implementation perspective, will consistently fail to render useful policy insights. Even though it is data-intensive, the process of implementing the BAI is likely to involve both positive and normative elements.36 The BAI is not a rigid framework, and it may be modified to incorporate or adapt to specific policy goals. This is a distinct advantage of our approach.
35 At a minimum, this point forces a discussion of how big the social premia must be in order to make 100% adoption a desirable social policy.
36 By this we mean a balance between the realities of a market (the “what is”) and the outcomes desired by policy makers (the “what should be”).

Summer 2009] BROADBAND ADOPTION INDEX 31
Phoenix Center for Advanced Legal and Economic Public Policy Studies www.phoenix-center.org
The conceptual underpinnings of the BAI are already being incorporated into policy. Even now policymakers are responding to demand and cost differences among heterogeneous modalities, often choosing wireless and mobile broadband options in areas where those technologies are more efficiently deployed. For example, Portugal has its e-initiatives program, which aims to provide laptop computers with mobile broadband connectivity to students and parents.37 Similarly, in many less developed countries, policymakers are likely to focus their attention on those deployments they believe have the highest social returns. Quantity-based measures of adoption, like those used widely today, fail to capture the heterogeneous social values between connections. While it is possible to make some simplifying assumptions that reduce the BAI to a simplistic calculation, each of these assumptions introduces some degree of error into the measure of adoption. These errors are not simply statistical errors, which are inevitable in anything that is measured, but are conceptual problems that render the index defective, irrespective of the statistical procedures or data limitations arising during estimation.
As shown above, and as illustrated clearly in the linear simulation, meaningful implementation of the BAI requires knowledge of both demand (value) and costs (the difference being the net value of the connection). We have shown that the demand and supply sides do matter; from a statistical standpoint, the vast majority of variation in broadband subscriptions across the OECD can be explained by a very few economic and demographic variables measuring income, education, age, and population density.38 While the high-level policy debates today ignore economic differences across geo-political units, it is clear that any meaningful analysis of broadband adoption cannot. Whether all countries will accept this fundamental reality in the future is unknown, but the policymakers in individual countries tasked with ensuring adequate Internet
37 The decision was costly in terms of broadband rankings, since the OECD and ITU rankings include only fixed connections. Unfortunately, the rankings debate raises the cost of welfare maximizing decisions by discouraging policymakers from making economically efficient decisions and instead focusing on statistics that are misleading and unrelated to efficient deployment and adoption decisions. The Portuguese policymakers chose welfare over rankings.
38 These differences occur within countries as well. For instance, we examined broadband subscriptions among the fifty states in the United States and found that similar demographic and economic conditions, such as education, income, income inequality, and age, explained this variation inside the U.S. much the same as they explained variation among OECD countries. See G.S. Ford, T.M. Koutsky and L.J. Spiwak, The Demographic and Economic Drivers of Broadband Adoption in the United States, PHOENIX CENTER POLICY PAPER NO. 31 (Nov. 2007) (available at: http://www.phoenix-center.org/pcpp/PCPP31Final.pdf ).
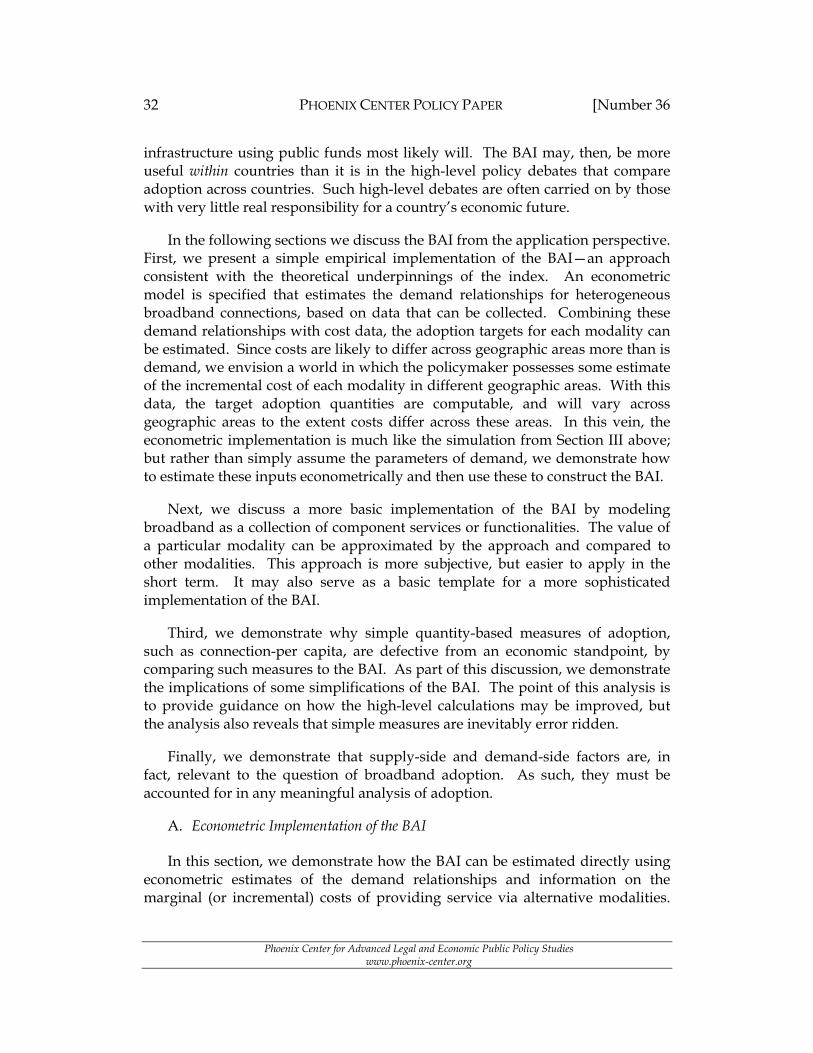
32 PHOENIX CENTER POLICY PAPER [Number 36
Phoenix Center for Advanced Legal and Economic Public Policy Studies www.phoenix-center.org
infrastructure using public funds most likely will. The BAI may, then, be more useful within countries than it is in the high-level policy debates that compare adoption across countries. Such high-level debates are often carried on by those with very little real responsibility for a country’s economic future.
In the following sections we discuss the BAI from the application perspective. First, we present a simple empirical implementation of the BAI—an approach consistent with the theoretical underpinnings of the index. An econometric model is specified that estimates the demand relationships for heterogeneous broadband connections, based on data that can be collected. Combining these demand relationships with cost data, the adoption targets for each modality can be estimated. Since costs are likely to differ across geographic areas more than is demand, we envision a world in which the policymaker possesses some estimate of the incremental cost of each modality in different geographic areas. With this data, the target adoption quantities are computable, and will vary across geographic areas to the extent costs differ across these areas. In this vein, the econometric implementation is much like the simulation from Section III above; but rather than simply assume the parameters of demand, we demonstrate how to estimate these inputs econometrically and then use these to construct the BAI.
Next, we discuss a more basic implementation of the BAI by modeling broadband as a collection of component services or functionalities. The value of a particular modality can be approximated by the approach and compared to other modalities. This approach is more subjective, but easier to apply in the short term. It may also serve as a basic template for a more sophisticated implementation of the BAI.
Third, we demonstrate why simple quantity-based measures of adoption, such as connection-per capita, are defective from an economic standpoint, by comparing such measures to the BAI. As part of this discussion, we demonstrate the implications of some simplifications of the BAI. The point of this analysis is to provide guidance on how the high-level calculations may be improved, but the analysis also reveals that simple measures are inevitably error ridden.
Finally, we demonstrate that supply-side and demand-side factors are, in fact, relevant to the question of broadband adoption. As such, they must be accounted for in any meaningful analysis of adoption.
A. Econometric Implementation of the BAI
In this section, we demonstrate how the BAI can be estimated directly using econometric estimates of the demand relationships and information on the marginal (or incremental) costs of providing service via alternative modalities.

Summer 2009] BROADBAND ADOPTION INDEX 33
Phoenix Center for Advanced Legal and Economic Public Policy Studies www.phoenix-center.org
Of course, data is required for this procedure, including data sufficient to estimate some type of demand function for the broadband connection modalities, as well cost estimates for the modalities across some disaggregated geographic units. Disaggregation of the cost data is desirable because the relevant policy issue with respect to deployment is not generally at the country-level; costs, and possibly demand, differ across geographic and demographic units within a country. So, disaggregation allows for more finely tuned policy decisions, which are likely to be more efficient in terms of promoting social welfare.
In order to illustrate the econometric-based algorithm for computing target adoption rates, we create a dataset with the minimum requirements for estimation. At a minimum, we must know what is being purchased and at what prices. Demographic information on consumers is also of value. Fortunately, most surveys on broadband adoption include measures of these factors, or can be expanded to include these variables. Going forward, all data collection should include purchase decisions, prices, and some demographic variables. Excluding any of these factors significantly reduces the value of the dataset. It is very difficult to say anything meaningful about market outcomes without knowing quantities, prices, and the factors relative to the determination of both.
The effort here is illustrative and is intended to serve as a template for actual implementations. As such, the details of the analysis are provided. Also, for the highest level of generality, the data is simulated, thereby avoiding any limitations to the analysis imposed by using data from a particular survey.
1. Basic Setup
The setup is as follows. There are two modalities, f and m. From a survey or other data collection effort, we know the purchase decisions for each modality for sample of consumers or households (we will use the term consumers for expositional purposes, but the data may be on households, businesses, or other unit of observation; the analysis should match, of course, the observation unit). Importantly, we also know the prices faced by consumers for each modality, or are able to approximate the prices using tariffs, surveys, or some other method. Demand relationships require price data. Some demographic data—income, education, age—is also available. It may be that optimal broadband adoption policies differ by income class, age groups, educational attainment, and other demographic and economic factors. The finer the aim of policy, the more detail the dataset must contain.

34 PHOENIX CENTER POLICY PAPER [Number 36
Phoenix Center for Advanced Legal and Economic Public Policy Studies www.phoenix-center.org
2. Generating the Data Set
Our dataset contains five variables. We have the purchase decisions for two modalities, the prices for each, and a single variable that is used to summarize demographic information. The observed purchase decision is dichotomous, with the purchase of each modality being indicated by either a zero or one (i.e., if purchased, the variable has a value of 1.0; zero otherwise). Prices are drawn from a uniform distribution across the discrete levels (30, 35, 40, 45, 50). Demographics are captured by a dichotomous variable called TYPE, which equals 1 for consumers with a relatively high preference for modality type m. (In actual implementations, this single variable would be replaced with a variety of demographic factors.) We assume there are 2,000 total observations, with half of them being of each type.39
We begin by creating valuations for the modality for each consumer. Valuations are drawn from a bivariate normal distribution, and the correlation is assumed to be positive and is created via a common variable, which is viewed as the general desire for connectivity to the Internet. Let xj be a normal distributed random variable. Valuations for each consumer are constructed as:
TYPExxVm 1051020 21 ; (6)
TYPExxV f 1051040 23 ; (7)
where x2 is the common valuation across modalities. For consumers of TYPE = 1, there is a preference for modality m. All random components are normally distributed, so the valuations are likewise normally distributed.
Based on these valuations, the underlying econometric demand system is:
mmm TYPEPNV 321 (8)
wmf TYPEPNV 321 (9)
where NVi is the net value of the service to the consumer of the modality i, Pi is the price of modality i, and the error terms, i, are assumed to be standard normal with a correlation of . In the final set of simulated data, we observe only whether a purchase is made (a dichotomous variable as would typically be
39 The simulated data is generated using Matlab. Most statistical programs, and even spreadsheet programs, could be used to simulate such data.
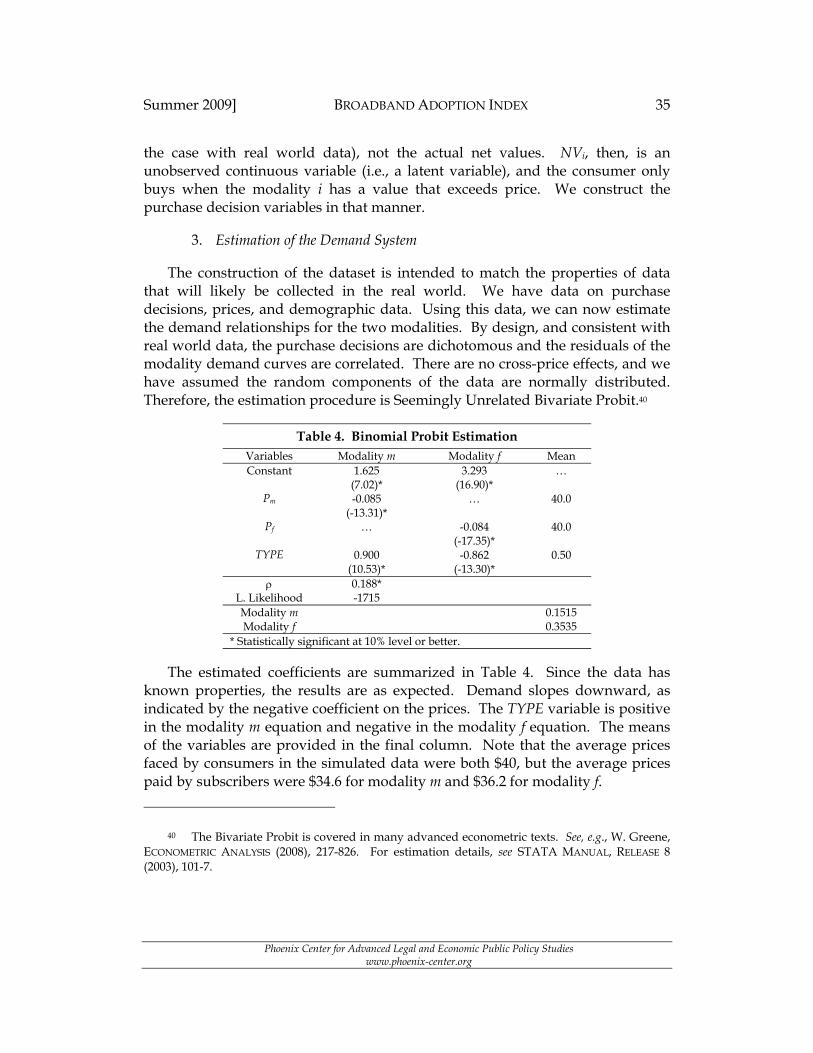
Summer 2009] BROADBAND ADOPTION INDEX 35
Phoenix Center for Advanced Legal and Economic Public Policy Studies www.phoenix-center.org
the case with real world data), not the actual net values. NVi, then, is an unobserved continuous variable (i.e., a latent variable), and the consumer only buys when the modality i has a value that exceeds price. We construct the purchase decision variables in that manner.
3. Estimation of the Demand System
The construction of the dataset is intended to match the properties of data that will likely be collected in the real world. We have data on purchase decisions, prices, and demographic data. Using this data, we can now estimate the demand relationships for the two modalities. By design, and consistent with real world data, the purchase decisions are dichotomous and the residuals of the modality demand curves are correlated. There are no cross-price effects, and we have assumed the random components of the data are normally distributed. Therefore, the estimation procedure is Seemingly Unrelated Bivariate Probit.40
Table 4. Binomial Probit Estimation Variables Modality m Modality f Mean Constant 1.625
(7.02)* 3.293
(16.90)* …
Pm -0.085 (-13.31)*
… 40.0
Pf … -0.084 (-17.35)*
40.0
TYPE 0.900 (10.53)*
-0.862 (-13.30)*
0.50
0.188* L. Likelihood -1715 Modality m 0.1515 Modality f 0.3535
* Statistically significant at 10% level or better.
The estimated coefficients are summarized in Table 4. Since the data has known properties, the results are as expected. Demand slopes downward, as indicated by the negative coefficient on the prices. The TYPE variable is positive in the modality m equation and negative in the modality f equation. The means of the variables are provided in the final column. Note that the average prices faced by consumers in the simulated data were both $40, but the average prices paid by subscribers were $34.6 for modality m and $36.2 for modality f.
40 The Bivariate Probit is covered in many advanced econometric texts. See, e.g., W. Greene, ECONOMETRIC ANALYSIS (2008), 217-826. For estimation details, see STATA MANUAL, RELEASE 8 (2003), 101-7.

36 PHOENIX CENTER POLICY PAPER [Number 36
Phoenix Center for Advanced Legal and Economic Public Policy Studies www.phoenix-center.org
4. Calculation of the BAI
With the estimated demand relationships, we may proceed with the computation of the BAI using the dual modality framework from Equation (3). Calculating the optimal quantities, qi*, requires an estimate of marginal cost. For now, assume that the marginal cost for modality m is $25 and for f is $35.41 Given the demand curves and costs, we can compute all the necessary elements of the BAI, and do so following the graphical analysis presented in Figures 2 and 3.
The optimal quantities are *mq = 965 and *
fq = 953, implying penetration rates
of 48.2% and 47.7% (as a share of population), with average values at the optimal of *
mv = 10.11 and *fv = 10.14. Actual quantities are qm = 303, qf = 707, and the
associated values are calculated to be tmv , = $16.74 and tfv , = $11.20. The BAI,
then, is
67.095314.1096511.1070720.1130374.16
tBAI . (10)
We see that for modality m, we have 52% of the maximum total social value obtained at an actual quantity equal to 31% of the optimal quantity, and only 15% of the population.42 For modality f, about 82% of the available total social value is obtained at actual values equal to only 74% of the optimal quantity, and only 35% of the population.43
These value shares demonstrate the importance of declining valuations in quantities and the defects in per capita measures of the adoption index. Relative to the optimal, the ratio of average values for modality m is m = 1.66 (= 16.74/10.11), and modality f is f = 1.10 (= 11.20/10.14). The lower relative value for modality f arises because the penetration rate on the optimal quantity is much larger for modality f than for m (and as the quantities converge, approaches 1.0).
We return again, reluctantly, to the per capita measures of adoption, which can be shown to be poor measures of the social value of adoption. For modality m, the per capita “penetration” rate is only 15%, yet over 50% of the value from
41 In practice, estimates of long-run incremental cost could be used.
42 The value obtained is 16.74·303/10.11·965 = 0.52.
43 The value obtained is 11.20·707/10.14·953 = 0.67.

Summer 2009] BROADBAND ADOPTION INDEX 37
Phoenix Center for Advanced Legal and Economic Public Policy Studies www.phoenix-center.org
modality m is obtained at current subscriptions. Further, the optimal penetration rate for modality m is only about 48% of the population, so the socially-desired quantity is well below the total population. We see the same is true for modality f. The use of per capita subscription rates is misleading, and we hope that fact is obvious at this point.
5. Subscription Targets at Different Costs
Neither demand nor costs is identical across all potential politically-relevant geographic units or sub-populations. On the demand side, it is possible to create area or population specific demand profiles by adjusting the demographic inputs in the estimated demand curves when computing optimal quantities and values. Such adjustments are relatively easy to implement. However, it is important to keep in mind that as the demographic input choice gets further from the sample average, the predictions of the econometric model become less reliable.
Cost differences across geography presumably are based on cost studies. In Table 5, we present the optimal subscription rates for modalities m and f at different marginal (incremental) cost values. Demand is based on the econometric estimation above.
Table 5. Costs and Optimal Population Penetration Rates
Marg. Cost
Optimal m Pop. Penetration Rate
(qm*/pop)
Optimal f Pop. Penetration Rate
(qf*/pop)
0 97% 100% 5 93% 99%
10 87% 97% 15 77% 93% 20 63% 86% 25 48% 76% 30 33% 63% 35 21% 48% 40 11% 33% 45 6% 21%
As expected, at a cost of zero, the optimal subscription rates are very high—97% for modality m and 100% for modality f.44 (Note that subscriptions in this
44 As shown in Equations (6) and (7), the value for modality f is assumed to be larger than for m, and the random terms are large enough to make the value of m negative in some instances

38 PHOENIX CENTER POLICY PAPER [Number 36
Phoenix Center for Advanced Legal and Economic Public Policy Studies www.phoenix-center.org
setup are not shared, but each is consumed at the level of the unit of observation.) As costs rise, optimal subscription rates fall. From the table, it is possible to create any two cost combinations to assess optimal subscription rates. For example, as shown above, at a cost of $25 for modality m and $35 for modality f, the optimal subscription rates are 48% for both. If modality f costs $45 and modality m is $10, then the optimal subscription rate is 21% for modality f and 87% for modality m. The optimal mix depends critically on costs, as well as on demand.
Econometric models of this sort are not difficult to estimate. Given data on demand and costs, even if crude, with a few assumptions it is possible to generate useful estimates of target adoption, and to evaluate performance at different levels of actual adoption. In the absence of good data, the underlying framework of the BAI can still be implemented, though the number of assumptions must rise to offset the lack of data. Still, a value-centric approach is likely to be better than mere connection counts in guiding policymakers toward the establishment of meaningful adoption and deployment targets.
6. Social Premia
The social benefits of broadband are commonly claimed to exceed the private benefits. In other words, broadband service is characterized by benefit spillovers, or social premia. In this econometric framework, we can incorporate such social premia in the analysis as a reduction in marginal cost so that the effect of such premia are easily analyzed using Table 6. In practice, the social premia should be defined, sized, and stated explicitly in implementation in order to avoid policy that is merely ends-driven.
B. Comparative Valuation of Broadband Connection Technologies
In this section, we describe a less data-intensive approach to implementing the BAI. While more limited and subjective in application, the approach may be useful for first approximations or as a template to a more data rich procedure.
To begin, we envision broadband connectivity as a collection of component services and recognize that these component services may vary across modalities. This approach allows one to gauge or judge the relative values of each connection modality even in the absence of specific empirical calculations of the net private benefits and social premia particular to a given modality which, at present, is not generally available or highly speculative. At present, given that broadband is a relatively recent development and new modalities are emerging, empirical measurements of social premia are not available. Alternative methods are required, even if in some cases the measures are speculative. In one method,
Summer 2009] BROADBAND ADOPTION INDEX 39
Phoenix Center for Advanced Legal and Economic Public Policy Studies www.phoenix-center.org
potentially useful for formulating benefit proxies for heterogeneous modalities described below, we envision broadband connectivity as a collection of component services, which may vary across modalities.
This approach recognizes that when consumers purchase broadband, they purchase it to provide a number of services or applications that flow over that connection. One consumer may use the connection principally for surfing the Web, another may use it to stream video programming, another almost exclusively for exchanging large files for work. Algebraically, we can say that consumers, Z, of the relevant broadband services may be divided into potentially many classes, the members of each class sharing relevant demographics, demand, and geographic characteristics. In other words, we may have customer classes such as teens, the elderly, the employed, the unemployed, women, men, rich, poor, urban, rural, or any other demographic or geographic distinction deemed relevant. Each potential broadband modality, M, can be thought of as providing a bundle of component services from which the consumer can obtain value, and for which one has a willingness to pay. Various broadband modalities are then taken to differ over the component services they provide, X, so that consumers will have preferences among them. Survey data could be used to identify these groups and their various uses of broadband services.
These different classes of consumers and category of uses can then be matched against various capabilities of different broadband connection technologies.45 For expositional purposes, we discuss the problem in terms of fixed and mobile broadband connections. Our intent is not to describe exactly the differences between these two services, since that is likely to change over time. We merely intend to illustrate one potential procedure showing how to incorporate such differences into the analysis.
In terms of component services, say, for example, that a fixed-line broadband provides the user the ability to download various sorts of very large files, which are difficult to manage on a mobile connection. Alternately, the mobile connection offers mobility that is likely to be highly valued. In contrast, both types of service offer satisfactory E-mail and other communications services and, therefore, not differ much in that respect.
45 For expositional purposes, we consider and compare the value of fixed and mobile broadband connections, as one potential procedure showing how to incorporate such differences into the analysis.

40 PHOENIX CENTER POLICY PAPER [Number 36
Phoenix Center for Advanced Legal and Economic Public Policy Studies www.phoenix-center.org
To be more formal, we have:
1. customers Zn where n = 1, 2, … N;
2. modalities Mm, where m = 1, 2, … M;
3. each modality consists of Xk underlying services or functionalities, where k = 1, 2, … K.
We have different types of customers (Z) choosing among different types of broadband connections modalities (M), with each modality offering a set of functionalities (X). We may take a given connection modality Ms as represented by a vector of 0’s and 1’s, indicating the presence (“1”) or absence (“0”) of the underlying service Xk. For example, if k = 3 (so there are a maximum of three relevant functionalities), then the vector Ms = (1,0,1) indicates that modality s provides functionalities 1 and 3, but not 2.
Next, we must consider consumer values for the various products contained in particular broadband modalities. Without loss of generality, the values over the K functionalities for a given customer n can be given as the vector Vn. Thus, the gross value of a consumer of type Zn for a given modality Ms is just Vn•Ms, the inner (dot) product of the vectors Ms and Vn. With the consumer paying a price of Psn for the service, we have a net consumer benefit of (Vn•Ms - Psn).46
We may now introduce service costs and, if any, the external benefits and costs of different modalities. In policy discussions, broadband connectivity is presumed to render at least some social premia, so that society may value a connection more than the individual making the consumption decision (or the firm making the production decision). We denote the social cost of modality Ms by Cs, and note that it is the modality that has a cost, not the individual functionalities they embody. In other words, a modality has many functionalities, but only one cost. In contrast, we assume that it is the component functions, not the way they might be bundled together in services, which generate social premia, if any. For example, while one often hears the suggestion that broadband connectivity has a positive social premia, in addition to its private benefits, we take this sentiment to mean that the activities the connection allows the user to participate in, such as e-commerce, political discussion, educational programs, and the like, are the actual sources of the social premium
46 We allow price to be indexed by n because consumer type includes geographic location.

Summer 2009] BROADBAND ADOPTION INDEX 41
Phoenix Center for Advanced Legal and Economic Public Policy Studies www.phoenix-center.org
(or the social “dis-premium”, if such a concept applies). The social benefits from watching television programs over a broadband connection are likely to be private only, without any social premia. This distinction is critical, since the debate often views broadband as having a social premia, while in fact the benefits of many uses are purely private. Further, it must be recognized that some uses of broadband may provide negative social premia, such as Internet crime and the coordination of terrorist activity through websites.47
To account for any social premia on functionality k, let e = (e1, e2, … eK) be a vector including the social premia per user for the K distinct functionalities embodied in one or another modality, and let Csn be the average incremental cost of providing modality s to a consumer of type n. Then the social benefit arising from a particular consumer using a particular modality s is just [(Vn + e)•Ms - Csn]. Consumers sort themselves among available modalities by determining which (appears) to give them the highest private surplus or net consumer benefit. Total social benefit in society from broadband adoption is then just the sum of these individual social benefits over all consumers.
Table 6 illustrates such a hypothetical scenario. Consider our two connection modalities—fixed and mobile. Functionalities include Email, large file download, and mobility. The fixed connection does Email and access to large files but does not offer mobility. The mobile connection does Email and mobility but does not offer large file access. (These assumptions are purely illustrative.) If we assume that the private value for each functionality is 1.0, as is the social premia, then each functionality has a total value of 2.0 units. In Table 6, we see that under these assumptions the values of the two modalities are identical. If each costs 2.0 units, then the net value of each is 2 units. Therefore, with this assumption the efficiency index is equal to the sum of the total connections of the two modalities.
47 S. Coll & S. Glasser, Terrorists Turn to the Web as Base of Operations, WASHINGTON POST (August 7, 2005), p. A01 (http://www.washingtonpost.com/wp-dyn/content/article/2005/08/05/AR2005080501138_pf.html); see also the U.S. FBI website: http://www.fbi.gov/terrorinfo/counterrorism/waronterrorhome.htm.

42 PHOENIX CENTER POLICY PAPER [Number 36
Phoenix Center for Advanced Legal and Economic Public Policy Studies www.phoenix-center.org
Table 6. Value Scenario
Functionality (X)
Modality (M) Email Video Mobility
Fixed 1 1 0
Mobile 1 0 1
Value of Xk (Vk) 1 1 1
Social Premia (ek) 1 1 1
Value Fixed 2 2 0 = 4
Value Mobile 2 0 2 = 4
Cost
Net Value
Fixed 2
Fixed = 2
Mobile 2
Mobile = 2
As an alternative, say that large file downloads have no social premia, but Email and mobility do. In this case, the total value of the fixed connection declines to 3.0 and its net value is 1.0, whereas the net total value of the mobile connection remains at 4.0. Now, mobile connections count twice as much as the fixed connection.
Go back to our original case where total value was 4.0 for each, for example, but assume this time that a fixed connection costs 1.0 unit and a mobile connection costs 2 units. The net value of the fixed connection is 3.0 units, while the net value of the mobile connection is 2.0 units. In this scenario, each mobile connection is worth 0.67 fixed connections. This approach could be used to establish ratios for the *
mv and *fv from Equation (3) above, where subscript m is
mobile and f is fixed. Or, it could be used for crude implementations of the BAI, or as a template for a richer calculation of the BAI.
Of course, the crux of the matter lies in calculating the private and social value of each of these constituent services. But it might be possible to obtain at least relative information over private value from survey data of Internet users, broken down by class of user. Questioning Internet users about the relative value they place upon a particular service that they utilize via a particular connection mode would allow for rudimentary calculations and comparisons as to the relative value of each connection modality. Calculating social value of each constituent service may be more complex but is not necessarily impossible.

Summer 2009] BROADBAND ADOPTION INDEX 43
Phoenix Center for Advanced Legal and Economic Public Policy Studies www.phoenix-center.org
C. Simplification of the BAI and Quantity-Based Measures of Adoption
From Equation (3), we see that the BAI in the dual-modality case has eight parameters, only two (actual quantities at time t) of which can be directly obtained as part of a census of some type. Values and optimal quantities cannot be observed; consequently, they must be estimated in some way. With sufficient data all the unknowns can be estimated; the data demands for one approach are provided above. While the data requirements are not too extensive, we suspect there will be significant demand for a simplified approach to computing a meaningful index of adoption. In this section, we illustrate some simplifications to the BAI formulation that may be helpful in that regard.
In the next section, we consider the simplest case of a single modality. We show first that per capita measures of adoption are biased, and propose a potentially helpful adjustment. Then, we consider the dual-modality BAI, illustrating a few key parameters that must be considered when combining multiple modalities in a single index of adoption.
1. The Single Modality and Per Capita Measures of Adoption
As shown above, for a single modality, the BAI is just
**qv
qvBAI tt
t , (2’)
where (as before) qt is quantity at time t, q* is the social optimal quantity, tv is the average social value of a broadband connection at qt, and v* is the average social value of a broadband connection at q*. We can simplify the BAI a little by setting
*vvt , where is ratio of the actual to optimal values, so that
*q
qBAI t
t . (11)
In this form, we see that the value parameters represent a scale of the quantity ratio. As described above, the value of the earliest purchased units is likely to be higher than that of later units, for a few reasons: (a) networks will be deployed first where demand is high and costs are low; (b) the prices for computers and services decline over time; and (c) those consumers with high valuations are

44 PHOENIX CENTER POLICY PAPER [Number 36
Phoenix Center for Advanced Legal and Economic Public Policy Studies www.phoenix-center.org
likely to subscribe first. Of course, as qt approaches q*, approaches 1.0.48 So, at high subscription rates, the assumption that = 1 is not too problematic if actual quantities approach optimal quantities. If qt is well below q*, however, then may be large, and ignoring the values could be problematic, particularly when comparing the numerical difference in the index (and not simply its rank).
If we assume that = 1 generally—that is, the people who subscribe to broadband earlier do not have systematically higher net values for broadband—the BAI is a quantity index of adoption, with actual quantity divided by the optimal or target quantity. Even then, however, we do not have a per capita measure of adoption. Population is not a meaningful proxy of q* as the evidence from telephone subscriptions per capita implies; countries with ubiquitous availability and near universal adoption had telephone subscription per capita rates far less than 1.0.49
So, if a simple quantity index is to be used, then a sensible target for adoption must be selected. The measurement problem may appear to be much simpler when we assume the value parameters away, but this does introduce some bias into the index. Still, a target quantity is needed, and population does not serve the purpose. Households likewise do not serve as a useful target given that business lines are often included in the quantity counts. Choosing targets like households or population also fails to consider the demographic realities of a country, and we have already shown in earlier work and in Section IV.D below, that these factors play a significant role in relative broadband adoption, and they will also play a role in the welfare benefits of broadband adoption.50 It makes little sense to have ubiquitous broadband if complementary infrastructure does not exist, such as transportation networks, educational facilities, developed financial markets, and so forth.
Per capita measures of adoption are very popular and the simple scheme is unlikely to disappear from the policy landscape. An interesting question, then, arises: Is there some way to make adjustments to the per capita measure to
48 If actual quantity exceeds optimal quantity, then < 1, since the additional users have negative net values.
49 Across the OECD, the telephones per capita statistic was only about 0.45 at network maturity (year 1996).
50 Supra n. 3.

Summer 2009] BROADBAND ADOPTION INDEX 45
Phoenix Center for Advanced Legal and Economic Public Policy Studies www.phoenix-center.org
improve its reliability? To understand, let Nq * , where N is population and
is a scaling between q* and N. Now, we have a BAI of the form
Nq
Nq
BAI ttt
. (12)
From Equation (12), we clearly see the bias in the per capita measure of adoption (i.e., the ratio /). Since we generally expect ≥ 1 and < 1, the bias can be significant. Further, we expect and to vary significantly by country, so that the bias is not uniform across countries, and therefore the per capita measure does not allow for relative comparisons of adoption. (Note that the current per capita scheme assumes either that / = 1, or that it is identical across countries.) Even if we assume = 1, a bias remains of size 1/. To eliminate the bias, the development of some proxy for is required.51 But if the assumption is that = 1 is made and is approximated, then the method is essentially the BAI approach, since conceptually the pair render an estimate of q*.52
2. Two Modalities
In the case of two (or more) modalities, the calculation of the BAI index becomes somewhat more complex, although the basic principles are identical. In general, the analyst needs to obtain four magnitudes, which may be divided for convenience and implementation into eight variables: actual and optimal quantities for both modes of service, and optimal and actual average social values per connection for both modes of service. These eight values (in the case of two modes) may be reduced in number by the application of one or more assumptions regarding their relationships. In this section, we briefly describe several of these simplifying restrictions, and use them to highlight the basic logical structure of the index in the case of multiple services.
51 For one short-term resolution, see G. S. Ford, PHOENIX CENTER PERSPECTIVES No. 09-01: Normalizing Broadband Connections (May 12, 2009)(available at: http://www.phoenix-center.org/perspectives/Perspective09-01Final.pdf). This point is also recognized in a recent study by the ITU, MEASURING THE INFORMATION SOCIETY: THE ICT DEVELOPMENT INDEX (revised 16 March 2009)(available at: http://www.itu.int/ITU-D/ict/publications/idi/2009/material/IDI2009_w5.pdf), at 18 (assuming a maximum or reference value for connections per 100 persons of 0.60).
52 We can write q* = N, if we let = 1. Using forecast methodologies, econometric methods could be used to estimate .

46 PHOENIX CENTER POLICY PAPER [Number 36
Phoenix Center for Advanced Legal and Economic Public Policy Studies www.phoenix-center.org
As before, we may write the index as:
****
,,,,
ffmm
tftftmtmt qvqv
qvqvBAI
. (3’)
If there is no correlation between the (net) values enjoyed by subscribers owing to the order in which they subscribe, then one may assume that *
ff vv and *mm vv . This assumption reduces the number of needed values to six.
Simplifications based on these sorts of restrictions can lead to final index forms that are merely weighted sums of the observed variables qf and qm. Simplifications of this category are computationally appealing, but there needs to be recognition that simplification is obtained at a cost, and that cost can be relatively high if the assumptions are inconsistent with the reality.
The simplest way of obtaining the required input values is to follow the path touched upon above. If broadband is, for example, diffused throughout the country on a geographically sequential basis, then assuming the equality of net
values (so *ii vv ) is reasonable district by district. Next, one would need an
approximation of the socially optimal diffusion rates for the broadband technologies (perhaps using historical telephone diffusion as a benchmark), making reasonable allowances for differences between the mobile and fixed modalities. As mentioned earlier, mobile broadband service presumably does not typically serve an entire household in the same manner a fixed broadband connection (or a telephone) would do, though in some cases households do rely on mobile connections only. Thus, one would generally wish to use different optimal penetration rate assumptions for the fixed and mobile modalities. Mobile broadband is not, however, merely a low quality fixed connection, as a simple sharing adjustment implies. In many cases, mobile connections are shared among family members, and mobility has a value not possessed by fixed connections.
Plainly, simplification in the multi-modality case is a daunting task. As shown in the previous section, simplifying the single modality case into a quantity-based index is difficult. While a few parameters can be eliminated under strong assumptions, the impact of such assumptions on accuracy must be carefully considered and (at least crudely) quantified.
D. Endowments and Broadband Adoption Targets
Despite some of the rhetoric, broadband is a service—not a miracle. End users demand it, and firms supply it, and there are numerous studies evaluating

Summer 2009] BROADBAND ADOPTION INDEX 47
Phoenix Center for Advanced Legal and Economic Public Policy Studies www.phoenix-center.org
how economic and demographic endowments affect outcomes.53 These studies have been conducted the individual, household, business and even geo-political level. All show approximately the same thing—broadband purchases are, among other things, positively related to income and education, and inversely related to service price and the age of the user. (There are, of course, other important determinants of subscription.) The findings of such studies are essential for formulating broadband policy, although often ignored today, and such findings can be very useful for implementing the BAI.
Economic and demographic factors play a critical role in broadband adoption. Using the last set of subscription rate data from the OECD (June 2008), we regress these 30 observations on a few key factors, including an index of price (PRICE), GDP per capita (GDPCAP), the GINI coefficient (income inequality), the percent of the persons over age 65 (AGE65), and the percent of population living in urban areas (URBAN).54 Both Log-Log and Lin-Lin models are summarized in Table 7. As shown in the table, the economic and demographic endowments are potent determinants of differences in adoption rates for fixed services. In fact, this simple regression with few observations explains about 87% of the variation in subscriptions rates across the OECD. Such a high R2 using so few cross sectional observations is rare, but telling.55 These basic findings strongly suggest that, when assessing adoption, ignoring economic and demographic endowments is problematic.
53 Supra n. 17.
54 All variables expressed as natural logs. All variables are statistically significant at better than the 5% level except for the constant term. The data is described in Ford, Koutsky and Spiwak (2008), supra n. 3. We limit the analysis to a few variables for two reasons. First, to demonstrate how much of the variation in broadband adoption rates can be explained by a limited set of regressors, and second because we have few degrees of freedom given the small sample size.
55 The R2 of a regression is defined as the ratio of variation explained by the model to total variation. D. Gujarati, BASIC ECONOMETRICS (1995), 74-80.

48 PHOENIX CENTER POLICY PAPER [Number 36
Phoenix Center for Advanced Legal and Economic Public Policy Studies www.phoenix-center.org
Table 7. Determinants of Broadband Subscription Log-Log Lin-Lin
Variables Coef (Robust t-stat)
Coef (Robust t-stat)
Mean
Constant -6.81 (-2.68)*
-0.31 (-3.07)*
…
PRICE -0.44 (-3.06)*
-0.002 (-4.70)*
49.7
GDPCAP 0.59 (3.70)*
1.97E-6 (1.76)*
27,529
GINI -0.81 (-2.97)*
-0.006 (-4.02)*
31.05
AGE65 -0.15 (-0.83)*
-0.003 (-3.88)*
27.03
URBAN 0.96 (3.87)*
0.003 (4.55)*
74.96
R2 0.87 0.86 Dep. Var. … … 0.228
* Statistically significant at 10% level or better.
From the Lin-Lin version of the model, we see that on average, a $10,000 increase in GDP per capita increases the connection rate per capita by 1.97 percentage points (with a mean of 0.228). A 10 percentage point rise in the percentage of a population living in an urban area, or a 10 percentage point decline in the share of persons over 65 years of age, both increase the subscription rate by about 3.0 percentage points, on average. Countries with large percentages of older citizens, or with low urban populations, should adjust their target subscription rates to reflect these realities. The numerical simulation in Section III demonstrates how such econometric estimates could be used to scale the benefit curves.
We do not consider this analysis to be a complete econometric analysis of broadband adoption across countries. The intent is merely to demonstrate the fact that demographics matter, and that econometric analysis of this sort may prove very helpful in implementing the BAI, either within a country or across a group of countries. Other techniques, such as “willingness to pay” models, stochastic frontier models, hedonic models, and so forth, may also be useful. Estimating valuations has a rich history in economics and econometrics, and the requirements of the BAI can be met using the standard techniques.
V. Measurement, Multiple Modalities and Public Policy
Above, we have provided a performance index, the BAI, that with sufficient data can accommodate multiple, heterogeneous connection technologies, is properly scaled, and can be used to meaningfully compare broadband adoption across countries. We have also shown that creating a connections-count index of

Summer 2009] BROADBAND ADOPTION INDEX 49
Phoenix Center for Advanced Legal and Economic Public Policy Studies www.phoenix-center.org
broadband adoption is not feasible absent a number of heroic assumptions. From the simulation in Section III, we saw that value maximizing broadband adoption is likely to require that a society employ a mix of different technologies for Internet access, with optimal adoption rates below 100%. As a result, any index or comparison system that does not include all significant methods of accessing and using the Internet will be inaccurate and misleading to policymakers.
Broadband policy in many countries is today unquestionably motivated by comparing the relative performance of countries. Having a meaningful tool for comparison is essential for good policy, yet the current way of comparing countries by ranking per capita fixed connection counts is defective. In this section, we demonstrate with a theoretical argument that a limited focus on quantity counts from single modalities can lead to public policy errors. Put simply, if there are differences in the cost and benefit of modalities, then all modalities must enter in to the benchmarking process. In many countries, millions, if not billions, of dollars have been set aside for broadband investments. Spending that money wisely should be paramount. The goal of the analysis is to encourage better public policy through the use of better measurement tools by illustrating the potential for bad public policy decisions arising from the use of bad measurement tools.
A. The Model
Imagine a country facing a decision as to how to allocate a fixed fund I between modality m and modality f broadband infrastructure spending. So that we can evaluate the aggregate welfare implications of the investment decision, we assume these investment levels are set by a welfare-maximizing social planner. These investments, in turn, will affect the costs of providing broadband services of the two modalities. Although some infrastructure investments might serve both purposes (e.g., backhaul and backbone facilities), we abstract from that fact here in order to highlight the salient points.
The investment budget constraint is:
III fm , (13)
so that all investment expenditures are made either on m or f infrastructure. To simplify, we imagine there are two types of consumers, those who derive utility from the services of m modality, and those who derive utility from the services provided by the f broadband modality. Although modes of service delivery are inevitably substitutes in practice for many consumers (and, apparently, complements for others since both sorts of subscriptions are bought by some

50 PHOENIX CENTER POLICY PAPER [Number 36
Phoenix Center for Advanced Legal and Economic Public Policy Studies www.phoenix-center.org
households), we again abstract from that here by assuming no overlap in demand at all. This is unrealistic, we know, but our findings do not depend on any sort of complex demand interactions, nor are they weakened by such relationships. Demand or cost dependencies serve only to unnecessarily complicate the analysis, and do not impact the main findings. Nevertheless, we expect that consideration of such complexities may render some interesting insights, but they are beyond the scope of the present analysis.
Now, suppose that a proportion s of the society is composed of m modality users, and (1 - s) of f modality users. Presumably, at least for now, m broadband use is less than f (s < 1 - s), but this is not necessary for our findings. Further, suppose that in each class of potential buyers the values they assign to their respective services of choice can be described simply by uniformly distributed random variables, taking values between 0 and 1. Thus, neither type of broadband connection has a “value advantage” over the other. Our findings, however, do not depend on this common distributional assumption, or on the uniformity of the distributions.
Next, to abstract somewhat from considerations of product market competition, suppose that consumers of both types buy their respective connections whenever the costs (prices) are less than their individual valuations. Thus, a buyer with valuation v for f modality, for example, would buy it if the cost cf were less than v (i.e., cf < v). This setup leads to continuous demand responses to changes in costs or price. The public authority charged with information technology investment decisions is assumed to be able to affect these service costs, given by cm and cf respectively, by means of their investment decisions. In this way, the level of penetration of broadband technology in society may be (partially) influenced by public policy. In particular, an investment in a service modality results in lower costs (and prices) for that modality, encouraging further subscription.
Both f and m broadband modalities have positive costs, but their costs are not identical (although they may be very similar depending on circumstances). As stated above, the more investment there is in a technology, the lower is the cost of providing a connection. To formalize in a useful way, suppose that the cost of a broadband connection can be given as a mode-specific constant, adjusted to reflect cost reductions arising from the public investment in that mode of delivery. Specifically, assume that the costs cm and cf can be given by:
)( mm Igc , (14)
)(1 tf Igc , (15)
Summer 2009] BROADBAND ADOPTION INDEX 51
Phoenix Center for Advanced Legal and Economic Public Policy Studies www.phoenix-center.org
where is a given constant, < 1 say, and g is an increasing function of investment common to both technologies.56 So, our model allows for inherent cost differences, which for now, we take as favoring traditional broadband for the sake of argument, and for cost-reduction through spending on infrastructure (that is, scale effects).
We have specified the demand and cost structure of the model, and we have a welfare maximizing social planner making the investment decision. So, we may now move directly into the issue of public policy and social welfare.
First, the simple demand model yields equally simple welfare expressions for buyers. Buyer welfare W is simply:
2212
21
11
)1)(1()1(
)()1()(
fm
cf
cm
cscs
dxcxsdxcxsWtm
(16)
The public policy problem is making investments Im and If that best promote social welfare given the nature of consumer demand and the technology and costs of the two modes of delivery. We ignore the issue of product market competition, since introducing it will introduce complexity without changing our main conclusion. Given welfare maximization (or perfect competition), we can assume that buyers pay prices equal to costs (cm and cf ). As will be explained below, adding market imperfections at the retail stage will not change the qualitative conclusions.
Given the above, we may directly insert the cost/price and investment relationships given by (14) and (15) into (16) to obtain our objective equation, which the public authorities will act to maximize by their investment behavior:
2212
21 )]()[1()]()1[( fm IfsIfsW such that III fm . (17)
Social welfare maximization is the assumed goal of the regulatory authority. At this point, we take this just to mean that investments are allocated to maximize the expression in Equation (17). The setup so far ignores several relevant issues, including the possible existence of social premia (i.e., external effects or
56 The curvature of g will indicate the degree of scale effects in cost-reducing investment spending, and presumably investments in broadband infrastructure, like all sorts of investments, exhibit diminishing returns.
52 PHOENIX CENTER POLICY PAPER [Number 36
Phoenix Center for Advanced Legal and Economic Public Policy Studies www.phoenix-center.org
externalities) attached to various broadband technologies. We will address this in more general terms below. At this point, we consider the optimal investments plan based solely on Equation (17).
First, it is clear that maximization of Equation (17), subject to the condition that Im + If = I, will typically yield interior solutions (that is, investment is made in both modalities and not just one), so that both modes of broadband connectivity, m and f, will be supported in any optimal plan. This is unsurprising when it is recognized that the different means of broadband delivery will, to some extent, satisfy differing wants and serve different purposes. Further, as the costs of provision will differ, efficiency will almost always involve some combination of technologies unless one strongly dominates the other, an unlikely circumstance. More to the point, it will almost never be optimal for a public authority to invest solely in traditional broadband, ignoring m infrastructure or support. This conclusion is not altered by the addition of complexities such as interdependent demands or common service provision or cost components. It depends instead merely on the recognition that, if two services are non-identical from consumers’ points-of-view, and one does not dominate the other in a very strong cost sense, then optimal investment will imply both are supported to some degree.
What, though, can we say about the optimal investment plan, and its relationship to cost differences and the relative sizes of the consumer blocs favoring one or another mode of broadband? Performing the maximization calculation, we obtain the optimality condition:
)()]()[1()()]()1[( ****ffmm IfIfsIfIfs (18)
Some light can be shed on the interpretation of this requirement by assuming a simple, conventional form for the cost reduction function g. In particular, suppose that xxg )( , where is a cost parameter given by the technology and not subject to choice by the regulators.57 The square-root form implies decreasing returns to investment, and is a common, simple assumption to illustrate that phenomenon. Given this functional form, we can explicitly solve for the optimal levels of investment, simplifying interpretation. We obtain:
212* 1)1( ss
mI (19)
57 This form leads to a closed form solution for Equation (10).

Summer 2009] BROADBAND ADOPTION INDEX 53
Phoenix Center for Advanced Legal and Economic Public Policy Studies www.phoenix-center.org
Equation (19) sheds considerable light on the basic effects of demand and costs on the optimal investment plan, despite the simplicity of the analysis.58 First, optimal m modality investment is decreasing in )0/( * mI . This implies that m modality investment, which is generally positive as explained earlier, is sensitive to the costs of m broadband services. As a consequence of the investment budget relationship in Expression (13), we further have a positive relationship between If* and . Finally, optimal welfare W* decreases in .59
What the analysis has shown is that the harms from using a single modality’s penetration, say modality f, as a policy success indicator, or a benchmarking standard, are severe. To see this, let us suppose we had two countries (Country 1 and 2) with slightly different m modality cost structures, given by the parameter values 1 and 2, where 2 > 1 by some small amount. Suppose further that these countries were otherwise identical. In this case, we would observe that Country 2 would have higher f modality penetration than Country 1. Given the typical response to broadband rankings, the argument would be that Country 2 was superior to Country 1. Yet, Country 1 would have higher welfare using the same investment budget. This result illustrates clearly that indices based on a single broadband modality alone may render conclusions as to broadband policy success which are not merely misleading, but actually perverse.
B. Caveats and Discussion
The theoretical analysis presented above contains a number of strong, simplifying assumptions. However, the conclusions our analysis suggest are not dependent on the apparent strength of the assumptions. Surely, more realistic models will render somewhat more nuanced results, but the central conclusion that a narrow focus on fixed broadband as an indicator of “success” in the current policy debate is misguided.
While the reality faced by policymakers is indeed more complex than the model given above, reflection shows that complications of these sorts will not, and cannot, overturn the basic character of the findings. Common components to costs, values, and so on, will not cause the optimal investment in alternate
58 Note that ∂Im*/∂ < 0. The budget constraint in Equation (6) forces ∂If*/∂ > 0, and the envelope theorem applied to Equation (10) yields ∂W*/∂ < 0.
59 Higher costs reduce welfare.

54 PHOENIX CENTER POLICY PAPER [Number 36
Phoenix Center for Advanced Legal and Economic Public Policy Studies www.phoenix-center.org
broadband modalities, such as mobile broadband, to become zero, nor will traditional broadband penetration measure the welfare of society. Even if there are social premia attached to these different services, even of varying magnitudes, then again the basic nature of the findings will not change unless such benefits are so large that any other modality but fixed becomes uneconomic. This seems to us extraordinarily unlikely and incompatible with the evidence. Rather, any index that seeks to allow meaningful comparisons between countries in broadband deployment performance, or is intended to be useful in benchmarking exercises, or for funding decisions, cannot ignore any type of broadband technology in cases where the technologies offer non-identical services at non-identical costs. We have proposed such an index in the BAI.
VI. Policy Recommendations
The Broadband Adoption Index (“BAI”) is a policy-relevant and economically-meaningful measure of broadband adoption that can be used in the presence of multiple connection modalities. We have demonstrated here how the BAI can be computed using econometric analysis and cost data. Nevertheless, we recognize that it is a complex measurement tool with copious data requirements. As a result, in this Section we discuss some policy recommendations that flow from our proposal that countries, even without a rich amount of broadband deployment and adoption data, can follow.
To some extent, the fact that the data needed to compute the BAI is complex and data intensive is basically and essentially our point. The optimal way to diffuse broadband technologies into a society in a way that maximizes economic and social welfare is complicated—it should not reduced to simplistic calculations. The figures used by policymakers today—most notably the OECD broadband “rankings” of fixed connections per population—are woefully inadequate and should not serve as the basis for formulating broadband policy. As we have shown in prior research, Turkey and Portugal are not significantly “worse” in broadband adoption than Japan because demographic and economic conditions between those three countries vary significantly. The problem with the simplistic rankings system published by the OECD is that it creates an artificial incentive or expectation for countries that rank toward the bottom to emulate the public policies of those in the top. In reality, each society will have its own unique mix of adoption rate, technology mode, and availability that will maximize social value of broadband for that society. Achieving this optimum

Summer 2009] BROADBAND ADOPTION INDEX 55
Phoenix Center for Advanced Legal and Economic Public Policy Studies www.phoenix-center.org
mix that maximizes net social value—not one’s OECD “rank”—is the appropriate role of public policy.60
Based on this analysis, we view one possible starting point for a country might be to consider the establishment of a realistic set of “targets” for broadband availability and adoption. These targets should be calculated by reference to key demographic and economic conditions in the country, as prescribed by the BAI analysis. The output of such an analysis, however, may be simple quantity targets. This approach is sensible from a practical perspective, and some countries have already adopted such an approach.61
For instance, Portugal’s National Broadband Initiative, launched in 2003, recognizes seven primary challenges to broadband deployment and adoption in Portugal:
(1) Low computer penetration;
(2) Large geographic areas with limited or no broadband access;
(3) Scarce and unattractive broadband content;
(4) High costs;
(5) Small perception of value for broadband among potential users;
(6) Reduced knowledge of Information Technology among population; and
(7) A trend of reduced IT investment by companies in Portugal.
60 See, e.g., In the Matter of Inquiry Concerning the Deployment of Advanced Telecommunications Capability to All Americans in a Reasonable and Timely Fashion, and Possible Steps to Accelerate Such Deployment Pursuant to Section 706 of the Telecommunications Act of 1996, FIFTH REPORT, FCC 08-88, __ FCC Rcd __ (rel. June 12, 2008) at ¶ 71 (“Fundamentally, [PHOENIX CENTER POLICY PAPER NO. 29 and others] demonstrate the value of understanding the broader context when making comparisons regarding broadband deployment and adoption. Indeed, the priority the Commission places on continuing to promote broadband deployment will remain, as intended by section 706, regardless of the United States’ ranking on any particular metric.”).
61 As noted supra n. 8, the United States’ American Recovery and Investment Act generally requires the Federal Communications Commission to develop broadband benchmarks.

56 PHOENIX CENTER POLICY PAPER [Number 36
Phoenix Center for Advanced Legal and Economic Public Policy Studies www.phoenix-center.org
In response, Portugal’s adopted broadband objectives directly tied to those challenges. The goal was not to “rank” in the “top ten” of the OECD but instead to achieve:
(1) 50% of households with access to broadband;
(2) Greater than 50% of businesses with broadband access;
(3) 100% of Central Government institutions with broadband access;
(4) 100% of hospitals with broadband access;
(5) Improve the number of students with access to PCs; and
(6) Increase public access to public Internet locations (16 per 100 POP).62
The current ConnectingPortugal initiative contains similar goals:
(1) Double the number of regular Internet users to 60%;
(2) Achieve at least 50% household broadband adoption;
(3) Increase number of computers in schools to one per five students;
(4) Ensure that the price for broadband Internet access available to a majority of the population is among the three lowest in the EU.63
These are very specific and targeted goals that are rooted in and directed at the specific economic and demographic conditions of Portugal. They present a far more meaningful method of assessing the success of broadband policy by reference to whether Portugal has achieved “top 10” status in the OECD broadband rankings.
For broadband policy to be effective, the desires for deployment and adoption should be tempered by realistic expectations and challenges when establishing targets. In the United States, for example, recent evidence suggests
62 See UMIC, Portugal’s Broadband Strategy (Jul. 2003) (available at: http://ec.europa.eu/information_society/eeurope/2005/doc/all_about/broadband/bb_content/portugal.ppt).
63 ConnectingPortugal: A Program of Action in the Portuguese Government (Jul. 2005) (available at: http://www.infosociety.gov.pt/conn_pt.pdf) at 15.

Summer 2009] BROADBAND ADOPTION INDEX 57
Phoenix Center for Advanced Legal and Economic Public Policy Studies www.phoenix-center.org
that nearly 70% of adults not using broadband today (about 22% of all adults) have no interest at all in broadband service or lack the requisite skills for it, irrespective of price.64 With this reality, the choice of broadband target by U.S. policymakers needs to reflect such indifference by a substantial number of the population. While there is some evidence that education can successfully improve adoption, such education is costly, and at some point the costs of spurring broadband adoption in marginal groups relative to the perceived benefits must be considered.65 Every dollar spent on pushing broadband access is a dollar counted against its benefits, and if the government is doing the spending, the social cost of government funds (the dead weight loss of taxation) should be considered.66 Portugal, faced with a similar challenge of indifference by much of the population, chose to invest a significant amount of its efforts in connecting schools and educating children in the use of computers. It has also been focused on home computer ownership in households with school age children, offering a tax credit of €250 for computer purchases by such households and distributing computers for free to low income children.67 The payoff for such a policy decision is not a higher rank in the OECD semi-annual report, since the policy will likely reduce Portugal’s rank as long as mobile broadband is excluded from the data as a connectivity technology. Portugal’s return is reaped over the long-term, as the policy ensures that its future population is technologically sophisticated.
Nor can it be ignored that broadband access may have significant social value if it is be available to persons who do not purchase their own connection. Free access at libraries and public Internet centers can generate significant economic returns—even if those connections are shared among dozens, if not hundreds, of citizens. Portugal, for instance, has a very aggressive program for public Internet spaces such as these and has the goal of doubling them from 2005-2009.68 It is very possible that a combination of a personal mobile broadband device along
64 J. Horrigan, Obama’s Online Opportunities II, supra n. 17.
65 Organizations like Connected Nation in the U.S. have shown success along these lines.
66 Government expenditures are financed by taxation, and taxation is costly, so the full social cost of a dollar of spending exceeds one dollar. H. Kleven and C. Kreiner, The Marginal Cost of Public Funds in OECD Countries: Hours of Work versus Labor Force Participation, CESIFO WORKING
PAPER NO. 935 (April 2003)(available at: http://ssrn.com/abstract=404582).
67 ConnectingPortugal, supra n. 63 at 17. Portugal also has policies directed at developing the market for used computers.
68 Id.

58 PHOENIX CENTER POLICY PAPER [Number 36
Phoenix Center for Advanced Legal and Economic Public Policy Studies www.phoenix-center.org
with shared access at a public Internet location may generate substantial value for a significant amount of the population, particularly the poor. The combination may even be potent enough that many low-income households choose not to subscribe at home. Indeed, if quality library access reduces home subscriptions by the poor, then this may well indicate a successful broadband strategy, rather than a failed one. The goal is to achieve a desired level of quality access at the lowest possible costs, consistent with the preferences of end users. And yet, a successful program such as this would be penalized in the OECD broadband rankings.
In sum, when comparing broadband adoption and policies across countries, the analysis must begin to incorporate the demographic and economic differences among these societies. Unlike any other measurement we have seen, the BAI is designed to take these realities into account. For example, a household subscription rate of 50% in a relatively poor and under-educated country may be entirely consistent with a highly successful broadband program, whereas in a relatively rich and educated country it may suggest failure. Comparing countries such as Turkey or Mexico to Sweden or Luxembourg without any account of the economic and demographic differences between them is nonsense and provides no meaningful indication of the success or failure of broadband policy or of the adequacy of Internet infrastructure. If anything, we hope that our outline of the BAI approach will raise the level of analysis when it comes to assessing broadband adoption and adopting broadband policies. Policies should be directed at leveraging or ameliorating the demographic and economic conditions that affect broadband adoption, and those conditions vary across countries and societies.
VII. Conclusion
Countries around the world are increasingly concerned as to whether the adoption of broadband technology in their economies is sufficient to support economic growth. Unfortunately such concerns are often expressed in terms of where a country ranks among its peers by means of raw adoption numbers, which are often misleading and incomplete—particularly with regard to mobile broadband service, which is affirmatively not counted by the OECD broadband computations.
In this PAPER, we take a decidedly different and more policy-relevant approach. We outline a value-based Broadband Adoption Index (“BAI”), which compares the actual value to society that results from the adoption of broadband technology to the optimum target value of adoption. This target level of adoption will vary from country to country and is a function of the social value
Summer 2009] BROADBAND ADOPTION INDEX 59
Phoenix Center for Advanced Legal and Economic Public Policy Studies www.phoenix-center.org
of broadband connectivity, measured as the difference in the social benefits and costs of broadband. The BAI is specifically designed to accommodate and include the value of different connection modalities, like mobile broadband, into a single index. Merely summing the number of broadband connections—and making arbitrary decisions as to whether to include one form of broadband access over another—will not provide useful insight for policy guidance. Policymakers ought to be interested in maximizing the net social value that their societies receive from adopting broadband technology, by any means or connection technology possible.
We recognize that calculating the BAI as we have proposed it would require governments to collect a substantial amount of data on subscription, availability, speed, and prices based on technology that many governments do not currently collect. But this is essentially our point—policymakers that want to maximize the social and economic impact of broadband in their countries cannot and should not satisfy themselves with the simple, easy to measure yet generally inadequate adoption “rankings” published by the OECD and ITU. If policy is to be directed at maximizing social value, then collecting information that reveals an accurate measurement of the value that broadband infrastructure offers society is worth the effort.
The information requirements for a basic implementation of the BAI include, at a minimum, customer or household specific data broken down by broadband connection technology on the following: (a) services available and purchased; (b) market prices for such services; (c) demographic data on the unit of observation; (d) cost estimates for each broadband connection technology; and (e) the constituent services offered by each broadband connection technology (e.g., Email, video streaming) and the relative private value placed by consumers on those constituent services. These data can be used to estimate both the private benefits and costs of each form of broadband connection technology.
It is important to note, however, that private benefits can only point in the direction of the overall social value of broadband adoption. A complete and rigorous approach will require additional data that would allow one to calculate the social premia of each broadband connection technology and constituent service. These data are likely to be more difficult to come by, requiring the analyst to, for example, calculate the value to society of better-educated schoolchildren or healthier citizens—the social value of broadband not necessarily reflected in private value calculations.
As a result, some heavy lifting is required to establish economically meaningful broadband adoption targets. In doing so, it is important to keep in

60 PHOENIX CENTER POLICY PAPER [Number 36
Phoenix Center for Advanced Legal and Economic Public Policy Studies www.phoenix-center.org
mind that the selection of the target may ease implementation of adoption measurement. For example, it is possible to define the target in terms of a penetration or adoption rate, perhaps even in per-capita terms, as long as these target adoption rates are based on economically meaningful concepts, and the penetration of the target rates account for the net benefits of existing and potential connections (see the discussion at Figure 6). We believe that adoption of a BAI approach would necessarily lead policymakers to establish a set of targets for deployment and adoption that vary by connection mode. The mixture of technologies deployed will vary from country to country, for a variety of demographic and economic reasons. Optimizing the mix of connection technologies goes beyond the issue of population density. For instance, a country like Portugal with relatively low computer ownership should recognize that given that condition, a mobile broadband network will generate significantly more social value than it would in a country in which computer ownership is much higher.
In the end, we hope policymakers will, at a minimum, take into account aspects of the BAI approach in making broadband policy, at least with regard to the information they may seek to collect and the statistics to which they pay attention when making policy decisions. Each country should evaluate the success (or failure) of their own broadband policies, which affect all demographic groups and include all forms of access technologies, based upon value that broadband offers to their own society, without reference to the outcomes in other countries that face their own set of unique characteristics. Success in broadband policy should be measured in terms of the wellbeing of society, and not in terms of the relative positions of raw subscription counts. In our opinion, this is a fundamental and necessary change in the way policymakers think about broadband. While it will require a commitment to compile and analyze the relevant data required for a complete BAI social value analysis, such efforts would be a positive step forward and raise the analysis to a level commensurate with the importance of broadband deployment and adoption in modern society.