bryant ranch elementary school sarc bryant ranch elementary school school mission statement the...
TRANSCRIPT
our teachers
our school
our message
Placentia-Yorba Linda USD
Bryant Ranch Elementary
School2014-15
School Accountability Report Card
Published in 2015-16
Doug Domene, Superintendent • [email protected] • Phone: (714) 986-7000
Placentia-Yorba Linda Unified School District • 1301 East Orangethorpe Avenue Placentia, CA 92870 • www.pylusd.org
Dominique Polchow Principal
24695 Paseo de Toronto Yorba Linda, CA 92887
Grades: PK-5 Phone: (714) 986-7120
www.bryantranchschool.com
CDS Code: 30-66647-6109102
Para español, visita: www.pylusd.org
2
Governing BoardEric Padget, President
Judi Carmona, Vice President
Karin Freeman, Clerk
Carrie Buck, Trustee
Carol Downey, Trustee
Superintendent’s MessageDear PYLUSD community,
Orange County historians tell us that the Placentia School District dates back to 1878; Yorba Linda School District formed about 40 years later in 1911. Pioneers in those early years established one-room school-houses, and with courage, hard work, and clear vision, laid the foundation for the present-day award-winning education system that we enjoy. I am incredibly proud to serve the Placentia-Yorba Linda Unified School Dis-trict as superintendent. Our educational heritage gives me much to be thankful for, as well as a keen desire to be a good steward of all that our schools and students represent and have achieved. Inspired by the past, I welcome all of you to join with me in continuing to build our school communities and equip our students for the future.
In the spirit of building toward the future, our district has undertaken some very important work. We launched The PYLUSD Advantage, a pivotal and significant five-year commitment and plan of action for our school dis-trict. Providing a framework for aligning our organization around core values, The PYLUSD Advantage guides our decision-making, aligns the priorities in our programs, and ultimately ensures that all of our students will receive an outstanding and comprehensive education.
People—our students, first and foremost; our district employees; families; and others in our supportive com-munity—are the heart and soul of the Placentia-Yorba Linda Unified School District. That is clear. To safe-guard this vital commitment and to provide a foundation of educational excellence, we have identified five key Focus Areas.
• AcademicAchievement:We will expect all students to demonstrate academic achievement in order to emerge college and career ready.
• EffectiveInstructionandLeadership: We will continue to support a dynamic and high-quality instructional program to build lifelong habits of learning.
• EngagedCommunity:We will establish a culture that encourages positive relationships among our students, staff, and parents as well as educational and business partners.
• SafeandRespectfulEnvironment:We will foster a safe and respectful atmosphere to promote the emotional health, safety and well-being of students, staff, and parents.
• Optimized Resources:We will ensure that all fiscal and capital resources maximize educational opportunities.
The 2015-16 school year provides us an opportunity to write another chapter of new successes and legacy in the history of our school district. We are grateful for the support of each of you—students, staff members, parents, and the community—as we embark on this important work and look forward with much anticipation to a wonderful year.
Sincerely,
Doug Domene, Ed.D. Superintendent
PYLUSD: Where...
CollaborationCommunicationCritical Thinking
CreativityDigital Citizenship
DiscoveryExcellenceInnovationTeamworkThe Future
Happens!
Placentia-Yorba Linda Unified School District Core ValuesWhat We Stand For and Represent
Excellence
We relentlessly pursue excellence in all academic and organizational endeavors.
Collaboration
We work together with all members of our school community to ensure student success.
Integrity
We foster relationships that promote respect, service, and honesty to ensure the well-being of all students.
Innovation
We embrace a culture that celebrates ingenuity and inspires intellectual exploration.
District Mission StatementWe hold high expectations for all students through rigorous and relevant educational experiences that challenge them to become responsible, ethical, and engaged citizens.
District Vision StatementWe are committed to being a dynamic learning community that prepares each and every student for success now and in the future.

3Bryant Ranch Elementary SchoolSARC
School Mission StatementThe mission of Bryant Ranch Elementary School is to provide differentiated instruction that challenges its students to reach their highest academic potential and to motivate and support students to become self-reliant. Through mutual respect within the total school community, we will facilitate collaboration ensuring a strong and supportive school-to-home connection, where together, we are enthusiastic about the teaching and learning process.
School Accountability Report Card
In accordance with state and federal requirements, the School Accountability
Report Card (SARC) is put forth annually by all public schools as a tool
for parents and interested parties to stay informed of the school’s progress, test
scores and achievements.
Principal’s MessageWelcome to Bryant Ranch Elementary School, where our motto is, “Reflect the Past, Explore the Present, and Invent the Future.” With approximately 575 students in preppy kindergarten through fifth grade, our school encourages children to develop a love for learning in a safe, stimulating and academically challenging envi-ronment. Students, parents and staff work as a team to provide a positive environment where we shape the academic, physical, emotional and social development of our children. This means we recognize individual differences that help students make the transition between learning and living in the 21st century a smooth one. Preparing for the future and helping all students reach their highest potential are our ultimate goals at Bryant Ranch.
The elementary years are critical for development of strong, positive attitudes, habits, capabilities and aca-demic skills. With this in mind, our curriculum is challenging, exciting and creative. Learning is supported through standards-based instruction, direct explicit lessons, technology, enrichment opportunities, indepen-dent thinking, problem solving and inquiry.
As part of our commitment to the community, Bryant Ranch teachers place a high priority on collaboration, professional growth and enrichment opportunities.
Weekly collaboration takes place in both formal and informal settings. Shared leadership and professional empowerment are tenets all Bryant Ranch teachers follow; evidenced in the professional responsibilities as-sumed by a number of staff members, including: team leader, disaster preparedness, STAR testing coordina-tion , technology, Gifted and Talented Education (GATE), and an after-school musical production.
Bryant Ranch is not only continually acclaimed by the community, but was recognized as a California Dis-tinguished School in 1993, 2002 and again in 2006. In 1994, the school was also honored with the National Blue Ribbon award and received this honor once again in 2003. Our school began simply as a school upon a hill in the farthest point east in our district. Through the combined hard work of parents, teachers, administra-tors, students and the community, Bryant Ranch School has evolved into the proud academic institution that it is today!
School Vision StatementBryant Ranch School will be recognized as an invention center, encouraging students, staff and community members to continually explore their environment. It will be a problem-solving center that encourages lifelong learning.
Bryant Ranch will offer a unique program for students and be an integral part of the greater community. Its fa-cilities, resources and philosophy will meet the varied learning needs and interests of its diverse participants during the school day and through after-school activities. Excited and involved learners of all ages will focus on inventing the future.
Bryant Ranch staff will act to heighten students’ enthusiasm to become lifelong explorers. The active involve-ment of adults as parallel and collaborative learners seeking solutions will be essential in this process.
Bryant Ranch students will be provided programs that will allow them to continually explore the unknown and experience success in their endeavors. Real-life issues will become the catalyst for exploring possible solu-tions and applying a variety of problem-solving methods. Students will experience learning through hands-on activities, use of technology, and active research in independent and cooperative settings.
These ideas and resources will empower students of Bryant Ranch to focus on knowledge acquisition and creation of new ideas supported by technology. Home and school will work collaboratively to extend the physi-cal base for learning. A nurturing, encouraging and caring environment will propel our lifelong learners along their educational journey as they “Reflect the Past, Explore the Present, and Invent the Future.”
Value Statements• A positive and caring environment
promotes intellectual curiosity, encourages creativity, and provides a balance between teamwork and independence.
• Promoting high self-esteem is the foundation for all school programs.
• Students and staff pride themselves in putting forth their best effort.
• There is a strong sense of community awareness and responsibility.
• Students are provided opportunities to learn about and appreciate the cultural diversity within our community.
• Cooperation among staff, parents and students encourages open communication and mutual support.
• Learning is celebrated as a lifelong experience.
• Students are recognized for striving toward academic success and appropriate behavior.
• Programs are provided that meet individual student needs.
• Schoolwide programs focus on developing a healthy mind and healthy body.
• Everyone is special.
School DescriptionSince opening its doors in 1990, Bryant Ranch has the reputation for being a community hub of innovation and exploration, where adults and students are nurtured in a caring environment to become lifelong learners. Bryant Ranch is located in an upper-middle-class neighborhood with homes, condominiums and apartment complexes in what used to be a sprawling California ranch. Many parents tell us they moved into the Bryant Ranch attendance area specifically for the school’s excellent reputation of high academic performance, the meeting of student needs and service to its community. Bryant Ranch serves approximately 592 students, preppy kindergarten through fifth grade.
“Bryant Ranch will offer a unique program for students and be an integral part of the greater community.”
4
“Bryant Ranch staff will act to heighten students’ enthusiasm to become
lifelong explorers.”
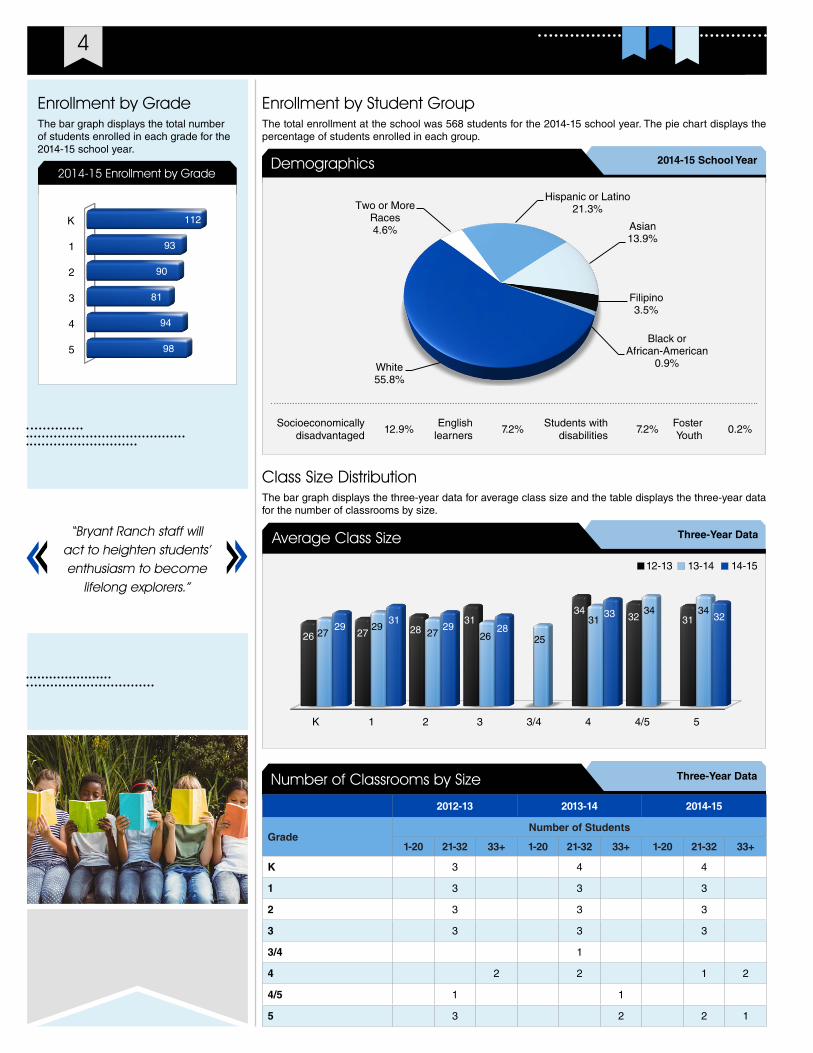
Three-YearDataNumber of Classrooms by Size
2012-13 2013-14 2014-15
GradeNumberofStudents
1-20 21-32 33+ 1-20 21-32 33+ 1-20 21-32 33+
K 3 4 4
1 3 3 3
2 3 3 3
3 3 3 3
3/4 1
4 2 2 1 2
4/5 1 1
5 3 2 2 1
Class Size DistributionThe bar graph displays the three-year data for average class size and the table displays the three-year data for the number of classrooms by size.
Three-YearDataAverage Class Size
13-1412-13 14-15
K 1 2 3 3/4 4 4/5 5
26 27 2831
3432 31
2729
27 26 25
3134 34
2931
29 28
33 32
Enrollment by Student GroupThe total enrollment at the school was 568 students for the 2014-15 school year. The pie chart displays the percentage of students enrolled in each group.
2014-15SchoolYearDemographics
Socioeconomically disadvantaged
12.9%English
learners7.2%
Students with disabilities
7.2%Foster Youth
0.2%
Hispanic or Latino21.3%
Asian13.9%
Filipino3.5%
Black or African-American
0.9%White55.8%
Two or More Races4.6%
Enrollment by GradeThe bar graph displays the total number of students enrolled in each grade for the 2014-15 school year.
2014-15 Enrollment by Grade
K
1
2
3
4
5
112
93
90
81
94
98
5Bryant Ranch Elementary SchoolSARC
Parental InvolvementWe have an extremely active PTA, priding itself on strengthening the school by providing more than 30 sup-port programs and enrichment opportunities for parents and students. The community’s interest in Bryant Ranch is evidenced by the 7,000 annual volunteer hours and the 98 percent attendance at Back-to-School Night.
Bryant Ranch has been a key element and central hub in serving the neighborhood community for the past two decades. We have always encouraged parents to be very involved in their child’s education. PTA leader-ship is active in recruiting volunteers for the classrooms, library, computer lab and office. Parents volunteer weekly on campus, assisting individuals or small groups of students and helping teachers prepare future lessons. They create a wonderful educational partnership by sharing their time and talents. Bryant Ranch par-ent, Stacey Carlos stated, “The Bryant Ranch team is not only a part of our community, but part of our family. They go far beyond my expectation, especially in extra learning activities for our children.”
There are a variety of opportunities for community members to become involved with Bryant Ranch, includ-ing Art Masters, Parent Education Nights, Reflections Contest, Math to Achieve, Read Naturally, Labels for Education and Box Tops for Education, School Site Council, Multiplication in a Week, Math Labs, Science Nights, Gold Rush and Colonial Days, Red Ribbon Week, assemblies, school spirit clothing sale, Community Discount Cards, silent auction, book fair, Jog-a-Thon, PTA, Ranchero Day (year-end carnival), yearbook, Ac-celerated Reader, and the Business Partners Program. Connections to local police and fire departments are established to stay current with policies and procedures in regards to our Disaster Preparedness Programs.
Volunteerism is one of the hallmarks of Bryant Ranch. Sign-up sheets go home at the beginning of the year with a checklist for each committee. Volunteers are asked to sign in at the Volunteer Desk in the school office and to wear ID badges while on campus. Orientations for the library, computer lab and classroom volunteers are scheduled each September. Each day, parents become partners in the learning process by assisting teachers with small group instruction, tutoring, materials preparation and supervising student activities.
At Bryant Ranch, we pride ourselves on our community like atmosphere. Frequent communication provides parents with many opportunities to be involved in, and have knowledgeable about their child’s education. Tuesday Envelopes, organized and implemented by a zealous group of volunteers, are distributed on a weekly basis. Each envelope contains a letter from the administration, “Tuesday Letter,” regarding current is-sues in education with information about upcoming events and opportunities for involvement. Every quarter, the PTA produces a newsletter, PTA Explorer, which covers current happenings in the school and community.
All of our school happenings can be accessed through email as well. During the year, parents, family and community members are invited to informal gatherings called Principal’s Coffees and Parent Education Nights. This provides another opportunity to discuss educational issues. Contact Alison Kenney, PTA presi-dent, at [email protected].
For more information on how to become involved at the school, please contact the PTA president at (714) 986-7120.
School SafetySpecial care is taken to ensure student safety at all times. Each year, members of the school’s safety and behavior committees, in compliance with state Senate Bill 187, review and update a comprehensive Safe School Action Plan. This comprehensive safety plan consists of three components: 1. All students and staff members are provided a safe teaching and learning environment; 2. all students are safe and secure while at school and are aware of safety issues regarding ingress and egress; and 3. district programs and community resources are available to students and parents. The school safety plan was last reviewed, updated and dis-cussed with school staff in October, 2015
Monthly fire drills are conducted as well as quarterly earthquake and disaster drills. Once a year, a full-scale mock disaster drill and two lockdown drills are held and evaluated by the local fire department. Safety proce-dures are reviewed and communicated through the weekly newsletters and parent education nights. Safety is a combined responsibility of students, staff, parents and district personnel. Safety concerns have been minimal due to this collaboration, and issues regarding safety are identified before becoming a concern. The surrounding community can report concerns directly to the school office during the day and a 24-hour emergency phone number is posted on the school windows and published in the newsletter to report safety issues after the school day.
Other activities that promote school safety include: safety assemblies, behavior assemblies, Student Valet Safety Program, social groups, antibullying assemblies and training in conflict management. Additionally, school personnel supervise playground and campus areas before and after school as well as during recess and lunch. In order to maintain assurances that school is a safe environment, an Emergency Disaster Plan has been developed in cooperation with teaching and classified staff, local community members, parents, and the local police and fire departments and is a part of the site’s Safe School Plan.
This comprehensive plan includes clearly written and communicated procedures for fire drills, earthquake drills, intruder lockdown drills, major disasters with injuries and a map for evacuation. Every staff member is trained and assigned to a team to perform duties in the event of a real disaster. A large supply of medical materials, water, and food are stored on-site. Once a month, students and staff participate in a drill to prac-tice procedures and safety techniques. A comprehensive exit plan was developed after the November 2008 wildfires occurred at Bryant Ranch. This includes exit areas, phone procedures and a safe evacuation center off the hill in case of an emergency. A security fence is currently being proposed in response to heightened safety concerns based on recent events in the country.
Continued on sidebar
School SafetyContinued from left
Positive Behavior Support Plan: A goal of the Bryant Ranch staff is to provide a safe, positive, and nurturing atmosphere that focuses on fairness, trust, communication, and caring. Every student at Bryant Ranch has the right to be safe, respected, able to learn free of disruption, and have a neat and clean environment.
Suspensions and ExpulsionsThis table shows the school, district, and state suspension and expulsion rates for the most recent three-year period. Note: Students are only counted one time, regardless of the number of suspensions.
Suspension and Expulsion Rates
BryantRanchES
12-13 13-14 14-15
Suspensionrates 0.7% 0.2% 0.1%
Expulsionrates 0.0% 0.0% 0.0%
Placentia-YorbaLindaUSD
12-13 13-14 14-15
Suspensionrates 3.6% 3.4% 2.4%
Expulsionrates 0.1% 0.0% 0.0%
California
12-13 13-14 14-15
Suspensionrates 5.1% 4.4% 3.8%
Expulsionrates 0.1% 0.1% 0.1%

6
Federal Intervention ProgramSchools and districts receiving Title I funding that fail to meet AYP over two consecutive years in the same content area (English language arts or mathematics) or on the same indicator enter into Program Improvement (PI). Each additional year that the district or school(s) do not meet AYP results in advancement to the next level of intervention. The percentage of schools identified for Program Improvement is calculated by taking the number of schools currently in PI within the district and dividing it by the total number of Title I schools within the district.
This table displays the 2015-16 Program Improvement status for the school and district. For detailed information about PI identification, please visit www.cde.ca.gov/ta/ac/ay/tidetermine.asp.
2015-16SchoolYearFederal Intervention Program
BryantRanchES Placentia-YorbaLindaUSD
ProgramImprovementstatus Not Title I In PI
FirstyearofProgramImprovement ² 2013-2014
YearinProgramImprovement ² Year 1
NumberofTitleIschoolscurrentlyinProgramImprovement 6
PercentageofTitleIschoolscurrentlyinProgramImprovement 75.00%
California Physical Fitness TestEach spring, all students in grades 5, 7 and 9 are required to participate in the California Physical Fitness Test (PFT). The Fitnessgram® is the designated PFT for students in California public schools put forth by the State Board of Education. The PFT measures six key fitness areas:
1. Aerobic Capacity
2. Body Composition
3. Flexibility
4. Abdominal Strength and Endurance
5. Upper Body Strength and Endurance
6. Trunk Extensor Strength and Flexibility
Encouraging and assisting students in establishing lifelong habits of regular physical activity is the primary goal of the Fitnessgram. The table shows the percentage of students meeting the fitness standards of being in the “healthy fitness zone” for the most recent testing period. For more detailed information on the California PFT, please visit www.cde.ca.gov/ta/tg/pf.
Percentage of Students Meeting Fitness Standards
2014-15SchoolYear
Grade5
Fourofsixstandards 18.9%
Fiveofsixstandards 17.9%
Sixofsixstandards 58.9%
Adequate Yearly ProgressThe federal Elementary and Secondary Education Act (ESEA) requires all schools and districts meet Ad-equate Yearly Progress (AYP) requirements. California public schools and districts are required to meet or exceed criteria in the following four target areas:
• Participation rate on statewide assessments in English language arts and mathematics
• Percentage of students scoring proficient on statewide assessments in English language arts and mathematics
• Attendance rates for schools with enrollment in Transitional Kindergarten through grade eight (TK-8)
• Graduation rate for high schools
The table displays whether or not the school, district, and state met each of the AYP criteria and made overall AYP for 2014-15. For more information, visit www.cde.ca.gov/ta/ac/ay.
2014-15SchoolYearAdequate Yearly Progress Criteria
BryantRanchES Placentia-YorbaLindaUSD California
MetoverallAYP Yes Yes Yes
Metparticipationrate:
Englishlanguagearts Yes Yes Yes
Mathematics Yes Yes Yes
Metpercentproficient:
Englishlanguagearts n n n
Mathematics n n n
Metattendancerates Yes Yes Yes
Metgraduationrate � Yes Yes
� Not applicable. This AYP indicator is only applicable for high schools.
²Not applicable. The school is not in Program Improvement.
Not applicable. Due to the transition to the Smarter Balanced Summative Assessments, the U.S. Department of Education approved the California Department of Education’s waiver request to exclude the percent proficient results from AYP determinations. For more information on the AYP reports, please visit http://data1.cde.ca.gov/dataquest/.
n
7Bryant Ranch Elementary SchoolSARC
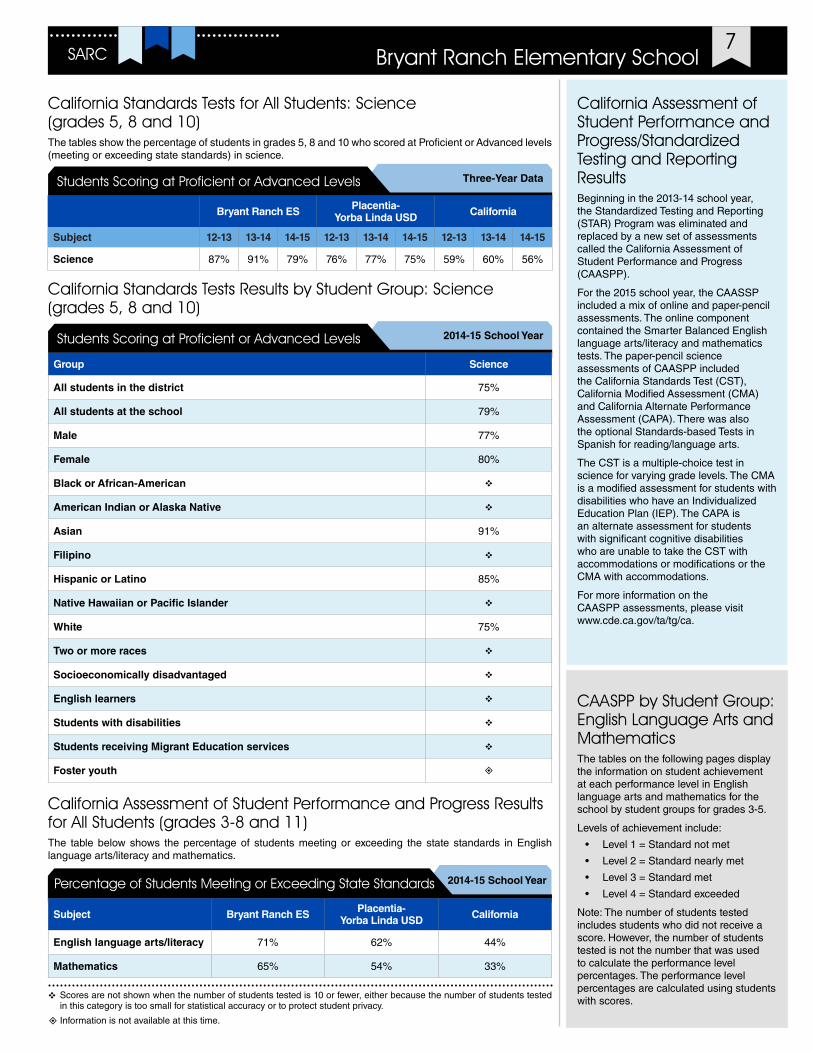
California Standards Tests for All Students: Science (grades 5, 8 and 10)The tables show the percentage of students in grades 5, 8 and 10 who scored at Proficient or Advanced levels (meeting or exceeding state standards) in science.
Three-YearDataStudents Scoring at Proficient or Advanced Levels
BryantRanchES Placentia-YorbaLindaUSD California
Subject 12-13 13-14 14-15 12-13 13-14 14-15 12-13 13-14 14-15
Science 87% 91% 79% 76% 77% 75% 59% 60% 56%
California Standards Tests Results by Student Group: Science (grades 5, 8 and 10)
2014-15SchoolYearStudents Scoring at Proficient or Advanced Levels
Group Science
Allstudentsinthedistrict 75%
Allstudentsattheschool 79%
Male 77%
Female 80%
BlackorAfrican-American v
AmericanIndianorAlaskaNative v
Asian 91%
Filipino v
HispanicorLatino 85%
NativeHawaiianorPacificIslander v
White 75%
Twoormoreraces v
Socioeconomicallydisadvantaged v
Englishlearners v
Studentswithdisabilities v
StudentsreceivingMigrantEducationservices v
Fosteryouth ±
California Assessment of Student Performance and Progress/Standardized Testing and Reporting Results Beginning in the 2013-14 school year, the Standardized Testing and Reporting (STAR) Program was eliminated and replaced by a new set of assessments called the California Assessment of Student Performance and Progress (CAASPP).
For the 2015 school year, the CAASSP included a mix of online and paper-pencil assessments. The online component contained the Smarter Balanced English language arts/literacy and mathematics tests. The paper-pencil science assessments of CAASPP included the California Standards Test (CST), California Modified Assessment (CMA) and California Alternate Performance Assessment (CAPA). There was also the optional Standards-based Tests in Spanish for reading/language arts.
The CST is a multiple-choice test in science for varying grade levels. The CMA is a modified assessment for students with disabilities who have an Individualized Education Plan (IEP). The CAPA is an alternate assessment for students with significant cognitive disabilities who are unable to take the CST with accommodations or modifications or the CMA with accommodations.
For more information on the CAASPP assessments, please visit www.cde.ca.gov/ta/tg/ca.
CAASPP by Student Group: English Language Arts and MathematicsThe tables on the following pages display the information on student achievement at each performance level in English language arts and mathematics for the school by student groups for grades 3-5.
Levels of achievement include:
• Level 1 = Standard not met
• Level 2 = Standard nearly met
• Level 3 = Standard met
• Level 4 = Standard exceeded
Note: The number of students tested includes students who did not receive a score. However, the number of students tested is not the number that was used to calculate the performance level percentages. The performance level percentages are calculated using students with scores.v Scores are not shown when the number of students tested is 10 or fewer, either because the number of students tested
in this category is too small for statistical accuracy or to protect student privacy.
± Information is not available at this time.
California Assessment of Student Performance and Progress Results for All Students (grades 3-8 and 11)The table below shows the percentage of students meeting or exceeding the state standards in English language arts/literacy and mathematics.
2014-15SchoolYearPercentage of Students Meeting or Exceeding State Standards
Subject BryantRanchES Placentia-YorbaLindaUSD California
Englishlanguagearts/literacy 71% 62% 44%
Mathematics 65% 54% 33%
8
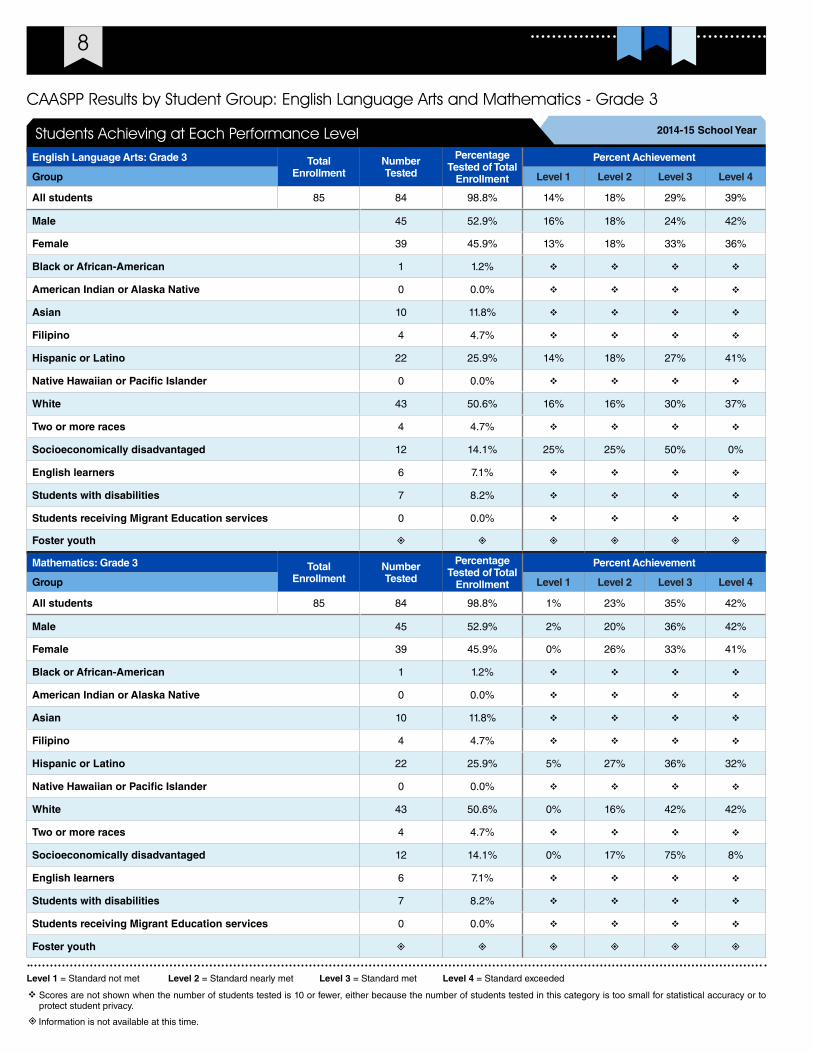
CAASPP Results by Student Group: English Language Arts and Mathematics - Grade 3
Level1 = Standard not met Level2 = Standard nearly met Level3 = Standard met Level4 = Standard exceeded
v Scores are not shown when the number of students tested is 10 or fewer, either because the number of students tested in this category is too small for statistical accuracy or to protect student privacy.
2014-15SchoolYearStudents Achieving at Each Performance LevelEnglishLanguageArts:Grade3 Total
EnrollmentNumberTested
PercentageTestedofTotalEnrollment
PercentAchievement
Group Level1 Level2 Level3 Level4
Allstudents 85 84 98.8% 14% 18% 29% 39%
Male 45 52.9% 16% 18% 24% 42%
Female 39 45.9% 13% 18% 33% 36%
BlackorAfrican-American 1 1.2% v v v v
AmericanIndianorAlaskaNative 0 0.0% v v v v
Asian 10 11.8% v v v v
Filipino 4 4.7% v v v v
HispanicorLatino 22 25.9% 14% 18% 27% 41%
NativeHawaiianorPacificIslander 0 0.0% v v v v
White 43 50.6% 16% 16% 30% 37%
Twoormoreraces 4 4.7% v v v v
Socioeconomicallydisadvantaged 12 14.1% 25% 25% 50% 0%
Englishlearners 6 7.1% v v v v
Studentswithdisabilities 7 8.2% v v v v
StudentsreceivingMigrantEducationservices 0 0.0% v v v v
Fosteryouth ± ± ± ± ± ±
Mathematics:Grade3 TotalEnrollment
NumberTested
PercentageTestedofTotalEnrollment
PercentAchievement
Group Level1 Level2 Level3 Level4
Allstudents 85 84 98.8% 1% 23% 35% 42%
Male 45 52.9% 2% 20% 36% 42%
Female 39 45.9% 0% 26% 33% 41%
BlackorAfrican-American 1 1.2% v v v v
AmericanIndianorAlaskaNative 0 0.0% v v v v
Asian 10 11.8% v v v v
Filipino 4 4.7% v v v v
HispanicorLatino 22 25.9% 5% 27% 36% 32%
NativeHawaiianorPacificIslander 0 0.0% v v v v
White 43 50.6% 0% 16% 42% 42%
Twoormoreraces 4 4.7% v v v v
Socioeconomicallydisadvantaged 12 14.1% 0% 17% 75% 8%
Englishlearners 6 7.1% v v v v
Studentswithdisabilities 7 8.2% v v v v
StudentsreceivingMigrantEducationservices 0 0.0% v v v v
Fosteryouth ± ± ± ± ± ±
± Information is not available at this time.
9Bryant Ranch Elementary SchoolSARC
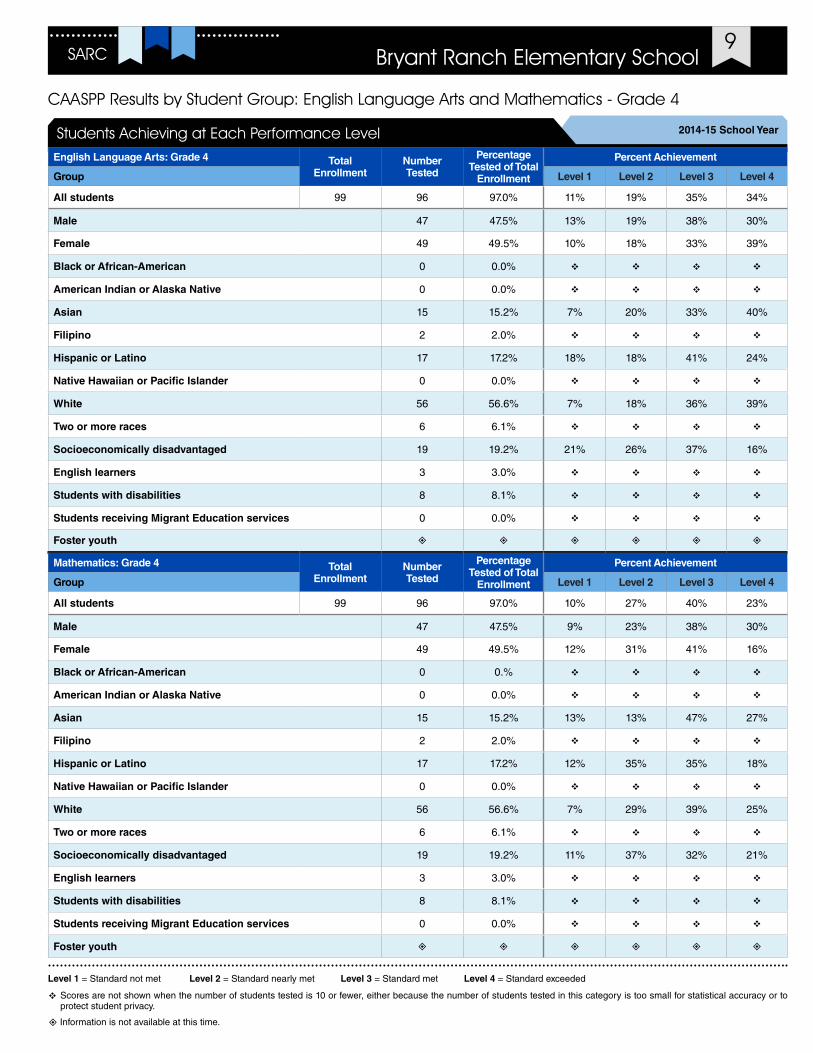
CAASPP Results by Student Group: English Language Arts and Mathematics - Grade 4
Level1 = Standard not met Level2 = Standard nearly met Level3 = Standard met Level4 = Standard exceeded
v Scores are not shown when the number of students tested is 10 or fewer, either because the number of students tested in this category is too small for statistical accuracy or to protect student privacy.
2014-15SchoolYearStudents Achieving at Each Performance LevelEnglishLanguageArts:Grade4 Total
EnrollmentNumberTested
PercentageTestedofTotalEnrollment
PercentAchievement
Group Level1 Level2 Level3 Level4
Allstudents 99 96 97.0% 11% 19% 35% 34%
Male 47 47.5% 13% 19% 38% 30%
Female 49 49.5% 10% 18% 33% 39%
BlackorAfrican-American 0 0.0% v v v v
AmericanIndianorAlaskaNative 0 0.0% v v v v
Asian 15 15.2% 7% 20% 33% 40%
Filipino 2 2.0% v v v v
HispanicorLatino 17 17.2% 18% 18% 41% 24%
NativeHawaiianorPacificIslander 0 0.0% v v v v
White 56 56.6% 7% 18% 36% 39%
Twoormoreraces 6 6.1% v v v v
Socioeconomicallydisadvantaged 19 19.2% 21% 26% 37% 16%
Englishlearners 3 3.0% v v v v
Studentswithdisabilities 8 8.1% v v v v
StudentsreceivingMigrantEducationservices 0 0.0% v v v v
Fosteryouth ± ± ± ± ± ±
Mathematics:Grade4 TotalEnrollment
NumberTested
PercentageTestedofTotalEnrollment
PercentAchievement
Group Level1 Level2 Level3 Level4
Allstudents 99 96 97.0% 10% 27% 40% 23%
Male 47 47.5% 9% 23% 38% 30%
Female 49 49.5% 12% 31% 41% 16%
BlackorAfrican-American 0 0.% v v v v
AmericanIndianorAlaskaNative 0 0.0% v v v v
Asian 15 15.2% 13% 13% 47% 27%
Filipino 2 2.0% v v v v
HispanicorLatino 17 17.2% 12% 35% 35% 18%
NativeHawaiianorPacificIslander 0 0.0% v v v v
White 56 56.6% 7% 29% 39% 25%
Twoormoreraces 6 6.1% v v v v
Socioeconomicallydisadvantaged 19 19.2% 11% 37% 32% 21%
Englishlearners 3 3.0% v v v v
Studentswithdisabilities 8 8.1% v v v v
StudentsreceivingMigrantEducationservices 0 0.0% v v v v
Fosteryouth ± ± ± ± ± ±
± Information is not available at this time.
10
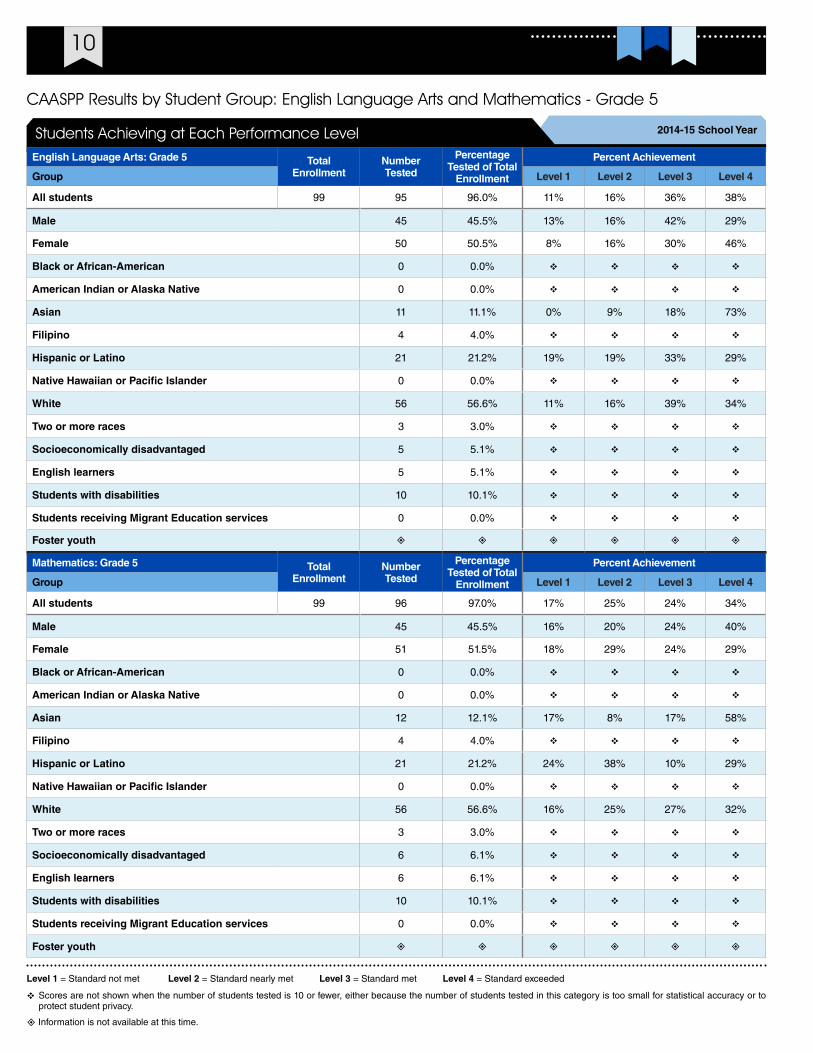
CAASPP Results by Student Group: English Language Arts and Mathematics - Grade 5
Level1 = Standard not met Level2 = Standard nearly met Level3 = Standard met Level4 = Standard exceeded
v Scores are not shown when the number of students tested is 10 or fewer, either because the number of students tested in this category is too small for statistical accuracy or to protect student privacy.
2014-15SchoolYearStudents Achieving at Each Performance LevelEnglishLanguageArts:Grade5 Total
EnrollmentNumberTested
PercentageTestedofTotalEnrollment
PercentAchievement
Group Level1 Level2 Level3 Level4
Allstudents 99 95 96.0% 11% 16% 36% 38%
Male 45 45.5% 13% 16% 42% 29%
Female 50 50.5% 8% 16% 30% 46%
BlackorAfrican-American 0 0.0% v v v v
AmericanIndianorAlaskaNative 0 0.0% v v v v
Asian 11 11.1% 0% 9% 18% 73%
Filipino 4 4.0% v v v v
HispanicorLatino 21 21.2% 19% 19% 33% 29%
NativeHawaiianorPacificIslander 0 0.0% v v v v
White 56 56.6% 11% 16% 39% 34%
Twoormoreraces 3 3.0% v v v v
Socioeconomicallydisadvantaged 5 5.1% v v v v
Englishlearners 5 5.1% v v v v
Studentswithdisabilities 10 10.1% v v v v
StudentsreceivingMigrantEducationservices 0 0.0% v v v v
Fosteryouth ± ± ± ± ± ±
Mathematics:Grade5 TotalEnrollment
NumberTested
PercentageTestedofTotalEnrollment
PercentAchievement
Group Level1 Level2 Level3 Level4
Allstudents 99 96 97.0% 17% 25% 24% 34%
Male 45 45.5% 16% 20% 24% 40%
Female 51 51.5% 18% 29% 24% 29%
BlackorAfrican-American 0 0.0% v v v v
AmericanIndianorAlaskaNative 0 0.0% v v v v
Asian 12 12.1% 17% 8% 17% 58%
Filipino 4 4.0% v v v v
HispanicorLatino 21 21.2% 24% 38% 10% 29%
NativeHawaiianorPacificIslander 0 0.0% v v v v
White 56 56.6% 16% 25% 27% 32%
Twoormoreraces 3 3.0% v v v v
Socioeconomicallydisadvantaged 6 6.1% v v v v
Englishlearners 6 6.1% v v v v
Studentswithdisabilities 10 10.1% v v v v
StudentsreceivingMigrantEducationservices 0 0.0% v v v v
Fosteryouth ± ± ± ± ± ±
± Information is not available at this time.
11Bryant Ranch Elementary SchoolSARC
Availability of Textbooks and Instructional MaterialsThe following lists the percentage of pupils who lack their own assigned textbooks and instructional materials.
2015-16SchoolYearPercentage of Students Lacking Materials by Subject
BryantRanchES PercentageLacking
Reading/languagearts 0%
Mathematics 0%
Science 0%
History/socialscience 0%
Visualandperformingarts 0%
Foreignlanguage 0%
Health 0%
Quality of TextbooksThe following table outlines the criteria required for choosing textbooks and instructional materials.
Quality of Textbooks
2015-16SchoolYear
Criteria Yes/No
Arethetextbooksadoptedfromthemostrecentstate-approvedorlocalgoverning-board-approvedlist?
Yes
ArethetextbooksconsistentwiththecontentandcyclesofthecurriculumframeworksadoptedbytheStateBoardofEducation?
Yes
Doallstudents,includingEnglishlearners,haveaccesstotheirowntextbooksandinstructionalmaterialstouseinclassandtotakehome?
Yes
2015-16SchoolYearTextbooks and Instructional Materials List
Subject Textbook Adopted
Englishlanguagearts The Language of Literature, McDougal Littell 2010
Mathematics Larson Big Ideas: Course 1, Houghton Mifflin Harcourt 2015
Mathematics Larson Big Ideas: Advanced 1, Houghton Mifflin Harcourt 2015
Mathematics Larson Big Ideas: Course 2, Houghton Mifflin Harcourt 2015
Mathematics Larson Big Ideas: Advanced 2, Houghton Mifflin Harcourt 2015
Mathematics Larson Big Ideas: Course 3, Houghton Mifflin Harcourt 2015
Mathematics Big Ideas Math: Algebra 1, Houghton Mifflin Harcourt 2015
Mathematics Big Ideas Math: Geometry, Houghton Mifflin Harcourt 2015
Science Focus on Life Science, California Edition, 2007; Glencoe 2008
Science Focus on Physical Science, California Edition, 2007; Glencoe 2007
History/socialscience Discovering Our Past: Medieval and Early Modern Times, California Edition, 2006; Glencoe
2007
Textbooks and Instructional MaterialsThe assistant superintendent of Educational Services shall appoint a principal or other administrator to chair the districtwide textbook-selection process. A Steering Committee shall be selected and consist of one cer-tificated staff member from each elementary school (elementary ) or at least one teacher from each school from the subject-area department for which adoption is pending (secondary). Appointments to the committee will be based on professional expertise, desire to serve insofar as possible, and the demographic diversity of the district. The Steering Committee shall review materials submitted on state-authorized lists and any other materials which may be considered for adoption. If pilot usage is to be pursued, the Steering Committee shall select the material to be piloted. With or without piloting, the Steering Committee will recommend adoption to the District Curriculum Council, which shall make an adoption recommendation to the assistant superinten-dent of Educational Services. The assistant superintendent is responsible for preparing recommendations for the Board of Education. The most recent public hearing to adopt a resolution on the sufficiency of instructional materials was held in September 2015. Most recently adopted textbooks were chosen from the state-ap-proved list. Textbook content fits within the curriculum frameworks adopted by the State Board of Education. New State Frameworks have been adopted in English language arts and English language development and mathematics to correspond to the Common Core State Standards. New textbooks to align with the Common Core State Standards will be adopted according to the State of California adoption timeline. Mathematics textbooks were adopted in the spring of 2015. English language arts and English language development textbooks will be available for preview in the spring of 2016 for a possible pilot during the 2016-17 school year and recommended for adoption in the spring of 2017 for implementation in 2017-18.
Currency of Textbook DataThis table displays the date when the textbook and instructional materials information was collected and verified.
Currency of Textbooks
2015-16SchoolYear
Datacollectiondate 9/2015

12
Deficiencies and Repairs
School Facility Items Inspected The tables show the results of the school’s most recent inspection using the Facility Inspection Tool (FIT) or equivalent school form. The following is a list of items inspected.
• Systems:Gas systems and pipes, sewer, mechanical systems (heating, ventilation and air-conditioning)
• Interior: Interior surfaces (floors, ceilings, walls and window casings)
• Cleanliness: Pest/vermin control, overall cleanliness (school grounds, buildings, rooms and common areas)
• Electrical:Electrical systems (interior and exterior)
• Restrooms/fountains: Restrooms, sinks and drinking fountains (interior and exterior)
• Safety: Fire-safety equipment, emergency systems, hazardous materials (interior and exterior)
• Structural:Structural condition, roofs
• External: Windows/doors/gates/fences, playgrounds/school grounds
School Facility Good Repair Status This inspection determines the school facility’s good repair status using ratings of good condition, fair condition or poor condition. The overall summary of facility conditions uses ratings of exemplary, good, fair or poor.
2015-16SchoolYearSchool Facility Good Repair Status
ItemsInspected RepairStatus ItemsInspected RepairStatus
Systems Good Restrooms/fountains Good
Interior Good Safety Good
Cleanliness Good Structural Good
Electrical Good External Good
Overallsummaryoffacilityconditions Good
Dateofthemostrecentschoolsiteinspection 8/12/2015
Dateofthemostrecentcompletionoftheinspectionform 8/12/2015
“Bryant Ranch has the reputation for being a community hub of
innovation and exploration, where adults and students
are nurtured in a caring environment to become
lifelong learners.”
School FacilitiesEducation is a top priority in the community of Placentia-Yorba Linda, and maintaining a safe and orderly environment maximizes student learning. Facilities are maintained through the diligent efforts of the site custodial crews and the district maintenance staff. PYLUSD principals work with the custodial staff to develop cleaning schedules to maintain clean and safe schools. District maintenance staff performs the repairs nec-essary in a timely manner to keep the schools in good working order. A work-order process is used to ensure efficient service and that emergency repairs are given the highest priority.
Since opening its doors in 1990, Bryant Ranch has the reputation for being a community hub of innovation and exploration, where adults and students are nurtured in a caring environment to become lifelong learn-ers. The school’s physical facility is well maintained and looks neat and clean. District personnel periodically examine the school’s physical facility and help eliminate obstacles to school safety. Additionally, the health and fire department inspectors contribute to school safety by doing routine inspections. The classrooms are monitored for safety and appearance by the administration and individual classroom teachers. Students take pride in the appearance of the school.
Bryant Ranch Elementary School provides a closed campus with a fence which is locked during school hours. The main building includes the office, mailroom, health office, library, staff workroom and lounge. There are three pods of classrooms located on the primary side of campus, one of which includes the kindergar-ten building, the 100 wing, 200 wing and 300 wing. There are two other pods of classrooms located on the upper-grade campus that is currently being utilized: the 300 wing (upper grade), 300 wing (day care). The 400 and 500 classrooms are vacant and only used on occasion. The Multiuse Room and the computer lab are adjoined with the PTA, music, drama, and kitchen and custodial offices. The playground is separated into three areas: kindergarten, primary and upper grade. Each playground area consists of grass and asphalt.
The primary and upper-grade playground includes basketball courts, ball walls, a climbing apparatus and a field. During the school day, staff members and administration provide campus supervision.
SecurityProcedures
Bryant Ranch Elementary School has established procedures to maintain student safety at all times. To ensure the safety of pupils and staff, upon entering school grounds, visitors sign in and are required to wear a visitor’s badge. At morning drop-off, traffic is monitored by a staff member, and students are greeted by upper-grade valet helpers. Students then enter the campus and “walk around America” on the blacktop area on the playground. After school, teachers are on duty to ensure that students are leaving safely. Additionally, upper-grade valet helpers keep traffic moving. A crossing guard assists children at Camino de Bryant and Via Cantanda.
ASafeandOrderlyEnvironment
The entire comprehensive school safety plan ensures that policies and procedures are in place and are reviewed as needed and/or by law. This comprehensive plan ensures that students are in a safe and orderly environment which is conducive to learning at school.
Deficiencies and RepairsFor all items inspected that were found to not be in “good repair,” a work-order has been created and mainte-nance will be completed before the end of the 2015-16 school year. Maintenance items will be prioritized so that student safety is not compromised.
13Bryant Ranch Elementary SchoolSARC
Professional DevelopmentTo support teachers during the one day of Preservice in August 2014, the topics were chosen based on the need to prepare teachers to continue the transition to and implement the Common Core State Standards (CCSS). Specific focus areas for Preservice in 2014 included unwrapping the English and language arts (ELA) Speaking and Listening standards and the English language development (ELD) Speaking and Listen-ing standards connections in order so that teachers in all disciplines are able to support students in content-area discussions and collaborative conversations . In addition, training was provided on Close Reading and Visual Thinking Strategies in each individual discipline and grade level.
For Preservice training, teachers attend workshop presentations at various sites in grade-level and content-area groupings. Trainers mostly consist of trained district staff with outside presenters as needed and appro-priate. For 2014, the Preservice training was one all-day training.
Follow-up training and support is provided all year long through the district’s Professional Development Acad-emy (PDA) in the form of all-day trainings, site support, and coaching. At the site level, principals lead their teams in data analysis and offer teachers opportunities for staff development in-house (trainings taught by teachers on-site or by the principal), or by inviting district PDA trainers to provide staff development. The PDA offers site leaders training as well through Leadership Learning Series. Discipline and/or grade-level task forces of teachers and leaders have also been established to lead implementation and provide direction and support with curriculum, instruction, and assessment.
2015-16
While the 2015-16 school year did not allow for a devoted professional development day during Preservice for all teachers, many professional development offerings were made available for leaders and teachers in August/summer 2015 and during the school year. A focus area was to ensure that all teachers of mathemat-ics were trained in the newly adopted textbook series. Other training options offered during the summer and school year to support districtwide initiatives included Project Read, Step Up to Writing, Classroom Manage-ment, FOSS Science Kits, Google Basics, Advanced Google training, ActivInspire, ELA/ELD standards and framework, Positive Behavioral Intervention and Supports (PBIS), and AVID/WICOR strategies.
Other avenues for training have included on-site professional development where trained district staff mem-bers provide learning modules for sites during weekly professional learning community (PLC) time. Site lead-ers arrange these trainings with the PDA team.
PDA team members provide collaborative coaching on-site through a collaborative teacher application op-portunity and/or at a principal’s and teacher request. Cognitive coaching techniques are used to help build capacity.
Local Control and Accountability Plan (LCAP) dollars were also used to send teachers and leaders to relevant training and conferences on such topics as Individual Education Program (IEP) Goal Writing to the CCSS, Multi-Tiered System of Supports (MTSS), universal design for learning (UDL), ELA/ELD frameworks launch and materials fairs, AVID, Next Generation Science Standards (NGSS), and California Assessment of Stu-dent Performance and Progress (CAASPP).
Induction training for first- and second-year general education teachers is also provided (formerly known as Beginning Teacher Support and Assessment [BTSA]).
Three-YearDataProfessional Development Days
2013-14 2014-15 2015-16
BryantRanchES 1 day 1 day 0 days
Types of Services FundedIn addition to school site budgets, our school also receives the following supplemental funding:
• School- and library-improvement budget
• PTA gifts funds used for a variety of programs beneficial to the children such as field trips, assemblies, after-school programs, technology resources and other instructional supplies
Public Internet AccessInternet access is available at public libraries and other locations that are publicly accessible (e.g., the Califor-nia State Library). Access to the Internet at libraries and public locations is generally provided on a first-come, first-serve basis. Other use restrictions include the hours of operation, the length of time that a workstation may be used (depending on availability), the types of software programs available at a workstation and the ability to print documents.
“Bryant Ranch students will be provided programs that will allow them to continually explore the unknown and experience success
in their endeavors.”
“Bryant Ranch has been a key element and
central hub in serving the neighborhood community for the past two decades.”
14
Teacher QualificationsThis table shows information about teacher credentials and teacher qualifications. Teachers without a full cre-dential include teachers with district and university internships, pre-internships, emergency or other permits, and waivers. For more information on teacher credentials, visit www.ctc.ca.gov.
Three-YearDataTeacher Credential InformationPlacentia-
YorbaLindaUSD BryantRanchES
Teachers 15-16 13-14 14-15 15-16
Withfullcredential 1,067 20 21 23
Withoutfullcredential 1 0 0 0
Teachingoutsidesubjectareaofcompetence 4 0 0 0
Teacher Misassignments and Vacant Teacher PositionsThis table displays the number of teacher misassignments (positions filled by teachers who lack legal authori-zation to teach that grade level, subject area, student group, etc.) and the number of vacant teacher positions (not filled by a single designated teacher assigned to teach the entire course at the beginning of the school year or semester). Please note total teacher misassignments includes the number of teacher misassign-ments of English learners.
Three-YearDataTeacher Misassignments and Vacant Teacher Positions
BryantRanchES
Teachers 13-14 14-15 15-16
TeachermisassignmentsofEnglishlearners 0 0 0
Totalteachermisassignments 0 0 0
Vacantteacherpositions 0 0 0
Core Academic Classes Taught by Highly Qualified TeachersThe No Child Left Behind Act (NCLB) extended the Elementary and Secondary Education Act (ESEA) to require that core academic subjects be taught by “highly qualified” teachers, defined as having at least a bachelor’s degree, an appropriate California teaching credential, and demonstrated competence for each core academic subject area he or she teaches. The table displays data regarding highly qualified teachers from the 2014-15 school year.
High-poverty schools are defined as those schools with student participation of approximately 40 percent or more in the free and reduced-priced meals program. Low-poverty schools are those with student participation of approximately 39 percent or less in the free and reduced-priced meals program. For more information on teacher qualifications related to NCLB, visit www.cde.ca.gov/nclb/sr/tq.
2014-15SchoolYearNo Child Left Behind Compliant Teachers
PercentageofClassesinCoreAcademicSubjects
TaughtbyHighlyQualifiedTeachers
NotTaughtbyHighlyQualifiedTeachers
BryantRanchES 100.00% 0.00%
Allschoolsindistrict 100.00% 0.00%
High-povertyschoolsindistrict 100.00% 0.00%
Low-povertyschoolsindistrict 100.00% 0.00%
“Reflect the Past, Explore the Present, and
Invent the Future.”
Academic Counselors and School Support StaffThis table displays information about aca-demic counselors and support staff at the school and their full-time equivalent (FTE).
Academic Counselors and School Support Staff Data
2014-15SchoolYear
AcademicCounselors
FTEofacademiccounselors 0.00
Averagenumberofstudentsperacademiccounselor ²
SupportStaff FTE
Social/behavioralorcareerdevelopmentcounselors 0.00
Librarymediateacher(librarian) 0.00
Librarymediaservicesstaff(paraprofessional) 0.00
Psychologist 0.00
Socialworker 0.00
Nurse 0.00
Speech/language/hearingspecialist 0.00
Resourcespecialist(nonteaching) 0.00
² Not applicable.
2013-14 School Accountability Report Card
15Bryant Ranch Elementary School
Data for this year’s SARC was provided by the California Department of Education (CDE), school and district offices. For additional information on California schools and districts and comparisons of the school to the district, the county and the state, please visit DataQuest at http://data1.cde.ca.gov/dataquest. DataQuest is an online resource that provides reports for accountability, test data, enrollment, graduates, dropouts, course enrollments, staffing and data regarding English learners. Per Education Code Section 35256, each school district shall make hard copies of its annually updated report card available, upon request, on or before February 1 of each year.
All data accurate as of December 2015.
School Accountability Report Card
Published by:
www.sia-us.com | 800.487.9234
SARC
Financial Data The financial data displayed in this SARC is from the 2013-14 fiscal year. The most current fiscal information available provided by the state is always two years behind the current school year and one year behind most other data included in this report. For detailed information on school expenditures for all districts in California, see the California Department of Education (CDE) Current Expense of Education & Per-pupil Spending Web page at www.cde.ca.gov/ds/fd/ec. For information on teacher salaries for all districts in California, see the CDE Certificated Salaries & Benefits Web page at www.cde.ca.gov/ds/fd/cs. To look up expenditures and salaries for a specific school district, see the Ed-Data website at www.ed-data.org.
District Financial DataThis table displays district teacher and administrative salary information and compares the figures to the state averages for districts of the same type and size based on the salary schedule. Note: The district salary data does not include benefits.
2013-14FiscalYearDistrict Salary DataPlacentia-
YorbaLindaUSD SimilarSizedDistrict
Beginningteachersalary $39,997 $43,165
Midrangeteachersalary $74,152 $68,574
Highestteachersalary $93,027 $89,146
Averageelementaryschoolprincipalsalary $111,686 $111,129
Averagemiddleschoolprincipalsalary $115,999 $116,569
Averagehighschoolprincipalsalary $125,379 $127,448
Superintendentsalary $233,520 $234,382
Teachersalaries:percentageofbudget 42% 38%
Administrativesalaries:percentageofbudget 5% 5%
School Financial Data
2013-14FiscalYear
Totalexpendituresperpupil $4,634
Expendituresperpupilfromrestrictedsources $268
Expendituresperpupilfromunrestrictedsources $4,367
Annualaverageteachersalary $77,225
School Financial DataThe following table displays the school’s average teacher salary and a breakdown of the school’s expenditures per pupil from unrestricted and restricted sources.
Expenditures Per PupilSupplemental/restricted expenditures come from money whose use is controlled by law or by a donor. Money that is designated for specific purposes by the district or governing board is not considered restricted. Basic/unrestricted expenditures are from money whose use, except for general guidelines, is not controlled by law or by a donor.
Financial Data ComparisonThis table displays the school’s per-pupil expenditures from unrestricted sources and the school’s average teacher salary and compares it to the district and state data.
2013-14FiscalYearFinancial Data ComparisonExpendituresPerPupilFrom
UnrestrictedSources
AnnualAverageTeacherSalary
BryantRanchES $4,367 $77,225
Placentia-YorbaLindaUSD $6,023 $73,852
California $5,348 $72,971
Schoolanddistrict:percentagedifference -27.5% +4.6%
SchoolandCalifornia:percentagedifference -18.3% +5.8%

1
2
Local Control Accountability Plan (LCAP) Requirements Aligned in Your SARCThe tables below outline the state priority areas that are included in the School Accountability Report Card.
Note:State Priority 2 and 7 are not required in the SARC, as well as certain portions of Priority 4 and 5. For detailed information about LCAP and frequently asked questions, please visit www.cde.ca.gov/fg/aa/lc/lcfffaq.asp.
Conditions of LearningThe table below describes information in the SARC that is relevant to the Basic State Priority (Priority 1).
AlignmentBetweenStatePriorityAreasandtheSARCLocal Control Accountability Plan Requirements
ConditionsofLearning
StatePriority:Basic
Degree to which teachers are appropriately assigned and fully credentialed in the subject area and for the pupils they are teaching. Education Code (EC) § 52060 (d)(1)
Pupils have access to standards-aligned instructional materials. EC § 52060 (d)(1)
School facilities are maintained in good repair. EC § 52060 (d)(1)
Pupil OutcomesThe table below describes information in the SARC that is relevant to Pupil Achievement State Priority (Priority 4) and Other Pupil Outcomes State Priority (Priority 8).
Local Control Accountability Plan Requirements
PupilOutcomes
StatePriority:PupilAchievements
Statewide assessments (e.g., California Assessment of Student Performance and Progress). EC § 52060 (d)(4)(A)
The Academic Performance Index. EC § 52060 (d)(4)(B)
The percentage of pupils who have successfully completed courses that satisfy the requirements for entrance to the University of California and California State University, or career technical education sequences or programs of study. EC § 52060 (d)(4)(C)
StatePriority:OtherPupilOutcomes
Pupil outcomes in subject areas such as English, mathematics, social sciences, science, visual and performing arts, health, physical education, career technical education, and other studies prescribed by the governing board.1 EC § 52060 (d)(8)
English, mathematics and physical education are the only subject areas included in Other Pupil Outcomes (Priority 8) that are reflected in the SARC. 1
The school safety plan is the only other local measure of School Climate (Priority 6) that is reflected in the SARC.2
EngagementThe table below describes information in the SARC that is relevant to the Parental Involvement State Priority (Priority 3), Pupil Engagement State Priority (Priority 5) and School Climate State Priority (Priority 6).
AlignmentBetweenStatePriorityAreasandtheSARCLocal Control Accountability Plan Requirements
Engagement
StatePriority:ParentInvolvement
Efforts the school district makes to seek parent input in making decisions for the school district and each school site. EC § 52060 (d)(3)
StatePriority:PupilEngagement
High school dropout rates. EC § 52060 (d)(5)(D)
High school graduation rates. EC § 52060 (d)(5)(E)
StatePriority:SchoolClimate
Pupil suspension rates. EC § 52060 (d)(6)(A)
Pupil expulsion rates. EC § 52060 (d)(6)(B)
Other local measures including surveys of students, parents and teachers on the sense of safety and school connectedness.2 EC § 52060 (d)(6)(C)
AlignmentBetweenStatePriorityAreasandtheSARC