bsheet assignment2
TRANSCRIPT

8/7/2019 BSHEET ASSIGNMENT2
http://slidepdf.com/reader/full/bsheet-assignment2 1/63

8/7/2019 BSHEET ASSIGNMENT2
http://slidepdf.com/reader/full/bsheet-assignment2 2/63
(Rs in Crs)
1,168.01 1,168.0124,816.35 21,879.4025,984.36 23,047.41
2,491.23 3,175.2114,829.01 9,003.3517,320.24 12,178.56
43,304.60 35,225.97
39,869.26 36,388.3016,452.91 14,341.6923,416.35 22,046.61
0 08,733.91 5,286.575,702.46 5,669.22
19,504.82 14,951.085,689.87 3,973.12
446.32 698.0711,453.96 11,251.8837,094.97 30,874.15
20,075.07 16,486.007,262.68 7,880.85
27,337.75 24,366.859,757.22 6,507.30
0 0185.21 158.41
4,490.55 4,442.14-4,305.34 -4,283.7343,304.60 35,225.97
4,959.53 4,200.750.92 1.03
Mar 05 Mar 04

8/7/2019 BSHEET ASSIGNMENT2
http://slidepdf.com/reader/full/bsheet-assignment2 3/63

8/7/2019 BSHEET ASSIGNMENT2
http://slidepdf.com/reader/full/bsheet-assignment2 4/63

8/7/2019 BSHEET ASSIGNMENT2
http://slidepdf.com/reader/full/bsheet-assignment2 5/63
8/7/2019 BSHEET ASSIGNMENT2
http://slidepdf.com/reader/full/bsheet-assignment2 6/63
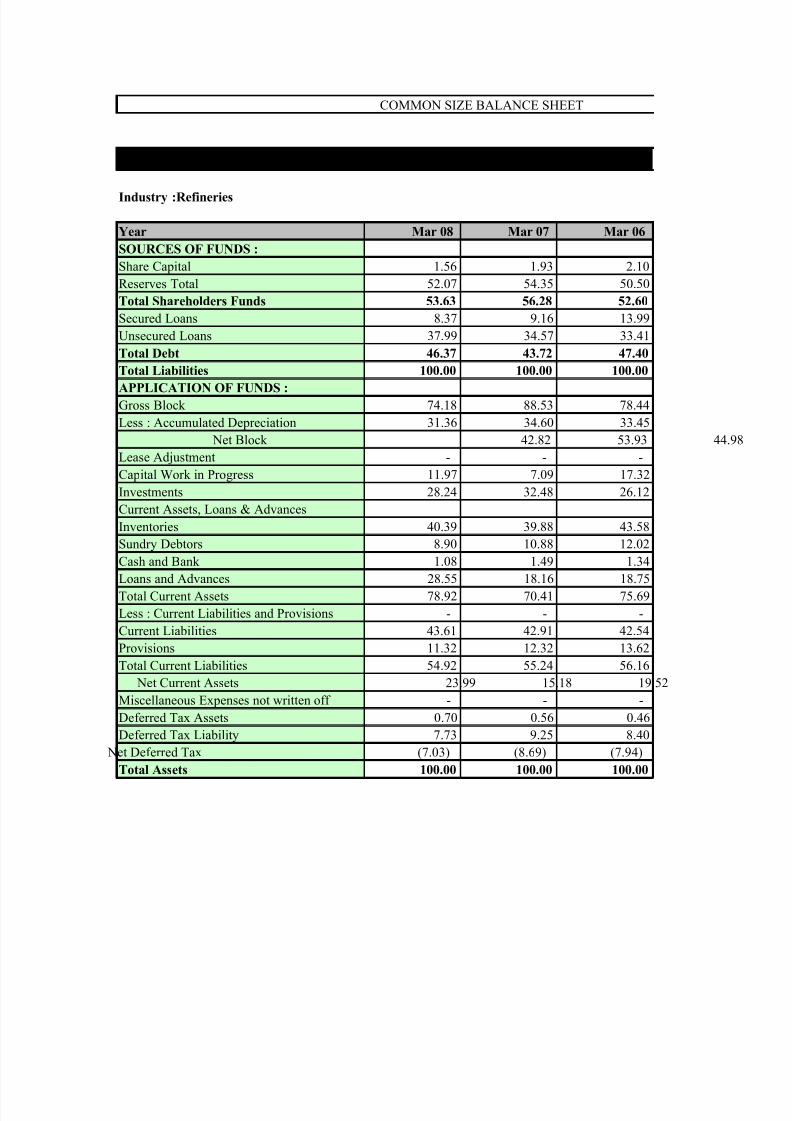
COMMON SIZE BALANCE SHEET
Indian Oil Corporation LtdIndustry :Refineries
Year
SOURCES OF FUNDS :
Share Capital 1.56 1.93 2.10Reserves Total 52.07 54.35 50.50Total Shareholders Funds 53.63 56.28 52.60
Secured Loans 8.37 9.16 13.99
Unsecured Loans 37.99 34.57 33.41Total Debt 46.37 43.72 47.40
Total Liabilities 100.00 100.00 100.00
APPLICATION OF FUNDS :
Gross Block 74.18 88.53 78.44Less : Accumulated Depreciation 31.36 34.60 33.45 Net Block 42.82 53.93 Lease Adjustment - - -Capital Work in Progress 11.97 7.09 17.32Investments 28.24 32.48 26.12
Current Assets, Loans & AdvancesInventories 40.39 39.88 43.58Sundry Debtors 8.90 10.88 12.02Cash and Bank 1.08 1.49 1.34Loans and Advances 28.55 18.16 18.75Total Current Assets 78.92 70.41 75.69Less : Current Liabilities and Provisions - - -Current Liabilities 43.61 42.91 42.54Provisions 11.32 12.32 13.62Total Current Liabilities 54.92 55.24 56.16
Net Current Assets 23.99 15.18 19.52Miscellaneous Expenses not written off - - -Deferred Tax Assets 0.70 0.56 0.46Deferred Tax Liability 7.73 9.25 8.40 Net Deferred Tax (7.03) (8.69) (7.94)Total Assets 100.00 100.00 100.00
Mar 08 Mar 07 Mar 06

8/7/2019 BSHEET ASSIGNMENT2
http://slidepdf.com/reader/full/bsheet-assignment2 7/63
Contingent Liabilities 10.75 11.87 8.97

8/7/2019 BSHEET ASSIGNMENT2
http://slidepdf.com/reader/full/bsheet-assignment2 8/63
(Rs in Crs)
2.70 3.3257.31 62.1160.00 65.43
5.75 9.01
34.24 25.5640.00 34.57
100.00 100.00
92.07 103.3037.99 40.7154.07 62.59
- -20.17 15.0113.17 16.09
45.04 42.4413.14 11.281.03 1.98
26.45 31.9485.66 87.65
- -46.36 46.8016.77 22.3763.13 69.17
22.53 18.47- -
0.43 0.4510.37 12.61(9.94) (12.16)
100.00 100.00
Mar 05 Mar 04

8/7/2019 BSHEET ASSIGNMENT2
http://slidepdf.com/reader/full/bsheet-assignment2 9/63
11.45 11.93

8/7/2019 BSHEET ASSIGNMENT2
http://slidepdf.com/reader/full/bsheet-assignment2 10/63

8/7/2019 BSHEET ASSIGNMENT2
http://slidepdf.com/reader/full/bsheet-assignment2 11/63

8/7/2019 BSHEET ASSIGNMENT2
http://slidepdf.com/reader/full/bsheet-assignment2 12/63
■ The company has improved the utilization of current assets per rupee of fixed assets.
■ (Rs in Crs)Year
Debt 35523.17 27082.69 26404.31 17320.24 12178.56FA 56832.26 54836.96 43694.96 39869.26 36388.3CWIP 9170.22 4394.3 9645.83 8733.91 5286.57FA + Cwip 66002.48 59231.26 53340.79 48603.17 41674.87
Net CA 18381.33 9400.03 10876.77 9757.22 6507.3% FA to long term funds 1.86 2.19 2.02 2.81 3.42
% Net CA to long term funds 0.52 0.35 0.41 0.56 0.53
■ (Rs in Crs)Year
CA 24,024.88 21,431.18 18,635.98 16,452.91 14,341.69CL 21,635.31 20,119.57 14,548.34 5,702.46 5,669.22Current Ratio 1.11:1 1.07:1 1.28:1 2.89:1 2.53:1
Analysis :
■ The size of balance sheet has enhanced by Rs.41,383.45 crores during the period of five yearswhich implies that the company is growing at a fast pace.
■ The company has inclined towards using more shareholders funds than loan funds in financingassets.Over the period of five years there has been 78.27% shift towards shareholders' funds. It isnecessary to appreciate the impact of cost of capital as opportunity cost of shareholders' funds isgenerally higher than the loan funds. the reasons for inclination towards shareholders' funds is ploughing back of profits.
■ There is a continuous growth in fixed assets component and outside investments signifying better fund management. Fixed assets has increased to 56.18% and outside investments increasedto 281.63%, which implies that additional funds are invested in assets on a massive scale.
Mar 08 Mar 07 Mar 06 Mar 05 Mar 04
√ The above trend shows that the company is following a lenient working capital policy.√ It can be observed from the above data that long term funds are being utilised for shortterm purposes as proportion of Fixed assets to longterm funds is on a downward trend,however proportion of working capital to long term funds is increasing.
Mar 08 Mar 07 Mar 06 Mar 05 Mar 04

8/7/2019 BSHEET ASSIGNMENT2
http://slidepdf.com/reader/full/bsheet-assignment2 13/63
√ It can be seen from the above figures that the company is deviating from ideal currentratio(2:1).

8/7/2019 BSHEET ASSIGNMENT2
http://slidepdf.com/reader/full/bsheet-assignment2 14/63
Bharat Petroleum Corporation Ltd
Industry :Refineries
(Rs in Crs)Year
SOURCES OF FUNDS :
Share Capital 361.54 361.54 361.54 300 300
Reserves Total 11,315.30 9,912.00 8,777.88 6,088.43 5,549.72Total Shareholders Funds 11,676.84 10,273.54 9,139.42 6,388.43 5,849.72
Secured Loans 2,730.21 2,593.96 3,071.32 1,173.42 1,973.74Unsecured Loans 12,292.17 8,235.28 5,302.28 2,708.19 715.98Total Debt 15,022.38 10,829.24 8,373.60 3,881.61 2,689.72
Total Liabilities 26,699.22 21,102.78 17,513.02 10,270.04 8,539.44
APPLICATION OF FUNDS :
Gross Block 21,500.93 19,457.58 17,376.84 12,668.84 11,157.96Less : Accumulated Depreciation 9,532.26 8,476.53 7,459.48 5,668.72 5,112.27 Net Block 11,968.67 10,981.05 9,917.36 7,000.12 6,045.69Lease Adjustment 0 0 0 0 0Capital Work in Progress 766.71 852.34 1,168.11 1,348.55 1,407.79Investments 10,318.22 8,294.90 3,889.37 1,677.14 1,976.97Current Assets, Loans & AdvancesInventories 10,603.84 8,661.26 9,044.77 6,258.56 4,286.02
Sundry Debtors 1,608.60 1,518.73 1,315.89 854.58 821.07Cash and Bank 961.59 863.97 492.1 352.39 626.61Loans and Advances 6,533.22 2,586.90 2,448.23 2,915.72 2,607.80Total Current Assets 19,707.25 13,630.86 13,300.99 10,381.25 8,341.50Less : Current Liabilities and ProvisionsCurrent Liabilities 13,594.11 10,200.62 8,894.48 8,820.98 7,523.85Provisions 986.15 1,073.16 512.49 347.01 886.27Total Current Liabilities 14,580.26 11,273.78 9,406.97 9,167.99 8,410.12 Net Current Assets 5,126.99 2,357.08 3,894.02 1,213.26 -68.62Miscellaneous Expenses not written off 0 0 0 0 0Deferred Tax Assets 303.88 298.16 216.04 129.71 203.39
Mar 08 Mar 07 Mar 06 Mar 05 Mar 04

8/7/2019 BSHEET ASSIGNMENT2
http://slidepdf.com/reader/full/bsheet-assignment2 15/63
Deferred Tax Liability 1,785.25 1,680.75 1,571.88 1,098.74 1,025.78 Net Deferred Tax -1,481.37 -1,382.59 -1,355.84 -969.03 -822.39Total Assets 26,699.22 21,102.78 17,513.02 10,270.04 8,539.44
Contingent Liabilities 3,035.11 2,810.81 2,028.80 1,767.19 1,649.87

8/7/2019 BSHEET ASSIGNMENT2
http://slidepdf.com/reader/full/bsheet-assignment2 16/63
-18,159.78
10,342.970.93
8,341.254.22

8/7/2019 BSHEET ASSIGNMENT2
http://slidepdf.com/reader/full/bsheet-assignment2 17/63
8/7/2019 BSHEET ASSIGNMENT2
http://slidepdf.com/reader/full/bsheet-assignment2 18/63
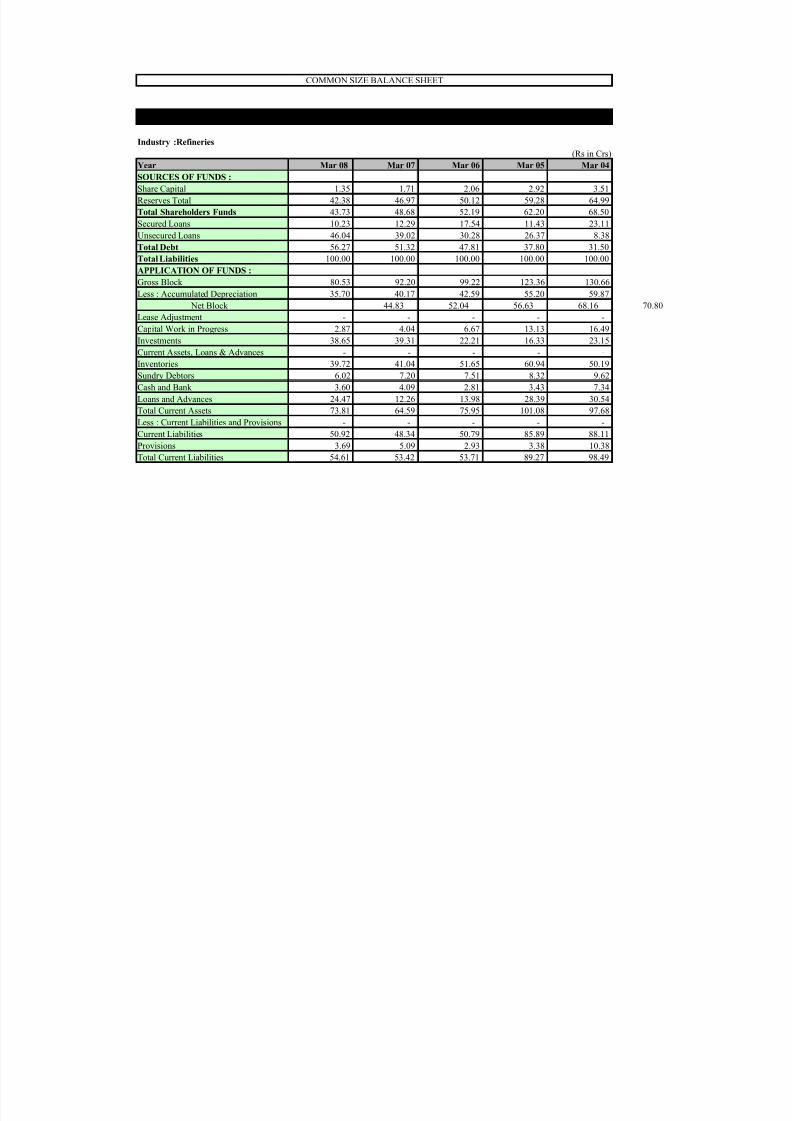
COMMON SIZE BALANCE SHEET
Bharat Petroleum Corporation Ltd
Industry :Refineries
(Rs in Crs)
YearSOURCES OF FUNDS :
Share Capital 1.35 1.71 2.06 2.92 3.51Reserves Total 42.38 46.97 50.12 59.28 64.99Total Shareholders Funds 43.73 48.68 52.19 62.20 68.50Secured Loans 10.23 12.29 17.54 11.43 23.11Unsecured Loans 46.04 39.02 30.28 26.37 8.38Total Debt 56.27 51.32 47.81 37.80 31.50Total Liabilities 100.00 100.00 100.00 100.00 100.00APPLICATION OF FUNDS :
Gross Block 80.53 92.20 99.22 123.36 130.66Less : Accumulated Depreciation 35.70 40.17 42.59 55.20 59.87 Net Block 44.83 52.04 56.63 68.16 70.80Lease Adjustment - - - - -Capital Work in Progress 2.87 4.04 6.67 13.13 16.49
Investments 38.65 39.31 22.21 16.33 23.15Current Assets, Loans & Advances - - - - -Inventories 39.72 41.04 51.65 60.94 50.19Sundry Debtors 6.02 7.20 7.51 8.32 9.62Cash and Bank 3.60 4.09 2.81 3.43 7.34Loans and Advances 24.47 12.26 13.98 28.39 30.54Total Current Assets 73.81 64.59 75.95 101.08 97.68Less : Current Liabilities and Provisions - - - - -Current Liabilities 50.92 48.34 50.79 85.89 88.11Provisions 3.69 5.09 2.93 3.38 10.38Total Current Liabilities 54.61 53.42 53.71 89.27 98.49
Mar 08 Mar 07 Mar 06 Mar 05 Mar 04

8/7/2019 BSHEET ASSIGNMENT2
http://slidepdf.com/reader/full/bsheet-assignment2 19/63
Net Current Assets 19.20 11.17 22.24 11.81 (0.80)Miscellaneous Expenses not written off - - - - -Deferred Tax Assets 1.14 1.41 1.23 1.26 2.38Deferred Tax Liability 6.69 7.96 8.98 10.70 12.01 Net Deferred Tax (5.55) (6.55) (7.74) (9.44) (9.63)Total Assets 100.00 100.00 100.00 100.00 100.00Contingent Liabilities 11.37 13.32 11.58 17.21 19.32

8/7/2019 BSHEET ASSIGNMENT2
http://slidepdf.com/reader/full/bsheet-assignment2 20/63

8/7/2019 BSHEET ASSIGNMENT2
http://slidepdf.com/reader/full/bsheet-assignment2 21/63

8/7/2019 BSHEET ASSIGNMENT2
http://slidepdf.com/reader/full/bsheet-assignment2 22/63

8/7/2019 BSHEET ASSIGNMENT2
http://slidepdf.com/reader/full/bsheet-assignment2 23/63
√ It can be seen from the above figures that the company is deviating from ideal currentratio(2:1).

8/7/2019 BSHEET ASSIGNMENT2
http://slidepdf.com/reader/full/bsheet-assignment2 24/63
COMMON SIZE BALANCE SHEET
IOCL BPCL
Year Mar-08 Mar-08SOURCES OF FUNDS :
Share Capital 1.56 1.35 0.20
Reserves Total 52.07 42.38 9.69
Total Shareholders Funds 53.63 43.73 9.90
Secured Loans 8.37 10.23 (1.85)
Unsecured Loans 37.99 46.04 (8.04)
Total Debt 46.37 56.27 (9.90)
Total Liabilities 100.00 100.00 -
APPLICATION OF FUNDS :
Gross Block 74.18 80.53 (6.35)Less : Accumulated Depreciation 31.36 35.70 (4.34)
Net Block 42.82 44.83(2.00)
Lease Adjustment - - -
Capital Work in Progress 11.97 2.87 9.10
Investments 28.24 38.65 (10.41)
Current Assets, Loans & AdvancesInventories 40.39 39.72 0.67
Sundry Debtors 8.90 6.02 2.88
Cash and Bank 1.08 3.60 (2.53)
Loans and Advances 28.55 24.47 4.08
Total Current Assets 78.92 73.81 5.10
Less : Current Liabilities and ProvisionsCurrent Liabilities 43.61 50.92 (7.31)
Provisions 11.32 3.69 7.62
Total Current Liabilities 54.92 54.61 0.31
Net Current Assets 23.99 19.20 4.79
Miscellaneous Expenses not written off - - -
Deferred Tax Assets 0.70 1.14 (0.44)
Deferred Tax Liability 7.73 6.69 1.04 Net Deferred Tax (7.03) (5.55) (1.48)
Total Assets 100.00 100.00 -
Contingent Liabilities 10.75 11.37 (0.62)
DIFFERENCE
%

8/7/2019 BSHEET ASSIGNMENT2
http://slidepdf.com/reader/full/bsheet-assignment2 25/63
Inter-Firm comparison between IOCL & BPCL :
IOCL BPCL
Shareholders Funds 53.63 43.73Secured Loans 8.37 10.23Unsecured Loans 37.99 46.04Total 100.00 100.00
√ IOCL is following a comparatively tight working capital policy than BPCL.
IOCL BPCL
Dividend (In Crs.) 655.81 144.62Equity Dividend % 55 40Earnings Per Share-Unit Curr 57.75 43.46Book Value-Unit Curr 344.58 322.98
√ In IOCL, shareholders' funds constitutes a major part of total funds in comparison toBPCL, whereas in BPCL more preference is given to debt.
√ Returns to shareholders are comparatively better in IOCL than BPCL as EPS is better in IOCL.
IOCL -SOURCE OF FUNDS
ShareholdersFundsSecuredLoansUnsecuredLoans
BPCL- SOURCE OF FUNDS
Shareholder s FundsSecuredLoansUnsecuredLoans

8/7/2019 BSHEET ASSIGNMENT2
http://slidepdf.com/reader/full/bsheet-assignment2 26/63
√ Dividend payout ratio is also high in IOCL.
Shar eholder s FundsSecur ed Loans Unsecur ed Loans
8/7/2019 BSHEET ASSIGNMENT2
http://slidepdf.com/reader/full/bsheet-assignment2 27/63
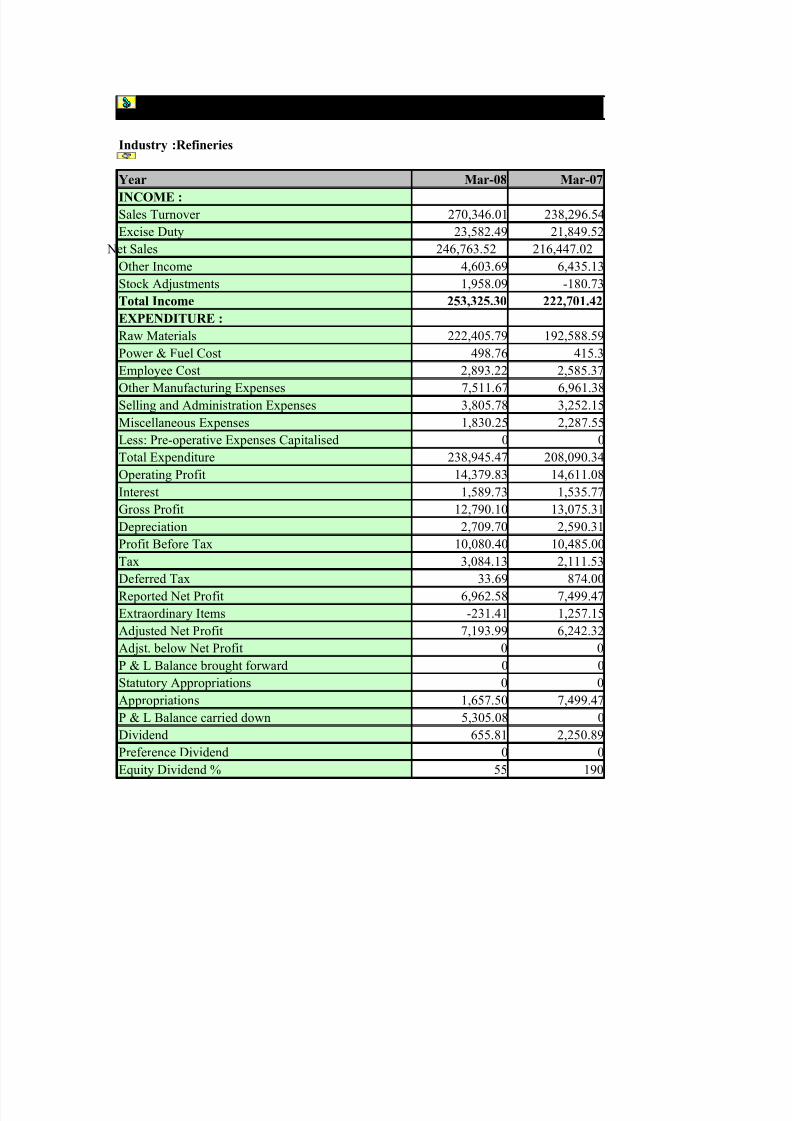
Indian Oil Corporation Ltd
Industry :Refineries
Year Mar-08 Mar-07
INCOME :
Sales Turnover 270,346.01 238,296.54Excise Duty 23,582.49 21,849.52 Net Sales 246,763.52 216,447.02Other Income 4,603.69 6,435.13Stock Adjustments 1,958.09 -180.73Total Income 253,325.30 222,701.42
EXPENDITURE :
Raw Materials 222,405.79 192,588.59Power & Fuel Cost 498.76 415.3Employee Cost 2,893.22 2,585.37Other Manufacturing Expenses 7,511.67 6,961.38Selling and Administration Expenses 3,805.78 3,252.15Miscellaneous Expenses 1,830.25 2,287.55Less: Pre-operative Expenses Capitalised 0 0Total Expenditure 238,945.47 208,090.34Operating Profit 14,379.83 14,611.08Interest 1,589.73 1,535.77
Gross Profit 12,790.10 13,075.31Depreciation 2,709.70 2,590.31Profit Before Tax 10,080.40 10,485.00Tax 3,084.13 2,111.53Deferred Tax 33.69 874.00Reported Net Profit 6,962.58 7,499.47Extraordinary Items -231.41 1,257.15Adjusted Net Profit 7,193.99 6,242.32Adjst. below Net Profit 0 0P & L Balance brought forward 0 0
Statutory Appropriations 0 0Appropriations 1,657.50 7,499.47P & L Balance carried down 5,305.08 0Dividend 655.81 2,250.89Preference Dividend 0 0Equity Dividend % 55 190
8/7/2019 BSHEET ASSIGNMENT2
http://slidepdf.com/reader/full/bsheet-assignment2 28/63
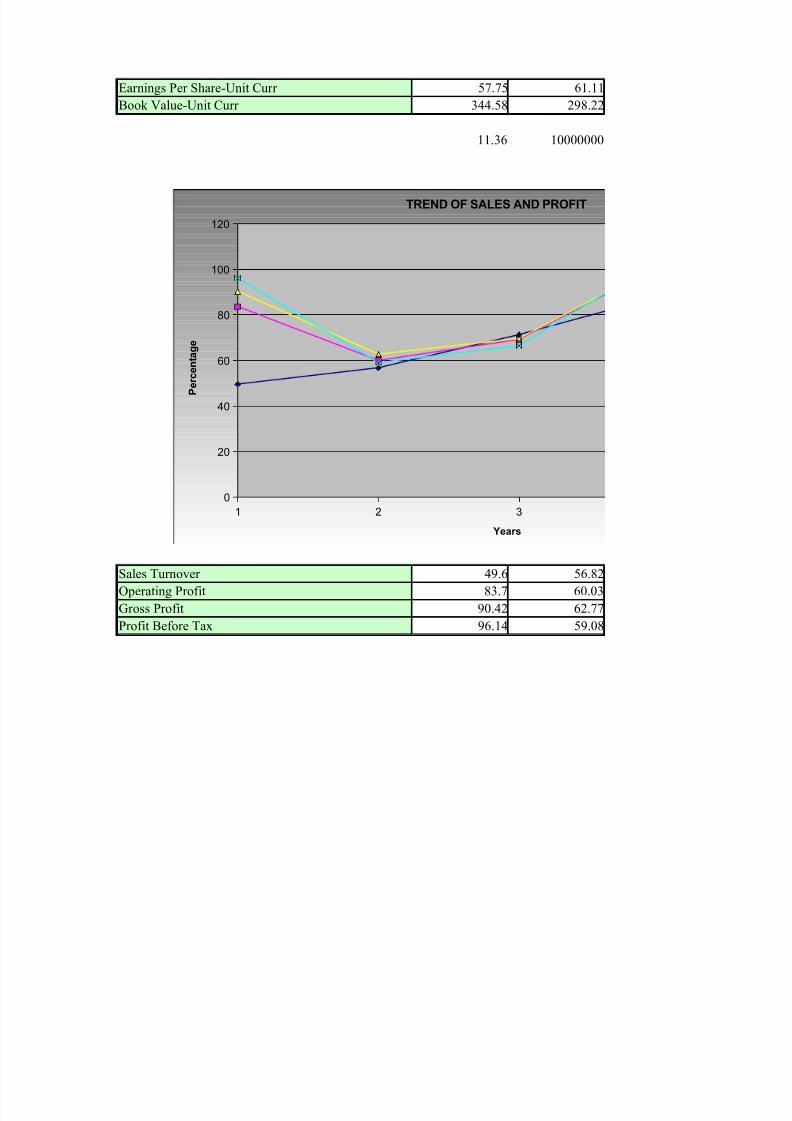
Earnings Per Share-Unit Curr 57.75 61.11Book Value-Unit Curr 344.58 298.22
11.36 10000000
Sales Turnover 49.6 56.82Operating Profit 83.7 60.03Gross Profit 90.42 62.77Profit Before Tax 96.14 59.08
1 2 3
0
20
40
60
80
100
120
TREND OF SALES AND PROFIT
Years
P e r c e n
t a g e

8/7/2019 BSHEET ASSIGNMENT2
http://slidepdf.com/reader/full/bsheet-assignment2 29/63
(Rs in Crs)Mar-06 Mar-05 Mar-04
192,817.53 153,604.78 134,084.37 0.1918,659.24 14,374.20 17,022.57 2.02
174,158.29 139,230.58 117,061.802,939.43 1,477.25 1,716.052,599.33 1,653.90 728.72
179,697.05 142,361.73 119,506.57
158,152.23 122,476.42 97,361.01335.06 272.72 445.251,844.16 1,829.17 1,536.046,025.82 6,149.77 5,676.252,713.62 2,413.91 1,656.15
665.92 587.59 796.380 0 0
169,736.81 133,729.58 107,471.089,960.24 8,632.15 12,035.491,052.79 604.17 470.86
8,907.45 8,027.98 11,564.632,201.46 2,072.80 1,873.796,705.99 5,955.18 9,690.841,617.63 1,029.43 2,275.40
173.24 34.37 410.624,915.12 4,891.38 7,004.82
321.04 -11.88 -55.474,594.08 4,903.26 7,060.29
0 0 00 0 0
0 0 04,915.12 4,891.38 7,004.82
0 0 01,460.02 1,693.62 2,452.83
0 0 0125 145 210

8/7/2019 BSHEET ASSIGNMENT2
http://slidepdf.com/reader/full/bsheet-assignment2 30/63
40.33 39.85 57.28250.88 222.47 197.32
Compounded Growth(%)
113560173.16 Sales Turnover Other Income
ExpenditureOperating ProfitProfit Before TaxReported Net Profit
Raw MaterialsPower & Fuel CostEmployee CostOther Manufacturing ExpensSelling and Administration EMiscellaneous ExpensesInterest
Analysis :
1.Growth rate of Other Inco2.Company could achieve b
3.Company's total expenditu3.1 Average growth in raw3.2 Selling & administratio3.3 Average growth in inter
71.32 88.15 10069.27 101.61 10069.64 102.23 10066.53 104.01 100
4 5
Sales Turnover
Operating ProfitGross ProfitProfit Before Tax

8/7/2019 BSHEET ASSIGNMENT2
http://slidepdf.com/reader/full/bsheet-assignment2 31/63

8/7/2019 BSHEET ASSIGNMENT2
http://slidepdf.com/reader/full/bsheet-assignment2 32/63
2004-200819.1627.98
22.114.550.99
-0.15
22.942.88
17.15es 7.26xpenses 23.12
23.1335.55
e is higher than Sales turnover, which shows that company's core business is generating comparativeltter profit growth than income growth because of lower expense growth.
e (i.e.direct & indirect) is increasing at a high rate because of the following reasons :aterial cost is 22.94%.expenses and miscellaneous expenses are increasing at a substantial rate.
est cost(i.e.35.55%) which pulled up the average cost.

8/7/2019 BSHEET ASSIGNMENT2
http://slidepdf.com/reader/full/bsheet-assignment2 33/63

8/7/2019 BSHEET ASSIGNMENT2
http://slidepdf.com/reader/full/bsheet-assignment2 34/63
less return.

8/7/2019 BSHEET ASSIGNMENT2
http://slidepdf.com/reader/full/bsheet-assignment2 35/63
Bharat Petroleum Corporation Ltd
Industry :Refineries
Year Mar-08 Mar-07 Mar-06
INCOME :
Sales Turnover 121,684.07 107,452.27 85,149.62Excise Duty 11,475.94 10,895.42 9,616.33 Net Sales 110,208.13 96,556.85 75,533.29Other Income 1,520.80 752.49 493.14Stock Adjustments -392.5 205.44 754.4Total Income 111,336.43 97,514.78 76,780.83
EXPENDITURE :
Raw Materials 101,586.56 88,593.77 71,350.42Power & Fuel Cost 61.75 66.64 47.71Employee Cost 1,296.16 1,002.88 881.09Other Manufacturing Expenses 609.05 586.54 493.12Selling and Administration Expenses 2,413.43 2,216.64 1,943.76Miscellaneous Expenses 1,002.41 844.52 642.55Less: Pre-operative Expenses Capitalised 0 0 0Total Expenditure 106,969.36 93,310.99 75,358.65Operating Profit 4,367.07 4,203.79 1,422.18Interest 672.47 532.69 247.62
Gross Profit 3,694.60 3,671.10 1,174.56Depreciation 1,098.21 904.11 768.01Profit Before Tax 2,596.39 2,766.99 406.55Tax 889.73 923.04 -1.01Deferred Tax 126.10 38.48 115.91Reported Net Profit 1,580.56 1,805.47 291.65Extraordinary Items 28.95 -28.4 1.92Adjusted Net Profit 1,551.61 1,833.87 289.73Adjst. below Net Profit 0 0 2,084.32P & L Balance brought forward 0 2,682.91 628.17
Statutory Appropriations 0 0 0Appropriations 1,580.56 4,488.38 321.23P & L Balance carried down 0 0 2,682.91Dividend 144.62 578.46 90.39Preference Dividend 0 0 0Equity Dividend % 40 160 25
8/7/2019 BSHEET ASSIGNMENT2
http://slidepdf.com/reader/full/bsheet-assignment2 36/63
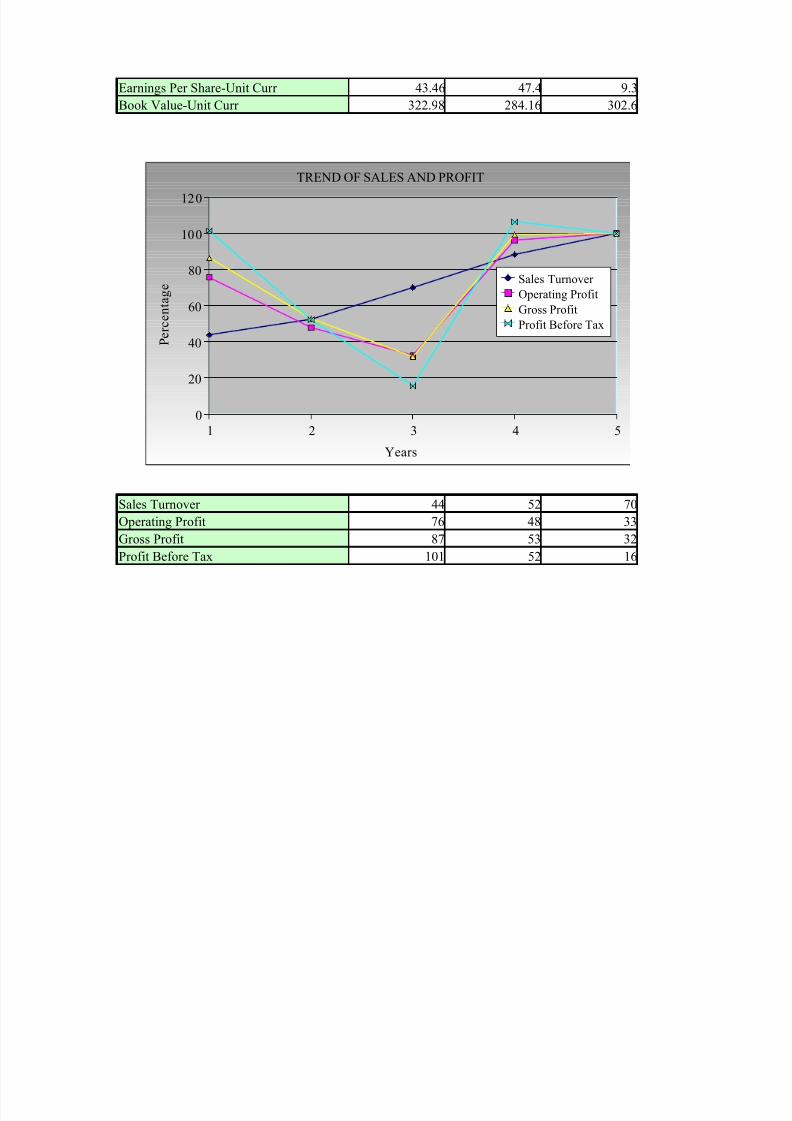
Earnings Per Share-Unit Curr 43.46 47.4 9.3Book Value-Unit Curr 322.98 284.16 302.6
Sales Turnover 44 52 70Operating Profit 76 48 33Gross Profit 87 53 32Profit Before Tax 101 52 16
1 2 3 4 50
20
40
60
80
100
120
TREND OF SALES AND PROFIT
Sales Turnover Operating ProfitGross ProfitProfit Before Tax
Years
P e
r c e n
t a g e

8/7/2019 BSHEET ASSIGNMENT2
http://slidepdf.com/reader/full/bsheet-assignment2 37/63
(Rs in Crs)Mar-05 Mar-04
63,857.00 53,448.365,979.60 5,610.67
57,877.40 47,837.69511.72 466.85
1,586.25 -284.0359,975.37 48,020.51
54,495.57 41,699.3719.69 21.02792.52 661.35373.83 316.46
1,741.41 1,535.19460.36 485.69
0 057,883.38 44,719.082,091.99 3,301.43
140.11 105.35
1,951.88 3,196.08596.04 561.16
1,355.84 2,634.92243.41 864.51146.63 75.84965.80 1,694.57-22.19 9.57987.99 1,685.00
0 00 0
0 0337.63 1,694.57628.17 0
375 5250 0
125 175

8/7/2019 BSHEET ASSIGNMENT2
http://slidepdf.com/reader/full/bsheet-assignment2 38/63
30.46 54.24212.95 194.99
Compounded Growth(%)
Sales Turnover
Other IncomeExpenditureOperating ProfitProfit Before TaxReported Net Profit
Raw MaterialsPower & Fuel CostEmployee CostOther Manufacturing ExpensesSelling and Administration ExpensesMiscellaneous ExpensesInterest
Analysis :
1.Other Income shows comparatively higher average g2.Company could achieve better profit growth than in3. Average growth in interest cost(i.e.58.95%) which p4. Growth in raw material cost arrested the operating p
88 100 5. Substantial increase in Power & Fuel cost.96 10099 100
107 100

8/7/2019 BSHEET ASSIGNMENT2
http://slidepdf.com/reader/full/bsheet-assignment2 39/63

8/7/2019 BSHEET ASSIGNMENT2
http://slidepdf.com/reader/full/bsheet-assignment2 40/63
2004-2008
22.84
34.3524.367.24
-0.37-1.73
24.9330.9218.3217.7811.9719.8658.95
rowth than Sales turnover.come growth because of lower expense growth.ulled up the average cost, otherwise the company could have registered still better profit growth.rofit growth at 7.24%.

8/7/2019 BSHEET ASSIGNMENT2
http://slidepdf.com/reader/full/bsheet-assignment2 41/63
COMMON SIZE PROFIT & LOSS ACCOUNT
Indian Oil Corporation LtdIndustry :Refineries
Year Mar-08 Mar-07 Mar-06
INCOME :
Sales Turnover 100.00 100.00 100.00Excise Duty 8.72 9.17 9.68 Net Sales 91.28 90.83 90.32Other Income 1.70 2.70 1.52
Stock Adjustments 0.72 -0.08 1.35Total Income 93.70 93.46 93.20
EXPENDITURE :
Raw Materials 82.27 80.82 82.02Power & Fuel Cost 0.18 0.17 0.17Employee Cost 1.07 1.08 0.96Other Manufacturing Expenses 2.78 2.92 3.13Selling and Administration Expenses 1.41 1.36 1.41Miscellaneous Expenses 0.68 0.96 0.35Less: Pre-operative Expenses Capitalised 0.00 0.00 0.00
Total Expenditure 88.39 87.32 88.03Operating Profit 5.32 6.13 5.17Interest 0.59 0.64 0.55Gross Profit 4.73 5.49 4.62Depreciation 1.00 1.09 1.14Profit Before Tax 3.73 4.40 3.48Tax 1.14 0.89 0.84Deferred Tax 0.01 0.37 0.09Reported Net Profit 2.58 3.15 2.55Extraordinary Items -0.09 0.53 0.17
Adjusted Net Profit 2.66 2.62 2.38Adjst. below Net Profit 0.00 0.00 0.00P & L Balance brought forward 0.00 0.00 0.00Statutory Appropriations 0.00 0.00 0.00Appropriations 0.61 3.15 2.55P & L Balance carried down 1.96 0.00 0.00

8/7/2019 BSHEET ASSIGNMENT2
http://slidepdf.com/reader/full/bsheet-assignment2 42/63
Dividend 0.24 0.94 0.76Preference Dividend 0.00 0.00 0.00
Equity Dividend % 55 190 125Earnings Per Share-Unit Curr 57.75 61.11 40.33
Book Value-Unit Curr 344.58 298.22 250.88
8/7/2019 BSHEET ASSIGNMENT2
http://slidepdf.com/reader/full/bsheet-assignment2 43/63
(Rs in Crs)Mar-05 Mar-04
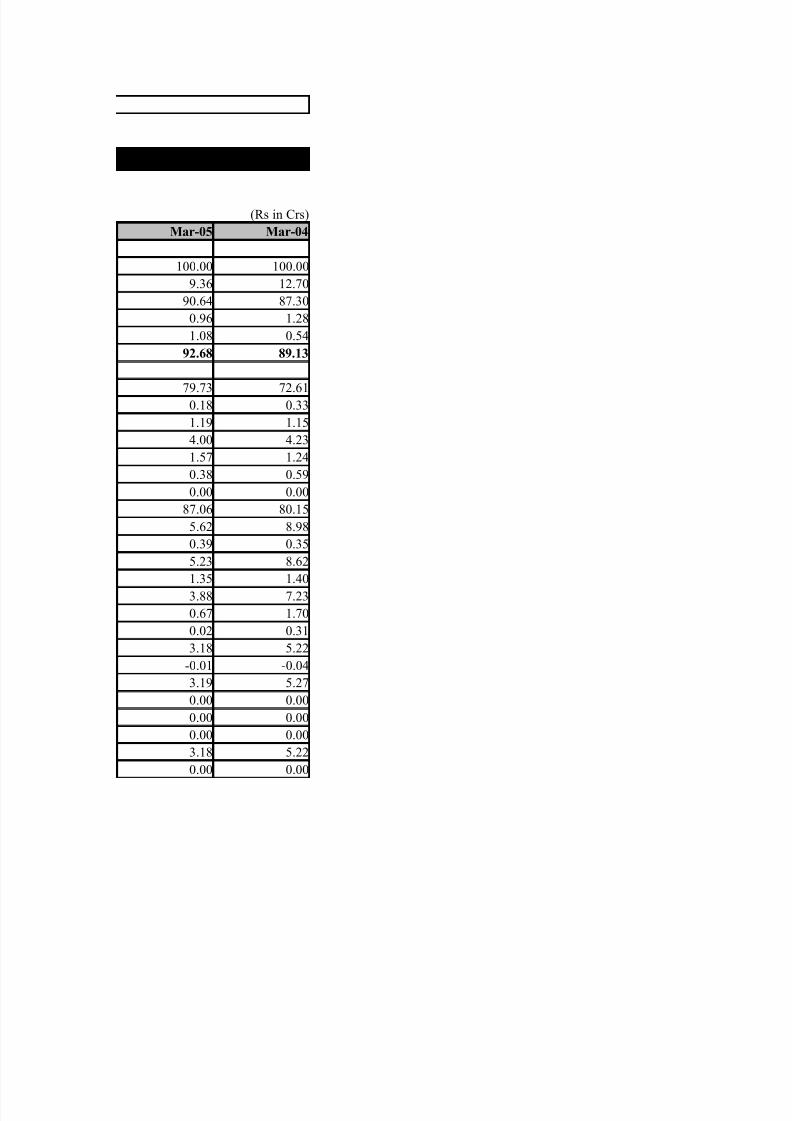
100.00 100.009.36 12.70
90.64 87.300.96 1.28
1.08 0.5492.68 89.13
79.73 72.610.18 0.331.19 1.154.00 4.231.57 1.240.38 0.590.00 0.00
87.06 80.155.62 8.980.39 0.355.23 8.621.35 1.403.88 7.230.67 1.700.02 0.313.18 5.22
-0.01 -0.04
3.19 5.270.00 0.000.00 0.000.00 0.003.18 5.220.00 0.00
8/7/2019 BSHEET ASSIGNMENT2
http://slidepdf.com/reader/full/bsheet-assignment2 44/63
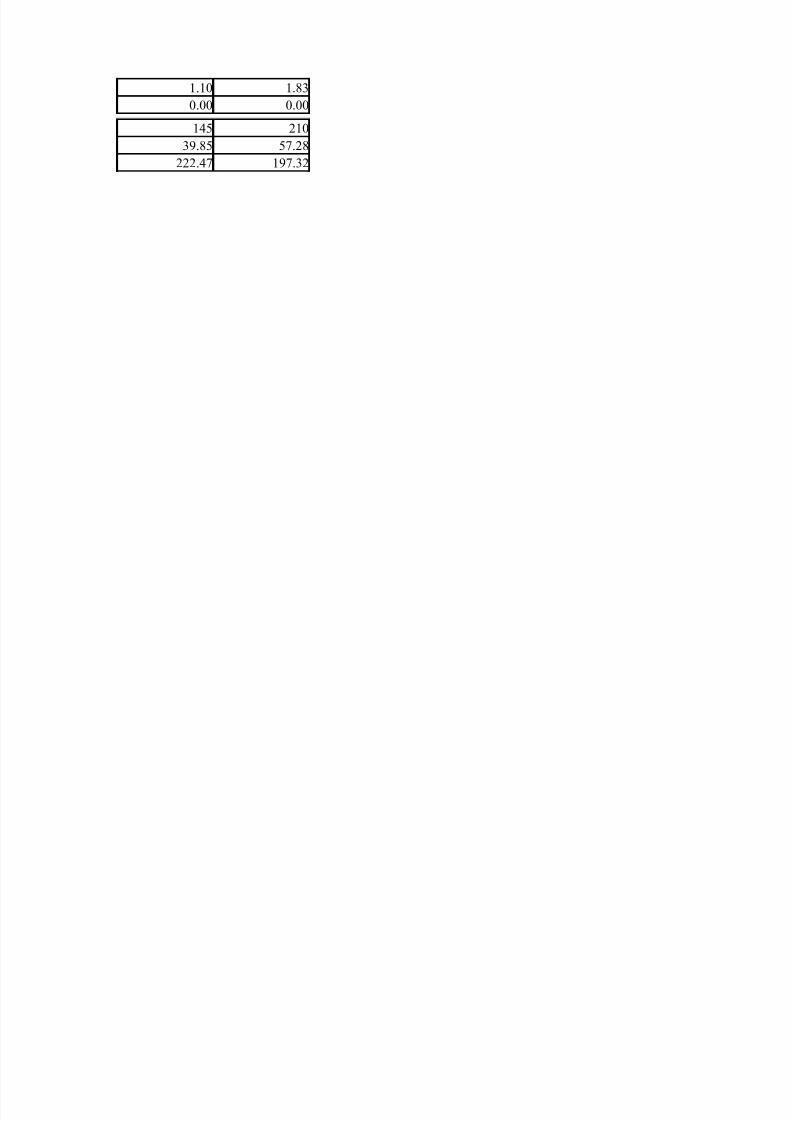
1.10 1.830.00 0.00
145 21039.85 57.28
222.47 197.32

8/7/2019 BSHEET ASSIGNMENT2
http://slidepdf.com/reader/full/bsheet-assignment2 45/63

8/7/2019 BSHEET ASSIGNMENT2
http://slidepdf.com/reader/full/bsheet-assignment2 46/63

8/7/2019 BSHEET ASSIGNMENT2
http://slidepdf.com/reader/full/bsheet-assignment2 47/63
Intra-Firm Analysis :
3. Depreciation % to sales has been diminished over the period.
4. Interest incidence has been increased signifying more dependence on borrowed funds.
5. Selling expenses & employee cost are more or less at the same level.
■ Compounded average growth rate in expenses i.e. 22.11% is very high.
Operating Efficiency :
1. The trend of Operating profits with respect to sales is more or less showing a diminishingtrend.
2. Raw material % to sales has been increased over the period. On the contrary, other manufacturing expenses % to sales decreased.
6. Net effect of increase in total expenditure has been reflected in the decreased operating profits.
7. Returns to shareholders has also shown a decreasing trend which is signified bydiminishing earnings per share.
Operating efficiency of the company can also be judged on the basis of CAGR
(Compounded Average Growth Rate)
■ Compounded average growth rate in interest expense is 35.55%, restricting the growth inPBT to only 0.99%.

8/7/2019 BSHEET ASSIGNMENT2
http://slidepdf.com/reader/full/bsheet-assignment2 48/63
COMMON SIZE PROFIT & LOSS ACCOUNT
Bharat Petroleum Corporation LtdIndustry :Refineries
Year Mar-08 Mar-07 Mar-06
INCOME :
Sales Turnover 100.00 100.00 100.00Excise Duty 9.43 10.14 11.29 Net Sales 90.57 89.86 88.71Other Income 1.25 0.70 0.58
Stock Adjustments -0.32 0.19 0.89Total Income 91.50 90.75 90.17
EXPENDITURE :
Raw Materials 83.48 82.45 83.79Power & Fuel Cost 0.05 0.06 0.06Employee Cost 1.07 0.93 1.03Other Manufacturing Expenses 0.50 0.55 0.58Selling and Administration Expenses 1.98 2.06 2.28Miscellaneous Expenses 0.82 0.79 0.75Less: Pre-operative Expenses Capitalised 0.00 0.00 0.00
Total Expenditure 87.91 86.84 88.50Operating Profit 3.59 3.91 1.67Interest 0.55 0.50 0.29Gross Profit 3.04 3.42 1.38Depreciation 0.90 0.84 0.90Profit Before Tax 2.13 2.58 0.48Tax 0.73 0.86 0.00Deferred Tax 0.10 0.04 0.14Reported Net Profit 1.30 1.68 0.34Extraordinary Items 0.02 -0.03 0.00
Adjusted Net Profit 1.28 1.71 0.34Adjst. below Net Profit 0.00 0.00 2.45P & L Balance brought forward 0.00 2.50 0.74Statutory Appropriations 0.00 0.00 0.00Appropriations 1.30 4.18 0.38P & L Balance carried down 0.00 0.00 3.15

8/7/2019 BSHEET ASSIGNMENT2
http://slidepdf.com/reader/full/bsheet-assignment2 49/63
Dividend 0.12 0.54 0.11Preference Dividend 0.00 0.00 0.00
Equity Dividend % 40 160 25Earnings Per Share-Unit Curr 43.46 47.4 9.3Book Value-Unit Curr 322.98 284.16 302.6

8/7/2019 BSHEET ASSIGNMENT2
http://slidepdf.com/reader/full/bsheet-assignment2 50/63

8/7/2019 BSHEET ASSIGNMENT2
http://slidepdf.com/reader/full/bsheet-assignment2 51/63
0.59 0.980.00 0.00
125 17530.46 54.24
212.95 194.99

8/7/2019 BSHEET ASSIGNMENT2
http://slidepdf.com/reader/full/bsheet-assignment2 52/63

8/7/2019 BSHEET ASSIGNMENT2
http://slidepdf.com/reader/full/bsheet-assignment2 53/63

8/7/2019 BSHEET ASSIGNMENT2
http://slidepdf.com/reader/full/bsheet-assignment2 54/63

8/7/2019 BSHEET ASSIGNMENT2
http://slidepdf.com/reader/full/bsheet-assignment2 55/63

8/7/2019 BSHEET ASSIGNMENT2
http://slidepdf.com/reader/full/bsheet-assignment2 56/63

8/7/2019 BSHEET ASSIGNMENT2
http://slidepdf.com/reader/full/bsheet-assignment2 57/63

8/7/2019 BSHEET ASSIGNMENT2
http://slidepdf.com/reader/full/bsheet-assignment2 58/63
Intra-Firm Analysis :
3. Depreciation % to sales has been diminished over the period.
4. Interest incidence has been increased signifying more dependence on borrowed funds.
■ Compounded average growth rate in expenses i.e. 24.36% is very high.
Operating Efficiency :
1. Operating profits with respect to sales has shown a decreasing trend over the period.
2. Raw material % to sales has been increased over the period. On the contrary, other manufacturing expenses % to sales decreased.
5. Selling expenses has shown a downward trend. However employee cost are more or less atthe same level.
6. Net effect of increase in total expenditure has been reflected in the decreased operating profits.
7. Returns to shareholders has also shown a decreasing trend which is signified bydiminishing EPS.
Operating efficiency of the company can also be judged on the basis of CAGR
(Compounded Average Growth Rate)
■ Compounded average growth rate in interest expense is 58.95%, restricting the growth inoperating profit to only 7.24%.

8/7/2019 BSHEET ASSIGNMENT2
http://slidepdf.com/reader/full/bsheet-assignment2 59/63
Inter-Firm comparison between IOCL & BPCL :
COMPARATIVE COMMON SIZE P& L ACCOUNT FOR 2008
IOCL BPCL
Year Mar-08 Mar-08
INCOME :
Sales Turnover 100.00 100.00 0.00Excise Duty 8.72 9.43 -0.71 Net Sales 91.28 90.57 0.71Other Income 1.70 1.25 0.45
Stock Adjustments 0.72 -0.32 1.05Total Income 93.70 91.50 2.21EXPENDITURE :
Raw Materials 82.27 83.48 -1.22Power & Fuel Cost 0.18 0.05 0.13Employee Cost 1.07 1.07 0.01Other Manufacturing Expenses 2.78 0.50 2.28Selling and Administration Expenses 1.41 1.98 -0.58Miscellaneous Expenses 0.68 0.82 -0.15Less: Pre-operative Expenses Capitalised 0.00 0.00 0.00Total Expenditure 88.39 87.91 0.48Operating Profit 5.32 3.59 1.73Interest 0.59 0.55 0.04Gross Profit 4.73 3.04 1.69Depreciation 1.00 0.90 0.10Profit Before Tax 3.73 2.13 1.59Tax 1.14 0.73 0.41Deferred Tax 0.01 0.10 -0.09Reported Net Profit 2.58 1.30 1.28
Extraordinary Items -0.09 0.02 -0.11Adjusted Net Profit 2.66 1.28 1.39Adjst. below Net Profit 0.00 0.00 0.00P & L Balance brought forward 0.00 0.00 0.00Statutory Appropriations 0.00 0.00 0.00Appropriations 0.61 1.30 -0.69P & L Balance carried down 1.96 0.00 1.96
DIFFERENCE%

8/7/2019 BSHEET ASSIGNMENT2
http://slidepdf.com/reader/full/bsheet-assignment2 60/63
Dividend 0.24 0.12 0.12Preference Dividend 0.00 0.00 0.00

8/7/2019 BSHEET ASSIGNMENT2
http://slidepdf.com/reader/full/bsheet-assignment2 61/63

8/7/2019 BSHEET ASSIGNMENT2
http://slidepdf.com/reader/full/bsheet-assignment2 62/63

8/7/2019 BSHEET ASSIGNMENT2
http://slidepdf.com/reader/full/bsheet-assignment2 63/63