budget 2012-13: portfolio additional estimates statements · structure of the portfolio additional...
TRANSCRIPT

PORTFOLIO ADDITIONAL ESTIMATES STATEMENTS 2012-13 HUMAN SERVICES PORTFOLIO EXPLANATIONS OF ADDITIONAL ESTIMATES 2012-13
© Commonwealth of Australia 2013
ISBN 9781 74357 3921
This publication is available for your use under a Creative Commons BY Attribution 3.0 Australia licence, with the exception of the Commonwealth Coat of Arms, the Department of Human Services logo, photographs, images, signatures and where otherwise stated. The full licence terms are available from http://creativecommons.org/licenses/by/3.0/au/legalcode.
Use of Department of Human Services material under a Creative Commons BY Attribution 3.0 Australia licence requires you to attribute the work (but not in any way that suggests that the Department of Human Services endorses you or your use of the work):
Department of Human Services material used 'as supplied'
Provided you have not modified or transformed Department of Human Services material in any way including, for example, by changing the Department of Human Services text; calculating percentage changes; graphing or charting data; or deriving new statistics from published Department of Human Services statistics – then Department of Human Services prefers the following attribution:
Source: The Australian Government Department of Human Services
Derivative material
If you have modified or transformed Department of Human Services material, or derived new material from those of the Department of Human Services in any way, then Department of Human Services prefers the following attribution:
Based on The Australian Government Department of Human Services data
Use of the Coat of Arms The terms under which the Coat of Arms can be used are set out on the It’s an Honour website (see www.itsanhonour.gov.au)
Other Uses Inquiries regarding this licence and any other use of this document are welcome at: Chief Financial Officer, CFO Division, Department of Human Services, PO Box 3959, Manuka 2603, Australia.

iv
Abbreviations and conventions The following notations may be used:
NEC/nec not elsewhere classified
- nil
.. not zero, but rounded to zero
^ not zero, refer footnote
na not applicable (unless otherwise specified)
nfp not for publication
$m $ million
Figures in tables and in the text may be rounded. Figures in text are generally rounded to one decimal place, whereas figures in tables are generally rounded to the nearest thousand. Discrepancies in tables between totals and sums of components are due to rounding.
ENQUIRIES
Should you have any enquiries regarding this publication please contact Darren Box, Chief Financial Officer in the Department of Human Services on (02) 6223 4433.
A copy of this document can be located on the Australian Government Budget website at: http://www.budget.gov.au.

USER GUIDE TO THE
PORTFOLIO ADDITIONAL ESTIMATES STATEMENTS


vii
USER GUIDE
The purpose of the Portfolio Additional Estimates Statements (PAES), like that of the Portfolio Budget Statements (PB Statements), is to inform Senators and Members of Parliament of the proposed allocation of resources to Government outcomes by agencies within the portfolio. The focus of the PAES differs from the PB Statements in one important aspect. While the PAES includes an Agency Resource Statement to inform Parliament of the revised estimate of the total resources available to an agency, the focus of the PAES is on explaining the changes in resourcing by outcome(s) since the Budget. As such, the PAES provides information on new measures and their impact on the financial and/or non-financial planned performance of programs supporting those outcomes.
The PAES facilitates understanding of the proposed appropriations in Appropriation Bills (No. 3 and No. 4) 2012-13. In this sense the PAES is declared by the Additional Estimates Appropriation Bills to be a ‘relevant document’ to the interpretation of the Bills according to section 15AB of the Acts Interpretation Act 1901.
Whereas the Mid-Year Economic and Fiscal Outlook 2012-13 is a mid-year budget report which provides updated information to allow the assessment of the Government’s fiscal performance against its fiscal strategy, the PAES updates the most recent budget appropriations for agencies within the portfolio.

User Guide
viii
Structure of the Portfolio Additional Estimates Statements
The PAES is presented in three parts with subsections.
User guide
Provides a brief introduction explaining the purpose of the PAES.
Portfolio overview
Provides an overview of the portfolio, including a chart that outlines the outcomes for agencies in the portfolio.
Agency additional estimates statements
A statement (under the name of the agency) for each agency affected by Additional Estimates.
Section 1: Agency overview and resources
This section details the total resources available to an agency, the impact of any measures since Budget, and impact on Appropriation Bills No. 3 and No. 4.
Section 2: Revisions to outcomes and planned performance
This section details changes to Government outcomes and/or changes to the planned performance of agency programs.
Section 3: Explanatory tables and budgeted financial statements
This section contains updated explanatory tables on special account flows and staffing levels and revisions to the budgeted financial statements.
Glossary Explains key terms relevant to the Portfolio.
Index (Optional) Alphabetical guide to the Statements

ix
CONTENTS
Portfolio Overview ........................................................................................................ 3
Department of Human Services ................................................................................... 9
Glossary ....................................................................................................................... 49


PORTFOLIO OVERVIEW


3
PORTFOLIO OVERVIEW
Minister and portfolio responsibilities
On 1 July 2011 the Human Services Legislation Amendment Act 2011 integrated the services of Medicare Australia and Centrelink into the Department of Human Services (the Department).
The Department provides policy advice on service delivery matters to government to ensure effective, innovative and efficient implementation of government service delivery. The Department delivers a range of government and other payments and services to Australians, including through its three main programs:
Medicare looks after the health of Australians through efficient services and payments such as Medicare, the Pharmaceutical Benefits Scheme, the Australian Childhood Immunisation Register, and the Australian Organ Donor Register.
Centrelink delivers a range of government payments and services for retirees,
the unemployed, families, carers, parents, people with disabilities, Indigenous Australians, and people from diverse cultural and linguistic backgrounds, and provides services at times of major change.
Child Support provides support to separated parents to provide the financial
and emotional support necessary for their children’s wellbeing. The Department also delivers other programs including CRS Australia, the Healthcare Identifiers Service, the Small Business Superannuation Clearing House and Early Release of Superannuation.
Human Services Agencies
The Human Services Portfolio comprises the Department of Human Services which is a General Government Sector entity and Australian Hearing which is a non-General Government Sector entity, as shown in Figure 1.
Australian Hearing is one of the largest hearing service providers in the world and is dedicated to helping people manage their hearing impairment so they have a better quality of life. Australian Hearing provides a full range of hearing services for young Australians up to the age of 26, eligible adults and aged pensioners, and most war veterans.
As required under Section 12 of the Charter of Budget Honesty Act 1998, non-General Government Sector entities are not consolidated into the Commonwealth General Government Sector fiscal estimates. These entities are not reported in the Portfolio Budget Statements or Portfolio Additional Estimates Statements.
Portfolio Overview
4
More comprehensive information on activities undertaken within the Department is available on the following web site:
http://www.humanservices.gov.au

Portfolio Overview
5
Figure 1: Human Services portfolio structure and outcomes
* This agency is a Non-General Government Sector entity and is not consolidated into the Commonwealth general government sector fiscal estimates. Therefore it is not reported in the Portfolio Budget Statements or Portfolio Additional Estimates Statements.
Portfolio Minister for Human Services Senator the Hon Kim Carr
Department of Human Services Portfolio Secretary: Ms Kathryn Campbell, CSC
Outcome 1
Support individuals, families and communities to achieve greater self-sufficiency; through the delivery of policy advice and high
quality accessible social, health and child support services and other payments; and support providers and businesses through
convenient and efficient service delivery.
Australian Hearing* Managing Director: Mr Steven Grundy

Portfolio Overview
6
Portfolio resources
Table 1 shows the additional resources provided to the portfolio in the 2012-13 budget year, by agency for those agencies reporting in the Portfolio Additional Estimates Statements.
Table 1: Portfolio resources 2012-13 Receipts Total
Bill No. 3 Bill No. 4 Special$m $m $m $m $m
Department of Human ServicesAdministered appropriations - - - 96.8 96.8
Departmental appropriations 31.4 5.2 - - 36.6
Total: 31.4 5.2 - 96.8 133.4
Portfolio total 133.4
133.4
Appropriation
Additional resources available within portfolio:

AGENCY ADDITIONAL ESTIMATES
STATEMENTS
Department of Human Services ................................................................................... 9


9
DEPARTMENT OF HUMAN SERVICES
Section 1: Agency overview and resources ............................................................. 11
1.1 Strategic Direction .................................................................................................. 11
1.2 Agency Resource Statement ................................................................................. 11
1.3 Agency Measures table .......................................................................................... 16
1.4 Additional Estimates and variations ....................................................................... 20
1.5 Breakdown of Additional Estimates by appropriation bill ....................................... 23
Section 2: Revisions to agency outcomes and planned performance .................. 25
2.1 Resources and performance information ............................................................... 25
Section 3: Explanatory tables and budgeted financial statements ....................... 29
3.1 Explanatory tables .................................................................................................. 29
3.2 Budgeted financial statements ............................................................................... 31


11
DEPARTMENT OF HUMAN SERVICES
Section 1: Agency overview and resources
1.1 STRATEGIC DIRECTION
The Department’s Strategic Direction is outlined in full in the 2012-13 Portfolio Budget Statements.
The Department is seeking an additional $31.4 million in departmental funding through Appropriation Bill (No. 3) 2012-13.
The Department is seeking additional equity injections of $5.2 million for capital measures through Appropriation Bill (No. 4) 2012-13.
1.2 AGENCY RESOURCE STATEMENT
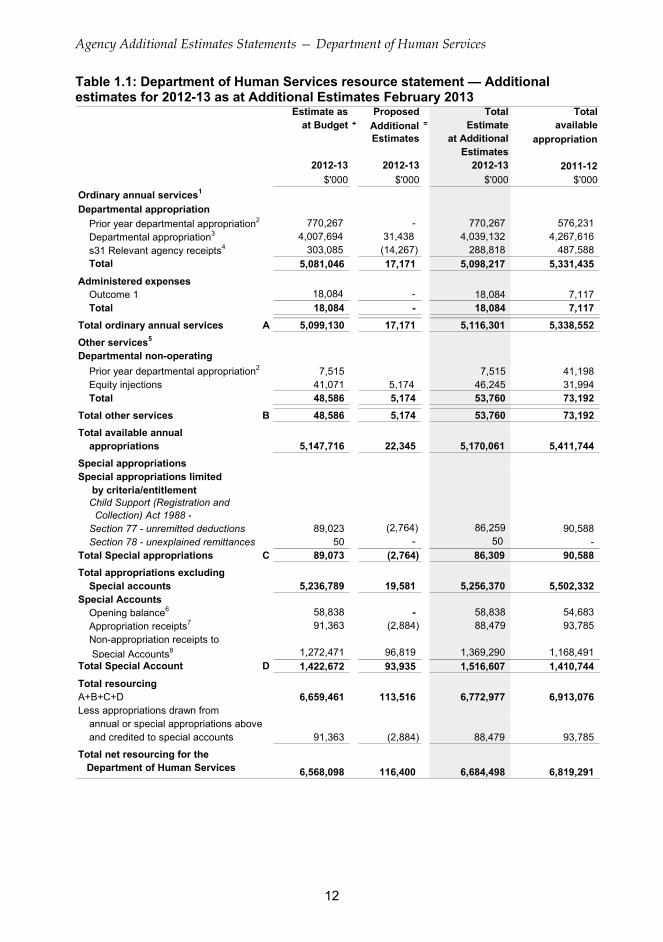
The Agency Resource Statement details the resourcing for the Department of Human Services at Additional Estimates. Table 1.1 outlines the total resourcing available from all sources for the 2012-13 Budget year, including variations through Appropriation Bills No. 3 and No. 4, special appropriations, special accounts and receipts from external sources.
Agency Additional Estimates Statements — Department of Human Services
12
Table 1.1: Department of Human Services resource statement — Additional estimates for 2012-13 as at Additional Estimates February 2013
Estimate as Proposed Total Totalat Budget + Additional = Estimate available
Estimates at Additional appropriationEstimates
2012-13 2012-13 2012-13 2011-12$'000 $'000 $'000 $'000
Ordinary annual services1
Departmental appropriation
Prior year departmental appropriation2 770,267 - 770,267 576,231
Departmental appropriation3 4,007,694 31,438 4,039,132 4,267,616
s31 Relevant agency receipts4 303,085 (14,267) 288,818 487,588 Total 5,081,046 17,171 5,098,217 5,331,435
Administered expensesOutcome 1 18,084 - 18,084 7,117 Total 18,084 - 18,084 7,117
Total ordinary annual services A 5,099,130 17,171 5,116,301 5,338,552
Other services5
Departmental non-operating
Prior year departmental appropriation2 7,515 7,515 41,198 Equity injections 41,071 5,174 46,245 31,994 Total 48,586 5,174 53,760 73,192
Total other services B 48,586 5,174 53,760 73,192
Total available annual appropriations 5,147,716 22,345 5,170,061 5,411,744
Special appropriationsSpecial appropriations limited
by criteria/entitlementChild Support (Registration and Collection) Act 1988 -Section 77 - unremitted deductions 89,023 (2,764) 86,259 90,588 Section 78 - unexplained remittances 50 - 50 -
Total Special appropriations C 89,073 (2,764) 86,309 90,588
Total appropriations excludingSpecial accounts 5,236,789 19,581 5,256,370 5,502,332
Special AccountsOpening balance6 58,838 - 58,838 54,683
Appropriation receipts7 91,363 (2,884) 88,479 93,785 Non-appropriation receipts to
Special Accounts8 1,272,471 96,819 1,369,290 1,168,491 Total Special Account D 1,422,672 93,935 1,516,607 1,410,744
Total resourcingA+B+C+D 6,659,461 113,516 6,772,977 6,913,076 Less appropriations drawn from
annual or special appropriations aboveand credited to special accounts 91,363 (2,884) 88,479 93,785
Total net resourcing for the Department of Human Services 6,568,098 116,400 6,684,498 6,819,291
Agency Additional Estimates Statements — Department of Human Services
13
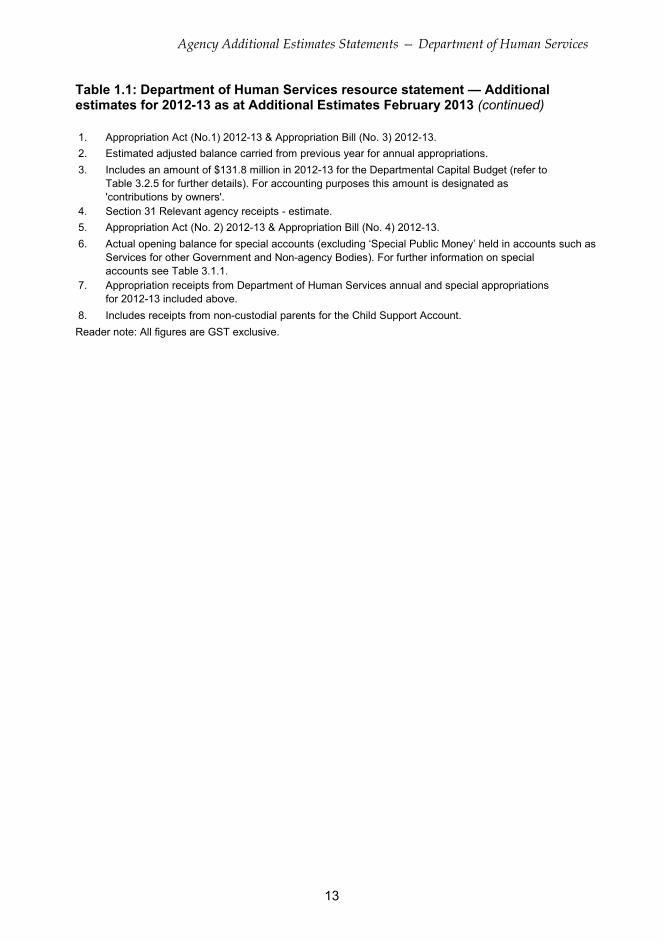
Table 1.1: Department of Human Services resource statement — Additional estimates for 2012-13 as at Additional Estimates February 2013 (continued) 1.
2.
3.
4.
5.
6.
7.
8.
Appropriation Act (No.1) 2012-13 & Appropriation Bill (No. 3) 2012-13.
Estimated adjusted balance carried from previous year for annual appropriations.
Includes an amount of $131.8 million in 2012-13 for the Departmental Capital Budget (refer toTable 3.2.5 for further details). For accounting purposes this amount is designated as'contributions by owners'.Section 31 Relevant agency receipts - estimate.
Appropriation receipts from Department of Human Services annual and special appropriationsfor 2012-13 included above.
Includes receipts from non-custodial parents for the Child Support Account.
Appropriation Act (No. 2) 2012-13 & Appropriation Bill (No. 4) 2012-13.
Actual opening balance for special accounts (excluding ‘Special Public Money’ held in accounts such as Services for other Government and Non-agency Bodies). For further information on specialaccounts see Table 3.1.1.
Reader note: All figures are GST exclusive.

Agency Additional Estimates Statements — Department of Human Services
14
Table 1.1: Department of Human Services resource statement — Additional estimates for 2012-13 as at Additional Estimates February 2013 (continued)
Third Party Payments on behalf of and receipts from other agencies Estimate at Estimate at
Budget AdditionalEstimates
2012-13 2012-13$'000 $'000
Payments made on behalf of other agencies(disclosed in the respective Agency Resource Statement)
Special Appropriation - Social Security (Administration) Act 1999 58,452,239 58,600,666
20,173,888 20,349,832 Special Appropriation - Paid Parental Leave Act 2010 1,426,951 1,426,951 Annual Appropriation - Ex Gratia and Act of Grace Payments 3,762 7,027
Total FaHCSIA 80,056,840 80,384,476
26,100 26,100
Special Appropriation - Social Security (Administration) Act 1999 2,884,000 3,304,692
Total DIISRTE 2,910,100 3,330,792
55,500 212,258 - 10,784
Total AG 55,500 223,042
41,200 41,100 101,900 110,200
1,050 1,050
Total DIT 144,150 152,350
4,437,338 4,596,630 Special Appropriation - Social Security (Administration) Act 1999 14,761,161 14,321,749
Special Appropriation - Student Assistance Act 1973 279,842 281,659
198 198
81,919 110,900 Total DEEWR 19,560,458 19,311,136
12,047 11,949 Total DAFF 12,047 11,949
Annual Appropriation - Bass Strait Passenger Vehicle Equalisation Scheme
Department of Families, Housing, Community Servicesand Indigenous Affairs (FaHCSIA)
Special Appropriation - A New Tax System (Family Assistance) (Administration) Act 1999
Department of Industry, Innovation, Science, Research and Tertiary Education (DIISRTE)
Annual Appropriation - Liquefied Petroleum Gas Vehicle Scheme
Attorney-General's Department (AG)Special Appropriation - Social Security (Administration) Act 1999 - National Security and Criminal Justice
Department of Infrastructure and Transport (DIT)
Annual Appropriation - Ex Gratia assistance - New Zealand citizens
Annual Appropriation - Tasmanian Freight Equalisation Scheme
Annual Appropriation - Tasmanian Wheat Freight Scheme
Department of Education, Employment and Workplace Relations (DEEWR)
Special Appropriation - A New Tax System (Family Assistance) (Administration) Act 1999
Annual Appropriation - Compensation and Debt Relief Annual Appropriation - Child Care For Eligible Parents Undergoing Training
Department of Agriculture, Fisheries and Forestry (DAFF)Annual Appropriation - Transitional Farm Family Payment

Agency Additional Estimates Statements — Department of Human Services
15
Table 1.1: Department of Human Services resource statement — Additional estimates for 2012-13 as at Additional Estimates February 2013 (continued)
Third Party Payments on behalf of and receipts from other agencies (continued) Estimate at Estimate at
Budget AdditionalEstimates
2012-13 2012-13$'000 $'000
Payments made on behalf of other agencies (continued)
Department of Veterans' Affairs (DVA)
4,007,247 4,019,830
9,981 9,991
375 309 Total DVA 4,017,603 4,030,130
Department of Health and Ageing (DoHA)
17,762,805 18,109,858
83,087 83,087
9,734,204 9,614,456
284,682 284,682
4,158,297 4,470,801
112,300 109,089
1,302 1,302
9,168,304 9,260,937
8,317 8,317
63,326 63,326 Total DoHA 41,376,624 42,005,855
Total Third party payments 148,133,322 149,449,730
Attorney-General's Department (AG) 1,073 1,943
Australian Taxation Office (ATO) 116 330
- 1,034
160,668 158,318
Department of Families, Housing, Community Services and Indigenous Affairs (FaHCSIA) 22,507 8,521
Department of Foreign Affairs and Trade (DFAT) 5,947 5,458
Department of Health and Ageing (DoHA) 31,700 15,268
Department of Immigration and Citizenship (DIAC) - 689
Department of Veterans' Affairs (DVA) 33,374 27,844
255,385 219,405
Special Appropriation - National Health Act 1953 - Aids and Appliances
Special Appropriation - Veterans’ Entitlements Act 1986 & Related ActsSpecial Appropriation - Military Rehabilitation and Compensation Act 2004Special Appropriation - Australian Participants in British Nuclear Tests (Treatment) Act 2006
Special Appropriation - Health Insurance Act 1973 - Medical Benefits
Special Appropriation - Dental Benefits Act 2008
Special Appropriation - National Health Act 1953 - Pharmaceutical Benefits
Receipts received from other agencies for the provision of services
Total s31 Relevant agency receipts received for the provision of services
Special Appropriation - Private Health Insurance Act 2007
Special Appropriation - Medical Indemnity Agreement Act 2002
Special Appropriation - Midwife Professional Indemnity (Commonwealth Contribution) Scheme Act 2010
Special Appropriation - Aged Care Act 1997 (Total)
Special Account - Australian Childhood Immunisation RegisterSpecial Appropriation - National Health Act 1953 - Continence Aids Payment
Department of Education, Employment and Workplace Relations (DEEWR)
Department of Broadband, Communications and the Digital Economy (DBCDE)
Agency Additional Estimates Statements — Department of Human Services
16
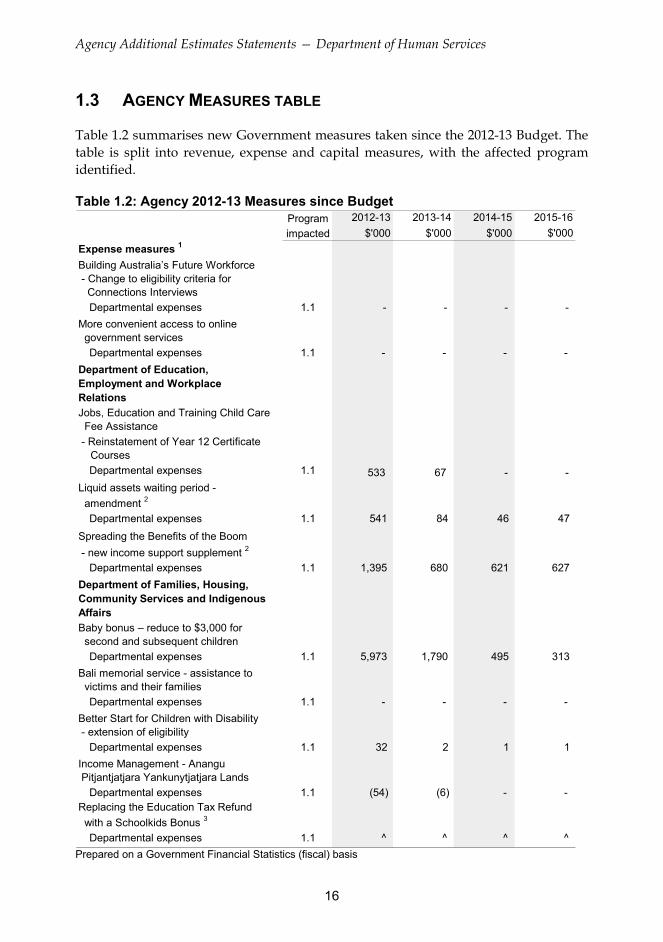
1.3 AGENCY MEASURES TABLE
Table 1.2 summarises new Government measures taken since the 2012-13 Budget. The table is split into revenue, expense and capital measures, with the affected program identified.
Table 1.2: Agency 2012-13 Measures since Budget Program 2012-13 2013-14 2014-15 2015-16
impacted $'000 $'000 $'000 $'000
Expense measures 1
Building Australia’s Future Workforce - Change to eligibility criteria for Connections Interviews
Departmental expenses 1.1 - - - -
More convenient access to online government services
Departmental expenses 1.1 - - - -
Department of Education,Employment and WorkplaceRelations
Jobs, Education and Training Child Care Fee Assistance
- Reinstatement of Year 12 Certificate Courses
Departmental expenses 1.1 533 67 - -
Liquid assets waiting period -
amendment 2
Departmental expenses 1.1 541 84 46 47
Spreading the Benefits of the Boom
- new income support supplement 2
Departmental expenses 1.1 1,395 680 621 627
Department of Families, Housing, Community Services and Indigenous Affairs
Baby bonus – reduce to $3,000 for second and subsequent children
Departmental expenses 1.1 5,973 1,790 495 313
Bali memorial service - assistance to victims and their families
Departmental expenses 1.1 - - - -
Better Start for Children with Disability - extension of eligibility
Departmental expenses 1.1 32 2 1 1
Income Management - Anangu Pitjantjatjara Yankunytjatjara Lands
Departmental expenses 1.1 (54) (6) - - Replacing the Education Tax Refund
with a Schoolkids Bonus 3
Departmental expenses 1.1 ^ ^ ^ ^ Prepared on a Government Financial Statistics (fiscal) basis
Agency Additional Estimates Statements — Department of Human Services
17
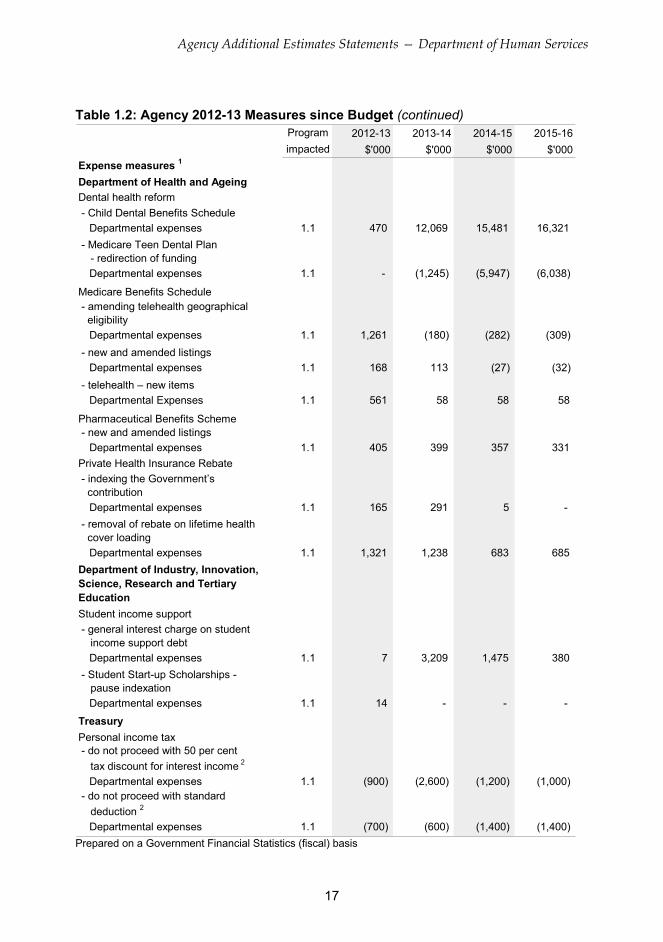
Table 1.2: Agency 2012-13 Measures since Budget (continued) Program 2012-13 2013-14 2014-15 2015-16
impacted $'000 $'000 $'000 $'000
Expense measures 1
Department of Health and Ageing
Dental health reform
- Child Dental Benefits Schedule
Departmental expenses 1.1 470 12,069 15,481 16,321
- Medicare Teen Dental Plan - redirection of funding
Departmental expenses 1.1 - (1,245) (5,947) (6,038)
Medicare Benefits Schedule - amending telehealth geographical eligibility
Departmental expenses 1.1 1,261 (180) (282) (309)
- new and amended listings
Departmental expenses 1.1 168 113 (27) (32)
- telehealth – new items
Departmental Expenses 1.1 561 58 58 58
Pharmaceutical Benefits Scheme - new and amended listings
Departmental expenses 1.1 405 399 357 331
Private Health Insurance Rebate
- indexing the Government’s contribution
Departmental expenses 1.1 165 291 5 -
- removal of rebate on lifetime health cover loading
Departmental expenses 1.1 1,321 1,238 683 685
Department of Industry, Innovation, Science, Research and Tertiary Education
Student income support
- general interest charge on student income support debt
Departmental expenses 1.1 7 3,209 1,475 380
- Student Start-up Scholarships - pause indexation
Departmental expenses 1.1 14 - - -
Treasury
Personal income tax - do not proceed with 50 per cent
tax discount for interest income 2
Departmental expenses 1.1 (900) (2,600) (1,200) (1,000) - do not proceed with standard
deduction 2
Departmental expenses 1.1 (700) (600) (1,400) (1,400) Prepared on a Government Financial Statistics (fiscal) basis

Agency Additional Estimates Statements — Department of Human Services
18
Table 1.2: Agency 2012-13 Measures since Budget (continued) Program 2012-13 2013-14 2014-15 2015-16
impacted $'000 $'000 $'000 $'000
Cross Portfolio
Targeted savings – public service efficiencies
Departmental expenses 1.1 (17,666) (17,172) (17,172) (17,172)
Whole of Government Savings from Paused Grant Programs
Administered expenses 1.1 (3,210) - - -
Total expense measures
Administered (3,210) - - - Departmental (6,474) (1,803) (6,806) (7,188)
Total (9,684) (1,803) (6,806) (7,188)
Capital measures 1
Department of Families, Housing, Community Services and Indigenous Affairs
Income Management – Anangu Pitjantjatjara Yankunytjatjara Lands
Departmental capital 1.1 60 - - - Replacing the Education Tax Refund
with a Schoolkids Bonus 3
Departmental capital 1.1 ^ ^ ^ ^
Department of Health and Ageing
Dental health reform
- Child Dental Benefits Schedule
Departmental capital 1.1 19 1,428 204 46
- Medicare Teen Dental Plan - redirection of funding
Departmental capital 1.1 - 20 - -
Private Health Insurance Rebate
- removal of rebate on lifetime health cover loading
Departmental capital 1.1 2,199 756 2 1
Department of Industry, Innovation, Science, Research and Tertiary Education
Student income support
- general interest charge on student income support debt
Departmental capital 1.1 6 780 - -
Total capital measures
Administered - - - -
Departmental 2,284 2,984 206 47
Total 2,284 2,984 206 47 Prepared on a Government Financial Statistics (fiscal) basis

Agency Additional Estimates Statements — Department of Human Services
19
Table 1.2: Agency 2012-13 Measures since Budget (continued) 1. Measures are listed by lead Portfolio agency where applicable.
2. These late measures were included in the 2012-13 Budget (Budget Paper No. 2), but were not published in the 2012-13 Human Services Portfolio Budget Statements.
3. This was a late 2012-13 Budget measure that was published in Budget Paper No. 2 against various agencies, but was not specifically attributed to the Department of Human Services. Expense funding provided to the Department at Budget was: 2012-13 $8.855 million; 2013-14 $2.737 million; 2014-15 $2.525 million; 2015-16 $2.713 million. Capital funding provided to the Department at Budget was as follows: 2012-13 $1.955 million; 2013-14 $0.080 million; 2014-15 $0.025 million.

Agency Additional Estimates Statements — Department of Human Services
20
1.4 ADDITIONAL ESTIMATES AND VARIATIONS
The following tables detail the changes to the resourcing for the Department of Human Services at Additional Estimates, by outcome. Table 1.3 details the Additional Estimates and variations resulting from new measures since the 2012-13 Budget in Appropriation Bills No. 3 and No. 4. Table 1.4 details Additional Estimates or variations through other factors, such as parameter adjustments.
Table 1.3: Additional estimates and variations to outcomes from measures since 2012-13 Budget
Program 2012-13 2013-14 2014-15 2015-16impacted $'000 $'000 $'000 $'000
Outcome 1Decrease in estimates (administered) Whole of Government Savings from Paused Grant Programs 1.1 (3,210) - - -
Net impact on estimates for Outcome 1 (administered) (3,210) - - -
Increase in estimates (departmental)
Building Australia’s Future Workforce
- Change to eligibility criteria for Connections Interviews 1.1 - - - -
More convenient access to online government services 1.1 - - - -
Jobs, Education and Training Child Care Fee Assistance - Reinstatement of Year 12 Certificate Courses 1.1 533 67 - -
Baby bonus - reduce to $3,000 for second and subsequent children 1.1 5,973 1,790 495 313
Bali memorial service - assistance to victims and their families 1.1 - - - -
Better Start for Children with Disability - extension of eligibility 1.1 32 2 1 1
Liquid assets waiting period - amendment 1.1 541 84 46 47 Replacing the Education Tax
Refund with a Schoolkids Bonus11.1 ^ ^ ^ ^
Spreading the Benefits of the Boom - new income support supplement 1.1 1,395 680 621 627
Dental health reform
- Child Dental Benefits Schedule 1.1 489 13,497 15,685 16,367
Medicare Benefits Schedule
- amending telehealth geographical eligibility 1.1 1,261 (180) (282) (309)
- new and amended listings 1.1 168 113 (27) (32)
- telehealth - new items 1.1 561 58 58 58

Agency Additional Estimates Statements — Department of Human Services
21
Table 1.3: Additional estimates and variations to outcomes from measures since 2012-13 Budget (continued)
Program 2012-13 2013-14 2014-15 2015-16impacted $'000 $'000 $'000 $'000
Increases in estimates (departmental) continued
Pharmaceutical Benefits Scheme - new and amended listings 1.1 405 399 357 331
Private Health Insurance Rebate
- indexing the Government’s contribution 1.1 165 291 5 -
- removal of rebate on lifetime health cover loading 1.1 3,520 1,994 685 686
Student income support
- general interest charge on student income support debt 1.1 13 3,989 1,475 380
- Student Start-up Scholarships - pause indexation 1.1 14 - - -
Decrease in estimates (departmental)
Targeted savings – public service efficiencies 1.1 (17,666) (17,172) (17,172) (17,172)
Income Management – Anangu Pitjantjatjara Yankunytjatjara Lands 1.1 6 (6) - -
Dental health reform - Medicare Teen Dental Plan - redirection of funding 1.1 - (1,225) (5,947) (6,038)
Personal income tax
- do not proceed with 50 per cent tax discount for interest income 1.1 (900) (2,600) (1,200) (1,000)
- do not proceed with standard deduction 1.1 (700) (600) (1,400) (1,400)
Net impact on estimates
for Outcome 1 (departmental) (4,190) 1,181 (6,600) (7,141) 1. This was a late 2012-13 Budget measure that was published in Budget Paper No. 2 against various
agencies, but was not specifically attributed to the Department of Human Services. Expense and capital funding provided to the Department at Budget was: 2012-13 $10.810 million; 2013-14 $2.817 million; 2014-15 $2.550 million; 2015-16 $2.713 million.

Agency Additional Estimates Statements — Department of Human Services
22
Table 1.4: Additional estimates and variations to outcomes from other variations Program 2012-13 2013-14 2014-15 2015-16impacted ($'000) ($'000) ($'000) ($'000)
Outcome 1Decrease in estimates (administered)
Economic parameter update - Administered Expenses 1.1 - (9) (13) -
Other changes in program specific parameters 1.2 (120) (137) (140) (144)
Net impact on estimates for Outcome 1 (administered) (120) (146) (153) (144)
Increase in estimates (departmental)Pharmaceutical Benefits Scheme - funding to implement legislative changes 1.1 3,387 - - -
More convenient access to online government services 1.1 - - (3,578) 3,578 Response to the expert panel
- Permanent migration program - additional family stream places from 2012-13 1.1 268 782 1,065 1,428
- Humanitarian migration program - additional places from 2012-13 1.1 2,903 5,624 7,479 9,233 Replacing the Education Tax Refund with a Schoolkids
Bonus 1 1.1 11,068 2,451 2,177 1,914
Spreading the Benefits of the Boom
- increasing the rate of Family Tax Benefit Part A 1.1 7,846 3,185 2,443 1,473
Dental health – reallocation of Chronic Disease Dental Scheme 1.1 3,816 98 - -
Family Assistance Office transfer of funding from FaHCSIA 1.1 9,114 9,144 9,201 9,283
Medicare Benefit Schedule
- removing out of hospital benefits for complex medical procedures 1.1 31 - - -
Decrease in estimates (departmental)Comcover reduction 1.1 (375) (391) (409) (409)
Early release of superannuation - adjustment to match levy determination 1.1 (15) - - - Economic parameter update - Departmental expenses 1.1 - (18,064) (24,350) (27,567) - Departmental Capital Budget 1.1 - (502) (1,324) (1,519) Change in workload volumes 1.1 2,759 (6,659) (6,467) (6,671)
Net impact on estimates for Outcome 1 (departmental) 40,802 (4,332) (13,763) (9,257)
1. Reflects subsequent adjustment to funding following the government measure shown in table 1.3.

Agency Additional Estimates Statements — Department of Human Services
23
1.5 BREAKDOWN OF ADDITIONAL ESTIMATES BY APPROPRIATION
BILL
The following tables detail the Additional Estimates sought for the Department of Human Services through Appropriation Bills No. 3 and No. 4.
Table 1.5: Appropriation Bill (No. 3) 2012-13 2011-12 2012-13 2012-13 Additional Reduced
Available Budget Revised Estimates Estimates($'000) ($'000) ($'000) ($'000) ($'000)
ADMINISTERED ITEMSOutcome 1
Support individuals, families and communities to achieve greater self-sufficiency; through the delivery of policy advice and high quality accessible social, health and child support services and other payments; and support providers and businesses through convenient and efficient service delivery.
7,117 18,084 14,754 - (3,330)
Total 7,117 18,084 14,754 - (3,330)
DEPARTMENTAL PROGRAMSOutcome 1
Support individuals, families and communities to achieve greater self-sufficiency; through the delivery of policy advice and high quality accessible social, health and child support services and other payments; and support providers and businesses through convenient and efficient service delivery.
4,267,616 4,007,694 4,039,132 59,252 (27,814)
Total 4,267,616 4,007,694 4,039,132 59,252 (27,814)
Total administered and departmental 4,274,733 4,025,778 4,053,886 59,252 (31,144)
Agency Additional Estimates Statements — Department of Human Services
24
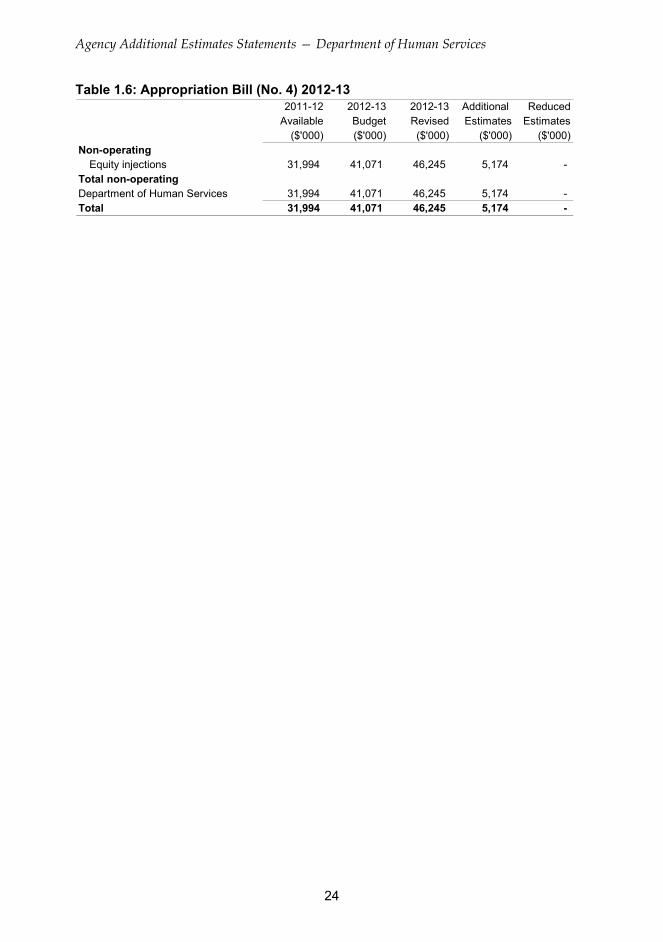
Table 1.6: Appropriation Bill (No. 4) 2012-13 2011-12 2012-13 2012-13 Additional Reduced
Available Budget Revised Estimates Estimates($'000) ($'000) ($'000) ($'000) ($'000)
Non-operatingEquity injections 31,994 41,071 46,245 5,174 -
Total non-operatingDepartment of Human Services 31,994 41,071 46,245 5,174 - Total 31,994 41,071 46,245 5,174 -

Agency Additional Estimates Statements — Department of Human Services
25
Section 2: Revisions to agency resources and planned performance
2.1 RESOURCES AND PERFORMANCE INFORMATION
There have been no changes to the Department of Human Services outcome and program structure since the 2012-13 Budget. Full details can be found in the 2012-13 Portfolio Budget Statements.
OUTCOME 1
Outcome 1 strategy
There have been no changes to the Department of Human Services outcome strategy since the 2012-13 Budget. Full details can be found in the 2012-13 Portfolio Budget Statements.
Agency Additional Estimates Statements — Department of Human Services
26
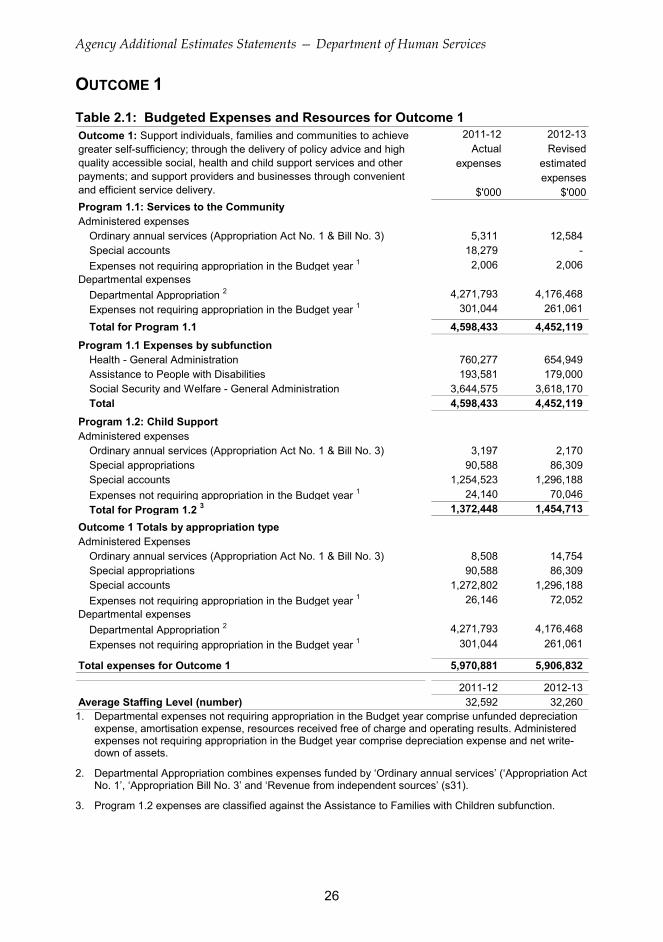
OUTCOME 1
Table 2.1: Budgeted Expenses and Resources for Outcome 1 2011-12 2012-13
Actual Revisedexpenses estimated
expenses$'000 $'000
Program 1.1: Services to the CommunityAdministered expenses
Ordinary annual services (Appropriation Act No. 1 & Bill No. 3) 5,311 12,584 Special accounts 18,279 -
Expenses not requiring appropriation in the Budget year 1 2,006 2,006 Departmental expenses
Departmental Appropriation 2 4,271,793 4,176,468
Expenses not requiring appropriation in the Budget year 1 301,044 261,061
Total for Program 1.1 4,598,433 4,452,119
Program 1.1 Expenses by subfunctionHealth - General Administration 760,277 654,949 Assistance to People with Disabilities 193,581 179,000 Social Security and Welfare - General Administration 3,644,575 3,618,170 Total 4,598,433 4,452,119
Program 1.2: Child SupportAdministered expenses
Ordinary annual services (Appropriation Act No. 1 & Bill No. 3) 3,197 2,170 Special appropriations 90,588 86,309 Special accounts 1,254,523 1,296,188
Expenses not requiring appropriation in the Budget year 1 24,140 70,046
Total for Program 1.2 3 1,372,448 1,454,713
Outcome 1 Totals by appropriation typeAdministered Expenses
Ordinary annual services (Appropriation Act No. 1 & Bill No. 3) 8,508 14,754 Special appropriations 90,588 86,309 Special accounts 1,272,802 1,296,188
Expenses not requiring appropriation in the Budget year 1 26,146 72,052 Departmental expenses
Departmental Appropriation 2 4,271,793 4,176,468
Expenses not requiring appropriation in the Budget year 1 301,044 261,061
Total expenses for Outcome 1 5,970,881 5,906,832
2011-12 2012-13Average Staffing Level (number) 32,592 32,260
Outcome 1: Support individuals, families and communities to achieve greater self-sufficiency; through the delivery of policy advice and high quality accessible social, health and child support services and other payments; and support providers and businesses through convenient and efficient service delivery.
1. Departmental expenses not requiring appropriation in the Budget year comprise unfunded depreciation
expense, amortisation expense, resources received free of charge and operating results. Administered expenses not requiring appropriation in the Budget year comprise depreciation expense and net write-down of assets.
2. Departmental Appropriation combines expenses funded by ‘Ordinary annual services’ (‘Appropriation Act No. 1’, ‘Appropriation Bill No. 3’ and ‘Revenue from independent sources’ (s31).
3. Program 1.2 expenses are classified against the Assistance to Families with Children subfunction.

Agency Additional Estimates Statements — Department of Human Services
27
Program 1.1 Objective
There have been no changes to Program 1.1 Objective since the 2012-13 Budget. Full details can be found in the 2012-13 Portfolio Budget Statements.
Program 1.1 Expenses
2011-12 2012-13 2013-14 2014-15 2015-16Actual Revised Forward Forward Forward
budget year 1 year 2 year 3$'000 $'000 $'000 $'000 $'000
Annual administered expenses:Income Management Card 2,552 5,006 5,006 3,000 -
Future Workforce 2,759 7,578 9,812 8,838 - Administered expenses not requiring
appropriation in the Budget year 1 2,006 2,006 2,006 2,005 1,970
Special Account Expenses: Compensation Recoveries 18,279 - - - -
Annual departmental expensesfunded by:Ordinary annual services (Appropriation Bills No. 1 & 3) 3,938,277 3,895,456 3,797,682 3,652,071 3,613,819
Revenues from other sources 333,516 281,012 280,402 276,757 277,972 Departmental expenses not requiring
appropriation in the Budget year 2 301,044 261,061 212,097 206,545 214,935
Total program expenses 4,598,433 4,452,119 4,307,005 4,149,216 4,108,696
Expenses by subfunctionDepartmental
Health - General Administration 760,277 654,949 652,063 635,539 634,604
Assistance to People with Disabilities 193,581 179,000 178,765 178,531 178,531
Social Security and Welfare - General Administration 3,618,979 3,603,580 3,459,353 3,321,303 3,293,591
Total Departmental 4,572,837 4,437,529 4,290,181 4,135,373 4,106,726
AdministeredSocial Security and Welfare - General Administration 25,596 14,590 16,824 13,843 1,970
Total Administered 25,596 14,590 16,824 13,843 1,970
Total Expenses by Sub Function 4,598,433 4,452,119 4,307,005 4,149,216 4,108,696
1. Administered expenses not requiring appropriation in the Budget year comprise depreciation expense and net write-down of assets.
2. Departmental expenses not requiring appropriation in the Budget year comprise unfunded depreciation expense, amortisation expense, resources received free of charge and operating results.
Program 1.1 Deliverables
There have been no changes to Program 1.1 Deliverables since the 2012-13 Budget. Full details appear in the 2012-13 Portfolio Budget Statements.
Program 1.1 Key Performance Indicators
There have been no changes to Program 1.1 Key Performance Indicators since the 2012-13 Budget. Full details can be found in the 2012-13 Portfolio Budget Statements.
Agency Additional Estimates Statements — Department of Human Services
28
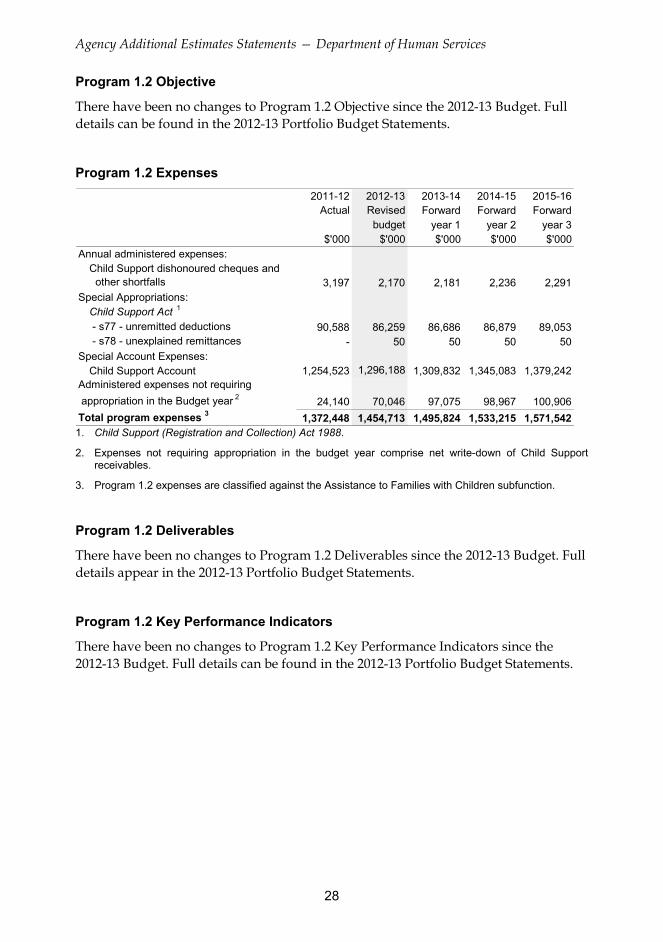
Program 1.2 Objective
There have been no changes to Program 1.2 Objective since the 2012-13 Budget. Full details can be found in the 2012-13 Portfolio Budget Statements.
Program 1.2 Expenses
2011-12 2012-13 2013-14 2014-15 2015-16Actual Revised Forward Forward Forward
budget year 1 year 2 year 3 $'000 $'000 $'000 $'000 $'000Annual administered expenses:
Child Support dishonoured cheques and other shortfalls 3,197 2,170 2,181 2,236 2,291
Special Appropriations:Child Support Act 1
- s77 - unremitted deductions 90,588 86,259 86,686 86,879 89,053 - s78 - unexplained remittances - 50 50 50 50
Special Account Expenses: Child Support Account 1,254,523 1,296,188 1,309,832 1,345,083 1,379,242
Administered expenses not requiring
appropriation in the Budget year 224,140 70,046 97,075 98,967 100,906
Total program expenses 3 1,372,448 1,454,713 1,495,824 1,533,215 1,571,542 1. Child Support (Registration and Collection) Act 1988.
2. Expenses not requiring appropriation in the budget year comprise net write-down of Child Support receivables.
3. Program 1.2 expenses are classified against the Assistance to Families with Children subfunction.
Program 1.2 Deliverables
There have been no changes to Program 1.2 Deliverables since the 2012-13 Budget. Full details appear in the 2012-13 Portfolio Budget Statements.
Program 1.2 Key Performance Indicators
There have been no changes to Program 1.2 Key Performance Indicators since the 2012-13 Budget. Full details can be found in the 2012-13 Portfolio Budget Statements.

Agency Additional Estimates Statements — Department of Human Services
29
Section 3: Explanatory tables and budgeted financial statements
3.1 EXPLANATORY TABLES
Estimates of special account flows
Special accounts provide a means to set aside and record amounts used for specified purposes. Table 3.1.1 shows the expected additions (receipts) and reductions (payments) for each account used by the Department of Human Services. The corresponding table in the 2012-13 Portfolio Budget Statements is Table 3.1.2.
Table 3.1.1: Estimates of special account flows Opening Closingbalance Receipts Payments Adjustments balance2012-13 2012-13 2012-13 2012-13 2012-132011-12 2011-12 2011-12 2011-12 2011-12
Outcome $'000 $'000 $'000 $'000 $'000
Child Support Account 1 (A) 1 58,838 1,457,769 (1,457,769) - 58,838
54,683 1,262,276 (1,258,121) - 58,838
1 75,029 285,245 (275,760) - 84,514 57,099 273,703 (255,773) - 75,029
Superannuation Clearing 1 8,948 748,042 (740,946) - 16,044
House Special Account 3 (A) 1,967 325,495 (318,514) - 8,948
1 - - - - -
101 387 (488) - -
Total special accounts 2012-13 Budget Estimate 142,815 2,491,056 (2,474,475) - 159,396
Total special accounts2011-12 Actual 113,850 1,861,861 (1,832,896) - 142,815
Recovery of Compensationfor Health Care & Other
Services Special Account 2 (A)
Services for Other Entitiesand Trust Moneys –Department of Human
Services Special Account 4
(A) & (D)
(A) = Administered (D) = Departmental
1. Child Support Account - s73 Child Support (Registration and Collection) Act 1988. Purpose: For the receipt of maintenance payments and the making of regular and timely payments to custodial parents.
2. Recovery of Compensation for Health Care and Other Services Special Account - s20 FMA Act Determination 2005/24. Purpose: To credit monies for the purpose of recovery of compensation following a judgement or settlement under the Health and Other Services (Compensation) Act 1995 and;
(a) to pay the claimant, or the claimant’s authorised representative, amounts credited to the Special Account; and
(b) to reduce the balance of the Special Account (and, therefore, the available appropriation for the Special Account) without making a real or notional payment; and
(c) to repay amounts where an Act or other law requires or permits the repayment of an amount received.

Agency Additional Estimates Statements — Department of Human Services
30
Table 3.1.1: Estimates of special account flows (continued)
3. Superannuation Clearing House Special Account - s20 FMA Act Determination 2010/05. Purpose: To receive amounts for the purpose of the Superannuation Clearing House and:
(a) make payments to superannuation funds on behalf of small business employers in performance of the functions of the Superannuation Clearing House;
(b) repay to an original payer amounts credited to the Special Account, including the residual after any necessary payments are made for the purpose mentioned in paragraph (a);
(c) reduce the balance of the Special Account (and, therefore the available appropriation for the Special Account) without making a real or notional payment; and
(d) repay amounts where an Act or other law requires or permits the repayment of an amount received.
4. Services for Other Entities and Trust Moneys Department of Human Services Special Account - s20(1) FMA Act Determination 2011/13. Purpose: To credit and debit monies for the purpose of:
(a) disbursing amounts held on trust or otherwise for the benefit of a person other than the Commonwealth;
(b) disbursing amounts in connection with services performed on behalf of other governments and bodies that are not FMA Act agencies;
(c) repaying amounts where an Act or other law requires or permits the repayment of an amount received; and
(d) reducing the balance of the Special Account (and, therefore, the available appropriation for the Account) without making a real or notional payment.

Agency Additional Estimates Statements — Department of Human Services
31
3.2 BUDGETED FINANCIAL STATEMENTS
3.2.1 Analysis of budgeted financial statements
Departmental comprehensive income statement (Table 3.2.1)
Since the 2012-13 Budget, revenue from government in 2012-13 has increased by $21.5 million, mainly due to an increase in appropriation for variations other than measures of $33.1 million, offset by:
a decrease of $6.5 million in appropriation revenue for new measures as per Table 1.2; and
a $5.2 million reduction in appropriation revenue due to a transfer of operating funding to Departmental Capital Budget as part of the measure 'More convenient access to online government services'.
Own-source revenue has decreased by $19.1 million since the 2012-13 Budget comprising reductions in revenue ($36.0 million) from service agreements with other agencies including the Department of Families, Housing, Community Services and Indigenous Affairs decreasing by $14.0 million; Department of Health and Ageing decreasing by $16.4 million; and Department of Veterans' Affairs decreasing by $5.5 million. This is offset by an increase of $16.9 million for services provided to external entities.
Expenses in 2012-13 have increased by $14.5 million since the 2012-13 Budget, mainly due to increased depreciation expense.
Departmental balance sheet (Table 3.2.2)
Movements in balances since the 2012-13 Budget are mainly due to differences between the estimated actual 2011-12 balances as at Budget and actual 2011-12 balances as at 30 June 2012.
Departmental statement of changes in equity (Table 3.2.3)
Total equity has decreased by $33.0 million since the 2012-13 Budget estimate mainly due to differences between the estimated actual for equity items at Budget (in May 2012) and the actual 2011-12 balances as at 30 June 2012.
Departmental cash flow (Table 3.2.4)
Since Budget, cash flows have been affected by new measures, changes in expenses and changes in own-source revenue. Overall, net cash held has decreased by $1.7 million since Budget.

Agency Additional Estimates Statements — Department of Human Services
32
3.2.1 Analysis of budgeted financial statements (continued)
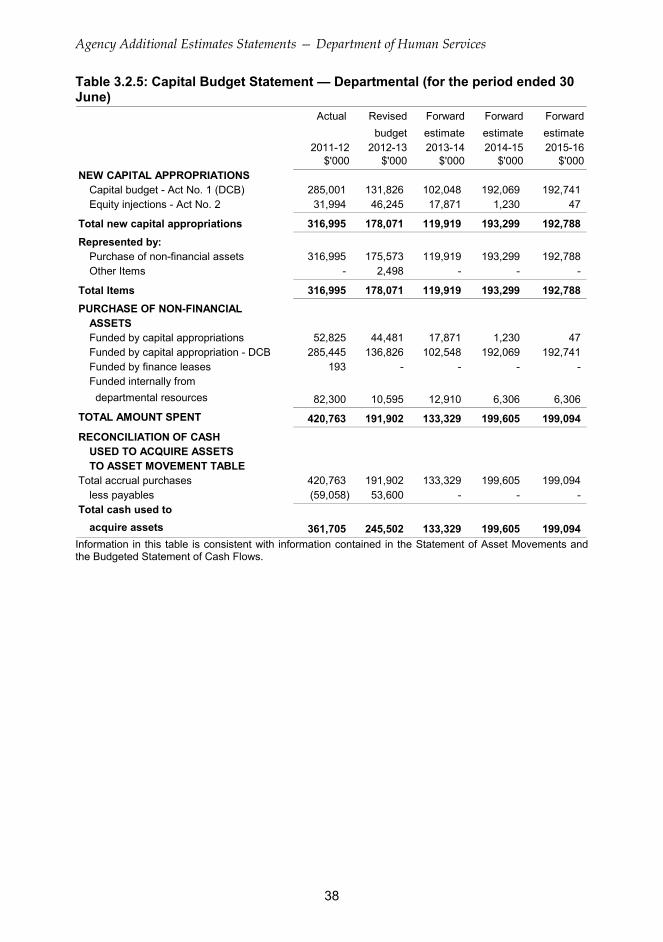
Departmental capital budget statement (Table 3.2.5)
Since Budget, the 2012-13 Departmental Capital Budget has increased by $5.2 million, with variations in the forward years mainly due to reallocation of operating funding to the Departmental Capital Budget as part of the measure 'More convenient access to online government services'. Equity injection appropriations in 2012-13 have increased by $5.2 million due to new measures.
Statement of departmental asset movements (Table 3.2.6)
Total land, buildings, property, plant & equipment and intangible assets have increased by $55.1 million since Budget, mainly due to the opening balance being $50.4 million more than estimated at Budget, and an overall increase of $10.3 million in asset purchases for 2012-13 as a result of new measures.
Agency Additional Estimates Statements — Department of Human Services
33
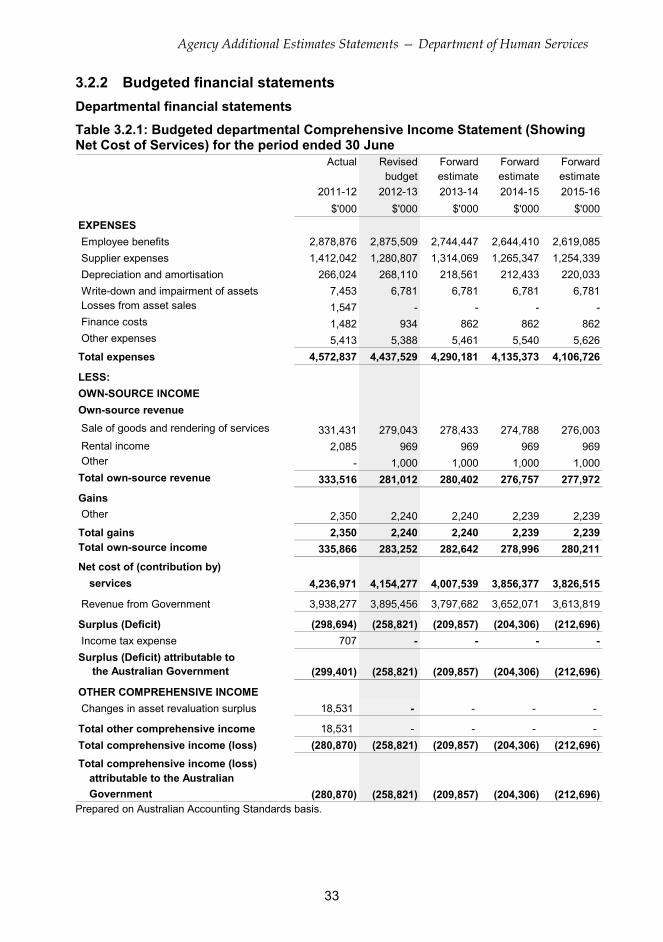
3.2.2 Budgeted financial statements
Departmental financial statements
Table 3.2.1: Budgeted departmental Comprehensive Income Statement (Showing Net Cost of Services) for the period ended 30 June
Actual Revised Forward Forward Forwardbudget estimate estimate estimate
2011-12 2012-13 2013-14 2014-15 2015-16
$'000 $'000 $'000 $'000 $'000
EXPENSES
Employee benefits 2,878,876 2,875,509 2,744,447 2,644,410 2,619,085
Supplier expenses 1,412,042 1,280,807 1,314,069 1,265,347 1,254,339
Depreciation and amortisation 266,024 268,110 218,561 212,433 220,033
Write-down and impairment of assets 7,453 6,781 6,781 6,781 6,781 Losses from asset sales 1,547 - - - - Finance costs 1,482 934 862 862 862 Other expenses 5,413 5,388 5,461 5,540 5,626
Total expenses 4,572,837 4,437,529 4,290,181 4,135,373 4,106,726
LESS:
OWN-SOURCE INCOME
Own-source revenue
Sale of goods and rendering of services 331,431 279,043 278,433 274,788 276,003
Rental income 2,085 969 969 969 969 Other - 1,000 1,000 1,000 1,000Total own-source revenue 333,516 281,012 280,402 276,757 277,972
Gains
Other 2,350 2,240 2,240 2,239 2,239
Total gains 2,350 2,240 2,240 2,239 2,239Total own-source income 335,866 283,252 282,642 278,996 280,211
Net cost of (contribution by)
services 4,236,971 4,154,277 4,007,539 3,856,377 3,826,515
Revenue from Government 3,938,277 3,895,456 3,797,682 3,652,071 3,613,819
Surplus (Deficit) (298,694) (258,821) (209,857) (204,306) (212,696)
Income tax expense 707 - - - -
Surplus (Deficit) attributable to the Australian Government (299,401) (258,821) (209,857) (204,306) (212,696)
OTHER COMPREHENSIVE INCOME
Changes in asset revaluation surplus 18,531 - - - -
Total other comprehensive income 18,531 - - - -
Total comprehensive income (loss) (280,870) (258,821) (209,857) (204,306) (212,696)
Total comprehensive income (loss)attributable to the Australian
Government (280,870) (258,821) (209,857) (204,306) (212,696)Prepared on Australian Accounting Standards basis.

Agency Additional Estimates Statements — Department of Human Services
34
Table 3.2.1: Budgeted departmental Comprehensive Income Statement (Showing Net Cost of Services) for the period ended 30 June (continued) Note: Impact of Net Cash Appropriation Arrangements
Actual Revised Forward Forward Forward
budget estimate estimate estimate
2011-12 2012-13 2013-14 2014-15 2015-16
$'000 $'000 $'000 $'000 $'000
Total Comprehensive Income
(loss) less depreciation/amortisation
expenses previously funded throughrevenue appropriations (20,111) - - - -
plus depreciation/amortisation expensespreviously funded through revenue
appropriations1 (260,759) (258,821) (209,857) (204,306) (212,696)
Total comprehensive Income
(loss) - as per the Statement of
Comprehensive Income (280,870) (258,821) (209,857) (204,306) (212,696)
Prepared on Australian Accounting Standards basis.
1. From 2010-11, the Government introduced net cash appropriation arrangements where Appropriation Act No. 1 or Bill No. 3 revenue appropriations for the depreciation/amortisation expenses of FMA Act agencies were replaced with a separate capital budget (the Departmental Capital Budget, or DCB) provided through Appropriation Act No. 1 or Bill No. 3 equity appropriations. For information regarding DCBs, please refer to Table 3.2.5 Departmental Capital Budget Statement.

Agency Additional Estimates Statements — Department of Human Services
35
Table 3.2.2: Budgeted departmental balance sheet (as at 30 June) Actual Revised Forward Forward Forward
budget estimate estimate estimate2011-12 2012-13 2013-14 2014-15 2015-16
$'000 $'000 $'000 $'000 $'000
ASSETSFinancial assets
Cash and cash equivalents 24,065 24,343 24,665 24,909 24,924Trade and other receivables 857,150 839,235 799,481 776,651 710,479Other financial assets 113 113 113 113 113
Total financial assets 881,328 863,691 824,259 801,673 735,516
Non-financial assetsLand and buildings 387,229 322,904 298,799 303,462 309,638Property, plant and equipment 190,633 188,443 150,131 148,100 141,787Intangibles 412,702 396,236 366,646 344,411 316,834Other non-financial assets 148,480 71,280 72,492 73,869 75,273
Total non-financial assets 1,139,044 978,863 888,068 869,842 843,532Total assets 2,020,372 1,842,554 1,712,327 1,671,515 1,579,048
LIABILITIES
PayablesSuppliers 393,633 289,434 287,293 280,265 278,539Other payables 103,255 98,309 103,208 109,653 45,822
Total payables 496,888 387,743 390,501 389,918 324,361
Interest bearing liabilitiesLeases 238 - - - -
Total interest bearing liabilities 238 - - - -
ProvisionsEmployee provisions 848,270 858,163 815,116 785,894 778,892Other 54,728 59,646 59,646 59,646 59,646
Total provisions 902,998 917,809 874,762 845,540 838,538
Total liabilities 1,400,124 1,305,552 1,265,263 1,235,458 1,162,899
Net assets 620,248 537,002 447,064 436,057 416,149EQUITYParent entity interest
Contributed equity 904,339 1,079,912 1,199,831 1,393,130 1,585,918Reserves 34,289 34,291 34,291 34,291 34,291Retained surplus (accumulated deficit) (318,380) (577,201) (787,058) (991,364) (1,204,060)
Total parent entity interest 620,248 537,002 447,064 436,057 416,149
Total equity 620,248 537,002 447,064 436,057 416,149 Prepared on Australian Accounting Standards basis.

Agency Additional Estimates Statements — Department of Human Services
36
Table 3.2.3: Departmental statement of changes in equity — summary of movement (Budget Year 2012-13)
Retained Asset Contributed Totalearnings revaluation equity/ equity
reserve capital$'000 $'000 $'000 $'000
Opening balance as at 1 July 2012Balance carried forward from
previous period (318,380) 34,289 904,339 620,248
Comprehensive incomeNet asset revaluation - non-financial assets - 2 - 2Surplus (deficit) for the period (258,821) (258,821)
Total comprehensive income (258,821) 2 - (258,819)
of which:Attributable to the Australian Government (258,821) 2 - (258,819)
Transactions with ownersContribution by owners
Equity Injection - Appropriation - - 43,747 43,747Departmental Capital Budget (DCB) - - 131,826 131,826
Sub-total transactions with owners - - 175,573 175,573
Estimated closing balance as at 30 June 2013 (577,201) 34,291 1,079,912 537,002Closing balance attributable to the
Australian Government (577,201) 34,291 1,079,912 537,002 Prepared on Australian Accounting Standards basis.

Agency Additional Estimates Statements — Department of Human Services
37
Table 3.2.4: Budgeted departmental statement of cash flows (for the period ended 30 June)
Actual Revised Forward Forward Forwardbudget estimate estimate estimate
2011-12 2012-13 2013-14 2014-15 2015-16$'000 $'000 $'000 $'000 $'000
OPERATING ACTIVITIESCash received
Goods and services 402,597 316,406 306,454 303,574 304,266Appropriations 3,885,674 3,899,826 3,837,559 3,674,501 3,680,173Section 31 receipts redrawn from OPA 402,597 317,405 307,455 304,574 305,266Net GST received 142,664 113,944 111,243 112,582 110,916Other - 1,000 1,000 1,000 1,000
Total cash received 4,833,532 4,648,581 4,563,711 4,396,231 4,401,621
Cash usedEmployees 2,746,239 2,865,060 2,782,668 2,667,266 2,690,004Suppliers 1,657,462 1,395,964 1,454,969 1,412,380 1,394,490
Section 31 receipts transferred to OPA 419,937 317,406 307,454 304,574 305,266Other 316 5,440 5,388 5,461 5,540
Total cash used 4,823,954 4,583,870 4,550,479 4,389,681 4,395,300Net cash from (used by)
operating activities 9,578 64,711 13,232 6,550 6,321
INVESTING ACTIVITIESCash received
Proceeds from sales of property,plant, equipment and intangibles 39 - - - -
Total cash received 39 - - - -
Cash usedPurchase of property, plant,
equipment and intangibles 361,705 245,502 133,329 199,605 199,094
Total cash used 361,705 245,502 133,329 199,605 199,094Net cash from (used by)
investing activities (361,666) (245,502) (133,329) (199,605) (199,094)
FINANCING ACTIVITIESCash received
Contributed equity 365,228 181,307 120,419 193,299 192,788
Total cash received 365,228 181,307 120,419 193,299 192,788
Cash usedFinance leases 775 238 - - -
Total cash used 775 238 - - -Net cash from (used by)
financing activities 364,453 181,069 120,419 193,299 192,788
Net increase or (decrease)in cash held 12,365 278 322 244 15
Cash and cash equivalents at thebeginning of the reporting period 11,700 24,065 24,343 24,665 24,909
Cash and cash equivalents at the end of the reporting period 24,065 24,343 24,665 24,909 24,924
Prepared on Australian Accounting Standards basis.
Agency Additional Estimates Statements — Department of Human Services
38
Table 3.2.5: Capital Budget Statement — Departmental (for the period ended 30 June)
Actual Revised Forward Forward Forward
budget estimate estimate estimate2011-12 2012-13 2013-14 2014-15 2015-16
$'000 $'000 $'000 $'000 $'000NEW CAPITAL APPROPRIATIONS
Capital budget - Act No. 1 (DCB) 285,001 131,826 102,048 192,069 192,741 Equity injections - Act No. 2 31,994 46,245 17,871 1,230 47
Total new capital appropriations 316,995 178,071 119,919 193,299 192,788
Represented by:Purchase of non-financial assets 316,995 175,573 119,919 193,299 192,788 Other Items - 2,498 - - -
Total Items 316,995 178,071 119,919 193,299 192,788
PURCHASE OF NON-FINANCIALASSETSFunded by capital appropriations 52,825 44,481 17,871 1,230 47 Funded by capital appropriation - DCB 285,445 136,826 102,548 192,069 192,741 Funded by finance leases 193 - - - - Funded internally from
departmental resources 82,300 10,595 12,910 6,306 6,306
TOTAL AMOUNT SPENT 420,763 191,902 133,329 199,605 199,094
RECONCILIATION OF CASHUSED TO ACQUIRE ASSETSTO ASSET MOVEMENT TABLE
Total accrual purchases 420,763 191,902 133,329 199,605 199,094 less payables (59,058) 53,600 - - -
Total cash used to
acquire assets 361,705 245,502 133,329 199,605 199,094 Information in this table is consistent with information contained in the Statement of Asset Movements and the Budgeted Statement of Cash Flows.

39
Agency Additional Estimates Statement — Department of Human Services
Tab
le 3
.2.6
: S
tate
men
t o
f D
epar
tmen
tal A
sset
Mo
vem
ents
(B
ud
get
Yea
r 20
12-1
3)
Land
Bui
ldin
gsO
ther
pro
pert
y,In
tang
ible
sT
otal
plan
t an
deq
uipm
ent
$'00
0$'
000
$'00
0$'
000
$'00
0
As
at 1
Ju
ly 2
012
Gro
ss b
ook
valu
e
6,
438
419
,248
2
37,7
96
54
7,23
8
1,21
0,72
0 A
ccum
ulat
ed d
epre
ciat
ion/
amor
tisat
ion
and
impa
irmen
t
-
(38
,457
)
(
47,1
63)
(134
,536
)
(22
0,15
6)O
pen
ing
net
bo
ok
bal
ance
6,43
8
3
80,7
91
190
,633
412,
702
990
,564
CA
PIT
AL
AS
SE
T A
DD
ITIO
NS
Est
imat
ed e
xpen
dit
ure
on
new
or
rep
lace
men
t as
sets
By
purc
hase
- a
ppro
pria
tion
equi
ty 1
-
-
2,6
75
4
1,80
6
44,
481
By
purc
hase
- a
ppro
pria
tion
ordi
nary
annu
al s
ervi
ces
2
-
48,
859
6
1,46
1
26,
506
13
6,82
6 B
y pu
rcha
se -
oth
er
-
3,47
5
1,
773
5,3
47
10
,595
To
tal
add
itio
ns
-
5
2,33
4
65,
909
7
3,65
9
191,
902
Oth
er m
ove
men
tsD
epre
ciat
ion/
amor
tisat
ion
expe
nse
-
(11
6,66
0)
(
67,0
37)
(8
4,41
3)
(26
8,11
0)O
ther
-
1
(
1,06
2)
(5
,712
)
(6,
773)
As
at 3
0 Ju
ne
2013
Gro
ss b
ook
valu
e
6,
438
471
,583
3
02,6
43
61
5,18
5
1,39
5,84
9 A
ccum
ulat
ed d
epre
ciat
ion/
amor
tisat
ion
and
impa
irmen
t
-
(
155,
117)
(
114,
200)
(218
,949
)
(48
8,26
6)C
losi
ng
net
bo
ok
bal
ance
6,43
8
3
16,4
66
188
,443
396,
236
907
,583
P
repa
red
on
Aus
tral
ian
Acc
ount
ing
Sta
ndar
ds b
asis
.
1.
"App
ropr
iatio
n eq
uity
" re
fers
to e
quity
inje
ctio
ns p
rovi
ded
thro
ugh
App
ropr
iatio
n B
ills
(No.
2 &
4)
2012
-13.
2.
"App
ropr
iatio
n or
dina
ry a
nnua
l ser
vice
s" r
efer
s to
fund
ing
prov
ided
thr
ough
App
rop
riatio
n B
ills
(No.
1 &
3)
2012
-13
for
Dep
artm
ent
al C
api
tal B
udge
t.

Agency Additional Estimates Statement — Department of Human Services
40
Schedule of administered activity
Administered income and expenses (Table 3.2.7)
Administered expenses have increased by $96.2 million since Budget due to an increase in child support maintenance payments.
Administered assets and liabilities (Table 3.2.8)
Net receivables have increased by $129.6 million since Budget mainly due to a decrease in the provision for doubtful debts for the child support program resulting from the advice of an actuarial review in 2011-12.

Agency Additional Estimates Statements — Department of Human Services
41
Table 3.2.7: Schedule of budgeted income and expenses administered on behalf of government (for the period ended 30 June)
Actual Revised Forward Forward Forwardbudget estimate estimate estimate
2011-12 2012-13 2013-14 2014-15 2015-16$'000 $'000 $'000 $'000 $'000
EXPENSES ADMINISTERED ONBEHALF OF GOVERNMENTSupplier expenses 2,552 5,006 5,006 3,000 - Grants 2,759 7,578 9,812 8,838 - Depreciation and amortisation 36 36 36 35 - Write-down and impairment of assets 26,110 72,016 99,045 100,937 102,876Other expenses 1,366,587 1,384,667 1,398,749 1,434,248 1,470,636
Total expenses administeredon behalf of Government 1,398,044 1,469,303 1,512,648 1,547,058 1,573,512
LESS:OWN-SOURCE INCOMEOwn-source revenueNon-taxation revenue
Compensation Recoveries 18,279 - - - - Fees and fines 52,829 54,694 59,883 61,318 62,788Dividends 3,993 644 - - - Competitive Neutrality Revenue 8,889 4,498 3,713 3,857 4,011Other revenue 1,271,417 1,411,639 1,448,488 1,484,700 1,521,817
Total non-taxation revenue 1,355,407 1,471,475 1,512,084 1,549,875 1,588,616Total own-source revenues
administered on behalf ofGovernment 1,355,407 1,471,475 1,512,084 1,549,875 1,588,616
GainsReversal of previous asset
write-downs and impairments 57,707 - - - - Total gains administered
on behalf of Government 57,707 - - - -
Total own-source incomeadministered on behalf ofGovernment 1,413,114 1,471,475 1,512,084 1,549,875 1,588,616
Net Cost of (contribution by)services 15,070 2,172 (564) 2,817 15,104
Surplus (Deficit) 15,070 2,172 (564) 2,817 15,104
OTHER COMPREHENSIVE INCOMEChanges in asset revaluation surplus - - - - -
Total other comprehensive income - - - - -
Total comprehensive income (loss) 15,070 2,172 (564) 2,817 15,104Prepared on Australian Accounting Standards basis.

Agency Additional Estimates Statements — Department of Human Services
42
Table 3.2.8: Schedule of budgeted assets and liabilities administered on behalf of government (as at 30 June)
Actual Revised Forward Forward Forwardbudget estimate estimate estimate
2011-12 2012-13 2013-14 2014-15 2015-16$'000 $'000 $'000 $'000 $'000
ASSETS ADMINISTERED ON BEHALF OF GOVERNMENT
Financial assetsCash and cash equivalents 15 15 15 15 15Receivables 710,222 721,240 744,170 768,532 794,030Other investments 37,342 37,342 37,342 37,342 37,342
Total financial assets 747,579 758,597 781,527 805,889 831,387
Non-financial assetsProperty, plant and equipment 107 71 35 - -
Total non-financial assets 107 71 35 - -Total assets administered
on behalf of government 747,686 758,668 781,562 805,889 831,387
LIABILITIES ADMINISTERED ON BEHALF OF GOVERNMENT
Payables
Suppliers 1 32,734 32,734 32,734 32,734 32,734Other payables 17,389 17,389 17,389 17,389 17,389
Total payables 50,123 50,123 50,123 50,123 50,123
ProvisionsOther provisions 691,346 706,723 729,409 753,193 778,103
Total provisions 691,346 706,723 729,409 753,193 778,103Total liabilities administered
on behalf of Government 741,469 756,846 779,532 803,316 828,226
Net assets/(liabilities) 6,217 1,822 2,030 2,573 3,161Prepared on Australian Accounting Standards basis.
1. Includes Child Support and Income Management Card payables.

Agency Additional Estimates Statements — Department of Human Services
43
Table 3.2.9: Schedule of budgeted administered cash flows (for the period ended 30 June)
Actual Revised Forward Forward Forwardbudget estimate estimate estimate
2011-12 2012-13 2013-14 2014-15 2015-16$'000 $'000 $'000 $'000 $'000
OPERATING ACTIVITIESCash received
Dividends 4,628 2,519 322 - -Competitive Neutrality 7,443 6,267 3,713 3,857 4,011Net GST received 303 1,259 1,482 1,184 -Other 1,271,819 1,378,418 1,386,074 1,420,719 1,456,231
Total cash received 1,284,193 1,388,463 1,391,591 1,425,760 1,460,242
Cash usedGrant 2,759 8,336 10,793 9,722 -Suppliers 2,860 5,507 5,507 3,300 -Other 1,259,550 1,369,290 1,376,063 1,410,464 1,445,726
Total cash used 1,265,169 1,383,133 1,392,363 1,423,486 1,445,726Net cash from (used by)
operating activities 19,024 5,330 (772) 2,274 14,516
Net increase (decrease) in cash held 19,024 5,330 (772) 2,274 14,516Cash and cash equivalents at
beginning of reporting period 15 15 15 15 15Cash from Official Public Account for:
- Appropriations 98,949 101,063 103,735 101,002 91,394- Special Accounts 1,147,177 1,280,811 1,287,146 1,321,300 1,354,332- s30A drawdowns 511 1,259 1,482 1,184 -
1,246,637 1,383,133 1,392,363 1,423,486 1,445,726Cash to Official Public Account for:
- Appropriations 92,213 88,479 88,917 89,165 91,394- Administered Revenue 21,004 17,914 14,046 14,112 14,516- Special Accounts 1,152,141 1,280,811 1,287,146 1,321,299 1,354,332- s30A repayment 303 1,259 1,482 1,184 -
1,265,661 1,388,463 1,391,591 1,425,760 1,460,242Cash and cash equivalents at endof reporting period 15 15 15 15 15 Prepared on Australian Accounting Standards basis.

Agency Additional Estimates Statements — Department of Human Services
44
Table 3.2.10: Schedule of Administered Capital Budget The Department of Human Services does not have an Administered Capital Budget for 2012-13.

45
Agency Additional Estimates Statement — Department of Human Services
Tab
le 3
.2.1
1: S
tate
men
t o
f A
dm
inis
tere
d A
sset
Mo
vem
ents
(B
ud
get
Yea
r 20
12-1
3)
Land
Bui
ldin
gsO
ther
pro
pert
y,In
tang
ible
sT
otal
plan
t an
deq
uipm
ent
$'00
0$'
000
$'00
0$'
000
$'00
0A
s at
1 J
uly
201
2G
ross
boo
k va
lue
-
-
16
1
-
16
1 A
ccum
ulat
ed d
epre
ciat
ion/
amor
tisat
ion
and
impa
irmen
t
-
-
(54
)
-
(5
4)O
pen
ing
net
bo
ok
bal
ance
-
-
10
7
-
10
7
CA
PIT
AL
AS
SE
T A
DD
ITIO
NS
To
tal
add
itio
ns
-
-
-
-
-
Oth
er m
ove
men
tsD
epre
ciat
ion/
amor
tisat
ion
expe
nse
-
-
(
36)
-
(36)
As
at 3
0 Ju
ne
2013
Gro
ss b
ook
valu
e
-
-
161
-
161
Acc
umul
ated
dep
reci
atio
n/am
ortis
atio
nan
d im
pairm
ent
-
-
(
90)
-
(90)
Clo
sin
g n
et b
oo
k b
alan
ce
-
-
71
-
7
1
Pre
pare
d o
n A
ustr
alia
n A
ccou
ntin
g S
tand
ards
bas
is.

Agency Additional Estimates Statements — Department of Human Services
46
Notes to the financial statements
Basis of accounting The Budgeted Financial Statements have been prepared in accordance with:
Finance Minister’s Orders (FMOs); and
Australian Accounting Standards and Interpretations issued by the Australian Accounting Standards Board (AASB) that apply for the reporting period.
The Department’s Budgeted Financial Statements have been prepared on an accrual basis and are in accordance with historical cost convention, except for certain assets and liabilities at fair value. Unless alternative treatment is specifically required by an Accounting Standard or the FMOs, assets and liabilities are recognised in the Balance Sheet when and only when it is probable that future economic benefits will flow to and from the Department and the amounts of the assets or liabilities can be reliably measured. However, assets and liabilities arising under executor contracts are not recognised unless required by an Accounting Standard. The Human Services Legislation Amendment Act 2011 was enacted on 1 July 2011 to support the Government’s agenda for service delivery reform. The Act integrates Medicare Australia and Centrelink into the Department of Human Services. As part of the integration process, the net book value of assets and liabilities of Medicare Australia and Centrelink have been transferred to and reflected in the balances of the Department of Human Services for 2011-12. Unless alternative treatment is specifically required by an Accounting Standard, revenues and expenses are recognised in the Comprehensive Income Statement when and only when, the flow, consumption or loss of economic benefits has occurred and can be reliably measured. The presentation of the Comprehensive Income Statement includes the “Impact of Net Cash Appropriation Arrangements” note, whereby the Department’s net operating result is adjusted by unfunded depreciation and amortisation expense. This treatment is the result of the net cash arrangement that has been implemented as part of the Operation Sunlight reform agenda.

Agency Additional Estimates Statements — Agency name
47
Departmental
Departmental assets, liabilities, revenues and expenses are those items controlled by the Department that are used in producing outputs, and include:
non-financial assets used in providing goods and services;
liabilities for employee entitlements;
revenue from appropriations or independent sources in payment for outputs; and
employee, supplier and depreciation expenses incurred in providing departmental outputs.
Administered
Administered items are those items controlled by the Government and managed, or overseen, by the Department on behalf of the Government.


Glossary and Acronyms
49
GLOSSARY
Term Meaning
Activities The actions/functions performed by agencies to deliver government policies.
Actual Available Appropriation
The Actual Available Appropriation indicates the total appropriations available to the agency for 2011-12. It includes all appropriations made available to the agency in the year (+/- section 32 transfers, formal reductions, Advance to the Finance Minister and movements of funds).
Administered Item Appropriation that consists of funding managed on behalf of the Commonwealth. This funding is not at the discretion of the agency and any unspent appropriation is returned to the Consolidated Revenue Fund at the end of the financial year. An administered item is a component of an administered program.
Agency Generic term for Australian Government General Government Sector entities, including those governed by the Financial Management and Accountability Act 1997.
Appropriation An amount of public money Parliament authorises for spending (i.e. funds to be withdrawn from the Consolidated Revenue Fund). Parliament makes laws for appropriating money under the Annual Appropriation Acts and under Special Appropriations, with spending restricted to the purposes specified in the Appropriation Acts.
Appropriations and Cash Management Module (ACM)
A module of the Central Budget Management System from which agencies draw down funds from the Consolidated Revenue Fund.
Budget Paper 1 (BP1) Budget Strategy and Outlook. Provides information and analysis on whole of government expenditure and revenue.
Budget Paper 2 (BP2) Budget Measures. Provides a description of each budget measure by portfolio.
Budget Paper 3 (BP3) Australia’s Federal Relations. Provides information and analysis on Federal funding provided to the states and territories.

Glossary and Acronyms
50
Term Meaning
Budget Paper 4 (BP4) Agency Resourcing. Details total resourcing available to agencies.
Central Budget Management System (CBMS)
CBMS is the Australian Government’s central budget and financial management information system administered by the Department of Finance and Deregulation. It contains the Commonwealth program list, the Commonwealth’s financial estimates and produces the Annual Appropriation Bills.
Clear Read Principle Under the Outcomes arrangements there is an essential clear link between the Appropriation Bills, the Portfolio Budget Statements (PBS), the Portfolio Additional Estimates Statements (PAES), and annual reports of agencies. Information should be consistent across these and other budget documents, and where possible, duplication of reporting within the PBS should be avoided. This is called the “clear read” between the different documents. Under this Principle the planned performance in PBS is to be provided on the same basis as actual performance in the annual reports covering the same period, to permit a clear read across planning and actual performance reporting documents. Agencies should take this into account in designing their performance reporting arrangements.
Consolidated Revenue Fund (CRF)
The principal operating fund from which money is drawn to pay for the activities of the Government. Section 81 of the Australian Constitution provides that all revenue raised or monies received by the Executive Government forms one consolidated revenue fund from which appropriations are made for the purposes of the Australian Government.
Departmental Capital Budget (DCB)
Funds provided in Appropriation Bill 1/3/5 for the ongoing replacement of minor assets.
Departmental Item Resources (assets, liabilities, revenues and expenses) that agency Chief Executive Officers control directly. This includes outsourced activities funded and controlled by the agency. Examples of departmental items include agency running costs, accrued employee entitlements and net appropriations. A departmental item is a component of a departmental program.

Glossary and Acronyms
51
Term Meaning
Estimated Actual Expenses
Details of the current year’s estimated final figures as included in the Budget documentation. As the Budget is released in May each year, but the financial year does not close off until 30 June, the current year numbers that are used for comparison with Budget amounts can only be estimates.
Expenses not requiring appropriation in the Budget year
Expenses not involving a cash flow impact are generally not included within the calculation of an appropriation. Appropriation funding is not provided in respect of depreciation expense. Also no funding is required for goods or services received free of charge that are then expensed: e.g. ANAO audit services — the ANAO does not charge for audit services however the expense must be recognised. Similarly, bad debts are recognised as an expense but are not recognised for the purpose of calculating appropriation amounts to be sought from Parliament.
Financial Management and Accountability Act 1997 (FMA Act)
The FMA Act sets out the financial management, accountability and audit obligations of agencies (including Departments) that are financially part of the Commonwealth (and form part of the General Government Sector).
Forward Estimates Period
The three years following the budget year. For example, if 2012-13 is the budget year, 2013-14 is forward year 1, 2014-15 is forward year 2 and 2015-16 is forward year 3. This period does not include the current or budget year.
General Government Sector (GGS)
A Government Finance Statistics’ classification of all entities that are controlled and largely funded by the Commonwealth Government. The GGS provides public services that are mainly non-market in nature and for the collective consumption of the community, or involve the transfer or redistribution of income. These services are largely financed through taxes and other compulsory levies, user charging and external funding. This sector comprises all government departments, offices and some other bodies.
Intended Result Intended result is a key part of an outcome statement and describes the goal or objective of an agency. The intended result is typically distilled from the Government’s economic, social, health or environmental policy goals.

Glossary and Acronyms
52
Term Meaning
Measure A new policy or savings decision of the Government with financial impacts on the Government's: underlying cash balance; fiscal balance; operating balance; headline cash balance; net debt or net worth. Such proposals are normally made in the context of the annual Budget, and are typically published in Budget Paper No. 2, in the Mid-Year Economic and Fiscal Outlook (MYEFO) and in the Pre-election Economic and Fiscal Outlook (PEFO).
Official Public Account (OPA)
The OPA is the government’s central bank account held within the Reserve Bank of Australia. The OPA is the central component of the Consolidated Revenue Fund.
Outcome An outcome is the intended result, consequence or impact of Government actions on the Australian community.
Outcome Statement An outcome statement articulates the intended results, activities and target group of an Australian Government agency. An outcome statement serves three main purposes within the financial framework: 1. to explain and control the purposes for which annual appropriations are approved by the Parliament for use by agencies; 2. to provide a basis for annual budgeting, including (financial) reporting against the use of appropriated funds; and 3. to measure and assess agency and program (non-financial) performance in contributing to Government policy objectives.
Output The goods and services produced by agencies on behalf of government for external organisations or individuals. Outputs include goods and services produced for other areas of government external to the agency.
Portfolio Budget Statements (PBS)
Budget related paper detailing budget initiatives and explanations of appropriations specified by outcome and program by each agency within a portfolio.
Portfolio Additional Estimates Statements (PAES)
Budget related paper detailing the changes in resourcing by outcome(s) since the Budget which provides information on new measures and their impact on the financial and/or non-financial planned performance of programs supporting those outcomes.

Glossary and Acronyms
53
Term Meaning
Program Activity that delivers benefits, services or transfer payments to individuals, industry and/or the community as a whole, with the aim of achieving the intended result specified in an outcome statement.
Program Support The agency running costs allocated to a program. This is funded as part of the agency’s departmental appropriations.
s31 Section 31 of the FMA Act 1997.
Target Group A specific group being targeted for assistance by government policy.
Transfer Cash paid to recipients of the applicable program. This includes welfare payments and tax rebates.
