portfolio additional estimates statements 2016-17 user guide the purpose of the 2016-17 portfolio...
TRANSCRIPT
Portfolio Additional Estimates Statements 2016-17
Social Services Portfolio (Department of Human Services)
Explanations of Additional Estimates 2016-17
© Commonwealth of Australia 2017
ISBN 978-1-76044-718-2
This publication is available for your use under a Creative Commons BY Attribution 3.0 Australia licence, with the exception of the Commonwealth Coat of Arms, the Department of Human Services logo, photographs, images, signatures and where otherwise stated. The full licence terms are available from http://creativecommons.org/licenses/by/3.0/au/legalcode.
Use of Department of Human Services’ material under a Creative Commons BY Attribution 3.0 Australia licence requires you to attribute the work (but not in any way that suggests that the Department of Human Services endorses you or your use of the work).
Department of Human Services’ material used 'as supplied'
Provided you have not modified or transformed Department of Human Services’ material in any way including, for example, by changing the Department of Human Services’ text; calculating percentage changes; graphing or charting data; or deriving new statistics from published Department of Human Services’ statistics – then Department of Human Services prefers the following attribution:
Source: The Australian Government Department of Human Services
Derivative material
If you have modified or transformed Department of Human Services’ material, or derived new material from those of the Department of Human Services in any way, then Department of Human Services prefers the following attribution:
Based on The Australian Government Department of Human Services’ data
Use of the Coat of Arms The terms under which the Coat of Arms can be used are set out on the It’s an Honour website (see www.itsanhonour.gov.au)
Other Uses Inquiries regarding this licence and any other use of this document are welcome to:
Mr Mark Jenkin, Chief Financial Officer, CFO Division, Department of Human Services, PO Box 7788, Canberra BC, ACT 2600 Australia.
iv
ABBREVIATIONS AND CONVENTIONS
The following notations may be used:
NEC/nec not elsewhere classified
- nil
.. not zero, but rounded to zero
na not applicable (unless otherwise specified)
nfp not for publication
$m $ million
Figures in tables and in the text may be rounded. Figures in text are generally rounded to one decimal place, whereas figures in tables are generally rounded to the nearest thousand. Discrepancies in tables between totals and sums of components are due to rounding.
Enquiries
Should you have any enquiries regarding this publication please contact Mr Mark Jenkin, Chief Financial Officer in the Department of Human Services on (02) 6223 4350.
Links to Portfolio Budget Statements (including Portfolio Additional Estimates Statements and Portfolio Supplementary Additional Estimates Statements) can be located on the Australian Government Budget website at www.budget.gov.au.
USER GUIDE TO THE
PORTFOLIO ADDITIONAL ESTIMATES STATEMENTS

vii
USER GUIDE
The purpose of the 2016-17 Portfolio Additional Estimates Statements (PAES), like that of the Portfolio Budget Statements (PB Statements), is to inform Senators and Members of Parliament of the proposed allocation of resources to Government outcomes by entities within the portfolio. The focus of the PAES differs from the PB Statements in one important aspect. While the PAES includes an Entity Resource Statement to inform Parliament of the revised estimate of the total resources available to an entity, the focus of the PAES is on explaining the changes in resourcing by outcome since the Budget. As such, the PAES provides information on new measures and their impact on the financial and/or non-financial planned performance of programs supporting those outcomes.
The PAES facilitates understanding of the proposed appropriations in Appropriation Bills (Nos. 3 and 4). In this sense the PAES is declared by the Additional Estimates Appropriation Bills to be a ‘relevant document’ to the interpretation of the Bills according to section 15AB of the Acts Interpretation Act 1901.
Whereas the Mid-Year Economic and Fiscal Outlook (MYEFO) 2016-17 is a mid-year budget report which provides updated information to allow the assessment of the Government’s fiscal performance against its fiscal strategy, the PAES updates the most recent budget appropriations for entities within the portfolio.
User Guide
viii
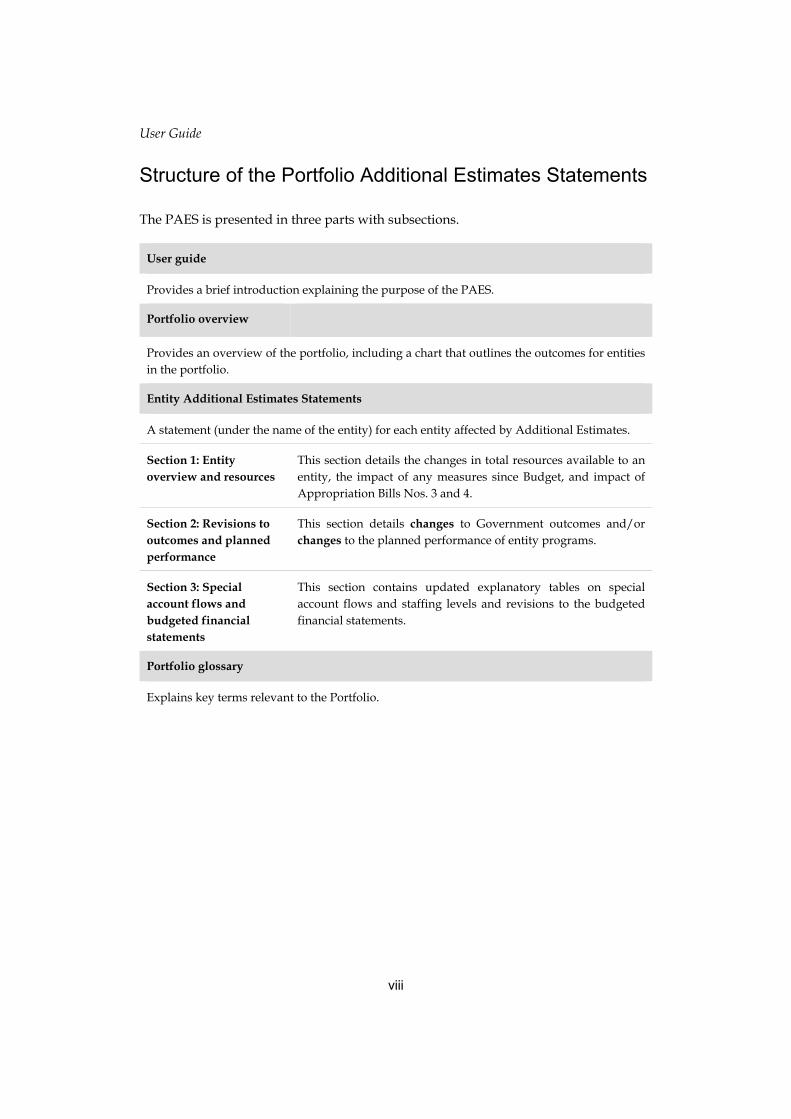
Structure of the Portfolio Additional Estimates Statements
The PAES is presented in three parts with subsections.
User guide
Provides a brief introduction explaining the purpose of the PAES.
Portfolio overview
Provides an overview of the portfolio, including a chart that outlines the outcomes for entities in the portfolio.
Entity Additional Estimates Statements
A statement (under the name of the entity) for each entity affected by Additional Estimates.
Section 1: Entity overview and resources
This section details the changes in total resources available to an entity, the impact of any measures since Budget, and impact of Appropriation Bills Nos. 3 and 4.
Section 2: Revisions to outcomes and planned performance
This section details changes to Government outcomes and/or changes to the planned performance of entity programs.
Section 3: Special account flows and budgeted financial statements
This section contains updated explanatory tables on special account flows and staffing levels and revisions to the budgeted financial statements.
Portfolio glossary
Explains key terms relevant to the Portfolio.
ix
CONTENTS
Portfolio overview ......................................................................................................... 3
Department of Human Services ................................................................................... 7
Portfolio glossary ........................................................................................................ 43


PORTFOLIO OVERVIEW

3
PORTFOLIO OVERVIEW
Ministers and portfolio responsibilities
The ministers responsible for the Social Services portfolio and its entities are:
The Hon Christian Porter MP, Minister for Social Services
The Hon Alan Tudge MP, Minister for Human Services
The Hon Jane Prentice MP, Assistant Minister for Social Services and Disability Services
Senator the Hon Zed Seselja, Assistant Minister for Social Services and Multicultural Affairs.
The Department of Human Services (the department) is part of the Social Services portfolio. Full details of the Social Services portfolio appear in Portfolio Additional Estimates Statements 2016-17 Social Services Portfolio.
DEPARTMENT OF HUMAN SERVICES
The department is responsible for providing advice to government on design, development, delivery, co-ordination and monitoring of government services. It is subject to the Public Governance, Performance and Accountability Act 2013 (PGPA Act). The department has one outcome and delivers a range of government and other payments and services to almost every Australian including:
Centrelink payments and services for retirees, the unemployed, families, carers, parents, students, people with disabilities, Aboriginal and Torres Strait Islander people, people from culturally and linguistically diverse backgrounds, people living overseas and provision of services at times of major change, including disaster recovery payments.
Aged care payments to services funded under the Aged Care Act 1997 including residential care, home care and flexible care services.
Health services and payments that support Australians such as Medicare, the Pharmaceutical Benefits Scheme, digital health, Private Health Insurance Rebate, the Australian Immunisation Register, the National Bowel Cancer Screening Register, Australian Organ Donor Register and related services for eligible veterans, their spouses and dependants.
Child Support services for separated parents to provide the financial and emotional support necessary for the wellbeing of their children.
Portfolio Overview
4
The department also delivers other services including the Tasmanian Freight Equalisation Scheme and Early Release of Superannuation, as well as whole of government services such as myGov.
On 1 July 2016, the Digital Transformation Agency (then known as the Digital Transformation Office), assumed responsibility for myGov strategy, policy and user experience and onboarding policy (of new member services to the myGov digital service). This resulted in the transfer of $0.7 million in 2016-17 appropriations under section 75 of the PGPA Act from the department to the Digital Transformation Agency.
Additional appropriation of $155.8 million is being sought through Appropriation Bill (No. 3) 2016-17 and $79.1 million through Appropriation Bill (No. 4) 2016-17 as a result of new measures and variations.
AUSTRALIAN HEARING
Australian Hearing is a non-General Government Sector entity established under the Australian Hearing Services Act 1991. As such, Australian Hearing is not consolidated into the Commonwealth General Government Sector fiscal estimates. Accordingly, Australian Hearing is not reported in the PB Statements or PAES. Australian Hearing is a corporate Commonwealth entity under the PGPA Act and is governed by a board that is appointed by the Minister for Human Services.
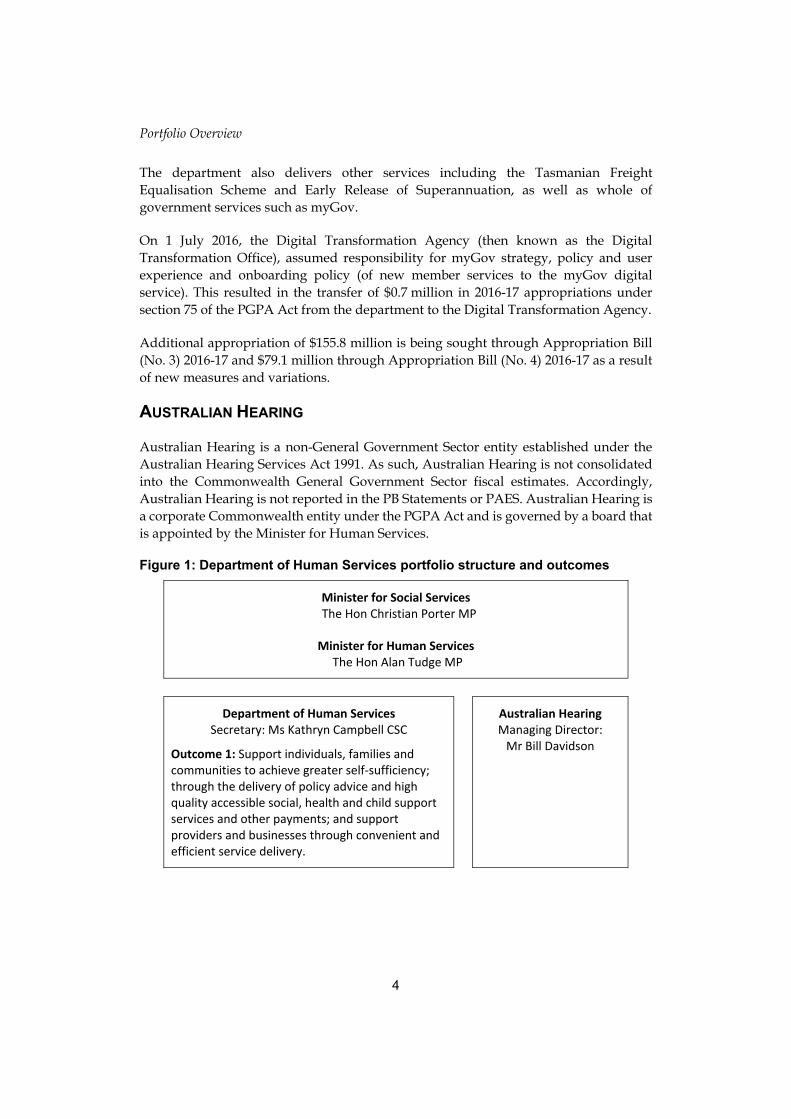
Figure 1: Department of Human Services portfolio structure and outcomes
Minister for Social Services The Hon Christian Porter MP
Minister for Human Services The Hon Alan Tudge MP
Department of Human Services Secretary: Ms Kathryn Campbell CSC
Outcome 1: Support individuals, families and communities to achieve greater self‐sufficiency; through the delivery of policy advice and high quality accessible social, health and child support services and other payments; and support providers and businesses through convenient and efficient service delivery.
Australian Hearing Managing Director: Mr Bill Davidson
ENTITY ADDITIONAL ESTIMATES
STATEMENTS
Department of Human Services ................................................................................... 7

7
DEPARTMENT OF HUMAN SERVICES
Section 1: Entity overview and resources .................................................................. 9
1.1 Strategic direction statement .................................................................................... 9
1.2 Entity resource statement ...................................................................................... 10
1.3 Entity measures ..................................................................................................... 17
1.4 Additional estimates, resourcing and variations to outcomes ................................ 20
1.5 Breakdown of additional estimates by appropriation bill ....................................... 22
Section 2: Revisions to outcomes and planned performance ............................... 24
2. Changes to outcome and program structures .......................................................... 24
2.1 Budgeted expenses and performance for Outcome 1 ........................................... 24
Section 3: Special account flows and budgeted financial statements .................. 28
3.1 Special account flows ............................................................................................. 28
3.2 Budgeted financial statements ............................................................................... 30

9
DEPARTMENT OF HUMAN SERVICES
Section 1: Entity overview and resources
1.1 STRATEGIC DIRECTION STATEMENT
There have been no changes to the strategic direction statement since the publication of the 2016–17 PB Statements.
For full details refer to pages 11-12 of the Portfolio Budget Statements 2016–17, Budget Related Paper No. 1.15B, Social Services Portfolio (Department of Human Services).
Additional Estimates Statements — Department of Human Services
10
1.2 ENTITY RESOURCE STATEMENT
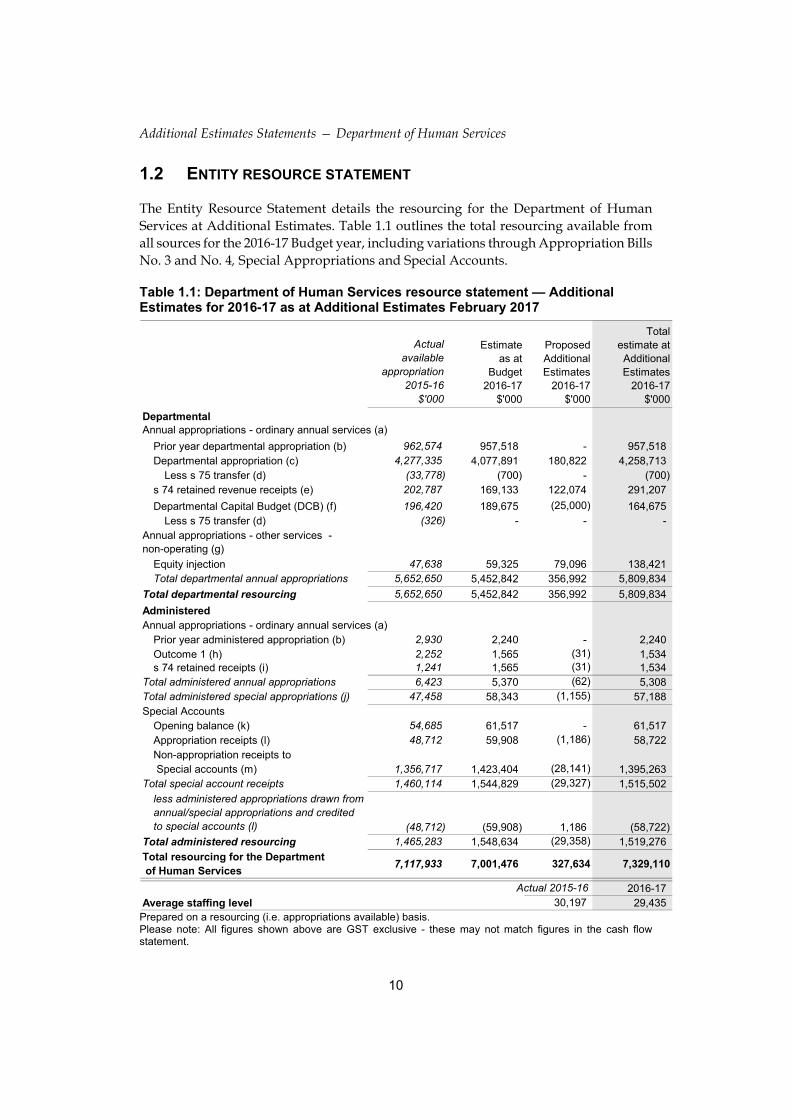
The Entity Resource Statement details the resourcing for the Department of Human Services at Additional Estimates. Table 1.1 outlines the total resourcing available from all sources for the 2016-17 Budget year, including variations through Appropriation Bills No. 3 and No. 4, Special Appropriations and Special Accounts.
Table 1.1: Department of Human Services resource statement — Additional Estimates for 2016-17 as at Additional Estimates February 2017
Actual available
appropriation2015-16
$'000
Estimateas at
Budget2016-17
$'000
Proposed Additional
Estimates2016-17
$'000
Total estimate at Additional Estimates
2016-17 $'000
DepartmentalAnnual appropriations - ordinary annual services (a)
Prior year departmental appropriation (b) 962,574 957,518 - 957,518 Departmental appropriation (c) 4,277,335 4,077,891 180,822 4,258,713
Less s 75 transfer (d) (33,778) (700) - (700) s 74 retained revenue receipts (e) 202,787 169,133 122,074 291,207
Departmental Capital Budget (DCB) (f) 196,420 189,675 (25,000) 164,675 Less s 75 transfer (d) (326) - - -
Annual appropriations - other services - non-operating (g)
Equity injection 47,638 59,325 79,096 138,421 Total departmental annual appropriations 5,652,650 5,452,842 356,992 5,809,834
Total departmental resourcing 5,652,650 5,452,842 356,992 5,809,834
AdministeredAnnual appropriations - ordinary annual services (a)
Prior year administered appropriation (b) 2,930 2,240 - 2,240 Outcome 1 (h) 2,252 1,565 (31) 1,534 s 74 retained receipts (i) 1,241 1,565 (31) 1,534
Total administered annual appropriations 6,423 5,370 (62) 5,308 Total administered special appropriations (j) 47,458 58,343 (1,155) 57,188 Special Accounts
Opening balance (k) 54,685 61,517 - 61,517 Appropriation receipts (l) 48,712 59,908 (1,186) 58,722 Non-appropriation receipts to Special accounts (m) 1,356,717 1,423,404 (28,141) 1,395,263
Total special account receipts 1,460,114 1,544,829 (29,327) 1,515,502
less administered appropriations drawn from annual/special appropriations and credited to special accounts (l) (48,712) (59,908) 1,186 (58,722)
Total administered resourcing 1,465,283 1,548,634 (29,358) 1,519,276
Total resourcing for the Department of Human Services
7,117,933 7,001,476 327,634 7,329,110
Actual 2015-16 2016-17Average staffing level 30,197 29,435
Prepared on a resourcing (i.e. appropriations available) basis. Please note: All figures shown above are GST exclusive - these may not match figures in the cash flow statement.
Additional Estimates Statements — Department of Human Services
11
Table 1.1: Department of Human Services resource statement — Additional Estimates for 2016-17 as at Additional Estimates February 2017 (continued)
(a) Supply Act (No. 1) 2016-2017, Appropriation Act (No. 1) 2016-2017 and Appropriation Bill (No. 3) 2016-17.
(b) The Estimate as at Budget has been updated to reflect the actual balance of annual appropriations carried forward from the previous year. Prior year departmental appropriation for 2015-16 excludes $6.0 million of 2013-14 appropriation subject to administrative quarantine under section 51 of the PGPA Act. Prior year departmental appropriation for 2016-17 also excludes $9.6 million of 2015-16 appropriation subject to administrative quarantine under section 51 of the PGPA Act.
(c) Departmental appropriation is not separately identified in Supply Act (No. 1) 2016-2017, Appropriation Act (No.1) or Appropriation Bill (No.3) and forms part of ordinary annual services items. The actual available appropriation for 2015-16 excludes $9.6 million of 2015-16 appropriation subject to administrative quarantine under section 51 of the PGPA Act.
(d) The department transferred $0.7 million of 2016-17 appropriations to the Digital Transformation Agency under machinery of government changes related to MyGov operations. In 2015-16 the department transferred $34.1 million to the Department of Health. For further details refer to Table 1.1 in the Portfolio Additional Estimates Statements 2015-16 Social Services Portfolio (Department of Human Services).
(e) Estimated retained revenue receipts under section 74 of the PGPA Act.
(f) Departmental capital budgets are not separately identified in Supply Act (No. 1) 2016-2017, Appropriation Act (No.1) 2016-2017 or Appropriation Bill (No. 3) 2016-17 and forms part of ordinary annual services items. Refer to Table 3.6 for further details. For accounting purposes, this amount has been designated as a 'contribution by owner’.
(g) Supply Act (No. 2) 2016-2017, Appropriation Act (No. 2) 2016-2017 and Appropriation Bill (No. 4) 2016-17.
(h) Appropriation Act (No. 1) 2016-2017 provides funding for operating expenses only. The department does not have an administered capital budget.
(i) Administered repayments received by the department.
(j) Special appropriations under the Child Support (Registration and Collection) Act 1988 provide temporary funding to cover unremitted deductions and unexplained remittances until deductions have been received and unexplained remittances have been attributed to the relevant paying parent.
(k) The Estimate as at Budget has been updated to reflect the actual balance of special accounts carried forward from the previous year.
(l) Amounts credited to special accounts from annual administered appropriations and special appropriations relating to Child Support.
(m) Non-appropriation receipts mainly comprise receipts from non-custodial parents through the Child Support special account.
Additional Estimates Statements — Department of Human Services
12
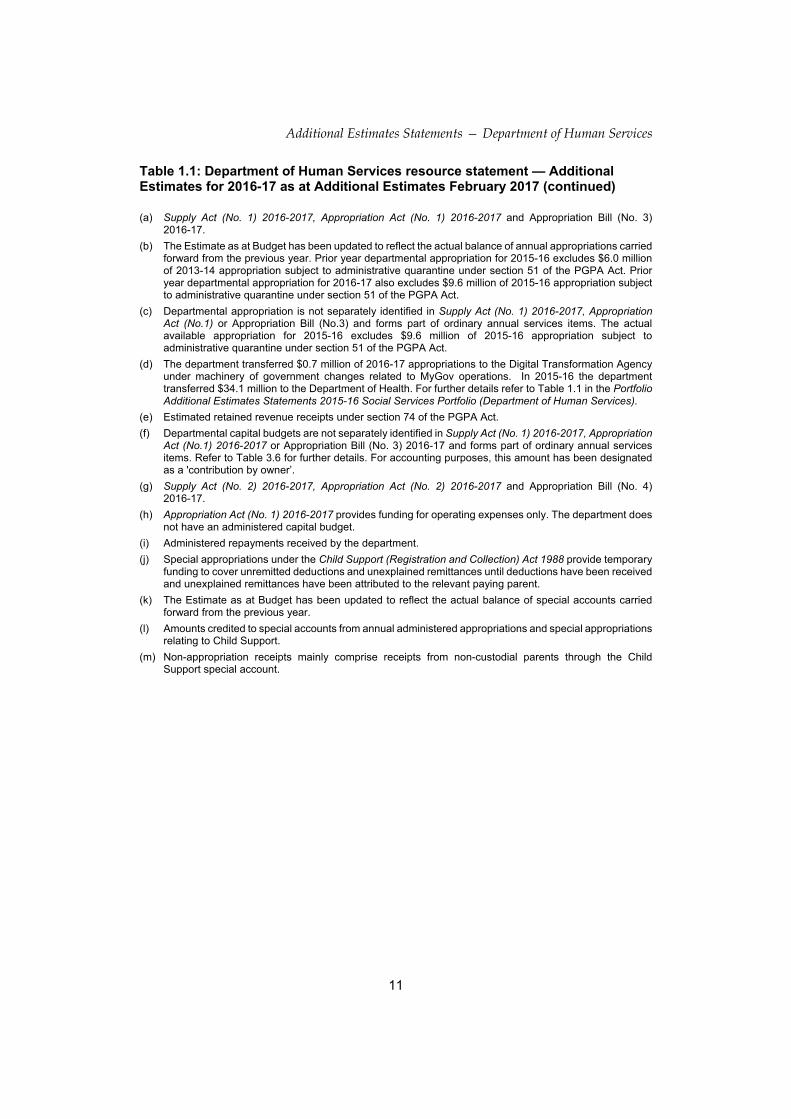
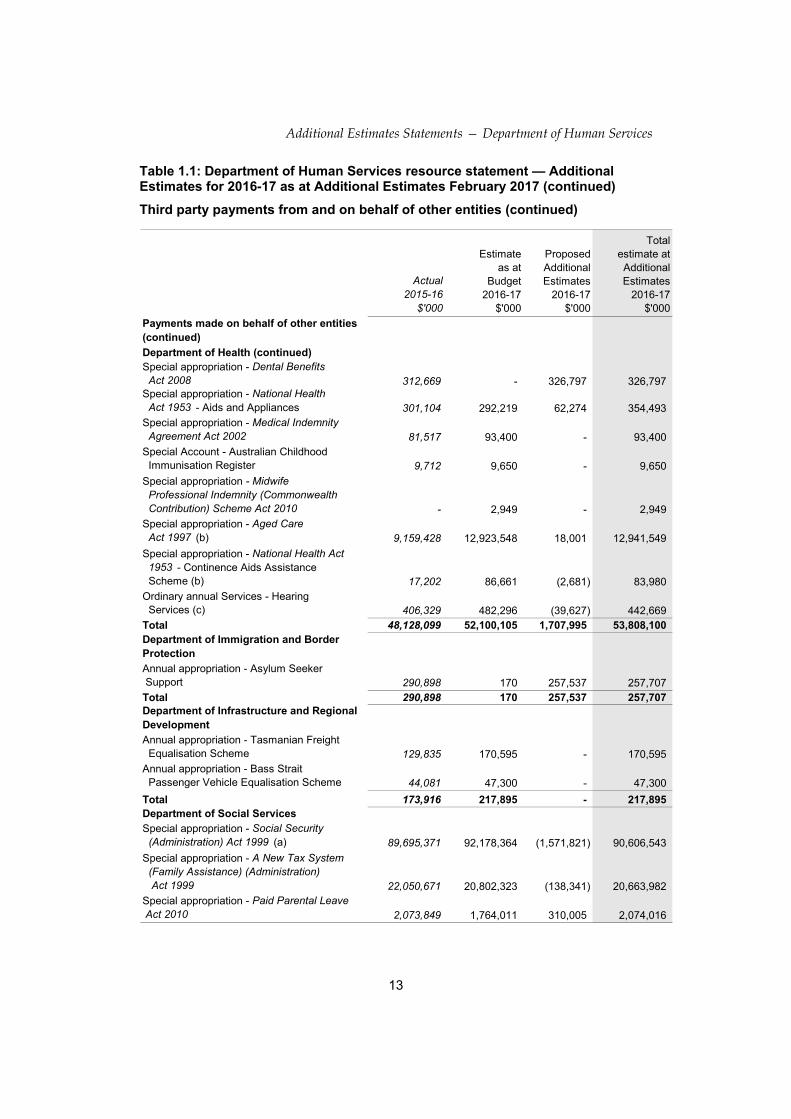
Table 1.1: Department of Human Services resource statement — Additional Estimates for 2016-17 as at Additional Estimates February 2017 (continued)
Third party payments from and on behalf of other entities
Actual2015-16
$'000
Estimateas at
Budget2016-17
$'000
Proposed Additional
Estimates2016-17
$'000
Totalestimate atAdditionalEstimates
2016-17$'000
Payments made on behalf of other entities(as disclosed in the respective entity's resource statement)
Attorney-General's Department
Special appropriation - Social Security (Administration) Act 1999 - Australian Victim of Terrorism Overseas Payment 1,489 500 525 1,025
- Disaster Recovery Allowance 652 60 742 802
- Disaster Recovery Payment 20,845 60 - 60 Annual appropriation - Ex gratia assistance - New Zealand citizens 115 117 - 117 Total 23,101 737 1,267 2,004 Department of Agriculture and Water Resources
Special appropriation - Farm Household Support Act 2014 s 105 - payments for Farm Household Allowance and Exceptional circumstances relief payments 57,431 117,736 (39,370) 78,366 Total 57,431 117,736 (39,370) 78,366 Department of Defence
Annual appropriation - Closure of Hunter River and Port Stephens Fisheries - Assistance to individuals and Businesses 720 2,156 - 2,156 Total 720 2,156 - 2,156 Department of Education and Training
Special appropriation - A New Tax System (Family Assistance) (Administration) Act 1999 (a) 1,009,550 2,101,539 (476,041) 1,625,498 Total 1,009,550 2,101,539 (476,041) 1,625,498 Department of Employment
Annual appropriation - Job Commitment Bonus 7,940 15,486 - 15,486 Total 7,940 15,486 - 15,486 Department of Health
Special appropriation - Health Insurance Act 1973 - Medical Benefits 21,115,085 21,850,644 239,204 22,089,848 Special appropriation - National Health Act 1953 - Pharmaceutical Benefits 10,837,986 10,109,505 1,173,393 11,282,898 Special appropriation - Private Health Insurance Act 2007 5,887,067 6,249,233 (69,366) 6,179,867
Additional Estimates Statements — Department of Human Services
13
Table 1.1: Department of Human Services resource statement — Additional Estimates for 2016-17 as at Additional Estimates February 2017 (continued)
Third party payments from and on behalf of other entities (continued)
Actual2015-16
$'000
Estimateas at
Budget2016-17
$'000
Proposed Additional
Estimates2016-17
$'000
Totalestimate atAdditionalEstimates
2016-17$'000
Payments made on behalf of other entities (continued)
Department of Health (continued)Special appropriation - Dental Benefits Act 2008 312,669 - 326,797 326,797 Special appropriation - National Health Act 1953 - Aids and Appliances 301,104 292,219 62,274 354,493 Special appropriation - Medical Indemnity Agreement Act 2002 81,517 93,400 - 93,400 Special Account - Australian Childhood Immunisation Register 9,712 9,650 - 9,650
Special appropriation - Midwife Professional Indemnity (Commonwealth Contribution) Scheme Act 2010 - 2,949 - 2,949 Special appropriation - Aged Care Act 1997 (b) 9,159,428 12,923,548 18,001 12,941,549
Special appropriation - National Health Act 1953 - Continence Aids Assistance Scheme (b) 17,202 86,661 (2,681) 83,980 Ordinary annual Services - Hearing Services (c) 406,329 482,296 (39,627) 442,669 Total 48,128,099 52,100,105 1,707,995 53,808,100 Department of Immigration and Border Protection
Annual appropriation - Asylum Seeker Support 290,898 170 257,537 257,707 Total 290,898 170 257,537 257,707 Department of Infrastructure and Regional Development
Annual appropriation - Tasmanian Freight Equalisation Scheme 129,835 170,595 - 170,595 Annual appropriation - Bass Strait Passenger Vehicle Equalisation Scheme 44,081 47,300 - 47,300
Total 173,916 217,895 - 217,895 Department of Social Services
Special appropriation - Social Security (Administration) Act 1999 (a) 89,695,371 92,178,364 (1,571,821) 90,606,543
Special appropriation - A New Tax System (Family Assistance) (Administration) Act 1999 22,050,671 20,802,323 (138,341) 20,663,982 Special appropriation - Paid Parental Leave Act 2010 2,073,849 1,764,011 310,005 2,074,016
Additional Estimates Statements — Department of Human Services
14
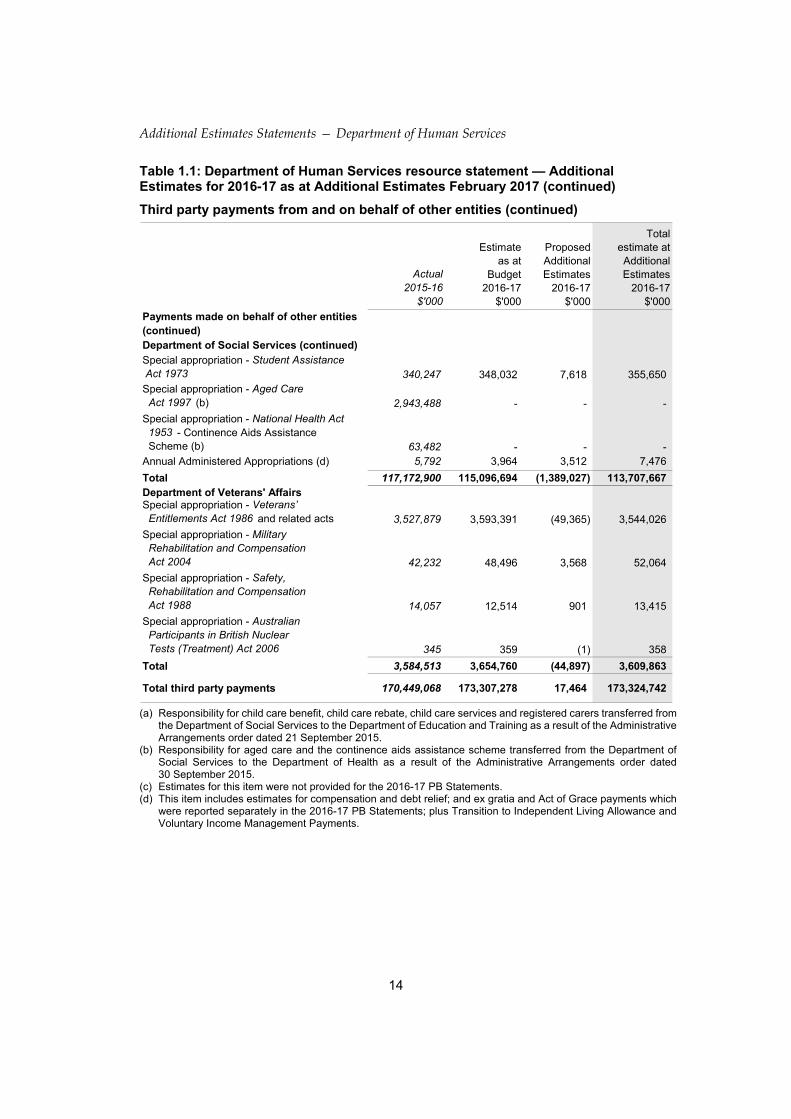
Table 1.1: Department of Human Services resource statement — Additional Estimates for 2016-17 as at Additional Estimates February 2017 (continued)
Third party payments from and on behalf of other entities (continued)
Actual2015-16
$'000
Estimateas at
Budget2016-17
$'000
Proposed Additional
Estimates2016-17
$'000
Totalestimate atAdditionalEstimates
2016-17$'000
Payments made on behalf of other entities (continued)Department of Social Services (continued)
Special appropriation - Student Assistance Act 1973 340,247 348,032 7,618 355,650 Special appropriation - Aged Care Act 1997 (b) 2,943,488 - - -
Special appropriation - National Health Act 1953 - Continence Aids Assistance Scheme (b) 63,482 - - - Annual Administered Appropriations (d) 5,792 3,964 3,512 7,476
Total 117,172,900 115,096,694 (1,389,027) 113,707,667 Department of Veterans' AffairsSpecial appropriation - Veterans’ Entitlements Act 1986 and related acts 3,527,879 3,593,391 (49,365) 3,544,026
Special appropriation - Military Rehabilitation and Compensation Act 2004 42,232 48,496 3,568 52,064
Special appropriation - Safety, Rehabilitation and Compensation Act 1988 14,057 12,514 901 13,415
Special appropriation - Australian Participants in British Nuclear Tests (Treatment) Act 2006 345 359 (1) 358
Total 3,584,513 3,654,760 (44,897) 3,609,863
Total third party payments 170,449,068 173,307,278 17,464 173,324,742
(a) Responsibility for child care benefit, child care rebate, child care services and registered carers transferred from
the Department of Social Services to the Department of Education and Training as a result of the Administrative Arrangements order dated 21 September 2015.
(b) Responsibility for aged care and the continence aids assistance scheme transferred from the Department of Social Services to the Department of Health as a result of the Administrative Arrangements order dated 30 September 2015.
(c) Estimates for this item were not provided for the 2016-17 PB Statements. (d) This item includes estimates for compensation and debt relief; and ex gratia and Act of Grace payments which
were reported separately in the 2016-17 PB Statements; plus Transition to Independent Living Allowance and Voluntary Income Management Payments.
Additional Estimates Statements — Department of Human Services
15
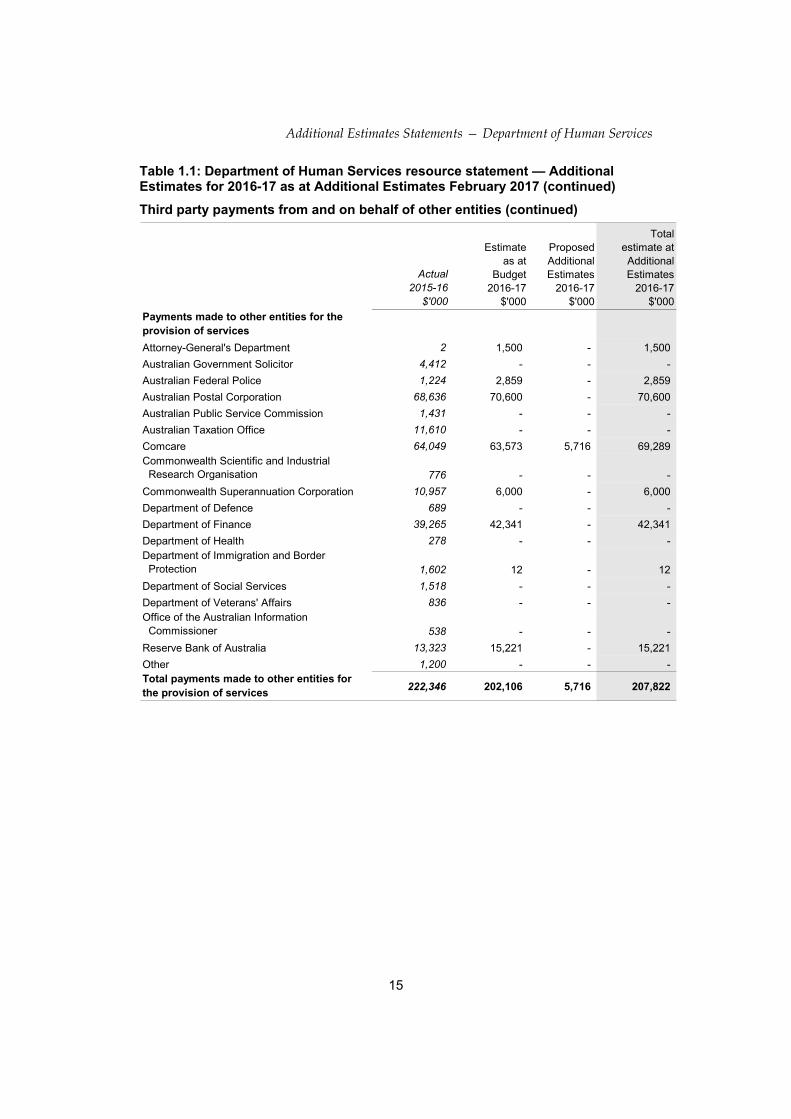
Table 1.1: Department of Human Services resource statement — Additional Estimates for 2016-17 as at Additional Estimates February 2017 (continued)
Third party payments from and on behalf of other entities (continued)
Actual2015-16
$'000
Estimateas at
Budget2016-17
$'000
Proposed Additional
Estimates2016-17
$'000
Totalestimate atAdditionalEstimates
2016-17$'000
Payments made to other entities for the provision of services
Attorney-General's Department 2 1,500 - 1,500
Australian Government Solicitor 4,412 - - -
Australian Federal Police 1,224 2,859 - 2,859
Australian Postal Corporation 68,636 70,600 - 70,600
Australian Public Service Commission 1,431 - - -
Australian Taxation Office 11,610 - - -
Comcare 64,049 63,573 5,716 69,289 Commonwealth Scientific and Industrial Research Organisation 776 - - -
Commonwealth Superannuation Corporation 10,957 6,000 - 6,000
Department of Defence 689 - - -
Department of Finance 39,265 42,341 - 42,341
Department of Health 278 - - - Department of Immigration and Border Protection 1,602 12 - 12
Department of Social Services 1,518 - - -
Department of Veterans' Affairs 836 - - - Office of the Australian Information Commissioner 538 - - -
Reserve Bank of Australia 13,323 15,221 - 15,221
Other 1,200 - - - Total payments made to other entities for the provision of services
222,346 202,106 5,716 207,822
Additional Estimates Statements — Department of Human Services
16
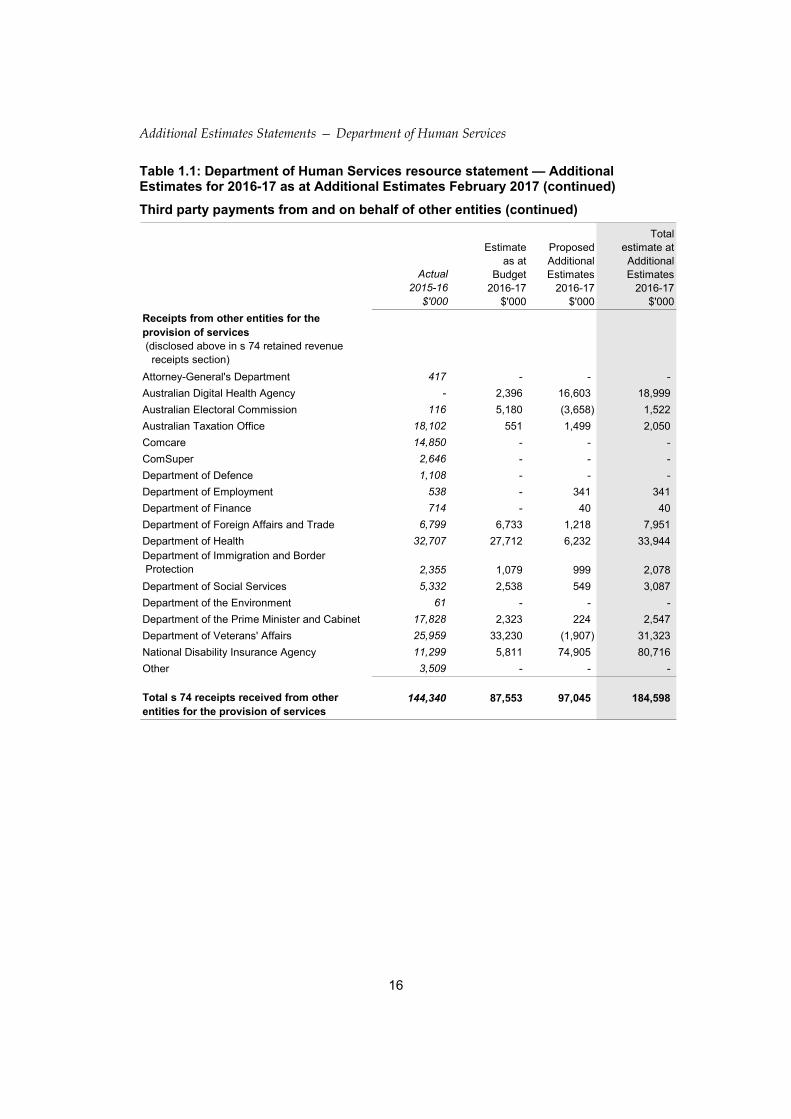
Table 1.1: Department of Human Services resource statement — Additional Estimates for 2016-17 as at Additional Estimates February 2017 (continued)
Third party payments from and on behalf of other entities (continued)
Actual2015-16
$'000
Estimateas at
Budget2016-17
$'000
Proposed Additional
Estimates2016-17
$'000
Totalestimate atAdditionalEstimates
2016-17$'000
Receipts from other entities for the provision of services (disclosed above in s 74 retained revenue receipts section)
Attorney-General's Department 417 - - -
Australian Digital Health Agency - 2,396 16,603 18,999
Australian Electoral Commission 116 5,180 (3,658) 1,522
Australian Taxation Office 18,102 551 1,499 2,050
Comcare 14,850 - - -
ComSuper 2,646 - - -
Department of Defence 1,108 - - -
Department of Employment 538 - 341 341
Department of Finance 714 - 40 40
Department of Foreign Affairs and Trade 6,799 6,733 1,218 7,951
Department of Health 32,707 27,712 6,232 33,944 Department of Immigration and Border Protection 2,355 1,079 999 2,078
Department of Social Services 5,332 2,538 549 3,087
Department of the Environment 61 - - -
Department of the Prime Minister and Cabinet 17,828 2,323 224 2,547
Department of Veterans' Affairs 25,959 33,230 (1,907) 31,323
National Disability Insurance Agency 11,299 5,811 74,905 80,716
Other 3,509 - - -
Total s 74 receipts received from other entities for the provision of services
144,340 87,553 97,045 184,598
Additional Estimates Statements — Department of Human Services
17
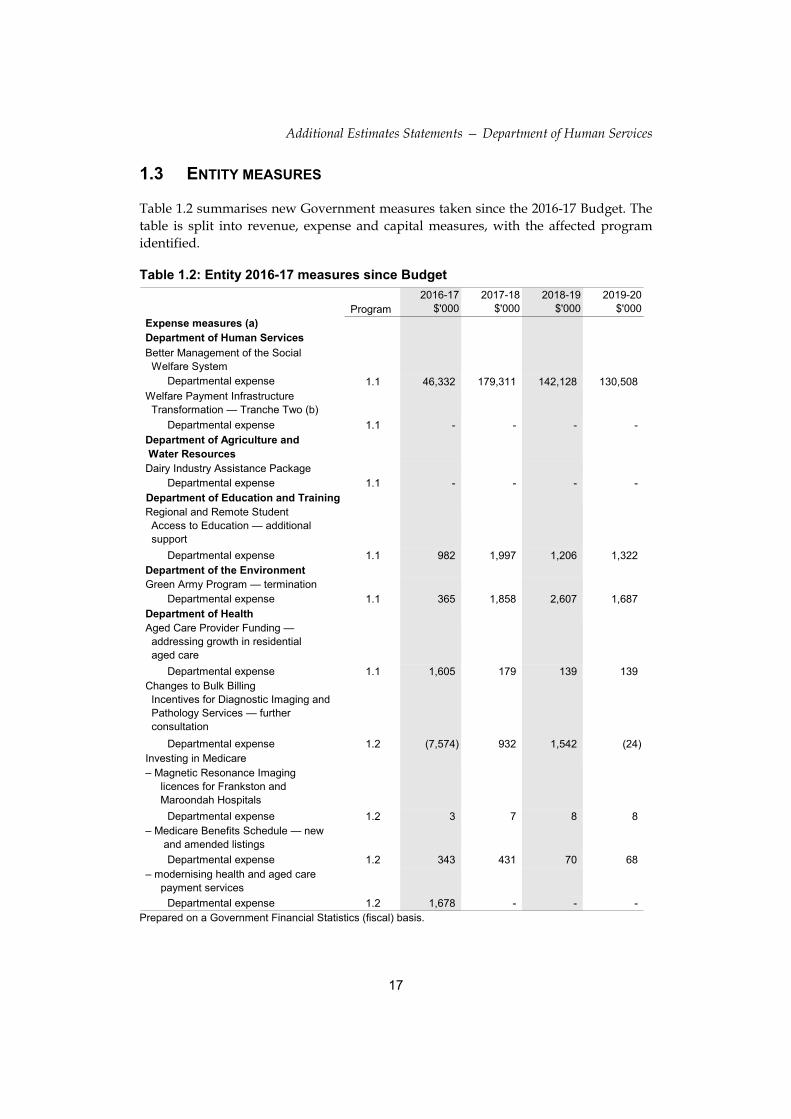
1.3 ENTITY MEASURES
Table 1.2 summarises new Government measures taken since the 2016-17 Budget. The table is split into revenue, expense and capital measures, with the affected program identified.
Table 1.2: Entity 2016-17 measures since Budget
Program 2016-17
$'000 2017-18
$'000 2018-19
$'000 2019-20
$'000 Expense measures (a) Department of Human Services
Better Management of the Social Welfare System
Departmental expense 1.1 46,332 179,311 142,128 130,508 Welfare Payment Infrastructure Transformation — Tranche Two (b)
Departmental expense 1.1 - - - - Department of Agriculture and Water Resources Dairy Industry Assistance Package
Departmental expense 1.1 - - - - Department of Education and Training
Regional and Remote Student Access to Education — additional support
Departmental expense 1.1 982 1,997 1,206 1,322 Department of the Environment Green Army Program — termination
Departmental expense 1.1 365 1,858 2,607 1,687 Department of Health Aged Care Provider Funding — addressing growth in residential aged care
Departmental expense 1.1 1,605 179 139 139 Changes to Bulk Billing Incentives for Diagnostic Imaging and Pathology Services — further consultation
Departmental expense 1.2 (7,574) 932 1,542 (24) Investing in Medicare – Magnetic Resonance Imaging licences for Frankston and Maroondah Hospitals
Departmental expense 1.2 3 7 8 8 – Medicare Benefits Schedule — new and amended listings
Departmental expense 1.2 343 431 70 68 – modernising health and aged care payment services
Departmental expense 1.2 1,678 - - - Prepared on a Government Financial Statistics (fiscal) basis.
Additional Estimates Statements — Department of Human Services
18
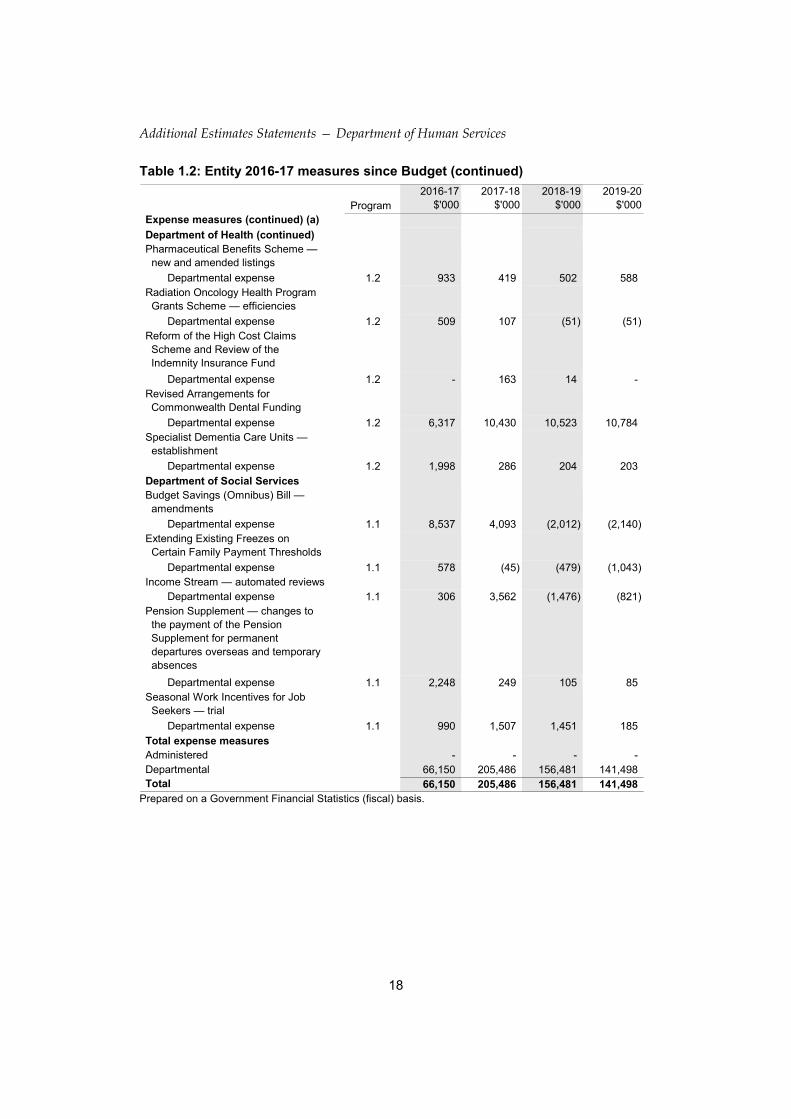
Table 1.2: Entity 2016-17 measures since Budget (continued)
Program 2016-17
$'000 2017-18
$'000 2018-19
$'000 2019-20
$'000 Expense measures (continued) (a)
Department of Health (continued) Pharmaceutical Benefits Scheme — new and amended listings
Departmental expense 1.2 933 419 502 588 Radiation Oncology Health Program Grants Scheme — efficiencies
Departmental expense 1.2 509 107 (51) (51) Reform of the High Cost Claims Scheme and Review of the Indemnity Insurance Fund
Departmental expense 1.2 - 163 14 - Revised Arrangements for Commonwealth Dental Funding
Departmental expense 1.2 6,317 10,430 10,523 10,784 Specialist Dementia Care Units — establishment
Departmental expense 1.2 1,998 286 204 203 Department of Social Services Budget Savings (Omnibus) Bill — amendments
Departmental expense 1.1 8,537 4,093 (2,012) (2,140) Extending Existing Freezes on Certain Family Payment Thresholds
Departmental expense 1.1 578 (45) (479) (1,043) Income Stream — automated reviews
Departmental expense 1.1 306 3,562 (1,476) (821) Pension Supplement — changes to the payment of the Pension Supplement for permanent departures overseas and temporary absences
Departmental expense 1.1 2,248 249 105 85 Seasonal Work Incentives for Job Seekers — trial
Departmental expense 1.1 990 1,507 1,451 185 Total expense measures Administered - - - - Departmental 66,150 205,486 156,481 141,498 Total 66,150 205,486 156,481 141,498 Prepared on a Government Financial Statistics (fiscal) basis.
Additional Estimates Statements — Department of Human Services
19
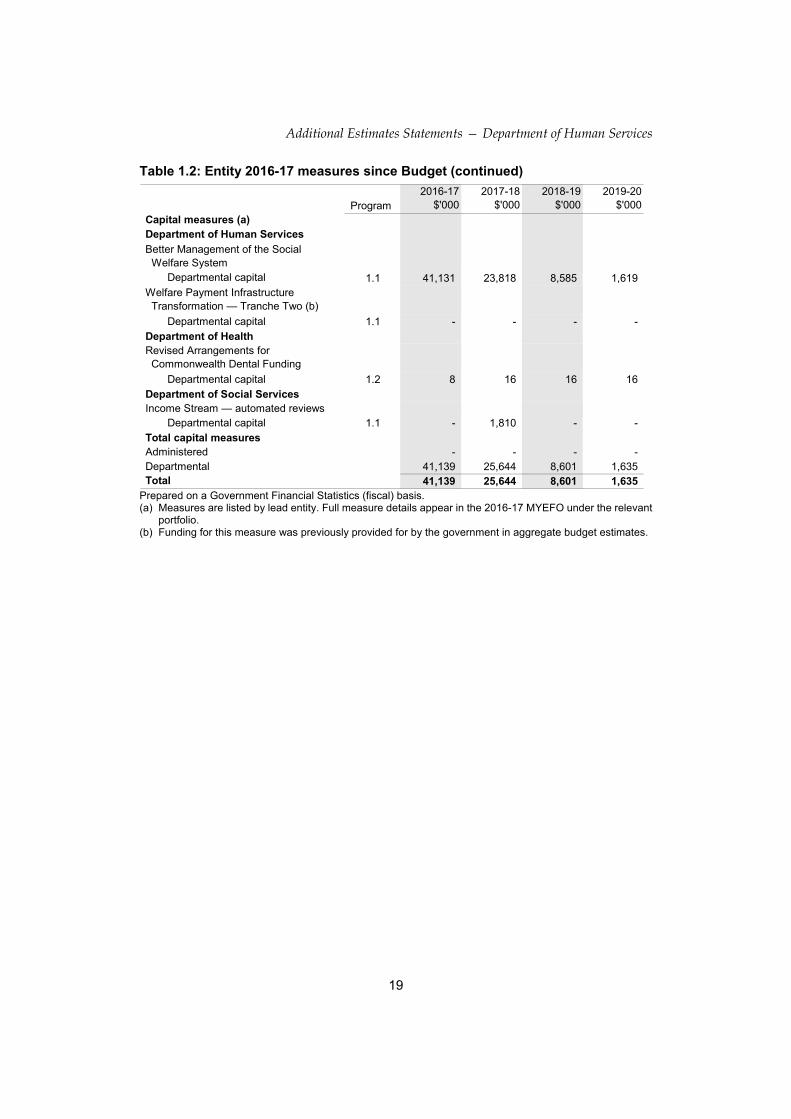
Table 1.2: Entity 2016-17 measures since Budget (continued)
Program 2016-17
$'000 2017-18
$'000 2018-19
$'000 2019-20
$'000 Capital measures (a) Department of Human Services
Better Management of the Social Welfare System
Departmental capital 1.1 41,131 23,818 8,585 1,619 Welfare Payment Infrastructure Transformation — Tranche Two (b)
Departmental capital 1.1 - - - - Department of Health Revised Arrangements for Commonwealth Dental Funding
Departmental capital 1.2 8 16 16 16 Department of Social Services Income Stream — automated reviews
Departmental capital 1.1 - 1,810 - - Total capital measures Administered - - - - Departmental 41,139 25,644 8,601 1,635 Total 41,139 25,644 8,601 1,635 Prepared on a Government Financial Statistics (fiscal) basis. (a) Measures are listed by lead entity. Full measure details appear in the 2016-17 MYEFO under the relevant
portfolio. (b) Funding for this measure was previously provided for by the government in aggregate budget estimates.
Additional Estimates Statements — Department of Human Services
20
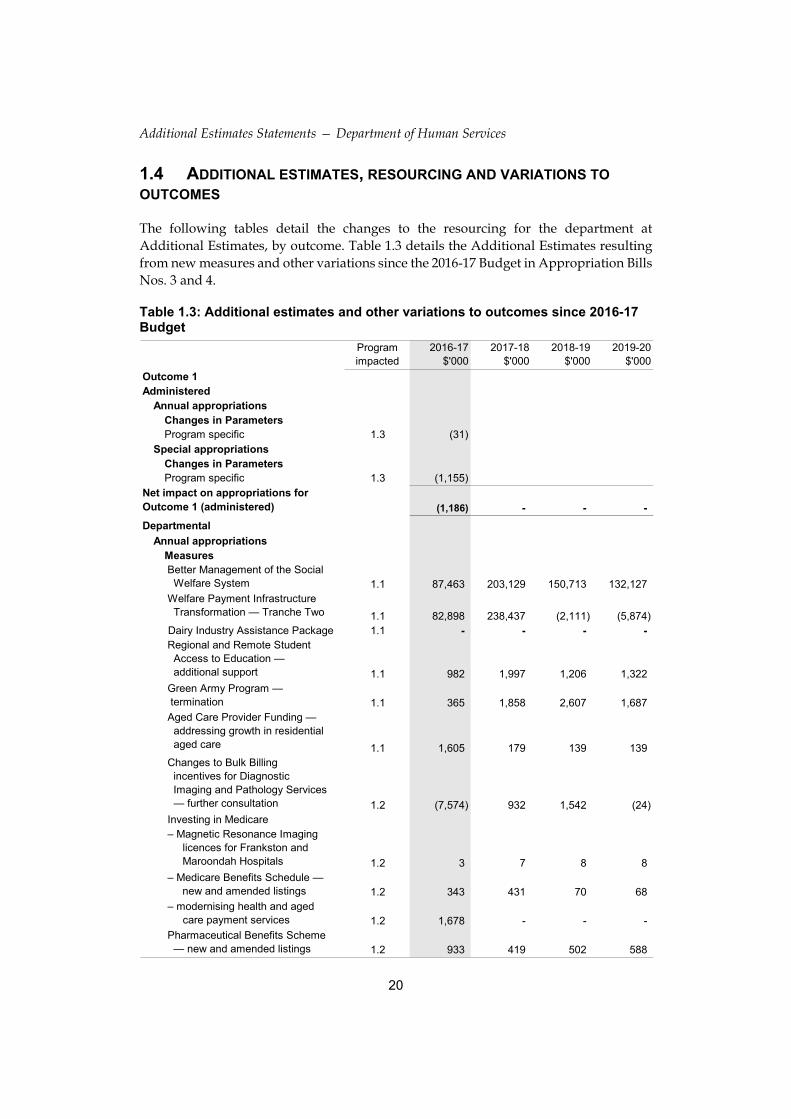
1.4 ADDITIONAL ESTIMATES, RESOURCING AND VARIATIONS TO
OUTCOMES
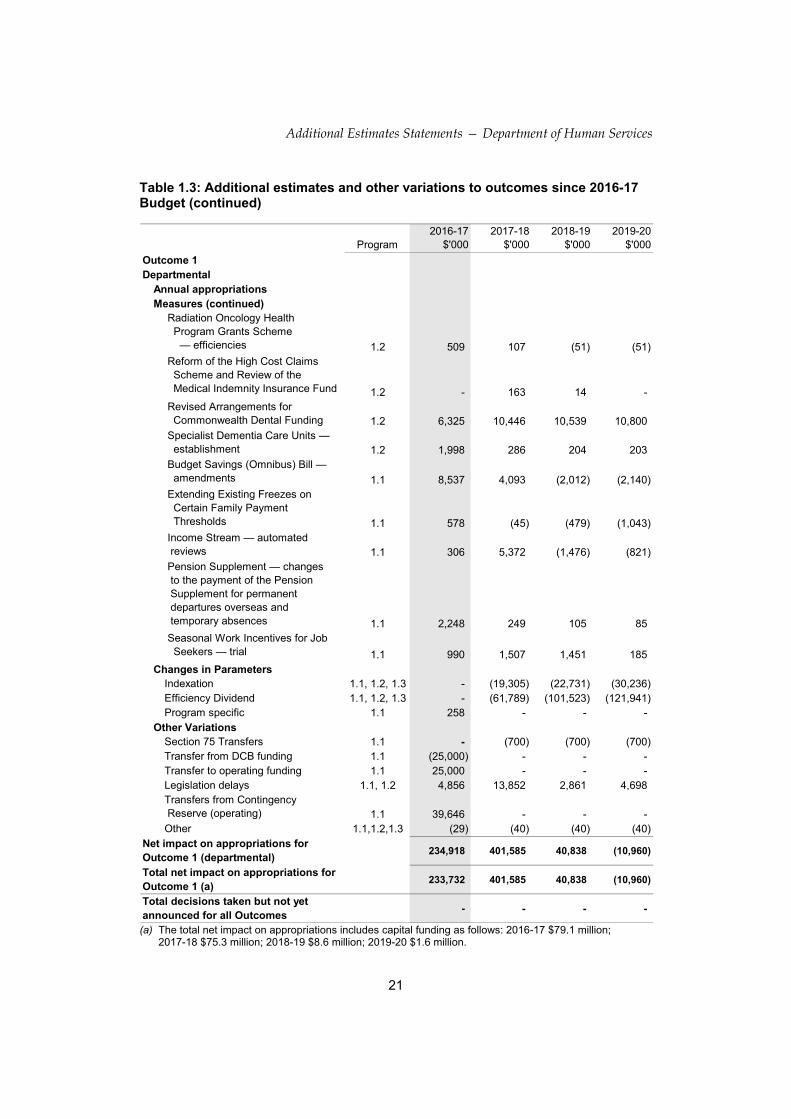
The following tables detail the changes to the resourcing for the department at Additional Estimates, by outcome. Table 1.3 details the Additional Estimates resulting from new measures and other variations since the 2016-17 Budget in Appropriation Bills Nos. 3 and 4.
Table 1.3: Additional estimates and other variations to outcomes since 2016-17 Budget
Program impacted
2016-17$'000
2017-18$'000
2018-19$'000
2019-20$'000
Outcome 1Administered
Annual appropriationsChanges in ParametersProgram specific 1.3 (31)
Special appropriations Changes in ParametersProgram specific 1.3 (1,155)
Net impact on appropriations for Outcome 1 (administered) (1,186) - - -
Departmental
Annual appropriationsMeasures Better Management of the Social Welfare System 1.1 87,463 203,129 150,713 132,127 Welfare Payment Infrastructure Transformation — Tranche Two 1.1 82,898 238,437 (2,111) (5,874) Dairy Industry Assistance Package 1.1 - - - -
Regional and Remote Student Access to Education — additional support 1.1 982 1,997 1,206 1,322 Green Army Program — termination 1.1 365 1,858 2,607 1,687 Aged Care Provider Funding — addressing growth in residential aged care 1.1 1,605 179 139 139 Changes to Bulk Billing incentives for Diagnostic Imaging and Pathology Services — further consultation 1.2 (7,574) 932 1,542 (24) Investing in Medicare – Magnetic Resonance Imaging licences for Frankston and Maroondah Hospitals 1.2 3 7 8 8 – Medicare Benefits Schedule — new and amended listings 1.2 343 431 70 68 – modernising health and aged care payment services 1.2 1,678 - - - Pharmaceutical Benefits Scheme — new and amended listings 1.2 933 419 502 588
Additional Estimates Statements — Department of Human Services
21
Table 1.3: Additional estimates and other variations to outcomes since 2016-17 Budget (continued)
Program2016-17
$'0002017-18
$'0002018-19
$'0002019-20
$'000
Outcome 1Departmental
Annual appropriationsMeasures (continued)
Radiation Oncology Health Program Grants Scheme — efficiencies 1.2 509 107 (51) (51) Reform of the High Cost Claims Scheme and Review of the Medical Indemnity Insurance Fund 1.2 - 163 14 - Revised Arrangements for Commonwealth Dental Funding 1.2 6,325 10,446 10,539 10,800 Specialist Dementia Care Units — establishment 1.2 1,998 286 204 203 Budget Savings (Omnibus) Bill — amendments 1.1 8,537 4,093 (2,012) (2,140) Extending Existing Freezes on Certain Family Payment Thresholds 1.1 578 (45) (479) (1,043) Income Stream — automated reviews 1.1 306 5,372 (1,476) (821) Pension Supplement — changes to the payment of the Pension Supplement for permanent departures overseas and temporary absences 1.1 2,248 249 105 85 Seasonal Work Incentives for Job Seekers — trial 1.1 990 1,507 1,451 185
Changes in ParametersIndexation 1.1, 1.2, 1.3 - (19,305) (22,731) (30,236) Efficiency Dividend 1.1, 1.2, 1.3 - (61,789) (101,523) (121,941) Program specific 1.1 258 - - -
Other VariationsSection 75 Transfers 1.1 - (700) (700) (700)Transfer from DCB funding 1.1 (25,000) - - - Transfer to operating funding 1.1 25,000 - - - Legislation delays 1.1, 1.2 4,856 13,852 2,861 4,698 Transfers from Contingency Reserve (operating) 1.1 39,646 - - -Other 1.1,1.2,1.3 (29) (40) (40) (40)
Net impact on appropriations for Outcome 1 (departmental)
234,918 401,585 40,838 (10,960)
Total net impact on appropriations for Outcome 1 (a)
233,732 401,585 40,838 (10,960)
Total decisions taken but not yet announced for all Outcomes
- - - -
(a) The total net impact on appropriations includes capital funding as follows: 2016-17 $79.1 million; 2017-18 $75.3 million; 2018-19 $8.6 million; 2019-20 $1.6 million.
Additional Estimates Statements — Department of Human Services
22
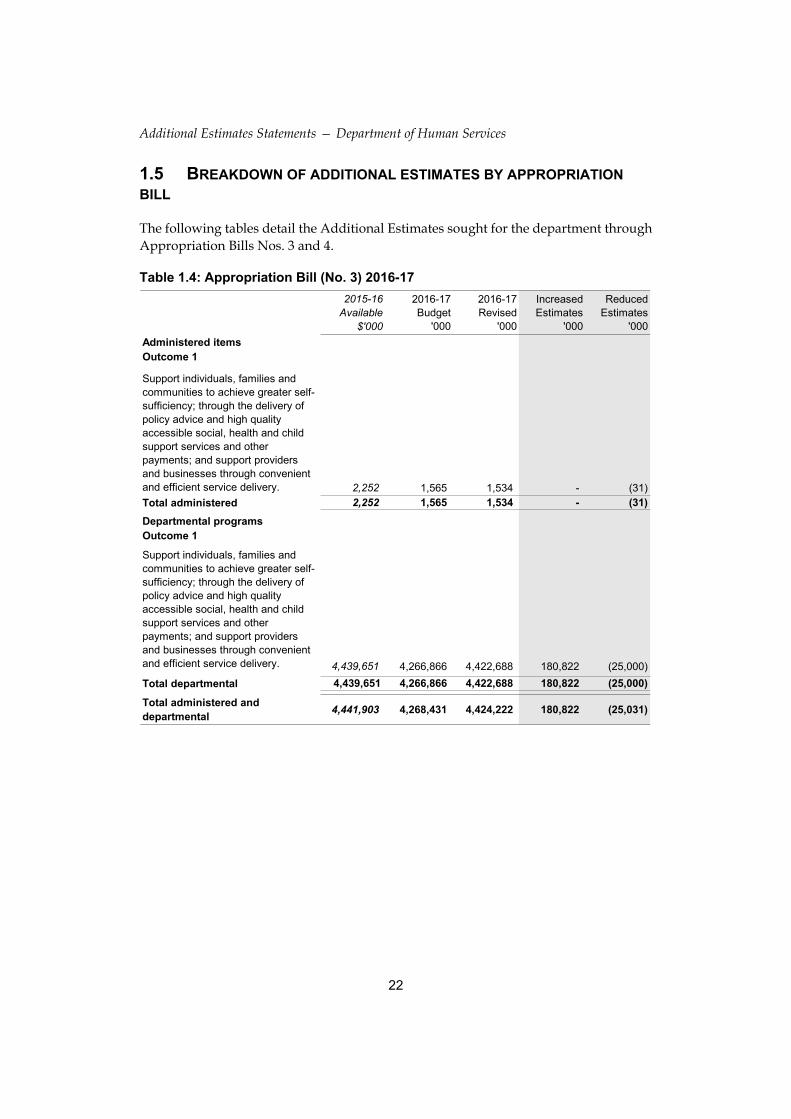
1.5 BREAKDOWN OF ADDITIONAL ESTIMATES BY APPROPRIATION
BILL
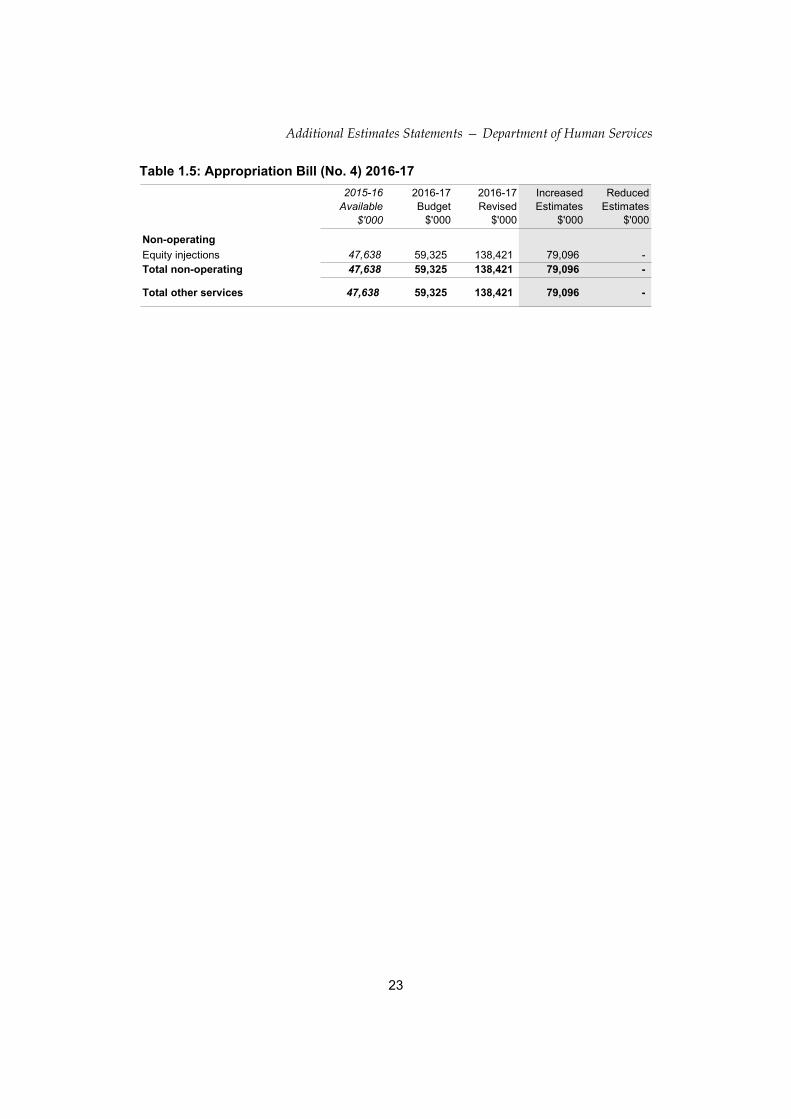
The following tables detail the Additional Estimates sought for the department through Appropriation Bills Nos. 3 and 4.
Table 1.4: Appropriation Bill (No. 3) 2016-17
2015-16Available
$'000
2016-17Budget
'000
2016-17Revised
'000
IncreasedEstimates
'000
ReducedEstimates
'000
Administered itemsOutcome 1
Support individuals, families and communities to achieve greater self-sufficiency; through the delivery of policy advice and high quality accessible social, health and child support services and other payments; and support providers and businesses through convenient and efficient service delivery. 2,252 1,565 1,534 - (31)
Total administered 2,252 1,565 1,534 - (31)
Departmental programsOutcome 1
Support individuals, families and communities to achieve greater self-sufficiency; through the delivery of policy advice and high quality accessible social, health and child support services and other payments; and support providers and businesses through convenient and efficient service delivery. 4,439,651 4,266,866 4,422,688 180,822 (25,000)
Total departmental 4,439,651 4,266,866 4,422,688 180,822 (25,000)
Total administered and departmental
4,441,903 4,268,431 4,424,222 180,822 (25,031)
Additional Estimates Statements — Department of Human Services
23
Table 1.5: Appropriation Bill (No. 4) 2016-17
2015-16Available
$'000
2016-17Budget
$'000
2016-17Revised
$'000
IncreasedEstimates
$'000
ReducedEstimates
$'000
Non-operating
Equity injections 47,638 59,325 138,421 79,096 -Total non-operating 47,638 59,325 138,421 79,096 -
Total other services 47,638 59,325 138,421 79,096 -
Additional Estimates Statements — Department of Human Services
24
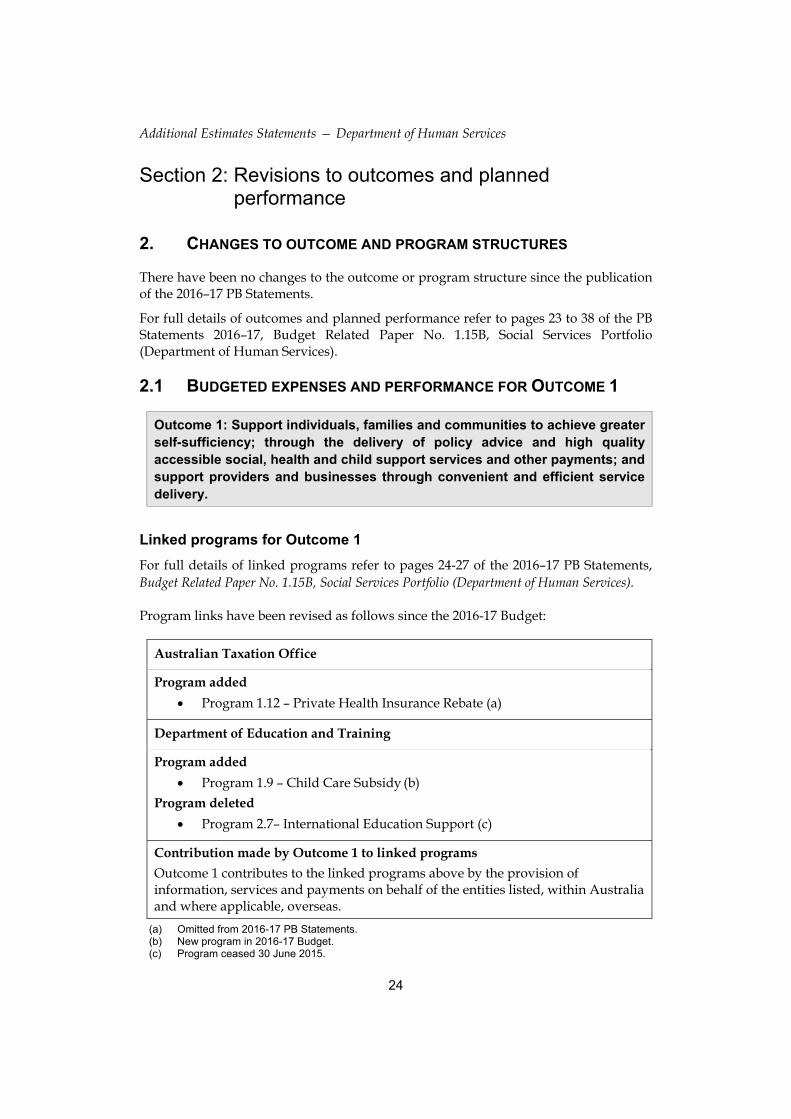
Section 2: Revisions to outcomes and planned performance
2. CHANGES TO OUTCOME AND PROGRAM STRUCTURES
There have been no changes to the outcome or program structure since the publication of the 2016–17 PB Statements.
For full details of outcomes and planned performance refer to pages 23 to 38 of the PB Statements 2016–17, Budget Related Paper No. 1.15B, Social Services Portfolio (Department of Human Services).
2.1 BUDGETED EXPENSES AND PERFORMANCE FOR OUTCOME 1
Outcome 1: Support individuals, families and communities to achieve greater self-sufficiency; through the delivery of policy advice and high quality accessible social, health and child support services and other payments; and support providers and businesses through convenient and efficient service delivery.
Linked programs for Outcome 1
For full details of linked programs refer to pages 24-27 of the 2016–17 PB Statements, Budget Related Paper No. 1.15B, Social Services Portfolio (Department of Human Services).
Program links have been revised as follows since the 2016-17 Budget:
Australian Taxation Office
Program added
Program 1.12 – Private Health Insurance Rebate (a)
Department of Education and Training
Program added
Program 1.9 – Child Care Subsidy (b)
Program deleted
Program 2.7– International Education Support (c)
Contribution made by Outcome 1 to linked programs
Outcome 1 contributes to the linked programs above by the provision of information, services and payments on behalf of the entities listed, within Australia and where applicable, overseas.
(a) Omitted from 2016-17 PB Statements. (b) New program in 2016-17 Budget. (c) Program ceased 30 June 2015.
Additional Estimates Statements — Department of Human Services
25
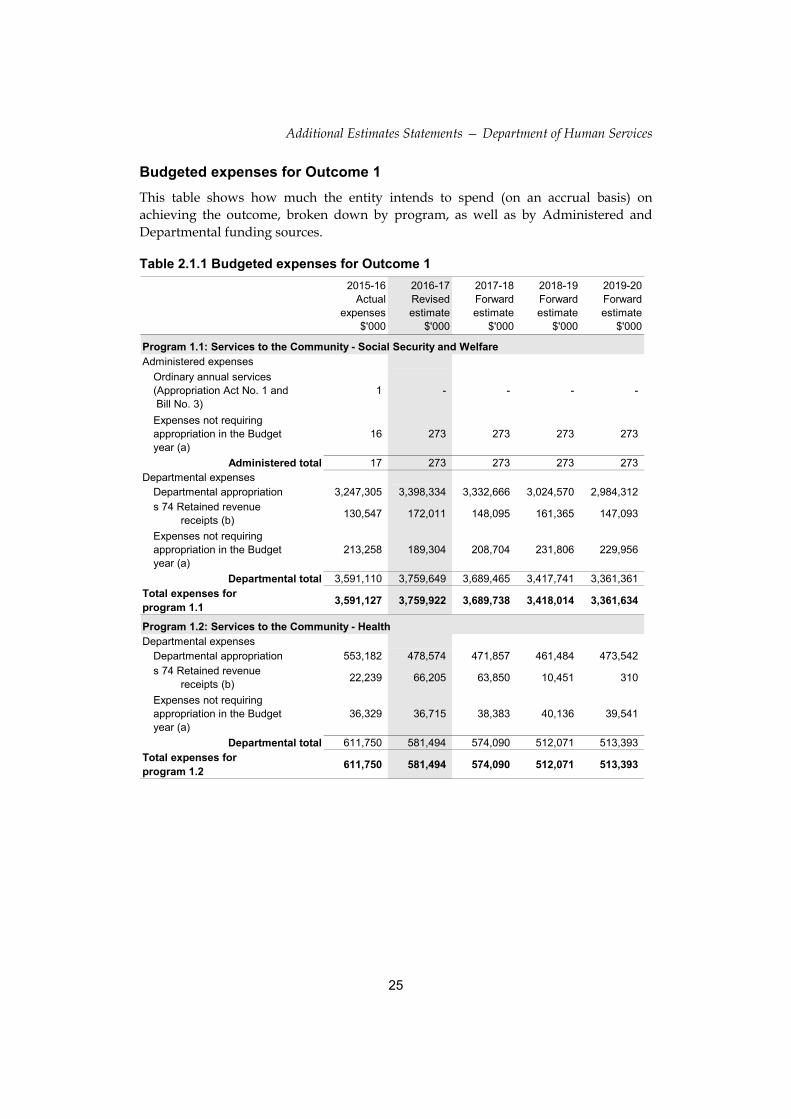
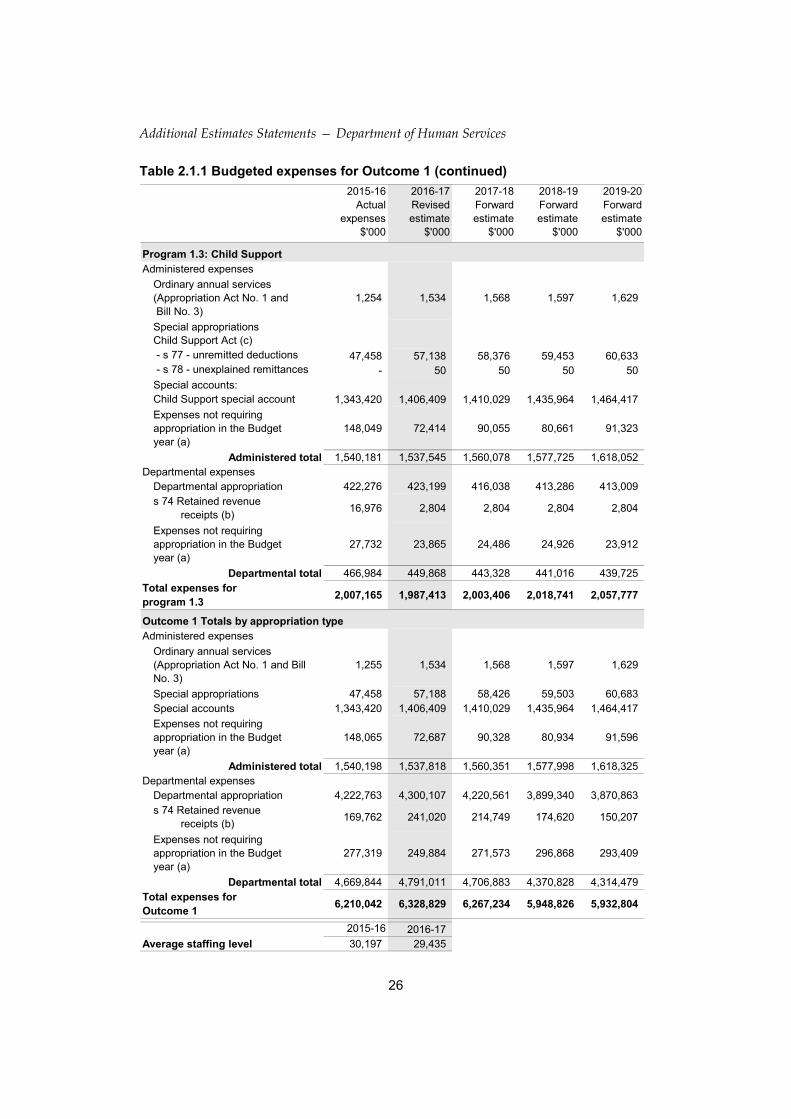
Budgeted expenses for Outcome 1
This table shows how much the entity intends to spend (on an accrual basis) on achieving the outcome, broken down by program, as well as by Administered and Departmental funding sources.
Table 2.1.1 Budgeted expenses for Outcome 1
2015-16Actual
expenses$'000
2016-17Revisedestimate
$'000
2017-18Forwardestimate
$'000
2018-19Forwardestimate
$'000
2019-20Forwardestimate
$'000
Administered expenses
Ordinary annual services (Appropriation Act No. 1 and Bill No. 3)
1 - - - -
Expenses not requiring appropriation in the Budget year (a)
16 273 273 273 273
Administered total 17 273 273 273 273 Departmental expenses
Departmental appropriation 3,247,305 3,398,334 3,332,666 3,024,570 2,984,312 s 74 Retained revenue receipts (b)
130,547 172,011 148,095 161,365 147,093
Expenses not requiring appropriation in the Budget year (a)
213,258 189,304 208,704 231,806 229,956
Departmental total 3,591,110 3,759,649 3,689,465 3,417,741 3,361,361 Total expenses for program 1.1
3,591,127 3,759,922 3,689,738 3,418,014 3,361,634
Departmental expensesDepartmental appropriation 553,182 478,574 471,857 461,484 473,542 s 74 Retained revenue receipts (b)
22,239 66,205 63,850 10,451 310
Expenses not requiring appropriation in the Budget year (a)
36,329 36,715 38,383 40,136 39,541
Departmental total 611,750 581,494 574,090 512,071 513,393 Total expenses for program 1.2
611,750 581,494 574,090 512,071 513,393
Program 1.2: Services to the Community - Health
Program 1.1: Services to the Community - Social Security and Welfare
Additional Estimates Statements — Department of Human Services
26
Table 2.1.1 Budgeted expenses for Outcome 1 (continued)
2015-16Actual
expenses$'000
2016-17Revisedestimate
$'000
2017-18Forwardestimate
$'000
2018-19Forwardestimate
$'000
2019-20Forwardestimate
$'000
Administered expenses
Ordinary annual services (Appropriation Act No. 1 and Bill No. 3)
1,254 1,534 1,568 1,597 1,629
Special appropriationsChild Support Act (c) - s 77 - unremitted deductions 47,458 57,138 58,376 59,453 60,633 - s 78 - unexplained remittances - 50 50 50 50 Special accounts:Child Support special account 1,343,420 1,406,409 1,410,029 1,435,964 1,464,417
Expenses not requiring appropriation in the Budget year (a)
148,049 72,414 90,055 80,661 91,323
Administered total 1,540,181 1,537,545 1,560,078 1,577,725 1,618,052 Departmental expenses
Departmental appropriation 422,276 423,199 416,038 413,286 413,009 s 74 Retained revenue receipts (b)
16,976 2,804 2,804 2,804 2,804
Expenses not requiring appropriation in the Budget year (a)
27,732 23,865 24,486 24,926 23,912
Departmental total 466,984 449,868 443,328 441,016 439,725 Total expenses for program 1.3
2,007,165 1,987,413 2,003,406 2,018,741 2,057,777
Administered expenses
Ordinary annual services (Appropriation Act No. 1 and Bill No. 3)
1,255 1,534 1,568 1,597 1,629
Special appropriations 47,458 57,188 58,426 59,503 60,683 Special accounts 1,343,420 1,406,409 1,410,029 1,435,964 1,464,417
Expenses not requiring appropriation in the Budget year (a)
148,065 72,687 90,328 80,934 91,596
Administered total 1,540,198 1,537,818 1,560,351 1,577,998 1,618,325 Departmental expenses
Departmental appropriation 4,222,763 4,300,107 4,220,561 3,899,340 3,870,863 s 74 Retained revenue receipts (b)
169,762 241,020 214,749 174,620 150,207
Expenses not requiring appropriation in the Budget year (a)
277,319 249,884 271,573 296,868 293,409
Departmental total 4,669,844 4,791,011 4,706,883 4,370,828 4,314,479 Total expenses forOutcome 1
6,210,042 6,328,829 6,267,234 5,948,826 5,932,804
2015-16 2016-17Average staffing level 30,197 29,435
Outcome 1 Totals by appropriation type
Program 1.3: Child Support
Additional Estimates Statements — Department of Human Services
27
Table 2.1.1 Budgeted expenses for Outcome 1 (continued) (a) Administered expenses not requiring appropriation in the Budget year comprise depreciation expense
and write down of assets. Departmental expenses not requiring appropriation in the Budget year include unfunded depreciation and amortisation expense; and resources consumed free of charge.
(b) Estimated expenses incurred in relation to receipts retained under section 74 of the PGPA Act.
(c) Child Support (Registration and Collection) Act 1988.
Note: Departmental appropriation splits and totals are indicative estimates and may change in the course of the budget year as government priorities change.
Performance criteria for Outcome 1
There have been no changes to the performance criteria since the publication of the 2016-17 PB Statements.
For full details of the performance criteria for Outcome 1 refer pages 31 to 38 of the Portfolio Budget Statements 2016-17, Budget related Paper No. 1.15B Social Services Portfolio (Department of Human Services).
Additional Estimates Statements — Department of Human Services
28
Section 3: Special account flows and budgeted financial statements
3.1 SPECIAL ACCOUNT FLOWS
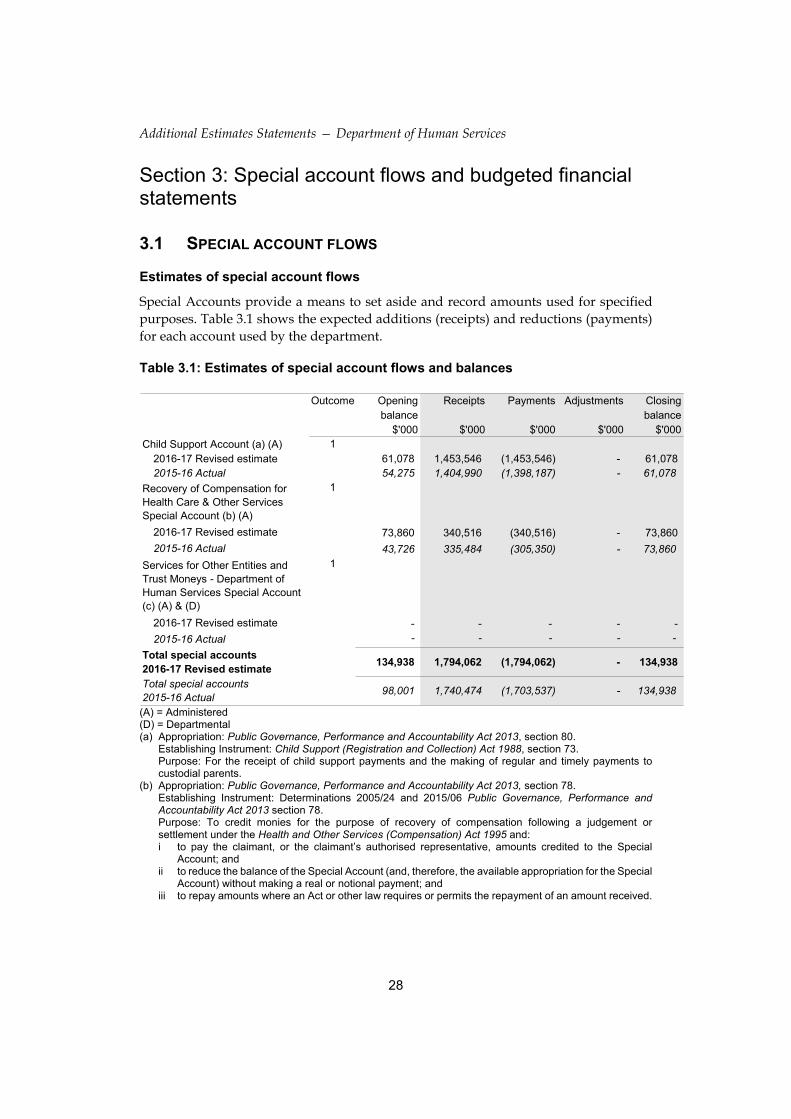
Estimates of special account flows
Special Accounts provide a means to set aside and record amounts used for specified purposes. Table 3.1 shows the expected additions (receipts) and reductions (payments) for each account used by the department.
Table 3.1: Estimates of special account flows and balances
Outcome Opening Receipts Payments Adjustments Closingbalance balance
$'000 $'000 $'000 $'000 $'000Child Support Account (a) (A) 1
2016-17 Revised estimate 61,078 1,453,546 (1,453,546) - 61,0782015-16 Actual 54,275 1,404,990 (1,398,187) - 61,078
Recovery of Compensation for Health Care & Other Services Special Account (b) (A)
1
2016-17 Revised estimate 73,860 340,516 (340,516) - 73,860
2015-16 Actual 43,726 335,484 (305,350) - 73,860
Services for Other Entities and Trust Moneys - Department of Human Services Special Account (c) (A) & (D)
1
2016-17 Revised estimate - - - - -
2015-16 Actual - - - - -
Total special accounts 2016-17 Revised estimate
134,938 1,794,062 (1,794,062) - 134,938
Total special accounts 2015-16 Actual
98,001 1,740,474 (1,703,537) - 134,938
(A) = Administered (D) = Departmental (a) Appropriation: Public Governance, Performance and Accountability Act 2013, section 80.
Establishing Instrument: Child Support (Registration and Collection) Act 1988, section 73. Purpose: For the receipt of child support payments and the making of regular and timely payments to custodial parents.
(b) Appropriation: Public Governance, Performance and Accountability Act 2013, section 78. Establishing Instrument: Determinations 2005/24 and 2015/06 Public Governance, Performance and Accountability Act 2013 section 78. Purpose: To credit monies for the purpose of recovery of compensation following a judgement or settlement under the Health and Other Services (Compensation) Act 1995 and: i to pay the claimant, or the claimant’s authorised representative, amounts credited to the Special
Account; and ii to reduce the balance of the Special Account (and, therefore, the available appropriation for the Special
Account) without making a real or notional payment; and iii to repay amounts where an Act or other law requires or permits the repayment of an amount received.
Additional Estimates Statements — Department of Human Services
29
Table 3.1.1: Estimates of special account flows and balances (continued)
(c) Appropriation: section 78(4) PGPA Act 2013. Establishing Instrument: Determination 2011/13 under Public Governance, Performance and Accountability Act 2013 section 78. Purpose: To credit and debit monies for the purpose of: i to disburse amounts held on trust or otherwise for the benefit of a person other than the
Commonwealth; ii to disburse amounts in connection with services performed on behalf of other governments and bodies
that are non-corporate Commonwealth entities; iii to repay amounts where an Act or other law requires or permits the repayment of an amount received;
and iv to reduce the balance of the Special Account (and, therefore, the available appropriation for the Special
Account) without making a real or notional payment.
Additional Estimates Statements — Department of Human Services
30
3.2 BUDGETED FINANCIAL STATEMENTS
3.2.1 Analysis of budgeted financial statements
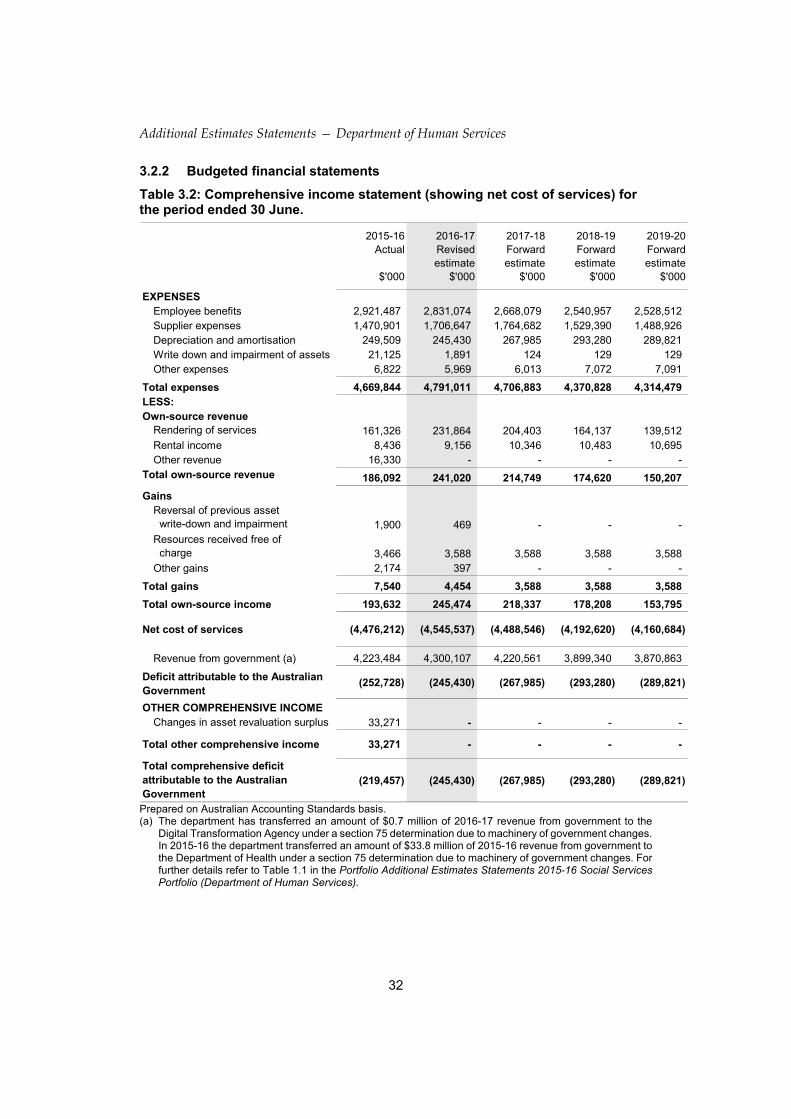
Departmental comprehensive income statement (Table 3.2)
Since the 2016–17 Budget, revenue from government in 2016-17 has increased by $179.9 million, reflecting additional expense measures of $143.4 million and other variations of $36.4 million (refer Table 1.3).
Since Budget, estimates of own-source income have increased by $122.9 million mainly reflecting changes in revenue from service agreements with other entities including the Australian Digital Health Agency, Departments of Health, Veterans’ Affairs; and the National Disability Insurance Agency.
Total expenses in 2016–17 have increased by $285.0 million since the 2016-17 Budget, mainly reflecting the impact of measures, other variations and own source income as noted above, and reduced depreciation expense following a revision of the useful lives of assets.
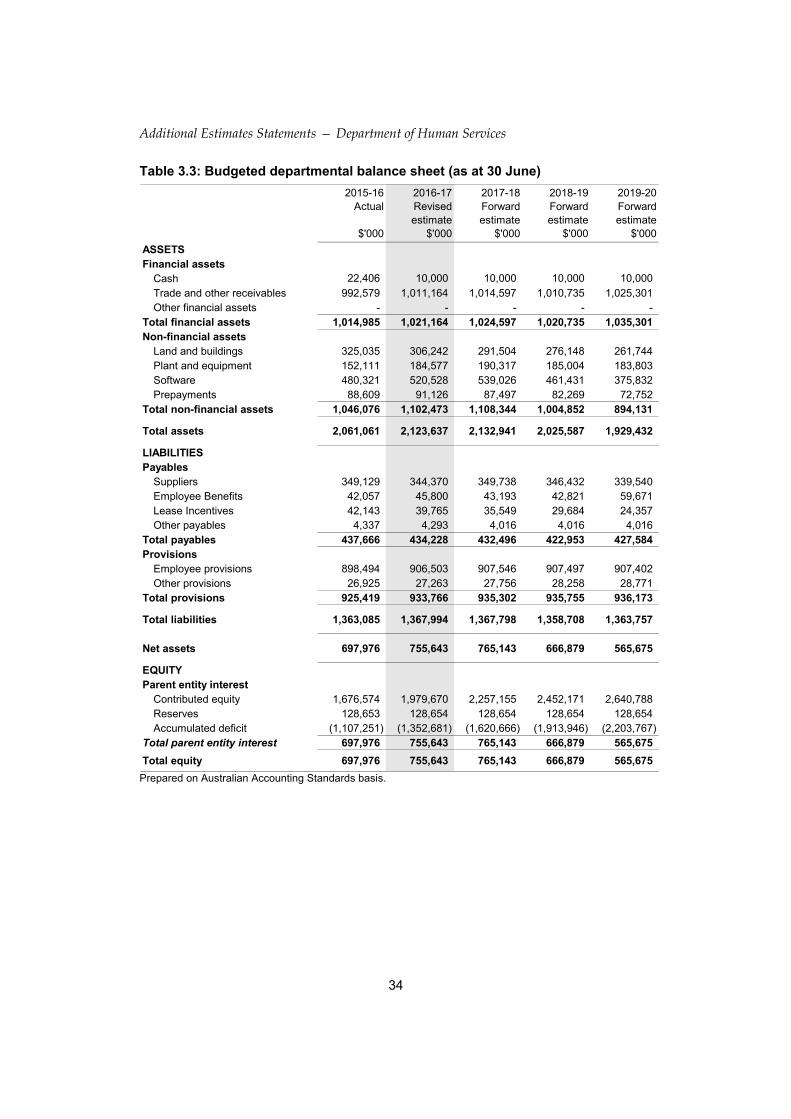
Departmental balance sheet (Table 3.3)
The budgeted net asset position at 30 June 2017 has increased by $87.9 million since the 2016–17 Budget to $755.6 million. The revised estimates take into account the 2015–16 operating result and the flow on effect of the audited financial accounts as at 30 June 2016.
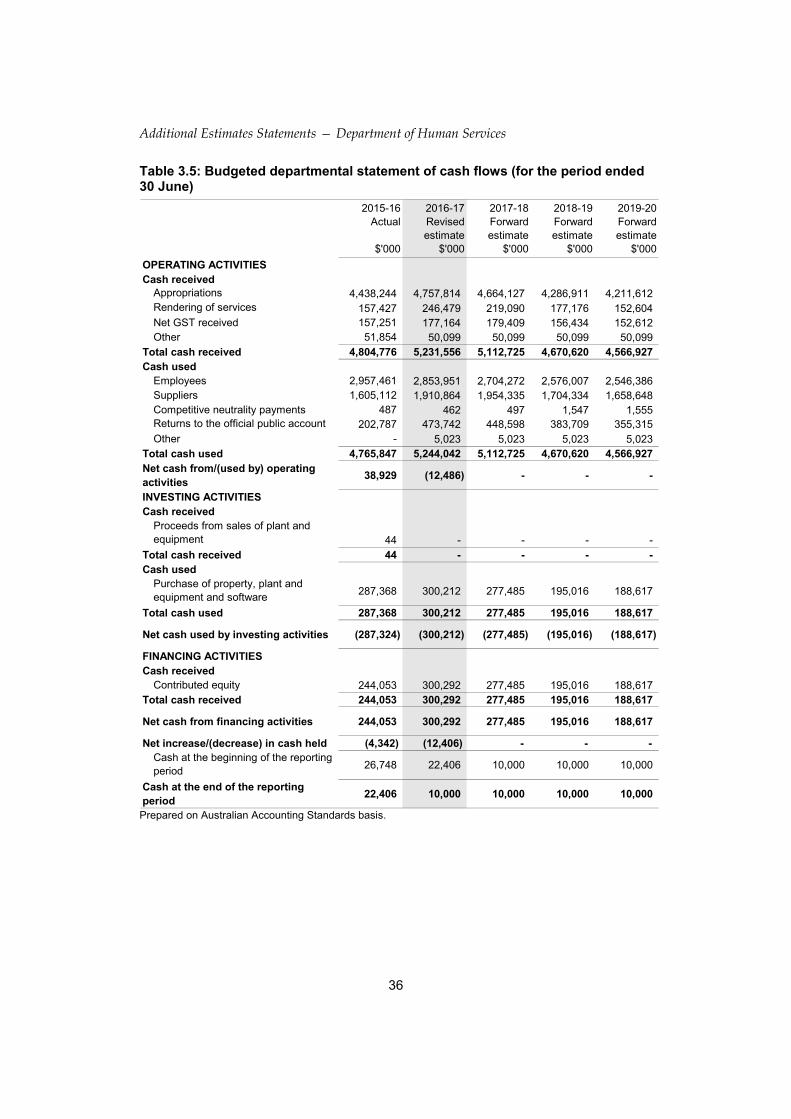
Departmental statement of cash flows (Table 3.5)
Since the 2016-17 Budget, departmental cash receipts and payments have been affected by changes in changes in appropriation; own source revenue; expenses and equity injections. Budgeted cash at the end of the reporting period has decreased by $17.6 million following a review of cash requirements.
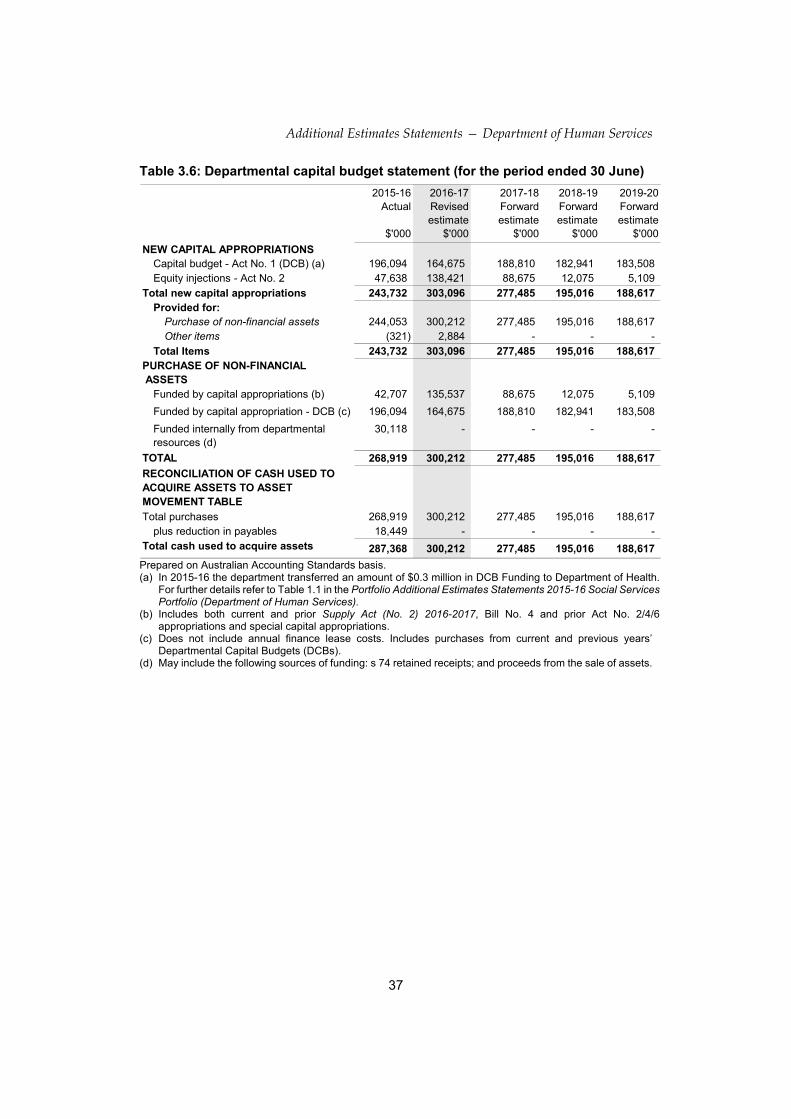
Departmental Capital Budget Statement (DCB) (Table 3.6)
Since the 2016–17 Budget, equity injection funding has increased by $79.1 million to $138.4 million, through measures ($46.7 million) and other variations ($32.3 million). An amount of $25.0 million was transferred from the DCB to operating expenditure, which has reduced the DCB to $164.7 million. The transfer was to cover increased operating expenses.
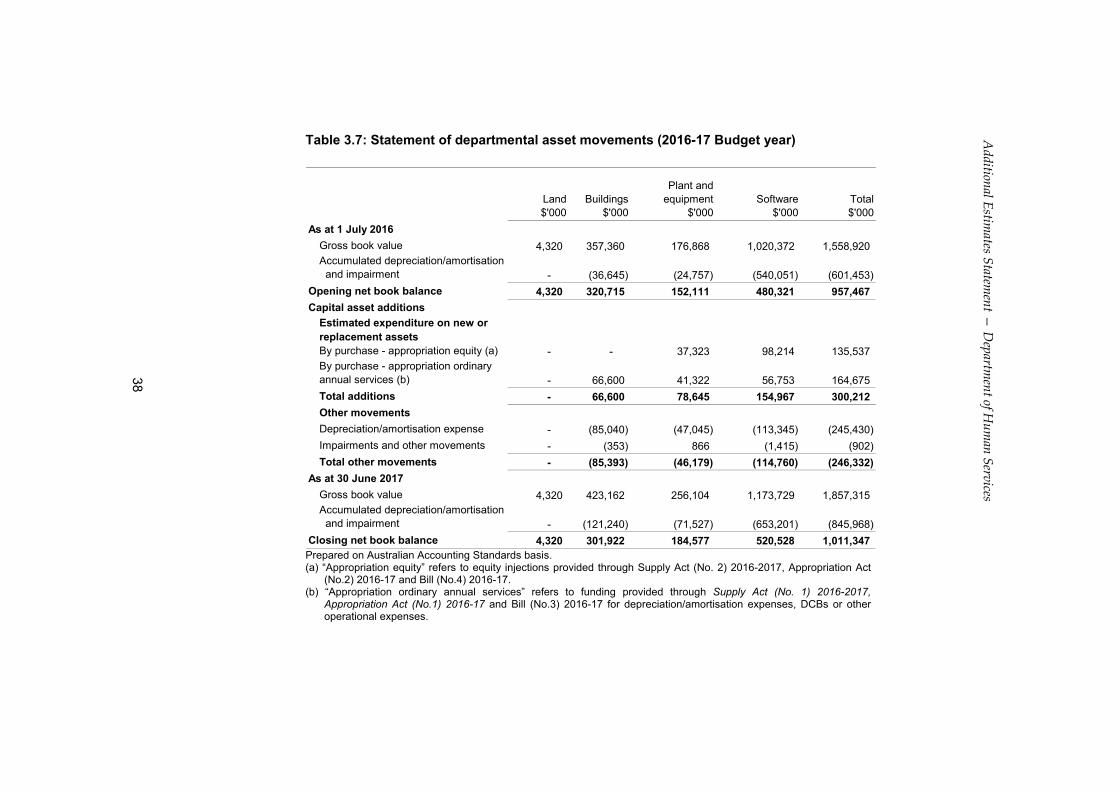
Statement of departmental asset movements (Table 3.7)
The estimated net book value of land, buildings, property plant and equipment and intangible assets as at 30 June 2017 has increased by $100.2 million since the 2016–17 Budget. This mainly reflects actual 2015–16 closing balances being $37.4 million higher than estimated at Budget; additional capital purchases of $46.0 million; and a reduction of $17.8 million in depreciation expense following a revision of the estimated useful lives of assets.
Additional Estimates Statements — Department of Human Services
31
3.2.1 Analysis of budgeted financial statements (continued)
Schedule of administered activity
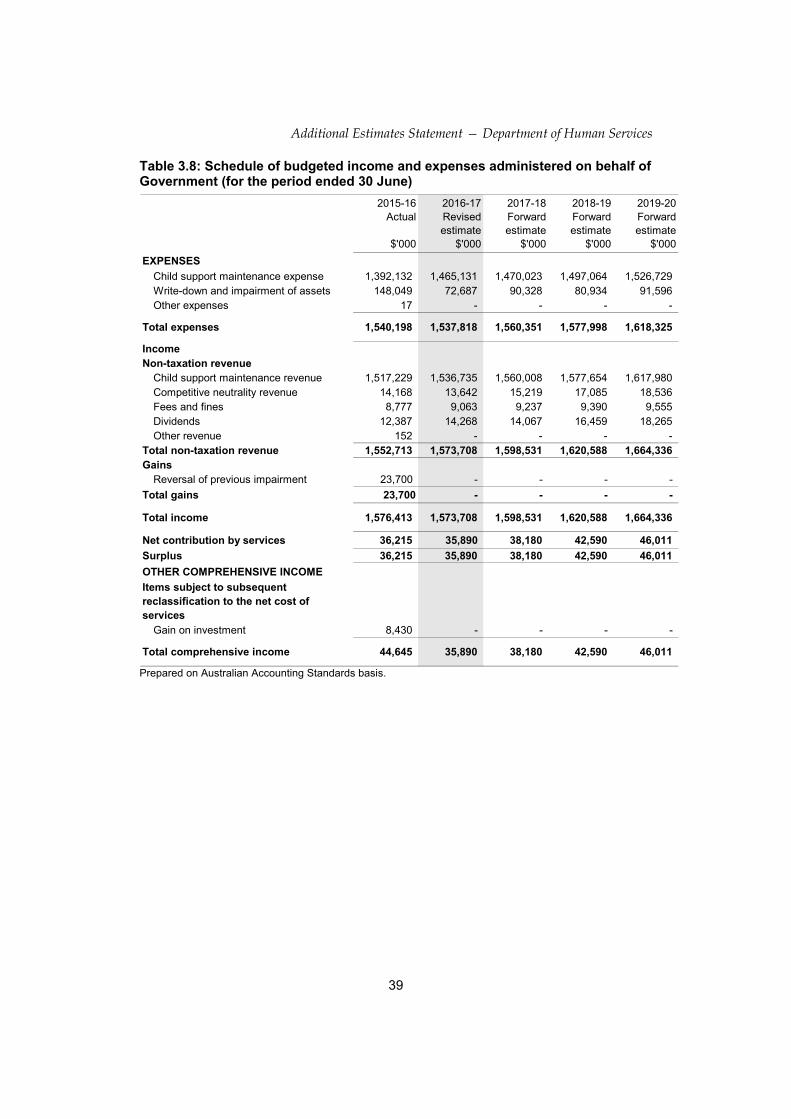
Administered income and expenses (Table 3.8)
Since the 2016–17 Budget, administered non taxation revenue has decreased by $15.9 million mainly reflecting a decrease in Child Support maintenance revenue.
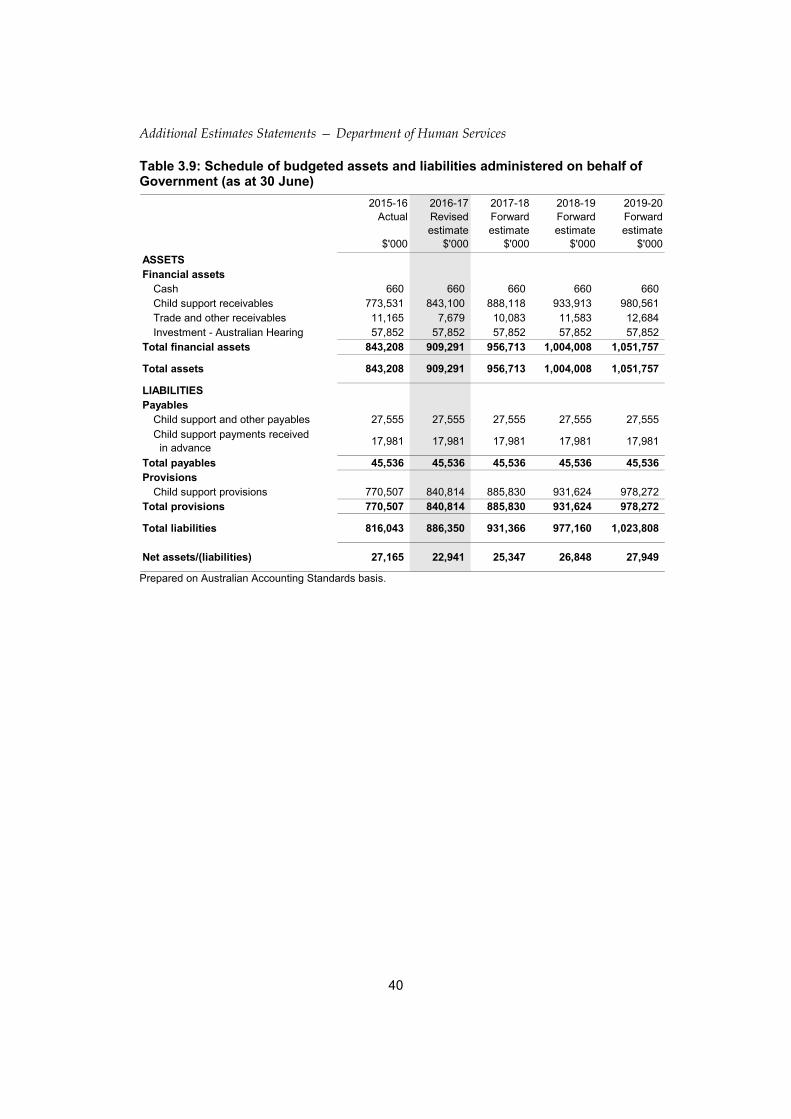
Administered assets and liabilities (Table 3.9) Since the 2016–17 Budget, the estimated closing asset balances for 2016–17 have decreased by $1.3 million, while liabilities have decreased by $4.1 million. These movements reflect an increase in the value of the Australian Hearing investment; offset by a decrease in receivables and provisions.
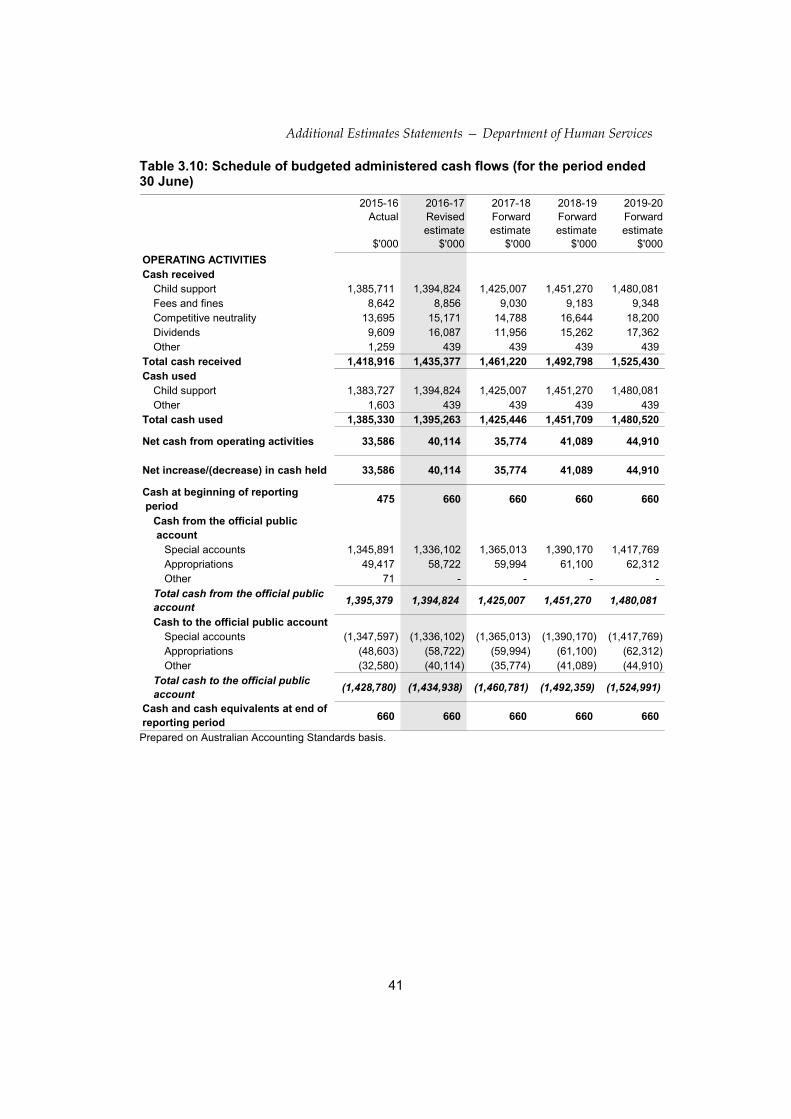
Administered statement of cash flows (Table 3.10)
Changes in administered cash flows and cash balances since the 2016-17 Budget reflect changes in child support receipts and payments.
Additional Estimates Statements — Department of Human Services
32
3.2.2 Budgeted financial statements
Table 3.2: Comprehensive income statement (showing net cost of services) for the period ended 30 June.
2015-16Actual
$'000
2016-17Revisedestimate
$'000
2017-18Forwardestimate
$'000
2018-19Forwardestimate
$'000
2019-20Forwardestimate
$'000
EXPENSESEmployee benefits 2,921,487 2,831,074 2,668,079 2,540,957 2,528,512 Supplier expenses 1,470,901 1,706,647 1,764,682 1,529,390 1,488,926 Depreciation and amortisation 249,509 245,430 267,985 293,280 289,821 Write down and impairment of assets 21,125 1,891 124 129 129 Other expenses 6,822 5,969 6,013 7,072 7,091
Total expenses 4,669,844 4,791,011 4,706,883 4,370,828 4,314,479 LESS: Own-source revenue
Rendering of services 161,326 231,864 204,403 164,137 139,512 Rental income 8,436 9,156 10,346 10,483 10,695 Other revenue 16,330 - - - -
Total own-source revenue 186,092 241,020 214,749 174,620 150,207
GainsReversal of previous asset write-down and impairment 1,900 469 - - - Resources received free of charge 3,466 3,588 3,588 3,588 3,588 Other gains 2,174 397 - - -
Total gains 7,540 4,454 3,588 3,588 3,588
Total own-source income 193,632 245,474 218,337 178,208 153,795
Net cost of services (4,476,212) (4,545,537) (4,488,546) (4,192,620) (4,160,684)
Revenue from government (a) 4,223,484 4,300,107 4,220,561 3,899,340 3,870,863
Deficit attributable to the Australian Government
(252,728) (245,430) (267,985) (293,280) (289,821)
OTHER COMPREHENSIVE INCOMEChanges in asset revaluation surplus 33,271 - - - -
Total other comprehensive income 33,271 - - - -
Total comprehensive deficit attributable to the Australian Government
(219,457) (245,430) (267,985) (293,280) (289,821)
Prepared on Australian Accounting Standards basis. (a) The department has transferred an amount of $0.7 million of 2016-17 revenue from government to the
Digital Transformation Agency under a section 75 determination due to machinery of government changes. In 2015-16 the department transferred an amount of $33.8 million of 2015-16 revenue from government to the Department of Health under a section 75 determination due to machinery of government changes. For further details refer to Table 1.1 in the Portfolio Additional Estimates Statements 2015-16 Social Services Portfolio (Department of Human Services).
Additional Estimates Statements — Department of Human Services
33
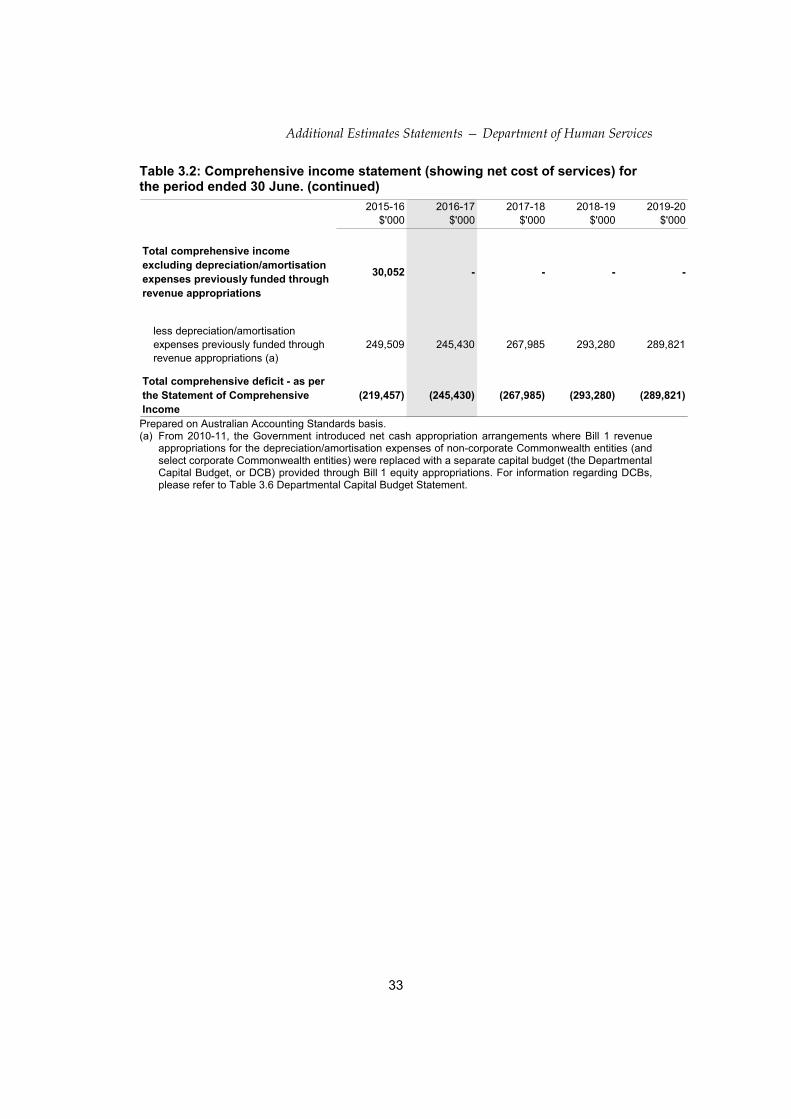
Table 3.2: Comprehensive income statement (showing net cost of services) for the period ended 30 June. (continued)
2015-16$'000
2016-17$'000
2017-18$'000
2018-19$'000
2019-20$'000
Total comprehensive income excluding depreciation/amortisation expenses previously funded through revenue appropriations
30,052 - - - -
less depreciation/amortisation expenses previously funded through revenue appropriations (a)
249,509 245,430 267,985 293,280 289,821
Total comprehensive deficit - as per the Statement of Comprehensive Income
(219,457) (245,430) (267,985) (293,280) (289,821)
Prepared on Australian Accounting Standards basis. (a) From 2010-11, the Government introduced net cash appropriation arrangements where Bill 1 revenue
appropriations for the depreciation/amortisation expenses of non-corporate Commonwealth entities (and select corporate Commonwealth entities) were replaced with a separate capital budget (the Departmental Capital Budget, or DCB) provided through Bill 1 equity appropriations. For information regarding DCBs, please refer to Table 3.6 Departmental Capital Budget Statement.
Additional Estimates Statements — Department of Human Services
34
Table 3.3: Budgeted departmental balance sheet (as at 30 June)
2015-16Actual
$'000
2016-17Revisedestimate
$'000
2017-18Forwardestimate
$'000
2018-19Forwardestimate
$'000
2019-20Forwardestimate
$'000
ASSETSFinancial assets
Cash 22,406 10,000 10,000 10,000 10,000 Trade and other receivables 992,579 1,011,164 1,014,597 1,010,735 1,025,301 Other financial assets - - - - -
Total financial assets 1,014,985 1,021,164 1,024,597 1,020,735 1,035,301 Non-financial assets
Land and buildings 325,035 306,242 291,504 276,148 261,744 Plant and equipment 152,111 184,577 190,317 185,004 183,803 Software 480,321 520,528 539,026 461,431 375,832 Prepayments 88,609 91,126 87,497 82,269 72,752
Total non-financial assets 1,046,076 1,102,473 1,108,344 1,004,852 894,131
Total assets 2,061,061 2,123,637 2,132,941 2,025,587 1,929,432
LIABILITIESPayables
Suppliers 349,129 344,370 349,738 346,432 339,540 Employee Benefits 42,057 45,800 43,193 42,821 59,671 Lease Incentives 42,143 39,765 35,549 29,684 24,357 Other payables 4,337 4,293 4,016 4,016 4,016
Total payables 437,666 434,228 432,496 422,953 427,584 Provisions
Employee provisions 898,494 906,503 907,546 907,497 907,402 Other provisions 26,925 27,263 27,756 28,258 28,771
Total provisions 925,419 933,766 935,302 935,755 936,173
Total liabilities 1,363,085 1,367,994 1,367,798 1,358,708 1,363,757
Net assets 697,976 755,643 765,143 666,879 565,675
EQUITYParent entity interest
Contributed equity 1,676,574 1,979,670 2,257,155 2,452,171 2,640,788 Reserves 128,653 128,654 128,654 128,654 128,654 Accumulated deficit (1,107,251) (1,352,681) (1,620,666) (1,913,946) (2,203,767)
Total parent entity interest 697,976 755,643 765,143 666,879 565,675
Total equity 697,976 755,643 765,143 666,879 565,675
Prepared on Australian Accounting Standards basis.
Additional Estimates Statements — Department of Human Services
35
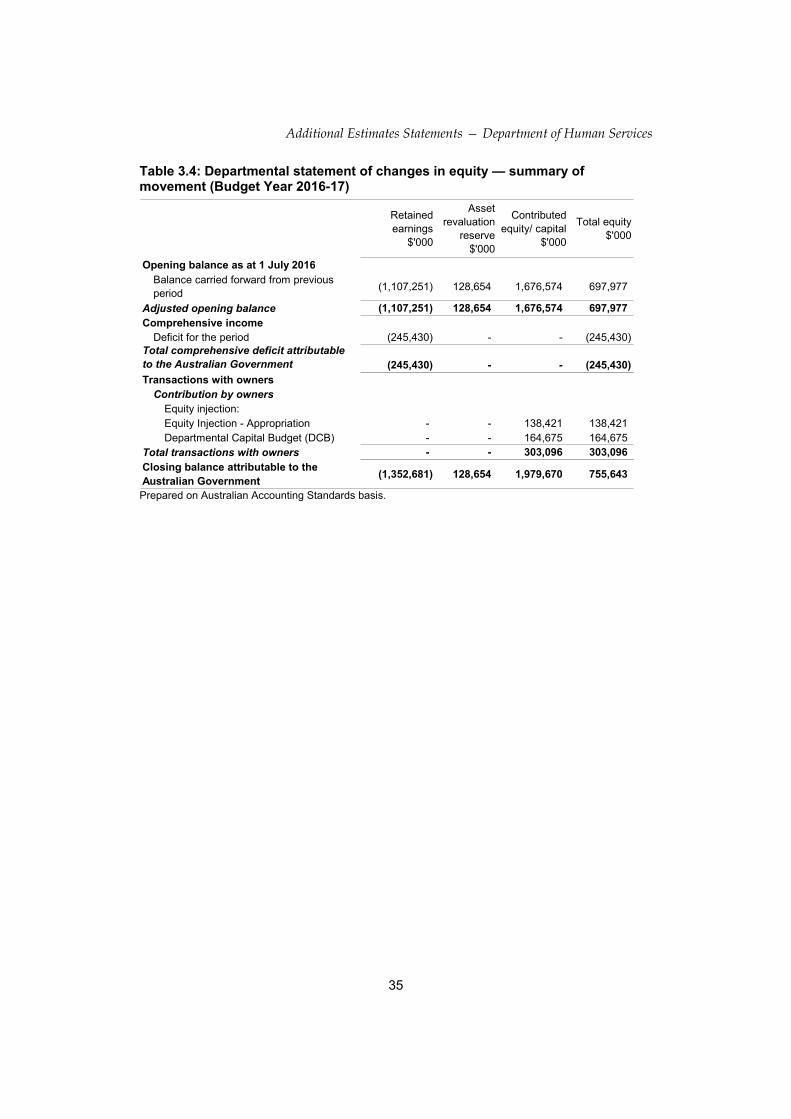
Table 3.4: Departmental statement of changes in equity — summary of movement (Budget Year 2016-17)
Retained earnings
$'000
Asset revaluation
reserve$'000
Contributed equity/ capital
$'000
Total equity $'000
Opening balance as at 1 July 2016Balance carried forward from previous period
(1,107,251) 128,654 1,676,574 697,977
Adjusted opening balance (1,107,251) 128,654 1,676,574 697,977 Comprehensive income
Deficit for the period (245,430) - - (245,430) Total comprehensive deficit attributable to the Australian Government (245,430) - - (245,430) Transactions with owners
Contribution by ownersEquity injection:Equity Injection - Appropriation - - 138,421 138,421 Departmental Capital Budget (DCB) - - 164,675 164,675
Total transactions with owners - - 303,096 303,096
Closing balance attributable to the Australian Government
(1,352,681) 128,654 1,979,670 755,643
Prepared on Australian Accounting Standards basis.
Additional Estimates Statements — Department of Human Services
36
Table 3.5: Budgeted departmental statement of cash flows (for the period ended 30 June)
2015-16Actual
$'000
2016-17Revisedestimate
$'000
2017-18Forwardestimate
$'000
2018-19Forwardestimate
$'000
2019-20Forwardestimate
$'000
OPERATING ACTIVITIESCash received
Appropriations 4,438,244 4,757,814 4,664,127 4,286,911 4,211,612 Rendering of services 157,427 246,479 219,090 177,176 152,604 Net GST received 157,251 177,164 179,409 156,434 152,612 Other 51,854 50,099 50,099 50,099 50,099
Total cash received 4,804,776 5,231,556 5,112,725 4,670,620 4,566,927 Cash used
Employees 2,957,461 2,853,951 2,704,272 2,576,007 2,546,386 Suppliers 1,605,112 1,910,864 1,954,335 1,704,334 1,658,648 Competitive neutrality payments 487 462 497 1,547 1,555 Returns to the official public account 202,787 473,742 448,598 383,709 355,315 Other - 5,023 5,023 5,023 5,023
Total cash used 4,765,847 5,244,042 5,112,725 4,670,620 4,566,927 Net cash from/(used by) operating activities
38,929 (12,486) - - -
INVESTING ACTIVITIESCash received
Proceeds from sales of plant and equipment 44 - - - -
Total cash received 44 - - - - Cash used
Purchase of property, plant and equipment and software
287,368 300,212 277,485 195,016 188,617
Total cash used 287,368 300,212 277,485 195,016 188,617
Net cash used by investing activities (287,324) (300,212) (277,485) (195,016) (188,617)
FINANCING ACTIVITIESCash received
Contributed equity 244,053 300,292 277,485 195,016 188,617 Total cash received 244,053 300,292 277,485 195,016 188,617
Net cash from financing activities 244,053 300,292 277,485 195,016 188,617
Net increase/(decrease) in cash held (4,342) (12,406) - - - Cash at the beginning of the reporting period
26,748 22,406 10,000 10,000 10,000
Cash at the end of the reporting period
22,406 10,000 10,000 10,000 10,000
Prepared on Australian Accounting Standards basis.
Additional Estimates Statements — Department of Human Services
37
Table 3.6: Departmental capital budget statement (for the period ended 30 June)
2015-16Actual
$'000
2016-17Revisedestimate
$'000
2017-18Forwardestimate
$'000
2018-19Forwardestimate
$'000
2019-20Forwardestimate
$'000
NEW CAPITAL APPROPRIATIONSCapital budget - Act No. 1 (DCB) (a) 196,094 164,675 188,810 182,941 183,508 Equity injections - Act No. 2 47,638 138,421 88,675 12,075 5,109
Total new capital appropriations 243,732 303,096 277,485 195,016 188,617 Provided for:
Purchase of non-financial assets 244,053 300,212 277,485 195,016 188,617 Other items (321) 2,884 - - -
Total Items 243,732 303,096 277,485 195,016 188,617 PURCHASE OF NON-FINANCIAL ASSETS
Funded by capital appropriations (b) 42,707 135,537 88,675 12,075 5,109
Funded by capital appropriation - DCB (c) 196,094 164,675 188,810 182,941 183,508
Funded internally from departmental resources (d)
30,118 - - - -
TOTAL 268,919 300,212 277,485 195,016 188,617
RECONCILIATION OF CASH USED TO ACQUIRE ASSETS TO ASSET MOVEMENT TABLE
Total purchases 268,919 300,212 277,485 195,016 188,617 plus reduction in payables 18,449 - - - -
Total cash used to acquire assets 287,368 300,212 277,485 195,016 188,617
Prepared on Australian Accounting Standards basis. (a) In 2015-16 the department transferred an amount of $0.3 million in DCB Funding to Department of Health.
For further details refer to Table 1.1 in the Portfolio Additional Estimates Statements 2015-16 Social Services Portfolio (Department of Human Services).
(b) Includes both current and prior Supply Act (No. 2) 2016-2017, Bill No. 4 and prior Act No. 2/4/6 appropriations and special capital appropriations.
(c) Does not include annual finance lease costs. Includes purchases from current and previous years’ Departmental Capital Budgets (DCBs).
(d) May include the following sources of funding: s 74 retained receipts; and proceeds from the sale of assets.
38
Additional E
stimates Statem
ent — D
epartment of H
uman Services
Table 3.7: Statement of departmental asset movements (2016-17 Budget year)
Land$'000
Buildings$'000
Plant and equipment
$'000Software
$'000Total$'000
As at 1 July 2016
Gross book value 4,320 357,360 176,868 1,020,372 1,558,920 Accumulated depreciation/amortisation and impairment - (36,645) (24,757) (540,051) (601,453)
Opening net book balance 4,320 320,715 152,111 480,321 957,467
Capital asset additions
Estimated expenditure on new or replacement assetsBy purchase - appropriation equity (a) - - 37,323 98,214 135,537 By purchase - appropriation ordinary annual services (b) - 66,600 41,322 56,753 164,675
Total additions - 66,600 78,645 154,967 300,212
Other movements
Depreciation/amortisation expense - (85,040) (47,045) (113,345) (245,430)
Impairments and other movements - (353) 866 (1,415) (902)
Total other movements - (85,393) (46,179) (114,760) (246,332)
As at 30 June 2017
Gross book value 4,320 423,162 256,104 1,173,729 1,857,315 Accumulated depreciation/amortisation and impairment - (121,240) (71,527) (653,201) (845,968)
Closing net book balance 4,320 301,922 184,577 520,528 1,011,347 Prepared on Australian Accounting Standards basis. (a) “Appropriation equity” refers to equity injections provided through Supply Act (No. 2) 2016-2017, Appropriation Act
(No.2) 2016-17 and Bill (No.4) 2016-17. (b) “Appropriation ordinary annual services” refers to funding provided through Supply Act (No. 1) 2016-2017,
Appropriation Act (No.1) 2016-17 and Bill (No.3) 2016-17 for depreciation/amortisation expenses, DCBs or other operational expenses.
Additional Estimates Statement — Department of Human Services
39
Table 3.8: Schedule of budgeted income and expenses administered on behalf of Government (for the period ended 30 June)
2015-16Actual
$'000
2016-17Revisedestimate
$'000
2017-18Forwardestimate
$'000
2018-19Forwardestimate
$'000
2019-20Forwardestimate
$'000
EXPENSES
Child support maintenance expense 1,392,132 1,465,131 1,470,023 1,497,064 1,526,729 Write-down and impairment of assets 148,049 72,687 90,328 80,934 91,596 Other expenses 17 - - - -
Total expenses 1,540,198 1,537,818 1,560,351 1,577,998 1,618,325
IncomeNon-taxation revenue
Child support maintenance revenue 1,517,229 1,536,735 1,560,008 1,577,654 1,617,980 Competitive neutrality revenue 14,168 13,642 15,219 17,085 18,536 Fees and fines 8,777 9,063 9,237 9,390 9,555 Dividends 12,387 14,268 14,067 16,459 18,265 Other revenue 152 - - - -
Total non-taxation revenue 1,552,713 1,573,708 1,598,531 1,620,588 1,664,336 Gains
Reversal of previous impairment 23,700 - - - -
Total gains 23,700 - - - -
Total income 1,576,413 1,573,708 1,598,531 1,620,588 1,664,336
Net contribution by services 36,215 35,890 38,180 42,590 46,011
Surplus 36,215 35,890 38,180 42,590 46,011
OTHER COMPREHENSIVE INCOME
Items subject to subsequent reclassification to the net cost of services
Gain on investment 8,430 - - - -
Total comprehensive income 44,645 35,890 38,180 42,590 46,011
Prepared on Australian Accounting Standards basis.
Additional Estimates Statements — Department of Human Services
40
Table 3.9: Schedule of budgeted assets and liabilities administered on behalf of Government (as at 30 June)
2015-16Actual
$'000
2016-17Revisedestimate
$'000
2017-18Forwardestimate
$'000
2018-19Forwardestimate
$'000
2019-20Forwardestimate
$'000
ASSETSFinancial assets
Cash 660 660 660 660 660 Child support receivables 773,531 843,100 888,118 933,913 980,561 Trade and other receivables 11,165 7,679 10,083 11,583 12,684 Investment - Australian Hearing 57,852 57,852 57,852 57,852 57,852
Total financial assets 843,208 909,291 956,713 1,004,008 1,051,757
Total assets 843,208 909,291 956,713 1,004,008 1,051,757
LIABILITIESPayables
Child support and other payables 27,555 27,555 27,555 27,555 27,555 Child support payments received in advance
17,981 17,981 17,981 17,981 17,981
Total payables 45,536 45,536 45,536 45,536 45,536 Provisions
Child support provisions 770,507 840,814 885,830 931,624 978,272 Total provisions 770,507 840,814 885,830 931,624 978,272
Total liabilities 816,043 886,350 931,366 977,160 1,023,808
Net assets/(liabilities) 27,165 22,941 25,347 26,848 27,949
Prepared on Australian Accounting Standards basis.
Additional Estimates Statements — Department of Human Services
41
Table 3.10: Schedule of budgeted administered cash flows (for the period ended 30 June)
2015-16Actual
$'000
2016-17Revisedestimate
$'000
2017-18Forwardestimate
$'000
2018-19Forwardestimate
$'000
2019-20Forwardestimate
$'000
OPERATING ACTIVITIESCash received
Child support 1,385,711 1,394,824 1,425,007 1,451,270 1,480,081Fees and fines 8,642 8,856 9,030 9,183 9,348Competitive neutrality 13,695 15,171 14,788 16,644 18,200Dividends 9,609 16,087 11,956 15,262 17,362Other 1,259 439 439 439 439
Total cash received 1,418,916 1,435,377 1,461,220 1,492,798 1,525,430Cash used
Child support 1,383,727 1,394,824 1,425,007 1,451,270 1,480,081Other 1,603 439 439 439 439
Total cash used 1,385,330 1,395,263 1,425,446 1,451,709 1,480,520
Net cash from operating activities 33,586 40,114 35,774 41,089 44,910
Net increase/(decrease) in cash held 33,586 40,114 35,774 41,089 44,910
Cash at beginning of reporting period
475 660 660 660 660
Cash from the official public account
Special accounts 1,345,891 1,336,102 1,365,013 1,390,170 1,417,769Appropriations 49,417 58,722 59,994 61,100 62,312Other 71 - - - -
Total cash from the official public account
1,395,379 1,394,824 1,425,007 1,451,270 1,480,081
Cash to the official public accountSpecial accounts (1,347,597) (1,336,102) (1,365,013) (1,390,170) (1,417,769)Appropriations (48,603) (58,722) (59,994) (61,100) (62,312)Other (32,580) (40,114) (35,774) (41,089) (44,910)
Total cash to the official public account
(1,428,780) (1,434,938) (1,460,781) (1,492,359) (1,524,991)
Cash and cash equivalents at end of reporting period
660 660 660 660 660
Prepared on Australian Accounting Standards basis.
Additional Estimates Statements — Department of Human Services
42
Table 3.11: Schedule of administered capital budget (for the period ended 30 June) The Department does not have an administered capital budget.
Table 3.12: Statement of administered asset movements (2016-17 Budget year) The Department does not administer any non-financial assets on behalf of Government.
43
PORTFOLIO GLOSSARY
Term Meaning
Activities The actions/functions performed by agencies to deliver government policies.
Available appropriation
The available appropriation indicates the total appropriations available to the entity. It includes all appropriations made available to the entity in the year (+/- s74 transfers, formal reductions, Advance to the Finance Minister and movements of funds).
Administered item Appropriation that consists of funding managed on behalf of the Commonwealth. This funding is not at the discretion of the entity and any unspent appropriation is returned to the Consolidated Revenue Fund at the end of the financial year. An administered item is a component of an administered program.
Appropriation An amount of public money Parliament authorises for spending (i.e. funds to be withdrawn from the Consolidated Revenue Fund). Parliament makes laws for appropriating money under the Supply Acts, Annual Appropriation Acts and under Special Appropriations, with spending restricted to the purposes specified in the Appropriation Acts.
Consolidated revenue fund (CRF)
The principal operating fund from which money is drawn to pay for the activities of the government. Section 81 of the Australian Constitution provides that all revenue raised or monies received by the Executive Government forms one consolidated revenue fund from which appropriations are made for the purposes of the Australian Government.
Corporate Commonwealth entity
A corporate Commonwealth entity is a Commonwealth entity that is a body corporate.
Departmental capital budget (DCB)
Funds proposed in Supply or Appropriation Bill 1/3/5 for the ongoing replacement of minor assets.
Glossary
44
Term Meaning
Departmental item Resources (assets, liabilities, revenues and expenses) that entity Chief Executive Officers control directly. This includes outsourced activities funded and controlled by the entity. Examples of departmental items include entity running costs, accrued employee entitlements and net appropriations. A departmental item is a component of a departmental program.
Expenses not requiring appropriation in the Budget year
Expenses not involving a cash flow impact are generally not included within the calculation of an appropriation. Appropriation funding is not provided in respect of depreciation or amortisation expense. Also no funding is required for goods or services received free of charge that are then expensed. Similarly, bad debts are recognised as an expense but are not recognised for the purpose of calculating administered appropriation amounts to be sought from Parliament.
Forward estimates period
The three years following the budget year. For example, if 2016–17 is the budget year, 2017–18 is forward year 1, 2018-19 is forward year 2 and 2019–20 is forward year 3. This period does not include the current or budget year.
General Government Sector (GGS)
A government Finance Statistics’ classification of all entities that are controlled and largely funded by the Commonwealth Government. The GGS provides public services that are mainly non-market in nature and for the collective consumption of the community, or involve the transfer or redistribution of income. These services are largely financed through taxes and other compulsory levies, user charging and external funding. This sector comprises all government departments, offices and some other bodies.
Measure A new policy or savings decision of the government with financial impacts on the government's underlying cash balance; fiscal balance; operating balance; headline cash balance; net debt or net worth. Such proposals are normally made in the context of the annual Budget, and are typically published in Budget Paper No. 2, in the Mid-Year Economic and Fiscal Outlook (MYEFO) and in the Pre-election Economic and Fiscal Outlook (PEFO).
Glossary
45
Term Meaning
Mid-Year Economic and Fiscal Outlook (MYEFO)
Around six months after the Budget, the Government produces the Mid-Year Economic and Fiscal Outlook (MYEFO) report. The report compares estimated expenditure to actual expenditure. MYEFO estimates include any government decisions made since the previous Budget that affected expenses and revenues. MYEFO also updates the budgetary position, including budget aggregates, by incorporating any changes to economic parameters.
Non-corporate Commonwealth entity
Non-corporate Commonwealth entity is a Commonwealth entity that is not a body corporate.
Official Public Account (OPA)
The OPA is the government’s central bank account held within the Reserve Bank of Australia. The OPA is the central component of the Consolidated Revenue Fund.
Outcome An outcome is the intended result, consequence or impact of government actions on the Australian community.
Outcome statement An outcome statement articulates the intended results, activities and target group of an Australian Government entity. An outcome statement serves three main purposes within the financial framework: 1. to explain and control the purposes for which annual appropriations are approved by the Parliament for use by agencies; 2. to provide a basis for annual budgeting, including (financial) reporting against the use of appropriated funds; and 3. to measure and assess entity and program (non-financial) performance in contributing to government policy objectives.
Portfolio Budget Statements (PB Statements)
Budget related paper detailing budget initiatives and explanations of appropriations specified by outcome and program by each entity within a portfolio.
Portfolio Additional Estimates Statements (PAES)
Budget related paper detailing the changes in resourcing by outcome(s) since the Budget which provides information on new measures and their impact on the financial and/or non-financial planned performance of programs supporting those outcomes.
Glossary
46
Term Meaning
Program Activity that delivers benefits, services or transfer payments to individuals, industry and/or the community as a whole, with the aim of achieving the intended result specified in an outcome statement.
Program support The entity running costs allocated to a program. This is funded as part of the entity’s departmental appropriations.
Public Governance, Performance and Accountability Act 2013 (PGPA Act)
The PGPA Act commenced on 1 July 2014. It provides a principles based framework for Commonwealth resource management, supported by rules and guidance to assist Commonwealth entities to manage public resources.
s 74 retained revenue receipts
Under section 74 of the PGPA Act, non-corporate Commonwealth entities can retain receipts for the amounts prescribed in the PGPA rules. These receipts include:
retained (revenue) receipts and retained (repayment) receipts.
Retained (revenue) receipts may increase a non-corporate Commonwealth entity’s most recent annual departmental item appropriation. Such receipts include:
receipts from the provision of departmental goods and services
amounts that are managed in trust or similar arrangements
receipts from the sale of minor departmental assets, such as old computers, are disposed of at the end of their useful life.
Retained (repayment) receipts enable an appropriation that was used to make a Commonwealth payment to be re-credited with an amount received as a repayment of that earlier payment. For example when a supplier is overpaid and the non-corporate Commonwealth entity receives a repayment.
Glossary
47
Term Meaning
s 75 determination A determination made by the Minister for Finance (Finance Minister) under section 75 of the PGPA Act which details amendments to the Supply or annual Appropriation Acts as a result of a transfer of functions from one entity to another.
Supply Act The Supply Act appropriations are broadly equivalent to 5/12ths of the estimated appropriations, excluding Budget measures. In some cases, the appropriations also provide for a few entities that may have disproportionately high estimated expenditure early in the financial year. The balance of the appropriations including Budget measures for that year will be in the Appropriation Acts (No.1) and (No. 2).