portfolio additional estimates statements 2016-17 › ... › budgets › 2016-17-paes.pdf2016-17...
TRANSCRIPT

Portfolio Additional Estimates Statements 2016-17
Immigration and Border Protection Portfolio
Explanations of Additional Estimates 2016-17

ii
© Commonwealth of Australia 2017
ISBN 978-1-920996-58-1
This publication is available for your use under a Creative Commons BY Attribution
3.0 Australia licence, with the exception of the Commonwealth Coat of Arms, the
Department of Immigration and Border Protection logo, photographs, images,
signatures and where otherwise stated. The full licence terms are available from http://creativecommons.org/licenses/by/3.0/au/legalcode.
Use of Immigration and Border Protection Portfolio material under a Creative
Commons BY Attribution 3.0 Australia licence requires you to attribute the work (but
not in any way that suggests that the Department endorses you or your use of the
work).
Immigration and Border Protection Portfolio material used 'as supplied'
Provided you have not modified or transformed Immigration and Border Protection
Portfolio material in any way including, for example, by changing the Immigration
and Border Protection Portfolio text; calculating percentage changes; graphing or
charting data; or deriving new statistics from published Immigration and Border
Protection Portfolio statistics – then the portfolio prefers the following attribution:
Source: The Australian Government Immigration and Border Protection Portfolio
Derivative material
If you have modified or transformed Immigration and Border Protection Portfolio
material, or derived new material from those of the Immigration and Border Protection
Portfolio in any way, then Immigration and Border Protection Portfolio prefers the
following attribution:
Based on The Australian Government Immigration and Border Protection Portfolio data
Use of the Coat of Arms
The terms under which the Coat of Arms can be used are set out on the It’s an Honour
website (see www.itsanhonour.gov.au)
Other Uses
Inquiries regarding this licence and any other use of this document are welcome at: Department of Immigration and Border Protection Steven Groves, Chief Finance Officer, (02) 6264 1235

iii
THE HON PETER DUTTON MP
MINISTER FOR IMMIGRATION
AND BORDER PROTECTION
President of the Senate
Australian Senate
Parliament House
CANBERRA ACT 2600
Speaker
House of Representatives
Parliament House
CANBERRA ACT 2600
Dear Mr President
Dear Mr Speaker
I hereby submit Portfolio Additional Estimates Statements in support of the
2016-17 Additional Estimates for the Immigration and Border Protection Portfolio.
These statements have been developed, and are submitted to the Parliament, as a
statement on the funding requirements being sought for the Portfolio.
I present these statements by virtue of my ministerial responsibility for accountability
to the Parliament and, through it, the public.
Yours sincerely
The Hon Peter Dutton MP
Minister for Immigration and Border Protection

iv
ABBREVIATIONS AND CONVENTIONS
The following notations may be used:
NEC/nec not elsewhere classified
- nil
.. not zero, but rounded to zero
na not applicable (unless otherwise specified)
nfp not for publication
$m $ million
Figures in tables and in the text may be rounded. Figures in text are generally rounded
to one decimal place, whereas figures in tables are generally rounded to the nearest
thousand. Discrepancies in tables between totals and sums of components are due to
rounding.
Enquiries
Should you have any enquiries regarding this publication please contact Steven
Groves, Chief Finance Officer in the Department of Immigration and Border Protection
on (02) 6264 1235.
Links to Portfolio Budget Statements (including Portfolio Additional Estimates
Statements and Portfolio Supplementary Additional Estimates Statements) can be
located on the Australian Government Budget website at www.budget.gov.au.

USER GUIDE TO THE
PORTFOLIO ADDITIONAL ESTIMATE STATEMENTS


vii
USER GUIDE
The purpose of the 2016-17 Portfolio Additional Estimates Statements (PAES), like that
of the Portfolio Budget Statements (PB Statements), is to inform Senators and Members
of Parliament of the proposed allocation of resources to Government outcomes by
entities within the portfolio. The focus of the PAES differs from the PB Statements in
one important aspect. While the PAES include an Entity Resource Statement to inform
Parliament of the revised estimate of the total resources available to an entity, the focus
of the PAES is on explaining the changes in resourcing by outcome(s) since the Budget.
As such, the PAES provides information on new measures and their impact on the
financial and/or non-financial planned performance of programs supporting those
outcomes.
The PAES facilitate understanding of the proposed appropriations in Appropriation
Bills (Nos. 3 and 4) and Appropriation (Parliamentary Departments) Bill (No. 2)
2016-17. In this sense the PAES is declared by the Additional Estimates Appropriation
Bills to be a ‘relevant document’ to the interpretation of the Bills according to section
15AB of the Acts Interpretation Act 1901.
Whereas the Mid-Year Economic and Fiscal Outlook (MYEFO) 2016-17 is a mid-year
budget report which provides updated information to allow the assessment of the
Government’s fiscal performance against its fiscal strategy, the PAES update the most
recent budget appropriations for entities within the portfolio.
User Guide
viii
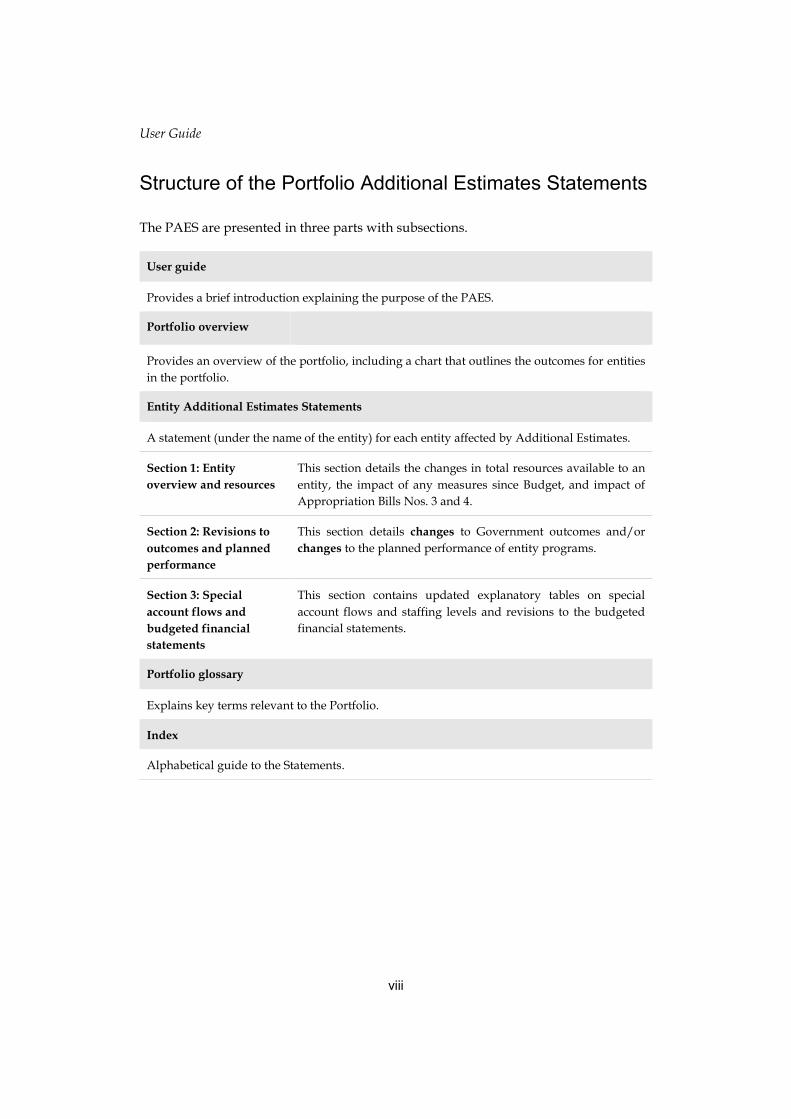
Structure of the Portfolio Additional Estimates Statements
The PAES are presented in three parts with subsections.
User guide
Provides a brief introduction explaining the purpose of the PAES.
Portfolio overview
Provides an overview of the portfolio, including a chart that outlines the outcomes for entities
in the portfolio.
Entity Additional Estimates Statements
A statement (under the name of the entity) for each entity affected by Additional Estimates.
Section 1: Entity
overview and resources
This section details the changes in total resources available to an
entity, the impact of any measures since Budget, and impact of
Appropriation Bills Nos. 3 and 4.
Section 2: Revisions to
outcomes and planned
performance
This section details changes to Government outcomes and/or
changes to the planned performance of entity programs.
Section 3: Special
account flows and
budgeted financial
statements
This section contains updated explanatory tables on special
account flows and staffing levels and revisions to the budgeted
financial statements.
Portfolio glossary
Explains key terms relevant to the Portfolio.
Index
Alphabetical guide to the Statements.

ix
CONTENTS
Portfolio overview ......................................................................................................... 3
Department of Immigration and Border Protection ................................................... 4
Portfolio glossary ........................................................................................................ 47
Index ............................................................................................................................ 49


PORTFOLIO OVERVIEW


3
PORTFOLIO OVERVIEW
Ministers and portfolio responsibilities
The portfolio has two Ministers, the Hon Peter Dutton MP, the Minister for
Immigration and Border Protection and the Hon Alex Hawke MP, Assistant Minister
for Immigration and Border Protection.
The Department of Immigration and Border Protection (DIBP) is a non-corporate
Commonwealth entity under the Public Governance, Performance and Accountability Act
2013 (PGPA Act).

Portfolio Overview
4
Figure 1: Immigration and Border Protection portfolio structure and outcomes
Minister for Immigration and Border Protection
The Hon Peter Dutton MP
Assistant Minister for Immigration and Border Protection
The Hon Alex Hawke MP
Department of Immigration Australian Border Force
and Border Protection
Secretary: Mr Michael Pezzullo Commissioner: Mr Roman Quaedvlieg APM
Outcome 1 Protect Australia’s sovereignty, security and safety by managing its border,
including through managing the stay and departure of all non-citizens.
Outcome 2 Support a prosperous and inclusive society, and advance Australia’s economic
interests through the effective management of the visa and citizenship programs
and provision of refugee and humanitarian assistance.
Outcome 3 Advance Australia’s economic interests through the facilitation of the trade of goods
to and from Australia and the collection of border revenue.

ENTITY ADDITIONAL ESTIMATES
STATEMENTS
Department of Immigration and Border Protection ................................................... 7


7
DEPARTMENT OF IMMIGRATION AND BORDER
PROTECTION
Section 1: Entity overview and resources .................................................................. 9
1.1 Strategic direction statement.................................................................................... 9
1.2 Entity resource statement ........................................................................................ 9
1.3 Entity measures ..................................................................................................... 12
1.4 Additional estimates and variations ....................................................................... 14
1.5 Breakdown of additional estimates by appropriation bill ....................................... 17
Section 2: Revisions to outcomes and planned performance ............................... 19
2.1 Changes to outcome and program structures ........................................................ 19
2.2 Budgeted expenses and performance for Outcome 1 ........................................... 20
2.3 Budgeted expenses and performance for Outcome 2 ........................................... 23
2.4 Budgeted expenses and performance for Outcome 3 ........................................... 25
Section 3: Special account flows and budgeted financial statements .................. 27
3.1 Special account flows ............................................................................................. 27
3.2 Budgeted financial statements ............................................................................... 28


9
DEPARTMENT OF IMMIGRATION AND BORDER
PROTECTION
Section 1: Entity overview and resources
1.1 STRATEGIC DIRECTION STATEMENT
The strategic direction statement for DIBP can be found in the 2016-17 Portfolio Budget
Statements. There are no changes to DIBP’s strategic direction as a result of Additional
Estimates.
1.2 ENTITY RESOURCE STATEMENT
The Entity Resource Statement details the resourcing for DIBP at Additional Estimates.
Table 1.1 outlines the total resourcing available from all sources for the 2016-17 Budget
year, including variations through Appropriation Bills No. 3 and No. 4 and Special
Appropriations.

DIBP Additional Estimates Statements
10
Table 1.1: DIBP resource statement — Additional Estimates for 2016-17 as at Additional Estimates February 2017
Actual available
appropriation
2015-16
$'000
Estimate as at
Budget
2016-17
$'000
Proposed
Additional
Estimates
2016-17
$'000
Total estimate
at Additional
Estimates
2016-17
$'000
Departmental
Annual appropriations - ordinary
annual services1
Prior year appropriations available2 424,177 345,372 - 345,372
Departmental appropriation 2,479,306 2,356,251 56,217 2,412,468
s 74 retained revenue receipts3 211,195 150,614 30,951 181,565
Departmental capital budget 4 116,639 120,519 - 120,519
Annual appropriations - other services -
non-operating5
Prior year appropriations available2 74,247 91,626 - 91,626
Equity injection6 212,218 197,179 - 197,179
Total departmental annual appropriations 3,517,782 3,261,561 87,168 3,348,729
Total departmental resourcing 3,517,782 3,261,561 87,168 3,348,729
Administered
Annual appropriations - ordinary
annual services1
Prior year appropriations available2 785,528 789,409 - 789,409
Outcome 1 2,109,390 2,055,771 143,512 2,199,283
Outcome 2 77,196 51,550 - 51,550
Outcome 3 - - - -
Administered capital budget7 26,098 18,856 - 18,856
Annual appropriations - other services -
new administered expenses5
Prior year appropriations available2 285,376 140,569 - 140,569
Administered assets and liabilities 140,350 124,074 300 124,374
Total administered annual appropriations 3,423,938 3,180,229 143,812 3,324,041
Total administered special appropriations8 517,776 420,000 - 420,000
DIBP Additional Estimates Statements
11
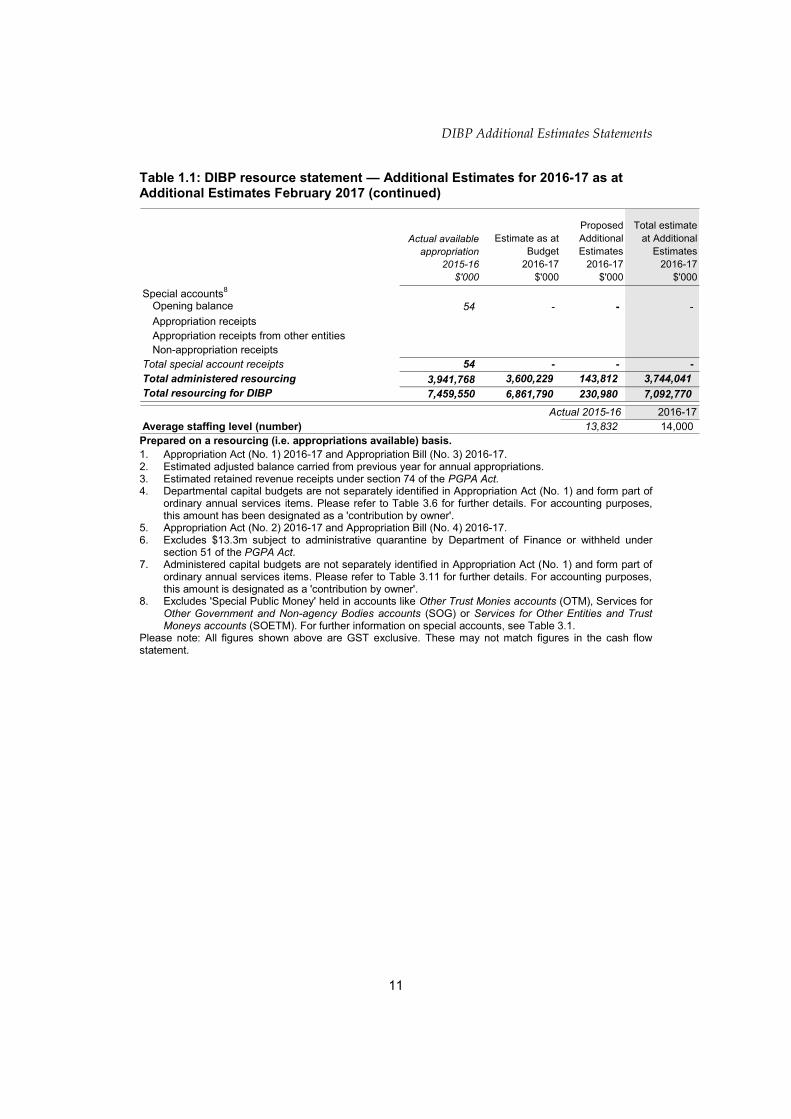
Table 1.1: DIBP resource statement — Additional Estimates for 2016-17 as at Additional Estimates February 2017 (continued)
Actual available
appropriation
2015-16
$'000
Estimate as at
Budget
2016-17
$'000
Proposed
Additional
Estimates
2016-17
$'000
Total estimate
at Additional
Estimates
2016-17
$'000
Special accounts8
Opening balance 54 - - -
Appropriation receipts
Appropriation receipts from other entities
Non-appropriation receipts
Total special account receipts 54 - - -
Total administered resourcing 3,941,768 3,600,229 143,812 3,744,041
Total resourcing for DIBP 7,459,550 6,861,790 230,980 7,092,770
Actual 2015-16 2016-17
Average staffing level (number) 13,832 14,000
Prepared on a resourcing (i.e. appropriations available) basis. 1. Appropriation Act (No. 1) 2016-17 and Appropriation Bill (No. 3) 2016-17. 2. Estimated adjusted balance carried from previous year for annual appropriations. 3. Estimated retained revenue receipts under section 74 of the PGPA Act. 4. Departmental capital budgets are not separately identified in Appropriation Act (No. 1) and form part of
ordinary annual services items. Please refer to Table 3.6 for further details. For accounting purposes, this amount has been designated as a 'contribution by owner'.
5. Appropriation Act (No. 2) 2016-17 and Appropriation Bill (No. 4) 2016-17. 6. Excludes $13.3m subject to administrative quarantine by Department of Finance or withheld under
section 51 of the PGPA Act. 7. Administered capital budgets are not separately identified in Appropriation Act (No. 1) and form part of
ordinary annual services items. Please refer to Table 3.11 for further details. For accounting purposes, this amount is designated as a 'contribution by owner'.
8. Excludes 'Special Public Money' held in accounts like Other Trust Monies accounts (OTM), Services for Other Government and Non-agency Bodies accounts (SOG) or Services for Other Entities and Trust Moneys accounts (SOETM). For further information on special accounts, see Table 3.1.
Please note: All figures shown above are GST exclusive. These may not match figures in the cash flow statement.
DIBP Additional Estimates Statements
12
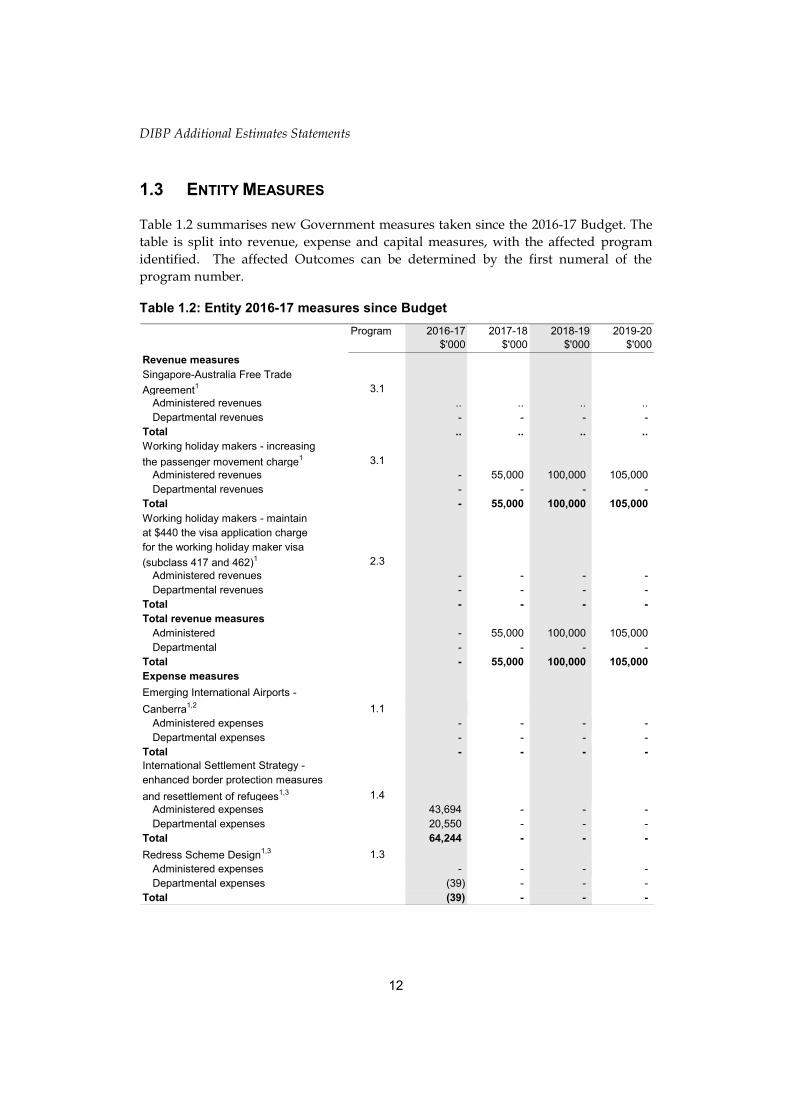
1.3 ENTITY MEASURES
Table 1.2 summarises new Government measures taken since the 2016-17 Budget. The
table is split into revenue, expense and capital measures, with the affected program
identified. The affected Outcomes can be determined by the first numeral of the
program number.
Table 1.2: Entity 2016-17 measures since Budget
Program 2016-17
$'000
2017-18
$'000
2018-19
$'000
2019-20
$'000
Revenue measures
Singapore-Australia Free Trade
Agreement1 3.1
Administered revenues .. .. .. ..
Departmental revenues - - - -
Total .. .. .. ..
Working holiday makers - increasing
the passenger movement charge1 3.1
Administered revenues - 55,000 100,000 105,000
Departmental revenues - - - -
Total - 55,000 100,000 105,000
Working holiday makers - maintain
at $440 the visa application charge
for the working holiday maker visa
(subclass 417 and 462)1 2.3
Administered revenues - - - -
Departmental revenues - - - -
Total - - - -
Total revenue measures
Administered - 55,000 100,000 105,000
Departmental - - - -
Total - 55,000 100,000 105,000
Expense measures
Emerging International Airports -
Canberra1,2 1.1
Administered expenses - - - -
Departmental expenses - - - -
Total - - - -
International Settlement Strategy -
enhanced border protection measures
and resettlement of refugees1,3 1.4
Administered expenses 43,694 - - -
Departmental expenses 20,550 - - -
Total 64,244 - - -
Redress Scheme Design1,3 1.3
Administered expenses - - - -
Departmental expenses (39) - - -
Total (39) - - -

DIBP Additional Estimates Statements
13
Table 1.2: Entity 2016-17 measures since Budget (continued)
Program 2016-17
$'000
2017-18
$'000
2018-19
$'000
2019-20
$'000
Visa Risk Assessment Capability4 2.3
Administered expenses - - - -
Departmental expenses - - - -
Total - - - -
Total expense measures
Administered 43,694 - - -
Departmental 20,511 - - -
Total 64,205 - - -
Capital measures
Emerging International Airports -
Canberra1,2 1.1
Administered capital - - - -
Departmental capital - - - -
Total - - - -
International Settlement Strategy -
enhanced border protection measures
and resettlement of refugees1,3 1.4
Administered capital 300 - - -
Departmental capital - - - -
Total 300 - - -
Visa Risk Assessment Capability4 2.3
Administered capital - - - -
Departmental capital - - - -
Total - - - -
Total capital measures
Administered 300 - - -
Departmental - - - -
Total 300 - - -
Decisions taken but not yet announced - - - -
Prepared on a Government Financial Statistics (fiscal) basis 1. The full measure description and package details appear in the 2016-17 MYEFO under the Immigration
and Border Protection portfolio. 2. The Government will provide $4.4m (including $3.4m in capital funding) in 2016-17 to establish
permanent border clearance services at the Canberra International Airport to support regular international air services. The cost of this measure will be met from within the existing resources of DIBP.
3. The change in appropriation estimates will be under Outcome 1. 4. This measure includes departmental operational funding of $36.8m and departmental capital funding of
$62.4m, totalling $99.2m over four years. This measure was included as a 'decision taken but not yet announced' in the 2016-17 Budget and is under Outcome 2.
DIBP Additional Estimates Statements
14
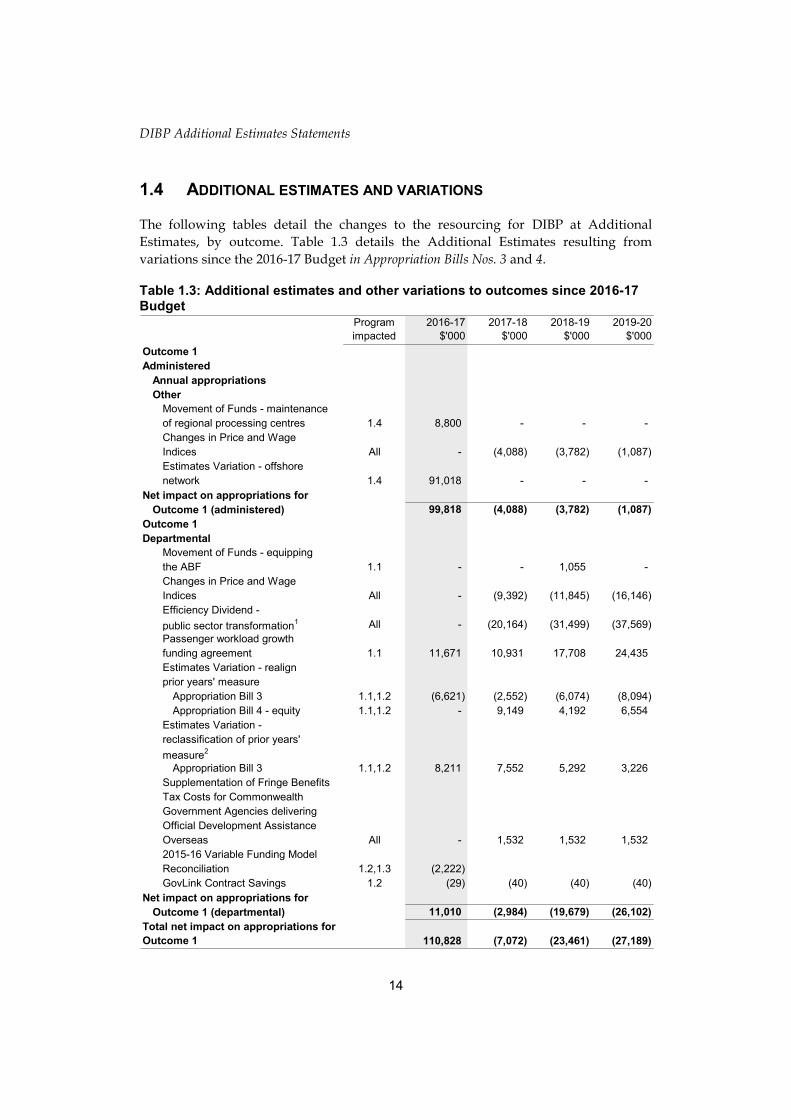
1.4 ADDITIONAL ESTIMATES AND VARIATIONS
The following tables detail the changes to the resourcing for DIBP at Additional
Estimates, by outcome. Table 1.3 details the Additional Estimates resulting from
variations since the 2016-17 Budget in Appropriation Bills Nos. 3 and 4.
Table 1.3: Additional estimates and other variations to outcomes since 2016-17 Budget
Program
impacted
2016-17
$'000
2017-18
$'000
2018-19
$'000
2019-20
$'000
Outcome 1
Administered
Annual appropriations
Other
Movement of Funds - maintenance
of regional processing centres 1.4 8,800 - - -
Changes in Price and Wage
Indices All - (4,088) (3,782) (1,087)
Estimates Variation - offshore
network 1.4 91,018 - - -
Net impact on appropriations for
Outcome 1 (administered) 99,818 (4,088) (3,782) (1,087)
Outcome 1
Departmental
Movement of Funds - equipping
the ABF 1.1 - - 1,055 -
Changes in Price and Wage
Indices All - (9,392) (11,845) (16,146)
Efficiency Dividend -
public sector transformation1 All - (20,164) (31,499) (37,569)
Passenger workload growth
funding agreement 1.1 11,671 10,931 17,708 24,435
Estimates Variation - realign
prior years' measure
Appropriation Bill 3 1.1,1.2 (6,621) (2,552) (6,074) (8,094)
Appropriation Bill 4 - equity 1.1,1.2 - 9,149 4,192 6,554
Estimates Variation -
reclassification of prior years'
measure2
Appropriation Bill 3 1.1,1.2 8,211 7,552 5,292 3,226
Supplementation of Fringe Benefits
Tax Costs for Commonwealth
Government Agencies delivering
Official Development Assistance
Overseas All - 1,532 1,532 1,532
2015-16 Variable Funding Model
Reconciliation 1.2,1.3 (2,222)
GovLink Contract Savings 1.2 (29) (40) (40) (40)
Net impact on appropriations for
Outcome 1 (departmental) 11,010 (2,984) (19,679) (26,102)
Total net impact on appropriations for
Outcome 1 110,828 (7,072) (23,461) (27,189)

DIBP Additional Estimates Statements
15
Table 1.3: Additional estimates and other variations to outcomes since 2016-17 Budget (continued)
Program
impacted
2016-17
$'000
2017-18
$'000
2018-19
$'000
2019-20
$'000
Outcome 2
Administered
Annual appropriations
Other
Changes in Price and Wage
Indices 2.4 - (146) (100) (7)
Net impact on appropriations for
Outcome 2 (administered) - (146) (100) (7)
Outcome 2
Departmental
Changes in Price and Wage
Indices All - (4,142) (5,203) (6,955)
Efficiency Dividend -
public sector transformation1 All - (10,824) (17,087) (20,008)
Estimates Variation -
reclassification of prior years'
measure3
Appropriation Bill 3 2.3 5,108 6,793 1,411 951
2015-16 Variable Funding Model
Reconciliation All 15,685
Supplementation of Fringe Benefits
Tax Costs for Commonwealth
Government Agencies delivering
Official Development Assistance
Overseas All - 636 636 636
LAFHA Supplementation for
2015-16 FBT year 2.2 3,903
Net impact on appropriations for
Outcome 2 (departmental) 24,696 (7,537) (20,243) (25,376)
Total net impact on appropriations for
Outcome 2 24,696 (7,683) (20,343) (25,383)

DIBP Additional Estimates Statements
16
Table 1.3: Additional estimates and other variations to outcomes since 2016-17 Budget (continued)
Program
impacted
2016-17
$'000
2017-18
$'000
2018-19
$'000
2019-20
$'000
Outcome 3
Departmental
Annual appropriations
Other
Changes in Price and Wage
Indices All - (404) (537) (692)
Efficiency Dividend -
Public Sector Transformation1 All - (1,057) (1,764) (1,993)
Supplementation of Fringe Benefits
Tax Costs for Commonwealth
Government Agencies delivering
Official Development Assistance
Overseas All - 69 69 69
Net impact on appropriations for
Outcome 3 (departmental) - (1,392) (2,232) (2,616)
Total net impact on appropriations for
Outcome 3 - (1,392) (2,232) (2,616)
Total net impact on
appropriations for All
Outcomes (Administered) 99,818 (4,234) (3,882) (1,094)
Total net impact on
appropriations for All
Outcomes (Departmental) 35,706 (11,913) (42,154) (54,094)
1. As announced in the 2016-17 Budget, the Public Sector Transformation and the Efficiency Dividend is a cross-portfolio measure. 2. The estimates variation includes a corresponding decrease in Appropriation Bill 4 – Equity funding of
$8.2m in 2016-17, $7.6m in 2017-18, $5.3m in 2018-19 and $3.2m in 2019-20 for the Smaller Government – strengthen and enhance Australia’s border protection services measure announced at 2015-16 Budget.
3. The estimates variation includes a corresponding decrease in Appropriation Bill 4 - Equity funding of $5.1m in 2016-17, $6.8m in 2017-18, $1.4m in 2018-19 and $1.0m in 2019-20 for the Visa Risk Assessment Capability measure announced at 2015-16 Budget.

DIBP Additional Estimates Statements
17
1.5 BREAKDOWN OF ADDITIONAL ESTIMATES BY APPROPRIATION
BILL
The following tables detail the Additional Estimates sought for DIBP through
Appropriation Bills Nos. 3 and 4.
Table 1.4: Appropriation Bill (No. 3) 2016-17
2015-16
Available
$'000
2016-17
Budget
$'000
2016-17
Revised
$'000
Additional
Estimates
$'000
Reduced
Estimates
$'000
Administered items
Outcome 1
Support a prosperous and
inclusive Australia through
managing temporary and 2,135,488 2,074,627 2,218,139 143,512 -
permanent migration, entry
through Australia’s borders, and
Australian citizenship
Outcome 2
Support Australia’s international
and humanitarian obligations by
providing protection,
resettlement and assistance to 77,196 51,550 51,550 - -
refugees and those in
humanitarian need, including
through arrangements with
other countries
Total administered 2,212,684 2,126,177 2,269,689 143,512 -
Departmental Programs
Outcome 1
Support a prosperous and
inclusive Australia through
managing temporary and 1,766,447 1,674,066 1,705,587 31,521 -
permanent migration, entry
through Australia’s borders, and
Australian citizenship
Outcome 2
Support Australia’s international
and humanitarian obligations by
providing protection,
resettlement and assistance to 770,938 739,031 763,727 24,696 -
refugees and those in
humanitarian need, including
through arrangements with
other countries
Total departmental 2,537,385 2,413,097 2,469,314 56,217 -
Total administered and
departmental 4,750,069 4,539,274 4,739,003 199,729 -

DIBP Additional Estimates Statements
18
Table 1.5: Appropriation Bill (No. 4) 2016-17
2015-16
Available
$'000
2016-17
Budget
$'000
2016-17
Revised
$'000
Additional
Estimates
$'000
Reduced
Estimates
$'000
Non-operating
Equity injections - - - - -
Administered assets and liabilities 140,350 124,074 124,374 300 -
Total non-operating 140,350 124,074 124,374 300 -
Total other services 140,350 124,074 124,374 300 -

DIBP Additional Estimates Statements
19
Section 2: Revisions to outcomes and planned performance
2.1 CHANGES TO OUTCOME AND PROGRAM STRUCTURES
There have been no changes to the outcome and program structures of DIBP during
2016-17 as a result of Additional Estimates. Complete details of the outcome and
program structures can be found in the 2016-17 PB Statements.
OUTCOME 1
Outcome 1 strategy
There are no changes to any Outcome 1 strategies published in the 2016-17
PB Statements.

DIBP Additional Estimates Statements
20
2.2 BUDGETED EXPENSES AND PERFORMANCE FOR OUTCOME 1
Budgeted expenses for Outcome 1
This table shows how much the entity intends to spend (on an accrual basis) on achieving
the outcome, broken down by program, as well as by Administered and Departmental
funding sources.
Table 2.2.1 Budgeted expenses for Outcome 1
2015-16 2016-17 2017-18 2018-19 2019-20
Actual Revised Forward Forward Forward
budget estimate estimate estimate
$'000 $'000 $'000 $'000 $'000
Program 1.1: Border Enforcement
Departmental expenses
Departmental appropriation1 958,797 918,090 911,984 890,038 891,507
s74 Retained revenue receipts2 16,283 14,155 12,253 12,275 12,297
Expenses not requiring appropriation in the
Budget year3 120,729 130,149 130,562 124,325 115,883
Departmental total 1,095,809 1,062,394 1,054,799 1,026,638 1,019,687
Total expenses for Program 1.1 1,095,809 1,062,394 1,054,799 1,026,638 1,019,687
Program 1.2: Border Management
Administered expenses
Ordinary annual services
(Appropriation Act No. 1 and Bill No. 3) - 8 8 8 8
Administered total - 8 8 8 8
Departmental expenses
Departmental appropriation1 237,451 206,910 200,014 191,715 194,339
s74 Retained revenue receipts2 2,752 3,078 2,355 2,360 2,364
Expenses not requiring appropriation in the
Budget year3 28,466 26,897 25,695 24,338 24,201
Departmental total 268,669 236,885 228,064 218,413 220,904
Total expenses for Program 1.2 268,669 236,893 228,072 218,421 220,912
Program 1.3: Onshore Compliance
and Detention (revised structure)4
Administered expenses
Ordinary annual services
(Appropriation Act No. 1 and Bill No. 3) - 1,138,280 686,507 576,531 552,372
Expenses not requiring appropriation in the
Budget year3 - 63,785 60,222 55,968 55,111
Administered total - 1,202,065 746,729 632,499 607,483
Departmental expenses
Departmental appropriation1 - 445,600 392,000 341,755 325,870
s74 Retained revenue receipts2 - 11,757 10,629 10,972 11,339
Expenses not requiring appropriation in the
Budget year3 - 27,014 24,375 26,384 23,996
Departmental total - 484,371 427,004 379,111 361,205
Total expenses for Program 1.3
(revised structure) - 1,686,436 1,173,733 1,011,610 968,688

DIBP Additional Estimates Statements
21
Table 2.2.1 Budgeted expenses for Outcome 1 (continued)
2015-16 2016-17 2017-18 2018-19 2019-20
Actual Revised Forward Forward Forward
budget estimate estimate estimate
$'000 $'000 $'000 $'000 $'000
Program 1.3: Compliance and
Detention (2015-16 structure)5
Administered expenses
Ordinary annual services
(Appropriation Act No. 1 and Bill No. 3) 251,977 - - - -
Expenses not requiring appropriation in the
Budget year3 19,818 - - - -
Administered total 271,795 - - - -
Departmental expenses
Departmental appropriation1 217,720 - - - -
s74 Retained revenue receipts2 2,773 - - - -
Expenses not requiring appropriation in the
Budget year3 21,000 - - - -
Departmental total 241,493 - - - -
Total expenses for Program 1.3
(2015-16 structure) 513,288 - - - -
Program 1.4: IMA Onshore
Management (2015-16 structure)5
Administered expenses
Ordinary annual services
(Appropriation Act No. 1 and Bill No. 3) 792,698 - - - -
Expenses not requiring appropriation in the
Budget year3 48,718 - - - -
Administered total 841,416 - - - -
Departmental expenses
Departmental appropriation1 224,288 - - - -
s74 Retained revenue receipts2 10,681 - - - -
Expenses not requiring appropriation in the
Budget year3 18,125 - - - -
Departmental total 253,094 - - - -
Total expenses for Program 1.4
(2015-16 structure) 1,094,510 - - - -
Program 1.4: IMA Offshore
Management
Administered expenses
Ordinary annual services
(Appropriation Act No. 1 and Bill No. 3) 950,776 973,234 313,387 336,654 327,467
Expenses not requiring appropriation in the
Budget year3 72,153 71,230 70,986 69,286 68,067
Administered total 1,022,929 1,044,464 384,373 405,940 395,534
Departmental expenses
Departmental appropriation1 98,046 52,461 27,884 27,717 27,755
s74 Retained revenue receipts2 2,418 17,447 18,389 19,585 20,864
Expenses not requiring appropriation in the
Budget year3 5,180 4,109 3,531 3,078 2,714
Departmental total 105,644 74,017 49,804 50,380 51,333
Total expenses for Program 1.4 1,128,573 1,118,481 434,177 456,320 446,867

DIBP Additional Estimates Statements
22
Table 2.2.1 Budgeted expenses for Outcome 1 (continued) 2015-16 2016-17 2017-18 2018-19 2019-20
Actual Revised Forward Forward Forward
budget estimate estimate estimate
$'000 $'000 $'000 $'000 $'000
Program 1.5: Regional Cooperation
Administered expenses
Ordinary annual services
(Appropriation Act No. 1 and Bill No. 3) 78,627 87,761 27,090 27,769 28,547
Expenses not requiring appropriation in the
Budget year 3 347 - - - -
Administered total 78,974 87,761 27,090 27,769 28,547
Departmental expenses
Departmental appropriation1 20,836 16,956 15,990 11,464 11,478
s74 Retained revenue receipts2 2,825 1,697 5,321 5,321 3,921
Expenses not requiring appropriation in the
Budget year3 1,130 988 746 565 429
Departmental total 24,791 19,641 22,057 17,350 15,828
Total expenses for Program 1.5 103,765 107,402 49,147 45,119 44,375
Outcome 1 Totals by appropriation type
Administered expenses
Ordinary annual services (Appropriation
Act No. 1 and Bill No. 3) 2,074,078 2,199,283 1,026,992 940,962 908,394
Expenses not requiring appropriation in the
Budget year3 141,036 135,015 131,208 125,254 123,178
Administered total 2,215,114 2,334,298 1,158,200 1,066,216 1,031,572
Departmental expenses
Departmental appropriation1 1,757,138 1,640,017 1,547,872 1,462,689 1,450,949
s74 Retained revenue receipts2 37,732 48,134 48,947 50,513 50,785
Expenses not requiring appropriation in the
Budget year3 194,630 189,157 184,909 178,690 167,223
Departmental total 1,989,500 1,877,308 1,781,728 1,691,892 1,668,957
Total expenses for Outcome 1 4,204,614 4,211,606 2,939,928 2,758,108 2,700,529
Movement of administered funds
between years 2015-16 2016-17 2017-18 2018-19 2019-20
Outcome 1:
Administered
Program 1.4: IMA Offshore
Management5,6 (8,800) 8,800 - - -
Total movement of administered
funds (8,800) 8,800 - - -
2015-16 2016-17
Average Staffing Level (number) 8,429 8,350
1. Departmental Appropriation combines Ordinary annual services Appropriation Act No. 1 and Bill No. 3. 2. Estimated expenses incurred in relation to receipts retained under section 74 of the PGPA Act. 3. Expenses not requiring appropriation in the Budget year are made up of Depreciation, Amortisation,
Write-down and impairment of assets and foreign exchange losses of $3.1m in 2015-16 recorded under Other expenses.
4. This includes funding for Status Resolution Support Services which was formerly recorded under Program 2.4 Refugee and Humanitarian Assistance.
5. 2015-16 figures are shown according to the structure in place during the 2015-16 year. The figures are for comparison purposes only. Under the 2016-17 structure funds have moved to Program 1.3: Onshore Compliance and Detention.
6. Figures displayed as a negative (-) represent a decrease in expenses and a positive (+) represent an increase in expenses. The movement of funds was undertaken under the 2015-16 program structure.

DIBP Additional Estimates Statements
23
OUTCOME 2
Outcome 2 strategy
There are no changes to any Outcome 2 strategies published in the 2016-17
PB Statements.
2.3 BUDGETED EXPENSES AND PERFORMANCE FOR OUTCOME 2
Budgeted expenses for Outcome 2
This table shows how much the entity intends to spend (on an accrual basis) on
achieving the outcome, broken down by program, as well as by Administered and
Departmental funding sources.
Table 2.3.1: Program components of Outcome 2 2015-16 2016-17 2017-18 2018-19 2019-20
Actual Revised Forward Forward Forward
budget estimate estimate estimate
$'000 $'000 $'000 $'000 $'000
Program 2.1: Citizenship
Departmental expenses
Departmental appropriation 1 75,334 55,862 53,320 53,952 54,027
s74 Retained revenue receipts 2 1,531 2,039 1,767 1,767 1,768
Expenses not requiring appropriation in the
Budget year 3 7,922 7,264 7,806 7,906 8,105
Departmental total 84,787 65,165 62,893 63,625 63,900
Total expenses for
Program 2.1 84,787 65,165 62,893 63,625 63,900
Program 2.2: Migration
Departmental expenses
Departmental appropriation 1 207,580 238,528 227,537 205,776 196,768
s74 Retained revenue receipts 2 56,070 35,024 35,877 37,624 39,493
Expenses not requiring appropriation in the
Budget year 3 29,300 21,619 21,601 21,545 21,449
Departmental total 292,950 295,171 285,015 264,945 257,710
Total expenses for Program 2.2 292,950 295,171 285,015 264,945 257,710
Program 2.3: Visas
Administered expenses
Ordinary annual services (Appropriation Act
No. 1 and Bill No. 3) 25 - - - -
Expenses not requiring appropriation in the
Budget year 3 12,688 - - - -
Administered total 12,713 - - - -
Departmental expenses
Departmental appropriation 1 324,338 295,253 273,840 246,695 235,928
s74 Retained revenue receipts 2 35,559 33,642 32,781 33,967 35,241
Expenses not requiring appropriation in the
Budget year 3 42,269 43,310 43,069 40,866 38,462
Departmental total 402,166 372,205 349,690 321,528 309,631
Total expenses for Program 2.3 402,166 372,205 349,690 321,528 309,631

DIBP Additional Estimates Statements
24
Table 2.3.1: Program components of Outcome 2 (continued) 2015-16 2016-17 2017-18 2018-19 2019-20
Actual Revised Forward Forward Forward
budget estimate estimate estimate
$'000 $'000 $'000 $'000 $'000
Program 2.4: Refugee and
Humanitarian Assistance
Administered expenses
Ordinary annual services (Appropriation Act
No. 1 and Bill No. 3) 64,357 51,550 32,921 32,764 33,507
Expenses not requiring appropriation in the
Budget year 3 1,161 - - - -
Administered total 65,518 51,550 32,921 32,764 33,507
Departmental expenses
Departmental appropriation 1 86,300 97,908 92,972 94,547 94,672
s74 Retained revenue receipts 2 7,509 8,540 8,169 8,218 8,270
Expenses not requiring appropriation in the
Budget year 3 6,056 4,249 4,043 3,852 3,722
Departmental total 99,865 110,697 105,184 106,617 106,664
Total expenses for
Program 2.4 99,865 110,697 105,184 106,617 106,664
Outcome 2 Totals by appropriation type
Administered expenses
Ordinary annual services (Appropriation Act
No. 1 and Bill No. 3) 64,382 51,550 32,921 32,764 33,507
Expenses not requiring appropriation in the
Budget year 3 13,849 - - - -
Administered total 78,231 51,550 32,921 32,764 33,507
Departmental expenses
Departmental appropriation 1 693,552 687,551 647,669 600,970 581,395
s74 Retained revenue receipts 2 100,669 79,245 78,594 81,576 84,772
Expenses not requiring appropriation in the
Budget year 3 85,547 76,442 76,519 74,169 71,738
Departmental total 879,768 843,238 802,782 756,715 737,905
Total expenses for Outcome 2 957,999 894,788 835,703 789,479 771,412
2015-16 2016-17
Average Staffing Level (number) 4,857 5,090
1. Departmental Appropriation combines Ordinary annual services Appropriation Act No. 1 and Bill No. 3. 2. Estimated expenses incurred in relation to receipts retained under section 74 of the PGPA Act. 3. Expenses not requiring appropriation in the Budget year are made up of Depreciation, Amortisation,
Write-down and impairment of assets and foreign exchange losses of $3.1m in 2015-16 recorded under Other expenses.

DIBP Additional Estimates Statements
25
OUTCOME 3
Outcome 3 strategy
There are no changes to any Outcome 3 strategies published in the 2016-17
PB Statements.
2.4 BUDGETED EXPENSES AND PERFORMANCE FOR OUTCOME 3
Budgeted expenses for Outcome 3
This table shows how much the entity intends to spend (on an accrual basis) on
achieving the outcome, broken down by program, as well as by Administered and
Departmental funding sources.

DIBP Additional Estimates Statements
26
Table 2.4.1: Program components of Outcome 3
2015-16 2016-17 2017-18 2018-19 2019-20
Actual Revised Forward Forward Forward
budget estimate estimate estimate
$'000 $'000 $'000 $'000 $'000
Program 3.1 Border- Revenue
Collection
Administered expenses
Ordinary annual services
(Appropriation Act No. 1 and Bill No. 3) 123 - - - -
Expenses not requiring appropriation in the
Budget year 3 13,565 13,500 13,500 13,500 13,500
Administered total 13,688 13,500 13,500 13,500 13,500
Departmental expenses
Departmental appropriation 1 19,247 11,028 11,314 11,197 8,502
s74 Retained revenue receipts 2 53,277 55,139 52,647 52,275 52,264
Expenses not requiring appropriation in the
Budget year 3 10,912 5,449 4,179 3,830 3,294
Departmental total 83,436 71,616 68,140 67,302 64,060
Total expenses for
Program 3.1 97,124 85,116 81,640 80,802 77,560
Program 3.2 Trade Faciliation
and Industry Engagement
Departmental expenses
Departmental appropriation 1 31,003 52,109 56,857 56,730 54,839
s74 Retained revenue receipts 2 301 494 354 354 354
Expenses not requiring appropriation in the
Budget year 3 2,139 2,391 2,523 2,559 2,254
Departmental total 33,443 54,994 59,734 59,643 57,447
Total expenses for
Program 3.2 33,443 54,994 59,734 59,643 57,447
Outcome 3 Totals by appropriation type
Administered expenses
Ordinary annual services
(Appropriation Act No. 1 and Bill No. 3) 123 - - - -
Expenses not requiring appropriation in the
Budget year 3 13,565 13,500 13,500 13,500 13,500
Administered total 13,688 13,500 13,500 13,500 13,500
Departmental expenses
Departmental appropriation 1 50,250 63,137 68,171 67,927 63,341
s74 Retained revenue receipts 2 53,578 55,633 53,001 52,629 52,618
Expenses not requiring appropriation in the
Budget year 3 13,051 7,840 6,702 6,389 5,548
Departmental total 116,879 126,610 127,874 126,945 121,507
Total expenses for Outcome 3 130,567 140,110 141,374 140,445 135,007
2015-16 2016-17
Average Staffing Level (number) 547 560
1. Departmental Appropriation combines Ordinary annual services Appropriation Act No. 1 and Bill No. 3. 2. Estimated expenses incurred in relation to receipts retained under section 74 of the PGPA Act. 3. Expenses not requiring appropriation in the Budget year are made up of Depreciation, Amortisation,
Write-down and impairment of assets and foreign exchange losses of $3.1m in 2015-16 recorded under Other expenses.

DIBP Additional Estimates Statements
27
Section 3: Special account flows and budgeted financial Statements
3.1 SPECIAL ACCOUNT FLOWS
Estimates of special account flows
Special Accounts provide a means to set aside and record amounts used for specified
purposes. Table 3.1 shows the expected additions (receipts) and reductions (payments)
for each account used by DIBP.
Table 3.1: Estimates of special account flows and balances
Outcome Opening
balance
$'000
Receipts
$'000
Payments
$'000
Adjustments
$'000
Closing
balance
$'000
Australian Population
Multicultural and Immigration
Research Program Account(A)
2016-17 - - - - -
Australian Population
Multicultural and Immigration
Research Program Account(A)
2015-16 54 - - (54) -
Total special accounts
2016-17 Budget estimate - - - - -
Total special accounts
2015-16 actual 54 - - (54) - (A) = Administered

DIBP Additional Estimates Statements
28
3.2 BUDGETED FINANCIAL STATEMENTS
3.2.1 Analysis of budgeted financial statements
An analysis of the primary source of movements between the financial statements published in the 2016-17 PB Statements and the 2016-17 PAES is provided below.
Departmental
Budgeted departmental comprehensive income statement
This statement presents the expected financial result for DIBP and identifies expenses
and revenues on a full accrual basis.
Expenses
In 2016-17, total departmental expenses are expected to increase from $2,743.7 million
(as published in the 2016-17 PB Statements) to $2,847.2 million, an increase of
$103.5 million. This movement reflects an increase of $20.5 million due to impacts of
new measures, $42.0 million from other variations and $41.0m from depreciation and
amortisation expenses.
Full details of the additional funding for 2016-17 for new measures and other
variations are provided in the tables presented in Section 1 of this document.

DIBP Additional Estimates Statements
29
Figure 2: Total departmental expenses as at 2016-17 PAES.
Income
In 2016-17, total departmental income is expected to increase from $2,511.3 million (as
published in the 2016-17 PB Statements) to $2,573.7 million. The movement of
$62.4 million is due to an increase in Revenue from Government (appropriation
revenue) of $34.4 million and $28.0 million increase in DIBP’s own source revenue and
gains.
Budgeted departmental balance sheet
This statement reports the financial position of the department, its assets, liabilities and
equity.
In 2016-17, total departmental assets are expected to decrease from $2,061.2 million (as
published in the 2016-17 PB Statements) to $1,913.1 million. The movement of
$148.1 million is predominantly due to a decrease of $93.8 million in the 2015-16
Final Budget Outcome (FBO); an increase of $41.0 million in accumulated depreciation
and amortisation and $13.3 million of appropriation reclassification from other services
non-operating into ordinary annual services.
DIBP Additional Estimates Statements
30
Departmental liabilities are expected to decrease from $747.6 million (as published in
the 2016-17 PB Statements) to $737.5 million. The movement of $10.1 million is due to a
decrease in the opening balance in the 2015-16 FBO.
Equity is also expected to decrease from $1,313.7 million (as published in the 2016-17
PB Statements) to $1,175.7 million, a decrease of $138.0 million in line with the
aforementioned decrease in the net asset figure.
Budgeted departmental statement of cash flows
The cash flow statement reports the extent and nature of cash flows, grouped
according to operating, investing and financing activities.
The budgeted cash flows largely mirror the trends and impacts of the measures
reported above for the income statement and balance sheet.
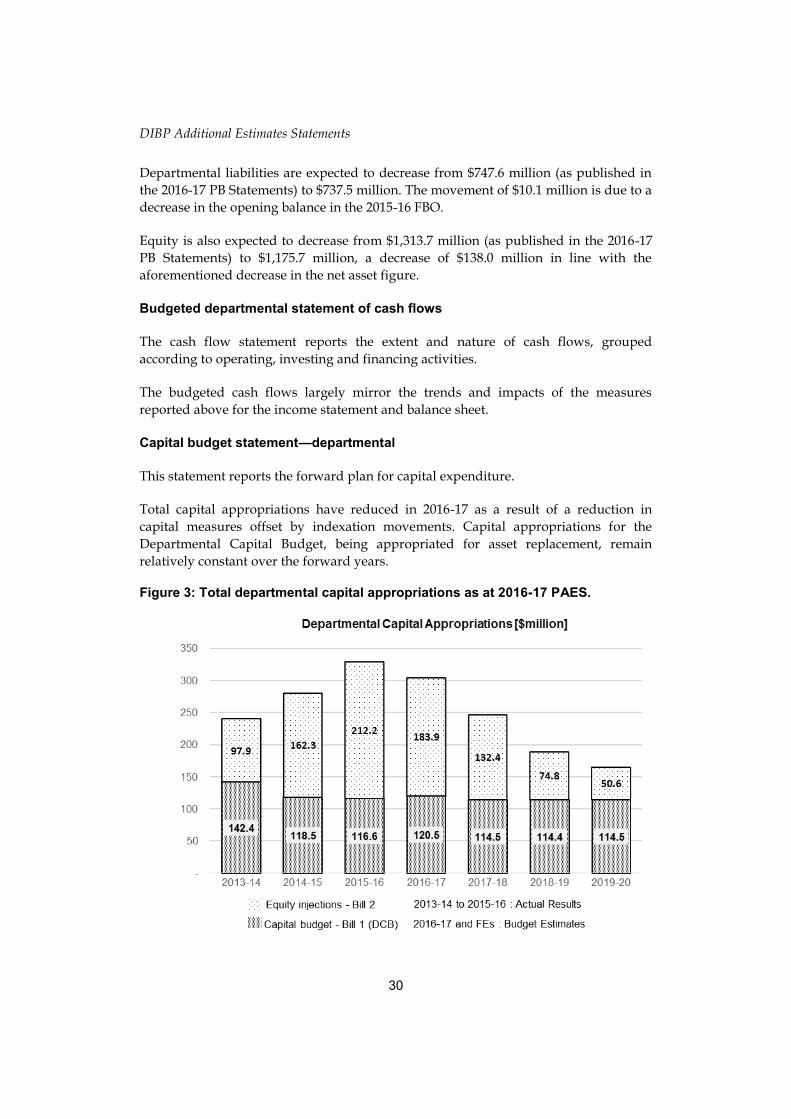
Capital budget statement—departmental
This statement reports the forward plan for capital expenditure.
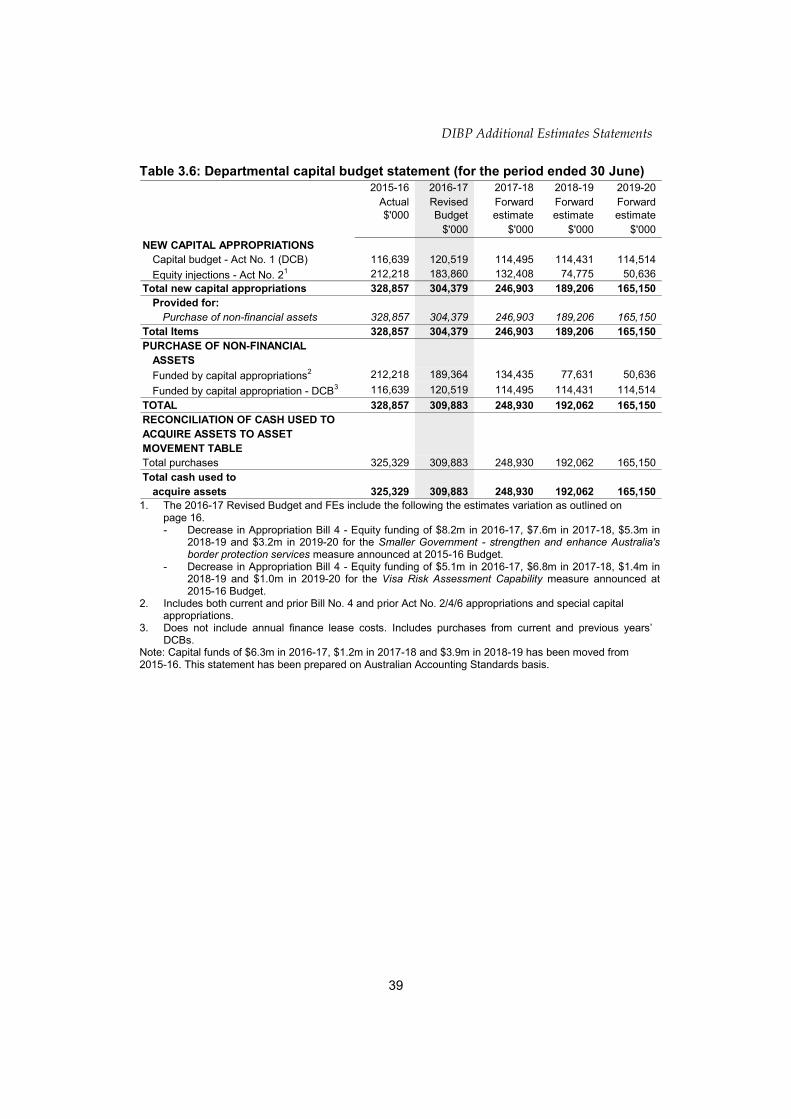
Total capital appropriations have reduced in 2016-17 as a result of a reduction in
capital measures offset by indexation movements. Capital appropriations for the
Departmental Capital Budget, being appropriated for asset replacement, remain
relatively constant over the forward years.
Figure 3: Total departmental capital appropriations as at 2016-17 PAES.

DIBP Additional Estimates Statements
31
Statement of asset movements
This statement reports the budgeted movements by asset class of the department’s
non-financial assets during the current financial year.
The increase in the estimated net book balance from 1 July 2016 to 30 June 2017 is due
to the net impacts of increases in asset purchases of $309.9 million being offset by
depreciation and amortisation expense of $273.4 million. Investment in new assets is
the result of capital measures and Departmental Capital Budget.
Administered
Schedule of budgeted income and expenses administered on behalf of
government
This schedule identifies the main revenue and expense items administered by the
department on behalf of government.
Expenses
In 2016-17, administered expenses are expected to increase from $2,207.2 million (as
published in the 2016-17 PB Statements) to $2,399.3 million, an increase of
$192.1 million. The change in administered expenses reflects an increase in
government decisions of $43.7 million and $148.4 million from other expenses.
Full details of the additional funding for 2016-17 for new measures and other
variations are provided in the tables presented in Section 1 of this document.
Figure 4: Administered expenses as at 2016-17 PAES.

DIBP Additional Estimates Statements
32
Income
In 2016-17, the department will administer the collection of revenue on behalf of the
government of $17,781.0 million, which is an increase of $294.3 million in the
administered revenue estimate of $17,486.7 million published in the 2016-17
PB Statements.
In 2016-17, the department is estimated to collect $17,710.0 million in taxation revenue,
which is an increase of $289.0 million from $17,421.0 million published in the 2016-17
PB Statements. The increase is primarily due to the expected increase of $250.0 million
in Customs duty collections across all duty categories, $32.7 million increase in the
Visa Application Charges component of Other taxes and $6.3 million increase in the
other taxes component of other taxes.
In addition to taxation revenue, the department will administer the collection of non-taxation revenue in 2016-17 on behalf of the government. An estimated $70.9 million is expected to be collected, which is an increase of $5.2 million from the $65.7 million published in the 2016-17 PB Statements. Figure 5: Revenues administered on behalf of the Government as at 2016-17 PAES.

DIBP Additional Estimates Statements
33
Schedule of budgeted assets and liabilities administered on behalf of
government
This schedule reports assets and liabilities administered by the department on behalf
of the government.
In 2016-17, total administered assets are expected to decrease by $132.2 million from
$2,142.0 million (as published in the 2016-17 PB Statements) to $2,009.8 million. The
movement is predominantly due to a decrease of $122.1 million in the 2015-16 FBO, an
increase of $48.6 million in accumulated depreciation and amortisation and
offset by an increase of $38.5 million in the assets estimate variation.
Schedule of budgeted administered cash flows
This schedule shows the cash flows administered on behalf of the government. The
cash flows largely reflect the transactions of the schedule of income and expenses. The
budgeted cash flows reflects the impact of the expected increase in taxation income.
Schedule for administered capital budget
This statement reports the forward plan for capital expenditure.
Purchase of non-financial assets funded by capital appropriations have increased in
2016-17, as a result of increases in movement of funds from previous years.
Statement of administered asset movements
This statement reports the budgeted movements by asset class of administered
non-financial assets during the current financial year.
The increase in the estimated net book balance from 1 July 2016 to 30 June 2017 is due
to the impact of increases in expected asset purchases of $186.1 million being offset by
depreciation and amortisation expense of $122.9 million.
DIBP Additional Estimates Statements
34
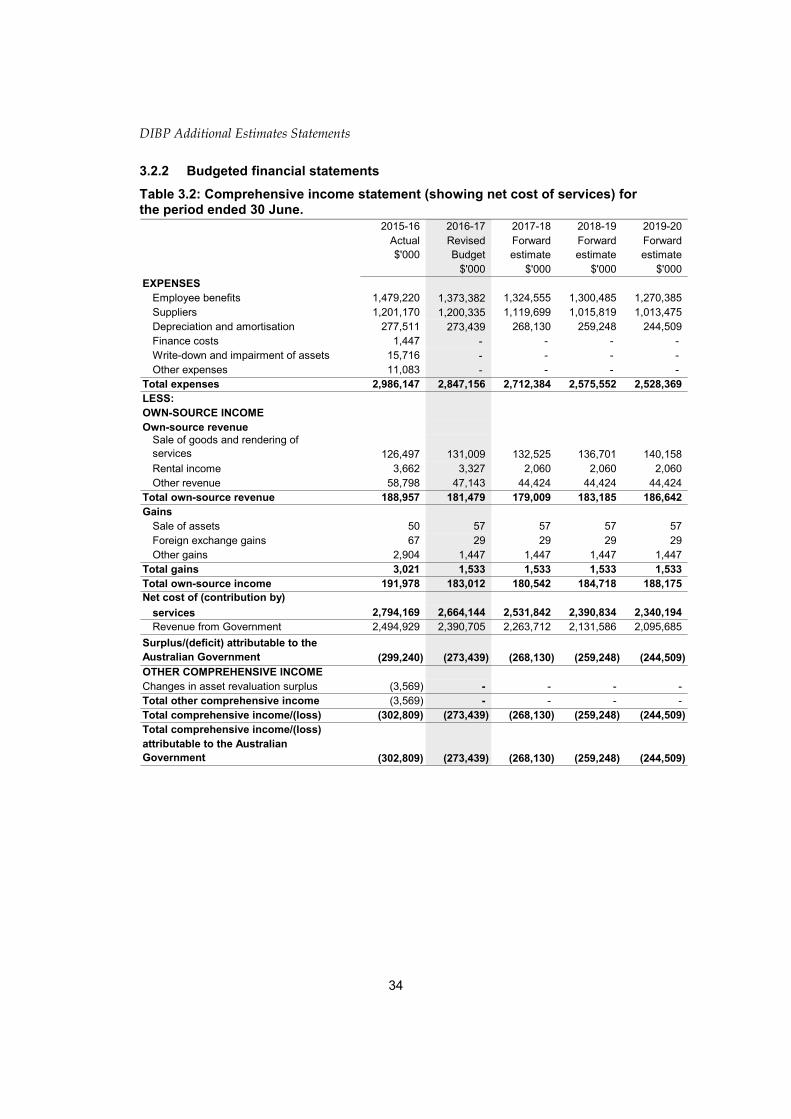
3.2.2 Budgeted financial statements
Table 3.2: Comprehensive income statement (showing net cost of services) for the period ended 30 June.
2015-16 2016-17 2017-18 2018-19 2019-20
Actual Revised Forward Forward Forward
$'000 Budget estimate estimate estimate
$'000 $'000 $'000 $'000
EXPENSES
Employee benefits 1,479,220 1,373,382 1,324,555 1,300,485 1,270,385
Suppliers 1,201,170 1,200,335 1,119,699 1,015,819 1,013,475
Depreciation and amortisation 277,511 273,439 268,130 259,248 244,509
Finance costs 1,447 - - - -
Write-down and impairment of assets 15,716 - - - -
Other expenses 11,083 - - - -
Total expenses 2,986,147 2,847,156 2,712,384 2,575,552 2,528,369
LESS:
OWN-SOURCE INCOME
Own-source revenue
Sale of goods and rendering of
services 126,497 131,009 132,525 136,701 140,158
Rental income 3,662 3,327 2,060 2,060 2,060
Other revenue 58,798 47,143 44,424 44,424 44,424
Total own-source revenue 188,957 181,479 179,009 183,185 186,642
Gains
Sale of assets 50 57 57 57 57
Foreign exchange gains 67 29 29 29 29
Other gains 2,904 1,447 1,447 1,447 1,447
Total gains 3,021 1,533 1,533 1,533 1,533
Total own-source income 191,978 183,012 180,542 184,718 188,175
Net cost of (contribution by)
services 2,794,169 2,664,144 2,531,842 2,390,834 2,340,194
Revenue from Government 2,494,929 2,390,705 2,263,712 2,131,586 2,095,685
Surplus/(deficit) attributable to the
Australian Government (299,240) (273,439) (268,130) (259,248) (244,509)
OTHER COMPREHENSIVE INCOME
Changes in asset revaluation surplus (3,569) - - - -
Total other comprehensive income (3,569) - - - -
Total comprehensive income/(loss) (302,809) (273,439) (268,130) (259,248) (244,509)
Total comprehensive income/(loss)
attributable to the Australian
Government (302,809) (273,439) (268,130) (259,248) (244,509)
DIBP Additional Estimates Statements
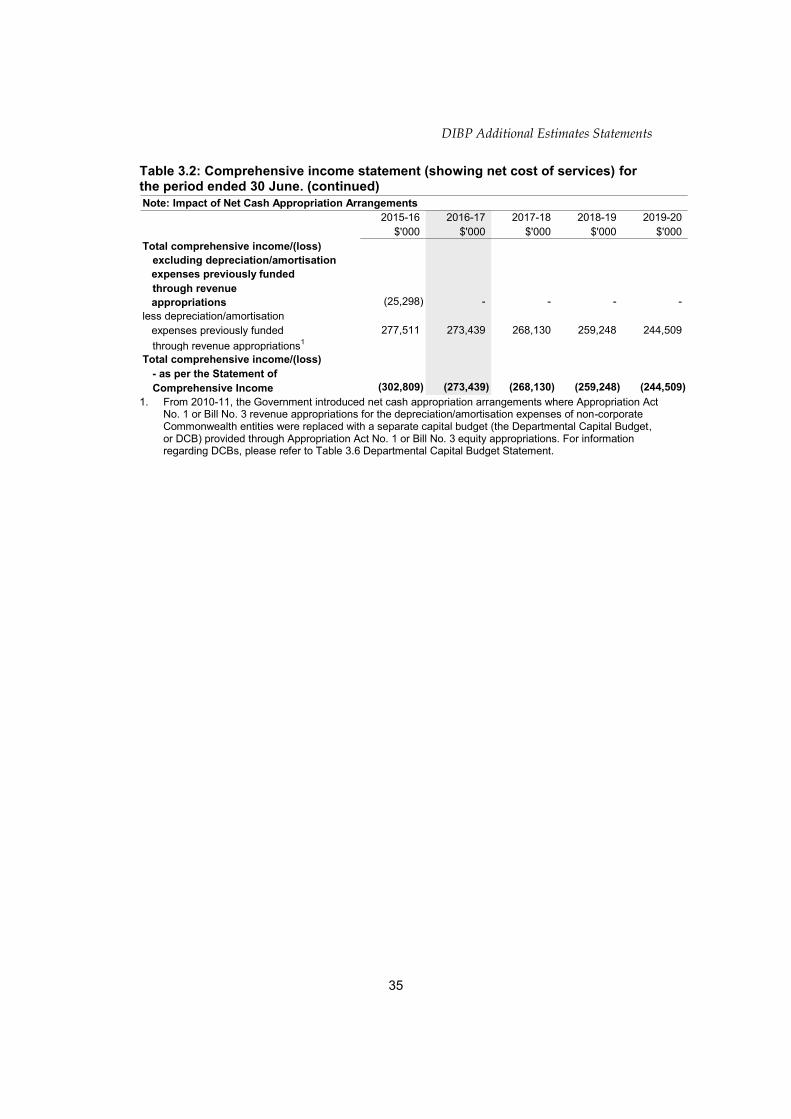
35
Table 3.2: Comprehensive income statement (showing net cost of services) for the period ended 30 June. (continued)
Note: Impact of Net Cash Appropriation Arrangements
2015-16 2016-17 2017-18 2018-19 2019-20
$'000 $'000 $'000 $'000 $'000
Total comprehensive income/(loss)
excluding depreciation/amortisation
expenses previously funded
through revenue
appropriations (25,298) - - - -
less depreciation/amortisation
expenses previously funded 277,511 273,439 268,130 259,248 244,509
through revenue appropriations1
Total comprehensive income/(loss)
- as per the Statement of
Comprehensive Income (302,809) (273,439) (268,130) (259,248) (244,509)
1. From 2010-11, the Government introduced net cash appropriation arrangements where Appropriation Act No. 1 or Bill No. 3 revenue appropriations for the depreciation/amortisation expenses of non-corporate Commonwealth entities were replaced with a separate capital budget (the Departmental Capital Budget, or DCB) provided through Appropriation Act No. 1 or Bill No. 3 equity appropriations. For information regarding DCBs, please refer to Table 3.6 Departmental Capital Budget Statement.

DIBP Additional Estimates Statements
36
Table 3.3: Budgeted departmental balance sheet (as at 30 June)
2015-16 2016-17 2017-18 2018-19 2019-20
Actual Revised Forward Forward Forward
$'000 Budget estimate estimate estimate
$'000 $'000 $'000 $'000
ASSETS
Financial assets
Cash and cash equivalents 3,409 3,409 3,409 3,409 3,409
Trade and other receivables 518,425 512,921 510,894 508,038 508,038
Other financial assets 3,691 3,691 3,691 3,691 3,691
Total financial assets 525,525 520,021 517,994 515,138 515,138
Non-financial assets
Land 24,291 24,291 30,294 32,809 36,742
Buildings 154,804 153,883 133,856 131,481 123,828
Property, plant and equipment 626,394 643,106 655,504 618,018 556,488
Intangibles 477,157 497,811 480,237 468,040 453,931
Other non-financial assets 74,018 74,018 74,018 74,018 74,018
Total non-financial assets 1,356,664 1,393,109 1,373,909 1,324,366 1,245,007
Total assets 1,882,189 1,913,130 1,891,903 1,839,504 1,760,145
LIABILITIES
Payables
Suppliers 58,480 58,481 58,481 58,481 58,481
Other payables 203,718 216,094 209,373 209,373 209,373
Total payables 262,198 274,575 267,854 267,854 267,854
Provisions
Employee provisions 430,347 417,970 424,690 424,690 424,690
Other provisions 44,911 44,911 44,911 44,911 44,911
Total provisions 475,258 462,881 469,601 469,601 469,601
Total liabilities 737,456 737,456 737,455 737,455 737,455
Net assets 1,144,733 1,175,674 1,154,448 1,102,049 1,022,690
EQUITY*
Parent entity interest
Contributed equity 2,106,465 2,410,844 2,657,747 2,864,596 3,029,746
Reserves 241,702 241,702 241,702 241,702 241,702
Retained surplus/(accumulated
deficit) (1,203,434) (1,476,872) (1,745,001) (2,004,249) (2,248,758)
Total parent entity interest 1,144,733 1,175,674 1,154,448 1,102,049 1,022,690
Total Equity 1,144,733 1,175,674 1,154,448 1,102,049 1,022,690
* Equity is the residual interest in assets after the deduction of liabilities. Prepared on Australian Accounting Standards basis.

DIBP Additional Estimates Statements
37
Table 3.4: Departmental statement of changes in equity — summary of movement (Budget Year 2016-17)
Retained Asset Contributed Total
earnings revaluation equity/ equity
reserve capital
$'000 $'000 $'000 $'000
Opening balance as at 1 July 2016
Balance carried forward from
previous period (1,203,434) 241,702 2,106,465 1,144,733
Adjusted opening balance (1,203,434) 241,702 2,106,465 1,144,733
Comprehensive income
Surplus (deficit) for the period (273,439) - - (273,439)
Other 1 - - 1
Total comprehensive income (273,438) - - (273,438)
of which:
Attributable to the Australian Government (273,438) - - (273,438)
Transactions with owners
Contributions by owners
Equity Injection - Appropriation - - 183,860 183,860
Departmental Capital Budget (DCB) - - 120,519 120,519
Sub-total transactions with owners - - 304,379 304,379
Estimated closing balance as at 30 June
2017 (1,476,872) 241,702 2,410,844 1,175,674
Closing balance attributable to the
Australian Government (1,476,872) 241,702 2,410,844 1,175,674 Prepared on Australian Accounting Standards basis.
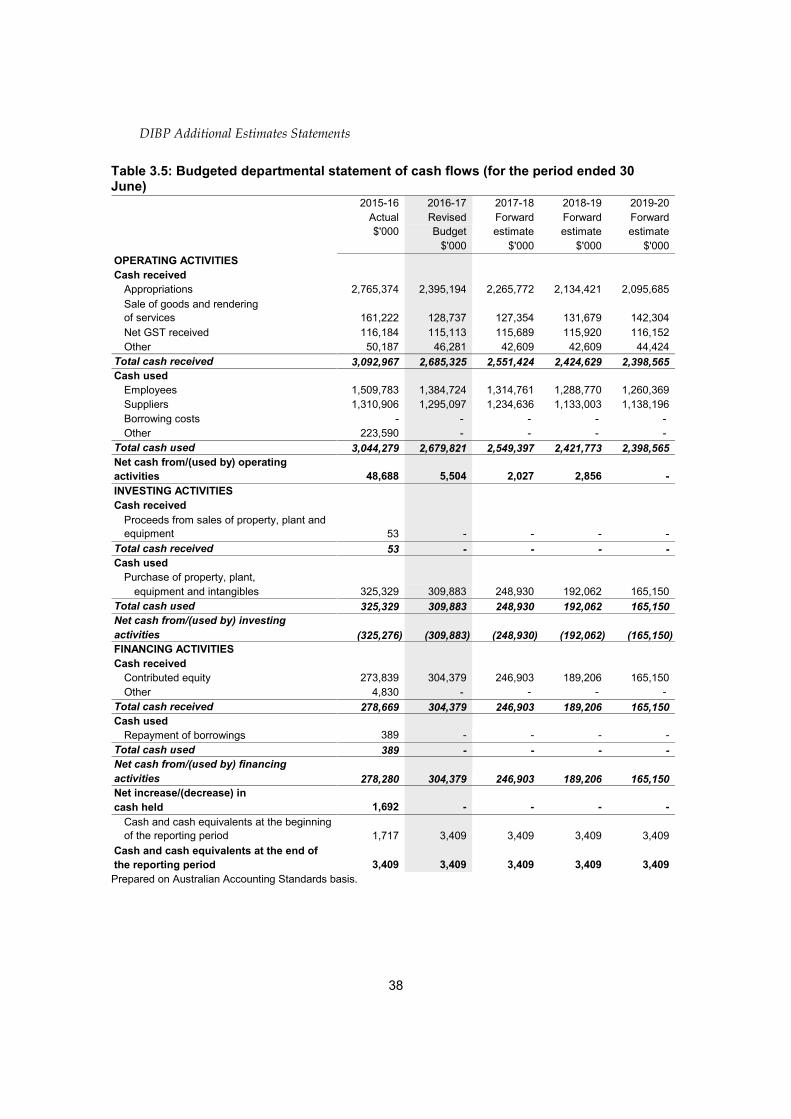
DIBP Additional Estimates Statements
38
Table 3.5: Budgeted departmental statement of cash flows (for the period ended 30 June)
2015-16 2016-17 2017-18 2018-19 2019-20
Actual Revised Forward Forward Forward
$'000 Budget estimate estimate estimate
$'000 $'000 $'000 $'000
OPERATING ACTIVITIES
Cash received
Appropriations 2,765,374 2,395,194 2,265,772 2,134,421 2,095,685
Sale of goods and rendering
of services 161,222 128,737 127,354 131,679 142,304
Net GST received 116,184 115,113 115,689 115,920 116,152
Other 50,187 46,281 42,609 42,609 44,424
Total cash received 3,092,967 2,685,325 2,551,424 2,424,629 2,398,565
Cash used
Employees 1,509,783 1,384,724 1,314,761 1,288,770 1,260,369
Suppliers 1,310,906 1,295,097 1,234,636 1,133,003 1,138,196
Borrowing costs - - - - -
Other 223,590 - - - -
Total cash used 3,044,279 2,679,821 2,549,397 2,421,773 2,398,565
Net cash from/(used by) operating
activities 48,688 5,504 2,027 2,856 -
INVESTING ACTIVITIES
Cash received
Proceeds from sales of property, plant and
equipment 53 - - - -
Total cash received 53 - - - -
Cash used
Purchase of property, plant,
equipment and intangibles 325,329 309,883 248,930 192,062 165,150
Total cash used 325,329 309,883 248,930 192,062 165,150
Net cash from/(used by) investing
activities (325,276) (309,883) (248,930) (192,062) (165,150)
FINANCING ACTIVITIES
Cash received
Contributed equity 273,839 304,379 246,903 189,206 165,150
Other 4,830 - - - -
Total cash received 278,669 304,379 246,903 189,206 165,150
Cash used
Repayment of borrowings 389 - - - -
Total cash used 389 - - - -
Net cash from/(used by) financing
activities 278,280 304,379 246,903 189,206 165,150
Net increase/(decrease) in
cash held 1,692 - - - -
Cash and cash equivalents at the beginning
of the reporting period 1,717 3,409 3,409 3,409 3,409
Cash and cash equivalents at the end of
the reporting period 3,409 3,409 3,409 3,409 3,409
Prepared on Australian Accounting Standards basis.
DIBP Additional Estimates Statements
39
Table 3.6: Departmental capital budget statement (for the period ended 30 June)
2015-16 2016-17 2017-18 2018-19 2019-20
Actual Revised Forward Forward Forward
$'000 Budget estimate estimate estimate
$'000 $'000 $'000 $'000
NEW CAPITAL APPROPRIATIONS
Capital budget - Act No. 1 (DCB) 116,639 120,519 114,495 114,431 114,514
Equity injections - Act No. 21 212,218 183,860 132,408 74,775 50,636
Total new capital appropriations 328,857 304,379 246,903 189,206 165,150
Provided for:
Purchase of non-financial assets 328,857 304,379 246,903 189,206 165,150
Total Items 328,857 304,379 246,903 189,206 165,150
PURCHASE OF NON-FINANCIAL
ASSETS
Funded by capital appropriations2 212,218 189,364 134,435 77,631 50,636
Funded by capital appropriation - DCB3 116,639 120,519 114,495 114,431 114,514
TOTAL 328,857 309,883 248,930 192,062 165,150
RECONCILIATION OF CASH USED TO
ACQUIRE ASSETS TO ASSET
MOVEMENT TABLE
Total purchases 325,329 309,883 248,930 192,062 165,150
Total cash used to
acquire assets 325,329 309,883 248,930 192,062 165,150
1. The 2016-17 Revised Budget and FEs include the following the estimates variation as outlined on page 16.
- Decrease in Appropriation Bill 4 - Equity funding of $8.2m in 2016-17, $7.6m in 2017-18, $5.3m in 2018-19 and $3.2m in 2019-20 for the Smaller Government - strengthen and enhance Australia's border protection services measure announced at 2015-16 Budget.
- Decrease in Appropriation Bill 4 - Equity funding of $5.1m in 2016-17, $6.8m in 2017-18, $1.4m in 2018-19 and $1.0m in 2019-20 for the Visa Risk Assessment Capability measure announced at 2015-16 Budget.
2. Includes both current and prior Bill No. 4 and prior Act No. 2/4/6 appropriations and special capital appropriations. 3. Does not include annual finance lease costs. Includes purchases from current and previous years’
DCBs. Note: Capital funds of $6.3m in 2016-17, $1.2m in 2017-18 and $3.9m in 2018-19 has been moved from 2015-16. This statement has been prepared on Australian Accounting Standards basis.

DIBP Additional Estimates Statements
40
Table 3.7: Statement of asset movements (2016-17 Budget year)
Asset Category
Land Buildings Other Computer Total
property, software
plant and and
equipment Intangibles
$'000 $'000 $'000 $'000 $'000
As at 1 July 2016
Gross book value 24,291 199,451 701,423 1,095,168 2,020,333
Accumulated depreciation/
amortisation and impairment - (44,647) (75,029) (618,011) (737,687)
Opening net book balance 24,291 154,804 626,394 477,157 1,282,646
Capital asset additions
Estimated expenditure on new
or replacement assets
By purchase - appropriation
equity1 - 41,005 106,490 162,388 309,883
Total additions - 41,005 106,490 162,388 309,883
Other movements
Depreciation/amortisation expense - (41,926) (89,778) (141,735) (273,439)
Other - - - 1 1
Total other movements - (41,926) (89,778) (141,734) (273,438)
As at 30 June 2017
Gross book value 24,291 240,456 807,913 1,257,557 2,330,217
Accumulated depreciation/
amortisation and impairment - (86,573) (164,807) (759,746) (1,011,126)
Closing net book balance 24,291 153,883 643,106 497,811 1,319,091
1. “Appropriation equity” refers to equity injections or Administered Assets and Liabilities
appropriations provided through Appropriation Act (No. 2) and Bill (No. 4) 2016-17.

DIBP Additional Estimates Statements
41
Table 3.8: Schedule of budgeted income and expenses administered on behalf of Government (for the period ended 30 June)
2015-16 2016-17 2017-18 2018-19 2019-20
Actual Revised Forward Forward Forward
$'000 Budget estimate estimate estimate
$'000 $'000 $'000 $'000
EXPENSES ADMINISTERED ON
BEHALF OF GOVERNMENT
Suppliers 1,715,411 1,869,029 831,045 800,884 828,955
Grants 21,083 - - - -
Personal benefits 401,825 381,804 228,868 172,842 112,946
Depreciation and amortisation 125,337 122,908 119,101 113,147 111,071
Write-down and impairment
of assets 39,990 25,607 25,607 25,607 25,607
Other expenses 3,387 - - - -
Total expenses administered on
behalf of Government 2,307,033 2,399,348 1,204,621 1,112,480 1,078,579
LESS:
OWN-SOURCE INCOME
Own-source revenue
Taxation revenue
Customs duty 14,044,689 14,259,200 14,729,250 16,169,450 17,559,450
Other taxes 3,214,364 3,450,847 3,644,760 3,825,171 3,971,023
Total taxation revenue 17,259,053 17,710,047 18,374,010 19,994,621 21,530,473
Non-taxation revenue
Fees and fines 43,636 53,266 49,441 49,441 51,720
Other revenue 21,560 17,682 21,962 21,649 21,835
Total non-taxation revenue 65,196 70,948 71,403 71,090 73,555
Total own source-revenue
administered on behalf of
Government 17,324,249 17,780,995 18,445,413 20,065,711 21,604,028
Gains
Sale of assets 703 - - 8,598 -
Other gains 115 - - - -
Total gains administered on
behalf of Government 818 - - 8,598 -
Total own-source income
administered on behalf of
Government 17,325,067 17,780,995 18,445,413 20,074,309 21,604,028
Net cost of/(contribution by)
services 15,018,034 15,381,647 17,240,792 18,961,829 20,525,449
Surplus/(deficit) after income tax 15,018,034 15,381,647 17,240,792 18,961,829 20,525,449
OTHER COMPREHENSIVE INCOME
Items not subject to subsequent
reclassification to profit or loss
Changes in asset revaluation
surplus (1,060) - - - -
Total other comprehensive
income (1,060) - - - -
Total comprehensive income/
(loss) 15,016,974 15,381,647 17,240,792 18,961,829 20,525,449
Prepared on Australian Accounting Standards basis.

DIBP Additional Estimates Statements
42
Table 3.9: Schedule of budgeted assets and liabilities administered on behalf of Government (as at 30 June)
2015-16 2016-17 2017-18 2018-19 2019-20
Actual Revised Forward Forward Forward
$'000 Budget estimate estimate estimate
$'000 $'000 $'000 $'000
ASSETS
Financial assets
Cash and cash equivalents 45,609 45,609 45,609 45,609 45,609
Taxation receivables 341,152 327,652 344,152 360,652 367,152
Trade and other receivables 21,500 15,935 10,370 27,874 15,767
Other financial assets 15,725 15,725 15,725 15,725 15,725
Total financial assets 423,986 404,921 415,856 449,860 444,253
Non-financial assets
Land 47,598 47,598 47,598 47,598 47,598
Buildings 1,293,795 1,360,915 1,280,158 1,185,257 1,105,933
Property, plant and equipment 173,855 169,961 156,460 143,437 131,816
Other non-financial assets 26,361 26,361 26,361 26,361 26,361
Total non-financial assets 1,541,609 1,604,835 1,510,577 1,402,653 1,311,708
Total assets administered on behalf of
Government 1,965,595 2,009,756 1,926,433 1,852,513 1,755,961
LIABILITIES
Payables
Suppliers 15,475 15,475 15,475 15,475 15,475
Personal benefits 20,310 20,310 20,310 20,310 20,310
Grants 66 66 66 66 66
Other payables 234,143 234,143 234,143 234,143 234,143
Total payables 269,994 269,994 269,994 269,994 269,994
Interest bearing liabilities
Loans 68,791 68,791 68,791 68,791 68,791
Total interest bearing liabilities 68,791 68,791 68,791 68,791 68,791
Provisions
Other provisions 9,200 9,200 9,200 9,200 9,200
Total provisions 9,200 9,200 9,200 9,200 9,200
Total liabilities administered on behalf
of Government 347,985 347,985 347,985 347,985 347,985
Net assets/(liabilities) 1,617,610 1,661,771 1,578,448 1,504,528 1,407,976
Prepared on Australian Accounting Standards basis.

DIBP Additional Estimates Statements
43
Table 3.10: Schedule of budgeted administered cash flows (for the period ended 30 June)
2015-16 2016-17 2017-18 2018-19 2019-20
Actual Revised Forward Forward Forward
$'000 Budget estimate estimate estimate
$'000 $'000 $'000 $'000
OPERATING ACTIVITIES
Cash received
Sales of goods and rendering of
services 50,462 58,466 54,641 54,641 52,020
Taxes 17,645,682 18,128,291 18,761,603 20,382,214 21,928,066
Net GST received 87,129 88,611 89,054 89,232 89,410
Other 58,959 10,840 15,120 14,807 21,535
Total cash received 17,842,232 18,286,208 18,920,418 20,540,894 22,091,031
Cash used
Personal benefits 427,456 381,804 228,868 172,842 112,946
Suppliers 1,839,339 1,957,640 920,099 890,116 918,365
Grants 21,017 - - - -
Other 522,043 500,000 500,000 500,000 500,000
Total cash used 2,809,855 2,839,444 1,648,967 1,562,958 1,531,311
Net cash from/(used by) operating
activities 15,032,377 15,446,764 17,271,451 18,977,936 20,559,720
INVESTING ACTIVITIES
Cash received
Proceeds from sale of property,
plant, equipment and intangibles 725 - - 23,069 -
Total cash received 725 - - 23,069 -
Cash used
Purchase of property, plant,
equipment and intangibles 125,831 186,134 24,843 19,694 20,126
Total cash used 125,831 186,134 24,843 19,694 20,126
Net cash from/(used by)
investing activities (125,106) (186,134) (24,843) 3,375 (20,126)
FINANCING ACTIVITIES
Cash received
Capital injections 161,007 143,230 24,843 19,694 20,126
Other 2,667 - - - -
Total cash received 163,674 143,230 24,843 19,694 20,126
Net cash from/(used by)
financing activities 163,674 143,230 24,843 19,694 20,126
Net increase/(decrease) in cash
held 15,070,945 15,403,860 17,271,451 19,001,005 20,559,720
Cash and cash equivalents at
beginning of reporting period 21,259 45,609 45,609 45,609 45,609
Cash from Official Public
Account for:
- Appropriations 2,764,849 2,797,779 1,563,955 1,454,699 1,441,901
Total cash from Official Public
Account 2,764,849 2,797,779 1,563,955 1,454,699 1,441,901
Cash to Official Public Account
for:
- Appropriations 17,811,444 18,201,639 18,835,406 20,455,704 22,001,621
Total cash to Official Public
Account 17,811,444 18,201,639 18,835,406 20,455,704 22,001,621
Cash and cash equivalents at
end of reporting period 45,609 45,609 45,609 45,609 45,609
Prepared on Australian Accounting Standards basis.

DIBP Additional Estimates Statements
44
Table 3.11: Schedule of administered capital budget (for the period ended 30 June)
2015-16 2016-17 2017-18 2018-19 2019-20
Actual Revised Forward Forward Forward
$'000 Budget estimate estimate estimate
$'000 $'000 $'000 $'000
NEW CAPITAL APPROPRIATIONS
Capital budget - Act 1 (ACB) 26,098 18,856 19,253 19,694 20,126
Administered Assets and Liabilities - Act 2 140,350 124,374 5,590 - -
Total new capital appropriations 166,448 143,230 24,843 19,694 20,126
Provided for:
Purchase of non-financial assets 166,448 143,230 24,843 19,694 20,126
Total Items 166,448 143,230 24,843 19,694 20,126 - - - -
PURCHASE OF NON-FINANCIAL ASSETS
Funded by capital appropriations1 181,350 162,584 5,590 - -
Funded by capital appropriation
- ACB2 21,404 23,550 19,253 19,694 20,126
TOTAL AMOUNT SPENT 202,754 186,134 24,843 19,694 20,126
RECONCILIATION OF CASH USED TO
ACQUIRE ASSETS TO ASSET MOVEMENT
TABLE
Total accrual purchases 125,831 186,134 24,843 19,694 20,126
Total cash used to
acquire assets 125,831 186,134 24,843 19,694 20,126
1. Includes both current Bill 4 and prior Act 2/4/6 appropriations and special capital appropriations. 2. Does not include annual finance lease costs. Includes purchases from current and previous years’
Administered Capital Budgets (ACBs). Note: Capital funds of $38.2 million has been moved from 2015-16 to 2016-17. This statement has been prepared on Australian Accounting Standards basis.

DIBP Additional Estimates Statements
45
Table 3.12: Statement of administered asset movements (2016-17 Budget year)
Asset Category
Land Buildings Other L&B, Total
property, IP&E
plant and held for
equipment sale
$'000 $'000 $'000 $'000 $'000
As at 1 July 2016
Gross book value 47,598 1,406,585 188,323 25,135 1,667,641
Accumulated depreciation/
amortisation and impairment - (112,790) (14,468) - (127,258)
Opening net book balance 47,598 1,293,795 173,855 25,135 1,540,383
CAPITAL ASSET ADDITIONS
Estimated expenditure on new
or replacement assets
By purchase - appropriation
equity1 - 175,302 10,832 - 186,134
Total additions - 175,302 10,832 - 186,134
Other movements
Depreciation/amortisation expense - (108,182) (14,726) - (122,908)
Restructuring - - - - -
Total other movements - (108,182) (14,726) - (122,908)
As at 30 June 2017
Gross book value 47,598 1,581,887 199,155 25,135 1,853,775
Accumulated depreciation/
amortisation and impairment - (220,972) (29,194) - (250,166)
Closing net book balance 47,598 1,360,915 169,961 25,135 1,603,609
1. "Appropriation equity" refers to equity injections or Administered Assets and Liabilities appropriations
provided through Appropriation Act (No. 2) 2016-17 and Bill No. 4 2016-17.

47
PORTFOLIO GLOSSARY
Term Meaning
Administered items Expenses, revenues, assets or liabilities managed by
agencies on behalf of the Commonwealth. Agencies
do not control administered items. Administered
expenses include grants, subsidies and benefits. In
many cases, administered expenses fund the
delivery of third party agencies.
Additional estimates Where amounts appropriated at Budget time are
insufficient, Parliament may appropriate more
funds to portfolios through the Additional
Estimates Acts.
Appropriation An authorisation by Parliament to spend monies
from the Consolidated Revenue Fund (CRF), for a
particular purpose.
Annual appropriation Two appropriation Bills are introduced into
Parliament in May and comprise the Budget for the
financial year beginning 1 July. Further Bills are
introduced later in the financial year as part of the
Additional Estimates. Parliamentary Departments
have their own appropriations.
Consolidated Revenue Fund Section 81 of the Constitution stipulates that all
revenue raised or money received by the
Commonwealth forms the one CRF. The CRF is not
a bank account. The Official Public Accounts
reflects most of the operations of the CRF.
Departmental items Assets, liabilities, revenues and expenses that are
controlled by the agency in providing program
outputs. Departmental items would generally
include computers, plant and equipment, assets
used by agencies in providing goods and services
and most employee expenses, supplier costs and
other administrative expenses incurred.
Depreciation Apportionment of an asset’s capital value as an
expense over its estimated useful life to take account

48
of normal usage, obsolescence, or the passage of
time.
Equity or net assets Residual interest in the assets of an entity after
deduction of its liabilities.
Expense Decreases in economic benefits in the form of
outflows or depletions of assets or incurrence of
liabilities that result in decrease in equity, other
than those relating to distributions to equity
participants.
Forward estimates period The three years following the Budget year. For
example if 2016-17 is the Budget year, 2017-18 is
forward year 1, 2018-19 is forward year 2 and
2018-19 is forward year 3. This period does not
include the current or Budget year.
PGPA Act The PGPA Act is the principal legislation concerning
the governance, performance and accountability of,
and the use and management of public resources by
the Commonwealth.
Measure A new policy or savings decision of the Government
with financial impacts on the Government’s
underlying cash balance, fiscal balance, operating
balance, headline case balance, net debt or net
worth. Such proposals are normally made in the
context of the annual Budget, and are typically
published in Budget Paper No. 2, and in the
Mid-Year Economic and Fiscal Outlook (MYEFO).
Migration Act Migration Act 1958.
Special account Balances existing within the CRF that are supported
by standing appropriations PGPA Act s.78, s.79 and
s.80. Special Accounts allow money in the CRF to
be acknowledged as set-aside (hypothecated) for a
particular purpose. Amounts credited to a Special
Account may only be spent for the purposes of the
Special Account. Special Accounts can only be
established by a written determination of the
Finance Minister (s. 78 of the PGPA Act) or through
an Act of Parliament (referred to in s. 80 of the
PGPA Act).

49
INDEX
Acronym Description
ABF Australian Border Force
ACB Administered Capital Budget
CRF Consolidated Revenue Fund
DCB Departmental Capital Budget
DIBP Department of Immigration and Border Protection
FBO Final Budget Outcome
FTA Free Trade Agreement
GST Goods and Services Tax
IPC Import Processing Charge
IMA Illegal Maritime Arrival
KPI Key Performance Indicator
MP Member of Parliament
MYEFO Mid-Year Economic and Fiscal Outlook
OTM Other Trust Monies
PB Statements Portfolio Budget Statements
PMC Passenger Movement Charge
SOETM Services for Other Entities and Trust Moneys
SOG Services for Other Government and Non-agency Bodies
accounts
VAC Visa Application Charge