building self-service bi solutions with power...
TRANSCRIPT
Building Self-Service BI Solutions with Power Query
Written By: Devin Knight
@Knight_Devin

CONTENTS
PAGE 3 INTRODUCTION
PAGE 4 WHAT IS POWER QUERY
PAGE 5 WHEN USE POWER QUERY
PAGE 6 WHO SHOULD USE POWER QUERY
PAGE 7 POWER QUERY DEMONSTRATION: MAKING SENSE OF CENSUS DATA PAGE 8 EXTRACTING DATA PAGE 9 TRANSFORMING DATA PAGE 11 ADDING ADDITIONAL DATA SOURCES PAGE 17 MERGING DATA PAGE 20 VISUALIZING DATA
PAGE 23 SELF-SERVICE, NOT SELF-TAUGHT
PAGE 24 SUMMARY

PRAGMATIC WORKS White Paper Building Self-Service BI Solutions with Power Query
Introduction
www.pragmaticworks.com PAGE 3
INTRODUCTION
Demand for data has never been higher. Keeping up with the
business’ needs has become increasingly difficult. Traditional
ways of getting the business the data they need often has
long planning cycles which make it difficult to adjust when the
requirements or needs change.
This demand is what launched many new Self-Service
technologies, which allow the business to design their own
solutions with little need to involve IT. Having this ability to create
data solutions on their own enables the business to be much more
agile in their decision making process. Business Intelligence has
long been the way to visualize how a business can truly be more
successful through the process of making decisions. Business
Intelligence is all about taking data and transforming it into
something meaningful for business purposes. The rise of Self-
Service technologies is one of the most significant developments
to affect Business Intelligence since the technology’s creation.
Through Self-Service BI, business units can personalize Business
Intelligence to their needs and solve problems at a much faster
rate than any traditional BI solution. This is why businesses
are looking to Self-Service BI to solve the smaller, but no less
significant, problems that individual departments need addressed.
Organizations should not see Self-Service BI as an opportunity
to completely disengage IT. Self-Service BI solutions may be
great for shorter development cycles and getting feedback from
the business quicker, but it is not a cure all to solving problems.
Corporate, or IT driven BI, will continue to be a better solution
around data quality, scalability, and providing a single version
of the truth.
Imagine a scenario where multiple departments have
implemented Self-Service solutions but they all give different
answers on the same question. Clearly in this situation, Corporate
BI would be better suited to create a Data Warehouse providing
the business with a single version of the truth. The lesson here is
use the right tool for the job. Analyze the problem you are trying
to solve and then determine if it is better solved with Corporate
or Self-Service BI.
The major components of Business Intelligence is data extraction
and manipulation. With traditional Corporate BI this can done
through tools like SSIS (SQL Server Integration Services), which
is an enterprise ETL (Extract Transform Load) tool. However, the
goal of this white paper is to focus on using and understanding
one of Microsoft’s latest Self-Service BI tools called Power Query.

PRAGMATIC WORKS White Paper Building Self-Service BI Solutions with Power Query
What is Power Query
www.pragmaticworks.com PAGE 4
WHAT IS POWER QUERY
Power Query is a Self-Service data extraction tool that is a free
add-in for Excel 2010 or higher. This allows users that are already
comfortable with Excel a smaller learning curve to start enjoying
it. Power Query has a vast array of options that it can use as data
sources. The types of sources that can be used are:
• Web page
• Excel or CSV file
• XML file
• Text file
• Folder
• SQL Server database
• Windows Azure SQL Database
• Access database
• Oracle database
• IBM DB2 database
• MySQL database
• SharePoint List
• OData feed
• Hadoop Distributed File System (HDFS)
• Windows Azure Marketplace
• Active Directory
This paper will show you how simple yet powerful Power Query
really is by showing you an example of solving a problem that
would be fairly complex using traditional ETL tools like SSIS but
made simple with Power Query.
By no means is Power Query going to replace SSIS, at least not
in the current form, but it can be used for solving quick data
extraction challenges. Integration Services will still be used for
things like complex Data Warehouse loads.
You can download the tool from the following URL:
www.tinyurl.com/powerquery

PRAGMATIC WORKS White Paper Building Self-Service BI Solutions with Power Query
When use Power Query
www.pragmaticworks.com PAGE 5
WHEN USE POWER QUERY
In the introduction of this paper it was discussed that Self-Service BI tools cannot solve
all your business problems. So when should you choose to use a Self-Service tool like
Power Query? There is no blanket answer to this question. As new initiatives come
up they should be analyzed on a case by case basis to determine if Power Query is a
good fit or not.
There are many factors that you can consider, so if you find it difficult to make a
choice than make a list of the challenges you are trying to get past and mark each as
better solved with Self-Service BI or Corporate BI. This table shows a basic example of
a decision matrix to help guide you through making this decision.
NEED IMPORTANCE SCORE (1-5) SELF-SERVICE BI CORPORATE BI
DATA QUALITY 4 X
SHORT DEVELOPMENT CYCLE 5 X
SINGLE VERSION OF TRUTH 2 X
USER DEVELOPMENT 5 X
SCALABILITY 3 X
SCORE 10 9
For any given solution simply adjust the importance score. For example, in some
projects scalability may be the most important problem to solve while other projects
it may be the least important. This demonstrates why this score may change from
project to project.

WHO SHOULD USE POWER QUERY
Within Self-Service BI there are several roles that individuals
may identify with. These are by no means formal roles but
often business users will align their expertise to one of the
following four: Data Wrangler, Data Steward, Power Analyst, or
Collaborative User. Business users may align with just one single
role or take on all four but it is important that to understand what
each involve. These roles are summarized in the image below.
As you may guess, Power Query is primarily facilitated by the
Data Wrangler role. This role specializes in bringing together and
creating meaning out of data. They often pull together disparate
data sources and create relationships where they may have not
previously existed. They must know each data source well or at
least know where to get the right answers to questions when
they arise. They can give details such as where data resides, how
to access it and how frequently it is refreshed. The data wrangler
has one of the most important roles because everything they
design impacts the subsequent roles.
PRAGMATIC WORKS White Paper Building Self-Service BI Solutions with Power Query
Who should use Power Query
www.pragmaticworks.com PAGE 6

PRAGMATIC WORKS White Paper Building Self-Service BI Solutions with Power Query
Power Query Demonstration: Making Sense of Census Data
www.pragmaticworks.com PAGE 7
POWER QUERY DEMONSTRATION: MAKING SENSE OF CENSUS DATA
One of the more fascinating things about Power Query is its ability to pull in data
from unusual data sources. This give you the ability to tap into data sources that were
previously thought of as difficult to analyze. It also makes public data sources much
more of an asset when combined with existing data sources.
This white paper will use the public data source of United States Census data for
targeting high income counties in the state of Florida. Imagine you work for a retail
company that is looking to open a new store front in Florida. If you could bring this
pubic data source in for the analysis of that choice you could make a much more
informed decision on choosing a new retail store location. This example will walk you
through using Power Query to do the Following:
• Extracting Data
• Transforming Data
• Adding Additional Data Sources
• Merging Data
• Visualizing Data (Using Power View)
To follow this example you will need the following functionality on your machine:
• Internet Access
• Excel Professional 2010 or higher
• Power Query add-in
• Power Pivot add-in (Already installed if using Excel 2013)
• If you are using Excel 2010 you must have SharePoint 2010 SP1 or higher with
SQL Server 2012 for the Visualizing Data section. If you are using Excel 2013 all
functionality is built-in.
PRAGMATIC WORKS White Paper Building Self-Service BI Solutions with Power Query
Power Query Demonstration: Making Sense of Census Data
www.pragmaticworks.com PAGE 8
Extracting Data
For our example we’ll be pulling census data which can be
found on the web. Use the following step-by-step instructions to
complete the example:
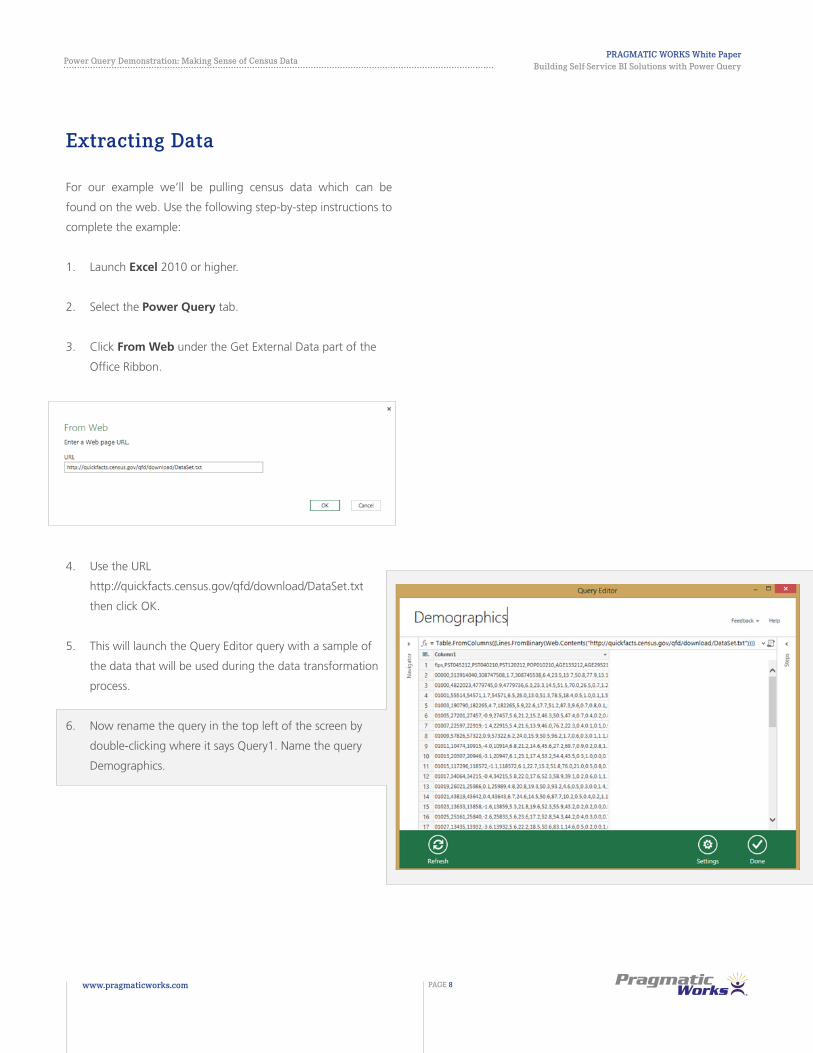
1. Launch Excel 2010 or higher.
2. Select the Power Query tab.
3. Click From Web under the Get External Data part of the
Office Ribbon.
4. Use the URL
http://quickfacts.census.gov/qfd/download/DataSet.txt
then click OK.
5. This will launch the Query Editor query with a sample of
the data that will be used during the data transformation
process.
6. Now rename the query in the top left of the screen by
double-clicking where it says Query1. Name the query
Demographics.

PRAGMATIC WORKS White Paper Building Self-Service BI Solutions with Power Query
Power Query Demonstration: Making Sense of Census Data
www.pragmaticworks.com PAGE 9
Transforming Data
Now that the data is inside the Power Query window you will
need to apply transformations to the data to make it usable
for reporting. Use the following step-by-step directions to
manipulate the data to fit our needs:
3. With the columns now split you can clearly see that
the first row of the data is column headers. Right-
click on any one of the column headers and select
Use First Row As Headers.
2. In the Split a column by delimiter dialog keep the
default settings of Comma delimiter and At each
occurrence of the delimiter then click OK.
1. Right-click on the Column header named Column1
and select Split Column -> By Delimiter

PRAGMATIC WORKS White Paper Building Self-Service BI Solutions with Power Query
Power Query Demonstration: Making Sense of Census Data
www.pragmaticworks.com PAGE 10
4. The columns here are not properly organized for the other
queries we’ll pull in later. Select all the columns except fips
then right-click and select Unpivot Columns.
5. The new Value column is full of metrics that we’d like
to eventually aggregate on and therefore the data type
must be changed to a number. Right-click on the Values
column and select Change Type -> Number.
6. Once this is complete click Done. This will load the
data into Excel.
This is quickly demonstrates some basic transformations in Power
Query. Next we’ll pull in some additional data sources to help
round out the analysis.
PRAGMATIC WORKS White Paper Building Self-Service BI Solutions with Power Query
Power Query Demonstration: Making Sense of Census Data
www.pragmaticworks.com PAGE 11
Adding Additional Data Sources
To make this a more functional example let’s add a couple more data sources and then
finally merge them together. Use the following steps to add in two new data source:
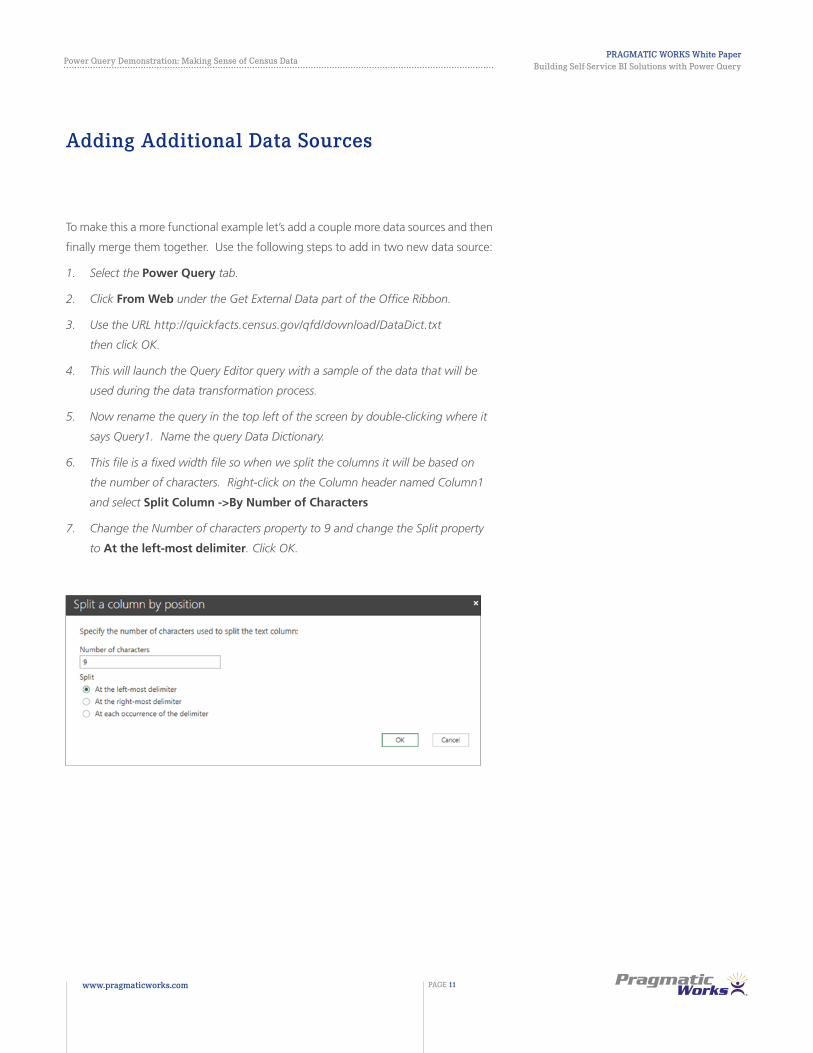
1. Select the Power Query tab.
2. Click From Web under the Get External Data part of the Office Ribbon.
3. Use the URL http://quickfacts.census.gov/qfd/download/DataDict.txt
then click OK.
4. This will launch the Query Editor query with a sample of the data that will be
used during the data transformation process.
5. Now rename the query in the top left of the screen by double-clicking where it
says Query1. Name the query Data Dictionary.
6. This file is a fixed width file so when we split the columns it will be based on
the number of characters. Right-click on the Column header named Column1
and select Split Column ->By Number of Characters
7. Change the Number of characters property to 9 and change the Split property
to At the left-most delimiter. Click OK.

PRAGMATIC WORKS White Paper Building Self-Service BI Solutions with Power Query
Power Query Demonstration: Making Sense of Census Data
www.pragmaticworks.com PAGE 12
8. Right-click on the Column header named Column1.2 and select Split Column
->By Number of Characters
9. Change the Number of characters property to 106 and change the Split property
to At the left-most delimiter. Click OK.
10. We now have two columns that provide a data dictionary for our first file we
loaded. The Column1.2.2 has data that we’re not concerned with for this
example so remove it by right-clicking on it and selecting Remove.
11. Just like the previous file our column headers are in the first row of the data so
right-click on any of the column headers and Use First Row as Headers.
12. Remove extra spaces that appear at the end of each column by selecting both
columns and right-clicking. Select Transform -> Trim to remove the extra spaces.

PRAGMATIC WORKS White Paper Building Self-Service BI Solutions with Power Query
Power Query Demonstration: Making Sense of Census Data
www.pragmaticworks.com PAGE 13
13. Right-click on the Data_Item column and select Rename. Rename the column
Attribute.
14. Next, right-click on the Item_Description column and select Rename. Rename
the column Description.
15. Click Done.
16. Let’s add in one more data source now. Select the Power Query tab.
17. Click From Web under the Get External Data part of the Office Ribbon.
18. Use the URL http://quickfacts.census.gov/qfd/download/FIPS_CountyName.txt
then click OK.
19. This will launch the Query Editor query with a sample of the data that will be
used during the data transformation process.
20. Now rename the query in the top left of the screen by double-clicking where it
says Query1. Name the query County.
21. Again we must deal with a file with delimiters. Right-click on the Column1
header and select Split Column ->By Delimiter.
22. Change the delimiter to Space and change the Split property to At the left-
most delimiter. Click OK.

PRAGMATIC WORKS White Paper Building Self-Service BI Solutions with Power Query
Power Query Demonstration: Making Sense of Census Data
www.pragmaticworks.com PAGE 14
23. Right-click on the Column1.2 header and select Split
Column ->By Delimiter.
24. Leave the default delimiter as Comma and change the Split
property to At the right-most delimiter. Click OK.
25. You will notice this not only includes county data but also
states and United States. Let’s start by removing the United
States value. Select the down arrow next to Column1.2.1
and uncheck UNITED STATES from the filter list then click OK.
26. Next to remove the state data start by right-clicking on
Column1.2.2 and select Insert Column ->Custom.
28. Click on the fx button in the formula bar to
create a custom function.
27. Add the following code to the Custom Column Formula
box: if [Column1.2.2] = null then [Column1.2.1] else null.
Click OK.

PRAGMATIC WORKS White Paper Building Self-Service BI Solutions with Power Query
Power Query Demonstration: Making Sense of Census Data
www.pragmaticworks.com PAGE 15
29. Use the following custom formula to fill in the state name
down each corresponding row:
= Table.FillDown(InsertedCustom,"Custom")
30. Select the down arrow next to the column named
Column1.2.2 and uncheck (null) values. Then click OK.
31. Right-click on the column named Column1.2.2 and select
Remove. It will no longer be needed.

PRAGMATIC WORKS White Paper Building Self-Service BI Solutions with Power Query
Power Query Demonstration: Making Sense of Census Data
www.pragmaticworks.com PAGE 16
32. To ensure all the data has the same casing right-click
on the column named Custom and select Transform
->Capitalize Each Word.
33. Finally, let’s fix the column names. Right-click on the
column named Column1.1 and select Rename. Set the
new column name to FIPS.
34. Right-click on the column named Column1.2.1 and select
Rename. Set the new column name to County.
35. Right-click on the column named Custom and select
Rename. Set the new column name to State.
36. Click Done to import this query to Excel.
PRAGMATIC WORKS White Paper Building Self-Service BI Solutions with Power Query
Power Query Demonstration: Making Sense of Census Data
www.pragmaticworks.com PAGE 17
Merging Data
Now that all the data sources have been extracted and
transformed separately we must merge them together in order to
report on each dataset at once. Finally we will load the resulting
table into a Power Pivot model.
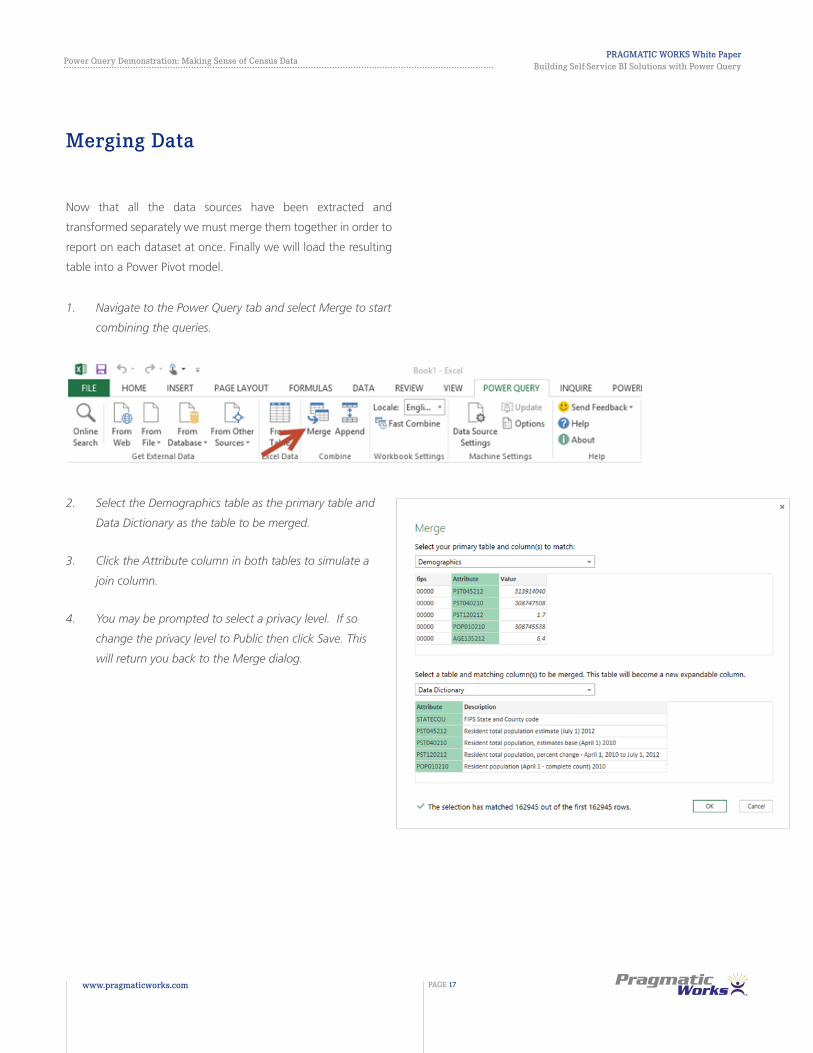
1. Navigate to the Power Query tab and select Merge to start
combining the queries.
2. Select the Demographics table as the primary table and
Data Dictionary as the table to be merged.
3. Click the Attribute column in both tables to simulate a
join column.
4. You may be prompted to select a privacy level. If so
change the privacy level to Public then click Save. This
will return you back to the Merge dialog.

PRAGMATIC WORKS White Paper Building Self-Service BI Solutions with Power Query
Power Query Demonstration: Making Sense of Census Data
www.pragmaticworks.com PAGE 18
5. Notice the matched rows on the bottom that identifies
the number of rows that match between each query.
While we have an exact match in this example it is not
mandatory that the rows match in each table. Click OK.
6. This will launch the Query Editor again. Power Query
may automatically convert the fips column to a number
so right-click on the fips column and change the select
Change Type ->Text.
7. Select the expand button next to the column named
NewColumn and select Description. Click OK.
8. Click Done.
9. Navigate back to the Power Query tab and select Merge
again.
10. Select Merge1 as the primary table and County as the
merge table
11. Click the fips column from the Merge1 table and the FIPS
column from the County table to simulate a join column.
12. You may be prompted again to select a privacy level. If so
change the privacy level to Public then click Save. This will
return you back to the Merge dialog.
13. Click OK in the Merge dialog.
14. This will launch the Query Editor again. Select the expand
button next to the column named NewColumn and
uncheck FIPS. Click OK.
Merging Data

PRAGMATIC WORKS White Paper Building Self-Service BI Solutions with Power Query
Power Query Demonstration: Making Sense of Census Data
www.pragmaticworks.com PAGE 19
15. Click the down arrow next to the column named
NewColumn.County and uncheck (null) then click OK.
16. Rename the new columns by right-clicking on
NewColumn.Description and selecting Rename. Set the
new name to Description.
17. Rename the new columns by right-clicking on
NewColumn.County and selecting Rename. Set the new
name to County.
18. Rename the new columns by right-clicking on
NewColumn.State and selecting Rename. Set the new
name to State.
19. Click Done.
20. In the Query Settings window double-click on the
query name Merge2 and rename the query County
Demographics.
21. Also in the Query Settings window select Load to data
model to bring this table into Power Pivot. This button
is only available in Excel 2013. If you are using Excel
2010 you can do the same action by launching the Power
Pivot window then selecting the Design tab and Existing
Connections.
Merging Data

PRAGMATIC WORKS White Paper Building Self-Service BI Solutions with Power Query
Power Query Demonstration: Making Sense of Census Data
www.pragmaticworks.com PAGE 20
Visualizing Data
While this paper has focused mainly on the capabilities of Power Query we will end this
demonstration by placing our demographic data in a presentation layer. Using Power
View we will place our data points on a map to finally help make the decision which
county in Florida would be best for our retail location.
1. Go to the Insert menu in Excel 2013. This demonstration can be done in Excel
2010 also after deploying to SharePoint. Power View was added as a built in
tool for Excel 2013 so these steps may vary if you are using Excel 2010 with
SharePoint.
2. Select the Power View button.
3. By default a table will be created with all the fields selected. Delete the
default table by selecting it and hitting delete.
4. Navigate to the Power View Fields pane on the right and expand the County
Demographics table.
5. Click and drag the State field into the filter section of the report. Then select
Florida so it will be the only state viewed in the report.

PRAGMATIC WORKS White Paper Building Self-Service BI Solutions with Power Query
Power Query Demonstration: Making Sense of Census Data
www.pragmaticworks.com PAGE 21
6. Next select County and Value from the same table. This will place the data
into a flatten table on the report design surface
7. To change this to a map click Map in the Design tab under the Switch
Visualization section.
8. Resize the map to take up the entire design surface by grabbing a corner and
stretching it to fit the screen.

PRAGMATIC WORKS White Paper Building Self-Service BI Solutions with Power Query
Power Query Demonstration: Making Sense of Census Data
www.pragmaticworks.com PAGE 22
9. You will notice there are several data points on the map that are outside the state
of Florida. This is because those states happen to have counties with the same
name as Florida counties.
10. Zoom in and adjust the map so the only state that is the focus is Florida.
11. In the Power View Fields pane drag the Description column into the Filters pane.
12. Check Median Household Income, 2007-2011 as the filter selection and then
close the Filters pane.
13. Give the report a title of Florida Household Income to complete the report.
This report now give us the answer of which counties in Florida have the highest average income
earners. Using the analysis we can make a more informed decision on creating a new retail store.

PRAGMATIC WORKS White Paper Building Self-Service BI Solutions with Power Query
Self-Service, Not Self-Taught
www.pragmaticworks.com PAGE 23
SELF-SERVICE, NOT SELF-TAUGHT
The biggest misconception about Self-Service BI is that it doesn’t
require training. Doing a simple web search on Self-Service BI will
render articles warning of the low success rate of Self-Service BI
or the difficulty users have grasping the concepts of Self-Service
BI. What most overlook in these articles is the reason users
have difficulty.
The truth is many companies do in fact assume because it is Self-
Service that it is also self-taught, which couldn’t be further from
the truth. In fact, training is pivotal to the success of implementing
Self-Service BI as a business solution. While many Self-Service BI
tools are designed using interfaces that are familiar to users, like
Excel, this does not mean they can be learned without formal
instructional lessons. Educating users on interacting with the
Self-Service development lifecycle is the biggest differentiator in
companies that fail and those that succeed with Self-Service BI.
Pragmatic Works has training options for you to both develop
and hone your Self-Service skills. Our Virtual Training class is a
great option for those who can’t travel or take a prolonged period
of time off work. This 4-day class is designed to get you up to
speed using tools easily accessible to Power Users. First you will
learn the basics of creating models using Power Pivot. Then using
Power Query you will shape additional data that can be found
in external data sources. Finally, you will learn the best ways to
present your data by building reports using Excel, Power View
and Power Map. You will also learn how to make the Self-Service
BI solutions you create scalable across your entire enterprise
environment. To learn more about this class please visit:
http://pragmaticworks.com/Self-ServiceBusinessIntelligenceOnline.
In addition we also hold in person Workshops across the country
in Microsoft offices that cover the same course material in two full
eight hour days. This gives you the opportunity to participate in a
live environment while quickly ramping up your skillset. You can
see a complete listing of our currently scheduled Workshops here:
http://pragmaticworks.com/LearningCenter/Workshops/BusinessAnalytics.aspx

PRAGMATIC WORKS White Paper Building Self-Service BI Solutions with Power Query
Self-Service, Not Self-Taught
www.pragmaticworks.com PAGE 24
Summary
If Business Intelligence is used to analyze data to make informed decisions about business operations, then Self-Service BI gives those
that need it most the ability to create solutions to answer their own questions. Providing proper training to developers of Self-Service
solutions will go a long way to being successful in building these solutions.
Power Query provides users with the ability to extract data that previously seemed impossible without lengthy IT driven projects. Once
extracted, Power Query can easily manipulate data through many simple transformation commands that can be done with ease. Power
Query gave us the ability to get new data sources into a familiar Excel environment where we could then visualize the data through
tools like Power View, which was demonstrated in this white paper.