burke lai technical report - easiconsult.com · technical report: burke learning agility...
TRANSCRIPT
Technical Report v3.3 A Guide for Learning about Learning Agility
September 2018
Contact Information Dr. Warner Burke
Teachers College, Columbia University [email protected]
Dr. David Smith [email protected] (v) 314.209.9495, ext. 701
EASI•Consult, LLC
3727 Three Oaks Lane, Ste. 203 Bridgeton, MO 63044
www.easiconsult.com

Technical Report: Burke Learning Agility Inventory® v3.3 September 2018
Introduction 1
Method 13
The Burke Learning Agility Inventory® 14
Results 16
Intercorrelations 16
Table 2. Burke LAI Scale Intercorrelations (Mid-Level Manager Sample) 16
Table 3. Burke LAI Scale Intercorrelations (Online Convenience Sample) 17
Table 4. Burke LAI Scale Intercorrelations (Healthcare Sample) 18
Test Reliability 19
Table 5. Internal Consistency (Mid-Level Manager Sample) 19
Table 6. Internal Consistency (Online Convenience Sample) 20
Table 7. Internal Consistency (Healthcare Organization Sample) 20
Confirmatory Factor Analysis 21
Table 8. CFA for Mid-Level Managers Sample 21
Table 9. CFA for Online Convenience Sample 21
Table 10. CFA for Healthcare Organization Sample 21
Construct Validity 22
Table 11. Convergent Validity for Online Convenience Sample 23
Table 12. Convergent Validity for Healthcare Sample 24
Table 13. Discriminant Validity for Online Convenience Sample 25
Table 14. Discriminant Validity for Healthcare Organization Sample 26
Criterion Validity 27
Table 15. Criterion Validity Table 28
Summary 29
References 31
Appendix 34
Table of Contents
Technical Report: Burke Learning Agility Inventory™ v3.3 Page 1 September 2018
“The ability to learn is a defining characteristic of being human; the ability to continue
learning is an essential skill of leadership. When leaders lose that ability, they inevitably falter.
When any of us lose that ability, we no longer grow” (Bennis & Thomas, 2007, p.1).
Attempting to learn about, and measure learning agility is like using a yardstick when you are not
sure that what you are measuring is a matter of inches and feet, much less linear, and that what
you are measuring is indeed even measurable. Yet it has been highly important for us to try. This
Technical Report/Guide outlines our journey in attempting to define and test a measure of learning
agility particularly in the context of leadership selection and development. We believe, as others
do, that the ability to learn from experience is fundamental to leadership success (Spreitzer, McCall,
& Mahoney, 1997; McCall, 2010; McCauley, Ruderman, Ohlott, & Morrow, 1994; De Meuse,
Guangrong Dai, & Hollenbeck, 2010) and that when selecting and developing leaders, we must
consider not only their intelligence or technical competence, but their ability to figure out what to
do when they don’t know what to do (Eichinger & Lombardo, 2004). This belief provided the drive
for us to “stay the course” to define and measure learning agility over a period of more than five
years. We do not go so far as to declare learning agility as the answer to our leadership issues
and failures, but we do think that with proper measurement and application, a contribution can be
made to both theory and practice.
The State of Leadership
Initially our concerns were about, and still are, learning agility in the context of leadership. Learning
matters to effective leadership, and the record of leadership success can be used to make this point.
This record is not one to be proud of or to shout from the rooftops. The failure rate for people in
positions of leadership ranges from 30-67% with an average of one out of every two leaders
failing (Hogan, Hogan, & Kaiser, 2009). Mistakes are made at the beginning. We select people
for leadership who are strong technically and perhaps have a good track record, but the
relationship between technical ability and leadership success hovers around zero (Hogan, Curphy
& Hogan, 1994). To use the cliché, “what got you here will not get you there”; more advanced and
Introduction
Technical Report: Burke Learning Agility Inventory™ v3.3 Page 2 September 2018
complex leadership roles require new skills, abilities, and perspectives that cannot be learned
elsewhere (Spreitzer et al., 1997; McCall, 2010).
Leadership failure rates, of course, cannot be solely attributed to poor selection. While a recent
overview by McCall (2010) paints a picture of how leaders develop, outlining that “to the extent
leadership is learned, it is learned through experience” (p.3), the painting continues to be viewed
more abstractly than concretely. Executives tend to develop skills through the accumulation of
challenging experiences (McCall, Lombardo, & Morrison, 1998; McCauley, Ruderman, Ohlott, &
Morrow, 1994) and individuals vary in their ability to learn from such experiences (Howard & Bray,
1988; McCall & Lombardo, 1983; R.F. Morrison & Branter, 1992). Yet, organizations continue to
struggle in translating this evidence into practice. As McCall (2010) points out, we know a lot about
the importance of job rotation with assignments being challenging and requiring new learning “on
the run” but getting executive decision-makers to subscribe to this form of development as opposed
to their preference for results and performance over learning is no easy matter.
Encouragingly, executives do seem to believe that leadership matters and makes a difference (Day
& Lord, 1988; Hogan, Curphy, & Hogan, 1994). However, many executives also subscribe to the
belief that the “cream rises to the top” and that one’s current expertise will somehow constitute
future success. The reality, however, is that half of this “cream” lacks the proper consistency, let
alone desirable taste to succeed in leadership roles. It is clear that we need to find another lens
through which we can select and develop leaders.
Defining and Measuring Learning Agility
In recent years, the concept of learning agility has been gaining prominence in the practitioner
world as a way to select and develop individual potential in organizational settings (DeRue,
Ashford, & Myers, 2012; Lombardo & Eichinger, 2000; Eichinger & Lombardo, 2004; DeMeuse,
Dali, & Hallenback, 2010; Silzer & Church, 2009). Defined as "the willingness and ability to learn
from experience, and subsequently apply that learning to perform successfully under new or first-
time conditions” (Lombardo & Eichinger, 2000, p. 322), the concept captures an important aspect
of what has been missing in the way we select and develop individuals in our organizations.
A number of attempts have been made at developing a measure of learning agility (Lombardo &
Eichinger, 2000) or related concepts (e.g. Spreitzer et al., 1997) with varying degrees of scope
and empirical rigor. While we acknowledge the important role this work has played in advancing

Technical Report: Burke Learning Agility Inventory™ v3.3 Page 3 September 2018
our understanding of learning agility and its potential for measurement, we believe a number of
common limitations leave room for further development.
The most systematic of these measures, the Prospector Survey, was developed by Spreitzer et al.
(1997) to aid in the identification of international executive potential. While not a measure of
learning agility in name, potential is operationalized through the measurement of an executive’s
ability to “learn from experience”, in conjunction with performance on a number of “end-state”
competencies (e.g., Is Flexible). Specifically, Spreitzer et al. (1997) identify six “learning-oriented”
competencies which they suggest are integral to executive performance: Uses Feedback, Is Culturally
Adventurous, Seeks Opportunities to Learn, Is Open to Criticism, Seeks Feedback, and Is Flexible1. Of
these six “learning oriented” factors, however, only two were shown to be significantly related to
current performance evaluations, and no support was found for the incremental predictive power
of learning-oriented factors beyond end-state factors. While a substantive reason offered for this
finding is that companies fail to take learning competencies into account when assessing
performance (Spreitzer, et al. 1997), further evidence is needed to validate the learning component
of this measure.
Perhaps the first formal measure of learning agility was developed by Lombardo and Eichinger
(2000). The authors based their measure on a review of some early studies at the Center for Creative
Leadership (see, for example, Lindsey, Homes, & McCall, 1987) and executive interviews, finding
evidence for four components (or factors) of learning agility that they term mental agility, people
agility, change agility and results agility. The Choices Architect, as it was originally commercially
branded, has been shown to be related to independent ratings of performance and potential
(Lombardo & Eichinger, 2000) and unrelated to IQ and the Big Five personality factors (Eichinger
& Lombardo, 2004).
While the results reported by both Sprietzer et al. (1997) and Lombardo & Eichinger (2000;
Eichinger & Lombardo, 2004) are promising, each has its respective limitations. Most significant is
the way in which each measure operationalizes learning agility. While the Prospector Survey is
based on relevant literatures (Boyatzis, 1982; Lobel, 1991; Quinn, Faerman, Thompson, & McGrath,
1990), it does not explicitly measure the concept of learning agility. It is likely that the “learning-
1 Of these, “Uses Feedback” explained the highest percentage of variance among all the factors (including end-state competency factors; 41.90%).

Technical Report: Burke Learning Agility Inventory™ v3.3 Page 4 September 2018
oriented” dimensions of the Prospector overlap significantly with learning agility; however, it cannot
be assumed that the instrument adequately represents all theoretical domains that are foundational
to the concept. The authors of the Choices Architect, on the other hand, do claim to measure learning
agility explicitly, but with 81 items comprising 27 dimensions, the instrument seems to measure more
than just the construct in question. While the four factors possess intuitive appeal, their sheer scope
suggests that a more focused measure may be needed.
DeMeuse, Dali, & Hallenback (2010), make the case for an assessment battery that taps into the
psychological constructs that predict learning agility, rather than learning agility itself, suggesting
that the construct may be a “meta-competency” that is prerequisite to the development of other
competencies. DeMeuse et al. (2010) provide theoretical support for three antecedents to learning
agility: past experience (De Pater et al., 2009), self-awareness (Briscoe & Hall, 1999), and ability
to handle complexity (Day & Lance, 2004; Hoojberg, Hunt, & Dodge 1997). Although the measure
by DeMeuse et al. (2010) provided a conceptual foundation for a more theoretically grounded
measure of learning agility, differentiating it from other related constructs and establishing
boundary conditions, they do not themselves offer and test a measure. They also fail to tackle the
inherent bias in both multi-rater and self-assessments that plague previous attempts at measuring
the construct. The Burke Learning Agility Inventory (Burke LAI) extends DeMeuse et al.’s (2010)
theoretically grounded approach to measuring learning agility, but limits item construction to
observable behavior. By doing so, greater correspondence can be gained between multi-rater and
self-assessments, and raters may be better able to evaluate aspects of learning agility without
needing an awareness of the construct. The authors know of no instrument to date that is
specifically focused on the concept of learning agility, theoretically grounded and behaviorally
based.
A conceptual base for theory development and measurement, however, has been provided by
DeRue et al. (2012). These authors reviewed the literature up to 2012 and defined learning agility
primarily in terms of flexibility and speed. They also emphasized the importance of distinguishing
between learning agility and learning ability. Yet, these two constructs may be related up to a
point. It may be that for a person to be agile as a learner a basic amount of learning ability is
required but after reaching a certain threshold of ability there may be little relationship between
ability and agility. As we attempt to show later, agility is a skill set that requires self-awareness
and actions such as feedback seeking, flexibility, collaborating and reflecting that correspond more
with social intelligence than with the traditional measures of mental ability.
Technical Report: Burke Learning Agility Inventory™ v3.3 Page 5 September 2018
DeRue and his colleagues also provide a model for understanding important ingredients that affect
learning agility. Antecedents like individual differences that include goal orientation, cognitive
ability, and openness to experience, and contextual factors such as complexity and organizational
climate and culture. As noted earlier in their definition of learning agility, they emphasize flexibility
and speed, and they state that learning agility can be understood in either of two processes –
cognitive and behavioral. With respect to measurement we have chosen the more parsimonious
process, i.e., behavioral. DeRue et al. (2012) also account for outcomes in their model in two forms:
(1) learning in and across situations and (2) positive performance change overtime.
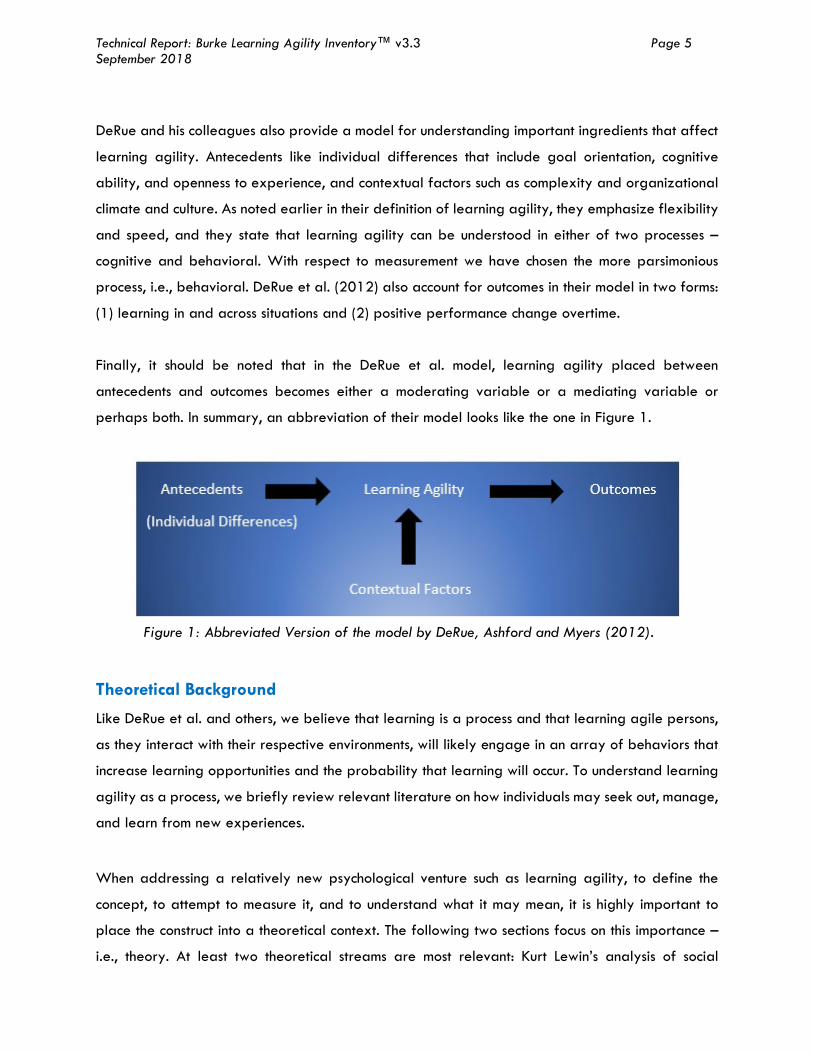
Finally, it should be noted that in the DeRue et al. model, learning agility placed between
antecedents and outcomes becomes either a moderating variable or a mediating variable or
perhaps both. In summary, an abbreviation of their model looks like the one in Figure 1.
Figure 1: Abbreviated Version of the model by DeRue, Ashford and Myers (2012).
Theoretical Background
Like DeRue et al. and others, we believe that learning is a process and that learning agile persons,
as they interact with their respective environments, will likely engage in an array of behaviors that
increase learning opportunities and the probability that learning will occur. To understand learning
agility as a process, we briefly review relevant literature on how individuals may seek out, manage,
and learn from new experiences.
When addressing a relatively new psychological venture such as learning agility, to define the
concept, to attempt to measure it, and to understand what it may mean, it is highly important to
place the construct into a theoretical context. The following two sections focus on this importance –
i.e., theory. At least two theoretical streams are most relevant: Kurt Lewin’s analysis of social
Technical Report: Burke Learning Agility Inventory™ v3.3 Page 6 September 2018
behavior (Lewin, 1935; 1951) and principles of adult learning starting with John Dewey and later
with such contributors as David Kolb, and Argyris and Schön.
Lewin’s Formulation
Considered by many as the father of social psychology, Lewin conceived of behavior as an
interaction of the person with his or her environment usually captured in the formula of B = f (P, E).
Even though Lewin promoted this way of thinking as far back as the late 1930s and early 40s,
psychology for many years, well into the 1960s and later, was taught to students in segments. There
were personality psychologists, e.g., Gordon Allport (1937) and social psychologists e.g., ironically
Gordon’s brother, F.H. Allport (1962). Although brothers they did not view the world of psychology
the same way.
It has been stated by some social psychologists, perhaps in jest, but argued nevertheless that in
social psychology, unlike personality research, there are no main effects. Behavior can only be
explained interactively not by either personality or environment alone. Moreover, cognition,
particularly the notion of social cognition, can be viewed as an interaction, that is, how the person
thinks about the situation one may be facing determines whether and how that person will act. This
action whether observed behaviorally or not (being merely a thought) is nevertheless a perceptive
interaction between the person and the situation.
The work of Albert Bandura referred to as reciprocal determinism carries this line of thinking to
another level (Bandura, 1977; 1978; 2004; see also Phillips & Orton, 1983). In short, reciprocal
determinism states that the person, the environment, and behavior exist and function in an
interlocking relationship characterized by bidirectional causality. As further explained by Kihlstrom
(2015) people shape their environments but environments also shape people. Personal factors, such
as extraversion for example, influence behavior but behavior also feeds back to affect the
individual who engaged in it. Environments elicit behavior, but behavior affects and changes the
environment in which it takes place. (See page 797)
Kihlstrom (2015) further dissects reciprocal determinism into three “dialectics” of social interaction.
1. The dialectic between the person and behavior encompasses “all of the influences
of the person’s internal states and dispositions” such as “personality traits social attitudes,
Technical Report: Burke Learning Agility Inventory™ v3.3 Page 7 September 2018
cognitions and beliefs, emotional states and moods, motives and values” that influence
one’s behavior; in other words, personality psychology. This dialectic also includes all of
the “influences of behavior on the individual’s mental states and dispositions as
exemplified by the James-Lange theory” (Lange, 1994) and self-perception theory
(Bem, 1967).”
2. The dialectic between environment and behavior, that is, all of the physical and
social situation factors that influence one’s behavior as well as the effects of one’s
behavior on the environment.
3. The dialectic between the person and the environment, again the reciprocal
influence of the environment on the person, e.g., individual conformity to a norm, and
vice versa, as in for example, exerting personal power and influence, i.e., getting
people to do what they might not otherwise do.
Thus, Lewin’s formula integrates personality psychology and social psychology which in turn
establishes the theoretical basis for understanding learning agility. Agile learners have a deeper
appreciation of the nature of social interaction and pay more attention to the consequences of their
behavior and at the same time how they are affected by situations that they face. This awareness
furnishes clues from which to learn. We will elaborate on this point later in the Discussion section.
Experiential Learning Theory
The theories of action learning (Lewin, 1951), experiential learning (Dewey, 1938), and cognitive
development meta-theory (Piaget, 1983; Perry, 1999) serve as the foundation for Experiential
Learning Theory (ELT), (Kolb, 1984), which presents a model of individual learning styles and types
by considering the distinct ways individuals typically take-in and process information. Kolb
conceived learning as a cycle in which individuals observe and experience an event (CE; concrete
experience), reflect on that experience (RO; reflective observation), form hypotheses and theories
(AC; abstract conceptualization) and then act based on this understanding (AE; active
experimentation).
Kolb states that “learning is the process whereby knowledge is created through the transformation
of experience” (p.38). Some individuals may learn better from doing tasks, whereas others may
learn better from coaching or critical reflecting. As a result, individuals rarely master all four modes
of learning, because the abilities required for learning some modes are polar opposites. For

Technical Report: Burke Learning Agility Inventory™ v3.3 Page 8 September 2018
example, CE and AC are two distinct ways of grasping information from the environment; AE and
RO form two distinct ways of transforming that information into knowledge (Kolb, 1984). Individuals
must choose which learning mode they will use and feel most comfortable within a given situation.
This approach will take the form of one of four styles. In brief, Accommodators (AE & CE) grasp
information intuitively and have a strong action orientation. They are open to new experiences and
tend to take risks by using trial-and-error approaches. Divergers (CE & RO) grasp information
intuitively and attempt to make meaning of those feelings. They tend to view problems from multiple
perspectives and generate multiple alternatives. Assimilators (RO & AC) enjoy the logic of an
argument and tend to use inductive reasoning to create theories and models. Finally, Convergers
(AC & AE) combine thinking and doing into a style focused on problem solving, decision-making and
pragmatism.
An important finding in Kolb’s research is that individuals learn more when they incorporate multiple
modes of learning (e.g., reflecting and doing tasks together, for example), and the individual who
is capable of doing this is said to have learning flexibility. Agile learners then, according to ELT,
are those who navigate multiple modes of learning. As such, we would expect learning agile
individuals to be able to demonstrate behaviors associated with each of the four components of the
cycle.
Learning Goal Orientation
The experiential learning cycle proposed by Kolb (1984) provides a comprehensive framework
that outlines how effective learners take in, and process information. Such a model is agnostic to the
type of experience, however certain types of experiences have been shown to be an important
determinant of leader development (McCall, 2010). Thus, we must also consider the extent to which
an individual seeks out, is open to, and persists with, new and challenging work related experiences.
A measure of learning agility should not only consider behaviors that indicate an individual’s ability
to effectively navigate the learning cycle (Kolb, 1984), but also their willingness to seek out relevant
situations in which new learning can occur.
Research suggests that individuals typically approach achievement situations as either a way to
develop one’s competence (a learning or mastery goal orientation) or to demonstrate one’s
competence (a performance goal orientation). Originating from work conducted by Carol Dweck
(1986; Dweck & Leggett, 1988; Elliott & Dweck, 1988), these concepts have recently been applied
to the workplace by VandeWalle (1997, 2001). Relevant to the concept of learning agility is the
Technical Report: Burke Learning Agility Inventory™ v3.3 Page 9 September 2018
notion that goal orientations are associated with different personal beliefs about the relationship
between effort and ability. Learning goal orientations defined as “a focus on developing one’s
competence by acquiring new skills, mastering new situations, and learning from experience”
(VandeWalle, 1997, p. 1000), are borne from the belief that one’s ability can be developed with
effort and that this will lead to success. Conversely, performance goal orientations are borne from
the beliefs that ability is innate, difficult to develop and thus effort is largely seen as unrelated to
success. Two different performance goal orientations have been identified, a proving goal
orientation which is defined as “a focus on demonstrating one’s competence and the gaining of
favorable judgments from others”, and an avoiding goal orientation, defined as “a focus on
avoiding negation of one’s competences and the avoiding of negative judgments from others”
(VandeWalle, 1997, p. 1000).
Research has found that individuals can approach new and challenging experiences in qualitatively
different ways depending on their orientation. For example, individuals with a learning goal
orientation display greater tolerance for ambiguity, thoughtfulness, open-mindedness (Kroll, 1988),
persistence in the face of difficulties (Dweck, 1986; Dweck & Leggett, 1988; Elliott & Dweck, 1988)
and prefer challenging tasks (Ames & Archer, 1988). Conversely, performance goal orientations
are negatively related to tolerance for ambiguity, thoughtfulness, complexity (Kroll, 1988), and
have been shown to be related to a general avoidance of challenging tasks (Dweck, 1986; Dweck
& Leggett, 1988; Elliott & Dweck, 1988).
Seeking out, and being open to new and challenging experiences is important for any learning to
be possible. To this end, the specific behaviors that are related to a learning goal orientation are
likely to be integral to the concept of learning agility. Behaviors that demonstrate a tolerance for
ambiguity, open-mindedness, persistence, and a general preference for challenging tasks are likely
to increase the likelihood that individuals will find themselves in, and persist with new and
challenging experiences long enough for learning to occur. If individuals are unable to do this, they
will likely avoid challenging situations, quit when difficulties arise and perhaps continue to seek out
familiar situations. Conversely, individuals who continually seek out new situations will have many
new experiences from which to extract new understanding, meaning and insight. A measure of
learning agility should assess an individual propensity to behave in ways fitting the latter of these
two examples.
Technical Report: Burke Learning Agility Inventory™ v3.3 Page 10 September 2018
Job Adaptability
The learning goal literature (Dweck, 1986; Dweck & Leggett, 1988; Elliott & Dweck, 1988;
VandeWalle, 1997, 2001) provides a rich source of behaviors that indicate an individual’s ability
to seek out and persist with new and challenging experiences. Additionally, experiential learning
theory (Kolb, 1984) provides a framework for understanding how, once in such situations, effective
learners may take-in, and process information. In an environment that is conducive to learning,
seeking out new experiences, accompanied with the ability to take-in and manage information in
an appropriate manner will likely be sufficient for one to learn effectively. However, in many
organizations the primary focus is often on production rather than learning and thus they can rarely
be considered optimal environments. In most work situations, immediate performance comes first
while learning is of secondary concern (if at all). Effective learning at work then must also consider
an individual’s ability to manage the immediate demands of the situation (i.e., the pressure to
produce and perform), in order for learning to occur either in parallel, or after the fact.
The job adaptability and performance literatures provide a rich source of behavioral indicators
that are relevant to job performance in every occupational domain (Campbell, 1993; Pulakos,
Arad, Donovan, & Plamondon, (2000). Many of the dimensions discussed in this domain are relevant
to handling new and challenging experiences. Specifically, an overview provided by Pulakos et al.
(2000) highlights two components that are relevant here: dealing with uncertain and unpredictable
work situations and handling work stress.
In line with what we have argued previously in this Technical Report/Guide, Pulakos et al. (2000)
suggest that effective job performance requires an individual to be able to deal with uncertain and
unpredictable work situations. Specifically, the authors posit that the ease and effectiveness with
which one confronts and deals with uncertainty is demonstrated when individuals refuse to be
paralyzed by uncertainty or ambiguity, don’t need things to be black and white, and take effective
action without having to know the total picture or have all the facts at hand (Pulakos, et al. 2000).
In order to learn from new experience, an individual will undoubtedly need to manage such
uncertainty displaying such behaviors.
Challenging situations, while rich opportunities for learning, can also evoke stress, especially in work
situations where an individual is under pressure to deliver and be present in the moment. This
pressure to deliver, when not managed well may impede an individual’s ability to attend to cues
that may provide valuable learning both during and after an experience. An individual’s ability to
Technical Report: Burke Learning Agility Inventory™ v3.3 Page 11 September 2018
handle such pressure is thus an important aspect of the learning agility process. The work of Pulakos
et al. (2000) again serves as a source of behavioral indicators that may demonstrate such ability.
Specifically, the authors suggest that effectively handling work stress involves remaining composed
and cool when faced with difficult situations, managing frustration well by directing effort to
constructive solutions rather than blaming others, and demonstrating resilience in stressful
circumstances.
Boundary Topics
The concepts covered thus far provide the primary theory for learning agility. But what may seem
relevant yet is not addressed? For example, what current conceptions of learning agility that are
not addressed is a connection to psychological research on behavioral learning theories from the
tradition of Hull, Spence, and Skinner. While these theories directly address how learning changes
behaviors, research from this scholarship is generally regarded as too different an approach from
the very situational and context driven conceptualization of learning agility we are attempting to
address. Another boundary of the theoretical contribution of this work noted briefly earlier is along
the cognitive-behavioral line drawn between aspects of experiential learning. As purported in the
De Rue et al. paper, there are distinct (but connected) processes that occur when an individual is
learning. The cognitive processes associated with learning have received the most attention by
scholars and thus are associated with common wisdom and conceptualizations of learning: namely,
learning is a literal change in connections between neurons that results in new memories and thought
processes. While this tradition is vast and widely studied, less attention has been paid to what
people actually do, in terms of behaviors, when they are learning.
The approach taken in this paper, is built on theories of organizational and team learning in
organizations. Most specifically, the theory of learning agility employed here is drawn from the
scholarship of Argyris and Schön: reflective practitioner, double loop learning, and defensiveness.
This literature also draws upon other social-cognitive theories of learning such as situated learning.
This theory provides insight into how a collaborative approach to learning can enhance the
capability to learn. That is, it is through interactions with others not just in a vicarious learning way,
but through the interpersonal processes of working together and sharing knowledge that capacity
for learning is built within a particular social context (i.e., work organization) and culture.
The contribution of this approach is to address what is known about how individual learning is
connected to team and organizational learning. In addition, this work addresses the issue of how

Technical Report: Burke Learning Agility Inventory™ v3.3 Page 12 September 2018
individuals learn in organizations by outlining the behaviors associated with learning, as separated
from the cognitive processes associated with learning. This work will clarify the content of the
construct of learning agility as it relates to behaviors performed when individuals are learning.
Through the development of a new measure of learning agility, clarity will be provided as to the
content of the construct as well as to convergent, discriminant, and predictive validity. A primary
goal of this work is to provide construct validity for the notion of learning agility, and the approach
is largely behavioral in nature. Findings from this research can contribute to a larger body of work
on leadership, in general, and leadership development, in particular. In sum, learning agility is a
developable set of behaviors that requires an examination of both the personal characteristics
that antecede learning agility as well as the social contextual elements that can enhance or
attenuate a person's ability to act in learning agile ways.
Defining Learning Agility
Learning agility is defined as the engagement in learning behaviors to enhance the capacity to
reconfigure activities quickly to meet the changing demands in the task environment.
Agility, as extrapolated from DeRue et al. (2012), is defined to have two components: flexibility
and speed. In regard to flexibility, it is the process of abandoning behaviors that have worked in
the past for new behaviors that meet the demands of the future. As a result of the learning behaviors
that individuals engage in (e.g., reflecting, collaboration), in concert with an examination of the
needs of the current situation, individuals change their approach to tasks along with changes in
needs or context. Flexibility involves unlearning as much as it does learning; that is, the process of
abandoning previously effective behaviors in favor of behaviors that will work better in the new
context is a critical component of flexibility. In addition, flexibly has to do with behaviors that are
contingency-based such that individuals readily change course in response to feedback from others
or the environment.
Speed, however, has to do with how quickly an individual can change course in behaviors as well
as how quickly an individual can read the situational cues in order to form a plan of action.
Colloquial phases such as “up to speed” and “quick study” exemplify the nature of this component
of learning agility. Individuals who demonstrate behaviors related to speed can change their
position during a discussion in response to social cues, or immediately change behavior after a
learning experience to adjust to the new knowledge.

Technical Report: Burke Learning Agility Inventory™ v3.3 Page 13 September 2018
Our statistical analyses support the claim by De Rue and his colleagues (2012) that Flexibility and
Speed are key dimensions of learning agility. Yet we have identified 7 other dimensions as well,
and the correlations among them show that all are acceptable as both interdependent and
reasonably independent – see Tables 1,2, and 3 that follow. It is likely that these additional 7 when
practiced and incorporated into one’s learning repertoire will support being flexible and quick.
Finally, learning agility is based on two major factors: skill and motivation. Skill concerns developing
the 38 behaviors of the BLAI, and motivation is the willingness to take risks and from time to time
move beyond one’s comfort zone.
The Burke Learning Agility Inventory®
Based on our literature review and preliminary testing, a 38-item learning agility inventory, with a
seven point Likert-style rating scale, was created for further investigation. The inventory was given
the name “Burke Learning Agility Inventory” (Burke LAI). It was postulated that learning agility
consists of nine independent dimensions. These include:
Flexibility – Being open to new ideas and proposing new solutions.
Speed – Acting on ideas quickly so that those not working are discarded and other possibilities are accelerated.
Experimenting – Trying out new behaviors (i.e., approaches, ideas) to determine what is effective.
Performance Risk Taking – Seeking new activities (i.e., tasks, assignments, roles) that provide opportunities to be challenged.
Interpersonal Risk Taking – Confronting differences with others in ways that lead to learning and change.
Collaborating – Finding ways to work with others that generate unique opportunities for learning.
Information Gathering – Using various methods to remain current in one’s area of expertise.
Feedback Seeking – Asking others for feedback on one’s ideas and overall performance.
Reflecting – Slowing down to evaluate one’s own performance in order to be more effective.
Method

Technical Report: Burke Learning Agility Inventory™ v3.3 Page 14 September 2018
Samples
Over the past four years the 38-item Burke LAI was administered to three different samples. A
brief summary of the samples is provided below.
Mid-Level Managers. Participants for this study received an email through a list serve that included
alumni of executive education programs at a large, mid-Atlantic organizations that specialize in
leadership development. Participants were provided with the online questionnaire via a link received
in their email. Participants were able to complete the questionnaire at their convenience. In total,
393 participants completed the study materials and were 57% male with the largest proportion being
between the ages of 35-44 years old (27%), followed by 45-49 (19%), 50-54 (18%), and 55-64 (18%).
The majority of participants held jobs in the corporate sector (57%) and came from various roles in the
organization including manager (24%), director (19%), professional staff (13%) and executive level (11%).
This sample was used as the norm group for the Burke Learning Agility Inventory and as such, it the sample
from which percentile scores found in our report are derived. Please see table 1 for information on the
sample.
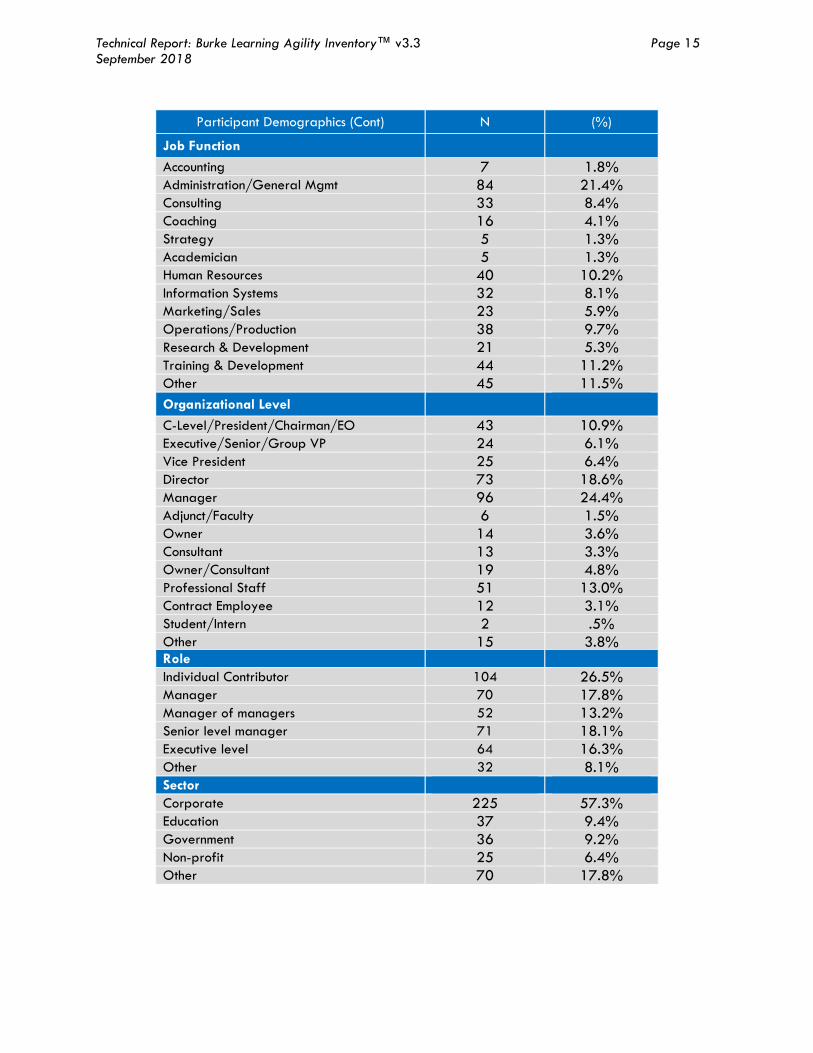
Table 1. Participant Demographics (Mid-Level Manager Sample)
Participant Demographics N (%) Age 18-24 4 1.0% 25-34 48 12.2% 35-44 104 26.5% 45-49 76 19.3% 50-54 72 18.3% 55-64 69 17.6% 65+ 20 5.1% Gender
Male 223 56.7% Female 170 43.3%
Technical Report: Burke Learning Agility Inventory™ v3.3 Page 15 September 2018
Participant Demographics (Cont) N (%)
Job Function Accounting 7 1.8% Administration/General Mgmt 84 21.4% Consulting 33 8.4% Coaching 16 4.1% Strategy 5 1.3% Academician 5 1.3% Human Resources 40 10.2% Information Systems 32 8.1% Marketing/Sales 23 5.9% Operations/Production 38 9.7% Research & Development 21 5.3% Training & Development 44 11.2% Other 45 11.5% Organizational Level C-Level/President/Chairman/EO 43 10.9% Executive/Senior/Group VP 24 6.1% Vice President 25 6.4% Director 73 18.6% Manager 96 24.4% Adjunct/Faculty 6 1.5% Owner 14 3.6% Consultant 13 3.3% Owner/Consultant 19 4.8% Professional Staff 51 13.0% Contract Employee 12 3.1% Student/Intern 2 .5% Other 15 3.8% Role Individual Contributor 104 26.5% Manager 70 17.8% Manager of managers 52 13.2% Senior level manager 71 18.1% Executive level 64 16.3% Other 32 8.1% Sector Corporate 225 57.3% Education 37 9.4% Government 36 9.2% Non-profit 25 6.4% Other 70 17.8%

Technical Report: Burke Learning Agility Inventory™ v3.3 Page 16 September 2018
Online Convenience Sample. A convenience sample of 207 individuals was recruited using
Amazon’s Mechanical Turk survey service. Participation was limited to U.S. adults over the age of
18. Slightly more than half of participants were male (51.2%). The majority of the sample was
White/Caucasian (71.5%) followed by 7.7% Asian/Asian-American, 6.8% Hispanic/Latino(a),
5.3% Black/African-American, 1.9% Biracial, and 6.8% did not respond.
The average age of participants was 34 (SD=10.25) and they had an average of 13.86 years of
work experience (SD=9.63). The majority of the sample were employed (86.5%) when the survey
was administered, 6.8% were not employed, and 6.8% of the sample did not respond. Over one-
third of participants (34.3%) completed a four-year college degree, almost one quarter of
participants (24.2%) reported completing some college, 13% completed their high school/GED
degree, 12.6% completed their two-year college degree, 7.7% completed a Master’s Degree,
and 1.4% completed a professional degree such as a Medical Degree (MD) or Juris Doctorate (JD).
Health Care Organization Sample. A sample of 471 employees at a Health Care organization
was surveyed using an online survey platform. Slightly more than half of participants were female
(56.1%), 14.4% were male, and 29.5% did not respond. The majority of the sample was
White/Caucasian (60%), 6% were Hispanic/Latino(a), 1.7% were Asian/Asian-American, 1.5%
were Black/African-American, .9% were Biracial or Multiracial, .6% were Native Hawaiian/Pacific
Islander, and 29.5% did not respond.
The average age of participants was 41.11 years (SD=14.10) with an average of 20.29 years of
formal work experience (SD=13.38). Roughly one quarter (26%) of participants earned a four-
year college degree; 19.1% earned a two-year college degree, 14.2% completed some college,
5.4% earned a High School Diploma or GED, 2.2% earned a Master’s Degree, 3.4% earned a
professional degree such as a Medical Degree (MD) or Juris Doctorate (JD), .2% completed a
doctoral degree such as a PhD or EdD and 29.5% of participants did not respond. Over one-third
(35.9%) of participants identified as a Team Leader or Supervisor who manages others; almost
one quarter of the sample (24.1%) identified as Individual Contributors who manage themselves;
3.9% identified as Functional Mangers who manage a business function in the organization; 3.7%
Technical Report: Burke Learning Agility Inventory™ v3.3 Page 17 September 2018
identified as Business Managers who manage multiple functions in the organization; 1.9% identified
as Senior Managers who manage other managers; .6% identified as Group Managers who manage
multiple businesses; 29.9% did not respond.
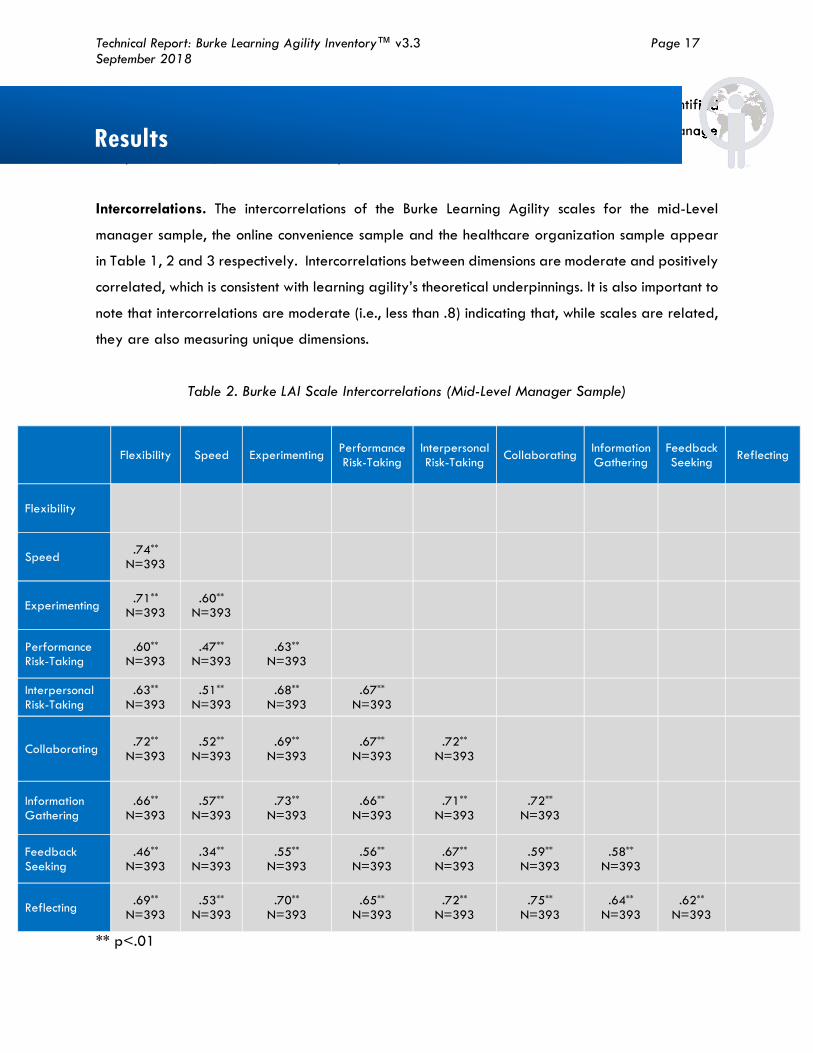
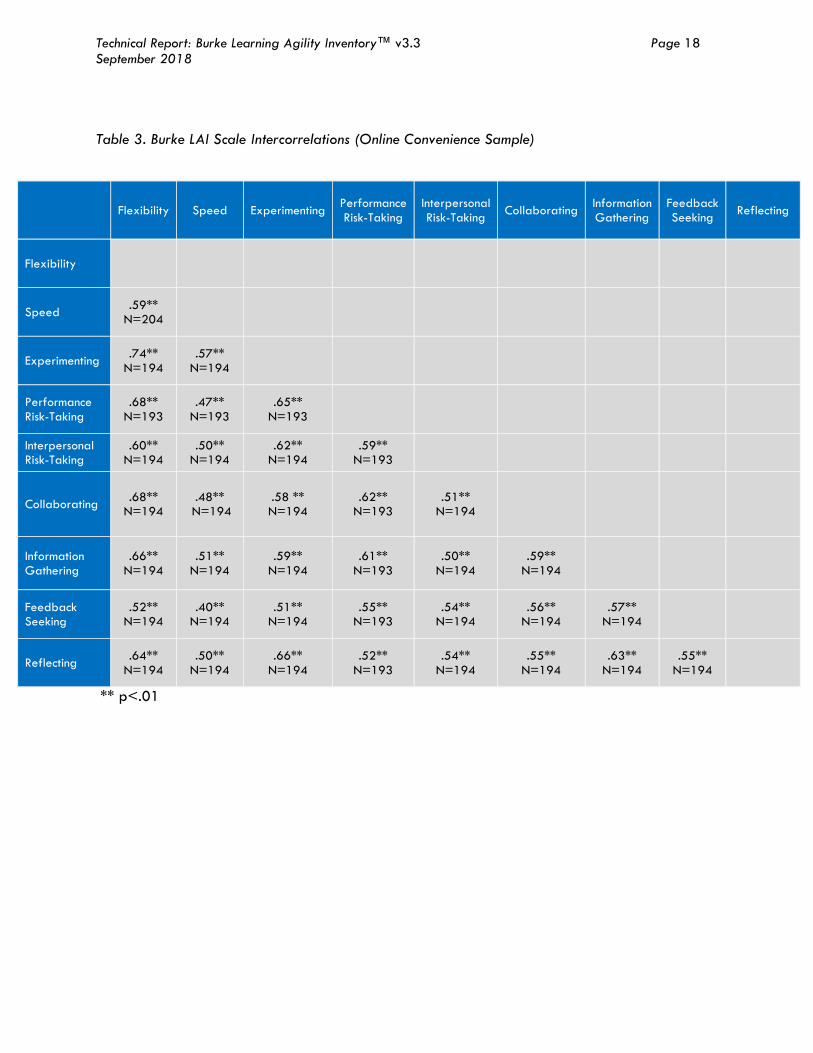
Intercorrelations. The intercorrelations of the Burke Learning Agility scales for the mid-Level
manager sample, the online convenience sample and the healthcare organization sample appear
in Table 1, 2 and 3 respectively. Intercorrelations between dimensions are moderate and positively
correlated, which is consistent with learning agility’s theoretical underpinnings. It is also important to
note that intercorrelations are moderate (i.e., less than .8) indicating that, while scales are related,
they are also measuring unique dimensions.
Table 2. Burke LAI Scale Intercorrelations (Mid-Level Manager Sample)
** p<.01
Flexibility Speed Experimenting Performance Risk-Taking
Interpersonal Risk-Taking Collaborating Information
Gathering Feedback Seeking Reflecting
Flexibility
Speed .74** N=393
Experimenting .71** N=393
.60**
N=393
Performance Risk-Taking
.60** N=393
.47** N=393
.63**
N=393
Interpersonal Risk-Taking
.63** N=393
.51** N=393
.68**
N=393 .67**
N=393
Collaborating .72** N=393
.52**
N=393.69**
N=393 .67**
N=393 .72**
N=393
Information Gathering
.66** N=393
.57** N=393
.73**
N=393 .66**
N=393 .71**
N=393 .72**
N=393
Feedback Seeking
.46** N=393
.34** N=393
.55**
N=393 .56**
N=393 .67**
N=393 .59**
N=393 .58**
N=393
Reflecting .69** N=393
.53** N=393
.70**
N=393 .65**
N=393 .72**
N=393 .75**
N=393 .64**
N=393 .62**
N=393
dentified
as Senior Managers who manage other managers; .6% identified as Group Managers who manage Results
Technical Report: Burke Learning Agility Inventory™ v3.3 Page 18 September 2018
Table 3. Burke LAI Scale Intercorrelations (Online Convenience Sample)
** p<.01
Flexibility Speed Experimenting Performance Risk-Taking
Interpersonal Risk-Taking Collaborating Information
Gathering Feedback Seeking Reflecting
Flexibility
Speed .59** N=204
Experimenting .74** N=194
.57** N=194
Performance Risk-Taking
.68** N=193
.47** N=193
.65** N=193
Interpersonal Risk-Taking
.60** N=194
.50** N=194
.62** N=194
.59** N=193
Collaborating .68** N=194
.48** N=194
.58 ** N=194
.62** N=193
.51** N=194
Information Gathering
.66** N=194
.51** N=194
.59** N=194
.61** N=193
.50** N=194
.59** N=194
Feedback Seeking
.52** N=194
.40** N=194
.51** N=194
.55** N=193
.54** N=194
.56** N=194
.57** N=194
Reflecting .64** N=194
.50** N=194
.66** N=194
.52** N=193
.54** N=194
.55** N=194
.63** N=194
.55** N=194

Technical Report: Burke Learning Agility Inventory™ v3.3 Page 19 September 2018
Table 4. Burke LAI Scale Intercorrelations (Healthcare Sample)
** p<.01
Flexibility Speed Experimenting Performance Risk-Taking
Interpersonal Risk-Taking Collaborating Information
Gathering Feedback Seeking Reflecting
Flexibility
Speed .52** N=280
Experimenting .61** N=279
.53** N=279
Performance Risk-Taking
.62** N=280
.45** N=280
.60** N=279
Interpersonal Risk-Taking
.41** N=280
.29** N=280
.43** N=279
.41** N=280
Collaborating .56** N=280
.50** N=280
.47** N=280
.52** N=280
.39** N=280
Information Gathering
.40** N=280
.33** N=280
.37** N=279
.41** N=280
.24** N=280
.39** N=280
Feedback Seeking
.52** N=279
.29** N=279
.45** N=279
.58** N=279
.41** N=279
.48** N=279
.34** N=279
Reflecting .57** N=280
.43** N=280
.53** N=279
.48** N=280
.45** N=280
.46** N=280
.42** N=280
.39** N=279
Technical Report: Burke Learning Agility Inventory™ v3.3 Page 20 September 2018
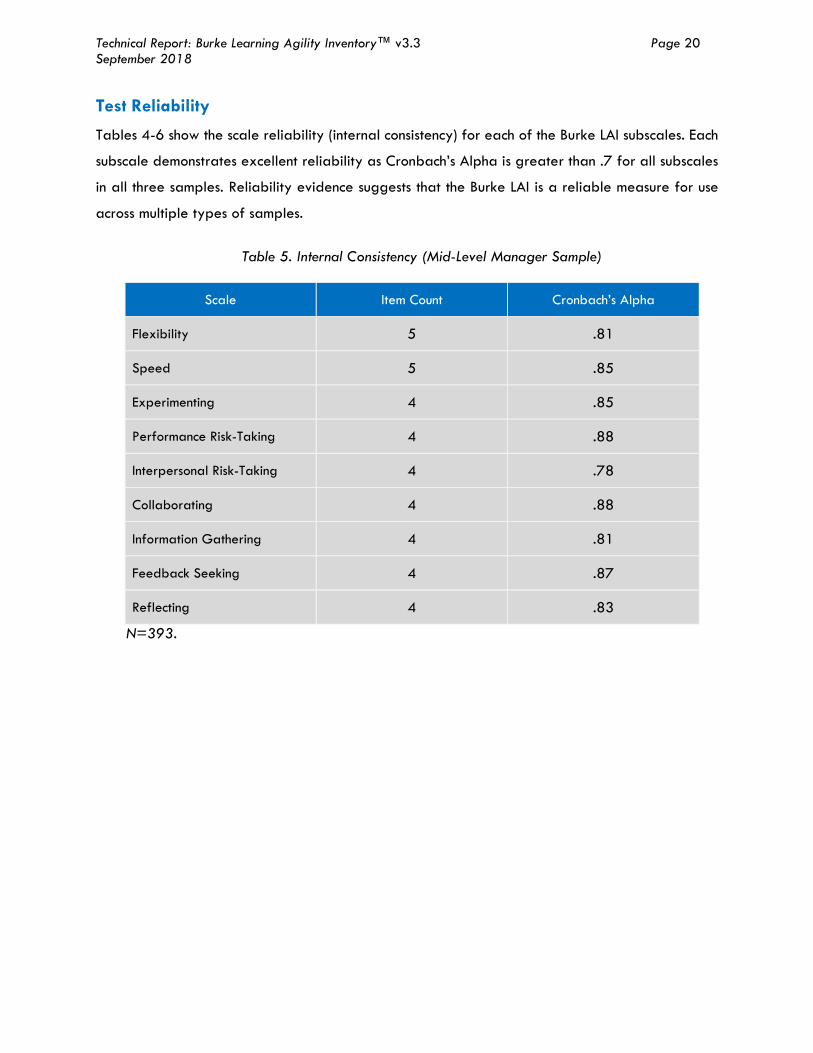
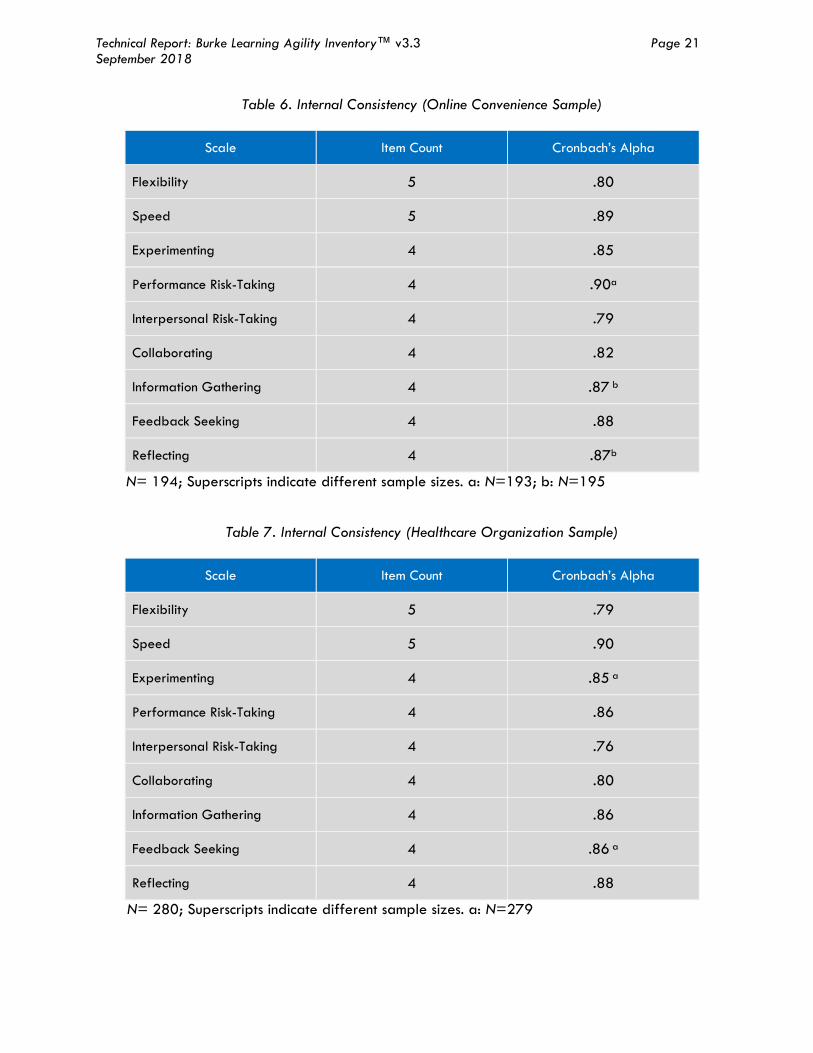
Test Reliability
Tables 4-6 show the scale reliability (internal consistency) for each of the Burke LAI subscales. Each
subscale demonstrates excellent reliability as Cronbach’s Alpha is greater than .7 for all subscales
in all three samples. Reliability evidence suggests that the Burke LAI is a reliable measure for use
across multiple types of samples.
Table 5. Internal Consistency (Mid-Level Manager Sample)
N=393.
Scale Item Count Cronbach’s Alpha
Flexibility 5 .81
Speed 5 .85
Experimenting 4 .85
Performance Risk-Taking 4 .88
Interpersonal Risk-Taking 4 .78
Collaborating 4 .88
Information Gathering 4 .81
Feedback Seeking 4 .87
Reflecting 4 .83
Technical Report: Burke Learning Agility Inventory™ v3.3 Page 21 September 2018
Table 6. Internal Consistency (Online Convenience Sample)
N= 194; Superscripts indicate different sample sizes. a: N=193; b: N=195
Table 7. Internal Consistency (Healthcare Organization Sample)
N= 280; Superscripts indicate different sample sizes. a: N=279
Scale Item Count Cronbach’s Alpha
Flexibility 5 .80
Speed 5 .89
Experimenting 4 .85
Performance Risk-Taking 4 .90a
Interpersonal Risk-Taking 4 .79
Collaborating 4 .82
Information Gathering 4 .87 b
Feedback Seeking 4 .88
Reflecting 4 .87b
Scale Item Count Cronbach’s Alpha
Flexibility 5 .79
Speed 5 .90
Experimenting 4 .85 a
Performance Risk-Taking 4 .86
Interpersonal Risk-Taking 4 .76
Collaborating 4 .80
Information Gathering 4 .86
Feedback Seeking 4 .86 a
Reflecting 4 .88
Technical Report: Burke Learning Agility Inventory™ v3.3 Page 22 September 2018
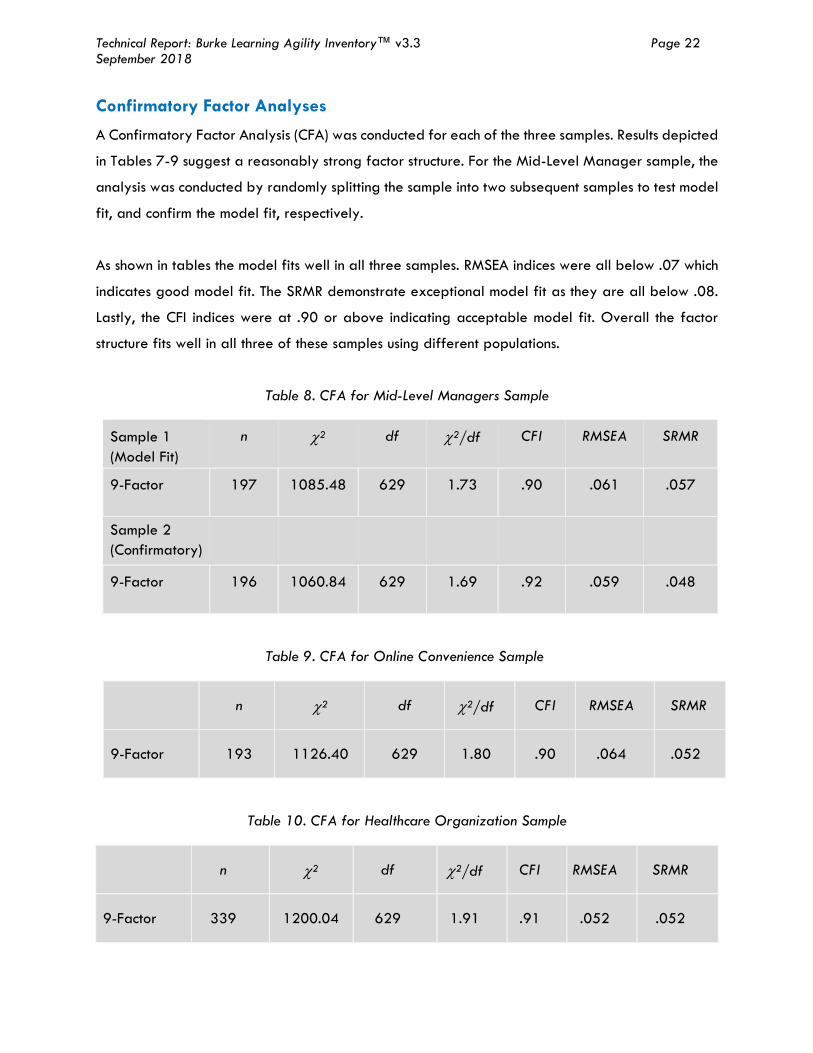
Confirmatory Factor Analyses
A Confirmatory Factor Analysis (CFA) was conducted for each of the three samples. Results depicted
in Tables 7-9 suggest a reasonably strong factor structure. For the Mid-Level Manager sample, the
analysis was conducted by randomly splitting the sample into two subsequent samples to test model
fit, and confirm the model fit, respectively.
As shown in tables the model fits well in all three samples. RMSEA indices were all below .07 which
indicates good model fit. The SRMR demonstrate exceptional model fit as they are all below .08.
Lastly, the CFI indices were at .90 or above indicating acceptable model fit. Overall the factor
structure fits well in all three of these samples using different populations.
Table 8. CFA for Mid-Level Managers Sample
Sample 1 (Model Fit)
n χ2 df χ2/df CFI RMSEA SRMR
9-Factor 197 1085.48 629 1.73 .90 .061 .057
Sample 2 (Confirmatory)
9-Factor 196 1060.84 629 1.69 .92 .059 .048
Table 9. CFA for Online Convenience Sample
n χ2 df χ2/df CFI RMSEA SRMR
9-Factor 193 1126.40 629 1.80 .90 .064 .052
Table 10. CFA for Healthcare Organization Sample
n χ2 df χ2/df CFI RMSEA SRMR
9-Factor 339 1200.04 629 1.91 .91 .052 .052

Technical Report: Burke Learning Agility Inventory™ v3.3 Page 23 September 2018
Construct Validity
After establishing that the Burke LAI reliably measures nine independent factors, it was necessary
to ensure that the instrument actually measures what it is intended to measure - learning agility.
Therefore, two types of correlation analyses were run -- convergent correlational analyses, which
test for relationships between the Burke LAI and theoretically similar constructs; and discriminant
correlational analyses, which tests constructs that are believed to be unrelated to the Burke LAI.
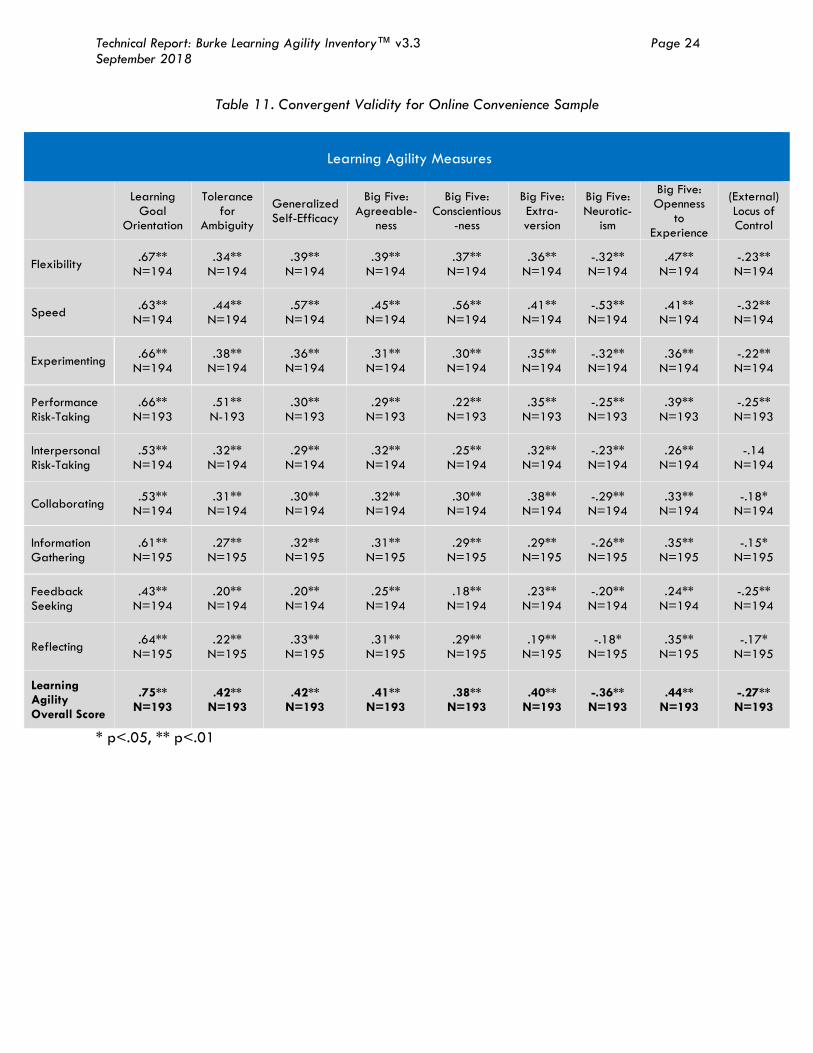
Convergent Validity. A total of nine cognitive, behavioral, and personality measures were tested
for convergent validity (Learning Goal Orientation, Tolerance for Ambiguity, Generalized Self-
Efficacy, The Big Five, and (External) Locus of Control) among the Online Convenience and Health
Care Organization samples. These measures were selected based on theoretical research
suggesting that there would likely be overlap among constructs.
Review of correlation matrices for convergent validity demonstrates that the nine dimensions of
learning agility correlate significantly, in the expected direction, with 9 of the 10 cognitive,
behavioral, and personality measures with which learn agility dimensions are expected to be
correlated supporting the BLAI’s construct validity. Furthermore, learning goal orientation, the
construct most similar to learning agility demonstrates the highest correlation with overall learning
agility and its dimensions, while more moderate correlations are observed with all the less similar
constructs. While external Locus of Control demonstrated significant negative correlations, there
was no significant correlation with Interpersonal Risk-Taking. Nevertheless, the data show that an
external locus of control is negatively correlated with Learning Agility as expected. This pattern of
results is expected and supports the construct validity of the Burke LAI.
Technical Report: Burke Learning Agility Inventory™ v3.3 Page 24 September 2018
Table 11. Convergent Validity for Online Convenience Sample
Learning Agility Measures
Learning
Goal Orientation
Tolerance for
Ambiguity
Generalized Self-Efficacy
Big Five: Agreeable-
ness
Big Five: Conscientious
-ness
Big Five: Extra-version
Big Five: Neurotic-
ism
Big Five: Openness
to Experience
(External) Locus of Control
Flexibility .67** N=194
.34** N=194
.39** N=194
.39** N=194
.37** N=194
.36** N=194
-.32** N=194
.47** N=194
-.23** N=194
Speed .63** N=194
.44** N=194
.57** N=194
.45** N=194
.56** N=194
.41** N=194
-.53** N=194
.41** N=194
-.32** N=194
Experimenting .66** N=194
.38** N=194
.36** N=194
.31** N=194
.30** N=194
.35** N=194
-.32** N=194
.36** N=194
-.22** N=194
Performance Risk-Taking
.66** N=193
.51** N-193
.30** N=193
.29** N=193
.22** N=193
.35** N=193
-.25** N=193
.39** N=193
-.25** N=193
Interpersonal Risk-Taking
.53** N=194
.32** N=194
.29** N=194
.32** N=194
.25** N=194
.32** N=194
-.23** N=194
.26** N=194
-.14 N=194
Collaborating
.53** N=194
.31** N=194
.30** N=194
.32** N=194
.30** N=194
.38** N=194
-.29** N=194
.33** N=194
-.18* N=194
Information Gathering
.61** N=195
.27** N=195
.32** N=195
.31** N=195
.29** N=195
.29** N=195
-.26** N=195
.35** N=195
-.15* N=195
Feedback Seeking
.43** N=194
.20** N=194
.20** N=194
.25** N=194
.18** N=194
.23** N=194
-.20** N=194
.24** N=194
-.25** N=194
Reflecting .64** N=195
.22** N=195
.33** N=195
.31** N=195
.29** N=195
.19** N=195
-.18* N=195
.35** N=195
-.17* N=195
Learning Agility Overall Score
.75** N=193
.42** N=193
.42** N=193
.41** N=193
.38** N=193
.40** N=193
-.36** N=193
.44** N=193
-.27** N=193
* p<.05, ** p<.01

Technical Report: Burke Learning Agility Inventory™ v3.3 Page 25 September 2018
Table 12. Convergent Validity for Healthcare Sample
Learning Agility Measures
Resistance to Change Learning Goal Orientation
Flexibility -.28** N=208
.47** N=280
Speed -.38** N=208
.47** N=280
Experimenting -.31** N=207
.33** N=280
Performance Risk-Taking -.32** N=208
.39** N=280
Interpersonal Risk-Taking -.24** N=208
.27** N=280
Collaborating
-.26** N=208
.37** N=280
Information Gathering -.21** N=208
.46** N=280
Feedback Seeking -.17* N=207
.28** N=279
Reflecting -.24** N=208
.43** N=280
Learning Agility Overall Score
-.37** N=207
.53** N=279
* p<.05, ** p<.01
Discriminant Validity. Measures that were not expected to correlate with Learning Agility and its
subscales were also incorporated to help establish that Learning Agility is a unique construct. The
measures included Risk Aversion and Reactance. Overall learning agility had significant negative
correlations with both Risk Aversion and Reactance; these correlations were rather small, showing a
weak negative relation with learning agility.

Technical Report: Burke Learning Agility Inventory™ v3.3 Page 26 September 2018
Risk Aversion. Correlations with Risk Aversion also showed discriminant validity as the correlations
tended to be nonsignificant or small. The three exceptions being Performance Risk-Taking,
Experimenting and Collaborating. However, this is expected as those who are risk averse are less
likely to risk their performance, experiment with new things and extend themselves to collaborate
with others. There is a significant correlation with Learning Agility Overall Score and Risk Aversion
because this score includes the items from Performance Risk-Taking, Experimenting and
Collaborating, which are negatively correlated with Risk Aversion, thus resulting in a negative
correlation for Learning Agility Overall Score and Risk Aversion. It is important to note that this
correlation is of a smaller magnitude than those found for both Performance Risk Taking and
Experimenting. Overall these data support the Burke LAI’s discriminant validity.
Table 13. Discriminant Validity for Online Convenience Sample
Learning Agility Dimensions Risk Aversion
Flexibility -.14* N=194
Speed -.13 N=194
Experimenting -.23** N=194
Performance Risk-Taking -.38** N=193
Interpersonal Risk-Taking -.07 N=194
Collaborating
-.20** N=194
Information Gathering -.14 N=195
Feedback Seeking -.08 N=194
Reflecting -.11 N=195
Learning Agility Overall Score
-.21** N=193
* p<.05, ** p<.01

Technical Report: Burke Learning Agility Inventory™ v3.3 Page 27 September 2018
Reactance. Correlations with Reactance also showed discriminant validity as the correlations tended to be nonsignificant or small.
Table 14. Discriminant Validity for Healthcare Organization Sample
Learning Agility Dimensions Reactance
Flexibility -.11 N=210
Speed -.19** N=210
Experimenting -.09 N=209
Performance Risk-Taking -.01 N=210
Interpersonal Risk-Taking -.05 N=210
Collaborating -.11 N=210
Information Gathering -.14* N=210
Feedback Seeking .-.08 N=209
Reflecting -.11 N=210
Learning Agility Overall Score
-.14* N=209
*p<.05, ** p<.01
Technical Report: Burke Learning Agility Inventory™ v3.3 Page 28 September 2018
Criterion Validity
In terms of criterion-related validity, a study performed on a sample of 130 candidates for
executive-level positions in the wealth management industry found a positive correlation of .42
(p<.05) between self-rated learning agility scores and a rating of the probability of success in an
executive-level position – as evaluated by an executive recruitment firm – (Burke, Roloff, and
Mitchinson, 2016). This indicates initial support for a relationship between learning agility and
high-level performance in executive leadership roles.
A second study conducted in 2017 examines the Burke LAI in relation to performance measures.
Data were collected from a major midwestern healthcare organization whose employees completed
the Burke LAI as a part of a leadership development program. The sample was comprised of mid-
level and senior leaders at the organization. Burke LAI data were collected over a five-month
period (October, 2016 – February, 2017). Performance data were collected from participants’
supervisors in March of 2017. This resulted in 74 participants with ratings on both the Burke LAI and
supervisor ratings of performance. The sample included 64.9% Female (n = 48) and 35.1% Male
(n = 26). The sample was 89.2% White (n = 66), 6.8% Asian (n = 5), 2.7% African American (n =
2), and 1.4% Hispanic (n = 1).
Performance was measured using an 8-Item measure that was completed by each participant’s
supervisor. The eight items included the dimensions of performance, transformation leadership,
results orientation, continuous learning, financial and operational performance, service orientation,
service quality, drives or enables growth and overall performance. See appendix 1 for definitions
of performance dimensions.
Pearson correlation analyses were conducted to determine the relationship of the Burke LAI to
performance outcomes. Our findings demonstrate “Overall Score” on the Burke LAI correlates with
the performance measure “Results Orientation” (driving aggressive goals to strategic targets) for
mid-level and senior leaders (r = .31 p < .01 N = 74). Similarly, the Overall Burke LAI score
correlates with “Drives or Enables Growth” (r = .25 p < .05 N = 74). The Burke LAI is made up of
nine dimensions. Seven of the nine dimensions correlated with at least one of the eight leadership
attributes used to evaluate leadership success (correlations ranged from r = .23 to .39; p < .05 to
p < .01; n = 74). “Information Gathering” and “Feedback Seeking” correlated with “Continuous
Learning” (r = .31, p < .01; r = .36, p < .01; respectively). “Speed” was shown to be one of the
more robust correlates of performance outcomes, correlating with “Results Orientation”, “Service

Technical Report: Burke Learning Agility Inventory™ v3.3 Page 29 September 2018
Quality”, “Drives or Enables Growth” and “Overall Performance” (r = .39, p < .01; r = .24, p <
.05; r = .26, p < .05; r = .27, p < .05; respectively). “Performance Risk Taking”, “Interpersonal
Risk Taking”, and “Collaborating” also correlated with “Results Orientation” (r = .23, p < .05; r =
.24, p < .05; r = .33, p < .01; respectively). “Experimenting” correlated with “Drives or Enables
Growth” (r = .28 p < .05 N = 74).
Results indicated that neither “Flexibility” or “Reflecting” predicted any of the performance
outcomes.
Table 15. Criterion Validity Table
Learning Agility Measures
Performance Measures
Transformational Leadership
Results Orientation
Continuous Learning
Financial and
Operational Performance
Service Orientation
Service Quality
Drives or
Enables Growth
Overall Performance
Flexibility -.13 N=74
.18 N=74
.03 N=74
-.14 N=73
.01 N=74
-.04 N=74
.14 N=73
-.02 N=74
Speed .07 N=74
.39** N=74
.20 N=74
.06 N=73
.20 N=74
.24* N=74
.26* N=73
.27* N=74
Experimenting .00 N=74
.21 N=74
.05 N=74
.01 N=73
.15 N=74
.19 N=74
.28* N=73
.09 N=74
Performance Risk-Taking
-.01 N=74
.23* N=74
.08 N=74
-.06 N=73
.10 N=74
.13 N=74
.17 N=73
.03 N=74
Interpersonal Risk-Taking
-.04 N=74
.24* N=74
-.03 N=74
.03 N=73
.12 N=74
.03 N=74
.19 N=73
.08 N=74
Collaborating
-.01 N=74
.33** N=74
.14 N=74
-.08 N=73
.01 N=74
.03 N=74
.18 N=73
.04 N=74
Information Gathering
-.02 N=74
.21 N=74
.31** N=74
.18 N=73
.11 N=74
.09 N=74
.21 N=73
.21 N=74
Feedback Seeking
.13 N=74
.20 N=74
.36** N=74
-.07 N=73
.24* N=74
.16 N=74
.20 N=73
.19 N=74
Reflecting -.20 N=74
.05 N=74
.13 N=74
-.22 N=73
-.10 N=74
-.02 N=74
-.09 N=73
-.13 N=74
Learning Agility Overall Score
-.02 N=74
.31** N=74
.20 N=74
-.04 N=73
.15 N=74
.12 N=74
.25* N=73
.13 N=74
* p < .05 ** p < .01
Technical Report: Burke Learning Agility Inventory™ v3.3 Page 30 September 2018
This review of relevant literature positions learning agility as a multifaceted concept, as
demonstrated by a range of behaviors that broadly allow individuals to seek out, manage,
understand, and ultimately learn from new and challenging experiences. This review suggests that
learning agile individuals display an enthusiasm for learning, proactively seeking out challenges,
new experiences and feedback from others. Further, an individual must also be able to effectively
take in and process relevant information, integrating new ideas with previous perspectives,
reflecting on new insights, generating multiple solutions to problems based on data, and
experimenting with new ways of doing things. Finally, in order for this learning to be possible, an
individual must be able to effectively manage the situation at hand, creating conditions that will
allow learning to occur. Such individuals will persist even when outcomes are unclear, remain calm
when faced with challenging situations, stay positive when confronted with failure and ultimately
perform well under new conditions.
Points for Discussion
As noted earlier agile learners shape their environments in a manner that produces opportunities
for learning. But how do they accomplish this? Buss (1987; 2009) has suggested three ways people
can affect their own environments – evocation, selection, and behavioral manipulation.
Evocation: The simple presence of an individual in a social setting shapes their environment. As our
lay psychologist, Woody Allan, has said, 80% of success in life is merely “showing up.” But showing
up in what way? Tall men evoke different reactions from others than short men do. Women evoke
different reactions than men. These different evocations can aid learning by paying attention to
others’ reaction and how these behaviors provide information that might be useful for learning, for
example, a tall man putting people at ease rather than intimidating them so that they will be more
forthcoming and say things they might not otherwise say. This greater openness from others can
provide, particularly for those in leadership positions, useful information for actions to take that will
lead to new and different situations to learn further from….and the cycle can continue.
Summary

Technical Report: Burke Learning Agility Inventory™ v3.3 Page 31 September 2018
Selection: We make choices all of the time and enter one situation or environment rather than
another. Choosing to place ourselves in a new environment, requiring different behavior on our
part, can provide a rich opportunity for learning. From the standpoint of learning being passive
about potential choices is not likely to enhance one’s agility. Key to this enhancement is actively
making selections that will provide new opportunities for learning rather than continuing with the
“tried and true” for oneself.
Manipulation: There are times, of course, when we do not seem to have a choice and we are stuck
with the situation we find ourselves in. Yet we can influence our environment. The positive psychology
literature is filled with examples. Other examples come from the literature on the self-fulfilling
prophesy, that is, holding certain expectations one can behave in a manner that elicit from others
the behaviors that will confirm those expectations. If opportunities for learning do not appear to be
available, the learning agile person will create them. Simple examples include changing one’s work
schedule, meeting new people, attending conferences, initiating teamwork, and finding time to
reflect are just a few examples.
To this list of three ways to affect one’s environment, Kihlstrom (2013) has added a fourth.
Cognitive transformation: The three that Buss has defined refer to changing the environment via overt
behaviors. Kihlstrom’s fourth way is covert rather than overt, that is, changing one’s subjective
environment. “Through cognitive transformations, people can change their internal mental
representations of the external physical and social environment – perceiving it differently,
categorizing it differently, giving it a different meaning than before. In cognitive transformation,
the objective features of the environment remain intact…[instead] the cognitive transformation has
altered the environment for that person only (Kihlstorm, 2013) For the learning agile person time
for reflecting provides opportunities to learn from cognitive transformations.
Technical Report: Burke Learning Agility Inventory™ v3.3 Page 32 September 2018
Allport, F. H. (1962). A structuronomic conception of behavior: Individual and collective: I. Structural theory and the master problem of social psychology. Journal of Abnormal and Social Psychology, 64, 3-30.
Allport, G. W. (1937). Personality: A psychological interpretation. New York: Holt, Rinehart & Winston.
Ames, C., & Archer, J., (1988). Achievement goals in the classroom: Students’ learning strategies and motivation process. Journal of Educational Psychology, 80(3).
Bennis, W. G., & Thomas, R. J. (2007). Leading for a lifetime: How defining moments shape the leaders of today and tomorrow (p. 1). Boston, MA: Harvard Business School Press.
Burke, W. W., Roloff, K. S., & Mitchinson, A. (2016). Learning Agility: A New Model and Measure.
White Paper. Teachers College, Columbia University.
Buss, D. M. (1987). Selection, evocation, and manipulation. Journal of Personality and Social Psychology, 53, 1214-1221.
Buss, D. M. (2009). An evolutionary formulation of personality interactions. Journal of Research in Personality, 43, 241-242.
Campbell, J. P., McCloy, R. A., Oppler, S. H., & Sager, C. E. (1993). A theory of performance. In N. Schmitt & W. C. Borman (Eds.), Personnel selection in organizations (pp. 35-70). San Francisco: Jossey-Bass.
Chambers, E. G., Foulon, M., Handfield-Jones, H., Hankin, S. M., & Michaels, E. G. (1998). The war for talent. The McKinsey Quarterly, 1, 1-8.
Day, D. V. (2010). The difficulties of learning from experience and the need for deliberate practice. Industrial and Organizational Psychology, 3(1), 41-44.
De Meuse, K. P., Dai, G., & Hallenbeck, G. S. (2010). Learning agility: A construct whose time has come. Consulting Psychology Journal: Practice and Research, 62(2), 119-130. doi: 10.1037/a0019988.
DeRue, D.S., Ashford, S.J., & Myers, C.G. (2012). Learning agility: In search of conceptual clarity and theoretical grounding. Industrial and Organizational Psychology: Perspectives on Science and Practice, 5 (3), 258-279.
Dweck, C. S. (1986). Motivational processes affecting learning. American Psychologist, 41, 1040-1048.
References

Technical Report: Burke Learning Agility Inventory™ v3.3 Page 33 September 2018
Dweck, C. S. & Leggett, E. L. (1988). A social-cognitive approach to motivation and personality. Psychological Review, 95, 256-273.
Eichinger, R. W., & Lombardo, M. M. (2004). Learning agility as a prime indicator of potential. Human Resource Planning, 27 (4), 12.
Elliot, A. J., & Dweck, C. S (1988). Goals: An approach to motivation and achievement. Journal of Personality and Social Psychology, 54, 5-12.
Finkelstein, S. (2003). Why smart executives fail. New York: Portfolio.
Hogan, J., Hogan, R., & Kaiser, R. B. (2009). Management derailment: Personality assessment and mitigation. American Psychological Association Handbook of Industrial and Organizational Psychology. Washington, DC: American Psychological Association.
Hogan, R., Curphy, G. J., & Hogan, J. (1994). What we know about leadership: Effectiveness and personality. American psychologist, 49(6), 493.
Hooijberg, R., Hunt, J. G., & Dodge, G. E. (1997). Leadership complexity and the leaderplex model. Journal of Management, 23, 375-408.
Kihlstrom, J. F. (2013). The person – situation interaction. In D. E. Carlston (Ed.), Oxford handbook of social cognition (pp. 786-805). New York: Oxford University Press.
Kolb, D. A. (1984) Experiential learning, Englewood Cliffs, NJ.: Prentice Hall.
Kroll, M. D. (1988). Motivational orientations, views about the purpose of education, and intellectual styles. Psychology in the Schools, 25, 338-343.
Lewin, Kurt (1936). Principles of Topological Psychology. New York: McGraw-Hill.
Lindsey, E. H., Homes, V., & McCall, M.W. (1987). Key events in executives’ lives. Greensboro, NC: Center for Creative Leadership.
Lombardo, M. M., & Eichinger, R. W. (2000). High potentials as high learners. Human Resource Management, 39 (4), 321-329.
McCall, M. W. (2010). Recasting leadership development. Industrial and Organizational Psychology, 3(1), 3-19.
McCall, M. W., Jr., & Hollenbeck, G. P. (2002b). Global fatalities: When international executives derail. Ivey Business Journal, 66, 74–78
Morrison, R. F., & Brantner, T. M. (1992). What enhances or inhibits learning a new job? A basic career issue. Journal of Applied Psychology, 77(6), 926.
Pulakos, E. D., Arad, S., Donovan, M. A., & Plamondon, K. E. (2000). Adaptability in the workplace: development of a taxonomy of adaptive performance. Journal of Applied Psychology, 85(4), 612-624.
Technical Report: Burke Learning Agility Inventory™ v3.3 Page 34 September 2018
Saucier, G., 1994. Mini-Markers: A brief version of Goldberg's unipolar big-five markers. Journal of Personality Assessment, 63, 506–516.
Spreitzer, G. M., McCall, M.W., & Mahoney, J. D. (1997). Early identification of international executive potential. Journal of Applied Psychology, 82, 6–29.
Vandewalle, D. (1997). Development and validation of a work domain goal orientation instrument. Educational and Psychological Measurement, 57(6), 995-1015.
Vandewalle, D. (2001). Goal orientation: Why wanting to look successful doesn’t always lead to success. Organizational Dynamics, 30, 162–171.

Technical Report: Burke Learning Agility Inventory™ v3.3 Page 35 September 2018
American Psychological Association, American Educational Research Association, & National Council on Measurement in Education (Joint Committee). (2014). Standards for Educational and Psychological Testing.
Criterion Validity Performance Measure
The following are the items on which supervisors rated participants in the criterion validity study.Each item was rated on the following scale and the following instructions were provided.
RATING SCALE
Please familiarize yourself with the following rating scale and use it to evaluate the person being rated on the leadership dimensions listed below. Review and apply this rating scale closely; it is a non-traditional format used to distinguish among higher performers.
Please avoid any natural tendencies to use mostly “middle of the line” ratings. For example, if you are trying to decide between a “6” or “7,” you are encouraged to choose “7.” If you are trying to decide between a “3” or “2”, you are encouraged to choose “2.”
7 – GREATLY EXCEEDS EXPECTATIONS | Delivers performance that consistently exceeds and often far exceeds performance expectations and goals – delivers performance in this area greater than 90% of all others in comparable levels/roles at the Company.
6 –
5 –
4 – MEETS EXPECTATIONS | Consistently performs in a manner which meets the Company standard performance expectations and meets challenging goals which are set to exceed company targets – delivers performance in this area greater than 50% of all others in comparable levels/roles at the Company.
3 –
2 –
1 – DOES NOT CONSISTENTLY MEET EXPECTATIONS | Does not consistently meet performance expectations and may fall short of one or more critical performance goals.
DK – DON'T KNOW | I do not have enough information on this person to offer a rating on this item.
Appendix
Technical Report: Burke Learning Agility Inventory™ v3.3 Page 36 September 2018
Technical Report: Burke Learning Agility Inventory™ v3.3 Page 37 September 2018
RATING ITEMS
1. TRANSFORMATIONAL LEADERSHIP: Uses influence rather than direct/coercive power to build teams and gain desired results. Holds self and others to high standards. Constructively initiates and manages change.
2. RESULTS ORIENTATION: Drives performance and accountability by setting aggressive goals. Challenges team members to focus energy and resources onto key metrics and strategic targets.
3. CONTINUOUS LEARNING: Sees change as a valuable tool to success. Puts effort into acquiring information relevant to the success of the Company. Is open to trial and error approaches.
4. FINANCIAL AND OPERATIONAL PERFORMANCE: Allocates financial and human resources to achieve business goals and makes changes, as needed, to ensure long-term success for the Company.
5. SERVICE ORIENTATION: Drives others to prioritize service excellence and create the best experience for those we serve and our employees. Uses service metrics and aggressive goals to drive improvement.
6. SERVICE QUALITY: Drives team focus onto exceeding targets for service quality. Coordinates service delivery and accountability to create break-through performance or improvement in quality outcomes.
7. DRIVES OR ENABLES GROWTH: Anticipates organizational challenges and continuously changes approaches to optimize the use of resources in order to serve more markets, customers, and/or employees.
8. OVERALL PERFORMANCE RATING: Please provide a rating based on the person’s overall performance in his/her current role.