bus vignette - bioconductor - home · bus vignette yin jin, hesen peng, lei wang, ra aele fronza,...
TRANSCRIPT

BUS Vignette
Yin Jin, Hesen Peng, Lei Wang, Raffaele Fronza, Yuanhua Liu and Christine Nardini
1 Introduction
GOAL: The BUS package allows the computation of two types of similarities (correlation [Sokal, 2003] andmutual information [Cover, 2001]) for two different goals: (i) identification of the similarity among the activity ofmolecules sampled across different experiments (we name this option Unsupervised, U), (ii) identification of thesimilarity between such molecules and other types of information (clinical, anagraphical, etc, we name this optionsupervised, S).
Unsupervised Option. The computation applies to data in tabular form (MxN) where rows representsdifferent molecules (M), columns represents experiments or samples (N) and the content of the tables’ cells theabundance of the molecule in the sample. Microarray experiments are the data of choice for this application, butthe method can be applied to any data in the appropriate format (miRNA arrays, RNA-seq data, etc.). Theresults are in the form of an MxM adjacency matrix, where each cell represents the association computed amongthe corresponding molecules. This matrix has associated also a p-value matrix and a corrected p-value matrix (seebelow for details). Based on the cutoff selected, the adjacency matrix can be trimmed and lead to a predictednetwork of statistically significant interactions (pred.network). This output can be used as-is to represent agene association network ([Margolin, 2004, Basso, 2005]), or can be further elaborated to cluster genes based ona shared degree of similarity (hence the Unsupervised label). Mutual information (from now on MI) is computedusing the minet package [Meyer, 2008], all the options can be found in the corresponding vignette. Here argumentnet.trim decides which function (mrnet/clr/aracne) in MINET package is used to give the similarity based onmutual information matrix. Correlation is computed using the R built-in cor function.
Supervised Option. For the S option a second dataset is necessary, a TxN table, where T represents thenumber of external traits of interest. The result is an association MxT table where each cell indicates the associationbetween the molecule and the external trait. Mutual information is computed according to the empirical methodproposed in MINET package. It is implemented with a external c function. This matrix has associated also ap-value matrix and a corrected p-value matrix (see below for details). As this can be used to associate samples toclinical classes we call this option Supervised (this type of approach was used in [Diehn, 2008]).
Statistical Significance. The package offers the possibility to evaluate the statistical significance of thecomputed similarity measures in two steps, a summary of the options is given in Table 1.
Optionp-value
single multipleρ MI MI
SExact beta distribution
permutations (3 options)U permutations
Table 1. Summary of the available options for statistical validation in BUS. ρ indicates correlation.
First, it allows the computation of the ”single” p-value, i.e. the p-value relevant for the assessment of thestatistical significance of the similarity of a given gene as if it was the only one tested.
For correlation this relies on the R built-in cor.test and it then computes the exact p-value.
1

For MI it is obtained from permutations and this method estimates the extreme p-values (close to 0) by fitting
a beta distribution, whose analytical expression is obtained by the estimate of 2 shape parameters (α̂ and β̂) usingthe method of the moments.
Second, for the p-value of MI, correction for multiple hypothesis testing is computed based on permutations. 3types of corrections are offered:
� S analysis option method.permut = 1 correction for multiple traits tested
� S analysis option method.permut = 2 correction for multiple genes tested
� S analysis option method.permut = 3 correction for both traits and genes
Missing Data Treatment. Data are pre-processed to cope with missing information (both in the MxN andin the TxN table) using (smooth) bootstrapping [Silverman, 1987].
The main function BUS has arguments for:
� the type of analysis (supervised/unsupervised)
� the distance metric (correlation/MI)
� the correction types for statistical significance on multiple hypothesis testing based on permutations (genes,traits or both)
Expected computation times. In the unsupervised case, the anticipated time for a 50*12 matrix (geneexpression data) is 30 seconds when running on an ordinary personal computer (with 1G memory). While in thesupervised case, with 50*12 gene expression data and trait data involved, it is 2 minute when correction of bothgenes and traits is considered.
The functions’ dependencies scheme of the BUS package is illustrated below.
Figure 1. functions scheme
Functions DescriptionBUS: A wrapper function to compute (i) the similarity matrix (using correlation/MI as metric) and the single
p-value matrix (each element is the p-value under the null hypothesis that the related row gene and column gene
2
have no interaction), corrected p-values matrix (different levels of dependency are considered) and the predictednetwork matrix (predicted gene network, this output is effective for option U)
gene.similarity: Function for the computation of the adjacency matrix in the Unsupervised option (usingcorrelation/MI as metric)
gene.trait.similarity: Function for the computation of the similarity matrix in the Supervised option (usingcorrelation/MI as metric)
gene.pvalue: Function for the computation of the p-value matrix for the Unsupervised option. Single p-value(each element is the p-value under the null hypothesis that the related row gene and column gene have no inter-action) is computed thanks to: (i) for MI the distribution identified by the P permutation values identified foreach gene, with extreme p-values computed fitting a beta distribution; for correlation using the exact distributionprovided by the built-in R cor function (single.perm.p.value). Corrected p-value is computed thanks to the distri-bution identified by the p permutation values across all genes (multi.perm.p.value). When correlation is used asmatric, only exact p-value is output.
gene.trait.pvalue: Function for the computation of the p-value matrix for the Supervised option. Singlep-value (each element is the p-value under the null hypothesis that the related row gene and column trait have nointeraction) is computed thanks to: (i) for MI the distribution identified by the P permutation values identified foreach gene, with extreme p-values computed fitting a beta distribution; for correlation using the exact distributionprovided by the built-in R cor function (single.perm.p.value). Corrected p-value is computed thanks to thedistribution identified by the P permutation values across all genes (multi.perm.p.value); (ii) the distributionidentified by the P permutation values across all traits; (iii) the distribution identified by the P permutation valuesacross all genes and traits.
pred.network: Function to predict the network from the selected corrected p-value matrix, only for the Unsu-pervised option.
2 BUS Usage
> library(BUS)
> library(minet)
> data(copasi)
> mat=as.matrix(copasi)[1:5,]
> rownames(mat)<-paste("G",1:nrow(mat), sep="")
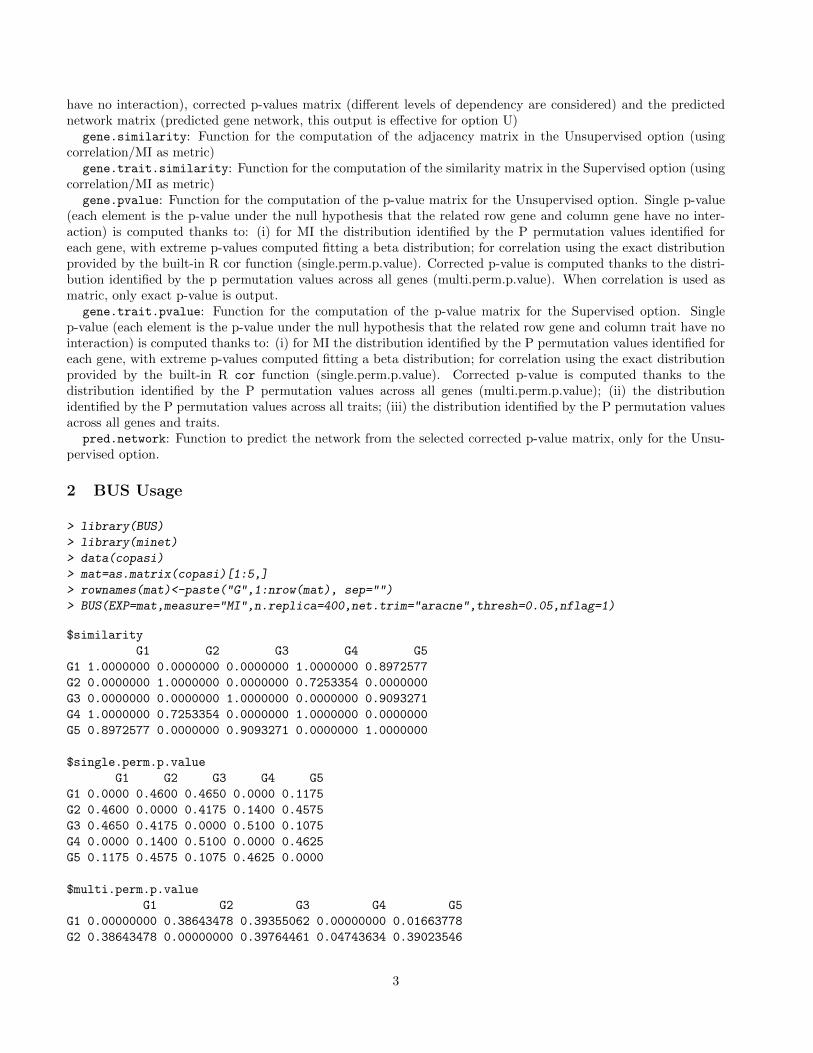
> BUS(EXP=mat,measure="MI",n.replica=400,net.trim="aracne",thresh=0.05,nflag=1)
$similarity
G1 G2 G3 G4 G5
G1 1.0000000 0.0000000 0.0000000 1.0000000 0.8972577
G2 0.0000000 1.0000000 0.0000000 0.7253354 0.0000000
G3 0.0000000 0.0000000 1.0000000 0.0000000 0.9093271
G4 1.0000000 0.7253354 0.0000000 1.0000000 0.0000000
G5 0.8972577 0.0000000 0.9093271 0.0000000 1.0000000
$single.perm.p.value
G1 G2 G3 G4 G5
G1 0.0000 0.4600 0.4650 0.0000 0.1175
G2 0.4600 0.0000 0.4175 0.1400 0.4575
G3 0.4650 0.4175 0.0000 0.5100 0.1075
G4 0.0000 0.1400 0.5100 0.0000 0.4625
G5 0.1175 0.4575 0.1075 0.4625 0.0000
$multi.perm.p.value
G1 G2 G3 G4 G5
G1 0.00000000 0.38643478 0.39355062 0.00000000 0.01663778
G2 0.38643478 0.00000000 0.39764461 0.04743634 0.39023546
3

G3 0.39355062 0.39764461 0.00000000 0.40611961 0.01622368
G4 0.00000000 0.04743634 0.40611961 0.00000000 0.39867918
G5 0.01663778 0.39023546 0.01622368 0.39867918 0.00000000
$net.pred.permut
G1 G2 G3 G4 G5
G1 1.0000000 0.0000000 0.0000000 1.0000000 0.8972577
G2 0.0000000 1.0000000 0.0000000 0.7253354 0.0000000
G3 0.0000000 0.0000000 1.0000000 0.0000000 0.9093271
G4 1.0000000 0.7253354 0.0000000 1.0000000 0.0000000
G5 0.8972577 0.0000000 0.9093271 0.0000000 1.0000000
The arguments to the BUS function here are
� EXP, a matrix for gene expression data.
� measure, metric used to calculate similarity. There are two choices, MI and corr. We use MI here, applyingthe MINET package to output the similarity matrix with option of aracne.
� method.permut, a flag to indicate which method is used to correct permutation p-values. Here a defaultvalue (2) is used.
� n.replica, number of permutations: default value is 400, for optimal precision in p-value computation.
� net.trim, method chosen to trim the network. Here aracne method is applied, where the least significantedge in each triplet is removed.
� threshold, threshold, according to which significant association between genes are selected to constructthe predicted network. This option is acutually used in function pred.network for predicted network fromp-value matrix.
� nflag, a flag for the type of analysis. If Supervised nflag=2, if Unsupervised nflag=1. Here an Unsupervisedoption is considered.
The copasi dataset is taken from Copasi2 (Complex Pathway Simulator), a software for simulation and analysisof biochemical networks. The system generates random artificial gene networks according to well-defined topo-logical and kinetic properties. These are used to run in silico experiments simulating real laboratory micro-arrayexperiments. Noise with controlled properties is added to the simulation results several times emulating mea-surement replicates, before expression ratios are calculated. This series consists of 150 artificial gene networks.Each network consists of 100 genes with a total of 200 gene interactions (on average each gene has 2 modulators).All networks are composed of genes with similar kinetics, the only difference between networks is how the geneinteractions are organized (i.e. which genes induce and repress which other genes). The networks belong to threemajor groups according to their topologies: RND stands for randomized network, SF for scale-free(many edgesamong few nodes) and SW for small world (edges exist between adjacent nodes). The data given in the packageis an RND data. Actually, only first of five rows in the gene expression data is used to calculate to save the spacehere.
Explain the results:
� similarity: the matrix for mutual information.
� single.perm.p.value: the single p-value matrix, i.e. the p-value matrix obtained by the simple purmutationmethod. We can see it is a 5*5 matrix here as we only use data for 5 genes.
� multi.perm.p.value: the corrected permutation p-value matrix, i.e. the p-value matrix obtained via cor-rected permutation method.
� net.pred.permut: the network predicted based on the corrected permutation p-value matrix. This networkis based on multi-hypothesis-corrected p-values.
4

This is an Unsupervised case. We could see that a lower values in single.perm.p.value/multi.perm.p.value
or a higher values in net.pred.permut indicate a strong link between the row and column genes. The value 0 inthe p-value matrix or 1 in network matrix respectively infers a strong link.
> data(tumors.mRNA)
> exp<- as.matrix(tumors.mRNA)[11:15,]
> rownames(exp)<-rownames(tumors.mRNA)[11:15]
> data(tumors.miRNA)
> trait<- as.matrix(tumors.miRNA)[11:15,]
> rownames(trait)<-rownames(tumors.miRNA)[11:15]
> BUS(EXP=exp,trait=trait,measure="MI",nflag=2)
$similarity
hsa-mir-132 hsa-mir-133a hsa-mir-135a
200017_at 0.0000000 0.0000000 0.2334554
200018_at 0.0000000 0.2334554 0.2334554
200022_at 1.0000000 0.0000000 0.2334554
200023_s_at 0.2334554 0.0000000 0.0000000
200024_at 1.0000000 0.2334554 0.2334554
hsa-mir-135b hsa-mir-139
200017_at 0.05920619 0.2334554
200018_at 0.05920619 0.0000000
200022_at 0.05920619 0.0000000
200023_s_at 0.05920619 0.0000000
200024_at 0.55920619 0.0000000
$single.perm.p.value
hsa-mir-132 hsa-mir-133a hsa-mir-135a
200017_at 0.5425 0.5650 0.2100
200018_at 0.5425 0.4100 0.1825
200022_at 0.0000 0.5325 0.3600
200023_s_at 0.1675 0.5800 0.5325
200024_at 0.0000 0.1775 0.3550
hsa-mir-135b hsa-mir-139
200017_at 0.4250 0.2100
200018_at 0.4225 0.5425
200022_at 0.4375 0.5700
200023_s_at 0.4100 0.5525
200024_at 0.0600 0.5375
$multi.perm.p.value
hsa-mir-132 hsa-mir-133a hsa-mir-135a
200017_at 0.5555 0.5620 0.1895
200018_at 0.5555 0.3695 0.1895
200022_at 0.0000 0.5620 0.3430
200023_s_at 0.1850 0.5620 0.5570
200024_at 0.0000 0.1885 0.3430
hsa-mir-135b hsa-mir-139
200017_at 0.4200 0.1760
200018_at 0.4200 0.5555
200022_at 0.4200 0.5555
200023_s_at 0.4200 0.5555
200024_at 0.0595 0.5555
Here is a Supervised case, we use the tumor dataset from [Liu, 2007], the mRNA data as gene expression data
5

and miRNA data as trait data. Gene expression data were obtained by microarray from human brain tumors,while miRNA data were obtained by RT-PCR. 12 brain tumors at different levels are analyzed for both mRNAand miRNA levels to study the correlation of any mRNA-miRNA pairs. Outputs are similar like that in theunsupervised case except the predicted network.
References
[Sokal, 2003] R.R.Sokal and F.J.Rohlf. Biometry. Freeman, New York, 2003.
[Cover, 2001] T. M. Cover and J. A. Thomas. Elements of Information Theory. John Wiley and Sons, 2001.
[Margolin, 2004] A. A. Margolin, I. Nemenman, K. Basso, U. Klein, C. Wiggins, G. Stolovitzky, R. Dalla. Favera,and A. Califano. Aracne: An algorithm for the reconstruction of gene regulatory networks in a mammaliancellular context, 2004.
[Basso, 2005] K. Basso, A. A. Margolin, G. Stolovitzky, U. Klein, R. Dalla-Favera, and A. Califano. Reverseengineering of regulatory networks in human b cells. Nat Genet, 37(4):382–390, Apr 2005.
[Meyer, 2008] P. E. Meyer, F Lafitte, and G. Bontempi. minet: A r/bioconductor package for inferring largetranscriptional networks using mutual information. BMC Bioinformatics, 9:461–461, 2008.
[Diehn, 2008] M. Diehn, C. Nardini, D. S. Wang, S. McGovern, M. Jayaraman, Y. Liang, K. Aldape, S. Cha, andM. D. Kuo. Identification of non-invasive imaging surrogates for brain tumor gene expression modules. Proc.Natl. Acad. Sci., 105(13):5213–5218, 2008.
[Silverman, 1987] B. W. Silverman and G. A. Young. The bootstrap: To smooth or not to smooth? Biometrika,74(3):469–479, 1987.
[Liu, 2007] T. Liu, T. Papagiannakopoulos, K. Puskar, S. Qi, F. Santiago, W. Clay, K. Lao, Y. Lee, S. F. Nelson,H. I. Kornblum, F. Doyle, L. Petzold, B. Shraiman, and K. S. Kosik. Detection of a microRNA signal in an invivo expression set of mRNAs. Plos One, 2(8): e804, 2007.
6