business index december 2015 - sensis® - marketing ... sensis business index december 2015 covers...
TRANSCRIPT

SensisBusiness Index December 2015A survey of confidence and behaviour of Australian small and medium businesses
Released 20 January 2016
OPEN
Join the conversation:
@sensis #SensisBiz
linkedin.com/company/sensis
www.sensis.com.au/SBI

Sensis Business Index | Small and medium businessesSensis Business Index | Small and medium businesses
Table of contentsIntroduction ...............................................................................................................................................................................................2
About the survey ........................................................................................................................................................................................................................................ 3
Foreword ......................................................................................................................................................................................................................................................4
Executive summary .................................................................................................................................................................................................................................... 5
SMB business cycle analysis .....................................................................................................................................................................................................................7
SBI snapshot ............................................................................................................................................................................................................................................... 8
Small and Medium Business Outlook – National Summary ................................................................................................................10
SMB confidence in their own business prospects over the next 12 months ....................................................................................................................................... 11
Confidence by state and territory, sector and size .................................................................................................................................................................................12
Perceptions of the economy ....................................................................................................................................................................................................................14
Expectations on key indicators for the next 12 months .......................................................................................................................................................................15
Concerns ....................................................................................................................................................................................................................................................16
Sales ...........................................................................................................................................................................................................................................................17
Employment ...............................................................................................................................................................................................................................................18
Wages bill ...................................................................................................................................................................................................................................................19
Prices .........................................................................................................................................................................................................................................................20
Capital expenditure ..................................................................................................................................................................................................................................21
Access to finance...................................................................................................................................................................................................................................... 22
Profitability................................................................................................................................................................................................................................................ 23
Exports ...................................................................................................................................................................................................................................................... 24
Government Policies ...............................................................................................................................................................................25
Government policies ................................................................................................................................................................................................................................ 26
Assessment of Federal Government policies ........................................................................................................................................................................................ 27
Assessment of state and territory government policies ......................................................................................................................................................................28
Small and Medium Business Outlook ...................................................................................................................................................29
National .....................................................................................................................................................................................................................................................30
New South Wales ......................................................................................................................................................................................................................................31
Victoria ...................................................................................................................................................................................................................................................... 32
Queensland ............................................................................................................................................................................................................................................... 33
South Australia ......................................................................................................................................................................................................................................... 34
Western Australia ..................................................................................................................................................................................................................................... 35
Tasmania ................................................................................................................................................................................................................................................... 36
Northern Territory ..................................................................................................................................................................................................................................... 37
Australian Capital Territory ......................................................................................................................................................................................................................38
Industry Snapshots .................................................................................................................................................................................39
Manufacturing ..........................................................................................................................................................................................................................................40
Building and Construction .......................................................................................................................................................................................................................40
Wholesale Trade ........................................................................................................................................................................................................................................41
Retail Trade ................................................................................................................................................................................................................................................41
Transport and Storage ............................................................................................................................................................................................................................. 42
Communication, Property and Business Services ................................................................................................................................................................................. 42
Finance and Insurance ............................................................................................................................................................................................................................. 43
Health and Community Services ............................................................................................................................................................................................................. 43
Cultural, Recreational and Personal Services ........................................................................................................................................................................................ 44
Hospitality (Accommodation, Cafes and Restaurants) ......................................................................................................................................................................... 44

Sensis Business Index | Introduction
2
1 3 42 5
IntroductionThe Sensis Business Index is a quarterly survey of Australia’s small and medium businesses (SMBs) which commenced in 1993 to measure and track:
• SMB business activity over the previous quarter.
• Expectations for the current quarter.
• Overall confidence among SMBs.
The Sensis Business Index samples SMBs nationally, enabling broad scrutiny of this market and relevant trends and issues. It examines differences by location, business size and industry. The aim is to reflect the attitudes and behaviour of SMBs, which comprise some 99% of Australian businesses.
Results are based on the responses of SMBs surveyed and reported as a net balance, which represents total positive responses minus total negative responses.
The Sensis Business Index is an initiative of Sensis as part of its commitment to this vital business sector. As Australia’s #1 marketing services company, we’re here to engage consumers with Australian businesses. We make this happen through a number of leading brands - Yellow Pages, White Pages, TrueLocal, Whereis and Skip and our expert digital know-how. Our digital expertise is what sets us apart - we give businesses a competitive edge through websites, search engine marketing and optimisation, data, and through our digital advertising agency, Found.

Sensis Business Index | Introduction
3
1 3 42 5
The Sensis Business Index December 2015 covers the period October to December. It is based on 1,001 telephone interviews conducted with small and medium business proprietors or managers, respectively employing less than 20 and 20-199 people.
This sample is drawn from metropolitan and major non-metropolitan regions throughout Australia, with targets set for location and industry as shown opposite. Interviewing was conducted from October 19 to November 23, 2015. TKW is responsible for sampling and fieldwork and Di Marzio Research for analysis and reporting.
Results for each survey are weighted so the sample is reflective of the total SMB population. Prior to 2015 the weighting was by selected ANZSIC (industry sector) divisions within the metropolitan and non-metropolitan region of each state and territory as per the Australian Bureau of Statistics (ABS) Business Register of June 1998. Now the weighting is also by industry, location and business size but based on the most current ABS data contained in the publication 8165.0 - Counts of Australian Businesses, including Entries and Exits, Jun 2009 to Jun 2013. Some adjustments to this weighting data were also made by Sensis to exclude firms with a turnover of under $50,000 per annum. These are primarily non-operating and/or non-employing firms.
This report covers experiences over the last quarter and expectations for the current quarter. It also covers expectations for the year ahead, which are only asked in the December quarter survey.
About the survey
Total Metro Regional
New South Wales 170 110 60
Victoria 170 110 60
Queensland 170 90 80
South Australia 125 90 35
Western Australia 125 89 36
Tasmania 80 40 40
Northern Territory 81 40 41
Australian Capital Territory 80 80 -
Total 1,001 649 352
Location of business
Industry sector
Business location
65% Metro
35% Regional
Manufacturing 105
Building and Construction 155
Wholesale Trade 75
Retail Trade 135
Hospitality (Accommodation, Cafes and Restaurants) 57
Transport and Storage 74
Finance and Insurance 66
Communication, Property and Business Services 170
Health and Community Services 79
Cultural, Recreational and Personal Services 85
Total Businesses 1,001
90% Small
(1-19 employees)
10% Medium
(20-199 employees)
Business size
OPEN OPEN

Sensis Business Index | Introduction
4
1 3 42 5
After a fairly flat 2015, Australian businesses ended the year on a high, posting the highest net confidence score for almost five years.
Sensis spoke to 1,000 Australian small and medium businesses for the latest Sensis Business Index survey, with the results showing more than three times as many businesses are now confident, as those who are concerned. Confidence went up everywhere except the Australian Capital Territory, with businesses more optimistic thanks to their specific business strengths, as well as healthy sales.
This was the first survey to be taken since Malcolm Turnbull took over from Tony Abbott and it is clear the new Prime Minister has had a positive impact on perceptions of the Government, as well as a halo effect on business confidence.
Despite being more confident in their own business prospects, perceptions of the economy continue to be negative with 86 percent of businesses still thinking the economy is either slowing or standing still. Looking ahead, however, there was an 11 point improvement in the expectations for the economy in 12 months’ time, with the net balance entering positive territory for the first time since December 2014.
Not unexpectedly, support for the Federal Government went up six points, with eight percent of businesses pointing to the new Prime Minister as a reason for their positive perceptions.
In the last survey Tasmania was the only region where support for the Federal Government went up, but in this survey the reverse was true with all states registering a positive uplift bar one. South Australia is now the most supportive of the Federal Government’s policies, with only Western Australia posting a negative net balance.
In the December quarter we also examine year ahead expectations for a range of indicators. With the exception of capital expenditure all of the other indicators are looking positive. These include sales, employment, wages, prices and profitability.
As we enter 2016 SMBs primary concern remains a lack of work or sales. This is also a growing barrier to businesses taking on new staff. Another concern is finding and retaining suitable staff with the right skills and training.
In terms of exports there has been little change in this area for the last 12 months and exports haven’t grown now for three years. Eleven percent of SMBs are currently exporting and only one percent of those not exporting plan to do so in the year ahead.
Obviously this varies greatly across the industry sectors, with manufacturers and wholesalers much more export oriented. Looking at the sectors more generally, confidence again rose in health and community services this quarter for it to retain top spot, while poor sales saw manufacturing become the least confident sector.
I’d be keen to hear your thoughts on the issues you see impacting on small and medium businesses this year using #SensisBiz.
John Allan, Chief Executive Officer, Sensis
Foreword
Sensis Business Index | Introduction
5
1 3 42 5
Historical trends and overall SMB highlights
SMB confidence lifted strongly to reach levels last seen two years ago and the highest score since March 2011. Despite difficult business conditions, the economy is expected to improve and performance expectations are fairly positive for the quarter and year ahead. The new Prime Minister appears to have had some impact as views of the Federal Government have improved.
The key findings of the Sensis Business Index December 2015 are:
• SMB confidence jumped twelve points to net +39. This compares with +27 a year ago.
• Confidence rose in all locations except the ACT. The most confident State is now Tasmania (+64 net), which saw a major improvement of 46 points. Double figure rises were also noted in NSW, Queensland, SA and WA.
• Opinions of the current state of the economy improved marginally but remain negative. More SMBs still believe the economy is slowing (31%) rather than growing (14%). They are now more hopeful about the health of the economy in 12 months’ time however (up from -4 to +7).
• Last quarter, performance indicators were uninspiring with sales and profitability both slightly negative.
• This quarter, all indicators are expected to remain positive on balance but to a lesser degree than last time.
• In the December quarter we also measure key indicator expectations for the year ahead, including for capital expenditure. There is a fairly positive outlook on all indicators except capital expenditure (-6). Sales expectations registered a net balance of +34, while for profitability it is +28 with prices at +32, wages at +25 and employment at +11. Apart from prices, which were four points higher, the expectations for the other four indicators were two to six points lower than a year ago.
• Lack of work or sales remains the most mentioned barrier to
taking on staff, followed by difficulty in finding suitable staff.
• Last survey, opinions of the Federal Government had deteriorated but there has now been some improvement. Previously, the proportion of SMBs believing the Federal Government’s policies help small business almost equalled those with the opposite view but now the net balance is +7. The key drivers for this change are tax and incentive related but 8% spontaneously mentioned the new Prime Minister as a reason for regarding the Government favourably.
• Among state and territory governments, only Tasmania (+12), the ACT (+12) and NSW (+11) receive a positive score from SMBs. Perceptions of the ACT Government moved into positive territory (-3 to +12), while the NT Government went from a positive to negative assessment (+10 to -4). The majority of the State Governments remain unpopular, with the SA Government (-32) remaining the most poorly regarded by SMBs.
Executive summary

Sensis Business Index | Introduction
6
1 3 42 5
Metropolitan versus regional
Confidence lifted among both metropolitan and regional SMBs.
Key findings relating to metropolitan and regional businesses included:
• Confidence rose 15 points in metropolitan locations and four points among regional SMBs. The gap in confidence between metropolitan and regional SMBs increased from four to 15 points (+44 versus +29).
• Metropolitan and regional SMBs remain similarly pessimistic overall about the current state of the economy (-17 net in regional compared to -18). However, metropolitan SMBs have stronger expectations for the economy in a year’s time (+10 versus +3).
• There were no major differences between metropolitan and regional SMBs on key performance indicators in the past quarter, with those results generally soft.
• For the current quarter there are positive expectations for all indicators in both metropolitan and regional locations, with net balances slightly higher in metropolitan areas or equal. Sales (+16 and +15) and profitability (+13 and +7) forecasts are relatively modest in both segments.
• Year ahead expectations are quite solid on all key indicators except capital expenditure in both metropolitan and regional areas, although they are slightly more positive among metropolitan SMBs. The respective sales and profitability forecasts for 2016 are +38 and +28 for sales and +32 and +20 for profitability.
• Both metropolitan and regional SMBs are more positive towards the Federal Government’s policies. Their net balances are the same but a greater increase occurred in regional areas (from -3 to +7) compared to metropolitan areas (from +3 to +7).
Executive summary
Industry sector trends
Most sectors have found conditions challenging recently but all sectors have a positive outlook for 2016, especially health and community services.
• The health and community services sector again displayed the highest confidence level (+65) and is well ahead of all other sectors on this measure. Around the average are building and construction; cultural, recreation and other services; communication, property and business services; and finance and insurance. Retail trade; transport and storage and manufacturing were below the average.
• Sales performances last quarter ranged from modest to poor, with wholesale recording the highest net balance of +14 followed by +6 for cultural, recreation and other services. Transport and storage (-20) and retail (-13) battled the hardest.
• Negative profitability results were common last quarter with communication, property and business services the only positive performer (+10). Retailers (-23) struggled most on profitability followed by transport and storage (-14).
• For the current quarter, sales and profitability expectations are generally positive across the sectors with some variations. The best sales expectations are in retail and health and community services (+32 in each), while the lowest are in transport and storage (+2). On profitability, retail led with a +27 net balance, while hospitality was the weakest on -9.
• The net balances for year ahead sales expectations ranged from +24 in transport and storage to +53 in health and community services. For profitability, the same two sectors stood out at the top and bottom - health and community services with +40 and transport and storage with +13.

Sensis Business Index | Introduction
7
1 3 42 5
A challenging last quarter has dampened performance expectations however they remain positive. SMBs are more confident about the economy and their own business prospects in 2016.
Examining the latest key indicator results shown opposite provides a gauge on the potential direction of the Australian economy.
Performance indicator results last quarter were uninspiring, yet confidence about their own business prospects for the next 12 months has lifted sharply and SMB perceptions of the economy in 2016 are now also positive. The Federal Government is more favourably viewed, coinciding with the change in Prime Minister and this appears to have influenced assessments and expectations measured in this survey.
SMB business cycle analysis
Results for this quarter
Expectations for this quarter
Expectations for next 12 months
Business Confidence
NA NA Increased optimism
Economy NA NA Improved from pessimism to
optimism
Sales Flat Lower but positive Lower but still quite optimistic
Employment Flat Marginally lower but positive
Marginally lower but optimistic
Wages Lower but positive Lower but positive Lower but still quite optimistic
Prices Flat but positive Marginally lower but positive
Lower but still quite optimistic
Profitability Marginally up but negative
Lower but positive Lower but still quite optimistic
Capital Expenditure
NA NA Lower and now pessimistic

Sensis Business Index | Introduction
8
1 3 42 5
SBI snapshot
Tasmania +64 ( 46)
+39 net balance- =57% feel confident
Because of:•Specific business strengths•Established, solid business•Healthy, growing sales
18% feel worried
Because of: • Unfavourable business, economic or industry environment• Decreasing sales
Increased 12 points from last quarter
65%Metro
35%Regional
90%Small
10%Medium
SBI SnapshotThe Sensis Business Index has tracked the confidence and behaviourof Australia’s small and medium businesses (SMBs) since 1993.Here are some of the key findings of the latest report.
Who did we survey?
What did they tell us?
Region
SMBs feeling confident
Business size
OPENOPEN
Net confidence increased to
Up 12 points from last quarter
points+39SMB confidence by state
Western Australia +31 ( 13)
Queensland +35 ( 10)
Northern Territory +24 ( 2)
South Australia +16 ( 15)
New South Wales +46 ( 12)
National average +39 ( 12)
Australian Capital Territory +38 ( 9)
Victoria +38 ( 6)

1 3 42 5
Health and Community Services +65 ( 24)
Perceptions of the economy now
2 points higher than last quarter
Slowing+31%
Growth+14%
Standing Still+55%
Better+28%
Same+51%
Worse+21%
Perceptions of the economy a year from now
11 points higher than last quarter
SBI Snapshot
-17Net balance
+7Net balance
SMB confidence by sector
Cultural, Recreational and Personal Services +42 ( 20)
Hospitality (Accommodation, Cafes and Restaurants) +38 ( 14)
Building and Construction +47 ( 21)
Manufacturing +15 ( 2)
Retail Trade +19 ( 3)
Wholesale Trade +30 ( 28)
Communications, Property and Business Services +38 ( 2)
National average +39 ( 12)
Finance and Insurance +40 ( 2)
Transport and Storage +24 ( 6)
Experience and expectations on key business indicators
* Net balance is defined as the difference between the percentage reporting an increase and the percentage reporting a decrease.** Actual experience relates to last 3 months. *** Expectation is for next 12 months.
*Net Balance for Key Indicators Actual experience** Expectation for next 12 months***
Change in expectation for next 12 months
Sales -1 +34 ↓6
Size of workforce 0 +11 ↓2
Wages +6 +25 ↓5
Prices +9 +32 ↑4
Profitability -5 +28 ↓6
Capital expenditure NA -6 ↓15

10
1 3 42 5
10
1 3 42 5
Sensis Business Index | Small and medium business outlook – national summary
Small and Medium Business Outlook – National Summary
SMB confidence in their own business prospects over the next 12 months ............................................................................. 11
Confidence by state and territory, sector and size ..........................................................................................................................12
Perceptions of the economy .................................................................................................................................................................14
Expectations on key indicators for the next 12 months ................................................................................................................ 15
Concerns ................................................................................................................................................................................................. 16
Sales ...........................................................................................................................................................................................................17
Employment ............................................................................................................................................................................................ 18
Wages bill ................................................................................................................................................................................................. 19
Prices .......................................................................................................................................................................................................20
Capital expenditure ................................................................................................................................................................................21
Access to finance ..................................................................................................................................................................................22
Profitability ..............................................................................................................................................................................................23
Exports ....................................................................................................................................................................................................24

11
1 3 42 5
Sensis Business Index | Small and medium business outlook – national summary
SMB confidence in their own business prospects over the next 12 months
Net confidence has lifted to the highest score since March 2011.
Key findings
The net confidence level of Australian SMBs rose this quarter to a level not seen since December 2013.
Last quarter (July - September)
The net balance figure was up 12 points to +39, with 57% of SMBs feeling confident about their prospects for the year ahead and 18% feeling worried. This represents a significant shift as the net balance had barely moved for the previous twelve months. The last time a similar net balance was observed was in the December quarter of 2013 when the score was +38.
Once more the leading factors generating confidence are specific strengths of the business, being an established, solid business and healthy, growing sales.
Lack of work or sales continues to be the prime cause of concern.
Small Business (up to 19
employees)
Medium Business (20 - 199
employees)
Total Small and Medium
Extremely confident 9 10 9
Fairly confident 48 44 48
Neutral 25 26 25
Fairly worried 13 13 13
Extremely worried 5 7 5
Total confident 57 54 57
Total worried 18 20 18
*Net Balance +39 +34 +39
Dec 14
Mar 15
Jun 15
Sep 15
Dec 15
Confident 51% 49% 51% 50% 57%
Worried 24% 22% 20% 23% 18%
*Net Balance +27 +27 +31 +27 +39
Overall confidence - Dec 2015
Confidence trends - past five quarters
Thinking about the next 12 months, how confident do you feel about your business prospects?
100%
50%
0%
Confident Worried *Net balance
Long term trends in confidence
* Net balance is defined as the difference between the percentage who are confident and the percentage who are worried.
Note: rounding occurs
Dec 1
3
Dec 0
8
Dec 0
9
Dec 1
0
Dec 1
1
Dec 1
2
Dec 1
4
Dec 1
5
57%
+39
18%

12
1 3 42 5
Sensis Business Index | Small and medium business outlook – national summary
Confidence by state and territory, sector and size
Confidence was higher almost across the board and substantially so in some cases.
Key findings
Confidence lifted everywhere except the ACT. Queensland improved for a third consecutive quarter with double figure improvements also noted in NSW, SA, WA and Tasmania. In Tasmania the net balance for confidence more than tripled. In Victoria confidence resembles the national average. SA is still clearly bottom of the pack but positive overall. The NT improved by only two points.
Confidence lifted more in metropolitan than regional areas. The gap is now 15 points compared to four points last quarter. Most regional areas are far less confident than their metropolitan counterparts. Most sectors are clearly more confident but some large differences exist. Small firms are now more confident than medium firms.
Last quarter
Tasmania jumped into a clear leadership position on confidence, rising 46 points to +64 net. NSW improved 12 points to +46, Victoria by six points to +38 and Queensland by 10 points to +35. WA (+31) and SA (+16) lifted 13 and 15 points each but remain below average, as does the NT (up two points to +22). The only fall was recorded in the ACT (down 9 points to +38).
The most confident capital city is Hobart, followed by Sydney and Brisbane with others under the national average. Darwin is now the most negative capital city having overtaken Adelaide. Regionally, confidence was strongest in Tasmania with the NT and WA also clearly above average. Regional SMBs in SA and Queensland were the least positive.
Confidence was easily highest in the health and community services sector, with building and construction the only other industry noticeably above average. However, communications; property and business services; finance and insurance; cultural, recreational and personal services; and hospitality are around the national average. Confidence is positive but relatively low in manufacturing; retail, wholesale trade; transport and storage.
Last survey medium sized businesses were much more positive about their prospects than small businesses - by a gap of 28 points - but that is no longer true with their net balance now at +34 compared to +39 for small businesses. Previously their net balances were +54 and +26 respectively, hence there has been quite a fall in the confidence of medium firms and a sizeable rise for small businesses.

13
1 3 42 5
Sensis Business Index | Small and medium business outlook – national summary
Confidence by state and territory, sector and size
Dec 14
Mar 15
Jun 15
Sep 15
Dec 15
National +27 +27 +31 +27 +39
New South Wales +24 +38 +31 +34 +46
Victoria +38 +33 +42 +32 +38
Queensland +13 +10 +18 +25 +35
South Australia +19 +6 +32 +1 +16
Western Australia +38 +29 +28 +18 +31
Tasmania +38 +32 +39 +18 +64
Northern Territory +46 +35 +43 +22 +24
Australian Capital Territory +9 +19 +33 +47 +38
Metro Regional Total
National +44 +29 +39
New South Wales +56 +32 +46
Victoria +42 +29 +38
Queensland +55 +22 +35
South Australia +15 +20 +16
Western Australia +27 +41 +31
Tasmania +73 +60 +64
Northern Territory -3 +45 +24
Australian Capital Territory +38 NA +38
Trends by state - *net balance
Metro and regional confidence - *net balance
Confidence by business size
Confident Worried *Net Balance
Total 57% 18% +39
1-2 Employees 51% 17% +34
3-4 Employees 60% 22% +38
5-9 Employees 63% 15% +48
10-19 Employees 63% 22% +41
Total Small Business 57% 18% +39
20-99 Employees 56% 20% +36
100-199 Employees 42% 17% +25
Total Medium Business 54% 20% +34
Confidence by sector
Confident Worried *Net Balance
Manufacturing 48% 33% +15
Building/Construction 60% 13% +47
Wholesale Trade 56% 26% +30
Retail Trade 48% 29% +19
Transport/Storage 46% 22% +24
Communication Property & Business Services
55% 17% +38
Finance and Insurance 53% 13% +40
Health and Community Services 74% 9% +65
Cultural, Recreational and Personal Services
62% 20% +42
Hospitality (Accommodation, Cafes and Restaurants)
55% 17% +38
* Net balance is defined as the difference between the percentage of SMBs with a positive outlook and the percentage with a negative outlook.
Note: rounding occurs.

14
1 3 42 5
Sensis Business Index | Small and medium business outlook – national summary
SMB expectations for the economy are improving.
Key findings
SMB assessments of the current state of the Australian economy are not quite as negative as last survey and their expectations for the next year have shifted into positive territory.
Last quarter (July - September)
There were one point improvements in the proportions believing the economy is growing or slowing down. This led to a net balance of -17 compared to -19 previously.
SMB perceptions of the current state of the economy stayed negative everywhere but Tasmania (+1). They remain lowest in SA (-32) and WA (-32), despite lifting 8 and 9 points respectively.
Regional SMBs (-17) are similar to those in metropolitan locations (-18) on this measure.
Views about the economy in a year’s time have improved by 11 points and are now positive on balance. The proportion expecting the economy to get better was up eight points from the prior survey with a three point drop in the proportion who feel the economy will be worse in a year’s time. As a result, the net balance was +7 compared to -4 last time, -2 previously and -9 before that. There had been positive net balances throughout 2014.
Expectations are now positive everywhere but SA (-5) and the NT (-8). There is a double figure net balance for year ahead expectations in NSW (+12), WA (+14), Tasmania (+22) and the ACT (+15).
There was a seven point gap between metropolitan (+10) and regional (+3) SMBs on this measure.
Perceptions of the economy
55+31+14+y 51+21+28+y Same
Worse
5128
21
Dec 14
Mar 15
Jun 15
Sep 15
Dec 15
The economy now
Growth 19% 12% 13% 13% 14%
Slowing 28% 35% 28% 32% 31%
*Net Balance -9 -23 -15 -19 -17
The economy a year from now
Better 28% 20% 18% 20% 28%
Worse 22% 29% 20% 24% 21%
*Net Balance +6 -9 -2 -4 +7
NSW VIC QLD SA WA TAS NT ACT
The economy now
Growth 18% 9% 17% 8% 8% 19% 13% 16%
Slowing 27% 36% 27% 40% 40% 18% 40% 22%
*Net Balance -9 -27 -10 -32 -32 +1 -27 -6
The economy a year from now
Better 33% 22% 27% 20% 36% 34% 24% 30%
Worse 21% 20% 24% 25% 22% 12% 32% 15%
*Net Balance +12 +2 +3 -5 +14 +22 -8 +15
Perceptions of the economy - trends
Perceptions of the economy by state
60
0
20
40
-20
-40
-60
-80
The economy now The economy a year from now
Perceptions of the economy Long term trends - *net balance
Dec 1
2
Dec 0
8
Dec 0
9
Dec 1
0
Dec 1
1
* Net balance is defined as the difference between the percentage with a positive outlook and the percentage with a negative outlook.
SlowingBetter
The economy now The economy a year from now
GrowthStanding
still
Dec 1
3
5531
14
Dec 1
4
Dec 1
5
+7
-17

15
1 3 42 5
Sensis Business Index | Small and medium business outlook – national summary
Almost all the year ahead indicators were positive while lower than this time last year.
Key findings
Five of the six year ahead business indicators were lower relative to the 2014 December quarter findings. SMBs are still more likely to be expecting increases in sales, employment, wages, prices and profitability than falls. The exception is capital expenditure.
Next 12 months (to December quarter 2016)
Forty seven percent expect an increase in sales over the next 12 months with 13% expecting a decline. The net balance of +34 is six points lower than the 2014 result. SMBs in all states and territories were again positive with respect to increased sales. The net balance varied from a low of +15 in SA to a high of +56 in Tasmania. The ACT (+42), Victoria (+40) and NSW (+37) exceeded the national average.
The health and community services sector is the most confident with a net +53 expecting better sales. The least optimistic sector is finance and insurance on net +22.
Employment expectations for 2016 eased two points to a net balance of +11. Around the nation Tasmania had the best results with a net balance of +24. The least optimistic SMBs are in SA (+1) and the NT (+5).
By industry the community, property and business services sector is the most bullish about employment results on +19, with retail the least positive on +3. Most of the other sectors resembled the national average in their year ahead employment expectations.
Wages and salary costs for the year ahead are anticipated to increase with a net balance result of +25. The strongest expectations for wages were recorded in Tasmania (+41) and the lowest in SA (+15). The wholesale sector is forecasting the biggest rise in wages over the next year (net balance of +39) followed by health and community services (+30). Retail stands out as the lowest on this measure (+13).
Selling price expectations for the year ahead were four points higher than in the December 2014 quarter, with 36% expecting an increase and just 4% a fall in the prices they charge. Those in NSW (+41) and in the wholesale sector (+46) are the most likely to be expecting increased prices.
Expectations on key indicators for the next 12 months
Profitability expectations were down six points to net +28 in the latest survey. Tasmania (+42) and the ACT (+40) recorded the strongest profit expectations for the year ahead. At an industry level the health and community services sector (+40) displayed the highest annual profit expectations.
Capital expenditure expectations for the year ahead were down 15 points to a net balance of -6. The only positive capital expenditure expectations for the next 12 months were recorded in Tasmania (+3) and the ACT (+5). By industry this was true only for health and community services (+3) and finance and insurance (0).
Expect an increase
Expect a decrease
*Net Balance
Value of sales 47% 13% +34
Size of workforce 19% 8% +11
Wages bill 35% 10% +25
Prices charged 36% 4% +32
Profitability 44% 16% +28
Capital expenditure 28% 34% -6
Dec 13
Dec 14
Dec 15
Value of sales +58 +40 +34
Size of workforce +19 +13 +11
Wages bill +42 +30 +25
Prices charged +34 +28 +32
Profitability +52 +34 +28
Capital expenditure +9 +9 -6
Expectations on key indicators over the next 12 months - Dec 2015
Expectations on key indicators - Trends in net balance over next 12 months
* Net balance is defined as the difference between the percentage with a positive outlook and the percentage with a negative outlook.
* Net balance is defined as the difference between the percentage with a positive outlook and the percentage with a negative outlook.

16
1 3 42 5
Sensis Business Index | Small and medium business outlook – national summary
Once more lack of work or sales is the most mentioned concern.
Key findings
A similar proportion of SMBs (41%) said they are facing no significant problems in their business as last time (39%). As discovered for many surveys now, lack of work or sales is cited above any other concern.
Last quarter
Nineteen percent nominated lack of work or sales revenue as the main issue impacting their business. This was up one point from last quarter. This concern stood out most in Queensland and SA at 24% each and least in Tasmania at 10%. In the finance and insurance sector only 9% worried about lack of work but this was 28% in manufacturing.
Spontaneous concern about the economic climate was mentioned by 11%, compared to 14% last time. Economic climate includes issues such as consumer confidence and spending levels, interest and exchange rates, concerns about the general economic climate, as well as global, state and regional economic concerns. This was most prominent in SA (20%) and WA (19%) as well as in the retail sector (17%).
Competition concerns registered 10% (previously 7%) with this figure at 11% in WA and 19% in the transport and storage sector.
Cash flow, bad debts or profitability, down three points, was mentioned by 7% overall, 11% in SA and by 11% of manufacturers.
All other issues were raised by fewer than 10% of SMBs and that has been a consistent situation for some time now.
Interestingly, 6% of SMBs mentioned difficulties in finding quality staff and when asked what specific problems they encountered the primary reasons given were lack of qualified or skilled staff (20%) and finding people who want to work (15%).
Concerns
As far as your business is concerned, what problems, if any, are you facing at the moment?
Prime concerns
Lack of work/sales
Economic climate
Competition
Cash flow/bad debts/profitability
Paperwork/bureaucracy
Finding/keeping staff
Costs/overheads
Employment costs and regulations
Taxes
No concerns = 41%
19%11%
10%7%7%
6%3%
2%2%
20%
25%
30%
15%
10%
5%
0%
Prime concerns - long term trends - lack of work or sales
Dec 1
2
Dec 0
8
Dec 0
9
Dec 1
0
Dec 1
1
Dec 1
3
Dec 1
4
Dec 1
5
19%
Prime concerns - long term trends - economic climate
15%
20%
25%
10%
5%
0%
Dec 1
2
Dec 0
8
Dec 0
9
Dec 1
0
Dec 1
1
Dec 1
3
Dec 1
4
Dec 1
5
11%
Prime concerns - long term trends - cash flow20%
5%
10%
15%
0%
Dec 1
2
Dec 0
8
Dec 0
9
Dec 1
0
Dec 1
1
Dec 1
3
Dec 1
4
Dec 1
5
7%

17
1 3 42 5
Sensis Business Index | Small and medium business outlook – national summary
Sales remain flat and expectations have reduced but remain optimistic.
Key findings
Overall, sales performance has continued to be weak despite expectations for the quarter ahead remaining optimistic.
Last quarter
Sales performance registered a net balance of -1, which was one point down on the previous quarter.
Sales performance was best in Tasmania (+17) followed by Victoria (+5). It was worst in WA (-19).
Across industry sectors, wholesale recorded the leading sales performance (+14) while the weakest was in transport and storage (-20). Retail was also a struggling sector (-13).
Current quarter
SMBs are expecting higher sales over the current quarter. Thirty two percent expect an increase in sales and 16% forecast a fall giving a net balance of +16, which is eight points lower than last time.
Sales expectations are positive in all locations except the NT where the net balance is -9. Tasmania and the ACT stood out with net balances of +46 and +35.
By industry, the expectations are best in the health and community services and retail sectors (+32 in each).
Next 12 months
Twelve month sales expectations were six points lower to net +34, with 47% expecting their sales to increase in the next 12 months and 13% expecting a decrease. This net balance score compares with +58 observed two years ago in December 2013.
Sales
50
40
30
20
10
0
-10
-20
-30
Dec 14
Mar 15
Jun 15
Sep 15
Dec 15
Last Quarter
Experienced increase 33% 30% 23% 29% 26%
No change 34% 37% 50% 41% 45%
Experienced decrease 31% 31% 25% 29% 27%
*Net Balance +2 -1 -2 0 -1
Current Quarter
Expect increase 34% 43% 31% 38% 32%
No change 43% 44% 55% 46% 49%
Expect decrease 20% 12% 13% 14% 16%
*Net Balance +14 +31 +18 +24 +16
Value of sales
Experience Expectations
Value of sales - trends in *net balance
* Net balance is defined as the difference between the percentage with a positive outlook and the percentage with a negative outlook.
Dec 1
3
Dec 0
8
Dec 0
9
Dec 1
0
Dec 1
1
Dec 1
2
Dec 1
4
+16
-1
Dec 1
5

18
1 3 42 5
Sensis Business Index | Small and medium business outlook – national summary
A subdued employment situation perseveres.
Key findings
This indicator has not gained traction for quite some time.
Last quarter
Ten percent of SMBs increased employment and 10% reported a decrease creating a neutral net balance. The net balance range has been -4 to +1 for the last six quarters.
At a state level, the best result was in Queensland (+10). It was not positive anywhere else. WA and Tasmania were lowest with a net balance of -6.
The best performing sector was cultural, recreational and other personal services (+8), in stark contrast to transport and storage (-7).
Fifty-two percent reported barriers to taking on new employees (50% last survey). Lack of work or sales is again the dominant barrier, mentioned by 49% (42% last survey). Business growth remained the prime reason for boosting staff.
Current quarter
Minimal change was noted again with 12% forecasting an increase and 7% expecting to shed staff. The net balance of +5 is in line with the last five surveys.
Tasmania (+16) is the most optimistic, while SMBs in SA (-2) and the NT (-10) are in negative territory.
By sector, expectations are highest in cultural, recreational and personal services (+14) and lowest in hospitality (-2).
Next 12 months
Year ahead expectations are positive. Nineteen percent expect an increase and 8% a decrease. The net balance of +11 compares with +13 in 2014 and +17 in 2013.
Employment
Dec 14
Mar 15
Jun 15
Sep 15
Dec 15
Last QuarterExperienced increase 10% 11% 8% 12% 10%No change 79% 79% 81% 75% 80%Experienced decrease 12% 10% 11% 13% 10%*Net Balance -2 +1 -3 -1 0Current QuarterExpect increase 11% 14% 11% 13% 12%No change 83% 78% 83% 80% 79%Expect decrease 6% 7% 5% 6% 7%*Net Balance +5 +7 +6 +7 +5
Size of workforce
What are the barriers to taking on new employees?
Note: Base = those who believe barriers or impediments exist
(52% of all respondents).
All other responses less than 2%.
49%8%
Lack of work/sales
Finding suitable staff
Lack of funds
Cost of employing
Paperwork/administration
Economic climate
Employment conditions
Fluctuating workload
Too many changes/regulations/rules
Lack of cash flow
Cost of wages
Profitability/lack of profits
7%7%
4%4%
3%
2%2%
3%
3%2%
Why SMBs have increased employment - Dec 2015
Note: Base = SMBs that
have increased staff in
the past quarter (11%
of all respondents).
Business is growing
Economic conditions improving
Increasing staff from part time to full time
Replacing staff that left
Planning ahead for economic growth
Easier to find staff in current economic conditions
Other reason
47%17%
6%
12%
2%18%
10%
* Net balance is defined as the difference between the percentage with a positive outlook and the percentage with a negative outlook.
15
20
5
10
0
-5
-10
Experience Expectations
Size of workforce - trends in *net balance
+5
0
Dec 1
3
Dec 0
8
Dec 0
9
Dec 1
0
Dec 1
1
Dec 1
2
Dec 1
4
Dec 1
5

19
1 3 42 5
Sensis Business Index | Small and medium business outlook – national summary
Wages pressure has eased.
Key findings
Expectations for wages growth among SMBs were down on the prior survey.
Last quarter
Twenty-one percent indicated higher wages against a 15% fall. The net balance of +6 compares with +10 previously and +9 one year earlier.
Wages growth in the last quarter registered a net balance of +19 in Tasmania and between +7 and +12 in NSW, Queensland, the NT and the ACT. This was negative in WA (-7) and below average in Victoria (+4).
Sector-wise, retail recorded the greatest rise in wage costs on +16, followed by finance and insurance (+14). The transport and storage sector was easily lowest on this indicator (-11), with wholesale at +3.
Current quarter
In this quarter, 21% foresee increased wage costs while 10% expect a decrease. The net balance of +11 compares with +19 last quarter and +11 a year ago.
There is a positive net balance in all but two locations for wages expectations ranging from +5 in SA to +33 in Tasmania. The NT (-3) and WA (-1) are negative.
Expected wage growth is highest in wholesale and cultural, recreational and other services (+18 in each) and lowest in communications, property and business services (+2).
Next 12 months
Expectations for wages growth over the next year have slipped slightly relative to the previous survey. Thirty-five percent expect wages growth and just 10% expect a decline.
The net balance of +25 is five points lower than in 2014.
Wages bill
Dec 14
Mar 15
Jun 15
Sep 15
Dec 15
Last Quarter
Experienced increase 23% 25% 15% 25% 21%
No change 59% 56% 67% 57% 61%
Experienced decrease 14% 15% 14% 15% 15%
*Net Balance +9 +10 +1 +10 +6
Current Quarter
Expect increase 22% 24% 20% 26% 21%
No change 66% 67% 71% 65% 67%
Expect decrease 11% 8% 6% 7% 10%
*Net Balance +11 +16 +14 +19 +11
Wages bill
30
0
10
20
-10
-20
Experience Expectations
Wages bill - trends in *net balance
* Net balance is defined as the difference between the percentage with a positive outlook and the percentage with a negative outlook.
Dec 1
3
Dec 0
8
Dec 0
9
Dec 1
0
Dec 1
1
Dec 1
2
Dec 1
4
+11
+6
Dec 1
5

20
1 3 42 5
Sensis Business Index | Small and medium business outlook – national summary
Steady pricing behaviour with expectations still trending down.
Key findings
Overall prices have lifted quite consistently over the year while expectations have tempered.
Last quarter
There was no shift in the net balance of +9. Price increases were noted by 15% with 6% cutting prices.
Net price changes last quarter were in the range of 0 (SA) to +22 (Tasmania).
By sector we saw a well above average situation in wholesale (+26) followed by retail (+15), which was clearly higher than finance and insurance (+1), manufacturing (+3), health and community services (+3).
Current quarter
Expectations for price rises this quarter were two points lower, establishing a net balance of +14.
These expectations ranged from +6 in SA and WA to +17 in Victoria and +19 in Tasmania.
Expectations for increased pricing were strongest in manufacturing (+25), wholesale and retail (both +21). Lowest on this measure were SMBs in the finance and insurance sector (+3).
Next 12 months
At a net balance of +32, expectations for price rises in the year ahead were higher than one year earlier when it registered +28.
Over the year 36% expect a rise in the prices they charge with 4% predicting a fall.
Prices
Dec 14
Mar 15
Jun 15
Sep 15
Dec 15
Last Quarter
Experienced increase 17% 21% 16% 18% 15%
No change 70% 67% 73% 70% 76%
Experienced decrease 10% 10% 8% 9% 6%
*Net Balance +7 +11 +8 +9 +9
Current Quarter
Expect increase 17% 26% 20% 21% 17%
No change 77% 68% 75% 72% 78%
Expect decrease 5% 5% 2% 5% 3%
*Net Balance +12 +21 +18 +16 +14
Prices charged
30
40
0
10
20
-10
Experience Expectations
Prices charged - trends in *net balance
+14
+9
Dec 1
3
Dec 0
8
Dec 0
9
Dec 1
0
Dec 1
1
Dec 1
2
Dec 1
4
Dec 1
5

21
1 3 42 5
Sensis Business Index | Small and medium business outlook – national summary
Negative results expected to continue next year.
Key findings
More SMBs reported decreased capital expenditure over the last year than an increase. This also applies to expectations for next year.
Last 12 months
In the last year, 30% increased capital expenditure, whilst 34% reduced it. The net balance of -4 cannot be compared with another ‘last 12 months measure’ as this is a new question. However, in the December quarter of 2014 we did ask about capital expenditure for the last 3 months and that revealed a net balance of -9 suggesting there has been little improvement on this indicator for some time.
Only in NSW (+3) and the NT (+10) was there a positive net balance in this area. In other locations it ranged from 0 (Tasmania) to -12 (SA).
Capital expenditure last year also varied substantially across sectors, ranging from +15 in health and community services to -20 in transport and storage.
Next 12 months
There was a drop from net +9 to -6 in SMBs expecting to increase capital expenditure in the coming year.
Capital expenditure expectations in the next 12 months were highest in the ACT (+5) and Tasmania (+2) and negative elsewhere, especially in SA (-17). By sector, health and community services recorded a net balance of +3, while in finance and insurance it was +1. The scores were negative for the remaining sectors, with transport and storage again standing out on -21.
Capital expenditure
Dec 14
Dec 15
Over last 12 months spent
More than in previous 12 months NA 30%
Same as in previous 12 months NA 33%
Less than in previous 12 months NA 34%
*Net Balance NA -4
Over next 12 months expect to spend
More than this year 29% 28%
Same as this year 49% 35%
Less than this year 20% 34%
*Net Balance +9 -6
Capital expenditure - trends
NOTE: This question is only asked in the December quarter survey about the last 12 months and next 12 months. Capital expenditure refers to funds used by a company to acquire or upgrade physical assets such as property, industrial buildings or equipment. It is often used to undertake new projects or investments by the firm.

22
1 3 42 5
Sensis Business Index | Small and medium business outlook – national summary
Obtaining finance is still challenging for SMBs.
Key findings
SMBs’ ability to access finance is critical for capital expenditure and growth. Overall they are still not finding it easy to access finance.
Last quarter
Accessing finance continues to just hover in positive territory. The net score of +3 compares with +1 and +4 in the last two surveys and +2 one year ago.
SMBs in SA (-4) and WA (-5) battled to access finance most of all, while those in NSW were the most positive on this dimension (+5).
By sector, transport and storage (+17) stood out at the top end in contrast to manufacturing (-5), cultural, recreational and other personal services (-7).
Medium size firms (+16) found it easier than small firms (+2) to access finance. The gap last time was +27 in favour of medium businesses.
Sixteen percent of SMBs indicated an attempt to access finance, compared to 17% last quarter. However, of those, 73% had success in both surveys.
The highest incidence of seeking finance was in Tasmania (28%) followed by WA (22%). The lowest was in NSW (11%). SMBs in the transport and storage sector (30%) were the most likely to have sought finance.
Access to finance
84+16+y
73+24+3+y
Dec 14
Mar 15
Jun 15
Sep 15
Dec 15
Last QuarterRelatively easy 25% 24% 19% 23% 24%Average 52% 58% 66% 55% 56%Relatively hard 23% 18% 15% 22% 21%*Net Balance +2 +6 +4 +1 +3
Access to finance
Access to finance - trends in *net balance
Success in accessing finance
Have you tried to access finance for your business in the past quarter?
Were you successful?
Ease of accessing finance - by business size (Dec 2015)
Easy Difficult *Net Balance
Total 24% 21% +3
1-2 Employees 21% 21% 0
3-4 Employees 23% 23% 0
5-9 Employees 26% 18% +8
10-19 Employees 28% 21% +7
Total Small Business 23% 21% +2
20-99 Employees 31% 14% +17
100-199 Employees 25% 17% +8
Total Medium Business 30% 14% +16
No
Pending
Yes
No
Yes
* Net balance is defined as the difference between the percentage with a positive outlook and the percentage with a negative outlook.
Base: Those who had tried to access finance.
16
3
7324
+3
+21
+24
84
0
10
20
30
40
50
-30
-20
-10
-40
-50
Relatively easy Relatively hard *Net balance
Dec 1
3
Dec 1
0
Dec 1
1
Dec 1
2
Dec 1
4
Dec 1
5

23
1 3 42 5
Sensis Business Index | Small and medium business outlook – national summary
Profitability
Consistently negative profitability experiences are tempering expectations.
Key findings
Despite SMBs reporting negative profitability for some time, their expectations have been upbeat. However, expectations have fallen nine points this quarter.
Last quarter
Twenty-three percent reported a profit rise against a 28% fall. The net balance result of -5 compares with -7 last survey.
The last net positive profitability result recorded was in February 2008.
Profitability was negative everywhere but Tasmania (+17) and Victoria (+1). It was very weak in WA (-21) and the NT (-17).
Only in communications, property and business services (+10) was profitability positive. Retail (-23) and transport and storage (-14) ranked lowest on this measure.
Current quarter
Profitability expectations are the lowest they have been this year, now sitting on +10.
The expectations are well above average in Tasmania (+38) and the ACT (+33). The opposite is true for WA (-3) and the NT (-14). Other locations are positive overall ranging from +5 (SA) to +16 (Victoria).
The retail (+27) and cultural, recreational and personal services sectors (+25) are the most positive, with the weakest being hospitality (-9) and finance and insurance (-6).
Next 12 months
Expectations for the year ahead have decreased again. Forty-four percent expect increased profitability and 16% anticipate a decrease. The net balance of +28 compares with +34 in 2014 and +52 in 2013.
Dec 14
Mar 15
Jun 15
Sep 15
Dec 15
Last Quarter
Experienced increase 26% 24% 21% 24% 23%
No change 37% 40% 53% 43% 47%
Experienced decrease 34% 34% 24% 31% 28%
*Net Balance -8 -10 -3 -7 -5
Current Quarter
Expect increase 33% 44% 29% 35% 29%
No change 44% 41% 55% 47% 50%
Expect decrease 22% 13% 14% 16% 19%
*Net Balance +11 +31 +15 +19 +10
Profitability
50
0
10
20
30
40
-20
-10
-40
-30
Experience Expectations
Profitability - trends in *net balance
* Net balance is defined as the difference between the percentage with a positive outlook and the percentage with a negative outlook.
+10
-5
Dec 1
3
Dec 0
8
Dec 0
9
Dec 1
0
Dec 1
1
Dec 1
2
Dec 1
4
Dec 1
5

24
1 3 42 5
Sensis Business Index | Small and medium business outlook – national summary
Exports
Exports have not grown in three years.
Key findings
There has been no growth in the proportion of SMBs exporting over the last three years.
Last 12 months
Eleven percent of SMBs exported goods or services in the last year (12% in 2014 and 13% in 2013). SMBs in the ACT (17%) were most likely to export followed by NSW (14%), while those in the NT were the least likely (5%).
Metropolitan SMBs were more likely to export than their regional counterparts (14% compared to 6%). Manufacturers (29%) and wholesalers (26%) were again the most export-oriented. Least likely was the hospitality sector (1%).
New exporters
Only 1% of the SMBs not exporting in the last year expect to do so in the next 12 months. This intention ranges from 0% in WA to 3% in NSW and the ACT. By industry, wholesale stands out at 9% with the rest ranging from 0% to 3% on this measure.
Exporting and business growth
Elsewhere in this survey we discovered 43% of SMBs seeking growth for their business and 6% of those expect their growth will mainly come from exports. This represents under 3% of the total base.
Proportion of SMBs exporting in the last year
* Net balance is defined as the difference between the percentage with a positive outlook and the
percentage with a negative outlook.
National
New South Wales
Victoria
Queensland
South Australia
Western Australia
Tasmania
Northern Territory
Australian Capital Territory
11%14%
10%
10%
7%7%
5%17%
11%

25
21 543
Government policies ..............................................................................................................................................................................26
Assessment of Federal Government policies ................................................................................................................................... 27
Assessment of state and territory government policies ...............................................................................................................28
Government Policies
25
21 543
Sensis Business Index | Government policies

26
21 543
Sensis Business Index | Government policies
21 543
Government policies
The maps below show the net balance of attitudes to Federal, state and territory government policies. This is calculated from the proportion believing the government is supportive less the proportion believing it to be working against small business interests. Also displayed is the change in net balance compared with the previous quarter.
Attitudes to Federal Government policies
Attitudes to state and territory government policies
Western Australia
Northern Territory
South Australia New South
Wales
Victoria
Queensland
National
ACT
Tasmania
No change
14
30
2
7
1
1
1
6
18
5
14
15
-10
-4
+18
-32+11
+4
-17
+7
-15
+3
+12
+18
+12
1-5
5+14
7+13
6+3
Western Australia
Northern Territory
South Australia New South
Wales
Victoria
Queensland
ACT
Tasmania

27
21 543
Sensis Business Index | Government policies
SMBs view the Federal Government more favourably than last survey and this time one year ago.
Key findings
SMBs see the Federal Government in a more positive light than last survey and in the corresponding 2014 survey.
Last quarter
Twenty-seven percent now assess Federal Government policies as supportive of SMBs with 20% disagreeing. The net balance of +7 compares with the prior result of +1, which had fallen significantly from +18 in the June quarter following the Federal Budget. Year on year the net balances recorded have been +9 in the first post-election survey of December 2013, -4 last December quarter and +7 now.
The top three reasons for a favourable assessment of the Government are tax cuts (15%), tax incentives (11%) and other incentives, subsidies or grants (11%). However, 8% also spontaneously mentioned “a new Prime Minister”.
SMBs not keen about the Federal Government’s policies mostly cite excessive bureaucracy or red tape (26%) followed by a lack of incentives, support or financial assistance for small business (15%), high taxes (13%) and a focus on big business (13%).
Businesses in the NT (+14), Tasmania (+18) and SA (+18) are the most impressed with Federal Government support for small business. Only in WA (-5) are opinions unfavourable overall.
Conversely, the wholesale (-12), cultural, recreational and other personal services sectors (-8) are the only negative sectors on this measure. The building and construction (+14) and communications, property and business services sectors (+19) are the most positive about Federal Government support.
Assessment of Federal Government policies
Dec 14 Mar 15 Jun 15 Sep 15 Dec 15
Supportive 22% 16% 30% 25% 27%
Work against 26% 24% 12% 24% 20%
No impact 52% 60% 58% 51% 53%
*Net Balance -4 -8 +18 +1 +7
Location Dec 14 Mar 15 Jun 15 Sep 15 Dec 15
National average -4 -8 +18 +1 +7
New South Wales +3 -7 +25 +6 +13
Victoria -6 -3 +13 +3 +4
Queensland -2 -8 +22 -3 +3
South Australia -22 -17 +25 -12 +18
Western Australia -19 -5 +10 -6 -5
Tasmania 17 -12 +8 +23 +18
Northern Territory -8 -1 +42 +9 +14
Australian Capital Territory -38 -33 +9 -15 +3
Attitudes to Federal Government policies - trends
Attitudes to Federal Government policies - by location
Thinking about the current Federal Government, do you believe that their policies are supportive of small business, work against small business or have no real impact either way?
Supportive Work against
Attitudes to Federal Government policies - long term trends
30%
40%
60%
50%
70%
20%
10%
0%
27%
20%
* Net balance is defined as the difference between the percentage with a positive outlook and the percentage with a negative outlook.
Dec 1
3
Dec 0
8
Dec 0
9
Dec 1
0
Dec 1
1
Dec 1
2
Dec 1
4
Dec 1
5
28
21 543
Sensis Business Index | Government policies
The NSW, ACT, QLD and SA Governments were better regarded this survey.
Key findings
Across the locations an average of 16% felt their state or territory government was supportive of small business and 22% felt they were working against small business interests. The net balance of -6 compares with -8 last survey.
The NSW, Tasmanian and ACT Governments are the only ones regarded positively for being supportive of SMBs. The SA Government remains the least favourably viewed.
Last quarter
The ACT and Tasmanian Governments now have the equal highest net rating (+12). The NSW Government is only one point behind on +11. Despite the positive rating in Tasmania, opinions of the Government did worsen (down 14 points). The Government in SA (-32, up by 2) continues to struggle with SMBs. The Victorian (-17) and Queensland (-15) Governments are also fairly unpopular.
The key factors behind the appeal of the Tasmanian Government are incentives (19%), being seen as supportive and interested in small business (19%) and trying to reduce bureaucracy (19%). In the ACT it is their encouragement of growth (23%) and infrastructure development (15%), while the NSW Government drew praise for infrastructure development (14%), tax cuts and incentives (11%) and encouraging growth (10%).
The SA Government, which has really struggled on this measure for over two years was criticised for high taxation (19%), payroll tax (11%), poor economic management (17%) and excessive, wasteful spending (12%).
Assessment of state and territory government policies
Attitudes to state or territory government policies (Dec 2015)
Dec 14
Mar 15
Jun 15
Sep 15
Dec 15
New South Wales +4 +16 +18 +10 +11
Victoria +1 -16 -8 -16 -17
Queensland +6 -24 -22 -22 -15
South Australia -31 -27 -30 -34 -32
Western Australia -19 -3 -2 -10 -10
Tasmania +4 +15 +7 +26 +12
Northern Territory 0 -5 +18 +10 -4
Australian Capital Territory -10 +3 -3 -3 +12
Attitudes to state or territory government policies - trends in *net balance
* Net balance is defined as the difference between the percentage with a positive outlook and the percentage with a negative outlook.
NSW VIC QLD SA WA TAS NT ACT
Supportive 25% 11% 10% 6% 15% 25% 22% 34%
Work against 14% 28% 25% 38% 25% 13% 26% 22%
No impact 62% 61% 65% 56% 60% 63% 52% 43%
*Net Balance +11 -17 -15 -32 -10 +12 -4 +12
Thinking about the current state/territory government, do you believe that their policies are supportive of small business, work against small business or have no real impact either way?
Note: Rounding occurs.

29
21 53 4
29
21 53 4
Sensis Business Index | Small and medium business outlook
National ....................................................................................................................................................................................................30
New South Wales ....................................................................................................................................................................................31
Victoria ......................................................................................................................................................................................................32
Queensland ..............................................................................................................................................................................................33
South Australia .......................................................................................................................................................................................34
Western Australia ...................................................................................................................................................................................35
Tasmania ..................................................................................................................................................................................................36
Northern Territory ................................................................................................................................................................................... 37
Australian Capital Territory ...................................................................................................................................................................38
Small and Medium Business Outlook

30
21 53 4
Sensis Business Index | Small and medium business outlook
Confidence jumps with SMBs also believing the economy will improve in 2016.
• Confidence was up 12 points this quarter (+39), generating the highest level observed since March 2011.
• Views of the current state of the economy were two points higher but still clearly negative overall (-17). However, expectations for the economy in a year’s time were 11 points higher, moving from -4 to +7 net balance.
• Sales and profitability results are again uninspiring with no employment growth indicated in the latest quarter. Some wages and price pressure was apparent.
• Expectations for the next quarter and next year on the key performance indicators remain positive overall but were lower than last time. Year ahead expectations for sales and profitability were +34 and +28. Conversely, the capital expenditure prognosis for 2016 is considerably lower (-6).
• The Federal Government is more favourably regarded now by SMBs, primarily due to positive opinions about taxes and incentives but also in part due to the change in Prime Minister.
Small and medium business outlook – National
Trends in the past three months’ experience and current expectations - National
Confidence in own business prospects in next 12 months Dec 14 Mar 15 Jun 15 Sep 15 Dec 15
Positive 51% 49% 51% 50% 57%
Negative 24% 22% 20% 23% 18%
*Net Balance +27 +27 +31 +27 +39
*Net balance
Actual experience**: Expectation for next 3 and 12 months:
Dec 2014 Sep 2015 Dec 2015 Dec 2015 Dec 2016
Sales +2 +0 -1 +16 +34
Size of workforce -2 -1 0 +5 +11
Wages +9 +10 +6 +11 +25
Prices +7 +9 +9 +14 +32
Profitability -8 -7 -5 +10 +28
Capital expenditure NA NA -4 *** NA -6
* Net balance is defined as the difference between the percentage with a positive outlook and the percentage with a negative outlook. ** This is for last 3 months.*** This was a new question in the December Quarter 2015 survey asked about the last 12 months.

31
21 53 4
Sensis Business Index | Small and medium business outlook
Confidence is nearly double the level of one year ago despite a lacklustre quarter for key indicators. Expectations for next quarter and next year remain positive with the exception of capital expenditure. The NSW Government also remains one of the better regarded.
• In NSW, overall confidence was 12 points higher and remains clearly above the national average.
• Like last time the main factors driving confidence were having specific business strengths, an established, solid business and healthy sales. Worried SMBs highlighted an unfavourable economic, business or industrial environment followed by declining sales as their main concerns.
• Last quarter, SMBs in NSW experienced flat sales and negative profitability with no employment growth registered. However, prices and wages were on the rise.
• Expectations for all indicators in the current quarter are again positive. For the next 12 months expectations for the indicators are even more positive, ranging from +12 for employment to +41 for prices. The exception is capital expenditure (-6). For sales and profitability the expectations for 2016 are +37 and +30.
• SMB support for the policies of the NSW Government rose one point to a net balance of +11, which is one of only three positive assessments of state governments observed in this survey.
• The main reason for a favourable assessment remains infrastructure investment, while excessive bureaucracy is the major criticism.
Small and medium business outlook – New South Wales
Trends in the past three months’ experience and current expectations - New South Wales
Confidence in own business prospects in next 12 months Dec 14 Mar 15 Jun 15 Sep 15 Dec 15
Positive 51% 55% 51% 54% 61%
Negative 27% 17% 20% 20% 15%
*Net Balance +24 +38 +31 +34 +46
*Net balance
Actual experience**: Expectation for next 3 and 12 months:
Dec 2014 Sep 2015 Dec 2015 Dec 2015 Dec 2016
Sales +4 +8 0 +18 +37
Size of workforce -6 -1 -1 +8 +12
Wages +10 +17 +9 +13 +23
Prices +11 +5 +12 +16 +41
Profitability -9 +5 -5 +12 +30
Capital expenditure NA NA +3 *** NA -6
* Net balance is defined as the difference between the percentage with a positive outlook and the percentage with a negative outlook. ** This is for last 3 months.*** This was a new question in the December Quarter 2015 survey asked about the last 12 months.

32
21 53 4
Sensis Business Index | Small and medium business outlook
Confidence is up in Victoria. Current quarter expectations for key indicators are lower but remain buoyant for the year ahead. The Victorian Government continues to struggle to win the support of SMBs.
• Overall confidence lifted six points to a net balance of +38, which is just shy of the national average.
• SMBs identified having an established, solid business as the key factor for their confidence followed by specific business strengths, while worried SMBs cited an unfavourable business, economic or industrial environment, lower sales and lower profits.
• This last quarter, sales and profitability moved into positive territory, while the other indicator scores were lower.
• For the current quarter, expectations stayed positive but were lower than last survey. However, they are all noticeably more positive for the year ahead with sales (+40) and profitability (+31) particularly encouraging. Capital expenditure expectations for Victorian SMBs in 2016 are neutral.
• Victorian SMBs remain disillusioned with the policies of the State Government recording a net balance of -17 (down one point).
• Their main issues with the Victorian Government are trading hours, the extra public holiday and too much notice being taken of unions. Favourable opinions are mostly influenced by incentives, subsidies, grants and tax cuts.
Small and medium business outlook –Victoria
Trends in the past three months’ experience and current expectations - Victoria
Confidence in own business prospects in next 12 months Dec 14 Mar 15 Jun 15 Sep 15 Dec 15
Positive 56% 51% 56% 54% 55%
Negative 18% 18% 14% 22% 17%
*Net Balance +38 +33 +42 +32 +38
*Net balance
Actual experience**: Expectation for next 3 and 12 months:
Dec 2014 Sep 2015 Dec 2015 Dec 2015 Dec 2016
Sales +10 -1 +5 +19 +40
Size of workforce +3 +1 -1 +4 +8
Wages +11 +8 +4 +11 +28
Prices +7 +12 +8 +17 +30
Profitability -6 -11 +1 +16 +31
Capital expenditure NA NA -9 *** NA 0
* Net balance is defined as the difference between the percentage with a positive outlook and the percentage with a negative outlook. ** This is for last 3 months.*** This was a new question in the December Quarter 2015 survey asked about the last 12 months.

33
21 53 4
Sensis Business Index | Small and medium business outlook
Confidence has continued its upward trend and now sits just below the national average. Expectations on the key performance indicators are down for this quarter. The State Government, while still unpopular with Queensland SMBs, has gained some favour.
• Confidence continues to rise in Queensland among SMBs, up by 10 points to +35 which is almost three times as high as one year ago.
• Those SMBs who are confident highlighted healthy sales as the main reason but an optimistic attitude was also readily apparent.
• Worried SMBs pointed to an unfavourable business, economic or industrial environment followed by decreasing sales as the primary barriers.
• Last quarter there was only improvement in employment, with sales neutral and profitability negative overall.
• Expectations for the current quarter are positive on the key indicators but to a lesser degree than last survey. However, for the next 12 months those expectations are quite upbeat ranging from +13 (employment) to +30 (sales). Capital expenditure is negative (-9).
• The State Government retains its negative image but improved its rating seven points to a net balance of -15. The most common criticism is a lack of incentives and support followed by no infrastructure investment. Offering advice or guidance and being supportive and interested in small business were the top two reasons for a favourable opinion.
Small and medium business outlook – Queensland
Trends in the past three months’ experience and current expectations - Queensland
Confidence in own business prospects in next 12 months Dec 14 Mar 15 Jun 15 Sep 15 Dec 15
Positive 42% 42% 44% 47% 56%
Negative 29% 32% 26% 22% 21%
*Net Balance +13 +10 +18 +25 +35
*Net balance
Actual experience**: Expectation for next 3 and 12 months:
Dec 2014 Sep 2015 Dec 2015 Dec 2015 Dec 2016
Sales +1 +2 0 +13 +30
Size of workforce -1 +1 +10 +3 +13
Wages +10 +14 +12 +11 +23
Prices +1 +11 +10 +10 +27
Profitability -7 -5 -3 +7 +24
Capital expenditure NA NA -8 *** NA -9
* Net balance is defined as the difference between the percentage with a positive outlook and the percentage with a negative outlook. ** This is for last 3 months.*** This was a new question in the December Quarter 2015 survey asked about the last 12 months.
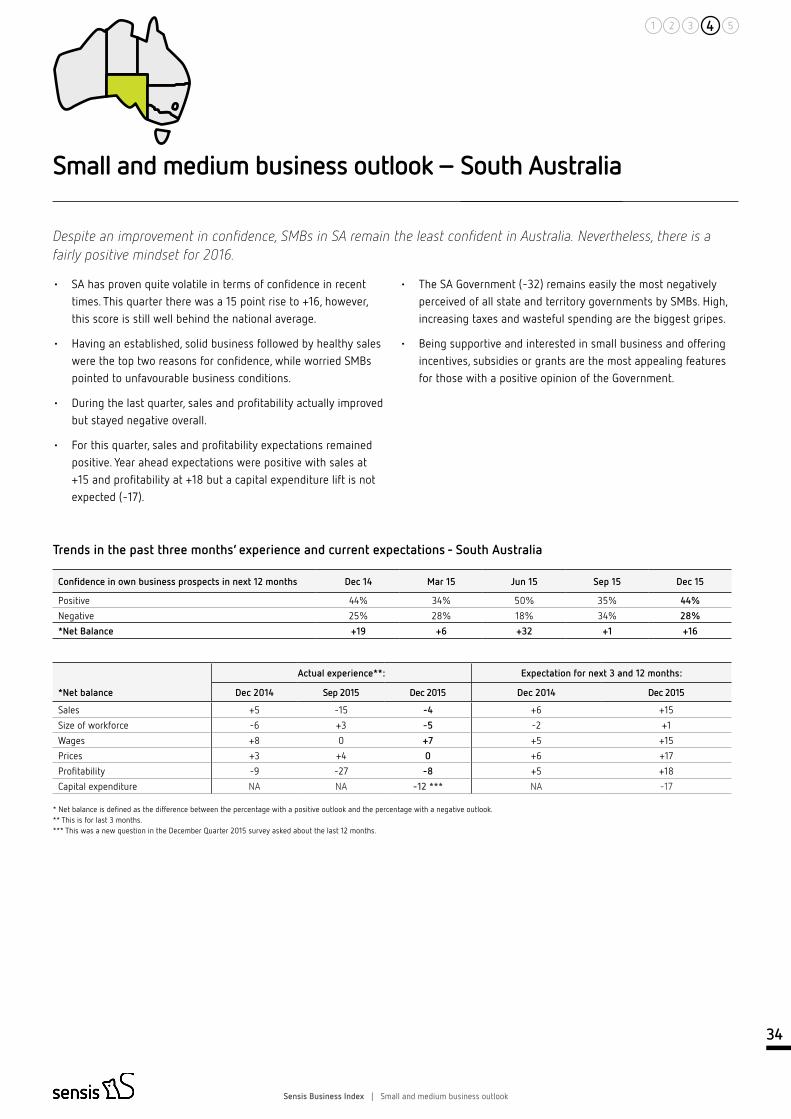
34
21 53 4
Sensis Business Index | Small and medium business outlook
Despite an improvement in confidence, SMBs in SA remain the least confident in Australia. Nevertheless, there is a fairly positive mindset for 2016.
• SA has proven quite volatile in terms of confidence in recent times. This quarter there was a 15 point rise to +16, however, this score is still well behind the national average.
• Having an established, solid business followed by healthy sales were the top two reasons for confidence, while worried SMBs pointed to unfavourable business conditions.
• During the last quarter, sales and profitability actually improved but stayed negative overall.
• For this quarter, sales and profitability expectations remained positive. Year ahead expectations were positive with sales at +15 and profitability at +18 but a capital expenditure lift is not expected (-17).
• The SA Government (-32) remains easily the most negatively perceived of all state and territory governments by SMBs. High, increasing taxes and wasteful spending are the biggest gripes.
• Being supportive and interested in small business and offering incentives, subsidies or grants are the most appealing features for those with a positive opinion of the Government.
Small and medium business outlook – South Australia
Trends in the past three months’ experience and current expectations - South Australia
Confidence in own business prospects in next 12 months Dec 14 Mar 15 Jun 15 Sep 15 Dec 15
Positive 44% 34% 50% 35% 44%
Negative 25% 28% 18% 34% 28%
*Net Balance +19 +6 +32 +1 +16
* Net balance is defined as the difference between the percentage with a positive outlook and the percentage with a negative outlook. ** This is for last 3 months.*** This was a new question in the December Quarter 2015 survey asked about the last 12 months.
*Net balance
Actual experience**: Expectation for next 3 and 12 months:
Dec 2014 Sep 2015 Dec 2015 Dec 2014 Dec 2015
Sales +5 -15 -4 +6 +15
Size of workforce -6 +3 -5 -2 +1
Wages +8 0 +7 +5 +15
Prices +3 +4 0 +6 +17
Profitability -9 -27 -8 +5 +18
Capital expenditure NA NA -12 *** NA -17

35
21 53 4
Sensis Business Index | Small and medium business outlook
Confidence remains below par but 2016 performance is anticipated to be better by SMBs in WA.
• Confidence was 13 points higher but WA still trails the national average by eight points.
• Specific business strengths and an optimistic attitude characterised the lift in confidence, with half of the worried SMBs bemoaning an unfavourable business, economic or industrial environment.
• Last quarter, all key indicators remained negative or were lower and expectations for the current quarter are not encouraging.
• However for the year ahead, expectations are fairly positive for all performance indicators except capital expenditure (-11). The net balance for sales was +21 and for profitability it was +17.
• Support for the WA Government was unchanged remaining at -10 net. The strongest criticisms relate to beliefs that the WA Government is only concerned with big business, the mining industry and multi-nationals and that it imposes too many costs and charges. Those satisfied believe the WA Government is supportive and interested and trying to reduce red tape.
Small and medium business outlook –Western Australia
Trends in the past three months’ experience and current expectations - Western Australia
Confidence in own business prospects in next 12 months Dec 14 Mar 15 Jun 15 Sep 15 Dec 15
Positive 59% 52% 51% 48% 52%
Negative 21% 23% 23% 30% 21%
*Net Balance +38 +29 +28 +18 +31
* Net balance is defined as the difference between the percentage with a positive outlook and the percentage with a negative outlook. ** This is for last 3 months.*** This was a new question in the December Quarter 2015 survey asked about the last 12 months.
*Net balance
Actual experience**: Expectation for next 3 and 12 months:
Dec 2014 Sep 2015 Dec 2015 Dec 2015 Dec 2016
Sales -16 -18 -19 +3 +21
Size of workforce +3 -14 -6 +2 +12
Wages -1 -10 -7 -1 +21
Prices +11 +9 +4 +6 +27
Profitability -11 -31 -21 -3 +17
Capital expenditure NA NA -9 *** NA -11

36
21 53 4
Sensis Business Index | Small and medium business outlook
Overall confidence more than tripled to a level well above all other locations, with Hobart the most confident capital city in Australia. This reflects a relatively strong performance last quarter and expectations of even better results.
• In Tasmania overall confidence skyrocketed 46 points to +64, which is 25 points ahead of the national average.
• Specific business strengths and a positive attitude are driving confidence most of all.
• In the last quarter, all key performance indicators displayed impressive gains except for employment.
• For the current quarter SMBs reported even more positive expectations for all the indicators, with confidence particularly strong for sales and profitability.
• For the year ahead the expectations are even more bullish and Tasmanian SMBs are the most confidence about sales (+56) and profitability (+42). They are also one of only two locations with a positive outlook for capital expenditure (+2).
• SMB support for the Tasmanian Government’s policies actually fell from +26 (clear leader) to +12 (equal leader). The major attractions are perceptions the Government is supportive and interested in small business and it is seeking to reduce bureaucracy. The main criticisms are a lack of incentives and that the Government is too concerned with big business.
Small and medium business outlook –Tasmania
Trends in the past three months’ experience and current expectations - Tasmania
Confidence in own business prospects in next 12 months Dec 14 Mar 15 Jun 15 Sep 15 Dec 15
Positive 58% 50% 56% 43% 72%
Negative 20% 18% 17% 25% 8%
*Net Balance +38 +32 +39 +18 +64
* Net balance is defined as the difference between the percentage with a positive outlook and the percentage with a negative outlook. ** This is for last 3 months.*** This was a new question in the December Quarter 2015 survey asked about the last 12 months.
*Net balance
Actual experience**: Expectation for next 3 and 12 months:
Dec 2014 Sep 2015 Dec 2015 Dec 2015 Dec 2016
Sales -7 +5 +17 +46 +56
Size of workforce -7 +3 -6 +16 +23
Wages +12 +6 +19 +33 +41
Prices +4 +14 +22 +19 +38
Profitability -10 -13 +17 +38 +42
Capital expenditure NA NA 0 *** NA +2

37
21 53 4
Sensis Business Index | Small and medium business outlook
SMBs in the NT are struggling for confidence and are pessimistic about the year ahead. Previously positive views of the NT Government have disappeared.
• In the NT, confidence among SMBs rose two points, but remains well below the national average. It is also much lower than the level observed one year ago and in the first two surveys this year. The problem for confidence in the NT is Darwin, which is now the least confident capital city in Australia and the only location with a negative net rating (-3).
• Unfavourable business conditions are the dominant concern of those who are worried. Specific business strengths and being an established, solid business were the most common reasons given for being confident.
• Last quarter, only wages were higher with sales and profitability weak, prices down and employment flat.
• This quarter, expectations for the key performance indicators are quite pessimistic but for 2016 they are positive with sales (+30) and profitability (+28) promising. However, capital expenditure expectations were negative (-4).
• Positively inclined SMBs feel the Government is supportive and building a lot of infrastructure. The most common complaints are that the Government is only concerned with big business and “all talk, no action”. SMB support for the Northern Territory Government declined 14 points moving it into negative space (net balance of -4).
Small and medium business outlook – Northern Territory
Trends in the past three months’ experience and current expectations - Northern Territory
Confidence in own business prospects in next 12 months Dec 14 Mar 15 Jun 15 Sep 15 Dec 15
Positive 62% 53% 59% 54% 53%
Negative 16% 18% 16% 32% 29%
*Net Balance +46 +35 +43 +22 +24
* Net balance is defined as the difference between the percentage with a positive outlook and the percentage with a negative outlook. ** This is for last 3 months.*** This was a new question in the December Quarter 2015 survey asked about the last 12 months.
*Net balance
Actual experience**: Expectation for next 3 and 12 months:
Dec 2014 Sep 2015 Dec 2015 Dec 2015 Dec 2016
Sales +1 -2 -3 -9 +30
Size of workforce -2 -1 0 -10 +5
Wages -3 +9 +12 -3 +21
Prices -1 +15 +10 +7 +29
Profitability -7 -8 -17 -14 +28
Capital expenditure NA NA +10 *** NA -4
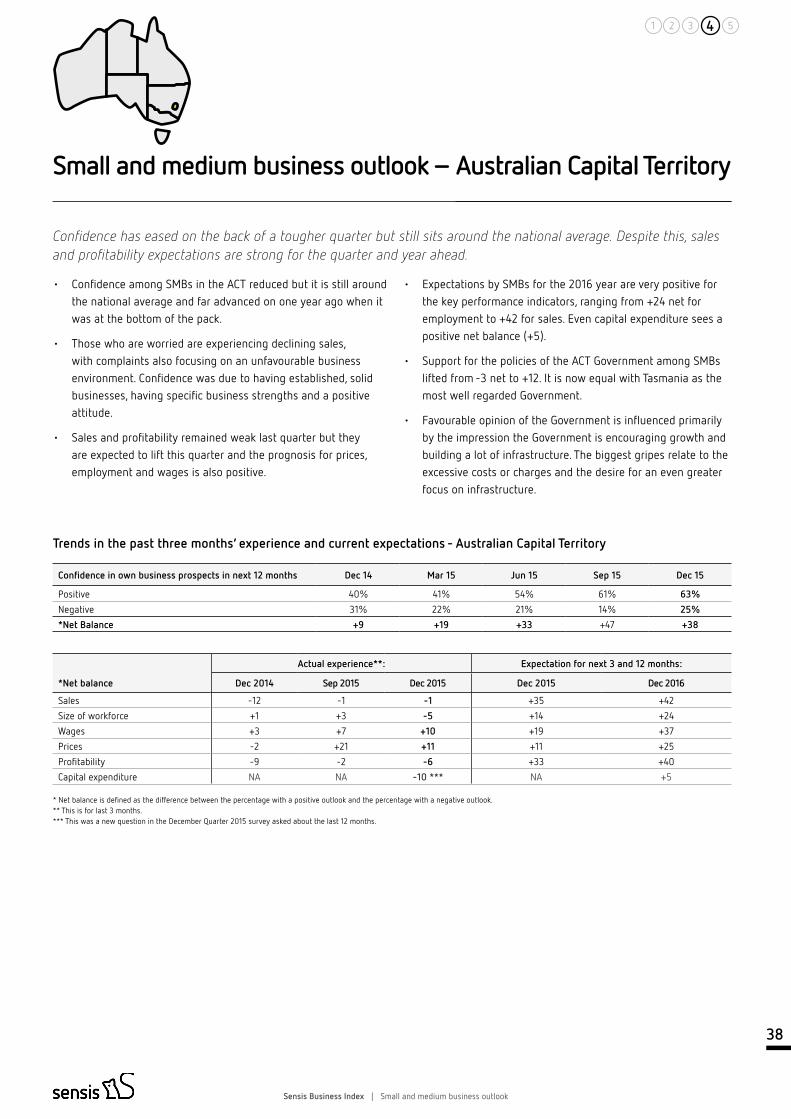
38
21 53 4
Sensis Business Index | Small and medium business outlook
Confidence has eased on the back of a tougher quarter but still sits around the national average. Despite this, sales and profitability expectations are strong for the quarter and year ahead.
• Confidence among SMBs in the ACT reduced but it is still around the national average and far advanced on one year ago when it was at the bottom of the pack.
• Those who are worried are experiencing declining sales, with complaints also focusing on an unfavourable business environment. Confidence was due to having established, solid businesses, having specific business strengths and a positive attitude.
• Sales and profitability remained weak last quarter but they are expected to lift this quarter and the prognosis for prices, employment and wages is also positive.
• Expectations by SMBs for the 2016 year are very positive for the key performance indicators, ranging from +24 net for employment to +42 for sales. Even capital expenditure sees a positive net balance (+5).
• Support for the policies of the ACT Government among SMBs lifted from -3 net to +12. It is now equal with Tasmania as the most well regarded Government.
• Favourable opinion of the Government is influenced primarily by the impression the Government is encouraging growth and building a lot of infrastructure. The biggest gripes relate to the excessive costs or charges and the desire for an even greater focus on infrastructure.
Small and medium business outlook – Australian Capital Territory
Trends in the past three months’ experience and current expectations - Australian Capital Territory
Confidence in own business prospects in next 12 months Dec 14 Mar 15 Jun 15 Sep 15 Dec 15
Positive 40% 41% 54% 61% 63%
Negative 31% 22% 21% 14% 25%
*Net Balance +9 +19 +33 +47 +38
* Net balance is defined as the difference between the percentage with a positive outlook and the percentage with a negative outlook. ** This is for last 3 months.*** This was a new question in the December Quarter 2015 survey asked about the last 12 months.
*Net balance
Actual experience**: Expectation for next 3 and 12 months:
Dec 2014 Sep 2015 Dec 2015 Dec 2015 Dec 2016
Sales -12 -1 -1 +35 +42
Size of workforce +1 +3 -5 +14 +24
Wages +3 +7 +10 +19 +37
Prices -2 +21 +11 +11 +25
Profitability -9 -2 -6 +33 +40
Capital expenditure NA NA -10 *** NA +5

Sensis Business Index | Industry snapshots
39
21 43 5
Industry Snapshots

Sensis Business Index | Industry snapshots
40
21 43 5
Industry snapshots
Confidence is relatively low but SMB manufacturers are quite optimistic about the quarter and year ahead.
Confidence eased back two points to a net balance of +15. This is 24 points below the national average and manufacturing is now the least confident sector.
Lack of confidence reflects lower sales and a perceived poor business environment. Confident manufacturers cited healthy sales and initiatives taken by the business.
Last quarter, manufacturers reported negative sales (-2), profitability (-8) and employment (-5) but positive wages (+11) and prices (+3).
For the current quarter expectations are positive on sales (+10), profitability (+9), prices (+25), wages (+9) and employment (+6). Similarly, expectations are very positive for the year ahead - sales (+40), profitability (+29), prices (+42), wages (+17) and employment (+13). Capital expenditure expectations for 2016 are negative (-14).
Overall confidence increased sharply in this sector underpinning bullish expectations for key indicators.
A big rise from +26 net to +47 makes this the second most confident sector.
Confidence has reflected healthy sales. Unfavourable business conditions and lower sales are concerning those with a worried outlook.
Last quarter sales (-1) and profitability (0) were flat and the net balances for the other indicators were -4 for employment, +3 for wages and +7 for prices.
This quarter, building and construction SMBs are fairly optimistic about sales (+11), profitability (+10), prices (+14) and wages (+13) but less so about employment (+4). For the year ahead expectations are buoyant for sales (+28), profitability (+23), prices (+30) and wages (+25), and fairly positive for employment (+8). However, the capital expenditure expectation is negative (-2).
Manufacturing
Building and Construction
-20
20
40
0
60
National ConfidenceBuilding and Construction Confidence
National ConfidenceManufacturing Confidence
Dec 0
9
Dec 0
9
Dec 1
0De
c 10
Dec 1
1De
c 11
Dec 1
2De
c 12
Dec 1
3De
c 13
Dec 1
4De
c 14
Dec 1
5De
c 15
-20
20
40
0
Manufacturing Confidence
Building and Construction Confidence
+15
+47

Sensis Business Index | Industry snapshots
41
21 43 5
Industry snapshots
Confidence has rebounded but is still below average. However, performance expectations are in the top tier.
Confidence has bounced back among wholesalers with the net balance rising from +2 to +30, where it was in the June quarter.
Higher sales and being an established business are the key factors generating confidence. Unfavourable business conditions are the biggest concern.
Sales (+14) were positive but profitability (-12) was negative last quarter and prices displayed a net balance of +26 (up from +7). The other two indicators were just positive. Current quarter expectations for all indicators are mostly positive ranging from +17 for profitability to +23 for sales. Employment is at +4.
Expectations for 2016 are among the highest for sales (+48), prices (+46), wages (+39), profitability (+31) and employment (+14). Capital expenditure (-9) is an exception.
Wholesale Trade
Overall confidence rose slightly but is well under the national average, however retailers are expecting to perform well this quarter and next year.
Confidence improved by three points to +19 in retail, but this sector is still one of the least confident.
Specific business strengths and being an established business are the main influences on confidence. Difficult business conditions and declining sales are the primary causes of pessimism.
In the last quarter, sales (-13) and profitability (-23) were negative but the other indicators were not – employment (+7), wages (+16) and prices (+15).
For the current quarter, expectations in this sector are upbeat for sales (+32), profitability (+27) and prices (+21). They are also positive for wages (+10) and employment (+5).
Year ahead expectations are also positive for sales (+31), profitability (+37), prices (+33), wages (+13) and employment (+3). The capital expenditure expectation for 2016 has a negative net balance (-5).
Retail Trade
-20
20
40
0
60
National ConfidenceRetail Trade Confidence
-20
20
40
0
60
National ConfidenceWholesale Trade Confidence
Dec 0
9
Dec 1
0
Dec 1
1
Dec 1
2
Dec 1
3
Dec 1
4
Dec 1
5
Dec 0
9
Dec 1
0
Dec 1
1
Dec 1
2
Dec 1
3
Dec 1
4
Dec 1
5
Wholesale Trade Confidence
Retail Trade Confidence
+30
+19

Sensis Business Index | Industry snapshots
42
21 43 5
Industry snapshots
A difficult quarter has dented confidence in this sector but hopes are quite high for 2016.
This sector continues to fluctuate on confidence which fell six points to +24, making it one of the least confident sectors.
A positive attitude is the primary driver of confidence in this sector. Unfavourable business conditions and decreasing sales characterise the views of those who are concerned.
Last quarter balances were negative on four of the indicators, sales (-20), profitability (-14), wages (-11) and employment (-7). However, they were positive for prices (+7).
In this quarter expectations are slightly positive ranging from +2 (sales and profitability) to +5 (prices).
Year ahead expectations are stronger - sales (+24), profitability (+13), wages (+28), employment (+13) and prices (+28). Capital expenditure expectations are the softest for all sectors, with a net balance of -21.
Transport and Storage
Confidence is marginally lower but near the national average. Despite a soft performance of late, performance expectations for next year are high.
Confidence was marginally down from +40 net to +38, still close to the national average.
Having specific business strengths and being an established, solid business are driving confidence above other factors. Weaker sales and an unfavourable business environment are the dominant causes of concern.
Last quarter, key indicator results were positive but not strong for sales (+7), profitability (+10), prices (+12), wages (+6) and employment (+3). That is also the case for this quarter with sales and profitability both at +12 and the other three indicators with balances of +2 to +8.
For 2016, expectations for the key indicators are solid, with sales at +35, profitability at +31, prices and wages at +25 and employment at +19. Capital expenditure expectations for 2016 reveal a negative net balance of -9.
Communication, Property and Business Services
-20
20
40
0
60
Transport and Storage Confidence National Confidence
National ConfidenceCommunication, Property and Business Services Confidence
-20
20
40
0
60
Dec 1
4
Dec 1
5
Dec 0
9
Dec 1
0
Dec 1
1
Dec 1
2
Dec 1
3
Dec 0
9
Dec 1
0
Dec 1
1
Dec 1
2
Dec 1
3
Dec 1
4
Dec 1
5
Transport and Storage Confidence
Communication, Property and Business Services Confidence
+24
+38

Sensis Business Index | Industry snapshots
43
21 43 5
Industry snapshots
Confidence leaps again and this sector now leads on this statistic by a significant amount.
Confidence has accelerated rising from +27 to +41 to +65, which is 26 points above the national average. Being established and the initiatives taken drove confidence most of all. Falling sales was mentioned most by worried SMBs in this sector.
Last survey, all indicators were unimpressive, especially profitability (-11) with sales also low (+4). This quarter major improvements are expected in sales (+32) and profitability (+14).
For the year ahead, sales (+53) and profitability (+40) expectations are the strongest and they are also relatively high for wages (+30), prices (+25) and employment (+15). Capital expenditure expectations also have a positive net balance (+3) unlike most other sectors.
Confidence sits just above the national average. Year ahead expectations are for solid improvement.
Confidence in this sector lifted two points to +40, keeping above the national average.
Specific business strengths are the key cause of confidence, while difficult business, economic or industrial conditions are the dominant issue for those lacking confidence.
Last quarter sales were soft (+5), as was profitability (0) and prices (+1). Wages grew (+14), while employment fell (-3).
This quarter, sales expectations are a little higher (+9) but not for profitability (-6). Employment (+5) and prices (+3) are just positive. For the year ahead there is a better outlook for sales (+22), profitability (+26), wages (+19) and prices (+24). However, employment (+1) and capital expenditure (0) will be flat.
Finance and Insurance
Health and Community Services
Finance and Insurance Confidence National Confidence
-20
20
40
0
60
80
-20
20
40
0
60
Health and Community Services Confidence
National Confidence
80
Dec 0
9
Dec 1
0
Dec 1
1
Dec 1
2
Dec 1
3
Dec 1
4
Dec 1
5
Dec 0
9
Dec 1
0
Dec 1
1
Dec 1
2
Dec 1
3
Dec 1
4
Dec 1
5
Finance and Insurance Confidence
Health and Community Services Confidence
+40
+65

Sensis Business Index | Industry snapshots
44
21 43 5
Industry snapshots
A significant confidence boost was recorded. There are bullish expectations for this quarter and 2016.
Overall confidence in this sector continues to bounce around with the net balance almost doubling this quarter from +22 to +42.
Being a solid, established business is the prime catalyst for confidence, while an unfavourable business environment and falling sales most concern those who are worried.
Sales were positive last quarter (+6) but profitability was flat (0). Prices lifted (+14), with wages (+7) and employment (+8) also positive.
For the current quarter there are fairly positive expectations all round and even more so for 2016. The net balances for the indicators in 2016 are +45 for sales, +28 for profitability, +29 for wages, +37 for prices and +14 for employment. For capital expenditure -4 was recorded.
Overall confidence again lifted despite the tough conditions experienced and expected this quarter. 2016 looks good for many in this sector.
Confidence in this sector again increased solidly by 14 points to +38, keeping it near the national average.
Rising sales followed by being an established, solid business, mostly explained confidence. The prime concerns emerging were an unfavourable business, economic or industrial environment followed by unfavourable Government policy.
Last quarter sales (+1) and profitability (-5) performances were hardly inspiring, nor were the other indicators - employment (-1), wages (+7) and prices (+8).
Apart from prices (+19), any expected growth this quarter should be modest at best – sales (+7), profitability (-9), wages (+10) and employment (-2).
2016 is anticipated to be considerably better - sales (+27), profitability (+16) employment (+13), wages (+26) and prices (+38). Capital expenditure expectations do not reflect this view however (-12).
Hospitality (Accommodation, Cafes and Restaurants)
Cultural, Recreational and Personal Services
-20
20
40
0
60
Cultural, Recreational and Personal Services Confidence
National Confidence
-20
20
40
0
60
Hospitality (Accommodation, Cafes and Restaurants) Confidence
National Confidence
Dec 0
9
Dec 1
0
Dec 1
1
Dec 1
2
Dec 1
3
Dec 1
4
Dec 1
5
Dec 0
9
Dec 1
0
Dec 1
1
Dec 1
2
Dec 1
3
Dec 1
4
Dec 1
5
Cultural, Recreational and Personal Services Confidence
Hospitality (Accommodation, Cafes and Restaurants) Confidence
+42
+38

45
21 43 5
The Sensis Business Index reports are updated each quarter. Electronic copies of the reports can be accessed on the Sensis website at: www.sensis.com.au/about/reports.
Sensis Business Index “Special Reports”
Since the inception of the Sensis Business Index, a range of Special Reports have been produced. Major reports include:
• Sensis Social Media Report – May 2011, May 2012, May 2013, April 2014 and May 2015
• Engaging the Dragon: Australian SME Exporters and China (with Austrade) – August 2008
• Sensis Environment Report – September 2007
• Teleworking - June 2005
• E-Business: The online experience of Australian SMEs – Annually since 1995
• Innovation – March 2001
• Finance & Banking Issues – August 1993, August 1995 and November 1999
• Attitudes to Changes in FBT – July 1999
• Workers Compensation and Workplace Safety – November 1998
• The Paper Work Burden on Small Business – October 1996
• Women in Business – July 1994 and February 1996
• Attitudes to Government – October 1994 and November 1995
About Sensis:
As Australia’s #1 marketing services company, we’re here to engage consumers with Australian businesses. We make this happen through a number of leading brands - Yellow Pages, White Pages, TrueLocal, Whereis and Skip and our expert digital know-how. Our digital expertise is what sets us apart - we give businesses a competitive edge through websites, search engine marketing and optimisation, data, and through our digital advertising agency, Found.
Sensis Pty Ltd 222 Lonsdale Street, Melbourne VIC 3000 Tel: + 61 3 8653 5000 | Twitter: @Sensis | www.sensis.com.au
The material contained in this publication is general only and is not intended as advice on any particular matter. No reader should act or fail to act on the basis of this report. Sensis Pty Ltd disclaims to the
maximum extent permitted by law all liability, costs and expenses incurred by any person in conjunction with the content of this report.