business management plan for kempsey shire … by sgl consulting group australia pty ltd appendix a...
TRANSCRIPT

Prepared by SGL Consulting Group Australia Pty Ltd
www.sglgroup.net
Business Management Plan for Kempsey Shire Caravan Parks 2016 to 2021 Draft Report December 2015
APPENDIX A Page 1BMP - KSC CP
15DEC2015

SGL Consulting Group Australia Pty Ltd Adelaide 2a Mellor St West Beach SA 5024 Phone: +61 (08) 8235 0925 Fax: +61 (08) 8353 1067 Email: [email protected] Brisbane PO Box 713 Mount Gravatt Queensland 4122 Mobile: +61 (0) 416 235 235 Email: [email protected] Melbourne Level 6, 60 Albert Road South Melbourne VIC 3205 Phone: +61 (03) 9698 7300 Fax: +61 (03) 9698 7301 Email: [email protected] Perth 19 Clayton Street East Fremantle WA 6158 Phone: +61 (0) 8 9319-8991 Mobile: +61 (0) 407 901 636 Email: [email protected] Sydney 1/273 Alfred St Nth North Sydney NSW 2060 Mobile: +61 (04) 17 536 198 Email: [email protected]
SGL also has offices in: • Auckland • Christchurch • Wellington
APPENDIX A Page 2BMP - KSC CP
15DEC2015

Business Management Plan for KSC Caravan Parks 26-11-2015 (NSW 11.2014) - 7 December 2015 Commercial in Confidence. SGL Consulting Group Australia Pty Ltd www.sglgroup.net
Table of Contents
1 Background ......................................................................................................... 1 1.1 Project Overview ..................................................................................................... 1 1.2 Project Aims and Objectives .................................................................................. 1 1.3 Project Methodology ............................................................................................... 2 1.4 Kempsey Shire Area Overview ............................................................................... 3 1.5 Macleay Valley Coast Overview .............................................................................. 4 1.6 Tourism Profile ........................................................................................................ 4
1.6.1 Overview of Macleay Valley Coast Assets and Products ..................................... 5 1.6.2 Visitor Expenditure Trends ................................................................................... 6 1.6.3 MVC Visitation Trends ......................................................................................... 6 1.6.4 MVC Visitor Profiles ............................................................................................. 7
2 Review of Councils Caravan Parks ................................................................... 9 2.1 Introduction ............................................................................................................. 9 2.2 Historical Review of Council Caravan Parks ......................................................... 9
2.2.1 1988 Kempsey Shire Caravan Park Management Plan ....................................... 9 2.2.2 2005 Kempsey Shire Caravan Park Management Plans ................................... 10 2.2.3 Caravan Park Operational Changes and Improvements from 2005 ................... 11
2.3 Review of Kempsey Shire Holiday Parks ............................................................. 11 2.3.1 Crescent Head Holiday Park .............................................................................. 12 2.3.1.1 CH Holiday Park Cabin and Site Capacities .................................................... 13 2.3.1.2 CH Holiday Park Cabin Occupancy 2013/14 ................................................... 13 2.3.1.3 CH Holiday Park Tourist Site Occupancy 2013/14 .......................................... 13 2.3.1.4 CH Holiday Park Financial Trends 2011 to 2014 ............................................. 14 2.3.2 Hat Head Holiday Park ...................................................................................... 14 2.3.2.1 HH Holiday Park Cabin and Site Capacities .................................................... 14 2.3.2.2 HH Holiday Park Cabin Occupancy 2013/14 ................................................... 15 2.3.2.3 HH Holiday Park Tourist Site Occupancy 2013/14 .......................................... 16 2.3.2.4 HH Holiday Park Financial Trends 2011 to 2014 ............................................. 16 2.3.3 Horseshoe Bay Holiday Park ............................................................................. 16 2.3.3.1 HB Holiday Park Cabin and Site Capacities .................................................... 17 2.3.3.2 HB Holiday Park Cabin Occupancy 2013/14 ................................................... 17 2.3.3.3 HB Holiday Park Tourist Site Occupancy 2013/14 .......................................... 18 2.3.3.4 HB Holiday Park Financial Trends 2011 to 2014 ............................................. 18 2.3.4 Stuarts Point Holiday Park ................................................................................. 19 2.3.4.1 SP Holiday Park Cabin and Site Capacities .................................................... 19 2.3.4.2 SP Holiday Park Cabin Occupancy 2013/14 ................................................... 20 2.3.4.3 SP Holiday Park Tourist Site Occupancy 2013/14 .......................................... 20 2.3.4.4 SP Holiday Park Financial Trends 2011 to 2014 ............................................. 20 2.3.5 Grassy Head Holiday Park ................................................................................. 21 2.3.5.1 GH Holiday Park Cabin and Site Capacities ................................................... 21 2.3.5.2 GH Holiday Park Cabin Occupancy 2013/14 .................................................. 22 2.3.5.3 GH Holiday Park Tourist Site Occupancy 2013/14 .......................................... 22 2.3.5.4 GH Holiday Park Financial Trends 2011 to 2014 ............................................ 23
2.4 Combined MVC Holiday Parks Review ................................................................ 23 2.4.1.1 MVC Combined Holidays Park Cabin and Site Capacities .............................. 23 2.4.1.2 MVC Combined Holiday Parks Cabin Occupancy 2013/14 ............................. 24 2.4.1.3 MVC Combined Holiday Parks Tourist Site Occupancy 2013/14 .................... 25 2.4.1.4 MVC Combined Holiday Parks Financial Trends 2011 to 2014 ....................... 26 2.4.1.5 MVC Combined Holiday Parks Income Trends 2013/2014 ............................. 26 2.4.1.6 MVC Combined Holiday Parks Capital Improvements 2011 to 2014 ............... 27
APPENDIX A Page 3BMP - KSC CP
15DEC2015
Business Management Plan for KSC Caravan Parks 26-11-2015 (NSW 11.2014) - 7 December 2015 Commercial in Confidence. SGL Consulting Group Australia Pty Ltd www.sglgroup.net
2.5 MVC Holiday Parks Management Contract Review ............................................. 28
3 Caravan Park Research and Trends Review .................................................. 30 3.1 Introduction ........................................................................................................... 30 3.2 Review of Local Relevant Documents ................................................................. 30
3.2.1 Holiday Park Cabins Structural Report 2014 ...................................................... 30 3.2.2 Macleay Valley Coastal Holiday Parks Marketing Plan ...................................... 31 3.2.3 MVC Holiday Parks Business Planning Workshop May 2014 ............................ 32
3.3 Caravan Parks Research and Industry Trends .................................................... 33 3.4 Local Area Caravan Park and Accommodation Review ..................................... 35
4 Future KSC Holiday Park Business Improvements ....................................... 36 4.1 Introduction ........................................................................................................... 36 4.2 MVC Holiday Park Review Key Findings ............................................................. 36
4.2.1 Historical Trends See Major Returns on Holiday Park Investment ..................... 36 4.2.2 Holiday Parks are a Major Outlet for Local Tourism Economic Growth .............. 37 4.2.3 Major Local Business that has Capacity for Increased Growth .......................... 37 4.2.4 Future MVC Holiday Park Business Impacts ...................................................... 38
4.3 Future HP Business Strategy 2016 to 2021 ......................................................... 38 4.3.1 New Holiday Park Market and Development Categories .................................... 38 4.3.2 Reducting Holiday Park Sites ............................................................................ 39 4.3.3 Continue to Improve High Yield Accommodation Opportunities ......................... 40 4.3.4 New/Redeveloped Facilities/Services To Increase Occupancy/Income ............. 40
4.4 2016 to 2021 Capital Improvement Program ........................................................ 41 4.4.1 Future Park Improvements and Costs 5 Year Program ...................................... 48 4.4.1.1 Destination Holiday Parks ............................................................................... 48 4.4.1.2 Unique Environment Holiday Parks ................................................................. 49 4.4.1.3 Outdoor Adventure Holiday Parks ................................................................... 50 4.4.1.4 Recommended Combined HP Capital Improvement Works ............................ 50
4.5 Funding Options and Opportunities .................................................................... 51 4.5.1.1 Existing Holiday Park Loan Commitments ...................................................... 52 4.5.2 Current Reserve Funds ..................................................................................... 53 4.5.3 Revenue Projections from New Accommodation Investments ........................... 53 4.5.4 Revenue Projections for Site En-Suite Improvements ........................................ 55 4.5.5 Funding Opportunities and Options ................................................................... 55
4.6 Future Management Options and Opportunities ................................................. 56 4.6.1 Current Management Contract Financial Performance ...................................... 57 4.6.2 Current Management Contract Issues ............................................................... 57 4.6.3 Future Management Contract Opportunities ...................................................... 58 4.6.4 Future Business Direction Needs to Guide Future Management Model ............. 59 4.6.5 Recommended Future Management Model ....................................................... 59 4.6.6 Procuring New Management Deal ..................................................................... 60 4.6.7 What level of Business Improvement Does Council Want to Achieve? .............. 60
4.7 Project Recommendations ................................................................................... 61
Directory of Tables TABLE 1.1 PROJECT METHODOLOGY AND ASSOCIATED PHASES ............................................... 2 TABLE 1.2 KSC HOLIDAY PARK BEDS 2013 ....................................................................................... 5 TABLE 1.3 MVC VISITATION TRENDS BY VISITOR TYPE ................................................................. 6 TABLE 1.4 MVC KEY VISITOR CATEGORIES SUMMARY .................................................................. 7 TABLE 2.1 CRESCENT HEAD HOLIDAY PARK CABIN AND SITE CAPACITIES 2015 .................... 13 TABLE 2.2 CRESCENT HEAD HOLIDAY PARK CABIN OCCUPANCY 2013/14 ............................... 13 TABLE 2.3 CRESCENT HEAD HOLIDAY PARK TOURIST SITE OCCUPANCY 2013/14 ................. 13
APPENDIX A Page 4BMP - KSC CP
15DEC2015

Business Management Plan for KSC Caravan Parks 26-11-2015 (NSW 11.2014) - 7 December 2015 Commercial in Confidence. SGL Consulting Group Australia Pty Ltd www.sglgroup.net
TABLE 2.4 CRESCENT HEAD HOLIDAY PARK FINANCIAL TRENDS 2011 TO 2014 ..................... 14 TABLE 2.5 HAT HEAD HOLIDAY PARK CABIN AND SITE CAPACITIES 2015 ................................ 14 TABLE 2.6 HAT HEAD HOLIDAY PARK CABIN OCCUPANCY 2013/14 ........................................... 15 TABLE 2.7 HAT HEAD HOLIDAY PARK TOURIST SITE OCCUPANCY 2013/14.............................. 16 TABLE 2.8 HAT HEAD HOLIDAY PARK FINANCIAL TRENDS 2011 TO 2014 .................................. 16 TABLE 2.9 HORSESHOE BAY HOLIDAY PARK CABIN AND SITE CAPACITIES 2015 ................... 17 TABLE 2.10 HORSESHOE BAY HOLIDAY PARK CABIN OCCUPANCY 2013/14 ............................ 18 TABLE 2.11 HORSESHOE BAY HOLIDAY PARK TOURIST SITE OCCUPANCY 2013/14 .............. 18 TABLE 2.12 HORSESHOE BAY HOLIDAY PARK FINANCIAL TRENDS 2011 TO 2014 ................... 18 TABLE 2.13 STUARTS POINT HOLIDAY PARK CABIN AND SITE CAPACITIES 2015 .................... 19 TABLE 2.14 STUARTS POINT HOLIDAY PARK CABIN OCCUPANCY 2013/14 ............................... 20 TABLE 2.15 STUARTS POINT HOLIDAY PARK TOURIST SITE OCCUPANCY 2013/14 ................. 20 TABLE 2.16 STUARTS POINT HOLIDAY PARK FINANCIAL TRENDS 2011 TO 2014 ..................... 21 TABLE 2.17 GRASSY HEAD HOLIDAY PARK CABIN AND SITE CAPACITIES 2015....................... 21 TABLE 2.18 GRASSY HEAD HOLIDAY PARK CABIN OCCUPANCY 2013/14 .................................. 22 TABLE 2.19 GRASSY HEAD HOLIDAY PARK TOURIST SITE OCCUPANCY 2013/14 .................... 23 TABLE 2.20 GRASSY HEAD HOLIDAY PARK FINANCIAL TRENDS 2011 TO 2014 ........................ 23 TABLE 2.21 MVC COMBINED HOLIDAY PARK CABIN AND SITE CAPACITIES 2015 .................... 24 TABLE 2.22 MVC COMBINED HP CABIN/SITE CAPACITIES 1996/97 AND 2014/15 ....................... 24 TABLE 2.23 MVC COMBINED HOLIDAY PARKS CABIN OCCUPANCY 2013/14 ............................. 25 TABLE 2.24 MVC COMBINED HOLIDAY PARKS TOURIST SITE OCCUPANCY 2013/14 ............... 25 TABLE 2.25 MVC COMBINED HOLIDAY PARKS FINANCIAL TRENDS 2011 TO 2014 ................... 26 TABLE 2.26 MVC COMBINED HOLIDAY PARKS FINANCIAL TRENDS 2011 TO 2014 ................... 27 TABLE 2.27 MVC COMBINED HOLIDAY PARKS CAPITAL IMPROVEMENTS 2011 TO 2014 ........ 27 TABLE 2.28 MVC COMBINED HOLIDAY PARKS CAPITAL IMPROVEMENTS 2014/15 .................. 28 TABLE 4.1 MVC HOLIDAY PARKS CUSTOMER SELECTION CRITERIA REVIEW ......................... 41 TABLE 4.2 REVIEW OF MANUFACTURED CABINS SUITABLE FOR MVC HOLIDAY PARKS ....... 47 TABLE 4.3 DESTINATION HOLIDAY PARKS 5 YEAR CAPITAL IMPROVEMENT WORKS ............. 48 TABLE 4.4 UNIQUE ENVIRONMENT HP 5 YEAR CAPITAL IMPROVEMENT WORKS ................... 49 TABLE 4.5 OUTDOOR ADVENTURE HP 5 YEAR CAPITAL IMPROVEMENT WORKS ................... 50 TABLE 4.6 RECOMMENDED COMBINED HP CAPITAL IMPROVEMENT WORKS ......................... 51 TABLE 4.7 EXISTING HOLIDAY PARK LOAN COMMITMENTS ........................................................ 52 TABLE 4.8 NEW CABIN PROJECTED YEAR ONE REVENUE .......................................................... 53 TABLE 4.9 NEW CABIN PROJECTED YEAR ONE EXPENDITURE .................................................. 54 TABLE 4.10 NEW CABIN PROJECTED YEAR ONE REDUCED SITE INCOME REDUCTION ......... 54 TABLE 4.11 NEW CABIN ESTIMATED NEW OPERATING SURPLUS .............................................. 54 TABLE 4.12 NEW EN-SUITE PROJECTED YEAR ONE REVENUE .................................................. 55 TABLE 4.13 MVC HOLIDAY PARKS MANAGEMENT CONTRACT PAYMENTS 2011 TO 2014 ...... 57
Appendices APPENDIX ONE: 2005 Holiday Parks Management Plan Capital Improvement
Recommendations APPENDIX TWO: May 2013 MVC Holiday Parks Business Planning Forum APPENDIX THREE: Cabin Options Used for Capital Investment Modeling
APPENDIX A Page 5BMP - KSC CP
15DEC2015

Business Management Plan for KSC Caravan Parks 26-11-2015 (NSW 11.2014) - 7 December 2015 Page 1 Commercial in Confidence. SGL Consulting Group Australia Pty Ltd www.sglgroup.net
1.1 Project Overview
Kempsey Shire Council is Reserve Trust Manager for five holiday parks located at popular holiday destinations on the Mid North Coast of NSW approximately mid-way between Brisbane and Sydney. Locations include Crescent Head, Hat Head, Horseshoe Bay, Grassy Head and Stuarts Point. The parks are operated by a private contractor and currently trade as Macleay Valley Coastal Holiday Parks. The project brief indicates the Macleay Valley Coast is popular holiday destination that has experienced strong growth of almost 10 per cent in its visitor economy over the past two years, rising $173M to $189M. This growth has seen the number of visitors to the Macleay rise from 489,000 to 554,000. While the biggest growth has been in the number of day visitors (now contributing $31M to the local economy), significant growth has also been experienced in the overnight visitor market, rising from 247,000 in 2011 to 269,000 for the year ended September 2013. Macleay Valley Coastal Holiday Parks are the single largest provider of accommodation beds in the Kempsey local government area, contributing approximately one-third (3571 of a total 10,764) of the Shire’s beds through a combination of cabins and campsites. All five parks are located in prime coastal locations, featuring pristine environmental surrounds, long stretches of sandy beaches, a sub-tropical climate and ideal conditions for surfing, fishing and other water-based recreational activities. The parks’ unique natural environs cannot, however, continue to be relied upon to attract new and returning visitors, particularly in what is becoming an increasingly sophisticated holiday park market. Recent visitor feedback suggests visitor expectations in relation to accommodation quality, public amenities, grounds, facilities and services are no longer being met. Council through this study is seeking to develop a comprehensive Plan of Management for the five holiday parks.
1.2 Project Aims and Objectives
The Plan of Management will provide Council with market analysis, a business plan (including cost-benefit analysis and fee modelling) and a budgeted capital works program that will be aimed at securing the parks’ long-term competitive advantage and commercial viability. This has involved:
Completing market analysis and a business plan to improve the parks’ long-term commercial viability, including identifying each park’s niche market strengths and opportunities.
Completing a full cost-benefit analysis for a range of capital upgrade options, including the type and style of accommodation offered, amenities, grounds, facilities and other value-add services aimed at enhancing the visitor experience.
1 Background
APPENDIX A Page 6BMP - KSC CP
15DEC2015
Business Management Plan for KSC Caravan Parks 26-11-2015 (NSW 11.2014) - 7 December 2015 Page 2 Commercial in Confidence. SGL Consulting Group Australia Pty Ltd www.sglgroup.net
Reviewing and recommending the most effective and efficient management model, including operational and reporting processes for day-to-day management.
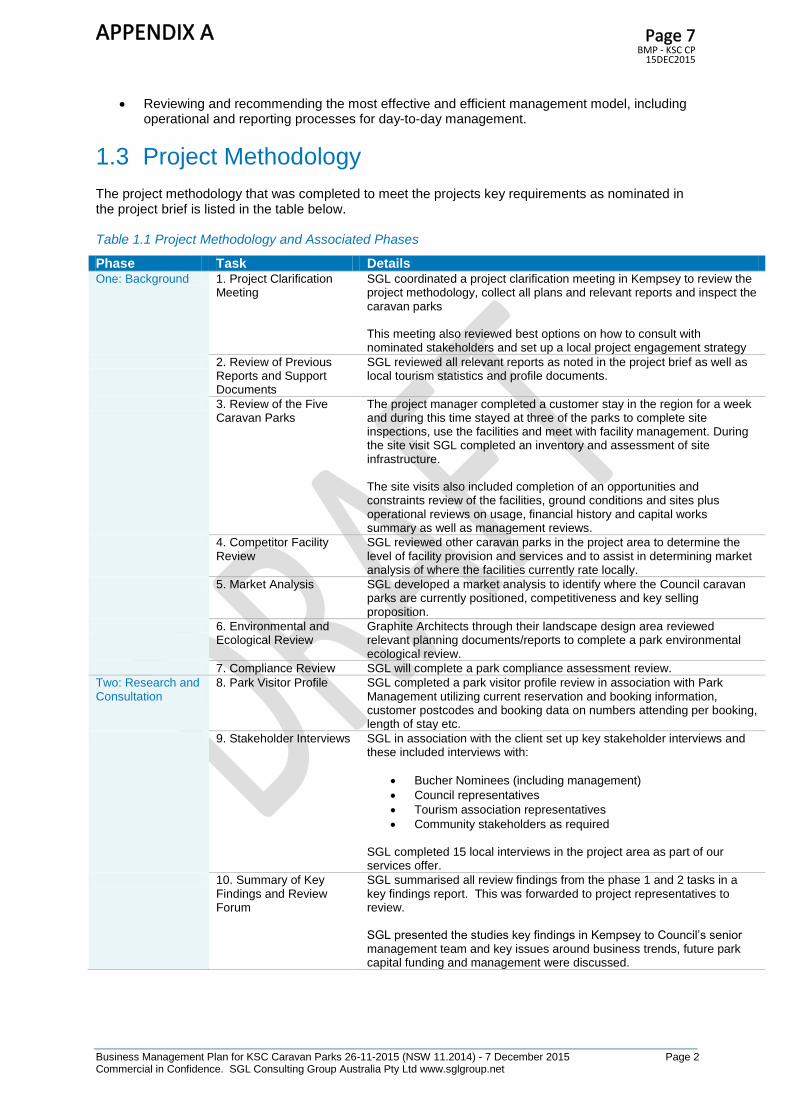
1.3 Project Methodology
The project methodology that was completed to meet the projects key requirements as nominated in the project brief is listed in the table below. Table 1.1 Project Methodology and Associated Phases
Phase Task Details One: Background 1. Project Clarification
Meeting SGL coordinated a project clarification meeting in Kempsey to review the project methodology, collect all plans and relevant reports and inspect the caravan parks This meeting also reviewed best options on how to consult with nominated stakeholders and set up a local project engagement strategy
2. Review of Previous Reports and Support Documents
SGL reviewed all relevant reports as noted in the project brief as well as local tourism statistics and profile documents.
3. Review of the Five Caravan Parks
The project manager completed a customer stay in the region for a week and during this time stayed at three of the parks to complete site inspections, use the facilities and meet with facility management. During the site visit SGL completed an inventory and assessment of site infrastructure. The site visits also included completion of an opportunities and constraints review of the facilities, ground conditions and sites plus operational reviews on usage, financial history and capital works summary as well as management reviews.
4. Competitor Facility Review
SGL reviewed other caravan parks in the project area to determine the level of facility provision and services and to assist in determining market analysis of where the facilities currently rate locally.
5. Market Analysis SGL developed a market analysis to identify where the Council caravan parks are currently positioned, competitiveness and key selling proposition.
6. Environmental and Ecological Review
Graphite Architects through their landscape design area reviewed relevant planning documents/reports to complete a park environmental ecological review.
7. Compliance Review SGL will complete a park compliance assessment review.
Two: Research and Consultation
8. Park Visitor Profile SGL completed a park visitor profile review in association with Park Management utilizing current reservation and booking information, customer postcodes and booking data on numbers attending per booking, length of stay etc.
9. Stakeholder Interviews SGL in association with the client set up key stakeholder interviews and these included interviews with:
Bucher Nominees (including management)
Council representatives
Tourism association representatives
Community stakeholders as required SGL completed 15 local interviews in the project area as part of our services offer.
10. Summary of Key Findings and Review Forum
SGL summarised all review findings from the phase 1 and 2 tasks in a key findings report. This was forwarded to project representatives to review. SGL presented the studies key findings in Kempsey to Council’s senior management team and key issues around business trends, future park capital funding and management were discussed.
APPENDIX A Page 7BMP - KSC CP
15DEC2015
Business Management Plan for KSC Caravan Parks 26-11-2015 (NSW 11.2014) - 7 December 2015 Page 3 Commercial in Confidence. SGL Consulting Group Australia Pty Ltd www.sglgroup.net
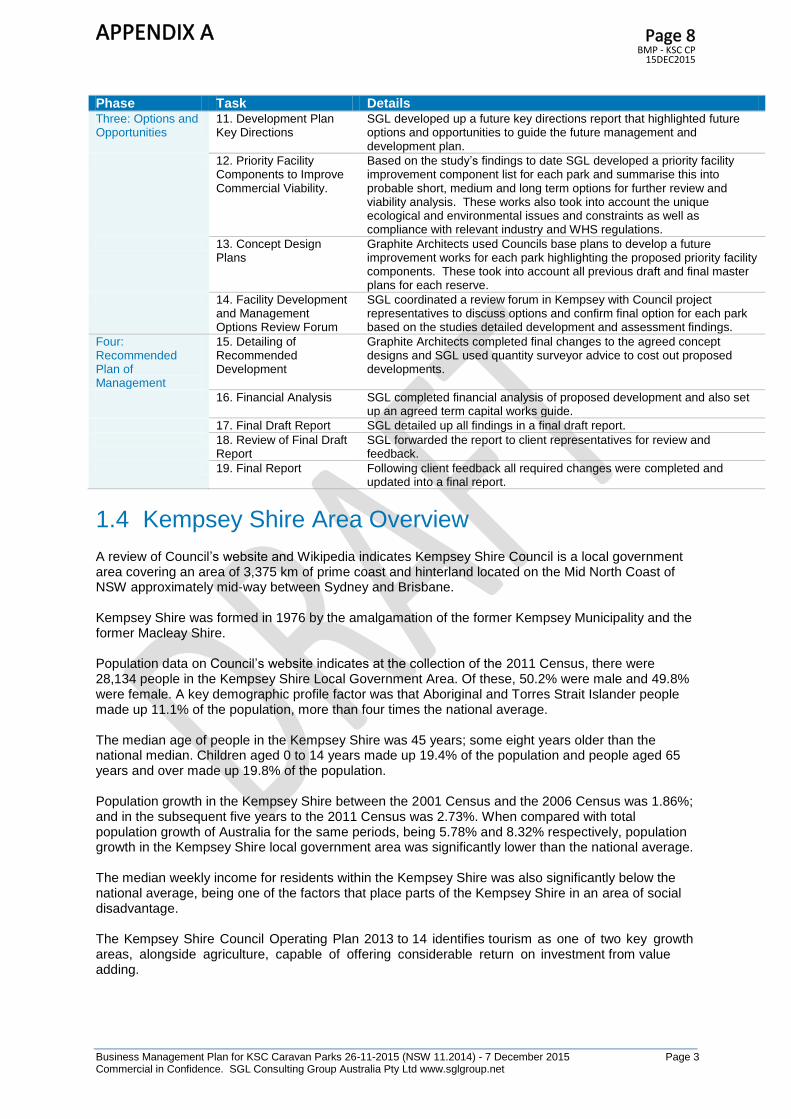
Phase Task Details Three: Options and Opportunities
11. Development Plan Key Directions
SGL developed up a future key directions report that highlighted future options and opportunities to guide the future management and development plan.
12. Priority Facility Components to Improve Commercial Viability.
Based on the study’s findings to date SGL developed a priority facility improvement component list for each park and summarise this into probable short, medium and long term options for further review and viability analysis. These works also took into account the unique ecological and environmental issues and constraints as well as compliance with relevant industry and WHS regulations.
13. Concept Design Plans
Graphite Architects used Councils base plans to develop a future improvement works for each park highlighting the proposed priority facility components. These took into account all previous draft and final master plans for each reserve.
14. Facility Development and Management Options Review Forum
SGL coordinated a review forum in Kempsey with Council project representatives to discuss options and confirm final option for each park based on the studies detailed development and assessment findings.
Four: Recommended Plan of Management
15. Detailing of Recommended Development
Graphite Architects completed final changes to the agreed concept designs and SGL used quantity surveyor advice to cost out proposed developments.
16. Financial Analysis SGL completed financial analysis of proposed development and also set up an agreed term capital works guide.
17. Final Draft Report SGL detailed up all findings in a final draft report.
18. Review of Final Draft Report
SGL forwarded the report to client representatives for review and feedback.
19. Final Report Following client feedback all required changes were completed and updated into a final report.
1.4 Kempsey Shire Area Overview
A review of Council’s website and Wikipedia indicates Kempsey Shire Council is a local government area covering an area of 3,375 km of prime coast and hinterland located on the Mid North Coast of NSW approximately mid-way between Sydney and Brisbane. Kempsey Shire was formed in 1976 by the amalgamation of the former Kempsey Municipality and the former Macleay Shire. Population data on Council’s website indicates at the collection of the 2011 Census, there were 28,134 people in the Kempsey Shire Local Government Area. Of these, 50.2% were male and 49.8% were female. A key demographic profile factor was that Aboriginal and Torres Strait Islander people made up 11.1% of the population, more than four times the national average. The median age of people in the Kempsey Shire was 45 years; some eight years older than the national median. Children aged 0 to 14 years made up 19.4% of the population and people aged 65 years and over made up 19.8% of the population. Population growth in the Kempsey Shire between the 2001 Census and the 2006 Census was 1.86%; and in the subsequent five years to the 2011 Census was 2.73%. When compared with total population growth of Australia for the same periods, being 5.78% and 8.32% respectively, population growth in the Kempsey Shire local government area was significantly lower than the national average. The median weekly income for residents within the Kempsey Shire was also significantly below the national average, being one of the factors that place parts of the Kempsey Shire in an area of social disadvantage. The Kempsey Shire Council Operating Plan 2013 to 14 identifies tourism as one of two key growth areas, alongside agriculture, capable of offering considerable return on investment from value adding.
APPENDIX A Page 8BMP - KSC CP
15DEC2015

Business Management Plan for KSC Caravan Parks 26-11-2015 (NSW 11.2014) - 7 December 2015 Page 4 Commercial in Confidence. SGL Consulting Group Australia Pty Ltd www.sglgroup.net
1.5 Macleay Valley Coast Overview
Macleay Valley Coast (MVC) is the tourism brand of the Kempsey Shire LGA. The Macleay Valley Coast encompasses the main service town of Kempsey, popular tourist destinations South West Rocks and Crescent Head, and numerous smaller villages and holiday accommodation locations including the coastal areas of Grassy Head, Stuarts Point and Hat Head. The MVC 2014 to 2016 Destination Management Plan indicates that the “Macleay Valley Coast brand
pays tribute to the Macleay River, which features prominently in the local landscape as it flows through the valley from the hinterland to the coast.”
The map below highlights the Macleay Valley area take up and location in context to Brisbane (538kms away) to the north and both Sydney (428kms) and Newcastle (280kms) to the south.
Source: MVC: Destination Management Plan 2014 to 2016
The MVC Destination Management Plan 2014-2016 indicates there is a lot to see and do with a variety of experiences including “famous surfing hot-spots, to timeless forests and imposing mountain ranges, the Macleay Valley Coast is a popular destination for nature-lovers, adventurers, families, couples, fishers, diving enthusiasts, surfers and visitors seeking a peaceful holiday experience in an un-spoilt and relatively underdeveloped destination.”
1.6 Tourism Profile
The MVC Destination Management Plan 2014-2016 indicates the Macleay Valley’s tourism sector is a major contributor to the local economy, generating an estimated $173 million each year. It is also the region’s fourth largest employer, with 8.8 per cent of the local workforce employed in tourism-related businesses. Locally, tourism directly contributes to wages and jobs. Indirectly, it supports numerous local supply chains. Exports from tourism are also the region’s fourth highest, making up 4.9 per cent of all local exports. Kempsey Shire Council recognises the significant economic growth opportunities from growing and value adding to the local tourism industry and supports the State Government’s goal to double overnight expenditure by the year 2020.
APPENDIX A Page 9BMP - KSC CP
15DEC2015

Business Management Plan for KSC Caravan Parks 26-11-2015 (NSW 11.2014) - 7 December 2015 Page 5 Commercial in Confidence. SGL Consulting Group Australia Pty Ltd www.sglgroup.net
Council further recognises that the Visitor Economy is broader than holiday-makers, covering many other visitors to the Macleay Valley Coast for sport, business, events, culture and entertainment, or to visit friends and relatives.
The Kempsey Shire Council Operating Plan 2013/14 identifies tourism as one of two key growth areas, alongside agriculture, capable of considerable return on investment from value adding. The Macleay Valley Coast is an environmentally pristine coast and country destination that is popular among leisure-seekers and outdoor enthusiasts. Visitors are particularly attracted to the natural beauty of the Macleay Valley coastline. From gently rolling waves to pounding surf breaks, the variety and quality of local beaches make them some of Australia’s best, with surfers travelling from around the world to experience the breaks at Crescent Head Surfing Reserve. Within minutes of leaving the beach, visitors can also experience the Australian bush, complete with crystal clear creeks, rocky outcrops, towering eucalypts and good old- fashioned country hospitality. The Upper Macleay River offers some of Australia’s best bass fishing, while lovers of the great outdoors come to camp, bushwalk, explore the restored timber towns and soak up the natural beauty. Nature lovers enjoy mountain biking and bush walking trails, with access to 34 State forests, National Parks and reserves. Much of the Macleay Valley lifestyle is focused on the water, with plenty of locations and opportunities for boating, kayaking, paddle boarding and fishing. Diving is an international draw card, with the dives off South West Rocks some of the finest in the world. Known as ‘the divers dive’, the famous dive off Fish Rock features one of the only dive-through caves in Australia and is home to an abundance of temperate and subtropical marine life, including turtles, rays, eels and fish, as well as being a breeding ground for the rare Grey Nurse Shark. The Macleay is also home to a number of unique tourism icons, including historic Trial Bay Gaol, the most elevated lighthouse on the Australian East Coast, Smoky Cape Lighthouse, the famous Akubra hat and the original Slim Dusty Homestead.
1.6.1 Overview of Macleay Valley Coast Assets and Products The MVC Destination Management Plan 2014 to 2016 highlights a completed audit of tourism related assets and products in July 2013 and notes the following: 1. Accommodation There were 80 accommodation providers who collectively offered 2,703 rooms accounting for over 10,700 beds in Kempsey Shire. The largest concentration of accommodation providers was located at South West Rocks and Kempsey. The review saw the total beds at the 5 council holiday parks being: Table 1.2 KSC Holiday Park Beds 2013
Holiday Park Cabins/Beds Sites/Beds Total Beds
Crescent Head HP 30/150 206/1,030 1,180
Horseshoe Bay HP 12/52 152/600 652
Hat Head HP 10/40 269/1,000 1,040
Stuarts Point HP 13/51 143/272 323
Grassy Point HP 4/16 90/360 376
Total Beds 2,919
The review of Kempsey Shires five caravan parks indicates in the 2013 accommodation audit they account for a total of 2,919 beds. This represents 27% of the area’s accommodation beds. 2. Transport Commercial flights are available at the regional centres of Port Macquarie and Coffs Harbour with Kempsey Airport available for private charter.
APPENDIX A Page 10BMP - KSC CP
15DEC2015

Business Management Plan for KSC Caravan Parks 26-11-2015 (NSW 11.2014) - 7 December 2015 Page 6 Commercial in Confidence. SGL Consulting Group Australia Pty Ltd www.sglgroup.net
The main access point for most visitors is the Pacific Highway, linking the major populations of Sydney/Newcastle and the Hunter Valley to the south and Brisbane/Gold Coast and Northern NSW to the north. 3. Restaurants and Cafes There were over 90 food and beverage outlets identified including:
45 restaurants
22 cafes
24 takeaway outlets
4. Attractions and Activities The MVC area is best known for its natural assets (over 100,000ha), which include National Parks, Walking Trails, State Forests and beaches. There are 14 key main made attractions in the Shire including Smoky Cape Lighthouse, Trial Bay Goal and Galleries. 5. Events The MVC hosts approximately 46 events throughout the year and the annual events calendar is increasing each year.
1.6.2 Visitor Expenditure Trends
The Visitor Economy is estimated to be worth $173 million to the Macleay Valley Coast. Domestic visitors represent 98.1% of travel within the Macleay, contributing $169 million to the local economy.
Domestic overnight visitors spend an average of $570 per visit, averaging $128 per night. International visitors represent 1.9% of travel within the region, contributing around $4 million to the local economy. The average spend per international visitor is $383, averaging $74 per night which is significantly less than domestic overnight visitors.
1.6.3 MVC Visitation Trends
The below table highlights the Macleay Valley Coast’s performance over the past 13 years, the statistics have been derived from the National Visitor Survey (NVS) and International Visitor Survey (IVS) – YE June 2013.
Table 1.3 MVC Visitation Trends By Visitor Type
Timeline Period
Domestic
Daytrips
Domestic
Overnight
International Total %
change
YE June 2000 - 291,000 8,000 299,000 -
YE June 2001 232,333 285,000 6,400 523,733 75%
YE June 2002 214,667 336,000 4,800 555,467 6%
YE June 2003 198,000 285,000 5,300 488,300 -12%
YE June 2004 181,000 298,000 5,100 484,100 -1%
YE June 2005 212,667 360,000 5,400 578,067 19%
YE June 2006 210,667 289,000 11,000 510,667 -12%
YE June 2007 235,333 307,000 8,200 550,533 8%
YE June 2008 213,333 247,000 9,200 469,533 -15%
YE June 2009 228,667 203,000 8,200 439,867 -6%
APPENDIX A Page 11BMP - KSC CP
15DEC2015
Business Management Plan for KSC Caravan Parks 26-11-2015 (NSW 11.2014) - 7 December 2015 Page 7 Commercial in Confidence. SGL Consulting Group Australia Pty Ltd www.sglgroup.net
Source: Tourism Australia National Visitor Survey YE June 2013
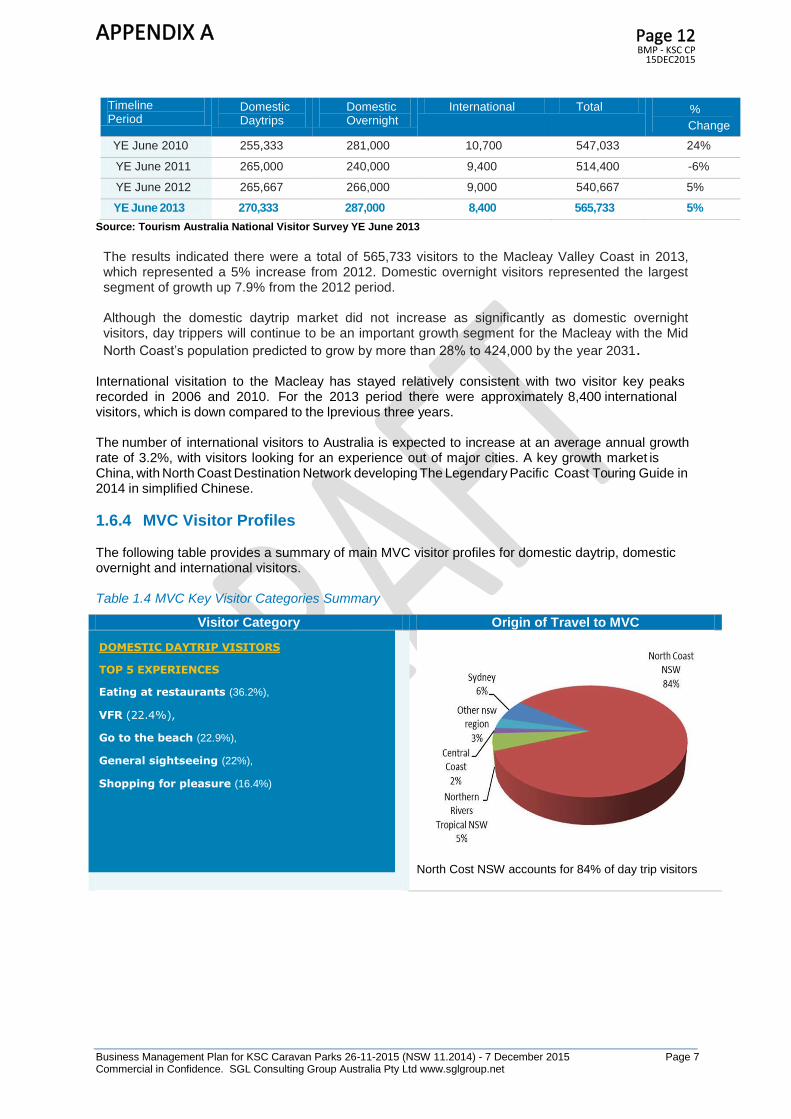
The results indicated there were a total of 565,733 visitors to the Macleay Valley Coast in 2013, which represented a 5% increase from 2012. Domestic overnight visitors represented the largest segment of growth up 7.9% from the 2012 period. Although the domestic daytrip market did not increase as significantly as domestic overnight visitors, day trippers will continue to be an important growth segment for the Macleay with the Mid
North Coast’s population predicted to grow by more than 28% to 424,000 by the year 2031.
International visitation to the Macleay has stayed relatively consistent with two visitor key peaks recorded in 2006 and 2010. For the 2013 period there were approximately 8,400 international visitors, which is down compared to the lprevious three years. The number of international visitors to Australia is expected to increase at an average annual growth rate of 3.2%, with visitors looking for an experience out of major cities. A key growth market is China, with North Coast Destination Network developing The Legendary Paci fi c Coast Touring Guide in 2014 in simpli fi ed Chinese.
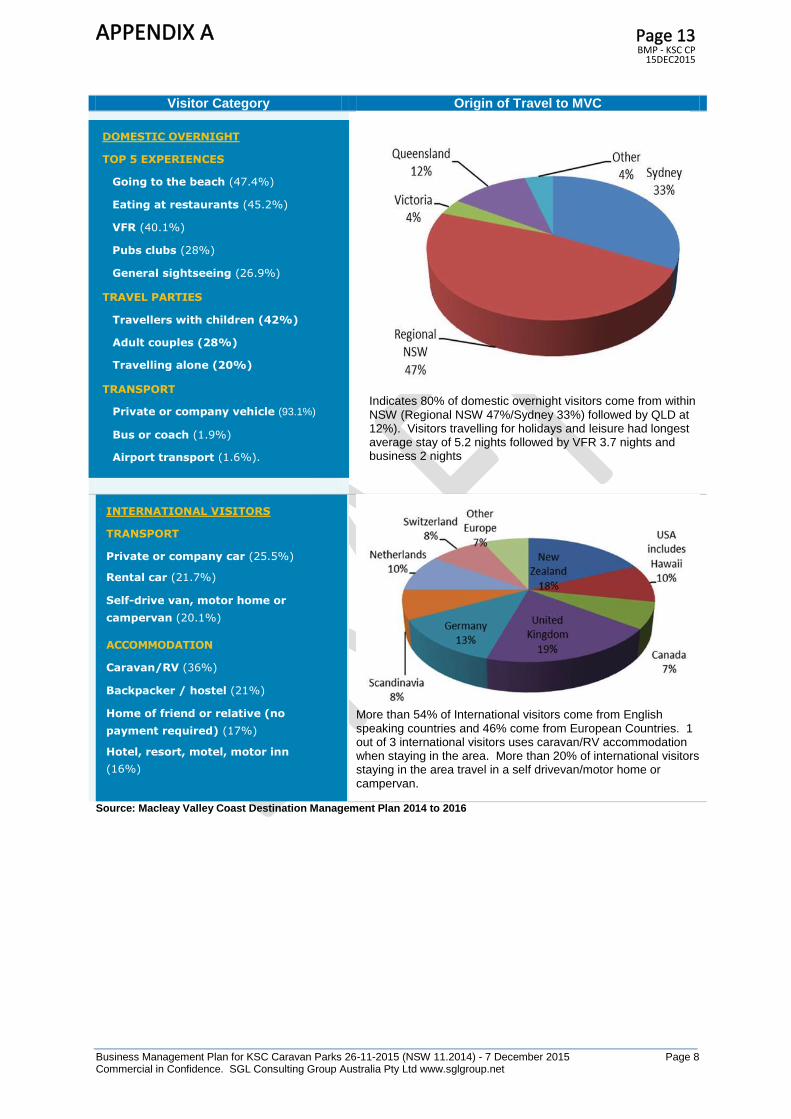
1.6.4 MVC Visitor Profiles The following table provides a summary of main MVC visitor profiles for domestic daytrip, domestic overnight and international visitors. Table 1.4 MVC Key Visitor Categories Summary
Visitor Category Origin of Travel to MVC
North Cost NSW accounts for 84% of day trip visitors
Timeline Period
Domestic Daytrips
Domestic Overnight
International Total %
Change
YE June 2010 255,333 281,000 10,700 547,033 24%
YE June 2011 265,000 240,000 9,400 514,400 -6%
YE June 2012 265,667 266,000 9,000 540,667 5%
YE June 2013 270,333 287,000 8,400 565,733 5%
DOMESTIC DAYTRIP VISITORS
TOP 5 EXPERIENCES
Eating at restaurants (36.2%),
VFR (22.4%),
Go to the beach (22.9%),
General sightseeing (22%),
Shopping for pleasure (16.4%)
APPENDIX A Page 12BMP - KSC CP
15DEC2015
Business Management Plan for KSC Caravan Parks 26-11-2015 (NSW 11.2014) - 7 December 2015 Page 8 Commercial in Confidence. SGL Consulting Group Australia Pty Ltd www.sglgroup.net
Visitor Category Origin of Travel to MVC
Indicates 80% of domestic overnight visitors come from within NSW (Regional NSW 47%/Sydney 33%) followed by QLD at 12%). Visitors travelling for holidays and leisure had longest average stay of 5.2 nights followed by VFR 3.7 nights and business 2 nights
More than 54% of International visitors come from English speaking countries and 46% come from European Countries. 1 out of 3 international visitors uses caravan/RV accommodation when staying in the area. More than 20% of international visitors staying in the area travel in a self drivevan/motor home or campervan.
Source: Macleay Valley Coast Destination Management Plan 2014 to 2016
INTERNATIONAL VISITORS
TRANSPORT
Private or company car (25.5%)
Rental car (21.7%)
Self-drive van, motor home or
campervan (20.1%)
ACCOMMODATION
Caravan/RV (36%)
Backpacker / hostel (21%)
Home of friend or relative (no
payment required) (17%)
Hotel, resort, motel, motor inn
(16%)
DOMESTIC OVERNIGHT
TOP 5 EXPERIENCES
Going to the beach (47.4%)
Eating at restaurants (45.2%)
VFR (40.1%)
Pubs clubs (28%)
General sightseeing (26.9%)
TRAVEL PARTIES
Travellers with children (42%)
Adult couples (28%)
Travelling alone (20%)
TRANSPORT
Private or company vehicle (93.1%)
Bus or coach (1.9%)
Airport transport (1.6%).
APPENDIX A Page 13BMP - KSC CP
15DEC2015

Business Management Plan for KSC Caravan Parks 26-11-2015 (NSW 11.2014) - 7 December 2015 Page 9 Commercial in Confidence. SGL Consulting Group Australia Pty Ltd www.sglgroup.net
2.1 Introduction
This section of the report presents information on the five holiday parks in relation to their capacity, management, operational and business trends including:
History of the Council Parks
Individual and combined holiday park overview and capacity
Individual and combined holiday park past three years occupancy results
Individual and combined holiday park past three years operating income
Individual and combined holiday park past three years operating expenditure
Individual and combined holiday park past three years operating performance
Individual and combined holiday park past three years capital development funding
2.2 Historical Review of Council Caravan Parks
The five Kempsey Shire Caravan Parks have different historical and development history as well as being operated under different management and lease models. We have reviewed a range of documents to help summarise some of the available history of the caravan parks.
2.2.1 1988 Kempsey Shire Caravan Park Management Plan Reviews of the 1988 Kempsey Shire Caravan Park Management Plan indicated at this time Council managed four parks, each under separate management contracts being:
Crescent Head Caravan Park (253 sites)
Grassy Head Caravan Park (85 sites)
Hat Head Caravan Park (250 sites)
Stuarts Point Caravan Park (126 sites)
The review found the contracts were set up to provide caretakers for the parks and there were no incentives for management to improve the park’s assets, onsite accommodation or increase use and associated income. The report also noted:
The parks did not comply with regulatory standards and required significant upgrades and capital expenditure.
Were poorly presented and maintained.
The stock of available onsite accommodation was limited and mainly was low standard onsite caravans.
The tariff levels and charges were high for overnight and low for long-term users, so inappropriate for the use and also park amenities and services standard offered.
2 Review of Councils Caravan Parks
APPENDIX A Page 14BMP - KSC CP
15DEC2015

Business Management Plan for KSC Caravan Parks 26-11-2015 (NSW 11.2014) - 7 December 2015 Page 10 Commercial in Confidence. SGL Consulting Group Australia Pty Ltd www.sglgroup.net
There were a large number of permanent users and long-term visitors paying low rates who believed they had ongoing rights to the sites.
The combined caravan park contracts were operating at an annual loss.
The 1988 management plan report recommended a large number of changes to management systems, operations and capital improvements.
2.2.2 2005 Kempsey Shire Caravan Park Management Plans This report was prepared by Integrated Site Design in June 2005 and covered the four caravan parks under direct Council control, being:
Crescent Head Caravan Park (16 cabins and 261 sites)
Grassy Head Caravan Park (2 cabins and 98 sites)
Hat Head Caravan Park (3 cabins and 301 sites)
Stuarts Point Caravan Park (6 cabins and 132 sites)
The report reviews the changes made from 1988 that, in summary, included:
Management was changed to link the parks under one contracted management model and management was paid a percentage of income.
Tariffs were reviewed and modified to reduce long-term use and attract higher revenue for short-term use.
New onsite units (cabins) were installed at the parks.
Capital works to improve regulatory services was commenced.
Many long-term sites were turned back to short-term sites over time.
The report reviews the 1996/97 operating year as a period to review these changes some 8 years after the 1988 review. This showed the four parks had a total income of $1.362M with camping/site fees accounting for approx. 74% of income and onsite cabins accounting for 26% of income. The combined parks operating expenditure was estimated at $992,000. This saw a major turnaround in business performance from an operating loss in 1988 to an operating surplus (before capital investment) of $370,000. Council invested $316,194 in capital works (mix of loan funded and direct funded projects) in 1996/97 and this was able to be funded from operating surpluses. The report also reviewed the 2002/03 financial year results for the four combined caravan parks and noted annual income had increased to an estimated $1.900M ($600,000 increase in income). Annual operating expenditure was estimated at $1.288M, so the net operating surplus (before capital expenditure) had also increased considerably to $612,000 (increase of $242,000 on 1996/97 operating surplus). The 2005 report findings indicated Council had made significant improvements to the four caravan parks since 1988 and this investment was now showing positive results. The report presented a range of recommendations for each of the four parks and these are summarised in Appendix One of the report. The report made 7 key recommendations and estimated a total of $2.254M in capital works was required to be made by Council over the next 5 years:
Crescent Head CP: $718,000
Hat Head CP: $796,000
Stuart Point CP: $464,000
Grassy Head CP: $275,000
Total Recommended Works: $2,253,000
APPENDIX A Page 15BMP - KSC CP
15DEC2015
Business Management Plan for KSC Caravan Parks 26-11-2015 (NSW 11.2014) - 7 December 2015 Page 11 Commercial in Confidence. SGL Consulting Group Australia Pty Ltd www.sglgroup.net
2.2.3 Caravan Park Operational Changes and Improvements from 2005 There has not been an updated plan of management for the combined parks since 2005 so SGL has not been able to obtain any detailed reports to track the completed improvement works, funding and specific business impacts from these changes. What is obvious is that the combined caravan park business has improved considerably since 2005, so this indicates many of the recommended changes have positively occurred. A key change that has impacted on the business not covered in the 2005 report is the Horseshoe Bay (Reserve) Holiday Park (previously referred to as South West Rocks Caravan Park) was taken back over by Council. This was added to the current management contract that took effect on the 30
th of
June 2011. This now saw five caravan parks linked in management under a common contract. Interviews with Council management and park management indicated the Horseshoe Bay CP was in poor condition at handover and this required increased capital investment over the past few years.
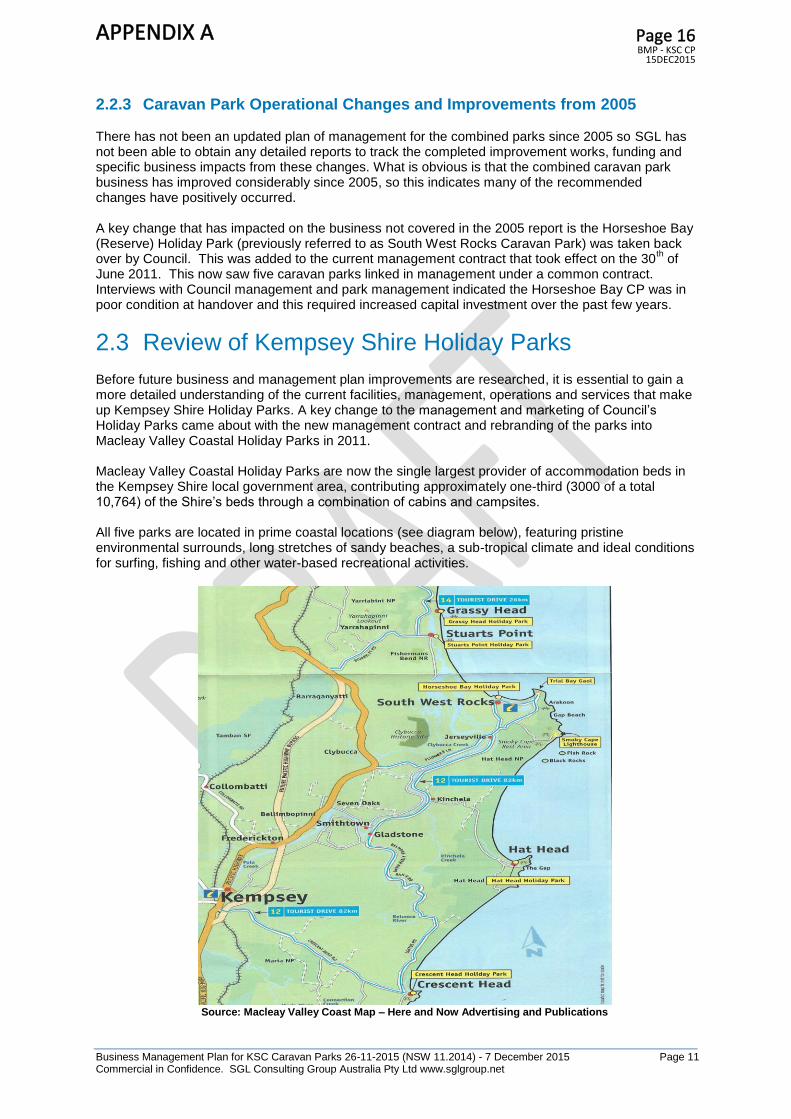
2.3 Review of Kempsey Shire Holiday Parks
Before future business and management plan improvements are researched, it is essential to gain a more detailed understanding of the current facilities, management, operations and services that make up Kempsey Shire Holiday Parks. A key change to the management and marketing of Council’s Holiday Parks came about with the new management contract and rebranding of the parks into Macleay Valley Coastal Holiday Parks in 2011. Macleay Valley Coastal Holiday Parks are now the single largest provider of accommodation beds in the Kempsey Shire local government area, contributing approximately one-third (3000 of a total 10,764) of the Shire’s beds through a combination of cabins and campsites. All five parks are located in prime coastal locations (see diagram below), featuring pristine environmental surrounds, long stretches of sandy beaches, a sub-tropical climate and ideal conditions for surfing, fishing and other water-based recreational activities.
Source: Macleay Valley Coast Map – Here and Now Advertising and Publications
APPENDIX A Page 16BMP - KSC CP
15DEC2015

Business Management Plan for KSC Caravan Parks 26-11-2015 (NSW 11.2014) - 7 December 2015 Page 12 Commercial in Confidence. SGL Consulting Group Australia Pty Ltd www.sglgroup.net
The 5 parks’ unique natural environs cannot, however, continue to be relied upon to attract new and returning visitors, particularly in what is becoming an increasingly sophisticated holiday park market. Ongoing visitor feedback suggests visitor expectations in relation to accommodation quality, public amenities, grounds, facilities and services are not always being met. The following sections provide an overview of each of the parks:
Site/user capacities,
2013/14 cabin and site occupancies,
Past three years financial review
Past four years capital improvement budgets and key work areas
2.3.1 Crescent Head Holiday Park
The parks website notes “with its beachfront location and proximity to the many activities the area has to offer, Crescent Head Holiday Park is one of the best located parks on the Mid North Coast of NSW. Crescent Head has one of the best right hand point breaks in the world, and the village is one of the hot spots of national and international surfing”. The park is divided up into two key zones, being Oceanside or Creekside, and both areas have many sites with water views. A site layout plan is listed below.
APPENDIX A Page 17BMP - KSC CP
15DEC2015

Business Management Plan for KSC Caravan Parks 26-11-2015 (NSW 11.2014) - 7 December 2015 Page 13 Commercial in Confidence. SGL Consulting Group Australia Pty Ltd www.sglgroup.net
2.3.1.1 CH Holiday Park Cabin and Site Capacities The following table lists the current (2015) Crescent Head Holiday Park cabin and site capacities. Table 2.1 Crescent Head Holiday Park Cabin and Site Capacities 2015
Holiday Park Cabins Long Term
Sites
Tourist
Sites
Holiday
Van Sites
Camp
Sites
Over Flow Sites
Crescent Head
Holiday Park
30 7 189 17 0 0
Today’s cabin and site capacity is lower than the park originally had due to changes to the park’s layout, inclusion of more onsite accommodation and reduction of long term/holiday sites. In 1997/98 the park had the following provision of sites:
9 long term sites
200 vacant short term (tourist) sites
16 short term sites with park cabins
32 holiday vans on short term sites
20 camp sites
The comparison of the 1997/98 capacities indicates that in 2015 there are 14 more cabins, 2 less long-term sites, 11 less tourist sites, 15 less holiday van sites and no camping sites.
2.3.1.2 CH Holiday Park Cabin Occupancy 2013/14 The following table lists the Crescent Head Holiday Park Cabin Occupancy for 2013/14: Table 2.2 Crescent Head Holiday Park Cabin Occupancy 2013/14
Holiday Park Cabins Days Per
Year
Available
Days
Occupied
Days
Vacant
Total
Income
Yield/Day Occupancy
Crescent Head
Holiday Park
30 10,950 7,785 3,165 $1.141M $146 71%
The occupancy review for the 30 cabins indicates the park is preforming well above industry cabin occupancy averages at 71% with 7,785 days occupied out of a total of 10,950 possible hire days. The average revenue per day hired is also above industry standards at $146/day/cabin.
2.3.1.3 CH Holiday Park Tourist Site Occupancy 2013/14 The following table lists the Crescent Head Holiday Park tourist site occupancy for 2013/14: Table 2.3 Crescent Head Holiday Park Tourist Site Occupancy 2013/14
Holiday Park Tourist
Sites
Days Per
Year
Available
Days
Occupied
Days
Vacant
Total
Income
Yield/Day Occupancy
Crescent Head
Holiday Park
189 68,985 35,964 33,021 $1,500M $41.70 52%
The occupancy review for the 189 tourist sites indicates the park is preforming well above industry tourist site occupancy averages at 52% with 35,964 days occupied out of a total of 68,985 possible site hire days. The average revenue per day hired is about on average for industry standards at $41.70/day/tourist site.
APPENDIX A Page 18BMP - KSC CP
15DEC2015

Business Management Plan for KSC Caravan Parks 26-11-2015 (NSW 11.2014) - 7 December 2015 Page 14 Commercial in Confidence. SGL Consulting Group Australia Pty Ltd www.sglgroup.net
2.3.1.4 CH Holiday Park Financial Trends 2011 to 2014 The following table lists the Crescent Head Holiday Park financial trends between 2011 and 2014: Table 2.4 Crescent Head Holiday Park Financial Trends 2011 to 2014
Crescent Head HP 2011/12
(Actual)
2012/13
(Actual)
2013/14
(Actual)
Operating Income $2,255,782 $2,344,469 $2,607,576
Operating Expenditure $1,666,414 $1,772,747 $1,945,685
Net Operating Profit/(Loss) $589,368 $571,722 $661,891
Capital Expenditure $260,708 $241,478 $132,162
Loan Repayments $12,302 $12,534 $12,782
Note: Family Holiday Experience Settlement $29K
Depreciation $174K
Family Holiday Experience Settlement $81K
Depreciation $176K
Depreciation $202K
The financial review indicates:
Operating income has increased annually from $2.255M in 2011/12 to $2.607M in 2013/14. This was an increase of approx. $352,000 (+15.6%) or an average yearly increase on average of $176,000 (+7.8%).
Operating expenditure has also increased annually from $1.666M in 2011/12 to $1.945M in 2013/14. This was an increase of approx. $279,000 (16.7%) or an average yearly increase on average of $89,000 (+8.35%).
A net operating profit was recorded for each of the three years ranging from $589,000 in 2011/12 and increasing to $662,000 by 2013/14. In 2013/14 the net operating profit saw income as a percentage of expenditure being 134%.
Capital expenditure fluctuated over the three years with a high of $260,708 in 2011/12 and a low of $132,162 in 2013/14.
Annual loan repayments were low at approximately $12,000/year.
2.3.2 Hat Head Holiday Park
This Holiday Park surrounded by the grandeur of Hat Head National Park and the tranquil seaside village of Hat Head, offers the ultimate beachside escape for nature lovers. The rich aquatic environment of the continental shelf is just 5.25 nautical miles offshore. Hat Head Holiday Park is a great place for people looking to fish with a diverse range of ocean, river and creek fishing options. The park is also divided up into a number of key zones being ocean side or creek side divided by a public road that provides access to ocean and creek boat ramps and public parking and day areas. A site layout plan is listed on the next page.
2.3.2.1 HH Holiday Park Cabin and Site Capacities The following table lists the current (2015) Hat Head Holiday Park cabin and site capacities. Table 2.5 Hat Head Holiday Park Cabin and Site Capacities 2015
Holiday Park Cabins Long Term
Sites
Tourist
Sites
Holiday
Van Sites
Camp
Sites
Over Flow Sites
Hat Head Holiday
Park
10 0 101 49 89 47
APPENDIX A Page 19BMP - KSC CP
15DEC2015

Business Management Plan for KSC Caravan Parks 26-11-2015 (NSW 11.2014) - 7 December 2015 Page 15 Commercial in Confidence. SGL Consulting Group Australia Pty Ltd www.sglgroup.net
Today’s cabin and site capacity is lower than the park originally had, due to changes to the park’s layout and inclusion of more onsite accommodation, and reduction of long term/holiday sites. In 1997/98, the park had the following provision of sites:
4 long term sites
102 vacant short term (tourist) sites
3 short term sites with park cabins
46 holiday vans on short term sites
149 camp sites
The comparison of the 1997/98 capacities indicates that in 2015 there are 7 more cabins, no long- term sites, 1 less tourist sites, 3 less holiday van sites and 60 less camping sites (though there are a large number of temporary/overflow camping sites still used at peak holiday periods).
2.3.2.2 HH Holiday Park Cabin Occupancy 2013/14 The following table lists the Hat Head Holiday Park Cabin Occupancy for 2013/14: Table 2.6 Hat Head Holiday Park Cabin Occupancy 2013/14
Holiday Park Cabins Days Per
Year
Available
Days
Occupied
Days
Vacant
Total
Income
Yield/Day Occupancy
Hat Head
Holiday Park
10 3,650 2,291 1,359 $266K $116 63%
The occupancy review for the 10 cabins indicates the park is preforming slightly above industry cabin occupancy averages at 63% with 2,291 days occupied out of a total of 3,650 possible hire days. The average revenue per day hired is also at average industry standards at $116/day/cabin.
APPENDIX A Page 20BMP - KSC CP
15DEC2015

Business Management Plan for KSC Caravan Parks 26-11-2015 (NSW 11.2014) - 7 December 2015 Page 16 Commercial in Confidence. SGL Consulting Group Australia Pty Ltd www.sglgroup.net
2.3.2.3 HH Holiday Park Tourist Site Occupancy 2013/14 The following table lists the Hat Head Holiday Park tourist site occupancy for 2013/14: Table 2.7 Hat Head Holiday Park Tourist Site Occupancy 2013/14
Holiday Park Tourist
Sites
Days Per
Year
Available
Days
Occupied
Days
Vacant
Total
Income
Yield/Day Occupancy
Hat Head
Holiday Park
101 36,865 23,967 12,898 $952K $39.72 65%
The occupancy review for the 101 tourist sites indicates the park is preforming well above industry tourist site occupancy averages at 65% with 23,967 days occupied out of a total of 36,865 possible site hire days. The average revenue per day hired is higher than average for industry standards at $39.72/day/tourist site.
2.3.2.4 HH Holiday Park Financial Trends 2011 to 2014 The following table lists the Hat Head Holiday Park financial trends between 2011 and 2014: Table 2.8 Hat Head Holiday Park Financial Trends 2011 to 2014
Hat Head HP 2011/12
(Actual)
2012/13
(Actual)
2013/14
(Actual)
Operating Income $1,133,116 $1,151,338 $1,366,845
Operating Expenditure $891,522* $899,451* $1,001,075*
Net Operating Profit/(Loss) $241,594 $251,887 $365,770
Capital Expenditure $10,348 $180,702 $20,323
Loan Repayments $89,904 $90,027 $68,609
Note *: Family Holiday Experience Settlement $15K
Depreciation 93K
Family Holiday Experience Settlement $39K
Depreciation 93K
Depreciation 93K
The financial review indicates:
Operating income has increased annually from $1.133M in 2011/12 to $1.366M in 2013/14. This was an increase of approx. $233,000 (+20.5%) or an average yearly increase on average of $116,500 (+10.25%).
Operating expenditure has also increased annually from $0.891M in 2011/12 to $1.001M in 2013/14. This was an increase of approx. $110,000 (12.3%) or an average yearly increase on average of $55,000 (+6.15%).
A net operating profit was recorded for each of the three years ranging from $242,000 in 2011/12 and increasing to $366,000 by 2013/14. In 2013/14 the net operating profit saw income as a percentage of expenditure being 136%.
Capital expenditure fluctuated over the three years with a high of $180,702 in 2012/13 and a low of $10,348 in 2011/12.
Annual loan repayments fluctuated from $89,900 in 2011/12 to $68,609 in 2013/14.
2.3.3 Horseshoe Bay Holiday Park
The MVC website indicates the park is in a unique and picturesque location on the NSW north coast, Horseshoe Bay Holiday Park is located on absolute beach frontage at South West Rocks and is nestled under shady pines with panoramic ocean, mountain and beach views. South West Rocks offers a selection of breathtaking beaches, rivers and National Parks and is perfect for family holidays, fishermen and those who want to explore or get away from it all.
APPENDIX A Page 21BMP - KSC CP
15DEC2015
Business Management Plan for KSC Caravan Parks 26-11-2015 (NSW 11.2014) - 7 December 2015 Page 17 Commercial in Confidence. SGL Consulting Group Australia Pty Ltd www.sglgroup.net
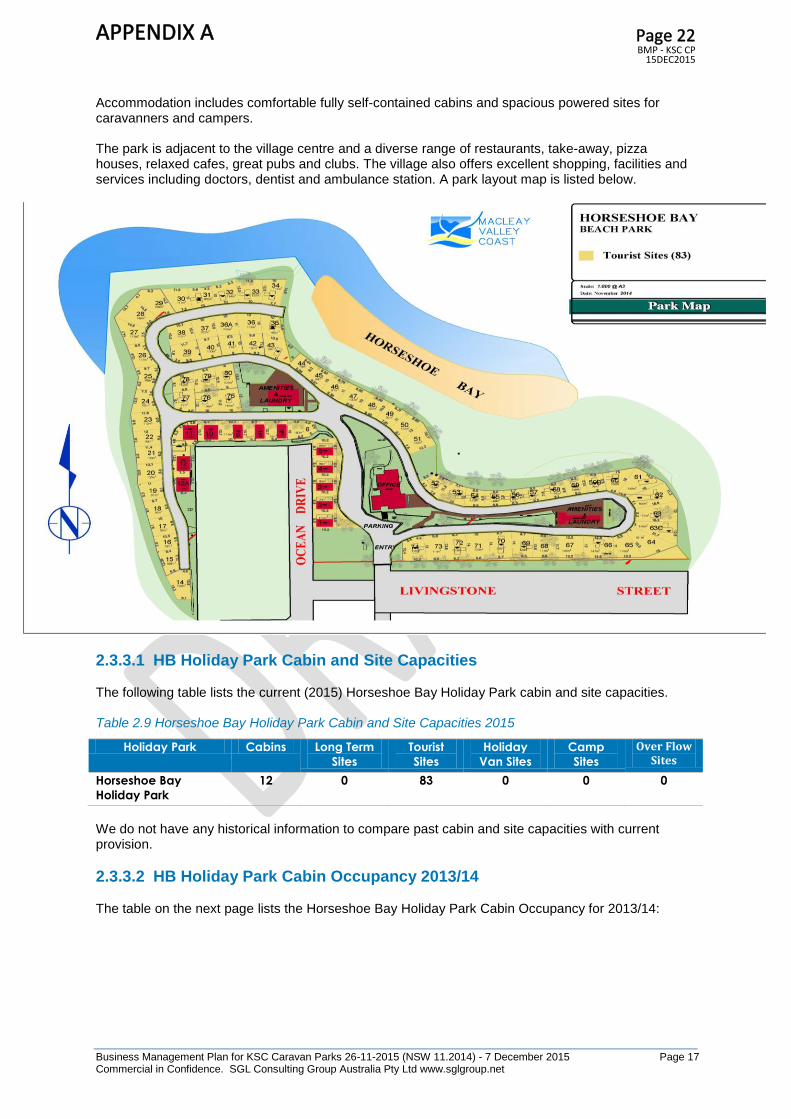
Accommodation includes comfortable fully self-contained cabins and spacious powered sites for caravanners and campers. The park is adjacent to the village centre and a diverse range of restaurants, take-away, pizza houses, relaxed cafes, great pubs and clubs. The village also offers excellent shopping, facilities and services including doctors, dentist and ambulance station. A park layout map is listed below.
2.3.3.1 HB Holiday Park Cabin and Site Capacities The following table lists the current (2015) Horseshoe Bay Holiday Park cabin and site capacities. Table 2.9 Horseshoe Bay Holiday Park Cabin and Site Capacities 2015
Holiday Park Cabins Long Term
Sites
Tourist
Sites
Holiday
Van Sites
Camp
Sites
Over Flow Sites
Horseshoe Bay
Holiday Park
12 0 83 0 0 0
We do not have any historical information to compare past cabin and site capacities with current provision.
2.3.3.2 HB Holiday Park Cabin Occupancy 2013/14 The table on the next page lists the Horseshoe Bay Holiday Park Cabin Occupancy for 2013/14:
APPENDIX A Page 22BMP - KSC CP
15DEC2015
Business Management Plan for KSC Caravan Parks 26-11-2015 (NSW 11.2014) - 7 December 2015 Page 18 Commercial in Confidence. SGL Consulting Group Australia Pty Ltd www.sglgroup.net
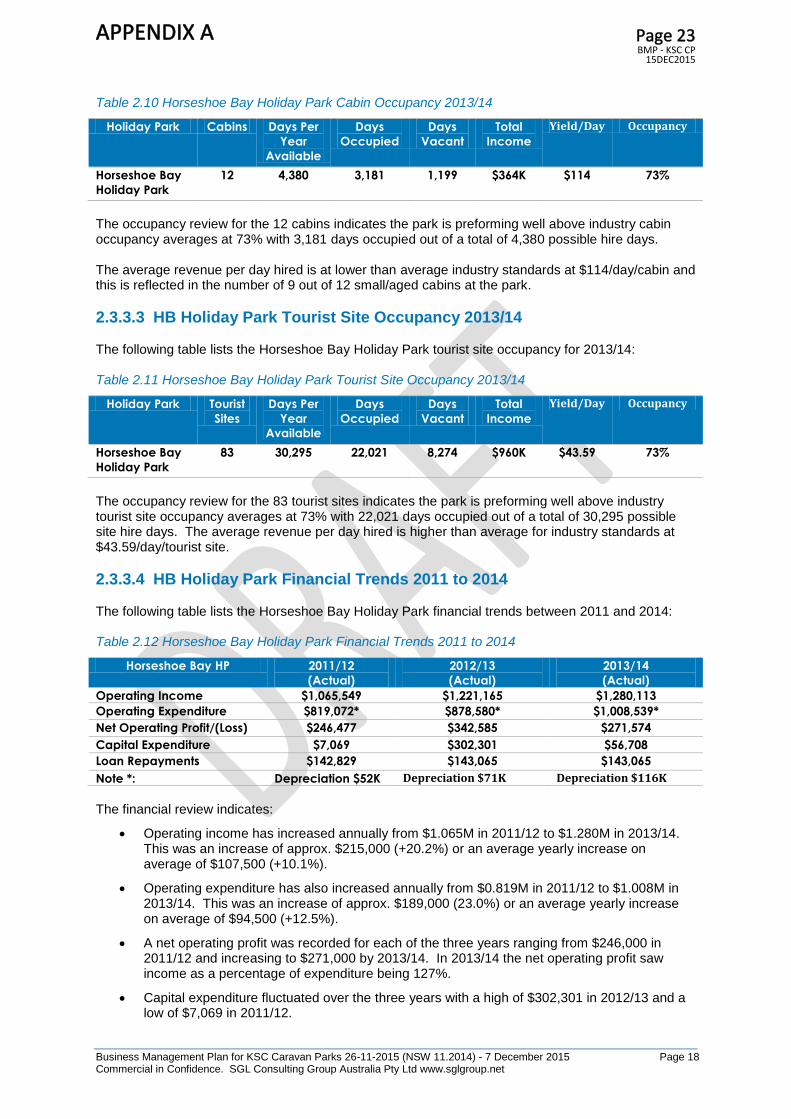
Table 2.10 Horseshoe Bay Holiday Park Cabin Occupancy 2013/14
Holiday Park Cabins Days Per
Year
Available
Days
Occupied
Days
Vacant
Total
Income
Yield/Day Occupancy
Horseshoe Bay
Holiday Park
12 4,380 3,181 1,199 $364K $114 73%
The occupancy review for the 12 cabins indicates the park is preforming well above industry cabin occupancy averages at 73% with 3,181 days occupied out of a total of 4,380 possible hire days. The average revenue per day hired is at lower than average industry standards at $114/day/cabin and this is reflected in the number of 9 out of 12 small/aged cabins at the park.
2.3.3.3 HB Holiday Park Tourist Site Occupancy 2013/14 The following table lists the Horseshoe Bay Holiday Park tourist site occupancy for 2013/14: Table 2.11 Horseshoe Bay Holiday Park Tourist Site Occupancy 2013/14
Holiday Park Tourist
Sites
Days Per
Year
Available
Days
Occupied
Days
Vacant
Total
Income
Yield/Day Occupancy
Horseshoe Bay
Holiday Park
83 30,295 22,021 8,274 $960K $43.59 73%
The occupancy review for the 83 tourist sites indicates the park is preforming well above industry tourist site occupancy averages at 73% with 22,021 days occupied out of a total of 30,295 possible site hire days. The average revenue per day hired is higher than average for industry standards at $43.59/day/tourist site.
2.3.3.4 HB Holiday Park Financial Trends 2011 to 2014 The following table lists the Horseshoe Bay Holiday Park financial trends between 2011 and 2014: Table 2.12 Horseshoe Bay Holiday Park Financial Trends 2011 to 2014
Horseshoe Bay HP 2011/12
(Actual)
2012/13
(Actual)
2013/14
(Actual)
Operating Income $1,065,549 $1,221,165 $1,280,113
Operating Expenditure $819,072* $878,580* $1,008,539*
Net Operating Profit/(Loss) $246,477 $342,585 $271,574
Capital Expenditure $7,069 $302,301 $56,708
Loan Repayments $142,829 $143,065 $143,065
Note *: Depreciation $52K Depreciation $71K Depreciation $116K
The financial review indicates:
Operating income has increased annually from $1.065M in 2011/12 to $1.280M in 2013/14. This was an increase of approx. $215,000 (+20.2%) or an average yearly increase on average of $107,500 (+10.1%).
Operating expenditure has also increased annually from $0.819M in 2011/12 to $1.008M in 2013/14. This was an increase of approx. $189,000 (23.0%) or an average yearly increase on average of $94,500 (+12.5%).
A net operating profit was recorded for each of the three years ranging from $246,000 in 2011/12 and increasing to $271,000 by 2013/14. In 2013/14 the net operating profit saw income as a percentage of expenditure being 127%.
Capital expenditure fluctuated over the three years with a high of $302,301 in 2012/13 and a low of $7,069 in 2011/12.
APPENDIX A Page 23BMP - KSC CP
15DEC2015

Business Management Plan for KSC Caravan Parks 26-11-2015 (NSW 11.2014) - 7 December 2015 Page 19 Commercial in Confidence. SGL Consulting Group Australia Pty Ltd www.sglgroup.net
Annual loan repayments were similar for all three years, being between $142,000 and $143,000.
2.3.4 Stuarts Point Holiday Park
The MVC website indicates this park is nestled on the banks of the Macleay River between vast golden beaches, the lush forests and rich pastures of the Macleay Valley. It is described as a secluded and serene riverside hideaway, offering a boat ramp and mooring, fish cleaning table and choice of beach, river or blue water fishing. Stuarts Point Holiday Park offers clean, well-equipped facilities and a playground and is situated close to local shops, a Tavern and a Workers Club. The park site plan is listed below.
2.3.4.1 SP Holiday Park Cabin and Site Capacities The following table lists the current (2015) Stuarts Point Holiday Park cabin and site capacities. Table 2.13 Stuarts Point Holiday Park Cabin and Site Capacities 2015
Holiday Park Cabins Long Term
Sites
Tourist
Sites
Holiday
Van Sites
Camp
Sites
Over Flow Sites
Stuarts Point Holiday
Park
9 4 69 39 36 0
Today’s cabin and site capacity is lower than the park originally had due to changes to the park’s layout and inclusion of more onsite accommodation, and reduction of long term/holiday sites. In 1997/98 the park had the following provision of sites:
APPENDIX A Page 24BMP - KSC CP
15DEC2015

Business Management Plan for KSC Caravan Parks 26-11-2015 (NSW 11.2014) - 7 December 2015 Page 20 Commercial in Confidence. SGL Consulting Group Australia Pty Ltd www.sglgroup.net
12 long term sites
65 vacant short term (tourist) sites
6 short term sites with park cabins
35 holiday vans on short term sites
20 camp sites
The comparison of the 1997/98 capacities indicates that in 2015 there are 3 more cabins, 8 less long- term sites, 4 more tourist sites, 4 more holiday van sites and 16 more camping sites.
2.3.4.2 SP Holiday Park Cabin Occupancy 2013/14 The following table lists the Stuarts Point Holiday Park Cabin Occupancy for 2013/14: Table 2.14 Stuarts Point Holiday Park Cabin Occupancy 2013/14
Holiday Park Cabins Days Per
Year
Available
Days
Occupied
Days
Vacant
Total
Income
Yield/Day Occupancy
Stuarts Point
Holiday Park
9 3,285 1,555 1,730 $156K $100 47%
The occupancy review for the 9 cabins indicates the park is preforming well below industry cabin occupancy averages at 47% with only 1,555 days occupied out of a total of 3,285 possible hire days. The average revenue per day hired is also below industry standards at $100/day/cabin. This is being influenced in part by two of the cabins not having en-suites and therefore recording low hire rates.
2.3.4.3 SP Holiday Park Tourist Site Occupancy 2013/14 The following table lists the Stuarts Point Holiday Park tourist site occupancy for 2013/14: Table 2.15 Stuarts Point Holiday Park Tourist Site Occupancy 2013/14
Holiday Park Tourist
Sites
Days Per
Year
Available
Days
Occupied
Days
Vacant
Total
Income
Yield/Day Occupancy
Stuarts Point
Holiday Park
69 25,185 11,851 13,334 $357K $30.12 47%
The occupancy review for the 69 tourist sites indicates the park is preforming just below industry tourist site occupancy averages at 42% with 11,851 days occupied out of a total of 25,185 possible site hire days. The average revenue per day hired is below average for industry standards at $30.12/day/tourist site.
2.3.4.4 SP Holiday Park Financial Trends 2011 to 2014 The table on the next page lists the Stuarts Point Holiday Park financial trends between 2011 and 2014:
APPENDIX A Page 25BMP - KSC CP
15DEC2015

Business Management Plan for KSC Caravan Parks 26-11-2015 (NSW 11.2014) - 7 December 2015 Page 21 Commercial in Confidence. SGL Consulting Group Australia Pty Ltd www.sglgroup.net
Table 2.16 Stuarts Point Holiday Park Financial Trends 2011 to 2014
Stuarts Point HP 2011/12
(Actual)
2012/13
(Actual)
2013/14
(Actual)
Operating Income $512,346 $556,959 $635,072
Operating Expenditure $471,600* $491,178* $546,613*
Net Operating Profit/(Loss) $40,746 $65,781 $88,459
Capital Expenditure $6,050 $107,501 $281,201
Loan Repayments $140,002 $139,864 $139,978
Note *: Family Holiday Exp. Settlement $7K
Depreciation $52K
Family Holiday Exp. Settlement $19K
Depreciation $71K
Depreciation $116K
The financial review indicates:
Operating income has increased annually from $0.512M in 2011/12 to $0.635M in 2013/14. This was an increase of approx. $123,000 (+24%) or an average yearly increase on average of $61,500 (+12.0%).
Operating expenditure has also increased annually from $0.471M in 2011/12 to $0.546M in 2013/14. This was an increase of approx. $75,000 (16.0%) or an average yearly increase on average of $37,500 (+8.0%).
A net operating profit was recorded for each of the three years ranging from $40,000 in 2011/12 and increasing to $88,000 by 2013/14. In 2013/14 the net operating profit saw income as a percentage of expenditure being 116%.
Capital expenditure fluctuated over the three years with a high of $281,201 in 2013/14 and a low of $6,050 in 2011/12.
Annual loan repayments were similar at approximately $140,000/year.
2.3.5 Grassy Head Holiday Park
The MCV website indicates the park is tucked away amongst lush coastal forests and immaculate golden beaches and is one of the natural holiday parks of the Mid North Coast. The abundance of fish and birdlife combined with the beautiful bushland surrounds is a delight for nature lovers. The Park, nestled beneath a canopy of shady trees, is located just 200 metres from Grassy Head beach. Tranquil recreational activity opportunities include rainforest, beach and river walks, rock and beach fishing, swimming and surfing. A park site map is listed as follows on the next page.
2.3.5.1 GH Holiday Park Cabin and Site Capacities The following table lists the current (2015) Grassy Head Holiday Park cabin and site capacities. Table 2.17 Grassy Head Holiday Park Cabin and Site Capacities 2015
Holiday Park Cabins Long Term
Sites
Tourist
Sites
Holiday
Van Sites
Camp
Sites
Over Flow Sites
Grassy Head Holiday
Park
4 0 43 29 24 0
Today’s cabin and site capacity is lower than the park originally had due to changes to the park’s layout and inclusion of more onsite accommodation and reduction of long term/holiday sites. In 1997/98 the park had the following provision of sites:
1 long term site
35 vacant short term (tourist) sites
APPENDIX A Page 26BMP - KSC CP
15DEC2015

Business Management Plan for KSC Caravan Parks 26-11-2015 (NSW 11.2014) - 7 December 2015 Page 22 Commercial in Confidence. SGL Consulting Group Australia Pty Ltd www.sglgroup.net
2 short term sites with park cabins
32 holiday vans on short term sites
30 camp sites
The comparison of the 1997/98 capacities indicates that in 2015 there are 2 more cabins, no long- term sites, 8 more tourist sites, 3 less holiday van sites and 6 less camping sites.
2.3.5.2 GH Holiday Park Cabin Occupancy 2013/14 The following table lists the Grassy Head Holiday Park Cabin Occupancy for 2013/14: Table 2.18 Grassy Head Holiday Park Cabin Occupancy 2013/14
Holiday Park Cabins Days Per
Year
Available
Days
Occupied
Days
Vacant
Total
Income
Yield/Day Occupancy
Grassy Head
Holiday Park
4 1,460 629 831 $52K $83 43%
The occupancy review for the 4 cabins indicates the park is preforming well below industry cabin occupancy averages at 43% with 629 days occupied out of a total of 1,460 possible hire days. The average revenue per day hired is also well below industry standards at $83/day/cabin.
2.3.5.3 GH Holiday Park Tourist Site Occupancy 2013/14 The table on the next page lists the Grassy Head Holiday Park tourist site occupancy for 2013/14:
APPENDIX A Page 27BMP - KSC CP
15DEC2015

Business Management Plan for KSC Caravan Parks 26-11-2015 (NSW 11.2014) - 7 December 2015 Page 23 Commercial in Confidence. SGL Consulting Group Australia Pty Ltd www.sglgroup.net
Table 2.19 Grassy Head Holiday Park Tourist Site Occupancy 2013/14
Holiday Park Tourist
Sites
Days Per
Year
Available
Days
Occupied
Days
Vacant
Total
Income
Yield/Day Occupancy
Grassy Head
Holiday Park
43 15,695 5,137 10,558 $170K $33.09 33%
The occupancy review for the 43 tourist sites indicates the park is preforming at well below industry tourist site occupancy averages at 33% with 5,137 days occupied out of a total of 15,695 possible site hire days. The average revenue per day hired is just below average for industry standards at $33.09/day/tourist site.
2.3.5.4 GH Holiday Park Financial Trends 2011 to 2014 The following table lists the Grassy Head Holiday Park financial trends between 2011 and 2014: Table 2.20 Grassy Head Holiday Park Financial Trends 2011 to 2014
Grassy Head HP 2011/12
(Actual)
2012/13
(Actual)
2013/14
(Actual)
Operating Income $254,945 $264,837 $282,030
Operating Expenditure $221,526* $227,974* $227,478*
Net Operating Profit/(Loss) $33,419 $36,863 $54,552
Capital Expenditure $3,708 $40,398 $15,574
Loan Repayments $0 $0 $0
Note *: Family Holiday Exp. Settlement $3K
Depreciation $27K
Family Holiday Exp. Settlement $9K
Depreciation $26K
Depreciation $33K
The financial review indicates:
Operating income has increased annually from $0.254M in 2011/12 to $0.282M in 2013/14. This was an increase of approx. $28,000 (+11.0%) or an average yearly increase on average of $14,000 (+5.5%).
Operating expenditure has also increased annually from $0.221M in 2011/12 to $0.227M in 2013/14. This was an increase of approx. $6,000 (3.0%) or an average yearly increase on average of $3,000 (+1.5%).
A net operating profit was recorded for each of the three years ranging from $33,000 in 2011/12 and increasing to $54,000 by 2013/14. In 2013/14 the net operating profit saw income as a percentage of expenditure being 123%.
Capital expenditure fluctuated over the three years with a high of $40,398 in 2012/13 and a low of $3,708 in 2011/12.
There was no annual loan repayments recorded for any of the review years at this holiday park.
2.4 Combined MVC Holiday Parks Review
Sections 2.3 provide comparative information on each of the Kempsey Shire Holiday Parks. This section draws this information together into a combined business to provide a guide to key trends to develop future business and management plans from.
2.4.1.1 MVC Combined Holidays Park Cabin and Site Capacities The table on the next page lists the current (2015) MVC Combined Holiday Parks cabin and site capacities.
APPENDIX A Page 28BMP - KSC CP
15DEC2015

Business Management Plan for KSC Caravan Parks 26-11-2015 (NSW 11.2014) - 7 December 2015 Page 24 Commercial in Confidence. SGL Consulting Group Australia Pty Ltd www.sglgroup.net
Table 2.21 MVC Combined Holiday Park Cabin and Site Capacities 2015
Holiday Park Cabins Long Term
Sites
Tourist
Sites
Holiday
Van Sites
Camp
Sites
Over Flow Sites
Crescent Head
Holiday Park
30 7 189 17 0 0
Hat Head Holiday
Park
10 0 101 49 89 47
Horseshoe Bay
Holiday Park
12 0 83 0 0 0
Stuarts Point Holiday
Park
9 4 69 39 36 0
Grassy Head Holiday
Park
4 0 43 29 24 0
Macleay Valley
Holiday Parks
Total Capacity
65 11 485 134 149 47
The following table compares current cabin and site provision at the MVC Holiday Parks compared to what was identified provided at four of the five parks in 1996/1997 (excluding Horseshoe Bay HP that was not included in the review at that time). Table 2.22 MVC Combined HP Cabin/Site Capacities 1996/97 and 2014/15
Year Cabins Long Term
Sites
Tourist
Sites
Holiday
Van Sites
Camp
Sites
Over Flow Sites
1996/97 27 26 402 145 219 47
2014/15 (excl.) HBHP 53 11 402 134 149 47
2014/15 HBHP 12 0 83 0 0 0
Total Combined Parks
2014/15
65 11 485 134 149 47
Change Between
1996/97 and 2014/15
+38 -15 +83 -9 -70 0
The comparison of the 1997/98 four holiday park capacities indicates that in 2015, with 5 holiday parks, there are 38 more cabins, 15 less long- term sites, 83 more tourist sites, 9 less holiday van sites and 70 less camping sites. This indicates positive change with higher income earning cabin and tourist sites and less long-term low income earning camping, holiday van and long term sites.
2.4.1.2 MVC Combined Holiday Parks Cabin Occupancy 2013/14 The table on the next page lists the MVC Combined Holiday Parks Cabin Occupancy for 2013/14:
APPENDIX A Page 29BMP - KSC CP
15DEC2015
Business Management Plan for KSC Caravan Parks 26-11-2015 (NSW 11.2014) - 7 December 2015 Page 25 Commercial in Confidence. SGL Consulting Group Australia Pty Ltd www.sglgroup.net
Table 2.23 MVC Combined Holiday Parks Cabin Occupancy 2013/14
Holiday Park Cabins Days Per
Year
Available
Days
Occupied
Days
Vacant
Total
Income
Yield/Day Occupancy
Crescent Head
Holiday Park
30 10,950 7,785 3,165 $1.141M $146 71%
Hat Head
Holiday Park
10 3,650 2,291 1,359 $266K $116 63%
Horseshoe Bay
Holiday Park
12 4,380 3,181 1,199 $364K $114 73%
Stuarts Point
Holiday Park
9 3,285 1,555 1,730 $156K $100 47%
Grassy Head
Holiday Park
4 1,460 629 831 $52K $83 43%
Total Macleay
Valley Holiday
Parks
65 23,725 15,441 8,284 $1.979M $128 N/A
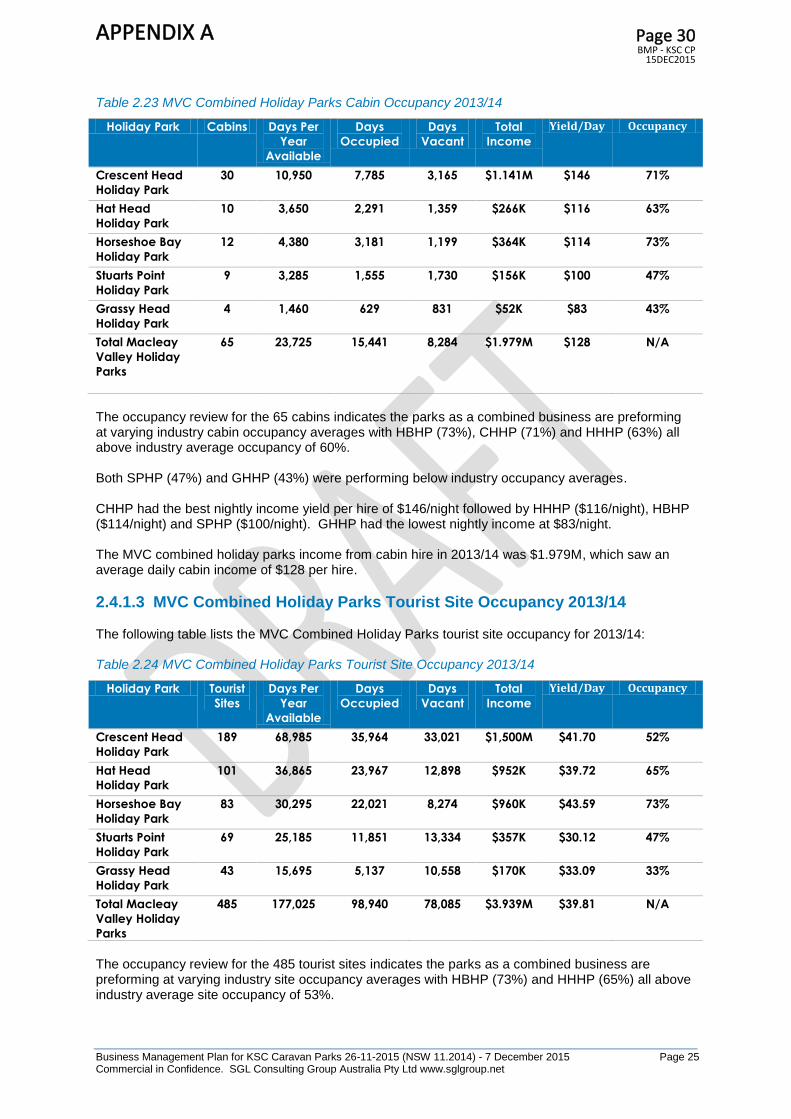
The occupancy review for the 65 cabins indicates the parks as a combined business are preforming at varying industry cabin occupancy averages with HBHP (73%), CHHP (71%) and HHHP (63%) all above industry average occupancy of 60%. Both SPHP (47%) and GHHP (43%) were performing below industry occupancy averages. CHHP had the best nightly income yield per hire of $146/night followed by HHHP ($116/night), HBHP ($114/night) and SPHP ($100/night). GHHP had the lowest nightly income at $83/night. The MVC combined holiday parks income from cabin hire in 2013/14 was $1.979M, which saw an average daily cabin income of $128 per hire.
2.4.1.3 MVC Combined Holiday Parks Tourist Site Occupancy 2013/14 The following table lists the MVC Combined Holiday Parks tourist site occupancy for 2013/14: Table 2.24 MVC Combined Holiday Parks Tourist Site Occupancy 2013/14
Holiday Park Tourist
Sites
Days Per
Year
Available
Days
Occupied
Days
Vacant
Total
Income
Yield/Day Occupancy
Crescent Head
Holiday Park
189 68,985 35,964 33,021 $1,500M $41.70 52%
Hat Head
Holiday Park
101 36,865 23,967 12,898 $952K $39.72 65%
Horseshoe Bay
Holiday Park
83 30,295 22,021 8,274 $960K $43.59 73%
Stuarts Point
Holiday Park
69 25,185 11,851 13,334 $357K $30.12 47%
Grassy Head
Holiday Park
43 15,695 5,137 10,558 $170K $33.09 33%
Total Macleay
Valley Holiday
Parks
485 177,025 98,940 78,085 $3.939M $39.81 N/A
The occupancy review for the 485 tourist sites indicates the parks as a combined business are preforming at varying industry site occupancy averages with HBHP (73%) and HHHP (65%) all above industry average site occupancy of 53%.
APPENDIX A Page 30BMP - KSC CP
15DEC2015

Business Management Plan for KSC Caravan Parks 26-11-2015 (NSW 11.2014) - 7 December 2015 Page 26 Commercial in Confidence. SGL Consulting Group Australia Pty Ltd www.sglgroup.net
CHHP (52%), SPHP (47%) and GHHP (43%) were performing below industry occupancy averages. All parks were performing above industry site income per night averages of $26. HBHP had the best nightly income yield per site hire of $43.49/night followed by CHHP ($41.70/night), HHHP ($39.72/night), GHHP ($33.09) and SPHP ($30.12/night). The MVC combined holiday parks’ income from tourist site hire in 2013/14 was $3.939M, which saw an average tourist site income per day hire of $39.81.
2.4.1.4 MVC Combined Holiday Parks Financial Trends 2011 to 2014 The following table lists the MVC Combined Holiday Parks financial trends between 2011 and 2014: Table 2.25 MVC Combined Holiday Parks Financial Trends 2011 to 2014
Stuarts Point HP 2011/12
(Actual)
2012/13
(Actual)
2013/14
(Actual)
Operating Income $5,221,738 $5,538,768 $6,171,636
Operating Expenditure $4,070,134 $4,269,930 $4,729,390
Net Operating Profit/(Loss) $1,151,604 $1,268,838 $1,442,246
Less Capital Expenditure $287,883 $872,380 $505,968
Less Loan Repayments $385,037 $385,490 $364,434
Net Profit/(Loss) $478,684 $10,968 $571,844
The MVC combined holiday parks’ financial review indicates:
Income has increased from $5.221M to $6.171M which was +$950,000 or +18.2%.
Expenditure has increased from $4.070M to $4.729M which was +$659,000 or 16.2%
The net operating result (before capital and loans) improved from a profit of $1.151M in 2011/12 to $1.442M in 2013/14 (+$291,000 or +25.2%).
Annual capital expenditure fluctuated from $287,883 (11/12) to $872,380 (12/13) and back to $505,968 (13/14). Main items upgrade amenities, cabin improvements, services upgrades and roads
Annual loan repayments were similar at $360Kto $380K per year.
Net profit after capital and loan payments fluctuated from $478,684 (11/12) to $10,968 (12/13) and then $571,844 (13/14).
The individual holiday park financial trends indicate:
Income – CHHP accounts for $2.6M or 42% of income followed by HHHP $1.4M (22%), HBHP $1.3M (21%) SPHP $635K (10%) and GHHP $282K (5%).
Expenditure – CHHP accounts for $1.9M or 41% of exp. Followed by HBHP and HHHP $1.M (21%) and SPHP $547K (12%) and GHHP $227K (5%).
The net operating profit (before capital and loans) – CHHP accounts for $662K or 46% followed by HHHP $366K (26%), HBHP $272K (19%), SPHP $88K (6%) and GHHP $$55K (3%).
Capital expenditure – CHHP had most capital expenditure ($493K/34%) followed by SPHP ($387K/27%), HBHP ($332K/23%), HHHP ($184K/13%) and GPHP ($38K/3%).
Loan Repayments - HBHP had the highest annual loan repayments at $143K followed by SPHP $140K, HHHP $68K and CHHP $12K. GHHP had no annual loan repayments.
2.4.1.5 MVC Combined Holiday Parks Income Trends 2013/2014 To assist in identifying where the main income streams are for the combined business, SGL has reviewed the MVC Combined Holiday Parks income trends for 2013/14.
APPENDIX A Page 31BMP - KSC CP
15DEC2015

Business Management Plan for KSC Caravan Parks 26-11-2015 (NSW 11.2014) - 7 December 2015 Page 27 Commercial in Confidence. SGL Consulting Group Australia Pty Ltd www.sglgroup.net
Table 2.26 MVC Combined Holiday Parks Financial Trends 2011 to 2014
Holiday Park Cabins Hire Tourist Sites Long Term
Site
Holiday Van Ensuites and
Other
Approx.
Total
Income
CHHP $1.141M $1.500M $0 $0 $0 $2.641M
HHHP $266K $952K $0 $0 $0 $1.218M
HBHP $364K $960K $0 $0 $24K $1.348M
SPHP $156K $357K $1K $3K $0 $517K
GHHP $52K $170K $0 $0 $0 $222K
Total/% $1.979M
(33%)
$3.939M
(66%)
$1K $3K $24K $5,946M
The MVC combined holiday parks’ income indicates tourist sites are the largest income category, raising $3.939M or 66% of combined income. This is followed by cabin hire at $1.979M, accounting for 33% of combined income. Other hire provides very low income for a total of $28,000 (approx.1% of combined income). As previously highlighted in sections 2.4.1.2 cabin occupancy/yield and 2.4.1.3 tourist site occupancy/yield key daily income from these two sectors see:
Daily hire cabin income ranges from a high of $146/day at CHHP through to a low of $83/day at GHHP. Average cabin hire daily income across all parks was $128/hire/day.
Daily hire tourist site income ranges from a high of $43.59 at HBHP through to a low of $30.12 at SPHP. Average tourist site hire daily income across all parks was $39.81/hire/day
2.4.1.6 MVC Combined Holiday Parks Capital Improvements 2011 to 2014 To provide a guide to Kempsey Shire capital improvements that have been made at the holiday parks over the past three years SGL has reviewed all works and costs and summarised them in the following table. Table 2.27 MVC Combined Holiday Parks Capital improvements 2011 to 2014
Holiday
Park
Amenity
Upgrades
Cabin
Improvements
Roads Services
Upgrades
Landscape
Trails/Paths
Total
CHHP $122K $100K $171K $2K $98K $493K
HHHP $172K $11K - - $1K $184K
HBHP $282K $1K - $11K $38K $332K
SPHP $85 $16K $2K $277K $7K $387K
GPHP $15K $9K $4K $3K $7K $38K
Total $676K $137K $177K $293K $151K $1.434M
The review of capital improvements funded by Kempsey Shire in the past 3 years indicates Council is still investing significant funding ($1.434M) into facility infrastructure and services upgrades. The highest investment has been made in amenity upgrades ($676,000) followed by services upgrades ($293,000), roads ($177,000) and landscape/trials/paths ($151,000). Limited capital funding has been made on cabin improvements ($137,000) though they are a major income generator for the combined holiday park business. A review of current financial year (2014/15) capital investment sees the following works funded as listed in the table on the next page:
APPENDIX A Page 32BMP - KSC CP
15DEC2015

Business Management Plan for KSC Caravan Parks 26-11-2015 (NSW 11.2014) - 7 December 2015 Page 28 Commercial in Confidence. SGL Consulting Group Australia Pty Ltd www.sglgroup.net
Table 2.28 MVC Combined Holiday Parks Capital improvements 2014/15
Holiday
Park
Details Budget Allocation Total
CHHP Cabin refurbishments $50,000
Footpath and bin area $20,000
Planting program $20,000
Dump point upgrade $10,000
Total CHHP Capital Improvements $100,00
HBHP Roads $30,000
Dump point upgrade $5,000
Total HBHP Capital Improvements $35,000
HHHP Cabin refurbishment $25,000
Dump point upgrade $5,000
Total HHHP Capital Improvements $30,000
SPHP Repairs to roads $30,000
Dump point upgrade $5,000
Total SPHP Capital Improvements $35,000
GPHP New trench for day area $10,000
Dump point upgrade $5,000
Total GPHP Capital Improvements $15,000
Total 2014/15 Capital Improvements $215,000
The above table indicates Council has allocated a further $215,000 to capital improvements at the holiday parks. This will see total capital investment of approximately $1.649M over the past four years.
Though the majority of works are still related to park services and amenity upgrades ($140,000), there was an allocation of $75,000 for cabin improvements, which relate primarily to structural works on cabins at CHHP.
2.5 MVC Holiday Parks Management Contract Review Council as the Reserve Trust Manager tendered the management contract for the five holiday parks in 2011. The contract tender was won by Burcher Nominees Pty Ltd (CAN 149 832 593) and came into force on the 30
th of June 20111.
A detailed contract was set covering:
General conditions of the contract
Fees payable
Duties of the contractor
Plant, equipment and consumables
Provision of labour
Administration
Obligations of Council
The Residences
Insurances and Indemnities
Termination or expiration of the contract
Miscellaneous
Variation of the agreement
APPENDIX A Page 33BMP - KSC CP
15DEC2015

Business Management Plan for KSC Caravan Parks 26-11-2015 (NSW 11.2014) - 7 December 2015 Page 29 Commercial in Confidence. SGL Consulting Group Australia Pty Ltd www.sglgroup.net
Review of the current management contract by SGL indicates the key conditions/features include:
Fixed 5 year contract commenced 01/07/2011 and ceases 30/06/2016.
Contractor pays 48% of total gross revenue on all park activities and 40% of net profit from washing machines/clothes dryers.
Payments are in arrears (21 days) and late payments attract 1% interest.
Contractor pays $250,000 security deposit
Must provide Council with reconciled gross revenue statements and occupancy rates (within 10 days of the end of the month) as well as quarterly reports.
The contractor also must:
Provide all labor, plant and equipment to maintain and manage the parks.
Clean all facilities and carry out waste removal as per cleaning specification.
Meet the cost of all utilities/services and all leased equipment, insurances (P.I $20M, vehicle insurance, workers compensation insurance and cash in transit insurance).
Council sets all fees and grants rights to occupy each of the park’s residences at an agreed rental. Council also meets the cost of major capital replacement and improvements. The current contract does not have any business improvement incentive clauses or commercial capital investment opportunities and is based on the contractor receiving an agreed percentage of revenue and from that they need to meet all of their costs and obligations as specified in the contract.
APPENDIX A Page 34BMP - KSC CP
15DEC2015

Business Management Plan for KSC Caravan Parks 26-11-2015 (NSW 11.2014) - 7 December 2015 Page 30 Commercial in Confidence. SGL Consulting Group Australia Pty Ltd www.sglgroup.net
3.1 Introductio4n
This section lists a range of information related to caravan and holiday park research and market trends. It includes:
Review of Local Relevant Documents
Caravan Park Research and Industry Trends
Caravan park Industry Trends
Local Area Caravan Park Competitor Review
3.2 Review of Local Relevant Documents
The following local documents have been reviewed as part of the research section of this project commission:
Holiday Park Cabins Structural Report 2014: Keith Greenslade of Greenslade Engineering and Graham Brown of GRB Building Services.
Macleay Valley Coastal Holiday Parks Marketing Plan.
MVC Holiday Parks Business Planning Workshop Minutes May 8 2014.
Management contract between Kempsey Shire Council and Burcher Nominees June 2011 (see section 2.5 for summary details).
A summary of key issues raised from these documents is listed as follows.
3.2.1 Holiday Park Cabins Structural Report 2014
In responses to concerns in regards to cabin structural issues caused by what appears to be environment corrosion, Council organised an assessment to evaluate the extent of the corrosion on
each of the cabins at Council’s five Holiday Parks.
Council engaged the services of Keith Greenslade of Greenslade Engineering and Graham Brown of GRB Building Services, two trade professionals, to conduct the inspections. The inspections commenced on Wednesday, 9 April 2014 and concluded the following week. The result of the inspections determined that the corrosion varied from little or none, to severe with structure failure. They found that 11 cabins had severe corrosion and required urgent attention and 20 were considered to have significant corrosion. The inspection also indicated that the foundations of cabins 7, 8 and 9 at Crescent Head (Creek side)
have moved, which was likely to be causing each cabin to have a lean aspect. Given the range and extent of the corrosion on the cabins several mitigation methods were recommended. The severely and significantly (structurally) affected cabins required complete new sub frames built and the sub frames should be of a Hot Dipped Galvanised nature.
3 Caravan Park Research and Trends Review
APPENDIX A Page 35BMP - KSC CP
15DEC2015
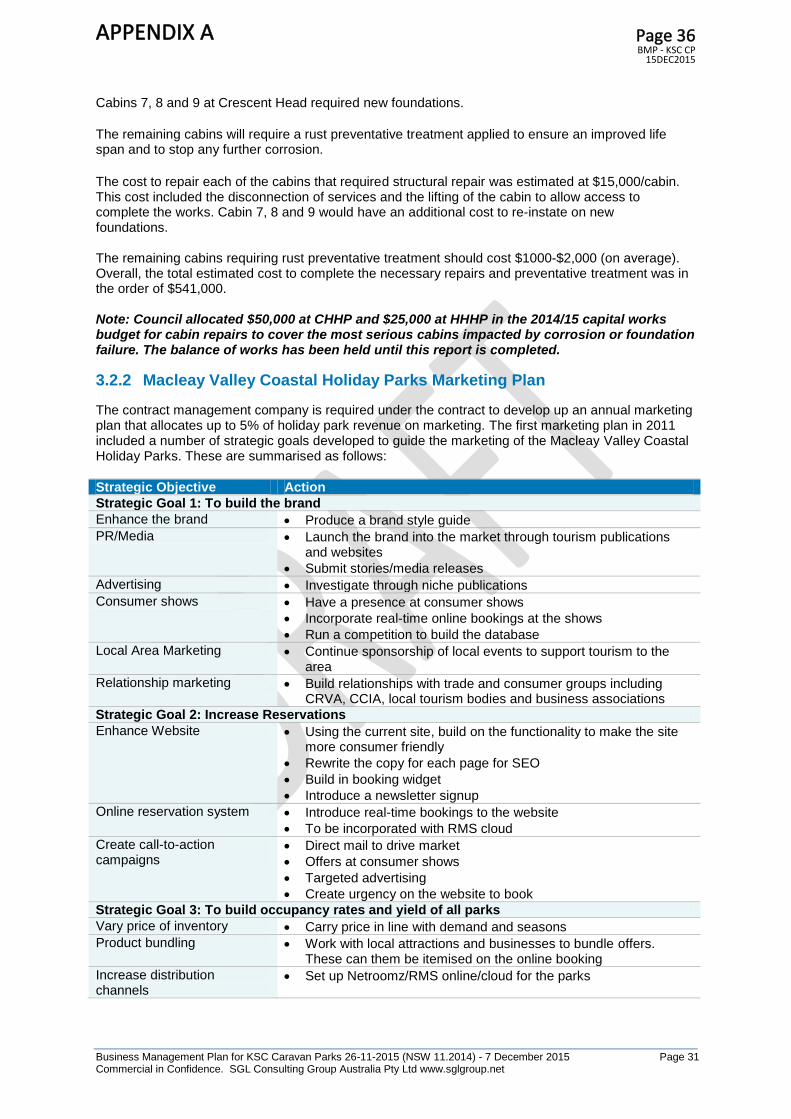
Business Management Plan for KSC Caravan Parks 26-11-2015 (NSW 11.2014) - 7 December 2015 Page 31 Commercial in Confidence. SGL Consulting Group Australia Pty Ltd www.sglgroup.net
Cabins 7, 8 and 9 at Crescent Head required new foundations.
The remaining cabins will require a rust preventative treatment applied to ensure an improved life span and to stop any further corrosion.
The cost to repair each of the cabins that required structural repair was estimated at $15,000/cabin. This cost included the disconnection of services and the lifting of the cabin to allow access to complete the works. Cabin 7, 8 and 9 would have an additional cost to re-instate on new foundations. The remaining cabins requiring rust preventative treatment should cost $1000-$2,000 (on average). Overall, the total estimated cost to complete the necessary repairs and preventative treatment was in the order of $541,000. Note: Council allocated $50,000 at CHHP and $25,000 at HHHP in the 2014/15 capital works budget for cabin repairs to cover the most serious cabins impacted by corrosion or foundation failure. The balance of works has been held until this report is completed.
3.2.2 Macleay Valley Coastal Holiday Parks Marketing Plan
The contract management company is required under the contract to develop up an annual marketing plan that allocates up to 5% of holiday park revenue on marketing. The first marketing plan in 2011 included a number of strategic goals developed to guide the marketing of the Macleay Valley Coastal Holiday Parks. These are summarised as follows:
Strategic Objective Action
Strategic Goal 1: To build the brand
Enhance the brand Produce a brand style guide
PR/Media Launch the brand into the market through tourism publications and websites
Submit stories/media releases
Advertising Investigate through niche publications
Consumer shows Have a presence at consumer shows
Incorporate real-time online bookings at the shows
Run a competition to build the database
Local Area Marketing Continue sponsorship of local events to support tourism to the area
Relationship marketing Build relationships with trade and consumer groups including CRVA, CCIA, local tourism bodies and business associations
Strategic Goal 2: Increase Reservations
Enhance Website Using the current site, build on the functionality to make the site more consumer friendly
Rewrite the copy for each page for SEO
Build in booking widget
Introduce a newsletter signup
Online reservation system Introduce real-time bookings to the website
To be incorporated with RMS cloud
Create call-to-action campaigns
Direct mail to drive market
Offers at consumer shows
Targeted advertising
Create urgency on the website to book
Strategic Goal 3: To build occupancy rates and yield of all parks
Vary price of inventory Carry price in line with demand and seasons
Product bundling Work with local attractions and businesses to bundle offers. These can them be itemised on the online booking
Increase distribution channels
Set up Netroomz/RMS online/cloud for the parks
APPENDIX A Page 36BMP - KSC CP
15DEC2015

Business Management Plan for KSC Caravan Parks 26-11-2015 (NSW 11.2014) - 7 December 2015 Page 32 Commercial in Confidence. SGL Consulting Group Australia Pty Ltd www.sglgroup.net
Strategic Objective Action
e-Marketing Introduce a sign-up newsletter on the website
Issue two e-marketing offers per month
Promote the local area and events through e-marketing
Dynamic pricing Do not publish the tariff sheet
Offer varying rates based around seasonality and demand
Strategic Goal 5: To provide a constant level of service across all parks
Brand consistency Write a brand guide to cover all consumer touch-points
Park Management Ensure continuity of park operations and customer service over all parks to give brand consistency
Staff training Implement a training strategy
Staff uniforms Ensure all staff are in uniform and wearing name badge (ground staff to have their names embroidered on their uniforms for safety reasons)
Quality of product/service Improve the facilities at each park
The annual budgets set for the first two years of the marketing plan included:
Key Area 2011/12 2012/13
1. Website $4,300 $33,000
2. Branding $0 $3,000
3. Advertising $38,899 $40,500
4. Online $6,500 $10,000
5. Memberships $19,869 $21,700
6. Promotions $23,906 $42,000
7. Miscellaneous $11,200 $27,000
Total MVC Holiday Parks Marketing Budget
$167,968
$177,200
The marketing plan provides a range of actions to achieve each strategic goal and included measurement outcomes and timelines for each strategy action.
3.2.3 MVC Holiday Parks Business Planning Workshop May 2014
A business plan workshop was held involving contractor and council representatives on the 8th of May
2014. The participants reviewed each holiday park against a range of key issues and the key findings are listed in Appendix 2. Priority future improvements suggested for each park to keep star rating or improve star rating are listed as follows: MVC Holiday Park/Rating
Priority Future Improvements To Keep Star Rating
Priority Future Improvements To Increase Star Rating
CHHP: 3.5 Stars Upgrade ocean-side amenities
Do minimum facelift for all cabins
Levelling of all sites
Improve cabins
New cabins by creek side
HHHP Upgrade of top block amenities, soft refurbishment on cabins
Fencing, top block amenities, camp kitchen, more powered sites
HBHP Improve sullage
Upgrade top amenity block
Level out sites
Soft refurbishment on identified cabins
Remove two smaller cabins
Upgrade the remaining six smaller cabins
Install camp kitchen/bbq area
Improve sullage
Upgrade top amenity block
SPHP Refurbish cabins, replace older smaller cabins
Possible waterfront cabins, more fencing (security issues restrict potential)
GPHP 2.5 Stars Improve plumping and electrical infrastructure where required
Camp Kitchen
Better playground facilities
Increase size of smaller sites
APPENDIX A Page 37BMP - KSC CP
15DEC2015

Business Management Plan for KSC Caravan Parks 26-11-2015 (NSW 11.2014) - 7 December 2015 Page 33 Commercial in Confidence. SGL Consulting Group Australia Pty Ltd www.sglgroup.net
3.3 Caravan Parks Research and Industry Trends
A range of market research documents has been reviewed to help identify key trends in the caravan park industry. Two major research documents provide an overview of key issues and these include: 1. Tourism Research Australia Tourism Research Australia (TRA) caravan and camping (CC) trends (2012) indicated:
There were 1638 caravan parks (40 or more with powered sites), employing more than 10,600 people.
These parks provided 225,100 sites with average occupancy rates of 53% and revenue of $50M.
Over the past 5 years there was a slight reduction in the number of CC parks mainly due to increasing land value cost.
In the past 5 years RV registration increased by 23% to 50,650 vehicles.
CC visitor nights were estimated at 45.3M, which represented 10% of all overnight visits.
Approx. 50% of visits were people aged 30 to 54yrs and 25% were people aged 55 to 70yrs (+12%).
More than 14.7m nights spent in NSW (33%) followed by QLD (21%), Vic (18.5%) and WA (12%).
A total of 81% of international visitors and 20% of domestic visitors used the internet to book and research the trip.
2. Tourism Research Australia – National Visitors Survey The overnight visitor accommodation statistics from the December 2013 quarter indicated:
There were a total of 302,368M visitor nights across Australia with NSW (86,996,000) receiving the highest visit nights followed by QLD (78,508,000) and Victoria (61,714,000).
Of these visitor nights 44,542,000 visitor nights were spent at caravan and camping grounds. This represented 14.8% of all visitor nights.
In NSW there were 14,180,000 visitor nights spent at caravan and camping sites and this represented higher than national averages at 16.1% of all visitor nights indicating NSW has a larger share of the caravan and camping visitor nights compared to other states.
3. The Caravan and Motorhome Club of Australia The caravan and motorhome club of Australia research indicated their latest caravan and camping (CC) trends in 2013 showed:
Est. 500,000 RVs are registered in Australia.
Approximately 120,000 RVs will be manufactured over the next five years.
Over 20,000 RVs have been manufactured each year since 2010.
New vehicles are increasingly low impact and self-contained and will dominate over the next five years.
There is also a trend to older people buying larger RVs so size of camp site will become an issue for older parks.
The market is worth $6.5 billion a year to the Australian economy.
They are the biggest spending travellers in the domestic tourism market and spend on average $500 to $900 per week.
On current trends RV travellers will increase by more than 60% over the next 10 years.
APPENDIX A Page 38BMP - KSC CP
15DEC2015

Business Management Plan for KSC Caravan Parks 26-11-2015 (NSW 11.2014) - 7 December 2015 Page 34 Commercial in Confidence. SGL Consulting Group Australia Pty Ltd www.sglgroup.net
4. Caravan Industry Association of Australia Research August 2014 CIAA research indicates that caravan registrations have experienced a higher rate of increase than any other vehicle type in the last two years, with research into the number of registered recreational vehicles (RVs) or motorhomes in Australia showing a jump year on year of 5%. In 2013 the number of registered RVs in Australia was 528,869, jumping from 502,025 the previous year. Of these registered vehicles 474,783 are towed product (including caravans, camper trailers, tent trailers, and other towed RVs) while 54,103 are motorised (motorhomes and campervans). RV production statistics for May 2014 are up 7.4% since May 2013. They also show the highest towables production in at least six years and the highest combined total since March 2011. Caravanning and camping is a significant industry in Australia, accounting for $7 billion of expenditure annually, and representing over 60 million visitor nights. These numbers are not solely the product of the 'grey nomad' (older people taking a long term camping trip around Australia) market - though these consumers remain significant. Industry data attributes this upsweep to younger families who are getting into the caravanning and camping spirit. According to Tourism Research Australia, the largest consumer group in the industry is made up of 35 to 49 year olds, who account for approximately 50% of all travel in the sector [5]. This is further backed by the Alliance Strategic Research findings that the key current user group is 35 to 49 year olds, particularly families with children. Other key Caravan and Holiday Park Industry Trends and Statistics include:
67.8 million site nights were spent in the caravanning and camping sector in 2012
45.3 million (67%) were in a caravan holiday park with above 40 sites
Expenditure by caravanning and camping consumers is approximately $7b annually
90% of all site nights are in regional Australia
90% of caravanning and camping activity is undertaken by Australian domestic travellers
The largest user group is 35-49 year olds with approximately 50% of all travel in the sector
There are 170,000 powered and unpowered sites available nightly in Australia.
At an average occupancy rate of 54% this means 86,000 sites go unused nightly around the country
There were 528,869 RVs registered in 2013. Of these registered vehicles 474,783 are towed product (such as caravans, camper trailers, tent trailers, and other towed RVs) while 54,103 are motorised (motorhomes and campervans).
Caravan registrations increased 5.96% to January 2012 – the highest recorded against other motor vehicle types
85% of the Australian population has stayed in a caravan holiday park at least once in their life
For every $100 of caravan park revenue $138 worth of direct economic benefit flows through the local economy
Local RV production in the year ending December 2013 was 20,402 (19,441 towed, 961 motorised). It is estimated up to 10,000 units (mainly camping trailers) may also be imported on an annual basis.
APPENDIX A Page 39BMP - KSC CP
15DEC2015
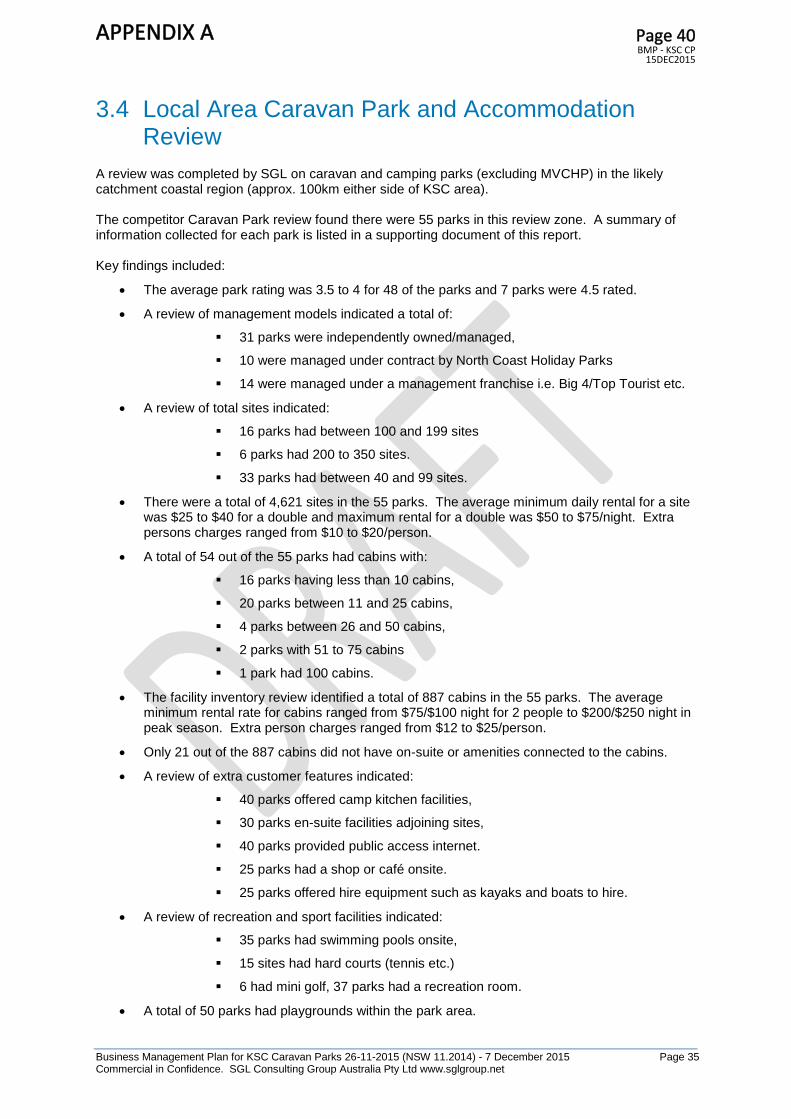
Business Management Plan for KSC Caravan Parks 26-11-2015 (NSW 11.2014) - 7 December 2015 Page 35 Commercial in Confidence. SGL Consulting Group Australia Pty Ltd www.sglgroup.net
3.4 Local Area Caravan Park and Accommodation Review
A review was completed by SGL on caravan and camping parks (excluding MVCHP) in the likely catchment coastal region (approx. 100km either side of KSC area). The competitor Caravan Park review found there were 55 parks in this review zone. A summary of information collected for each park is listed in a supporting document of this report. Key findings included:
The average park rating was 3.5 to 4 for 48 of the parks and 7 parks were 4.5 rated.
A review of management models indicated a total of:
31 parks were independently owned/managed,
10 were managed under contract by North Coast Holiday Parks
14 were managed under a management franchise i.e. Big 4/Top Tourist etc.
A review of total sites indicated:
16 parks had between 100 and 199 sites
6 parks had 200 to 350 sites.
33 parks had between 40 and 99 sites.
There were a total of 4,621 sites in the 55 parks. The average minimum daily rental for a site was $25 to $40 for a double and maximum rental for a double was $50 to $75/night. Extra persons charges ranged from $10 to $20/person.
A total of 54 out of the 55 parks had cabins with:
16 parks having less than 10 cabins,
20 parks between 11 and 25 cabins,
4 parks between 26 and 50 cabins,
2 parks with 51 to 75 cabins
1 park had 100 cabins.
The facility inventory review identified a total of 887 cabins in the 55 parks. The average minimum rental rate for cabins ranged from $75/$100 night for 2 people to $200/$250 night in peak season. Extra person charges ranged from $12 to $25/person.
Only 21 out of the 887 cabins did not have on-suite or amenities connected to the cabins.
A review of extra customer features indicated:
40 parks offered camp kitchen facilities,
30 parks en-suite facilities adjoining sites,
40 parks provided public access internet.
25 parks had a shop or café onsite.
25 parks offered hire equipment such as kayaks and boats to hire.
A review of recreation and sport facilities indicated:
35 parks had swimming pools onsite,
15 sites had hard courts (tennis etc.)
6 had mini golf, 37 parks had a recreation room.
A total of 50 parks had playgrounds within the park area.
APPENDIX A Page 40BMP - KSC CP
15DEC2015

Business Management Plan for KSC Caravan Parks 26-11-2015 (NSW 11.2014) - 7 December 2015 Page 36 Commercial in Confidence. SGL Consulting Group Australia Pty Ltd www.sglgroup.net
4.1 Introduction
This section of the report considers the findings from all research and consultation completed to assist with the future Macleay Valley Coastal Holiday Parks Plan of Management that will provide Council with market analysis, a Business Plan (including cost-benefit analysis and fee modeling) and a budgeted capital works program that is aimed at securing the parks’ long-term competitive advantage and commercial viability. This section covers
Highlighting market analysis to help improve the parks’ long-term commercial viability, including identifying each park’s niche market strengths and opportunities.
Completing cost-benefit analysis for a range of capital upgrade options, including the type and style of accommodation offered, amenities, grounds, facilities and other value-add services aimed at enhancing the visitor experience.
Reviewing and recommending the most effective and efficient future management model, including operational and reporting processes for day-to-day management.
4.2 MVC Holiday Park Review Key Findings
The business and operational review in association with past research and management plans that have been able to be reviewed indicate that the investment Council has made into this service area is creating significant economic and employment impact in the area.
4.2.1 Historical Trends See Major Returns on Holiday Park Investment
Historically, previous management plans indicate that prior to 1988, the four Council managed caravan parks were in poor condition, failing to meet regulatory requirements and losing money. The review found the Council contracts were set up to provide caretakers for the parks and there were no incentives for management to improve the parks assets, onsite accommodation or increase use and associated income. The report also noted:
The parks did not comply with regulatory standards and required significant upgrades and capital expenditure.
Were poorly presented and maintained.
The stock of available onsite accommodation was limited and mainly was low standard onsite caravans.
The tariff levels and charges were high for overnight and low for long-term users so inappropriate for the use and also park amenities and services standard offered.
There were a large number of permanent users and long-term visitors paying low rates who believed they had ongoing rights to the sites.
The combined caravan park contracts were operating at an annual loss.
Significant investment and change occurred from 1988 and some eight years after showed the four parks recorded a total income of $1.362M. Camping/site fees accounted for approximately 74% of
4 Future KSC Holiday Park Business Improvements
APPENDIX A Page 41BMP - KSC CP
15DEC2015

Business Management Plan for KSC Caravan Parks 26-11-2015 (NSW 11.2014) - 7 December 2015 Page 37 Commercial in Confidence. SGL Consulting Group Australia Pty Ltd www.sglgroup.net
income and onsite cabins accounted for 26% of income. The combined parks operating expenditure was estimated at $992,000. This saw a major turnaround in business performance from an operating loss in 1988 to an operating surplus (before capital investment) of $370,000. Council also invested $316,194 in capital works (mix of loan funded and direct funded projects) in 1996/97 and this was able to be funded from operating surpluses. Some five years later with further improvements, the 2002/03 financial year results for the four combined caravan parks saw annual income had increased to an estimated $1.900M ($600,000 increase in income). Annual operating expenditure was estimated at $1.288M so the net operating surplus (before capital expenditure) had also increased considerably to $612,000 (increase of $242,000 on 1996/97 operating surplus).
4.2.2 Holiday Parks are a Major Outlet for Local Tourism Economic Growth
The MVC Destination Management Plan 2014-2016 indicates the Macleay Valley’s tourism sector is a major contributor to the local economy, generating an estimated $173 million each year. It is also the region’s fourth largest employer, with 8.8 per cent of the local workforce employed in tourism-related
businesses.
Kempsey Shire Council recognises the signi ficant economic growth opportunities from growing and value adding to the local tourism industry and supports the State Government’s goal to double overnight expenditure by the year 2020.
Council further recognises that the Visitor Economy is broader than holiday-makers, covering many other visitors to the Macleay Valley Coast for sport, business, events, culture and entertainment, or to visit friends and relatives.
The Kempsey Shire Council Operating Plan 2013/14 identifies tourism as one of two key growth areas, alongside agriculture, capable of considerable return on investment from value adding.
4.2.3 Major Local Business that has Capacity for Increased Growth
Section 2 of this report indicates that the five Kempsey Shire Council holiday parks are now a major local business, generating in 2013/14 a total revenue from accommodation services of just over $6.100M. Other key MVC Holiday Park business statistics include:
The 65 cabins had an average occupancy of 3 to 4 people and based on the number of days available to hire per year (23,725 days), the cabins can accommodate 71,000 to 95,000 people per year.
In 2013/14 the combined parks cabins had occupancy for 15,441 days so this accommodated between 46,300 and 61,700 people.
The annual income received from cabin hire was $1.979M, or an average spend of $128/day/cabin.
The 485 short-term tourist sites had also an average occupancy of 3 to 4 people and based on the number of days available to hire per year (177,025) the sites can accommodate 531,000 to 708,000 people.
In 2013/14 the combined parks tourist sites had an occupancy of 98,940 days so this accommodated between 297,000 and 396,000 people.
The annual income received from tourist site hire was $3.939M, or an average spend of $39.81/day/tourist site.
National industry trends indicate that for every dollar spent at local caravan and camping sites, $1.38 is generated in economic impact. This sees the combined revenue and economic impact for the MVC Holiday Parks in 2013/14 estimated at:
APPENDIX A Page 42BMP - KSC CP
15DEC2015

Business Management Plan for KSC Caravan Parks 26-11-2015 (NSW 11.2014) - 7 December 2015 Page 38 Commercial in Confidence. SGL Consulting Group Australia Pty Ltd www.sglgroup.net
Total 2013/14 Operating Income: $6.171M
Total Economic Impact ($1/$1.38): $8.515M
Combined Revenue/Economic Impact: $14.868M
These estimated results indicate that the MVC Holiday Parks are estimated to be contributing $14.686M to the local area economy.
4.2.4 Future MVC Holiday Park Business Impacts
The key study findings indicate a range of future facility changes and management plan issues will impact on future service viability and business growth. These include:
Already high occupancy of cabins/sites at the three largest parks and high daily charges (compared to alternative area accommodation) will limit future revenue growth projections.
Aging cabins and amenities will require significant capital investment to upgrade so parks can compete in the local market, which is very competitive with 55 parks in the coastal catchment zone.
Site landscape, roads, services and site support facilities at the parks still need some upgrades and will also require ongoing investment.
New support facilities to meet industry changing trends such as on-suite sites, pull through sites and paved parking areas will require future capital investment.
Council has already invested $1.434M in past three years in capital improvements but only $137K has been spent on cabins even though they generate 33% of park income. Most capital has been spent on amenity upgrades/services.
Trends towards larger RVs with self-contained amenities will require some parks to have larger sites provision (which will reduce the number of sites) and services modified over time as less reliance on public amenities in some parks that can accommodate such RVs.
The absence of a long-term asset management plan means annual works are based on available budget rather than ongoing asset replacement/renewal.
Short-term management contract (five years) has no provisions for profit share, incentives for business growth and new services or opportunities for capital investment by the contractor.
Range of value-add services such as equipment hire and store (at isolated sites) not encourage or supported under current contract and the contractor would not invest as half the income has to be paid to Council, whatever the outlay.
Not a definite clear direction about why Council is in the caravan park business and what its key outcomes are from this involvement and has it got the financial capacity to fund the required improvements.
Due to large number of surrounding competitor facilities (50 parks identified in the local catchment area), will Council in the future be able to compete in the commercial accommodation industry?
4.3 Future HP Business Strategy 2016 to 2021
Council’s ongoing investment in holiday park facilities, amenities and services now supports a $6.1M major accommodation business that is attracting between 355,000 and 450,000 people a year to stay at the holiday parks. The recommended future business strategy for the next five financial years should be guided by the following strategies.
4.3.1 New Holiday Park Market and Development Categories
Detailed reviews of the business indicate that each of the holiday parks are different and, though marketed under a common brand (Macleay Valley Coastal Holiday Parks), the next plan of management needs to look at a mix of combined park and like category park improvements.
APPENDIX A Page 43BMP - KSC CP
15DEC2015

Business Management Plan for KSC Caravan Parks 26-11-2015 (NSW 11.2014) - 7 December 2015 Page 39 Commercial in Confidence. SGL Consulting Group Australia Pty Ltd www.sglgroup.net
The current facilities on site, their capacity for improvements and unique environment of the park and surrounds indicates Council has an opportunity to set the management plan up under three distinct new categories of holiday parks being:
The future suggested categorisation of the holiday parks has been made based on:
Major Destination Holiday Parks: These include Crescent Head Holiday Park and Horseshoe Bay Holiday Park, which are currently the highest occupancy and income yield parks. They have capacity for redevelopment to increase the quality of accommodation experience as well as greater occupancy and income per hire. They are both located in absolute beach frontage coastal locations in townships that have a range of major services and are close to many Macleay Valley tourism attractions. These parks will suit most travellers who want to camp by the beach but also like to have township facilities and services.
Unique Environment Holiday Parks: This category includes Hat Head Holiday Park, which is Council’s largest site positioned between ocean and river environments with large open outdoor spaces. The park is located away from major townships and offers a unique “get away” from urban development option. This category lends itself to people prepared to drive off the highway and away from towns to camp in a pristine coastal and river environment and who do not want close township facilities.
Outdoor Adventure Holiday Parks: This category includes Stuarts Point Holiday Park and Grassy Head Holiday Park, which are smaller capacity parks located in absolute beach frontage coastal locations well away from populated areas. They offer the outdoor adventurer who is prepared to drive well off the highway for both land and water recreation experiences in small occupancy parks that suit the people looking to “get away and relax”.
We have used these three holiday park categories to help link and guide future recommended development at each of the parks as well as help with prioritisation of improvements.
4.3.2 Reducing Holiday Park Sites
The review of each site indicates all five holiday parks are now located within restricted land areas and cannot continue to significantly increase their number of sites. Future plans developed for both Crescent Head HP and Horseshoe Bay HP recommend reduced sites.
Macleay Valley Coastal
Holiday Parks
Destination Holiday Parks
Crescent Head HP
Horseshoe Bay HP
Outdoor Adventure
Holiday Parks
Stuarts Point
Grassy Head
Unique Environment Holiday Parks
Hat Head HP
APPENDIX A Page 44BMP - KSC CP
15DEC2015

Business Management Plan for KSC Caravan Parks 26-11-2015 (NSW 11.2014) - 7 December 2015 Page 40 Commercial in Confidence. SGL Consulting Group Australia Pty Ltd www.sglgroup.net
In the view of SGL, any future plans to reduce the number of sites or undertake major capital works outside the scope of this Business Plan need to be carefully considered within the context of impact on, and relevance to, park income. Within a limited capital and rate-capped local government environment, priority should be given to funds that will improve the business, and increase occupancy and income. However it is noted that in the case of the Horseshoe Bay Plan of Management that Council gave consideration to broader community benefits in making the decision to reduce the number of sites. Community benefit may also be a consideration for the full development of the Crescent Head Plan of Management. It should be noted that financial projections included as part of this Business Plan are based upon the existing number of sites at all five parks.
4.3.3 Continue to Improve High Yield Accommodation Opportunities
History has also shown that as higher yield accommodation options such as cabins have been developed, there has been reduced numbers of camping sites and holiday vans (both low income yield categories), but more sites for short-stay visitors and this has directly assisted with higher income/site. Section 2.4.1 compares the 1997/98 holiday park capacities with 2015 and indicates with five holiday parks there are now 38 more cabins, 15 less long- term sites, 83 more tourist sites, 9 less holiday van sites and 70 less camping sites. This indicates very positive change, with higher income earning cabin and tourist sites and less long-term low-income earning camping, holiday van and long-term sites. The future management plan therefore needs to ensure “that land areas at each park are not reduced any further “and especially for major destination and unique environment holiday parks that more onsite cabin and new en-suite site accommodation options are planned and developed to directly increase occupancy and income per day hire. Continued reduction of holiday van sites when available at the two major destination holiday parks is also recommended as these are low yield sites that could attract higher occupancy and income if redeveloped into short-stay tourist sites.
4.3.4 New/Redeveloped Facilities/Services to Increase Occupancy/Income
Industry trends and customer satisfaction surveys indicate that people who choose caravan and camping facilities usually base this on key park assessment criteria including:
Coastal location and how close the park is to water areas
Park environment including quality of landscape/plantings as well as size of sites/site levels
Condition of amenities, access roads and site services
Cost and standard of accommodation
Safety of park and surrounds i.e. fenced/secure safe for children etc.
To assist in ranking where SGL has assessed the parks we have completed an overlay of these key park selection criteria against each of Council’s holiday parks as a guide to how we believe these are currently being met. We have used the following scoring criteria:
9-10: Excellent
7-8: Good
5-6: Adequate
3-5: Poor
1-2: Very poor
APPENDIX A Page 45BMP - KSC CP
15DEC2015
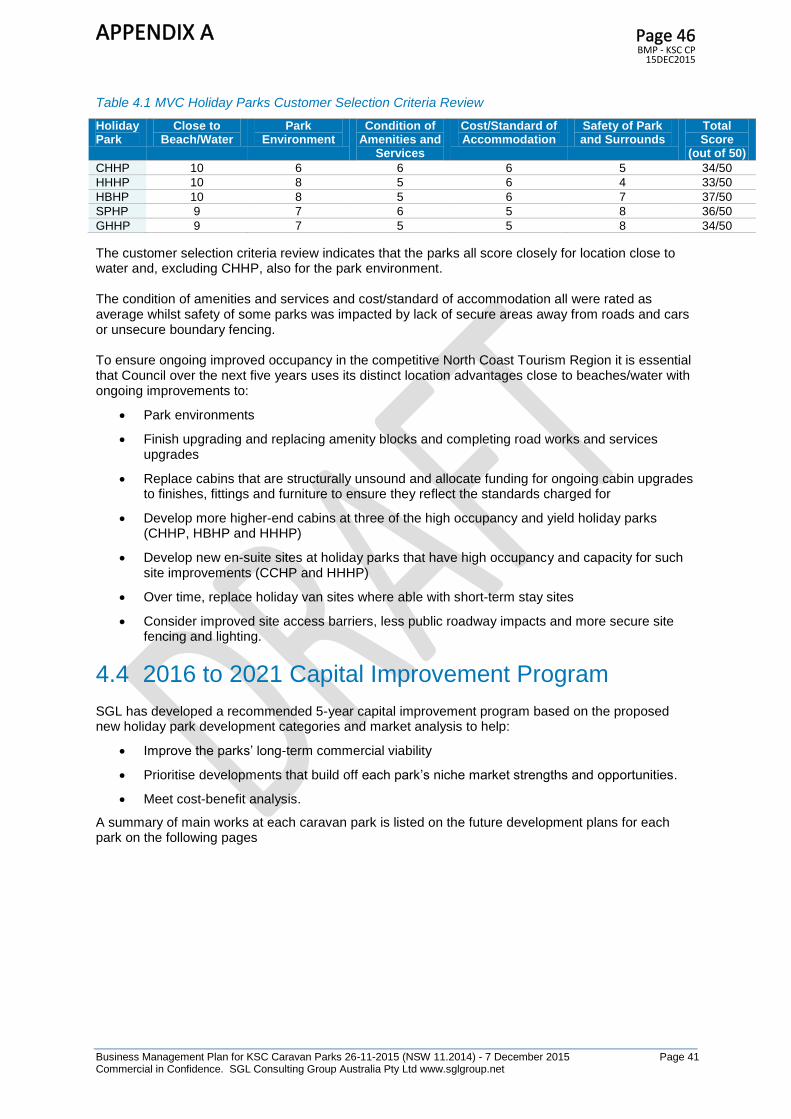
Business Management Plan for KSC Caravan Parks 26-11-2015 (NSW 11.2014) - 7 December 2015 Page 41 Commercial in Confidence. SGL Consulting Group Australia Pty Ltd www.sglgroup.net
Table 4.1 MVC Holiday Parks Customer Selection Criteria Review
Holiday Park
Close to Beach/Water
Park Environment
Condition of Amenities and
Services
Cost/Standard of Accommodation
Safety of Park and Surrounds
Total Score
(out of 50)
CHHP 10 6 6 6 5 34/50
HHHP 10 8 5 6 4 33/50
HBHP 10 8 5 6 7 37/50
SPHP 9 7 6 5 8 36/50
GHHP 9 7 5 5 8 34/50
The customer selection criteria review indicates that the parks all score closely for location close to water and, excluding CHHP, also for the park environment. The condition of amenities and services and cost/standard of accommodation all were rated as average whilst safety of some parks was impacted by lack of secure areas away from roads and cars or unsecure boundary fencing. To ensure ongoing improved occupancy in the competitive North Coast Tourism Region it is essential that Council over the next five years uses its distinct location advantages close to beaches/water with ongoing improvements to:
Park environments
Finish upgrading and replacing amenity blocks and completing road works and services upgrades
Replace cabins that are structurally unsound and allocate funding for ongoing cabin upgrades to finishes, fittings and furniture to ensure they reflect the standards charged for
Develop more higher-end cabins at three of the high occupancy and yield holiday parks (CHHP, HBHP and HHHP)
Develop new en-suite sites at holiday parks that have high occupancy and capacity for such site improvements (CCHP and HHHP)
Over time, replace holiday van sites where able with short-term stay sites
Consider improved site access barriers, less public roadway impacts and more secure site fencing and lighting.
4.4 2016 to 2021 Capital Improvement Program
SGL has developed a recommended 5-year capital improvement program based on the proposed new holiday park development categories and market analysis to help:
Improve the parks’ long-term commercial viability
Prioritise developments that build off each park’s niche market strengths and opportunities.
Meet cost-benefit analysis.
A summary of main works at each caravan park is listed on the future development plans for each park on the following pages
APPENDIX A Page 46BMP - KSC CP
15DEC2015
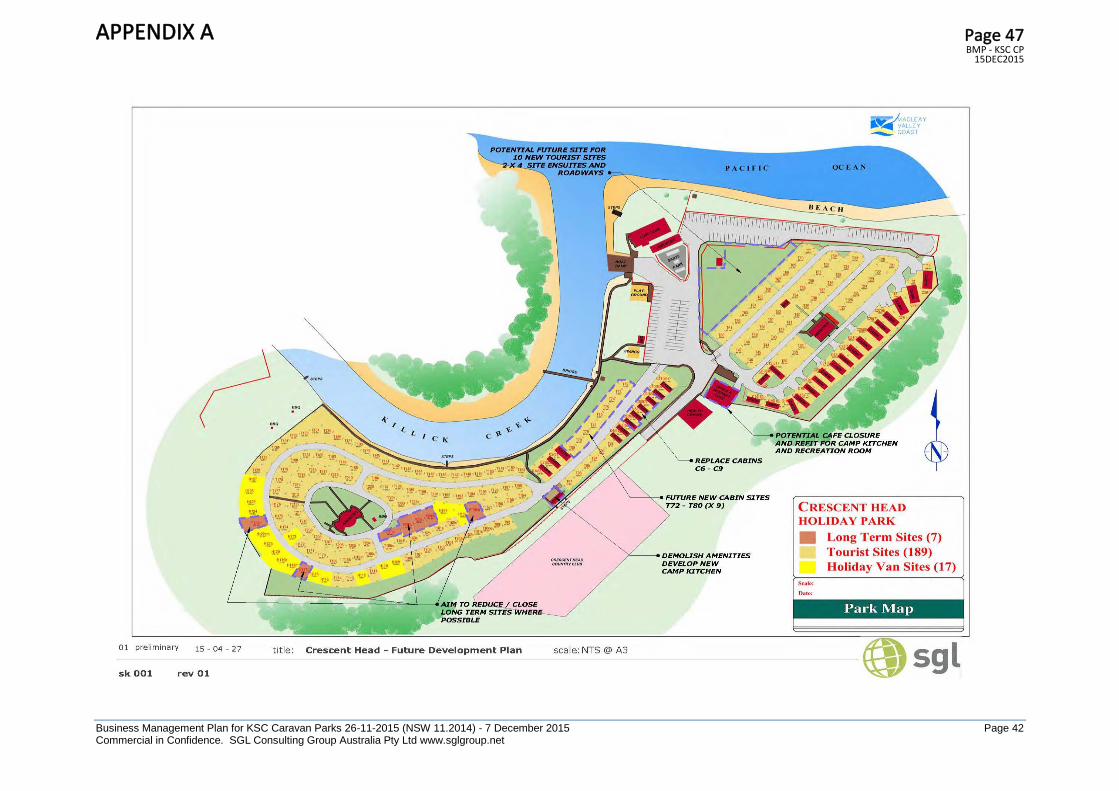
Business Management Plan for KSC Caravan Parks 26-11-2015 (NSW 11.2014) - 7 December 2015 Page 42 Commercial in Confidence. SGL Consulting Group Australia Pty Ltd www.sglgroup.net
APPENDIX A Page 47BMP - KSC CP
15DEC2015

Business Management Plan for KSC Caravan Parks 26-11-2015 (NSW 11.2014) - 7 December 2015 Page 43 Commercial in Confidence. SGL Consulting Group Australia Pty Ltd www.sglgroup.net
APPENDIX A Page 48BMP - KSC CP
15DEC2015

Business Management Plan for KSC Caravan Parks 26-11-2015 (NSW 11.2014) - 7 December 2015 Page 44 Commercial in Confidence. SGL Consulting Group Australia Pty Ltd www.sglgroup.net
APPENDIX A Page 49BMP - KSC CP
15DEC2015
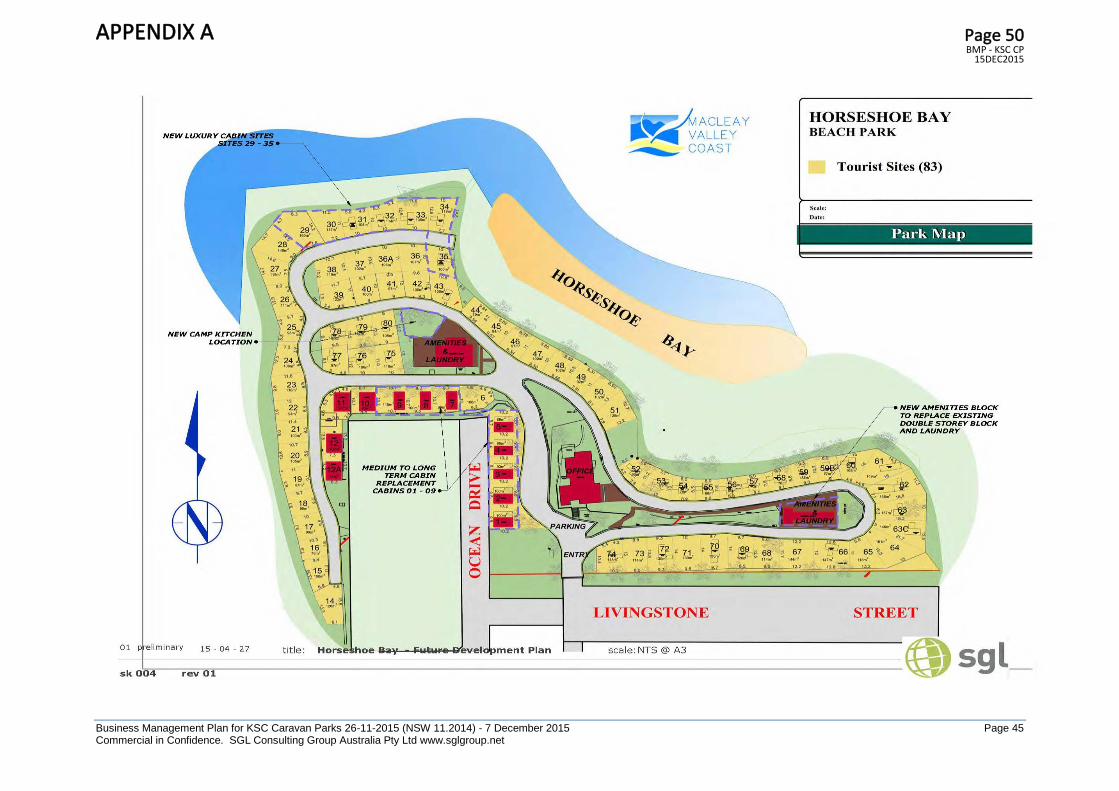
Business Management Plan for KSC Caravan Parks 26-11-2015 (NSW 11.2014) - 7 December 2015 Page 45 Commercial in Confidence. SGL Consulting Group Australia Pty Ltd www.sglgroup.net
APPENDIX A Page 50BMP - KSC CP
15DEC2015

Business Management Plan for KSC Caravan Parks 26-11-2015 (NSW 11.2014) - 7 December 2015 Page 46 Commercial in Confidence. SGL Consulting Group Australia Pty Ltd www.sglgroup.net
APPENDIX A Page 51BMP - KSC CP
15DEC2015

Business Management Plan for KSC Caravan Parks 26-11-2015 (NSW 11.2014) - 7 December 2015 Page 47 Commercial in Confidence. SGL Consulting Group Australia Pty Ltd www.sglgroup.net
To assist with estimating capital costs for the recommended works we have made the following assumptions based on information available: 1. New Cabin Layouts and Associated Costs Comparison SGL has collected information from three manufacturers of park cabins to assist in determining likely costs for new and replacement cabins. We have looked at a range of layouts (that will fit the sites) with all cabins needing 4 to 6 berth capacities, as this is the family/couples market using, or likely to use, cabins. The manufacturers we reviewed included:
Jayco: Australia’s largest manufacturer of caravans, RVs, cabins and kit homes based in Dandenong, Victoria (approximately 1300kms from Kempsey).
Timberline: There are a number of the company cabins on site and the company manufacturing is based in Armidale, NSW (approximately 200kms from Kempsey).
Lifestyle: There are a number of the company cabins on site and the company manufacturing is based in Ulladulla, NSW (approximately 650kms from Kempsey).
The following table highlights the manufacturer’s cabin products (from internet searches and brochure reviews) that are of a size to fit most sites and the cabins associated purchase cost (before transport, site erection and service connection allowances). Please note that the quoted prices relate to individual units and there could be possible discount pricing allocated if multiple units were purchased. Table 4.2 Review of Manufactured Cabins Suitable for MVC Holiday Parks
Size of Cabin Jacyo Lifestyle Timberline Length Width Model Cost Model Cost Model Cost
9.7m 4.7m 30.1A $54,484 Bawley $61,843 Omaha $82,520
12.0m 4.7m 30.9A $62,238 Ulladulla $76,893 Fernvale $82,520
12.2m 5.2m 40.- A $64,779 Ulladulla $76,893 Fernvale $82,520
13.4m 4.7m 40.4-A $65,857 Ulladulla $76,893 Fernvale $82,520
11.0m 4.7m Miner $63,440 Papua $71,476 Appley $80,880
The estimated cost to transport and erect and connect services on site was estimated from information from company. These are estimate costs, with size and numbers impacting on the final cost:
Jayco: Approximately $11,000 transport/cabin and $5000 installation cost on site (using local trades persons).
Lifestyle: Approximately $8500 transport/cabin and same installation costs as the others.
Timberline: Approximately $6500 transport cost/cabin and same installation costs as the others.
Based on reviewing the three companies’ estimated prices, we have used for capital works estimated costing and modelling the Jayco cabin product range prices. We have added to these costs $16,000 for transport and installation on site. We have selected them as over the product range they are the lowest cost company based on the information able to be sourced. Obviously if Council approves future cabin purchases, these would be tendered and final costs could be determined, including any discounts for multiple orders, transport and installation. The recommended capital works program for cabins has been set up under three categories being:
Cabin replaced ASAP (based on park management, maintenance manager and engineers report)
Replaced over next five years (based on past use date)
New cabin installation opportunities (based on expanding cabin accommodation at key parks).
APPENDIX A Page 52BMP - KSC CP
15DEC2015

Business Management Plan for KSC Caravan Parks 26-11-2015 (NSW 11.2014) - 7 December 2015 Page 48 Commercial in Confidence. SGL Consulting Group Australia Pty Ltd www.sglgroup.net
We have also assumed that the cabins being removed have some value and have searched companies that may be interested in purchasing them and removing them at their cost. We were not able to get fixed guides to the worth of each cabin (as they would be subject to inspection) so we have used an estimated sale income of $5000 for modelling purposes, based on purchaser meets all removal costs and disconnection of services to make the site safe. 2. Amenities Upgrades Amenity upgrades are still to be completed and are recommended at a number of parks. For costing purposes (until detailed design is completed), we have used an average refurbishment allowance of $220,000. This is based on the past three amenity upgrades completed at Horseshoe Bay HP ($270,000), Crescent Head HP ($200,000) and Hat Head HP ($170,000). 3. Roadway Improvements Internal holiday park roadways at Horseshoe Bay HP, Hat Head HP, Stuarts Point HP and Grassy Point HP are all recommend for upgrades over the next five years. For costing purposes, we have used approximate road areas from the layout maps and used Council’s current cost allowance for resealing and repair at $72/sq m.
4.4.1 Future Park Improvements and Costs 5 Year Program
The recommended holiday park improvement works have been set up into each park and prioritised for the next five years. They are listed as follows under each future development category and associated park.
4.4.1.1 Destination Holiday Parks
The following table lists the next five years recommended capital improvements at the two destination holiday parks.
Table 4.3 Destination Holiday Parks 5 Year Capital Improvement Works
Holiday Park
Proposed Works
Details 2016/17 2017/18 2018/19 2019/20 2020/21 Total Allocation
CHHP Cabin Replacement at sites C6, C7, C8 and C9
Replacement cabins (Model 301.A) @ $54,500/cabin plus travel/install $16,000 = $70,500
4 cabins @ $70,500 = $282,000
$282,000 (4 cabins)
$282,000
New Cabins Creek Side sites T172 to T180
New cabins (Model - Miner) @ $63,500/cabin plus travel/install $16,000 = $79,500
9 cabins @ $79,500 = $715,500
$238,500 (3 cabins)
$238,500 (3 Cabins)
$238,500 (3 Cabins)
$715,500
Cabin Refurbishment for C1 to C5 and C10/11 and C24 to 27
Allow $15,000 per cabin for internal refurbishment and new furniture.
15 cabins @ $15,000/cabin = $225,000
$45,000 (3 cabins)
$45,000 (3 cabins)
$45,000 (3 cabins)
$45,000 (3 cabins)
$45,000 (3 cabins)
$225,000
Develop 2 x En-Suite Site Areas at Beachside
Allow $41,500 +$16,000 travel/install for en-suite unit (serves 4 sites) plus road works and services say $53,000/site
2 en-suites @ $110,000 site = $220,000
$110,000 (1 x en-
suite area)
$110,000 (1 x en-
suite area)
$220,000
APPENDIX A Page 53BMP - KSC CP
15DEC2015
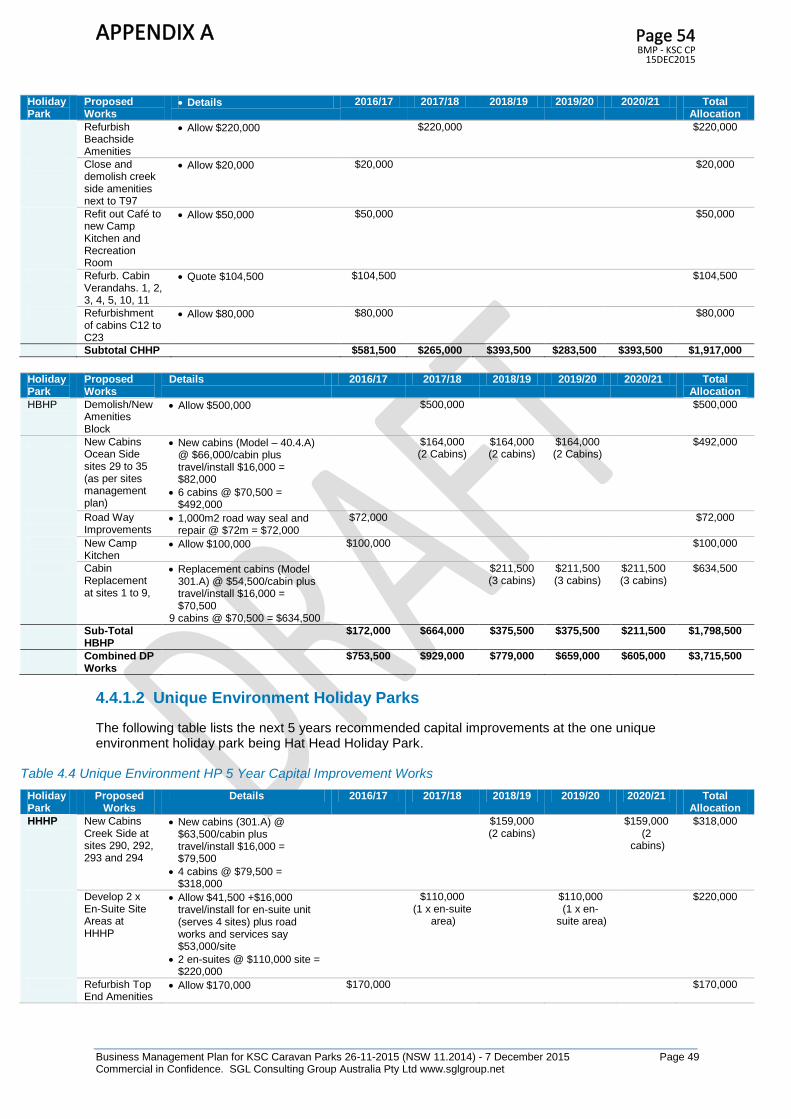
Business Management Plan for KSC Caravan Parks 26-11-2015 (NSW 11.2014) - 7 December 2015 Page 49 Commercial in Confidence. SGL Consulting Group Australia Pty Ltd www.sglgroup.net
Holiday Park
Proposed Works
Details 2016/17 2017/18 2018/19 2019/20 2020/21 Total Allocation
Refurbish Beachside Amenities
Allow $220,000 $220,000 $220,000
Close and demolish creek side amenities next to T97
Allow $20,000 $20,000 $20,000
Refit out Café to new Camp Kitchen and Recreation Room
Allow $50,000 $50,000 $50,000
Refurb. Cabin Verandahs. 1, 2, 3, 4, 5, 10, 11
Quote $104,500 $104,500 $104,500
Refurbishment of cabins C12 to C23
Allow $80,000 $80,000 $80,000
Subtotal CHHP $581,500 $265,000 $393,500 $283,500 $393,500 $1,917,000
Holiday Park
Proposed Works
Details 2016/17 2017/18 2018/19 2019/20 2020/21 Total Allocation
HBHP Demolish/New Amenities Block
Allow $500,000 $500,000 $500,000
New Cabins Ocean Side sites 29 to 35 (as per sites management plan)
New cabins (Model – 40.4.A) @ $66,000/cabin plus travel/install $16,000 = $82,000
6 cabins @ $70,500 = $492,000
$164,000 (2 Cabins)
$164,000 (2 cabins)
$164,000 (2 Cabins)
$492,000
Road Way Improvements
1,000m2 road way seal and repair @ $72m = $72,000
$72,000 $72,000
New Camp Kitchen
Allow $100,000 $100,000 $100,000
Cabin Replacement at sites 1 to 9,
Replacement cabins (Model 301.A) @ $54,500/cabin plus travel/install $16,000 = $70,500
9 cabins @ $70,500 = $634,500
$211,500 (3 cabins)
$211,500 (3 cabins)
$211,500 (3 cabins)
$634,500
Sub-Total HBHP
$172,000 $664,000 $375,500 $375,500 $211,500 $1,798,500
Combined DP Works
$753,500 $929,000 $779,000 $659,000 $605,000 $3,715,500
4.4.1.2 Unique Environment Holiday Parks
The following table lists the next 5 years recommended capital improvements at the one unique environment holiday park being Hat Head Holiday Park.
Table 4.4 Unique Environment HP 5 Year Capital Improvement Works
Holiday Park
Proposed Works
Details 2016/17 2017/18 2018/19 2019/20 2020/21 Total Allocation
HHHP New Cabins Creek Side at sites 290, 292, 293 and 294
New cabins (301.A) @ $63,500/cabin plus travel/install $16,000 = $79,500
4 cabins @ $79,500 = $318,000
$159,000 (2 cabins)
$159,000 (2
cabins)
$318,000
Develop 2 x En-Suite Site Areas at HHHP
Allow $41,500 +$16,000 travel/install for en-suite unit (serves 4 sites) plus road works and services say $53,000/site
2 en-suites @ $110,000 site = $220,000
$110,000 (1 x en-suite
area)
$110,000 (1 x en-
suite area)
$220,000
Refurbish Top End Amenities
Allow $170,000 $170,000 $170,000
APPENDIX A Page 54BMP - KSC CP
15DEC2015
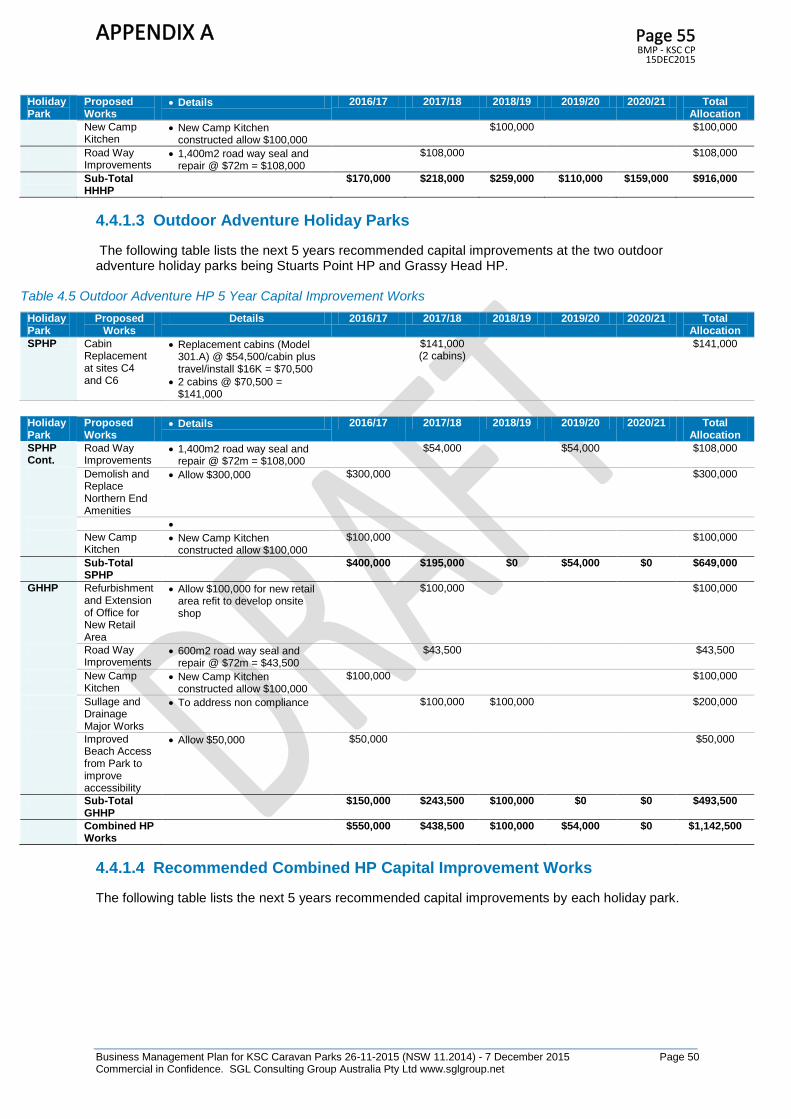
Business Management Plan for KSC Caravan Parks 26-11-2015 (NSW 11.2014) - 7 December 2015 Page 50 Commercial in Confidence. SGL Consulting Group Australia Pty Ltd www.sglgroup.net
Holiday Park
Proposed Works
Details 2016/17 2017/18 2018/19 2019/20 2020/21 Total Allocation
New Camp Kitchen
New Camp Kitchen constructed allow $100,000
$100,000 $100,000
Road Way Improvements
1,400m2 road way seal and repair @ $72m = $108,000
$108,000 $108,000
Sub-Total HHHP
$170,000 $218,000 $259,000 $110,000 $159,000 $916,000
4.4.1.3 Outdoor Adventure Holiday Parks
The following table lists the next 5 years recommended capital improvements at the two outdoor adventure holiday parks being Stuarts Point HP and Grassy Head HP.
Table 4.5 Outdoor Adventure HP 5 Year Capital Improvement Works
Holiday Park
Proposed Works
Details 2016/17 2017/18 2018/19 2019/20 2020/21 Total Allocation
SPHP Cabin Replacement at sites C4 and C6
Replacement cabins (Model 301.A) @ $54,500/cabin plus travel/install $16K = $70,500
2 cabins @ $70,500 = $141,000
$141,000 (2 cabins)
$141,000
Holiday Park
Proposed Works
Details 2016/17 2017/18 2018/19 2019/20 2020/21 Total Allocation
SPHP Cont.
Road Way Improvements
1,400m2 road way seal and repair @ $72m = $108,000
$54,000 $54,000 $108,000
Demolish and Replace Northern End Amenities
Allow $300,000 $300,000 $300,000
New Camp Kitchen
New Camp Kitchen constructed allow $100,000
$100,000 $100,000
Sub-Total SPHP
$400,000 $195,000 $0 $54,000 $0 $649,000
GHHP Refurbishment and Extension of Office for New Retail Area
Allow $100,000 for new retail area refit to develop onsite shop
$100,000 $100,000
Road Way Improvements
600m2 road way seal and repair @ $72m = $43,500
$43,500 $43,500
New Camp Kitchen
New Camp Kitchen constructed allow $100,000
$100,000 $100,000
Sullage and Drainage Major Works
To address non compliance $100,000 $100,000 $200,000
Improved Beach Access from Park to improve accessibility
Allow $50,000 $50,000 $50,000
Sub-Total GHHP
$150,000 $243,500 $100,000 $0 $0 $493,500
Combined HP Works
$550,000 $438,500 $100,000 $54,000 $0 $1,142,500
4.4.1.4 Recommended Combined HP Capital Improvement Works
The following table lists the next 5 years recommended capital improvements by each holiday park.
APPENDIX A Page 55BMP - KSC CP
15DEC2015
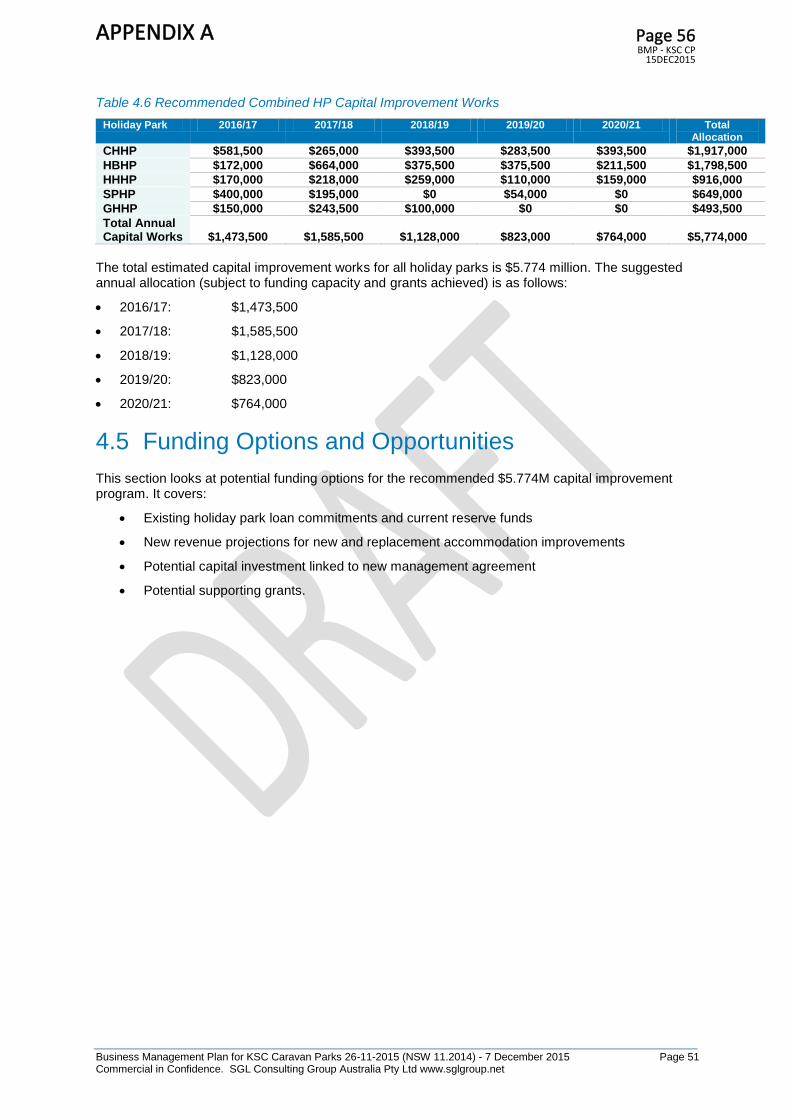
Business Management Plan for KSC Caravan Parks 26-11-2015 (NSW 11.2014) - 7 December 2015 Page 51 Commercial in Confidence. SGL Consulting Group Australia Pty Ltd www.sglgroup.net
Table 4.6 Recommended Combined HP Capital Improvement Works
Holiday Park 2016/17 2017/18 2018/19 2019/20 2020/21 Total Allocation
CHHP $581,500 $265,000 $393,500 $283,500 $393,500 $1,917,000
HBHP $172,000 $664,000 $375,500 $375,500 $211,500 $1,798,500
HHHP $170,000 $218,000 $259,000 $110,000 $159,000 $916,000
SPHP $400,000 $195,000 $0 $54,000 $0 $649,000
GHHP $150,000 $243,500 $100,000 $0 $0 $493,500
Total Annual Capital Works $1,473,500 $1,585,500 $1,128,000 $823,000 $764,000 $5,774,000
The total estimated capital improvement works for all holiday parks is $5.774 million. The suggested annual allocation (subject to funding capacity and grants achieved) is as follows:
2016/17: $1,473,500
2017/18: $1,585,500
2018/19: $1,128,000
2019/20: $823,000
2020/21: $764,000
4.5 Funding Options and Opportunities
This section looks at potential funding options for the recommended $5.774M capital improvement program. It covers:
Existing holiday park loan commitments and current reserve funds
New revenue projections for new and replacement accommodation improvements
Potential capital investment linked to new management agreement
Potential supporting grants.
APPENDIX A Page 56BMP - KSC CP
15DEC2015

Business Management Plan for KSC Caravan Parks 26-11-2015 (NSW 11.2014) - 7 December 2015 Page 52 Commercial in Confidence. SGL Consulting Group Australia Pty Ltd www.sglgroup.net
4.5.1.1 Existing Holiday Park Loan Commitments
The following table lists the current loan commitments Council had at each of the five holiday parks as at the 30th June 2014.
Table 4.7 Existing Holiday Park Loan Commitments
Loan/Number Interest Rate
Term Borrowing Commenced Completion Crescent Head
Hat Head Stuarts Point Grassy Head Horseshoe Bay
Total
Loan 395 (1.47% to CHHP)) 5.96% 10 Years $36,368.00 1/03/06 1/03/16 8,034.55 8,034.55
Loan 401 (1.51% to HBHP) 4.35% 5 Years $1,523,000.00
29/05/14 29/05/19 22,997.00 22,997.00
Loan 537 5% 7 Years $150,000.00 1/08/07 1/08/14 21,559.48 21,559.48
Loan 538 5.50% 7 Years $600,000.00 1/08/07 1/08/14 85,822.43 85,822.43
Loan 539 3.50% 7 Years $60,000.00 20/06/08 20/06/15 8,799.37 8,799.37
Loan 540 5.50% 7 Years $125,000.00 20/06/08 20/06/15 17,959.20 17,959.20
Loan 542 5.00% 7 Years $635,000.00 7/12/09 7/06/16 272,307.76 272,307.76
Loan 543 3.50% 7 Years $523,500.00 7/12/09 7/06/16 314,167.77 314,167.77
Loan 544 3.50% 7 Years $300,000.00 27/05/10 27/05/17 128,607.13 128,607.13
Loan 545 3.50% 7 Years $80,000.00 27/05/10 27/05/17 34,294.43 34,294.43
Loan 546 3.50% 7 Years $70,000.00 27/05/10 27/05/17 30,009.13 30,009.13
Total Loans $16,833.92 $69,527.81 $248,723.99 $0.00 $609,472.53 $944,558.25
The review of current loans indicates Council had outstanding loans totaling $944,558 at four of the five holiday parks as at the 30
th of June 2014. A number
of these loans (as highlighted in yellow shading) will be repaid before the 2016-21 MVC HP Management Plan is implemented. Based on the repayment completion date, the following loans will still be outstanding from 2015/16 to 2018/19 Council financial years:
Crescent Head HP: $8,034.55 (completed 01/03/2016)
Hat Head HP: $30,009.13 (completed 27/05/2017)
Stuarts Point HP: 2 loans totaling $162,901.56 (completed 27/05/2017)
Horseshoe Bay HP: 2 loans totaling $586,475.53 (completed 07/06/2016) and 1 loan totaling $22,997 (completed 29/05/2019)
This will see a total of 6 outstanding loans to be paid out during the term of the next management plan at a total repayment of $810,417.77
APPENDIX A Page 57BMP - KSC CP
15DEC2015

Business Management Plan for KSC Caravan Parks 26-11-2015 (NSW 11.2014) - 7 December 2015 Page 53 Commercial in Confidence. SGL Consulting Group Australia Pty Ltd www.sglgroup.net
4.5.2 Current Reserve Funds
Council has two funding reserves relating to the holiday parks and surrounding reserves, being:
The 4 Shore Reserve has the accumulated funds in respect of the Crescent Head, Hat Head, Stuarts Point and Grassy Head Reserves and the balance at 30 June 2014 was $479,357.
The South West Rocks Reserve (HBHP) balance was $431,560 at 30 June 2014.
Both funds are available for consideration to help fund capital improvements and investment within the specific areas related to each reserve fund.
4.5.3 Revenue Projections from New Accommodation Investments
To assist with potential funding and financing models for the recommend capital improvements, SGL has reviewed potential revenue projections related to replacement and new accommodation options proposed at key sites. This is detailed as follows: 1. Sale of Cabins Nominated to be Replaced The cabin sales estimate assumptions follow contact with a range of companies that purchase cabins but were not prepared to nominate a fixed sale price due to the variances of condition, cost of travel and reinstating the site. Companies indicated in similar circumstances that they previously have purchased similar aged cabins at $7500 to $10,000 each. To ensure conservative estimates, we have made a sales allowance of $5000/cabin. We have assumed a sale return of $5000 from each cabin nominated for replacement being:
CHHP: 4 cabins @ $5000 = $20,000
HBHP: 9 cabins @ $5000 = $45,000
SPHP: 2 cabins @ $5000 = $10,000
Total Cabin Est. Sale Income: = $75,000
2. New Cabin Revenue Estimates A total of 19 new cabins have been recommended to be installed at CHHP (9 cabins), HBHP (6 cabins) and HHHP (4 cabins) over the next 5 years. Based on current occupancy and average yield from each holiday park, we have estimated the new revenue from new cabins as listed in the table below: Table 4.8 New Cabin Projected Year One Revenue
Holiday Park Number of New Cabins
Estimated Average Days Occupied/Year
Average Income per Day
Est. Annual Income/Cabin
Est. Annual Income All
Cabins
Crescent Head HP 9 260 (71%) $150 $39,000 $351,000
Horseshoe Bay HP 6 267 (73%) $120 $32,040 $192,240
Hat Head HP 4 230 (63%) $120 $27,600 $110,400
Total Annual New Cabin Income
19 N/A N/A N/A $653,640
Note: Have assumed cabin occupancy is the same as current holiday park rate and average income per day is current daily rate plus CPI.
2.1. New Cabin Expenditure Estimates We have made operating expenditure allowances for cleaning and maintaining the new cabins based on an average clean every 3 occupied days and an allowance of $2000 per cabin for maintenance allowance of $2000/cabin. This would see the following new cabin expenditure as listed in the table on the next page.
APPENDIX A Page 58BMP - KSC CP
15DEC2015

Business Management Plan for KSC Caravan Parks 26-11-2015 (NSW 11.2014) - 7 December 2015 Page 54 Commercial in Confidence. SGL Consulting Group Australia Pty Ltd www.sglgroup.net
Table 4.9 New Cabin Projected Year One Expenditure
Holiday Park Number of New Cabins
Estimated Average Days Cleaned @ $50
Maintenance/Power Allowance Cost
Est. Annual Expenditure Per
Cabin
Est. Annual Income All
Cabins
Crescent Head HP 9 86 days x$50 = $4,300/year
$5,000/Cabin $9,300 $83,700
Horseshoe Bay HP 6 89 days x $50 = $4,450/year
$5,000/Cabin $9,450 $56,700
Hat Head HP 4 77 days x $50 = $3,850/year
$5,000/Cabin $8,850 $35,400
Total Annual New Cabin Income
19 N/A N/A N/A $175,800
Note: Have assumed that the cabin cleaning cost is $50 every 3 days occupied and maintenance/services allowance is $5,000/cabin/year.
2.2. Loss of Site Income for New Cabin Sites All 19 new cabins are being located on existing sites so the new cabins will impact site income. This has been calculated as follows in the following table. Table 4.10 New Cabin Projected Year One Reduced Site Income Reduction
Holiday Park Number of Sites
Reduced
Average Site Occupied Days
Reduced
Average Site Income/Day
Lost
Est. Annual Site Income
Reduction
Est. Annual Site Income
Reduction
Crescent Head HP 9 190 days $41.70/day $7,923 $71,307
Horseshoe Bay HP 6 266 days $43.59/day $11,594 $69,564
Hat Head HP 4 237 days $39.72/day $9,413 $37,652
Total Annual New Cabin Income
19 N/A N/A N/A $178,523
Note: Have assumed current site occupancy rates per holiday park and average daily site fee income.
2.3. Net Operating Surplus Estimated for New Cabins Based on the assumptions for annual income, operating expenditure and loss of site income the following net operating surplus are estimated for the new cabins. Table 4.11 New Cabin Estimated New Operating Surplus
Holiday Park Number of New Cabins
Annual Cabin
Income/Year
Less Annual Cabin
Expenditure
Less Annual Site Lost Income
New Cabin Est. Annual
Operating Surplus
Combined Cabins Est.
Annual Operating Surplus
Crescent Head HP
9 $39,000 -$9,300 -$7,923 $21,777 $195,993
Horseshoe Bay HP
6 $32,040 -$9,450 -$11,594 $10,996 $65,976
Hat Head HP 4 $27,600 -$8,850 -$9,413 $9,337 $37,348
Total Annual New Cabin Income
19 299,317
.
The review of new cabin income and associated operating costs and loss of site income indicates the net first year operating result would be in the order of:
Crescent Head HP: $21,800/cabin or $196,000 for the proposed 9 cabins
Horseshoe Bay HP: $10,996/cabin or $66,000 for the proposed 6 cabins
Hat Head HP: $9,337/cabin or $37,348 for the proposed 4 cabins
Combined new cabins operating surplus of approximately $300,000 year.
The detailed review of installing the new cabins based on conservative current business trends is expected to see an annual operating surplus of approximately $300,000 year.
APPENDIX A Page 59BMP - KSC CP
15DEC2015

Business Management Plan for KSC Caravan Parks 26-11-2015 (NSW 11.2014) - 7 December 2015 Page 55 Commercial in Confidence. SGL Consulting Group Australia Pty Ltd www.sglgroup.net
The net operating surplus does not include at this stage the cost of borrowings on capital, which will need to be factored in consideration of:
Council’s capacity to attract grants for proposed works
Council’s capacity to use reserves for part funding of improvements
Council’s capacity to borrow to fund improvements
Timing of improvements and timing of cost of capital
Timing of construction of improvements and loss of site income whilst improvements.
The net operating surplus is also calculated before management costs are taken into account if future management contracts are based on a percentage of income. We have at this stage not used the current 48% of income under the revenue management share model so we can see the full business case. Following a review of the business assumptions, financial projections, timing of developments and how the capital improvements would be financed, we can complete financial modelling.
4.5.4 Revenue Projections for Site Ensuite Improvements
A key facility improvement trend is to offer upgraded site services for some customers who wish to hire their own ensuite adjacent to their site. Presently a modified offer occurs at Horseshoe Bay HP where there are 8 ensuites located under the southern area amenities block. These raise approximately $23,000-$25,000 in extra hire income per year. They are not heavily booked as they are located away from sites, so they still require people to walk from their site to the amenity block. We have proposed new ensuite units be developed at Council’s high occupancy and yield holiday parks at Crescent Head and Hat Head. We have not recommended these for Horseshoe Bay HP as there is limited room and sites for such development. The industry charge that parks have been able to charge out for ensuite sites is between $12/site and $15/site extra to normal site fees. Based on the occupancy at each of the proposed parks, the following income projections are estimated. Table 4.12 New Ensuite Projected Year One Revenue
Holiday Park Number of New Ensuite
Sites
Estimated Average Days Occupied/Year
Average Income per Day
Est. Annual Income/Cabin
Est. Annual Income All En-suites
Crescent Head HP 8 260 (71%) $15 $3,900 $31,200
Hat Head HP 8 230 (63%) $15 $3,450 $27,600
Total Annual New En-suite Income
16 N/A N/A N/A $58,800
The new ensuite project annual revenue based on 16 sites being redeveloped is estimated at around $60,000 year. There will be a cost to cleaning these new facilities and some maintenance allowances so based on an expenditure assumption of 1 hour/day cleaning for all units, this would see an annual cost of around $12,250 and an average $5750 for maintenance. Based on these assumptions the net operating surplus on the proposed ensuites is estimated at $42,000 year before capital repayment is factored in.
4.5.5 Funding Opportunities and Options
The notional future capital improvement recommendations are looking at a total investment over the next five years of $5.774M. The report provides information on possible funding from:
Reserves on hand
APPENDIX A Page 60BMP - KSC CP
15DEC2015
Business Management Plan for KSC Caravan Parks 26-11-2015 (NSW 11.2014) - 7 December 2015 Page 56 Commercial in Confidence. SGL Consulting Group Australia Pty Ltd www.sglgroup.net
New loans part serviced by profits from new cabins and en-suites (subject to timing and new management contract)
Potential new management contract that seeks partnership funding under new financial arrangements.
Due to the significant regional nature of the service, high economic impact, tourism investment creating significant employment opportunities and increased local spending, we believe Council could package up the improvement works into a major redevelopment application for the Federal Government’s National Stronger Regions Fund scheme. In May 2014 the Commonwealth Government announced a new scheme that could fit this project from the Department of Infrastructure and Regional Development through the strengthening regional strategy and grants and initiatives (NSRF). The budget allocation to this new scheme was set at $1 billion over 4 years and $200 million has been allocated in the 2014/15 Commonwealth Government budget (applications now closed). The scheme’s guidelines indicate this project could be successful in attracting funding and we recommend a detailed review be completed with the aim of attracting up to 50% of the total funds from the Federal Government. Once the capital works scheme is discussed and Council’s financial team advises on use of loans and reserves, we can agree on works and timing and SGL can complete funding recommendations.
4.6 Future Management Options and Opportunities
A review of the current management agreement indicates it is based on a very traditional management tender process that allows Council to hand over day to day operational and services responsibility to a contract management company for an agreed percentage of holiday park income. Review of the current management contract by SGL indicates the key conditions/features include:
Fixed 5 year contract commenced 01/07/2011 and ceases 30/06/2016
Contractor is paid 48% of total gross revenue on all park activities and 40% of net profit from washing machines/clothes dryers
Payments are in arrears (21 days) and late payments attract 1% interest
Contractor pays $250,000 security deposit
Must provide Council with reconciled gross revenue statements and occupancy rates (within 10 days of the end of the month) as well as quarterly reports.
The contractor also must:
Provide all labor, plant and equipment to maintain and manage the parks
Clean all facilities and carry out waste removal as per cleaning specification
Meet the cost of all utilities/services and all leased equipment, insurances (P.I $20M, vehicle insurance, workers compensation insurance and cash in transit insurance).
Provide audited 6 monthly and annual financial reports
Council sets all fees and grants rights to occupy each of the parks residences at an agreed rental. Council also meets the cost of major capital replacement and improvements. The current contract does not have any business improvement incentive clauses or commercial capital investment opportunities to allow the contractor to increase business and turnover. It is therefore more of a caretaker agreement based on the contractor receiving an agreed percentage of revenue and from that amount they need to meet all of their costs and obligations as specified in the contract as well as generating profits.
APPENDIX A Page 61BMP - KSC CP
15DEC2015
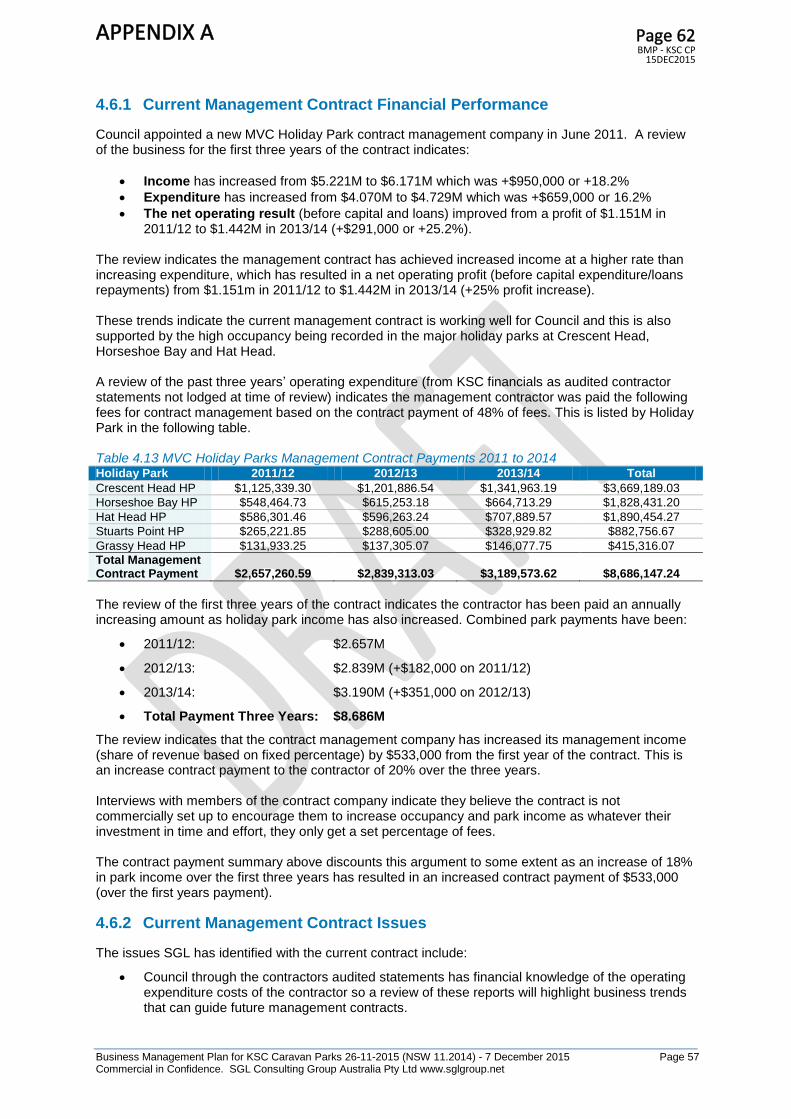
Business Management Plan for KSC Caravan Parks 26-11-2015 (NSW 11.2014) - 7 December 2015 Page 57 Commercial in Confidence. SGL Consulting Group Australia Pty Ltd www.sglgroup.net
4.6.1 Current Management Contract Financial Performance
Council appointed a new MVC Holiday Park contract management company in June 2011. A review of the business for the first three years of the contract indicates:
Income has increased from $5.221M to $6.171M which was +$950,000 or +18.2%
Expenditure has increased from $4.070M to $4.729M which was +$659,000 or 16.2%
The net operating result (before capital and loans) improved from a profit of $1.151M in 2011/12 to $1.442M in 2013/14 (+$291,000 or +25.2%).
The review indicates the management contract has achieved increased income at a higher rate than increasing expenditure, which has resulted in a net operating profit (before capital expenditure/loans repayments) from $1.151m in 2011/12 to $1.442M in 2013/14 (+25% profit increase). These trends indicate the current management contract is working well for Council and this is also supported by the high occupancy being recorded in the major holiday parks at Crescent Head, Horseshoe Bay and Hat Head. A review of the past three years’ operating expenditure (from KSC financials as audited contractor statements not lodged at time of review) indicates the management contractor was paid the following fees for contract management based on the contract payment of 48% of fees. This is listed by Holiday Park in the following table. Table 4.13 MVC Holiday Parks Management Contract Payments 2011 to 2014 Holiday Park 2011/12 2012/13 2013/14 Total
Crescent Head HP $1,125,339.30 $1,201,886.54 $1,341,963.19 $3,669,189.03
Horseshoe Bay HP $548,464.73 $615,253.18 $664,713.29 $1,828,431.20
Hat Head HP $586,301.46 $596,263.24 $707,889.57 $1,890,454.27
Stuarts Point HP $265,221.85 $288,605.00 $328,929.82 $882,756.67
Grassy Head HP $131,933.25 $137,305.07 $146,077.75 $415,316.07
Total Management Contract Payment $2,657,260.59 $2,839,313.03 $3,189,573.62 $8,686,147.24
The review of the first three years of the contract indicates the contractor has been paid an annually increasing amount as holiday park income has also increased. Combined park payments have been:
2011/12: $2.657M
2012/13: $2.839M (+$182,000 on 2011/12)
2013/14: $3.190M (+$351,000 on 2012/13)
Total Payment Three Years: $8.686M
The review indicates that the contract management company has increased its management income (share of revenue based on fixed percentage) by $533,000 from the first year of the contract. This is an increase contract payment to the contractor of 20% over the three years. Interviews with members of the contract company indicate they believe the contract is not commercially set up to encourage them to increase occupancy and park income as whatever their investment in time and effort, they only get a set percentage of fees. The contract payment summary above discounts this argument to some extent as an increase of 18% in park income over the first three years has resulted in an increased contract payment of $533,000 (over the first years payment).
4.6.2 Current Management Contract Issues
The issues SGL has identified with the current contract include:
Council through the contractors audited statements has financial knowledge of the operating expenditure costs of the contractor so a review of these reports will highlight business trends that can guide future management contracts.
APPENDIX A Page 62BMP - KSC CP
15DEC2015

Business Management Plan for KSC Caravan Parks 26-11-2015 (NSW 11.2014) - 7 December 2015 Page 58 Commercial in Confidence. SGL Consulting Group Australia Pty Ltd www.sglgroup.net
It should be noted that SGL has not been able to view the audited reports until after completing this report as the contractor was providing financial reports but these were not audited as per the contract conditions. This oversight is now rectified and audited reports for all operational years must be supplied by the contractor so business trends can be developed from these reports for the next contract period
In reviewing contractors audited reports after this report was completed it highlights significant fluctuations in operating expenditure categories over the two full years of audited reports available (2012/13 and 2013/14). It is therefore critical that the 2014/15 audited financial report be lodged with Council as soon as possible so this can be reviewed as background to the next tender period.
It should be noted when considering the operating expenditure variations that the contractor controls all onsite operating expenditure (excluding main maintenance costs that Council controls) and therefore can cut back on some items to reduce operating expenditure and create higher profits. For example, stopping watering of surrounds, less frequent mowing and cleaning, reducing landscape maintenance etc. all can be controlled by the contractor to reduce costs. This may impact on customers and park amenity and may impact on longer-term revenue.
Another example of cost cutting is in current rubbish collection where small bins have not been set up around the parks (as there is a daily cost to empty/clean) but rather a central waste skip is located at the park and everyone has to take their waste to them. This impacts on customers but is a cheaper way of collecting and clearing rubbish.
There are no incentives in the contract for the contractor to invest funds in business improvements as they only get paid 48% of revenue generated. For example, hire of recreation equipment at most of the parks would be a viable new business but the current arrangements do not take into account the equipment purchase set up and ongoing equipment repair and replacement.
The contract reporting is limited and needs to be updated to some key performance indicators as have been developed by SGL from the data reviewed (see section two analysis) that allows identification of key performance of items such as:
Capacity of park by cabins and sites
Occupancy days compared to capacity days
Average revenue per day by cabins and sites
No customer service reviews or reporting in the contract so Council has no way of monitoring if management is doing its job and providing high quality customer service.
All capital improvement costs are Council’s responsibility and the contractor does not have to contribute to these but will receive a percentage of any increased revenue form such improvements, i.e. more cabins, new en-suite sites etc.
The length of term of 5 years is not conclusive to a building business contract or improving partnerships but more is towards a traditional caretaker contract. In reality, a new contractor takes one to two years to set up and operate the contract effectively and years three to four may have business growth, but year five is focused on retender.
Marketing is required to be completed by the contractor at a value of 5% of income but there is limited tracking of the marketing spend and associate business improvement outcomes.
4.6.3 Future Management Contract Opportunities
With annually increasing income and achieving above industry standard occupancy rates at the main parks, the current contract could be generally assessed as working well for Council. Financial reviews of available operating information indicates that also packaging management of the smaller holiday parks with the larger parks does help defray the operating losses likely at the smaller parks (SPHP and GHHP).
APPENDIX A Page 63BMP - KSC CP
15DEC2015
Business Management Plan for KSC Caravan Parks 26-11-2015 (NSW 11.2014) - 7 December 2015 Page 59 Commercial in Confidence. SGL Consulting Group Australia Pty Ltd www.sglgroup.net
Based on the contract through to 2016 continuing to see increased income and maintaining or increasing occupancy rates, then it would, in our opinion, be in Council’s best interests to look at more of a partnership arrangement with the current company or a new company that wins the tender, especially if it is looking to share the cost of capital improvements. A partnership model will require the contractor and Council to have an open book on all business and financial reporting so both parties have a clear understanding of the cost and profitability of the contract. Interviews with members of the contract company indicate they believe the contract is not commercially set up to encourage them to increasing occupancy and park income as whatever their investment in time and effort they only get a set percentage of fees. The contract payment summary listed in this report discounts this argument to some extent as an increase of 18% in park income over the first three years has resulted in an increased contract payment of $533,000 (over the first years payment).
4.6.4 Future Business Direction Needs to Guide Future Management Model
All the above points indicate the need for Council to be more proactive in what management model it wants to set up in the next phase of the caravan parks business. This is significantly more important in this next phase as the parks are now back to operating well, are attracting high use and are ready for major capital investment. From an administration perspective with annually increasing income and above industry standard occupancy rates at the main parks, the current contract would be generally assessed as working well for Council, particularly if business trends from 10 years ago or later where overlaid. Financial reviews of available operating information indicates that also packaging management of the smaller holiday parks with the larger parks help defray the operating losses likely at the smaller parks (SPHP and GHHP). From all the information collected we have assumed that the contractor has a profitable business that is improving and that the growth in business would be further improved by a range of suggested capital improvements. This report is recommending more than $5.774M in capital improvements and it is critical that a new management model helps pay for some capital upgrades as new business means more contract income from increased fees.
4.6.5 Recommended Future Management Model
Council has a significant economic impact business opportunity facing it with the KSC Caravan Parks now that management and council officers have established the business issues and regular growth in occupancy and yield is occurring. The financial modeling in this report indicates investing in the proposed capital upgrades will significantly increase the size and profitability of the business if the capital can be raised. From an SGL perspective, to get maximum return for all parties the future management arrangements should therefore move to:
A longer term joint funded partnership agreement where the better the business becomes, both partners (Council and management) benefit
But at the same time they also share the capital investment risk which at the moment is all on Council, meaning management or other levels of government have no risk or responsibility.
APPENDIX A Page 64BMP - KSC CP
15DEC2015

Business Management Plan for KSC Caravan Parks 26-11-2015 (NSW 11.2014) - 7 December 2015 Page 60 Commercial in Confidence. SGL Consulting Group Australia Pty Ltd www.sglgroup.net
To reduce this risk, Council needs to use this report to package up the recommneded works and seek at least 30% to 50% external funding from a combined funding strategy, being say NSW State (new tourism infrastructure grant scheme) and Federal Government (National Stronger Regions Fund). These grants are set up as non-repayment capital, so attracting 30% (of $5.774M) would see total grants of $1.732M or at 50% at $2.887M. Attracting grants reduces the financial risk to Council and would allow for even better expanded business impacts as works could be completed quicker than the 5-year proposed staged developments. The business trends and economic and financial impacts highlighted in this report and the fact that the parks are attracting greater regional, state, national and international visitors and generating more local jobs and product purchases would provide good stories for why these two levels of government should see one off capital funding as a high priority. So if one-off government funding can be attracted to, say 50% of the proposed $5.774M, then the next step is to set up a new management partnership that encourages park management to “have some investment (skin in the game)” and considers management being able to command longer contract terms in return for agreed capital investment. If park management agreed to provide, say 20%of the capital improvement target ($5.774M), it would equate to $1.154M. Based on the current management contract fee at just over $3M/year and increasing then servicing a loan of $1M, will not be difficult. Extending the contract to 10 years allows the $1M to be spread over 10 years and also reduces risk on repayment. So, if grants were 50% of capital and management contributed 20% of capital, this would leave Council to find the balance of funds of $1.733M, which it already has a large proportion of in hand. The foreshore Reserve has the accumulated funds in respect of the Crescent Head, Hat Head, Stuarts Point and Grassy Head Reserves and the balance at 30 June 2014 were $479,357. The South West Rocks Reserve (HBHP) balance was $431,560 at 30 June 2014. With these Reserves allocated, Council would need to finance less than $1M in capital improvements and this could be budgeted to be funded from a mix of predicted business profits and low interest loans. In the end, sharing the risk of capital in a new management contract will bring the projects on faster and allow Council to get a better management partnership that as previously indicated needs to be a longer term open book partnership where both parties share the gain but also the pain.
4.6.6 Procuring New Management Deal
Before going out to an open Tender for long-term management and investment of the parks, Council needs to determine if it wants to stay in business with current management (as they have done a good job and want to be a partner in park redevelopment) or it wants to put it out to Tender to:
Market test a best offer
Or simply move on and attract a new management company that would be a better partner.
Working out how any of these future contract options can be done is critical and especially what is the legal procurement system that will allow Council to get the contract model that it wants. This needs review and a clear strategy adopted as seeking capital investment as part of a tender is a different arrangement than just tendering the business for an agreed percentage of revenue.
4.6.7 What Level of Business Improvement does Council Want to Achieve?
If Council wants to directly stimulate the local economy, attract more visitors to the area and create more jobs, then the proposed park improvement program listed in this report should be a priority. Sharing the capital cost risk through one-off government grants and management contributing to capital as well is a better shared cost and risk situation than what currently occurs.
APPENDIX A Page 65BMP - KSC CP
15DEC2015

Business Management Plan for KSC Caravan Parks 26-11-2015 (NSW 11.2014) - 7 December 2015 Page 61 Commercial in Confidence. SGL Consulting Group Australia Pty Ltd www.sglgroup.net
If Council does not want to lead this, then management could take a greater control role, but would need a greater term of tenure to invest in upgrades they cannot own in the future as they are on Crown Land improvements. It will be essential that once audited statements are forwarded for 2014/15 that the past three years contractor management fees and operating expenditure be spread sheeted to help identify the likely level of profitability in the current contract and possible capital investment capacity.
4.7 Project Recommendations
The final draft report was circulated for review in October 2015 and this allowed Council and its management team to review the large amount of detailed information and to consider future management and development strategies. The consultant team was advised in late October 2015 that the proposed redevelopment and improvement program listed in this report provided an excellent future business framework. It has continued to build on the past five years successful caravan park operations, provided stimulus to continue to increase revenue and economic impact to the local economy as well as continuing to improve these valuable community and environmental assets. The 2016 to 2021 capital works plan proposed also allows Council to apply for partnership funding both from the other two levels of government and also test the market place for a new management contract that required capital investment in return for longer management rights. To assist Council in moving forward in decision making, SGL has made the following project recommendations:
Recommendation Recommendation Detail
RECOMMENDATION ONE: That Council adopt the Future Holiday Park Management Business Plan 2016 to 2021
That Council notes that the ongoing investment in holiday park facilities, amenities and services now supports a $6.1M major accommodation business that is attracting 355,000 to 450,000 people a year staying at the parks and the next 5 years holiday park business strategy should be guided by key initiatives listed in section 4.3 of the report including:
New holiday market and development categories
No reduction in holiday park sites
Continue to improve high yield accommodation opportunities
New/Redeveloped Facilities/Services to increase Occupancy/Income
RECOMMENDATION TWO: That Council adopt the 2016 to 2021 Holiday Parks Capital Improvement Program
That Council adopts in principle the 2016 to 2021 Holiday Parks Capital Improvement Program as listed in section 4.4 of the report.
RECOMMENDATION THREE: That Council investigate the funding options proposed in the report
That Council further investigate and detail up the funding options and opportunities presented in section 4.5 of the report that best could fund the 2016 to 2021 Holiday Parks Capital Improvement Program including a mix of:
Current held reserve funds
New revenue generated from new and replacement accommodation improvements
Capital investment from new management contract
One off or ongoing government grants.
Low interest government loans
Kempsey Shire Council funding support.
Other funding opportunities
APPENDIX A Page 66BMP - KSC CP
15DEC2015

Business Management Plan for KSC Caravan Parks 26-11-2015 (NSW 11.2014) - 7 December 2015 Page 62 Commercial in Confidence. SGL Consulting Group Australia Pty Ltd www.sglgroup.net
RECOMMENDATION FOUR Develop Grant Applications for the Holiday Parks Capital Improvement Program
That Council develop a funding strategy that aims to attract up to 50% of the required capital improvement funding from other levels of government.
RECOMMENDATION FIVE: Review New Holiday Parks Management Contract Issues and Options
That Council note the issues/constraints identified in the current holiday park management model as listed in section 4.6.2 of the report and also be guided by the future management contract opportunities listed in section 4.6.3 of the report when considering future management contracts
RECOMMENDATION SIX New Management Contract Developed and complete new Management Contract EOI and Tender
That Council develops and tenders a new management contract model that continues to improve and expand the business and also provides up to 20% required capital funding improvement investment.
APPENDIX A Page 67BMP - KSC CP
15DEC2015
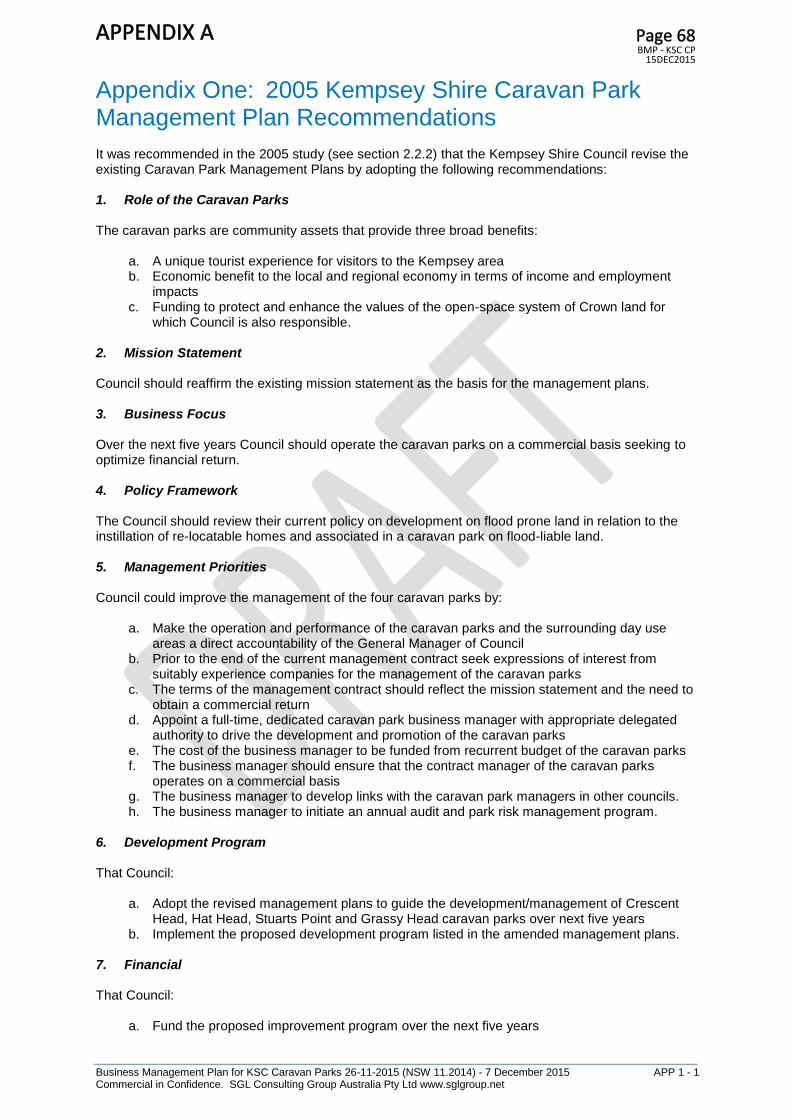
Business Management Plan for KSC Caravan Parks 26-11-2015 (NSW 11.2014) - 7 December 2015 APP 1 - 1 Commercial in Confidence. SGL Consulting Group Australia Pty Ltd www.sglgroup.net
Appendix One: 2005 Kempsey Shire Caravan Park Management Plan Recommendations It was recommended in the 2005 study (see section 2.2.2) that the Kempsey Shire Council revise the existing Caravan Park Management Plans by adopting the following recommendations: 1. Role of the Caravan Parks The caravan parks are community assets that provide three broad benefits:
a. A unique tourist experience for visitors to the Kempsey area b. Economic benefit to the local and regional economy in terms of income and employment
impacts c. Funding to protect and enhance the values of the open-space system of Crown land for
which Council is also responsible.
2. Mission Statement Council should reaffirm the existing mission statement as the basis for the management plans. 3. Business Focus Over the next five years Council should operate the caravan parks on a commercial basis seeking to optimize financial return. 4. Policy Framework The Council should review their current policy on development on flood prone land in relation to the instillation of re-locatable homes and associated in a caravan park on flood-liable land. 5. Management Priorities Council could improve the management of the four caravan parks by:
a. Make the operation and performance of the caravan parks and the surrounding day use areas a direct accountability of the General Manager of Council
b. Prior to the end of the current management contract seek expressions of interest from suitably experience companies for the management of the caravan parks
c. The terms of the management contract should reflect the mission statement and the need to obtain a commercial return
d. Appoint a full-time, dedicated caravan park business manager with appropriate delegated authority to drive the development and promotion of the caravan parks
e. The cost of the business manager to be funded from recurrent budget of the caravan parks f. The business manager should ensure that the contract manager of the caravan parks
operates on a commercial basis g. The business manager to develop links with the caravan park managers in other councils. h. The business manager to initiate an annual audit and park risk management program.
6. Development Program That Council:
a. Adopt the revised management plans to guide the development/management of Crescent Head, Hat Head, Stuarts Point and Grassy Head caravan parks over next five years
b. Implement the proposed development program listed in the amended management plans.
7. Financial That Council:
a. Fund the proposed improvement program over the next five years
APPENDIX A Page 68BMP - KSC CP
15DEC2015
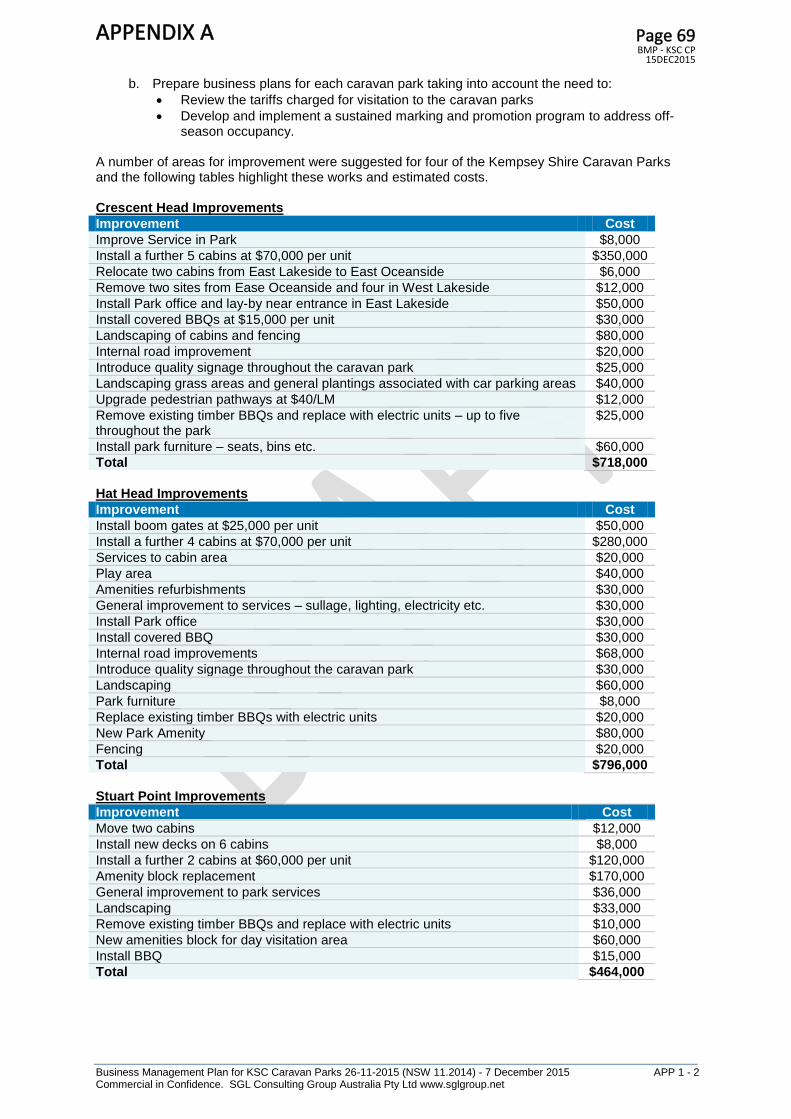
Business Management Plan for KSC Caravan Parks 26-11-2015 (NSW 11.2014) - 7 December 2015 APP 1 - 2 Commercial in Confidence. SGL Consulting Group Australia Pty Ltd www.sglgroup.net
b. Prepare business plans for each caravan park taking into account the need to:
Review the tariffs charged for visitation to the caravan parks
Develop and implement a sustained marking and promotion program to address off-season occupancy.
A number of areas for improvement were suggested for four of the Kempsey Shire Caravan Parks and the following tables highlight these works and estimated costs. Crescent Head Improvements
Improvement Cost
Improve Service in Park $8,000
Install a further 5 cabins at $70,000 per unit $350,000
Relocate two cabins from East Lakeside to East Oceanside $6,000
Remove two sites from Ease Oceanside and four in West Lakeside $12,000
Install Park office and lay-by near entrance in East Lakeside $50,000
Install covered BBQs at $15,000 per unit $30,000
Landscaping of cabins and fencing $80,000
Internal road improvement $20,000
Introduce quality signage throughout the caravan park $25,000
Landscaping grass areas and general plantings associated with car parking areas $40,000
Upgrade pedestrian pathways at $40/LM $12,000
Remove existing timber BBQs and replace with electric units – up to five throughout the park
$25,000
Install park furniture – seats, bins etc. $60,000
Total $718,000
Hat Head Improvements
Improvement Cost
Install boom gates at $25,000 per unit $50,000
Install a further 4 cabins at $70,000 per unit $280,000
Services to cabin area $20,000
Play area $40,000
Amenities refurbishments $30,000
General improvement to services – sullage, lighting, electricity etc. $30,000
Install Park office $30,000
Install covered BBQ $30,000
Internal road improvements $68,000
Introduce quality signage throughout the caravan park $30,000
Landscaping $60,000
Park furniture $8,000
Replace existing timber BBQs with electric units $20,000
New Park Amenity $80,000
Fencing $20,000
Total $796,000
Stuart Point Improvements
Improvement Cost
Move two cabins $12,000
Install new decks on 6 cabins $8,000
Install a further 2 cabins at $60,000 per unit $120,000
Amenity block replacement $170,000
General improvement to park services $36,000
Landscaping $33,000
Remove existing timber BBQs and replace with electric units $10,000
New amenities block for day visitation area $60,000
Install BBQ $15,000
Total $464,000
APPENDIX A Page 69BMP - KSC CP
15DEC2015

Business Management Plan for KSC Caravan Parks 26-11-2015 (NSW 11.2014) - 7 December 2015 APP 1 - 3 Commercial in Confidence. SGL Consulting Group Australia Pty Ltd www.sglgroup.net
Grassy Head Improvements
Improvement Cost
Install boom gates at $25,000 per unit $25,000
Demolish small amenity block and replace with en-suite unit $40,000
Install Camp Kitchen $30,000
Amenities refurbishments $50,000
General improvement to services – sullage, lighting, electricity etc. $33,000
Install covered BBQ in cabin precinct $15,000
Internal road improvements $20,000
Introduce quality signage $17,000
Landscaping $25,000
Remove existing timber BBQs and replace with electric units $15,000
Fencing $5,000
Total $275,000
APPENDIX A Page 70BMP - KSC CP
15DEC2015
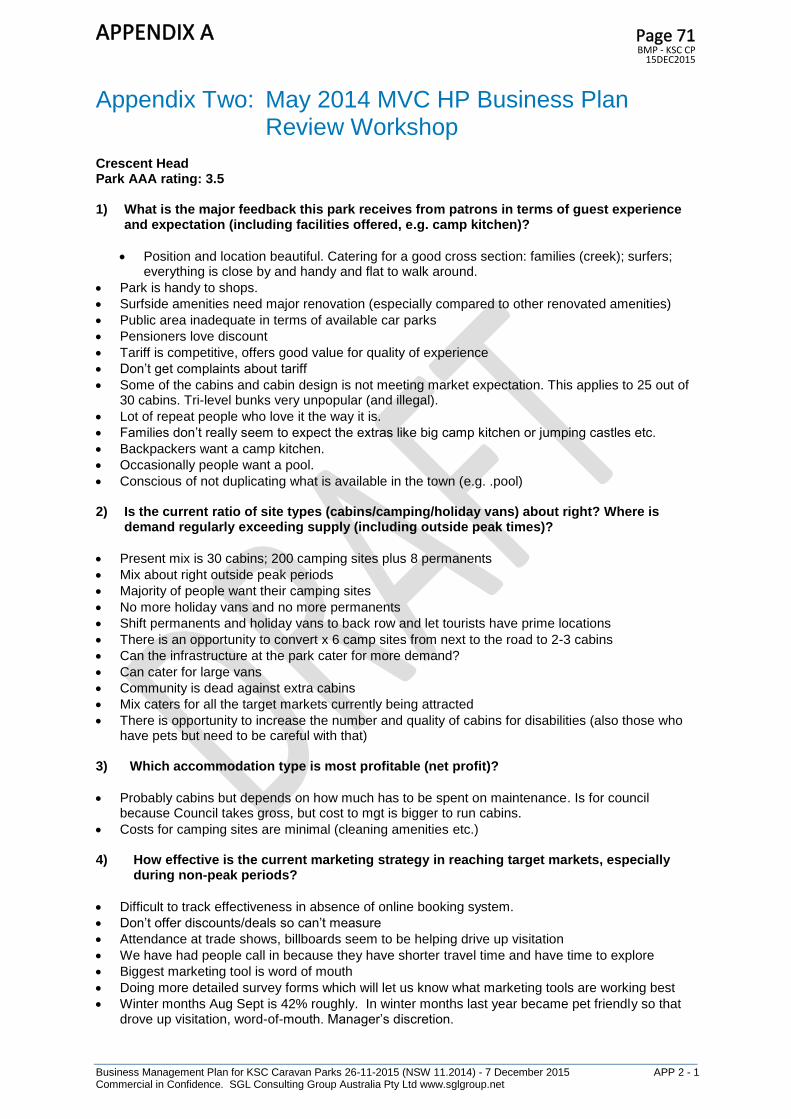
Business Management Plan for KSC Caravan Parks 26-11-2015 (NSW 11.2014) - 7 December 2015 APP 2 - 1 Commercial in Confidence. SGL Consulting Group Australia Pty Ltd www.sglgroup.net
Appendix Two: May 2014 MVC HP Business Plan Review Workshop
Crescent Head Park AAA rating: 3.5 1) What is the major feedback this park receives from patrons in terms of guest experience
and expectation (including facilities offered, e.g. camp kitchen)?
Position and location beautiful. Catering for a good cross section: families (creek); surfers; everything is close by and handy and flat to walk around.
Park is handy to shops.
Surfside amenities need major renovation (especially compared to other renovated amenities)
Public area inadequate in terms of available car parks
Pensioners love discount
Tariff is competitive, offers good value for quality of experience
Don’t get complaints about tariff
Some of the cabins and cabin design is not meeting market expectation. This applies to 25 out of 30 cabins. Tri-level bunks very unpopular (and illegal).
Lot of repeat people who love it the way it is.
Families don’t really seem to expect the extras like big camp kitchen or jumping castles etc.
Backpackers want a camp kitchen.
Occasionally people want a pool.
Conscious of not duplicating what is available in the town (e.g. .pool) 2) Is the current ratio of site types (cabins/camping/holiday vans) about right? Where is
demand regularly exceeding supply (including outside peak times)?
Present mix is 30 cabins; 200 camping sites plus 8 permanents
Mix about right outside peak periods
Majority of people want their camping sites
No more holiday vans and no more permanents
Shift permanents and holiday vans to back row and let tourists have prime locations
There is an opportunity to convert x 6 camp sites from next to the road to 2-3 cabins
Can the infrastructure at the park cater for more demand?
Can cater for large vans
Community is dead against extra cabins
Mix caters for all the target markets currently being attracted
There is opportunity to increase the number and quality of cabins for disabilities (also those who have pets but need to be careful with that)
3) Which accommodation type is most profitable (net profit)?
Probably cabins but depends on how much has to be spent on maintenance. Is for council because Council takes gross, but cost to mgt is bigger to run cabins.
Costs for camping sites are minimal (cleaning amenities etc.) 4) How effective is the current marketing strategy in reaching target markets, especially
during non-peak periods?
Difficult to track effectiveness in absence of online booking system.
Don’t offer discounts/deals so can’t measure
Attendance at trade shows, billboards seem to be helping drive up visitation
We have had people call in because they have shorter travel time and have time to explore
Biggest marketing tool is word of mouth
Doing more detailed survey forms which will let us know what marketing tools are working best
Winter months Aug Sept is 42% roughly. In winter months last year became pet friendly so that drove up visitation, word-of-mouth. Manager’s discretion.
APPENDIX A Page 71BMP - KSC CP
15DEC2015

Business Management Plan for KSC Caravan Parks 26-11-2015 (NSW 11.2014) - 7 December 2015 APP 2 - 2 Commercial in Confidence. SGL Consulting Group Australia Pty Ltd www.sglgroup.net
Biggest feed market is Newcastle, Novacastrians like to holiday within 3-4 hours of home
Caravan groups can drive visitation during non-peak times
Lions convention at club is looking for accommodation
Golf, bowls, club
Communication (packaging etc.) could be strong with club/tavern etc.
Park seen as a bit separate to rest of local community
Change of dates Head to Head may make a difference. 5) Are this park’s current fees and charges about right for the product/experience being
offered compared to its regional competitors?
Yes, for what’s being offered
Little bit of refurb goes a long way to fulfilling consumer expectation 6) Given its history, location and positioning within the local community, should this park
aspire to a higher star rating?
For the overall experience of Crescent Head it’s about right at 3.5 however should strive for a 4 star rating
Standard/quality of product/service/amenities/front of house
Two motels and private houses are major competitors. Park cabins start at $97 plus linen so motel rooms are cheaper
Best value for money taking into account location
Upgrading cabins/adding new cabins would help the range of accommodation offerings
Nice and clean, but looking a bit tired. Common comment re state of cabins 7) Would the cost to increase the star rating provide a significantly higher level of income?
Yes (10-25% depending on changes/upgrades) 8) Would increasing the star rating (and tariff) alienate any of our current existing or target
markets?
Punters will always come during peak holiday time. At 100% Christmas/East, Sept/Oct 85% and June/July 65%
9) What are the major improvements/infrastructure upgrades required to:
Keep the park competitive and profitable at its current star rating
Upgrade ocean-side amenities
Do minimum facelift for all cabins where required
Leveling of all sites Upgrade to a higher star rating.
Nil 10) What accommodation niche does this park fill within the local accommodation sector?
Caravanning and camping, weekend getaways, group bookings, events (surfing), affordable accommodation
Grassy Head Park AAA rating: 2.5 1) What is the major feedback this park receives from patrons in terms of guest experience
and expectation (including facilities offered, e.g. camp kitchen)?
Camp kitchen communal area would be good
Public access of road through to beach – dangerous close to some sites and noisy with fishermen and boats going through
APPENDIX A Page 72BMP - KSC CP
15DEC2015

Business Management Plan for KSC Caravan Parks 26-11-2015 (NSW 11.2014) - 7 December 2015 APP 2 - 3 Commercial in Confidence. SGL Consulting Group Australia Pty Ltd www.sglgroup.net
Access to the beach eroded and dangerous – not family friendly
Better playground facilities
More services – fresh bread/milk
Love the natural environment - Peacefulness and wildlife
Better pumping
Moved to higher ground
Ability to have a camp fire 2) Is the current ratio of site types (cabins/camping/holiday vans) about right? Where is
demand regularly exceeding supply (including outside peak times)?
No more holiday vans – ratio is right
Not a high demand park outside of peak time – never exceeds
Infrastructure needs improvement to be able to cope with higher occupancy
No room for growth due to current infrastructure
Sites subjecting to flooding with heavy ran 3) Which accommodation type is most profitable (net profit)?
Sites more profitable due to minimal cabins in the park 4) How effective is the current marketing strategy in reaching target markets, especially
during non-peak periods?
Difficult to track without online booking and survey responses
Slight increase to occupancy but not compared to other parks
Walkins requesting camp kitchen referred to Stuarts Point
Off the beaten track/poor signage into the park
More focus on backpackers and work with rental companies such as Wicked Vans 5) Are this park’s current fees and charges about right for the product/experience being
offered compared to its regional competitors?
Yes for what’s being offered 6) Given its history, location and positioning within the local community, should this park
aspire to a higher star rating?
Yes should aspire to higher rating but work would need to be done
Based on what is there it’s about right.
No other competition in town 7) Would the cost to increase the star rating provide a significantly higher level of income?
If the cabins were repositioned to offer a better outlook/view may increase occupancy significantly
Camp Kitchen would provide more income
Would increasing the star rating (and tariff) alienate any of our current existing or target markets?
No
8) What are the major improvements/infrastructure upgrades required to:
Keep the park competitive and profitable at its current star rating
Improve Plumping and electrical infrastructure where required Upgrade to a higher star rating
Camp Kitchen and better playground facilities and increase size of some of smaller sites
9) What accommodation niche does this park fill within the local accommodation sector?
Caravanning and camping, weekend getaways, group bookings, events, affordable accommodation
APPENDIX A Page 73BMP - KSC CP
15DEC2015
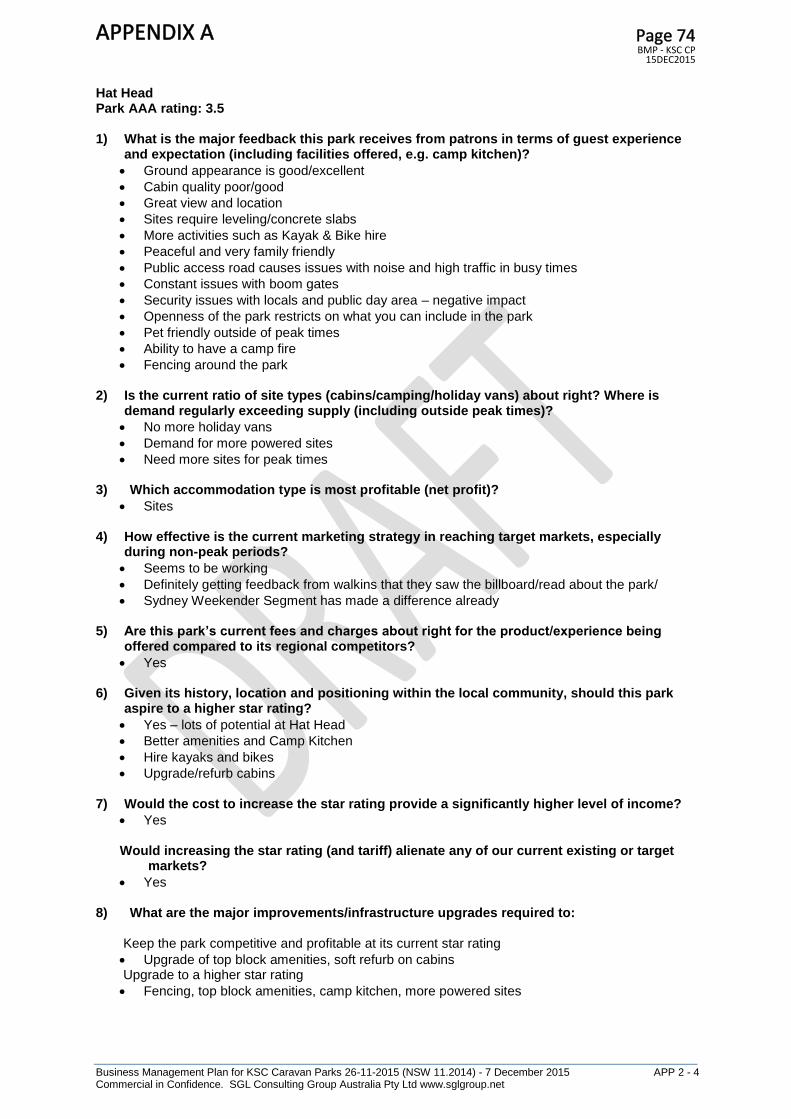
Business Management Plan for KSC Caravan Parks 26-11-2015 (NSW 11.2014) - 7 December 2015 APP 2 - 4 Commercial in Confidence. SGL Consulting Group Australia Pty Ltd www.sglgroup.net
Hat Head Park AAA rating: 3.5 1) What is the major feedback this park receives from patrons in terms of guest experience
and expectation (including facilities offered, e.g. camp kitchen)?
Ground appearance is good/excellent
Cabin quality poor/good
Great view and location
Sites require leveling/concrete slabs
More activities such as Kayak & Bike hire
Peaceful and very family friendly
Public access road causes issues with noise and high traffic in busy times
Constant issues with boom gates
Security issues with locals and public day area – negative impact
Openness of the park restricts on what you can include in the park
Pet friendly outside of peak times
Ability to have a camp fire
Fencing around the park 2) Is the current ratio of site types (cabins/camping/holiday vans) about right? Where is
demand regularly exceeding supply (including outside peak times)?
No more holiday vans
Demand for more powered sites
Need more sites for peak times 3) Which accommodation type is most profitable (net profit)?
Sites
4) How effective is the current marketing strategy in reaching target markets, especially during non-peak periods?
Seems to be working
Definitely getting feedback from walkins that they saw the billboard/read about the park/
Sydney Weekender Segment has made a difference already 5) Are this park’s current fees and charges about right for the product/experience being
offered compared to its regional competitors?
Yes 6) Given its history, location and positioning within the local community, should this park
aspire to a higher star rating?
Yes – lots of potential at Hat Head
Better amenities and Camp Kitchen
Hire kayaks and bikes
Upgrade/refurb cabins
7) Would the cost to increase the star rating provide a significantly higher level of income?
Yes
Would increasing the star rating (and tariff) alienate any of our current existing or target markets?
Yes 8) What are the major improvements/infrastructure upgrades required to:
Keep the park competitive and profitable at its current star rating
Upgrade of top block amenities, soft refurb on cabins Upgrade to a higher star rating
Fencing, top block amenities, camp kitchen, more powered sites
APPENDIX A Page 74BMP - KSC CP
15DEC2015
Business Management Plan for KSC Caravan Parks 26-11-2015 (NSW 11.2014) - 7 December 2015 APP 2 - 5 Commercial in Confidence. SGL Consulting Group Australia Pty Ltd www.sglgroup.net
9) What accommodation niche does this park fill within the local accommodation sector? Caravanning and camping, weekend getaways, fishing trips, group bookings, family gatherings, affordable accommodation
Stuarts Point Park AAA rating: 3.5 1) What is the major feedback this park receives from patrons in terms of guest experience
and expectation (including facilities offered, e.g. camp kitchen)?
Ground appearance excellent
Cabin quality good
Range of facilities
Waterfront and location
Tidy up amenities
Pot holes in roads
Hire for kayaks and bikes
Boat ramp upgraded (park one)
Security with locals having access – noise, vandalism, theft
Facelift of camp kitchen
Soft fall in playground maintained more regularly 2) Is the current ratio of site types (cabins/camping/holiday vans) about right? Where is
demand regularly exceeding supply (including outside peak times)?
Peak times could have more cabins but not outside of this time – possibly waterfront cabins up in unpowered site area
Ratio pretty perfect for current market
Doesn’t cater well for large groups/events/schools
3) Which accommodation type is most profitable (net profit)?
Sites 4) How effective is the current marketing strategy in reaching target markets, especially
during non-peak periods?
Definitely increased occupancy
Pet friendly has made a difference 5) Are this park’s current fees and charges about right for the product/experience being
offered compared to its regional competitors?
Yes 6) Given its history, location and positioning within the local community, should this park
aspire to a higher star rating?
Yes definitely
7) Would the cost to increase the star rating provide a significantly higher level of income?
Not significantly
Would increasing the star rating (and tariff) alienate any of our current existing or target markets?
No 8) What are the major improvements/infrastructure upgrades required to:
Keep the park competitive and profitable at its current star rating
Refurbish cabins, replace older smaller cabins
Upgrade to a higher star rating
Possible waterfront cabins, more fencing (security issues restrict potential)
APPENDIX A Page 75BMP - KSC CP
15DEC2015

Business Management Plan for KSC Caravan Parks 26-11-2015 (NSW 11.2014) - 7 December 2015 APP 2 - 6 Commercial in Confidence. SGL Consulting Group Australia Pty Ltd www.sglgroup.net
9) What accommodation niche does this park fill within the local accommodation sector?
Caravanning, camping, weekend getaways, family reunions (groups), affordable accommodation Horseshoe Bay Park AAA rating: 3 1) What is the major feedback this park receives from patrons in terms of guest experience
and expectation (including facilities offered, e.g. camp kitchen)?
Lots of comments about wanting camp kitchen and communal area – from backpackers wicked vans
Positive comments around ground experience and quality of sites
Service exceptional
Location hands down
Every thing’s close to get to for walking around
Increased competition at the rocks so kept tariff down this year. Lot of flats plus Big 4. Cabins are only full on the weekends. Lot of walk-ins. Cabins are $92 without linen, plus extra for kid’s small overnight cabins. Want a view for cabin. Flats across the road roughly same price as larger cabins. For product being offered, at maximum price point outside of peak season (cabins).
2) Is the current ratio of site types (cabins/camping/holiday vans) about right? Where is
demand regularly exceeding supply (including outside peak times)?
Demand is constantly high for camp sites
Cabins in perfect location because up high overlooking the campsites. Would keep them there. Turn them around to make more money. Make end cabin bigger for higher tariff.
Currently have 12 cabins, minimum 2-night stay.
Demand and supply about right but can be difficult to fill cabins due to high competition from other accommodation providers.
Only time we’re quiet is July/August.
72 campsites and they’re highly sought.
Very high level of repeat visitation
Lots of Victorians and Sydney people
Lots of nomads outside holiday period.
More port Macquarie locals lately
Longer than average length of stay than some parks 3) Which accommodation type is most profitable (net profit)?
Tent sites perceived to be more profitable 4) How effective is the current marketing strategy in reaching target markets, especially
during non-peak periods?
Excellent for this park
Print advertising is effective, as well as word-of-mouth during non-peak periods, esp targeting grey nomads
Lowest ave occupancy rate in winter is 57% (July), otherwise full.
Cabins very full on weekends for events, family events, sports events, weddings etc. Quieter through the week.
Pet friendly all year outside school holidays
Mid week specials eat into margin too much
Maybe need to look at making weekends more expensive. Look at a strategy to increase weekend tariff as opposed to weekday rate. If increased 10% on weekends, would still fill on weekend.
APPENDIX A Page 76BMP - KSC CP
15DEC2015
Business Management Plan for KSC Caravan Parks 26-11-2015 (NSW 11.2014) - 7 December 2015 APP 2 - 7 Commercial in Confidence. SGL Consulting Group Australia Pty Ltd www.sglgroup.net
5) Are this park’s current fees and charges about right for the product/experience being offered compared to its regional competitors?
Could possibly charge up on weekends
More flexibility to charge more on weekends and long weekends 6) Given its history, location and positioning within the local community, should this park
aspire to a higher star rating?
Target being a 4 star rating
Smaller cabins are rate 2.4 which has brought parks overall average down
Top amenity block also needs updating
Reception needs modernizing plus sullage 7) Would the cost to increase the star rating provide a significantly higher level of income?
This park already charging a higher market rate than five star rated parks with all the mod cons, due to its unique location.
Oldies wouldn’t pay much more
People may stay longer if fuel prices go up to reduce travel time Would increasing the star rating (and tariff) alienate any of our current existing or target markets?
It would if the price went up to high as the growing market is grey nomads. Can’t price ourselves out of the market.
8) What are the major improvements/infrastructure upgrades required to:
Keep the park competitive and profitable at its current star rating
Sullage
Upgrade top amenity block
Level out sites
Soft refurb on identified cabins Upgrade to a higher star rating
Remove two smaller cabins
Upgrade the remaining six smaller cabins
Install camp kitchen/bbq area – under cover
Sullage
Upgrade top amenity block
9) What accommodation niche does this park fill within the local accommodation sector?
Affordable and convenient prime location
Off peak regarding cabins its more overnighters and weekend market
During holidays in cabins and camp sites its families
Grey nomads are any time not school hols
Other two parks have better and modern facilities but they have to compete with horseshoe bay
APPENDIX A Page 77BMP - KSC CP
15DEC2015

Business Management Plan for KSC Caravan Parks 26-11-2015 (NSW 11.2014) - 7 December 2015 APP 3 - 1 Commercial in Confidence. SGL Consulting Group Australia Pty Ltd www.sglgroup.net
Appendix Three: Jayco Cabin Range Used for Capital Works Cost Estimates
Jayco 40.0.A 12.2m x 5.2m
Jayco 40.4.A 13.4m x 4.7m
Jayco 30.9.A 12.0m X 4.7m
APPENDIX A Page 78BMP - KSC CP
15DEC2015

Business Management Plan for KSC Caravan Parks 26-11-2015 (NSW 11.2014) - 7 December 2015 APP 3 - 2 Commercial in Confidence. SGL Consulting Group Australia Pty Ltd www.sglgroup.net
Jayco 30.1.A 9.7m x 4.7m
Photo of Jayco Miner Cabin
Jayco Site En-suites (X4) 10.9 Amen 9.7m x 4.7m
APPENDIX A Page 79BMP - KSC CP
15DEC2015