business value at risk: areas of engagement with...
TRANSCRIPT
Business Value at Risk:
Areas of Engagement with
Governments on Extreme
Weather and Climate Change
Resilience
New Leef 2013 – Adapting to a changing environment
October 10th, 2013

© Deloitte LLP and affiliated entities.
Overview
1
Business value at risk & opportunities
Role of government
Areas of engagement with government
Benefits & examples of resilience in action

© Deloitte LLP and affiliated entities.
• The climate is changing
• Historic climate data is no
longer a guide for the future
• Existing risk management
measures build resilience
against today’s climate
normals & weather variability
• Business performance needs
to be reviewed in light of future
projections
Climate trends, risk management and coping capacity Business value at risk
Sources: Willows and Connell (2003) 2
© Deloitte LLP and affiliated entities.
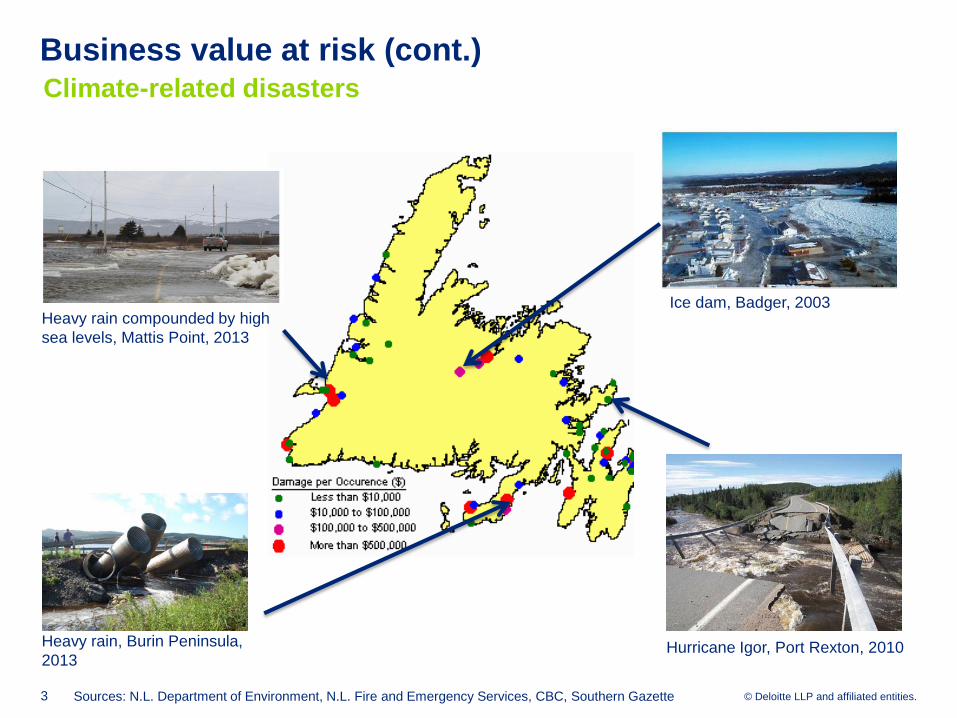
Business value at risk (cont.)
3 Sources: N.L. Department of Environment, N.L. Fire and Emergency Services, CBC, Southern Gazette
Heavy rain compounded by high
sea levels, Mattis Point, 2013
Ice dam, Badger, 2003
Heavy rain, Burin Peninsula,
2013
Climate-related disasters
Hurricane Igor, Port Rexton, 2010
© Deloitte LLP and affiliated entities. 4
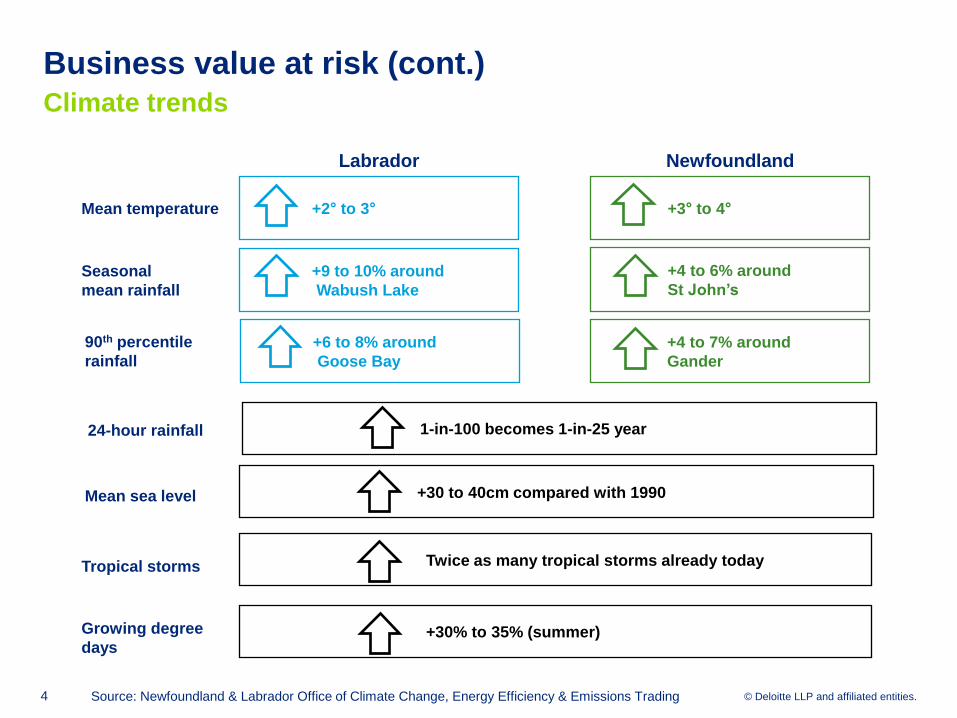
+3° to 4°
+4 to 6% around
St John’s
Mean temperature
Seasonal
mean rainfall
Tropical storms
Growing degree
days
+2° to 3°
+9 to 10% around
Wabush Lake
Twice as many tropical storms already today
+30% to 35% (summer)
Labrador Newfoundland
Source: Newfoundland & Labrador Office of Climate Change, Energy Efficiency & Emissions Trading
Climate trends
Business value at risk (cont.)
+4 to 7% around
Gander
90th percentile
rainfall
+6 to 8% around
Goose Bay
Mean sea level +30 to 40cm compared with 1990
24-hour rainfall 1-in-100 becomes 1-in-25 year
© Deloitte LLP and affiliated entities.
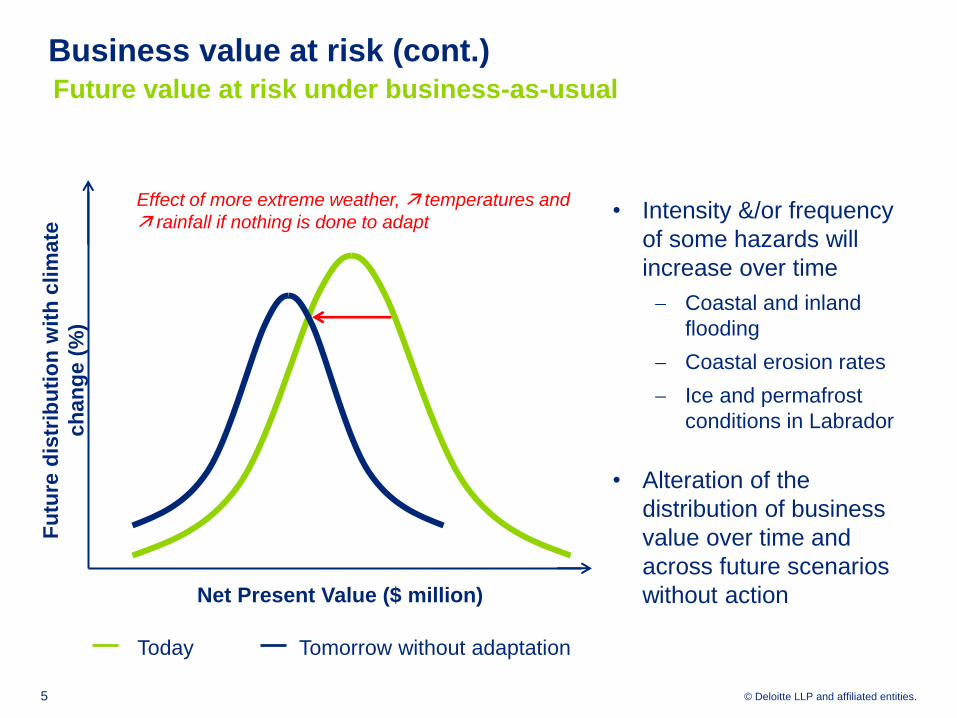
Business value at risk (cont.) F
utu
re d
istr
ibu
tio
n w
ith
clim
ate
ch
an
ge (
%)
Net Present Value ($ million)
Effect of more extreme weather, temperatures and
rainfall if nothing is done to adapt
Today Tomorrow without adaptation
Future value at risk under business-as-usual
• Intensity &/or frequency
of some hazards will
increase over time
Coastal and inland
flooding
Coastal erosion rates
Ice and permafrost
conditions in Labrador
• Alteration of the
distribution of business
value over time and
across future scenarios
without action
5
© Deloitte LLP and affiliated entities.
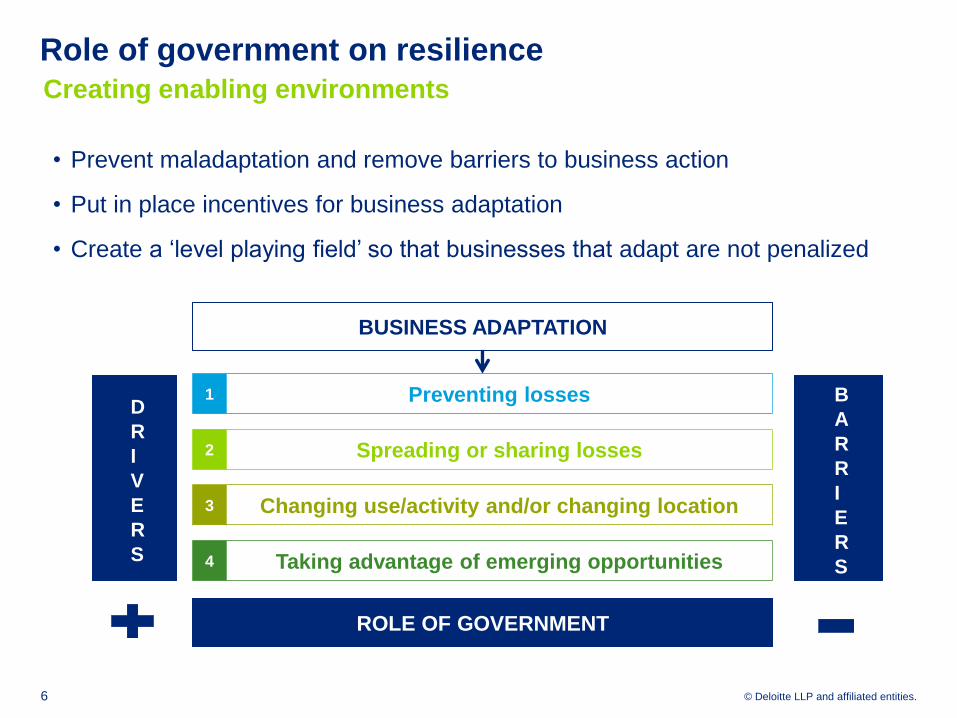
Role of government on resilience
6
1 Preventing losses
2 Spreading or sharing losses
3 Changing use/activity and/or changing location
4 Taking advantage of emerging opportunities
D
R
I
V
E
R
S
• Prevent maladaptation and remove barriers to business action
• Put in place incentives for business adaptation
• Create a ‘level playing field’ so that businesses that adapt are not penalized
Creating enabling environments
BUSINESS ADAPTATION
B
A
R
R
I
E
R
S
ROLE OF GOVERNMENT
© Deloitte LLP and affiliated entities.
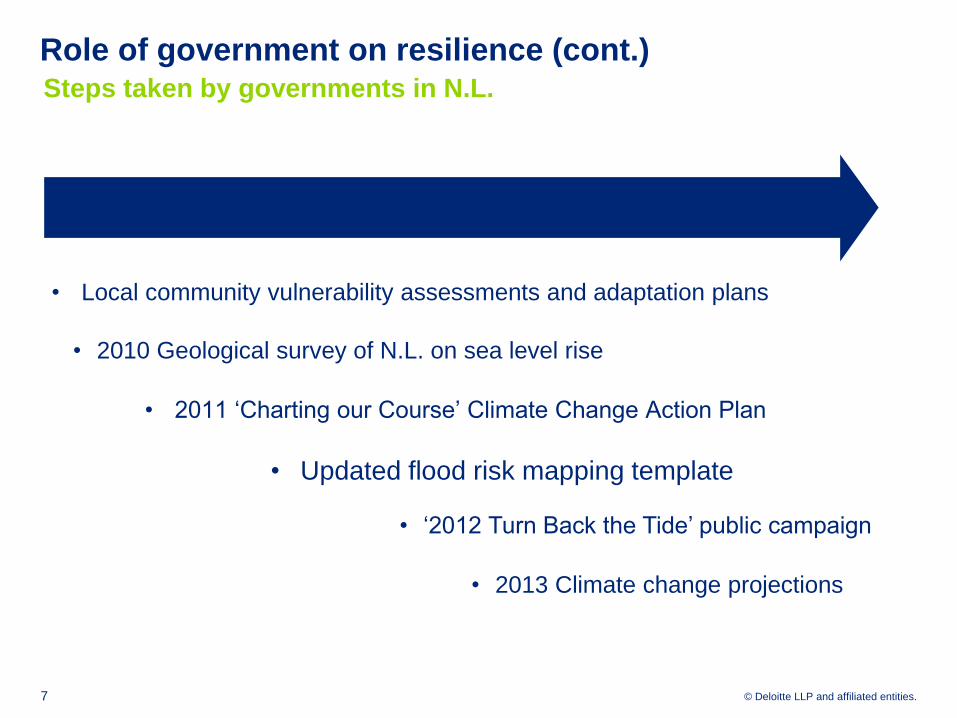
Role of government on resilience (cont.)
• 2010 Geological survey of N.L. on sea level rise
• 2011 ‘Charting our Course’ Climate Change Action Plan
• Updated flood risk mapping template
7
Steps taken by governments in N.L.
• ‘2012 Turn Back the Tide’ public campaign
• 2013 Climate change projections
• Local community vulnerability assessments and adaptation plans
© Deloitte LLP and affiliated entities.
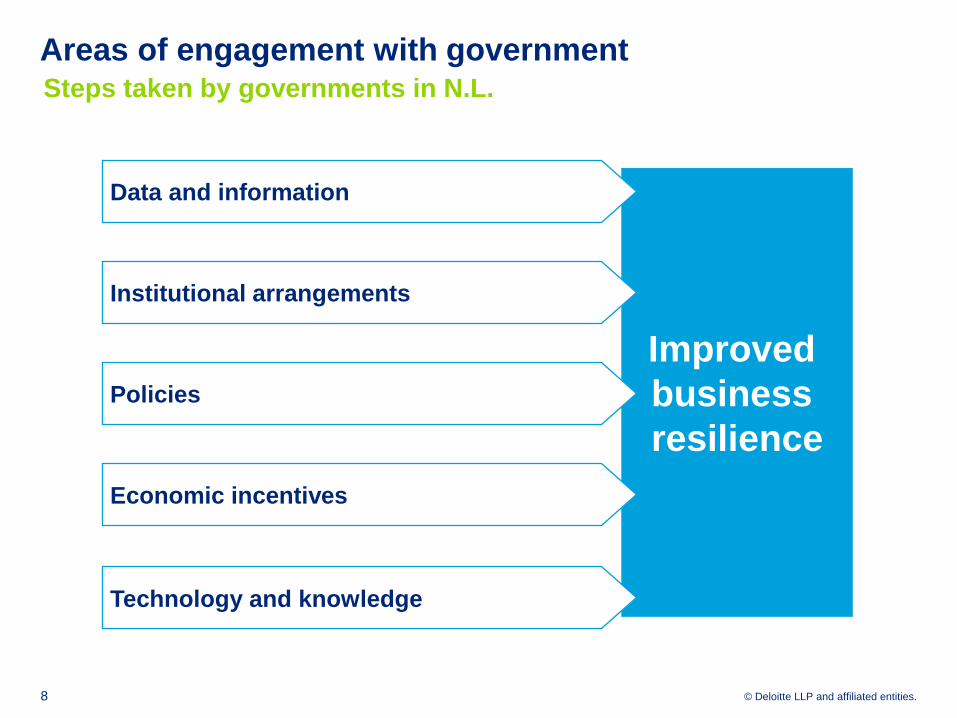
Areas of engagement with government
Improved
business
resilience
Data and information
Institutional arrangements
Policies
Economic incentives
8
Technology and knowledge
Steps taken by governments in N.L.
© Deloitte LLP and affiliated entities.
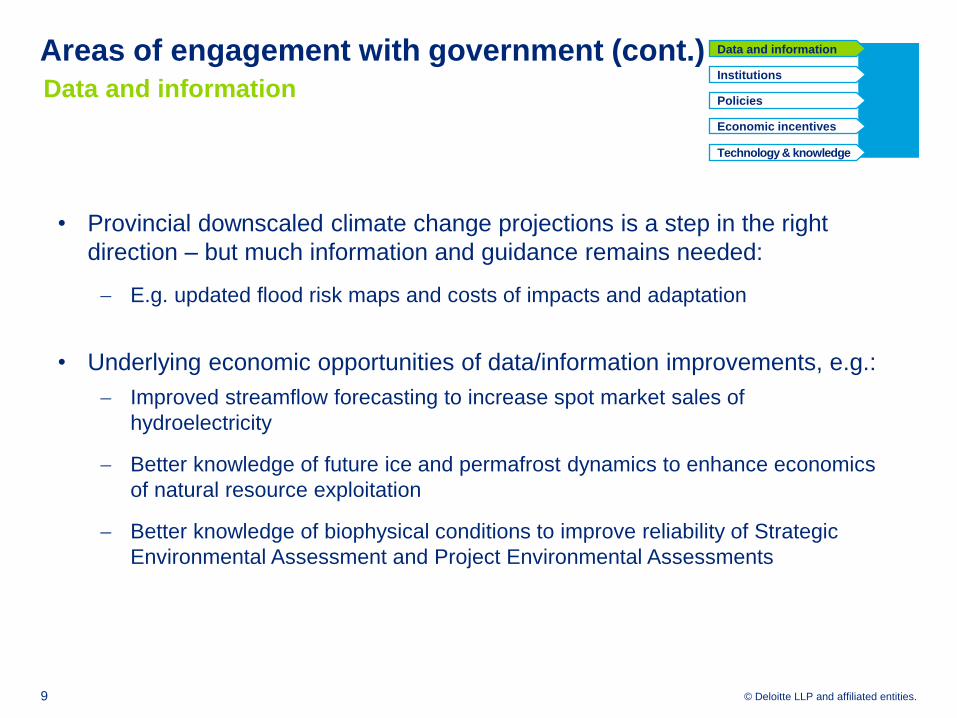
Areas of engagement with government (cont.)
9
Data and information
Institutions
Policies
Economic incentives
Technology & knowledge
• Provincial downscaled climate change projections is a step in the right
direction – but much information and guidance remains needed:
E.g. updated flood risk maps and costs of impacts and adaptation
• Underlying economic opportunities of data/information improvements, e.g.:
Improved streamflow forecasting to increase spot market sales of
hydroelectricity
Better knowledge of future ice and permafrost dynamics to enhance economics
of natural resource exploitation
Better knowledge of biophysical conditions to improve reliability of Strategic
Environmental Assessment and Project Environmental Assessments
Data and information
© Deloitte LLP and affiliated entities. 10
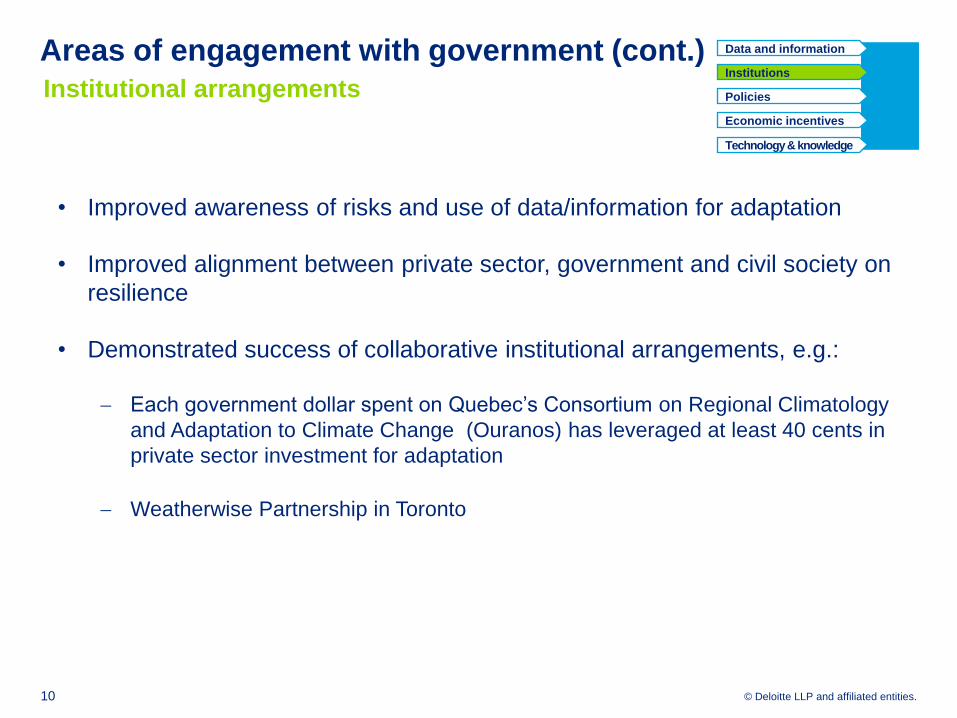
• Improved awareness of risks and use of data/information for adaptation
• Improved alignment between private sector, government and civil society on
resilience
• Demonstrated success of collaborative institutional arrangements, e.g.:
Each government dollar spent on Quebec’s Consortium on Regional Climatology
and Adaptation to Climate Change (Ouranos) has leveraged at least 40 cents in
private sector investment for adaptation
Weatherwise Partnership in Toronto
Data and information
Institutions
Policies
Economic incentives
Technology & knowledge
Areas of engagement with government (cont.)
Institutional arrangements

© Deloitte LLP and affiliated entities. 11
• Updated building/infrastructure standards and codes
E.g. without adaptation, climate change could add 10 to 20% to infrastructure wear
& tear costs
• Local zoning to reduce vulnerability of assets and operations, e.g.:
Building height and other construction restrictions
Requirements to maintain and/or build natural or artifical coastal defences
• Permitting and impact assessments requiring to consider future impacts
Data and information
Institutions
Policies
Economic incentives
Technology & knowledge
Areas of engagement with government (cont.)
Policies
© Deloitte LLP and affiliated entities. 12
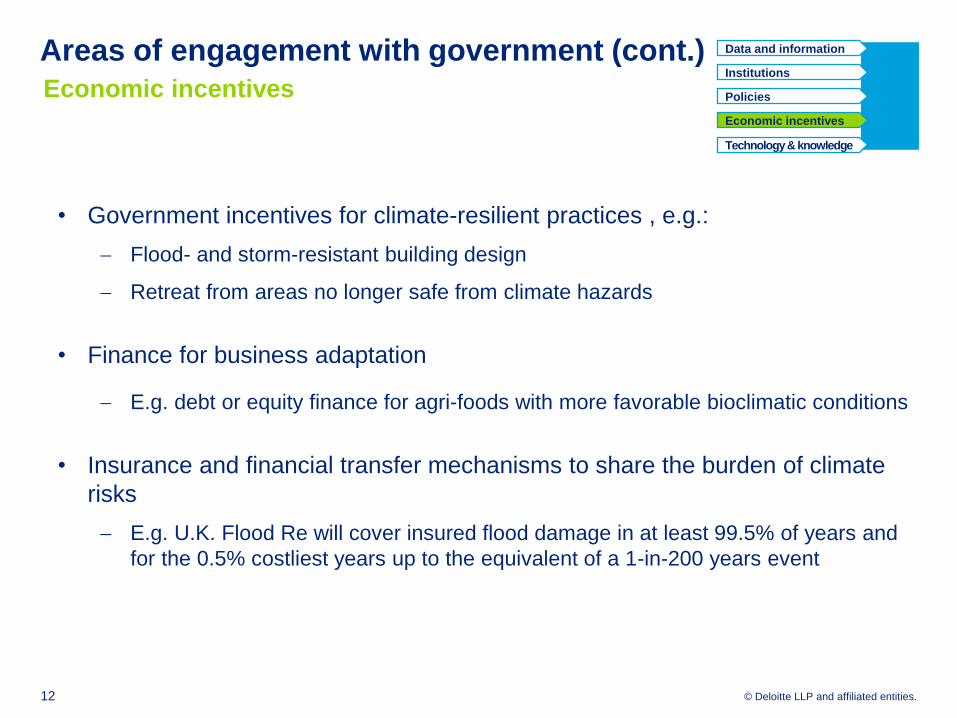
• Government incentives for climate-resilient practices , e.g.:
Flood- and storm-resistant building design
Retreat from areas no longer safe from climate hazards
• Finance for business adaptation
E.g. debt or equity finance for agri-foods with more favorable bioclimatic conditions
• Insurance and financial transfer mechanisms to share the burden of climate
risks
E.g. U.K. Flood Re will cover insured flood damage in at least 99.5% of years and
for the 0.5% costliest years up to the equivalent of a 1-in-200 years event
Data and information
Institutions
Policies
Economic incentives
Technology & knowledge
Areas of engagement with government (cont.)
Economic incentives
© Deloitte LLP and affiliated entities. 13
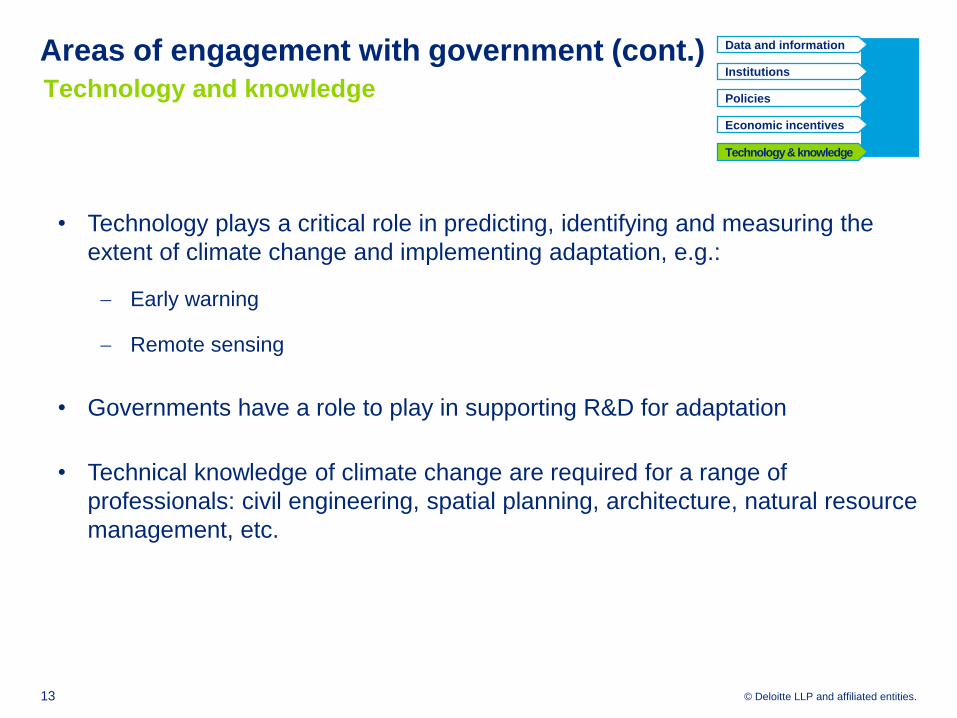
• Technology plays a critical role in predicting, identifying and measuring the
extent of climate change and implementing adaptation, e.g.:
Early warning
Remote sensing
• Governments have a role to play in supporting R&D for adaptation
• Technical knowledge of climate change are required for a range of
professionals: civil engineering, spatial planning, architecture, natural resource
management, etc.
Data and information
Institutions
Policies
Economic incentives
Technology & knowledge
Areas of engagement with government (cont.)
Technology and knowledge
© Deloitte LLP and affiliated entities.
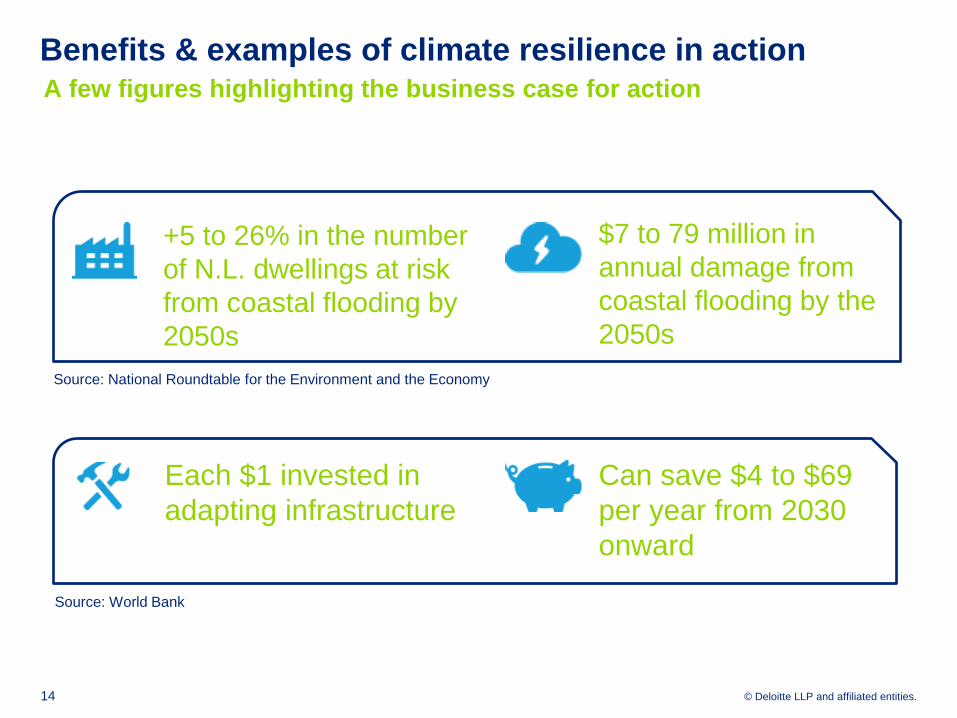
Benefits & examples of climate resilience in action
14
Each $1 invested in
adapting infrastructure
Can save $4 to $69
per year from 2030
onward
$7 to 79 million in
annual damage from
coastal flooding by the
2050s
+5 to 26% in the number
of N.L. dwellings at risk
from coastal flooding by
2050s
Source: National Roundtable for the Environment and the Economy
Source: World Bank
A few figures highlighting the business case for action
© Deloitte LLP and affiliated entities.
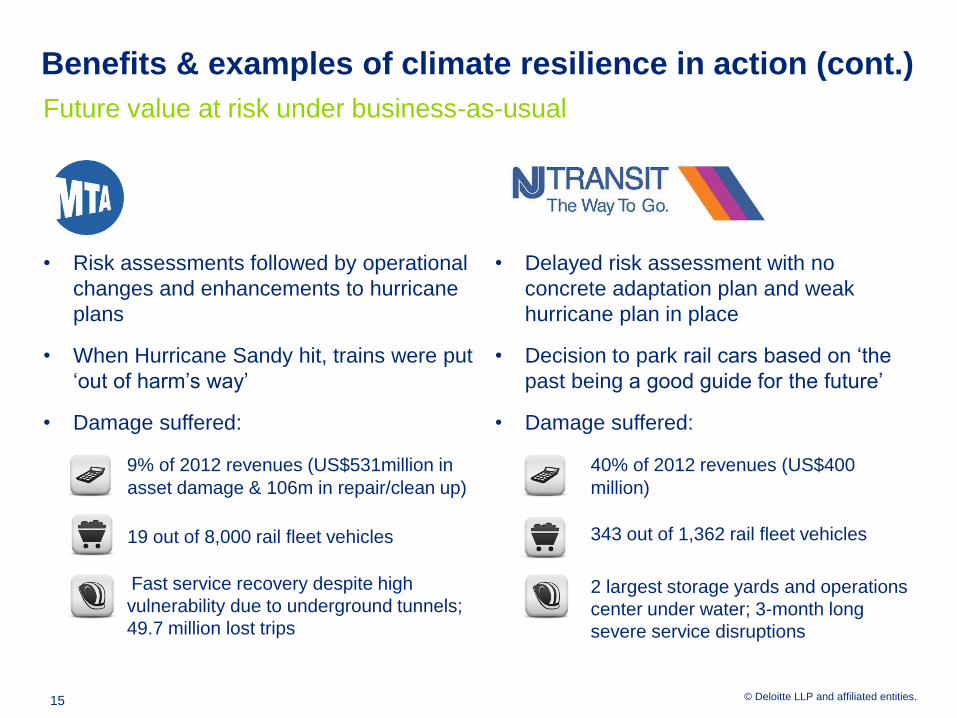
• Risk assessments followed by operational
changes and enhancements to hurricane
plans
• When Hurricane Sandy hit, trains were put
‘out of harm’s way’
• Damage suffered:
9% of 2012 revenues (US$531million in
asset damage & 106m in repair/clean up)
19 out of 8,000 rail fleet vehicles
Fast service recovery despite high
vulnerability due to underground tunnels;
49.7 million lost trips
Benefits & examples of climate resilience in action (cont.)
• Delayed risk assessment with no
concrete adaptation plan and weak
hurricane plan in place
• Decision to park rail cars based on ‘the
past being a good guide for the future’
• Damage suffered:
40% of 2012 revenues (US$400
million)
343 out of 1,362 rail fleet vehicles
2 largest storage yards and operations
center under water; 3-month long
severe service disruptions
Future value at risk under business-as-usual
15
© Deloitte LLP and affiliated entities.
Benefits & examples of climate resilience in action (cont.)
16
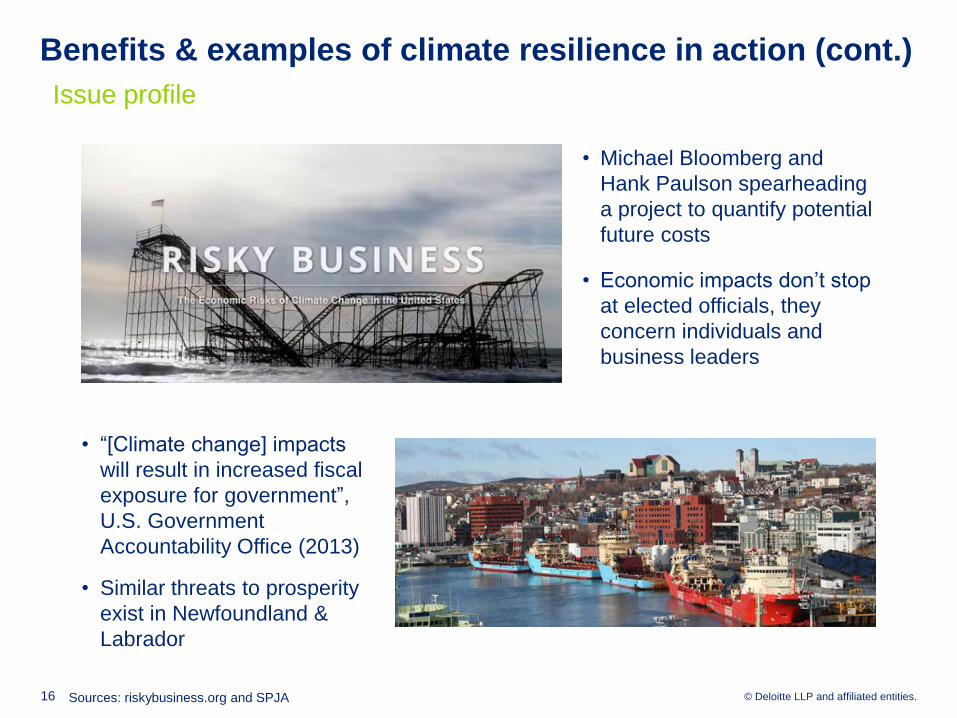
Issue profile
• Michael Bloomberg and
Hank Paulson spearheading
a project to quantify potential
future costs
• Economic impacts don’t stop
at elected officials, they
concern individuals and
business leaders
• “[Climate change] impacts
will result in increased fiscal
exposure for government”,
U.S. Government
Accountability Office (2013)
• Similar threats to prosperity
exist in Newfoundland &
Labrador
Sources: riskybusiness.org and SPJA
