by eric m. mosier ph.d., 2018 m.s.e., university of kansas
TRANSCRIPT

1
THE EFFECTS OF VERTICAL JUMP FATIGUE AND SPRINT FATIGUE ON TOTAL-
BODY BIOMECHANICS
By
© 2018
Eric M. Mosier
Ph.D., 2018
M.S.E., University of Kansas, 2015
B.G.S., University of Kansas, 2012
Submitted to the graduate degree program in Health Sport and Exercise Science and the Graduate
Faculty of the University of Kansas in partial fulfillment of the requirements for the degree of
Doctor of Philosophy in Exercise Physiology.
__________________________
Chairperson Dr. Andrew C. Fry
__________________________
Dr. Phillip M. Gallagher
__________________________
Dr. Trent J. Herda
__________________________
Dr. Ashley A. Herda
__________________________
Dr. E. Bruce Hayes
Date Defended: July 24th, 2018

2
THE EFFECTS OF VERTICAL JUMP FATIGUE AND SPRINT FATIGUE ON TOTAL-
BODY BIOMECHANICS
By
© 2018
Eric M. Mosier
Ph.D., 2018
M.S.E., University of Kansas, 2015
B.G.S., University of Kansas, 2012
Submitted to the graduate degree program in Health Sport and Exercise Science and the Graduate
Faculty of the University of Kansas in partial fulfillment of the requirements for the degree of
Doctor of Philosophy in Exercise Physiology.
__________________________
Chairperson Dr. Andrew C. Fry
__________________________
Dr. Phillip M. Gallagher
__________________________
Dr. Trent J. Herda
__________________________
Dr. Ashley A. Herda
__________________________
Dr. E. Bruce Hayes
Date Defended: July 24th, 2018

3
The Dissertation Defense Committee for Eric M. Mosier certifies
that this is the approved version of the following:
The Effects of Vertical Jump Fatigue and Sprint Fatigue on
Total-Body Biomechanics
__________________________
Chairperson Dr. Andrew C. Fry
Date Defended: July 24th, 2018

4
ABSTRACT
The Effects of Vertical Jump Fatigue and Sprint Fatigue on Total-Body Biomechanics
Eric M. Mosier
The University of Kansas, 2018
Supervising Professor: Andrew C. Fry, Ph.D.
INTRODUCTION: Motion capture systems (MCS) can be used to assess an
individual’s upper-and lower-body motions, both explosive and functional in nature.
Advancements in technology and screening protocols are capable of detecting acute
biomechanical alterations of the lower-extremities following fatiguing tasks. PURPOSE: This
study compared the kinetic and kinematic variables measured by a 3-dimesional video MCS to
identify alterations in lower-extremity performance following VJ and sprint fatiguing tasks.
METHODS: Eleven healthy, recreationally active women (�̅�±SD; age=20.81.1 yrs.,
hgt.=172.27.4 cm, wgt.=68.07.2 kg) and eleven men (age=23.02.6 yrs., hgt.=180.34.8 cm,
wgt.=80.47.3 kg) volunteered for this investigation, and were screened using the Performance
Motion Analysis (PMA) protocol, consisting of 19 motions. These include shoulder ranges of
motions (i.e., shoulder abduction and adduction, horizonal abduction and adduction, internal and
external rotation, flexion and extension). Also assessed were trunk rotation, bilateral overhead
squat, unilateral squats, forward lunges, single leg balance, bilateral counter-movement vertical
jump (CMVJ), unilateral CMVJs, concentric-only VJ, multiple unilateral CMVJs, and depth VJ.
A three-dimensional markerless MCS (DARI Motion, Scientific Analytics, Lincoln, NE) was
used to analyze the kinetic and kinematic data, from which 192 variables were calculated and

5
reported in PMA Scores (i.e. Composite Score, Power Score, Functional Strength Score,
Dysfunction Score, Vulnerability Score, and Exercise Readiness Score). Each subject completed
one familiarization session, three experimental sessions consisting of three randomized acute
fatiguing protocols (i.e. Control Session, Modified jump test, 25-sec Sprint Test). PMA Test,
accumulated lactate and heart rate (HR) was collected pre-and post-fatigue tests. Statistical
analyses were conducted for the performance measures using the scores [Composite Score,
Power Score, Functional Strength Score, Dysfunction Score, Exercise Readiness Score (ERS),
and Vulnerability Score] x conditions (VJ, Sprint, CON) x time (pre-test, post-test) x within sex
(females, males) repeated measures MANOVA. RESULTS: The MANOVA indicated a three-
way interaction (score x condition x time). Follow-up analyses indicated significant differences
between pre-and post-tests for the (𝑋 ̅± SD for pre-test; post-tests) Composite Score
(1556.43±307.8; 1368.00±264.62), Power Score (813.34±242.39; 687.32±164.83), and ERS
(18.16±4.75; 16.02±3.54) during the VJ experimental sessions. Significant increases in
accumulated lactate and HR were indicated for the post-test during the modified VJ and 25-sec
sprint tests. CONCLUSION: The current investigation demonstrated the viability of a MCS test
to evaluate changes in performance due to acute fatigue. The investigation determined the MCS
was capable of detecting acute lower-body biomechanical changes. The PMA Scores suggested
decrements in performance are first observed in the decreases in power production during high
velocity movements (i.e. VJs). PRACTICAL APPLICATION: Documentation and tracking of
changes in performances will give future insights on how fatigue can be rated and evaluated.
Advancements in technology and screening protocols may be capable of predicting increased
risk of season ending injuries. This may provide the strength and conditioning professional

6
helpful longitudinal information as an athlete/patient/client progresses through a training
program and season.

7
ACKNOWLEDGEMENTS
I would like to thank my dissertation committee, Dr. Andrew Fry, Dr. Phillip Gallagher,
Dr. Trent Herda, Dr. Ashley Herda, and Dr. Bruce Hayes, for serving on my committee and for
all they have taught me throughout my years at the University of Kansas. I also would like to
thank Patrick Moodie and the entire staff at Dynamic Athletics Research Institute (DARI
Motion) for their work and time each one has put forth. I would like to thank Dr. Justin Nicoll
and other members of the Jayhawk Athletic Performance Laboratory for the assistance and
support. I am especially thankful for my advisor Dr. Fry, without his persistence and mentorship
this research study and degree would not have been possible. Lastly, I would like to thank my
family and friends, for their immense support and understanding through the dedicated years.

8
TABLE OF CONTENTS
CHAPTERS
Title Pages 1-3
Abstract 4-6
Acknowledgements 7
Table of Contents 8-11
I. CHAPTER 1 - REVIEW OF LITERATURE 12-45
A. Origins / Background 12
B. Usage of Vertical Jump Testing 12
C. Vertical Jump Theories 14
D. Training Comparison 15
E. Performance Comparison 16
F. Relationship to Lower Body Power 16
G. Predictor of Lifting Performance 17
H. Weightlifting Injury Rates 17
I. Vertical Jump Phases 19-20
I-1. Counter-Movement Vertical Jump Eccentric Phase 19
I-2. Counter-Movement Vertical Jump Concentric Phase 19
I-3. Combination of Eccentric & Concentric Phases for the 20
Counter-Movement Vertical Jump
J. Vertical Jump Individual Strategies 21
K. Kinetic Jump Performance Variables 22

9
i. Figure 1 24
L. Motion Capture Systems 26-29
L-1. Markerless Motion Capture System 26
L-2. Comparison of Markerless Motion Capture System 27
and Force Plate
i. Figure 2 28
M. Vertical Jumps with and without Arm Swing 29-30
M-1. Arms Swing versus No-Arm Swing 29
M-2. Contribution of the Upper Limbs using Markerless 29
Motion Capture System
N. Joint Torques 31
O. Gender Differences 32-37
O-1. Anterior Cruciate Ligament Injury during Jumps 32
O-2. Theories of Gender Biomechanical Differences 33
O-3. Gender Biomechanical Differences 33
P. Biomechanics of Jump Landings 37
Q. Biomechanics of Single Leg Jumps 38
R. Biomechanics of Depth (Drop) Jump 39
S. Biomechanics during Fatigue Protocols 40
T. Biomechanics Coordination following Fatigue 41
U. Landing Error Scoring System 42
V. Repeated Anaerobic Jump Test 42
W. Anaerobic Sprint Running Test 43

10
X. Conclusion 44
II. CHAPTER 2 - INTRODUCTION 46-49
A. Problem Statement 48
B. Purposes 49
III. CHAPTER 3 - METHODS 50-58
A. Experimental Approach to the Problem 50
B. Subjects 50
i. Table 1 50
C. Procedures 51
i. Figure 1 51
D. Performance Movement Analysis 52
E. Performance Motion Analysis Scores 52
i. Figure 2 54
F. Acute Fatigue Protocols 55-56
F-1. Warm-up Protocol 55
F-2. Control Session 55
F-3. Modified Jump Test 55
F-4. 25-Second Sprint Test 56
G. Blood Samples 56
H. Performance Tests 56-57
H-1. Motion Capture Device 56
H-2. Force Plate Device 57
H-3. Non-motorized Treadmill 57
11
I. Statistical Analyses 57
IV. CHAPTERS IV – RESULTS 59-66
i. Table 2. 61
ii. Table 3 62
iii. Table 4 63
iv. Table 5 64
v. Table 6 65
vi. Table 7 66
V. CHAPTER V – DISCUSSION 67-70
A. Conclusion 69
B. Practical Application 70
VI. REFERENCES 71-99
VII. APPENDIX A 100
A. Informed Consent 101-106
VIII. APPENDIX B 107
A. Authorized for Release of Photography and/or video 108-109
IX. APPENDIX III 110
A. Medical History Form 111-114
12
I. CHAPTER I - REVIEW OF LITERATURE
A. ORIGINS / BACKGROUND
The vertical jump (VJ) is a well-recognized essential component of successful athletic
performance. More specifically, strength and conditioning specialists, coaches, and health
professionals commonly administer the VJ test to determine an athlete’s or client’s jumping
ability and/or to determine lower-body power (16, 50, 141, 201, 215). It was originally
developed by Dudley Sargent in 1921 as “the physical test of man (201).” VJ height (VJH) was
assessed as the difference between standing reach and jump height. VJH may be a good predictor
of changes in lower-body power in weightlifting, football, and track and field events (20, 95,
146, 202). In addition, the VJ has been shown to correlate with speed, agility, and lower body
power performances in soccer players (141). Furthermore, strength and conditioning
professionals use a variety of devices to compare pre- and post-tests of VJH to determine the
effectiveness of a prescribed training program (40, 220).
B. USAGE OF VERTICAL JUMP TESTING
Numerous methods and testing equipment have been used to measure VJH. Traditionally,
the most commonly used testing methods is the Sargent’s test (9, 41, 84, 156, 224), also known
as the jump and reach test (9, 41, 84, 156, 217, 224). This method is simple and effective with
the reported reliability of (r = 0.93) (9, 75, 156). Subjects would either have a tape or chalk on
their fingers, and in a counter-movement vertical jump (CMVJ) with an arm swing, the subjects
would slap their fingers or tape against the wall or board. The VJH height is obtained by
subtracting the standing reach by the highest VJ reach of the individual (9, 14, 84, 156, 217).
Other devices measure VJH using basic kinematic equation to calculate jump height by flight
13
time (41, 83-85, 140). Comparison of flight times for a VJ mat was not consistent with flight
times from a force plate, however, correlations between them were very strong (r = 0.995) (224).
Vertical jump mat has been shown to be effective at measuring VJ reach height for many
individuals when compared with a Vertec (83, 84, 125, 224), despite the fact the timed VJ mat
device reported 100 milliseconds longer flight times than those measured by a force plate (224).
Video analysis can also determine the vertical displacement of the center of mass (COM)
from the standing position to the apex of the jump (15, 34, 83-85, 110, 156). Some studies
suggest this method could be considered the criterion reference, or “gold standard” method, for
VJH measurement (15, 83-85). Many studies have examined the kinematic characteristics of the
human body during a VJ. Improvements in motion capture systems (MCS) have led to analytical
tools that allow detailed analyses of the CMVJ, and to determine the vertical displacement of the
center of mass (COM) (72, 73, 97, 136). A MCS allows derivation of the individual joint
torques and the net ground reaction forces produced. Additionally, a MCS quantifies movement
of body segments and joints which influence the forces generated. This method requires
expensive motion analysis equipment and the placement of reflective markers on the subject’s
body that are recorded during the jumping movement and then analyzed by computer software.
However, this method is cost prohibitive for many sport or gym settings (3, 15, 41, 85).
As previously discussed there are variety of different approaches used for measuring
VJH, with force platforms being considered as the gold standard (85, 192). Force platforms can
measure VJH both time in the air and take-off velocity methods (122, 164). While take-off
velocity is considered the most accurate method for measuring VJH, time in the air method have
been proven to be highly valid and reliable. Most instrumental calculation of VJH by measuring
flight time (85, 164). Force platforms, accelerometers, contact platforms, infrared platforms, and

14
high-speed cameras (42, 85, 192). An inexpensive approach is using a low-cost high-speed
camera, license-free computer software, and download applications to evaluate VJH (17, 18).
Recently, companies are releasing smartphones with high-speed cameras. One such company is
Apple Inc. (USA), which released a smartphone with a high-speed camera capable of recording
120 Hz (17). Balsalobre-Fernandez and colleagues examined the validity and reliability of the
smartphone application for measuring VJH (17). The investigation concluded that the application
and force platform displayed almost perfect agreement for the CMVJ (17). Software and
application development can provide alternatives for CJVH analysis more specifically of VJH.
C. VERTICAL JUMP THEORIES
The counter-movement vertical jump (CMVJ) is a complex multi-joint action where
muscles of both the lower and upper extremities collectively summate forces to produce a
movement. In the standard vertical jump test, as well as in many sports events, the upper limb
(i.e., arms) swing vigorously upward during takeoff to enhance the VJH and performance at
takeoff (45, 72, 73, 97, 98, 136, 137, 186, 204). Several theories have been proposed for the
positive effect of the arm swing (AS) swing on enhanced CMVJ performances. One of the
earliest was the ‘transmission of force’ theory which suggested the arms are accelerated upward,
exerting a downward force through the body and increasing the ground reaction force (GRF),
thus positively influencing the vertical velocity of the center of mass (COM) (186). A second
theory, the ‘joint torque augmentation’ theory, suggested the reaction force exerted onto the
trunk is due to the upward acceleration of the arm swing causing the lower limb joints (hips,
knees, and ankles) to slow their rate of extension, thus enabling them to collectively produce
greater muscle forces (73). A third theory, the ‘pull’ theory, proposed that towards the end of the

15
concentric phase as the arms begin to decelerate, the high vertical velocity of the upper limbs
relative to the trunk enables the upper limbs to ‘pull’ on the trunk, transferring energy from the
arms to the rest of the body (98).
D. TRAINING COMPARISION
An examination on VJ performance was performed based on training styles, such as
powerlifting, Olympic lifting, and sprinting, on strength and power characteristics in the squat
movement (147). Olympic lifters and sprinters require explosive strength or maximal power.
Powerlifters are known to focus on maximal force production during heavy load and slow
velocity lifts. Sprinters, however, would primary focus on specific events, characterized by low
resistance, explosive, and high-velocity movements. Olympic lifts incorporate exercises similar
to sprinters and powerlifters, but include both heavy loads and explosive types of lifts. Over one
year of training, Olympic lifters demonstrated a significant improvement in both rate of force
development and maximal force production (94). This type of training is very effective for
increasing muscle strength and power (95). The training style used by sprinters results in smaller
strength gains, but greater rates of force development due to the explosiveness (147). CMVJ
peak forces and peak velocity were significantly higher in the Olympic lifting group and the
sprinters group. Thus, peak power was significantly higher in the Olympic lifters when compared
to the powerlifters. Furthermore, VJH was significantly higher VJH in the Olympic lifters and
the sprinters. As a result, the Olympic lifters outperformed the sprinter group, by jumping higher,
producing higher force, and generating the highest power outputs.

16
E. PERFORMANCE COMPARISON
When Olympic lifters are compared to a plyometric training group, the Olympic lifting
training group consistently resulted in the greatest VJ performance. Through an eight week
training program the plyometric group produced higher improvements in maximum strength but
failed to increase performance in the squat jump test (214). However, strong correlation were
reported between maximum strength and power performance (214). The differences observed
between the Olympic lifting group and the plyometric group could be due to the development of
a greater rate of force development with external resistance applied to the center of mass.
F. RELATIONSHIP TO LOWER BODY POWER
The program design or training status of the athlete can influence the VJ performance. An
athlete’s development of strength and power can be very crucial in sport specific performances.
One recent study analyzed the relationship between lower body muscular power and linear sprint
speed in soccer players based upon vertical jump and full squat power outputs (141). The authors
proposed a new method to analyze them to improve soccer specific acceleration. Thus, it is
argued that squats and jumps are two exercises that can improve lower body strength, power, and
speed. Training programs of full squats, CMVJ and sprinting exercises indicate significant
increases in CMVJ loading and mean and peak squat power. Significant correlation were
reported between the sprint times and peak power in the 20 kg, loaded CMJ, and between the
loaded CMJs and split times from the 10 to 30 meter sprint (141). The average power with the
full squat with a load of 70 kg showed a significant positive correlation with sprint times (141).
These results suggest that power produced either with vertical jump or full squat exercises could
explain much of the sprint performances in those soccer players.

17
G. PREDICTOR OF LIFTING PERFORMANCE
Heavy-resistance training uses high loads and slower velocities of concentric muscle
actions that may lead to improvement in maximal strength, that is the high force and low velocity
portion of the force velocity curve (220). Power training incorporates lighter resistances and high
velocities of muscle action, which this may result in increases in force output at higher velocities
and increased rate of force development (220). The United States Olympic Committee and USA-
Weightlifting correlated estimates of average power and peak power, derived from the vertical
jump, with performance in weightlifting movements among national-level men and women, and
junior squads (39). Estimated VJ was correlated with lifting ability among 64 USA National-
level weightlifters. As one would expect, the National-level men had higher absolute power
outputs and VJH. Furthermore, correlations indicated maximum strength from 1 RM squat and
peak power derived from vertical jumps are strongly related to weightlifting performance (39). A
strong correlation was also reported between peak power during vertical jump and weightlifting
performance. Since lifting typically begins from a static position, a static vertical jump may
correlate with lifting performance (40).
H. WEIGHLIFTING INJURY RATES
As weightlifting is becoming increasingly popular, safety is a growing concern (96, 209).
The lifts in the sport of weightlifting emphasize explosive muscular power (128, 209) and
essential property of many sports (127). As a result, weightlifting related exercises are often a
training tool used to enhance performance for numerous of other sports (127, 193). Injuries
always concern athletics, and weightlifting is no exception. Injuries mechanics, prevalence, and
rates provide critical information for the coach, athlete, and athletic trainer. Such information

18
may help provide a safe environment for athletes (37, 113, 209, 211). Three anatomical areas
though to be at high risk of injury for weightlifting are also common injury sites in many sports
(60, 88, 143) the knee, low back, and the shoulder. Data on powerlifting and body building
indicate that most injuries occur in the shoulder region, followed by the low back, and the knee
(86). Injuries in weightlifting have been reported to include not only soft tissue muscle injuries,
but also conditions such as spondylolysis and meniscal injuries (1, 128, 193). In weightlifting,
previous literature has indicated that most injuries occur at the knee, followed by the shoulder
and back (21, 113, 128, 209). Kulund et al. has indicated the highest percentage occurs during
the clean and jerk lift in weightlifting (128). Knee injuries are a high concern not only for
weightlifting but for all sports (37). Knee tendinitis especially patellar tendinitis is a problem for
many athletes (60).
Calhoon and Fry indicated the most commonly injured sites to include the back, knee,
and shoulder, and most of the injuries can be described either as acute or chronic rather than
recurring or due to complications and consisted primarily of trains tendinitis and sprains among
elite weightlifters over a 6-year period (37). Most of the injuries were relatively minor resulting
in missed training time recommendations of less than 1 day (37). The injuries typical of elite
weightlifters are primarily overuse injuries, not traumatic injuries comprising joint integrity.
Overall the injury rates for weightlifters are similar to rates for many other sports (7, 21, 37, 113,
128). Lower back, knees, and shoulders constitute the most commonly injured anatomical areas
in the sport of weightlifting (37).

19
I. VERTICAL JUMP PHASES
I-1. COUNTER-MOVEMENT VERTICAL JUMP ECCENTRIC PHASE
An eccentric muscle action occurs when the muscle cannot develop sufficient force and is
overcome by an external load, resulting in a lengthening of the muscle (69). An eccentric phase
is commonly found during the deceleration of joint motion, or the downward phase of the
CMVJ. The thin filaments are pulled further away from the center of the sarcomere, stretching
the muscle (120). The preparation phase, or eccentric phase, of a vertical jump is defined as the
period when the body is being lowered to a desirable position for an upward acceleration (174).
During the preparatory phase, “the ankles dorsiflex, the knees, and hips flex, and the shoulders
hyperextend (148).”
I-2. COUNTER-MOVEMENT VERTICAL JUMP CONCENTRIC PHASE
A concentric muscle action occurs when a muscle overcomes a load and shortens,
resulting in an upward phase during the vertical jump (69). The thin filaments are pulled toward
the center of the sarcomere (120). The concentric phase, or propulsion phase, is defined by the
period when the body is in an upward acceleration motion acting against gravity (24). During the
concentric phase, “ankles plantar flex, the knees, and hips extend, and the shoulders flex (148).”
Whether the contraction of the muscle is concentric or eccentric, “force is generated dependent
on the number and type of motor units activated, the frequency of stimulation of each motor unit,
the size of the muscle, the muscle fiber and sarcomere length, and muscle’s speed of contraction”
(120). The ability to develop force depends on the speed of the muscle contraction during the
eccentric and concentric phases. However, if the downward motion is not included in the vertical
jump, the jump is considered a squat jump, therefore only the concentric phase is performed.

20
I-3. COMBINATION OF ECCENTRIC & CONCENTRIC PHASES FOR THE
COUNTERMOVEMENT VERTICAL JUMP
When the duration of the eccentric, concentric, and amortization phases combined are
minimized, it can result in the greatest improvement in performance (213). It has been suggested
that the neuromuscular adaptation of “increased inhibition of antagonist muscles after training
causes an increased activation of synergistic muscles, an inhibition of neural protection
mechanisms, and/or increased in motor neuron excitability can all contribute to the increased
work (213).” For example, the energy that is stored in a rubber band when it is stretched
(eccentric phase), is released once it is released (concentric phase). Therefore, a greater amount
of work can be used if there is a right amount of time duration between the two phases that
allows the synergistic muscles to activate and to deactivate the antagonist muscles. Training
programs that combine both phases involve the union between strength and speed, commonly
referred as the stretch shortening cycle (SSC) (213). Many studies have analyzed training certain
phases or training the combination of phases to cause the maximum performance in the vertical
jump. Training these phases allows for a rapid switch from the eccentric phase to the concentric
phase during a vertical jump. Furthermore, this type of training allows for a decrease in the
duration of the amortization phase resulting in the jumper reaching the propulsion phase quicker,
and in turn increasing power production and vertical displacement of the center of mass.
Increasing force and power during the SSC are necessary to increase the vertical jump
performance. If the period between the two phases is delayed, the potential energy (PE) stored
during the eccentric phase will be lost and dissipated as heat. The stretch reflex will not be able
to increase muscle activity during the concentric phase (69).

21
J. INDIVIDUAL STRATEGIES FOR THE VERTICAL JUMP
Previous research has identified discrete biomechanical variables as discriminators of
“good” or “bad” jumpers, indicating a skill component which can be collected from kinematic
and kinetic data (8, 217). A feature of the skill component of the VJ has been identified as the
sequencing of joint and segment actions (98, 216). Bobbert and colleagues originally found the
proximal-to-distal strategy generated net joint movement-time curves where the hips reached
maximum torque early in the jump, followed by the extensions of the knees and ankles (28, 45,
216). Allowing for large hip, knee and ankle extensor net joint movements resulted in
maximizing vertical accelerations of the pelvis (45). The sequencing consists of two principles;
(a) optimal timing of segment motions to maximize vertical velocity of the body’s COM, and (b)
an energy efficient transfer of force from proximal to distal segments (28, 45, 216). However,
there is disagreement as to whether this strategy, or simultaneous joint extensions, is ideal for
vertical jump performance (111).
Comparison of VJ with arm swing and without indicated a longer relative time between
the initiation of the hip extension and knee extensions resulting in higher vertical jumps with the
usage of the upper limbs (45). The highest jumps displayed a longer relative time delay between
joint extension of the hips and knees compared to lower jumps (45). It was hypothesized that the
proximal-to-distal strategy allows maximal force of the hamstring muscles to occur before
maximal force of the quadriceps, minimizing the antagonism between the muscle groups (45).
The simultaneous strategy resulted in maximum force of both muscle groups concurrently,
resulting in decreased knee extension torque (45). Sequential extension increased the GRF
towards the end of the lower extremity extension, but reduces force earlier in the movement (6).

22
Van Igen Schenau and colleagues (1989) suggested that the sequential extension
movement pattern would improve jumping performance if rates of extension were limited by
muscle properties (i.e., fiber types) (216). Furthermore, it may be beneficial if the joint extension
is driven by the elastic recoil of tendons and the stretch-shortening cycle (6, 27, 29). Regardless,
both jumping patterns are observed among individuals with diverse training statuses and
backgrounds (217). Chiu and colleagues (2014) stated that in untrained individuals, the muscles
contributing to the sequential strategy may have insufficient levels of fitness, such as strength
and flexibility (45). The proximal-to-distal and simultaneous strategies display the influences of
the net joint movements during a CMVJ, thus suggesting that coordination must also be
considered when evaluating vertical jump performance.
K. KINETIC JUMP PERFORMANCE VARIABLES
Direct measurement of kinetic and kinematic variables can provide an insight pertaining
to (a) neuromuscular strategies used to achieve maximal jump performance, reflecting the
movement efficiency of the athlete, (b) neuromuscular status of an athlete in response to training
and competition, intimating the presence of adaptation (48, 49, 107, 145, 149, 210); and (c)
lower-body explosive qualities of an athlete (56, 203, 233), thus highlighting areas of deficiency
for a more efficient training program (149). Therefore, assessment of VJ kinetic and kinematic
variables is a useful tool in the routine monitoring of athletes. The degree of precision associated
with VJ performance and associated kinetic and kinematic variables has shown an implication
for the interpretation of true lower-body explosive capacity and changes in VJ performance.
Furthermore, several studies have shown that the shape of the force-time curve is dependent on
expertise (51, 52, 54, 130). Coaches and practitioners must be aware of typical variations and or

23
reliability associated with VJ performance (68). The reliability of the individual performance
may encompass biological (i.e. within subjects) and nonsystematic measurement error (i.e.
equipment, tester) (68, 130). The variability and measurement of the performer is critical for the
interpretation of the VJ data.
Cormack et al. (2008) calculated the intraday and interday reliability of CMVJ variables
in elite Australian Rules Football players, reporting coefficient of variations (CV values) of 1.1-
1.7% (intraday), and 1.0-5.7% (interday) (48). Sheppard et al. (2008) assessed unloaded (body
mass) and loaded (body mass + 25%) CMVJs in elite and developmental athletes, and observed
CVs of 3.5% (peak force) to 36.3% [concentric and peak rate of force development (RFD)] in
unloaded jumps, and 3.0% (mean power) to 47.4% (concentric peak RFD) in loaded jumps
(203). Further RFD seems to play a role in activities involving plyometr ic muscular contractions
such as sprinting or jumping (93, 119, 130, 138, 152, 226).
Laffaye and colleagues (2014) have shown football and baseball players exhibit VJ
“signature” or profiles scores ranging from (r = -1.5 to 2.8), with higher values of eccentric RFD
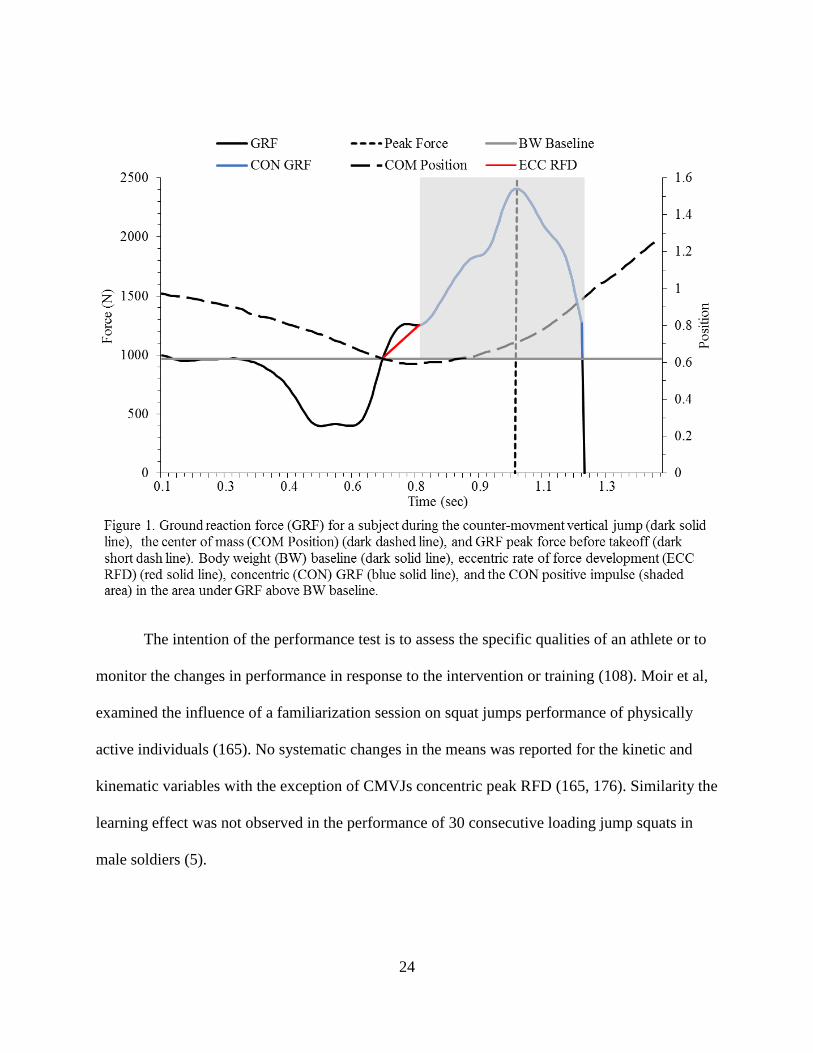
than volleyball and basketball players (Figure 1) (130). Football and baseball players tend to
display explosive profiles, with high values of eccentric RFD, average concentric force, and VJH
(130). Although RFD and impulse provide valuable insight pertaining to the jumping strategy,
researchers report higher variability for these variables compared to peak power and jump height
(47, 129, 144, 152, 163, 210). Moir et al. (2005) report CVs for peak and average eccentric RFD
ranging from 17 to 21% in physically active men and women (165). The reliability statistics for
eccentric RFD, more specifically, average eccentric RFD is limited.
24
The intention of the performance test is to assess the specific qualities of an athlete or to
monitor the changes in performance in response to the intervention or training (108). Moir et al,
examined the influence of a familiarization session on squat jumps performance of physically
active individuals (165). No systematic changes in the means was reported for the kinetic and
kinematic variables with the exception of CMVJs concentric peak RFD (165, 176). Similarity the
learning effect was not observed in the performance of 30 consecutive loading jump squats in
male soldiers (5).

25
The evaluation of repetitive trials revealed trivial or small non-systematic changes in the
mean for average eccentric RFD, concentric mean force, concentric impulse, and VJH. Nibali et
al. (2013) suggests no evidence of systematic error in any of the 3 variables, nor for the
combined pool encompassing all levels of athletes (175). It was reported that the familiarization
trials before VJ assessment are not necessary in athletes, irrespective of the competitive level or
sport, suggesting adequate proficiency of the athlete with VJ performance (5, 163, 165, 176).
Average eccentric RFD has been reported to be highly correlated with VJH of elite athletes (118,
129), and potentially could be sued as a key variable when it is examined in the relation to
average concentric force (129, 176).
Nibali and colleagues (2015) stated that the average eccentric RFD can be a sensitive
measure in training adaptations despite the variability, owning the to the magnitude eccentric
RFD changes (176). Cormie et al. (2010) reports significant improvements in eccentric RFD in
stronger power, weak power, and weaker strength groups. A significant improvement was
reported; however, the magnitude of change was not present (53). Average concentric force and
concentric impulse were reported to be the most reliable variables, however, were less effective
in detecting small changes in performance (176). Average eccentric RFD has been reported to be
unreliable and is incapable of detecting small changes (176). The assessment of VJ kinetics and
kinematic variables are a useful tool in the routinely monitoring of athletes.
26
L. MOTION CAPTURE SYSTEMS
Many studies analyze the development of the vertical jump and use discrete measures to
analyze the performances such as mean or peak values. This can disregard the important
measurements needed to analyze motion and forces. The evaluation of variations in force,
velocity, and displacement-time curves can provide one of the best ways to assess the changes in
the kinematic and kinetic properties thus resulting in improved jump performance. Force
platforms have been used to measure the kinetic data to measure the reaction forces. Kinetics is
the understanding of the forces that cause the changes in motion. Kinematics examine the
description of the body in motion based upon motion capture system (MCS). These systems are
used to capture in digital form the three-dimensional (3D) movements of the whole body. A
muscle can contribute to the energy of a segment in two ways. The muscle can change the
segments of velocity, and there by its kinetic energy (KE) (67). The muscle can induce an
upward movement of the segment, increasing the PE (67). A typical system is comprised of six
or more video cameras, marker system, and specialized software to organize the date to produce
a digital representation of the movement (148). Typically, full-body marker sets consist of more
than 50 markers. Recently the advancements in technology have allowed the development of
markerless MCS. Dynamic Athletes Research Institute’s (DARI Motion) 3-D motion capture
markerless system has been in the fore front of advancements in analysis of performance.
L-1. MARKERLESS MOTION CAPTURE SYSTEM
Dynamic Athletics Research Institute (Overland Park, Kansas) MCS is comprised of a
3D markerless MCS which access and analyze kinetic and kinematic data (57, 80, 100, 166-168,
187, 218, 222). The OpenStage and BioStage systems designed by Organic Motion (New York,

27
New York) and DARI Motion (Overland Park, KS) provide accurate tracking and MCS data
without markers or special suits. Eighteen vision cameras positioned at different orientations
sampling at 120 Hz or 120 frames per second. From these different 2D coordinates and
orientations a 3D spatial coordinates are generated by establishing a linear relationship between
the 2D cameras coordinates of each body landmark and represent these in a 3D space (194). The
direct linear transformation method is used to calculate the 3D coordinates from a series of
control points (2). The visual hull technology model records and subtracts the visional signal
minus the background which converts to pixels and thus the visual and pixel signals generate a
pixilated person. The algorithm searches for 5 appendages during the consistent “scarecrow
pose” figure, which estimates the lengths, COM, joints, height, and etc. Either DXA scans or
anthropometric estimates (227, 228) used to calculate and analyze 3D kinetic and kinematic data
from vector masses. The 3D MCS kinematics and kinetics are accurately measured
simultaneously without a force platform to provide performance data. The DARI markerless
system has been validated and has the ability to collect kinetic and kinematic data and relay the
information to the specific athlete (79, 187). The 3D motion capture system can be used to
improve performance to a degree that allows the viewer to know exactly where the athlete is
from an objective standpoint.
L-2. COMPARISON OF MARKERLESS MOTION CAPTURE SYSTEM AND FORCE
PLATE
Study conducted by the Biomechanics Laboratory at the University of Kansas, compared
the GRF derived from a force plate and MCS during body weight squats. Subjects wore form
fitting full body suite on which 43 markers were placed (i.e., ankles, knees, hips, etc.) to from
rigid bodies to track joint positions (100). Subjects were instructed to squat with a controlled

28
velocity to parallel depth and back to the starting position. The results of the study indicated that
the GRF can be successfully calculated with the MCS. Fourteen different cameras result in
calculation of position, velocity, and force acting on each part of the body over 100 Hz, or 100
times per second (100). The full body motion capture system records and tracks a stick figure
moving in real time.
A similar study was conducted in 1996 by Department of Sport, Leisure, and Exercise
Science from the University of Connecticut, which analyzed the relationship of the kinetic and
kinematic data between squatting vertical jump and the Olympic hang snatched. The kinematic
data was analyzed through a Peak 3D system and the kinetic data was analyzed through a force
plate system. The multi-joint Olympic lift is very similar to the quick and explosive mechanics of
a squat vertical jump. Thus a significant relationship between all kinetic comparisons, maximal
power, time to maximal power, relative power, maximal force, and time to maximal force,
during the propulsive phase (38). Angular displacement of the left hip, knee, and ankle joints,
Figure 2. The composite mean force values (N) for the ground reaction forces
calculated from the force plate and motion captures system (100).

29
were statistically dissimilar between both exercises during the propulsion phase. This could have
been due to the backward movement of the COM in order for the barbell to pass the subject’s
face during the second pull (38). The researchers did notice that the force-time curves displayed
different scales per subject, meaning that each curve is unique to the individual. The relationship
between the kinetic and kinematic data provides an advanced analysis during any type of
athlete’s performance.
M. VERTICAL JUMPS WITH AND WITHOUT ARM SWING
M-1. ARMS SWING VRSUS NO-ARM SWING
Comparison of the squat jump with and without arms, the push-off or propulsion phase
was quicker during the squat jump without arms, or 1.49 to 1.54 times quicker (25). Shoulder
work was calculated to be estimated of 6.6% of the total work during the vertical jump (25). The
greater VJH during the squat jump with arm swing corresponds to a greater effective energy
during the propulsion phase. Forty-two percent difference between then squat jump with and
without arm swing relative to 58% difference in CMJ (25). Athletes achieve 20% higher in
height, 44% VJH difference, and 56% by the COM height at take-off (25). The squat jump VJH
increased with arm swing resembling an increase of 0.86J/kg of total work (25). In addition the
subjects jumped 23% higher with arm swing, which can be explained by a greater vertical
position of COM at take-off (25). Slower contractile element slows velocity in the early and later
stages of the propulsive phase thus affecting the squat jump with arm swing resulting in
generating greater contractile element force. Furthermore, greater force production was
generated during the arm swing and slower contractile element shortening velocity. Not only had
the hip extensor muscles produced more work with the arm swing, but also the erector spine, and

30
gluteus maximus muscles (25). It is anticipated that the mechanisms underlying the increase are
different for each muscle in the lower extremities. The shortening velocity provides an
explanation in the force production and the force-velocity relationship. The vertical velocity of
the COM at take-off was recorded to be 12.7% larger in the arm swing compared to the no-arm
swing jumps, resulting in 8.2 centimeter in the vertical displacement between take-off and apex
of the jump (73).
M-2. CONTRIBUTION OF UPPER LIMBS USING MARKERLESS MOTION
CAPTURE SYSTEM
The DARI markerless motion capture system was used to access the contribution of the
upper extremities during CMVJ while using arm swing (AS) or no-arm swing (NAS). The usage
of the upper extremities increased the VJH by an average of three inches (171). Dual-energy X-
ray absorptiometry scans determined that the upper limbs were 12.0% of the total body mass.
Movement of the upper limbs during the AS CMVJ produced 32.2% of the total GRF and 11.3%
during the NAS CMVJ (171). The enhancement performance when jumping using an AS
resulted in a 13.6% increase in VJH (171). The contribution of the upper limbs during the AS
CMVJ averaged 31.5% of the peak GRF, which occurred immediately before takeoff (171). The
upper extremities can influence the vertical jump performances and the accompanying kinetics.
It was purposed that when analyzing jump GRFS, one must be aware of how much the upper
limbs contribute to these forces. In addition, proper AS mechanics must be emphasized when
instructing correct jump technique.

31
N. JOINT TORQUES
Stimulation of joint torques listed in the order of joint extension: knee, hip, and ankle for
the NAS, however, during AS the CMVJ begins: hip, shoulder, knee, and ankle. Incorporating
the upper limbs cause an early hip activation in order to effectively swing the arms upward. Knee
joint torque is decreased in the arm swing due to the decreased duration of torque generation.
Arm motion can increase the jump performance and vertical velocity contributes to nearly 2/3 of
the increased height (44). In addition, arm swing influences an onset of early hip torque and
lengthens the duration on the ground. A jump with arm swing slows the hip extension allowing
for more force production. The slowing of hip extension allows longer muscle activation to
escalate therefore allows for greater force production and more work generation (67). Larger the
torque value at the hip and knee result in larger mean downward vertical forces applied at the
joints. The no-arm swing jumps produce greater hip and knee extension torques during the
propulsive phase. Once the arms pass the vertical, the shoulder load torque acting on the trunk
become negative, thus affecting the slowing of the angular velocity of the hip and a reduction in
the power output. Arm swing jumps have a reduction in the muscle shorting velocities for the hip
extensors, thus allowing for greater force productions (67). “Jump height can be increased by
arm swing specifically by slowing leg extension permitted muscles to work on favorable region
of the force-velocity curve, thereby allowing them to produce higher forces and to generate
greater work (joint torque augmentation mechanism), and energy contributions from the arm
swing (pull mechanisms) (67)”.

32
O. GENDER DIFFERENCES
O-1. ANTERIOR CRUCIATE LIGAMENT INJURY DURING JUMPS
Anterior cruciate ligament (ACL) injuries are among the most common knee injuries
observed in athletes (4, 11, 66, 158). The ACL is considered an important ligament that limits
anterior movement and rotation of the tibia during activity (62, 177). Seventy percent of all ACL
tears happen in a noncontact mechanism when an athlete rapidly deaccelerates and pivots with a
large amount of torsion while the foot is planted (35, 92, 180, 191, 199, 205). Noncontact ACL
injuries are common in sports such as soccer, basketball, field hockey, and volleyball (4, 11, 66,
158). These sports required a high amount of energy and fatiguing muscular performance. When
fatigue occurs, reaction times to external stimuli are delayed and injuries are more likely to occur
(43). Fatigue is an extrinsic factor affecting the musculoskeletal and neurological systems (22,
43). The system of fatigue seems to create an environment that increases the risk of noncontact
ACL injuries by altering the lower extremity landing strategies. Fatigue has been reported to
result in decreased motor control performance (117, 230), increased knee joint laxity (199, 207,
230) decreased balance skill (117), and decreased proprioception (105, 134, 135, 160, 199).
Muscle fibers have a decreased capacity to absorb energy when fatigued, and altered
neuromuscular function with fatigue which has been shown to increase anterior tibial transition
(200, 206). These effects indicate a decreased capacity for controlling body movement after
fatigue and may indicate fatigue as a contributor to noncontact ACL injuries (22, 105, 178, 195).
ACL tear is a debilitating sports injury with an estimated 80,000 ACL occurrences in the
United States annually (91, 161, 185). The literature unanimously suggests that females are
substantially more susceptible than males in suffering acute noncontact injury of the ACL (10,

33
61, 89, 185). American Orthopaedic Society for Sports Medicine in 1999 issued a consensus
statement suggesting that biomechanical and neuromuscular factors appear to be the most
important factors associated with ACL injury and higher incidents in injury with female athletes
(90, 185). Although ACL tears can occur during bilateral and unilateral landings (30), unilateral
landings are considered more dangerous due to the decreased base of support and the increased
demand required by absorption of the impact of landing. Boden et al. have suggested that ACL
tears occur more commonly during unilateral than bilateral landings (30).
O-2. THEORIES OF GENDER BIOMECHANICAL DIFFERENCES
Although the ACL gender bias is likely multifactorial, three main theories have been
proposed to explain the higher incidence of female ACL injury: the ligament dominance theory
(101), the quadriceps dominance theory (101), and the straight knee landing theory (114). The
ligament dominance theory suggests that the lower extremity muscles do not adequately absorb
the impact of landing, resulting in knee valgus which causes increased loading of the ACL (76,
185). The quadriceps dominance theory suggests that females tend to rely on their quadriceps
more than their hamstrings creating excessive anterior translation of the tibia (76, 104, 115, 185).
The straight knee landing theory suggests that females exhibit less knee flexion at the time of
impact that may lead to ACL injury either by hyperextension or by anterior tibial translation (59,
114, 185).
O-3. GENDER BIOMECHANICAL DIFFERENCES
Several epidemiological studies support the notion that fatigue is a predisposing factor
responsible for increased number of injuries (33, 81, 82, 99, 121, 185). According to Rozzi and

34
colleagues, males and females athletes were fatigued to 25% of original torque with the use of a
isokinetic dynamometer, the researchers found decreased knee proprioception and increased
onset of contraction time for hamstrings and gastrocnemius as subjects preformed a landing task
(199). Chappell et al. suggested that a fatigue protocol of vertical jumps and sprints caused
subjects to land with increased proximal tibia peak anterior shear force and decreased kneed
flexion at the time that peak anterior sheer force occur (43, 185). Muscle fatigue has been shown
to alter the lower extremity biomechanics of healthy individuals (178, 188). Madigan and Pidcoe,
accessed the effects of lower extremity muscle fatigue on drop-landing biomechanics and
documented an increase in performance at the hip to compensate for the weakness created in the
thigh muscles (142).
These biomechanical changes are believed to decrease shock absorption and knee
stabilization during landing. Following quadriceps targeted fatiguing protocol, Augustsson et al.
determined reduction in negative power at the knee and hip during single-leg hop landings (12).
During drop landings, the lower extremity acts to absorb impact and to deceleration the COM
primarily in the vertical direction (181). It appears that the hip extensors are mostly responsible
for controlling the vertical position of the COM and preventing collapse of the knee flexion
when comprised by fatigue of the thigh muscles (59, 155). During cross-cutting tasks, quadriceps
fatigue resulted in increased ankle dorsiflexion movements, and displaced peak knee flexion
angles (43, 178). Hamstring fatigue resulted in decreased peak impact knee flexion moment,
increased internal tibial rotation, and decreased peak ankle dorsiflexion (43, 178). Madigan and
Pidcoe observed that the motor patterns shift proximally and the performance at the hip increases
to compensate for the loss in order to show the downward momentum (142). However high
35
demand is placed on the knees and hips to maintain stability during a single-leg hop landing.
After creating weakness in the quadriceps and other muscles surrounding the knee, a
compensatory adaptation in landing strategy can be observed at the ankle. Peak extension
moment and power to the knee decrease, however, the total amount of knee flexion increases
following fatigue (181).
Moreover, females landed with an external knee valgus moment that was increased in the
post-fatigue condition while males exhibited an external vargus moment. Females also exhibited
a greater external knee flexion moment that the authors suggested may be due to increased
quadriceps contraction, decreased hamstring contraction or a combination of both conditions (43,
185). Fatigue of the hamstrings have resulted in decreased peak impact knee flexion moments,
and increased internal tibial rotation at peak knee flexion and decreased peak ankle dorsiflexion
(22). However, quadricep fatigue results increased peak ankle dorsiflexion moments, decreased
peak knee extension moments, delayed peak knee flexion and delayed peak knee extension
moments, delayed knee flexion and delayed subtalar peak inversion moments (178). More
recently, others found that fatigue results in increased initial and peak knee abduction and
internal rotation motions and peak knee internal rotation, adduction, and abduction moments
with the latter being more pronounced in females (151).
Furthermore, increased knee valgus may produce excessive stress on the inert structures
and lead to traumatic injury, consistent with the ligament dominance theory (76, 102, 185).
Females exhibited greater peak knee valgus than males in variety of athletic activities (74, 109,
124). Females athletes subsequently suffered ACL injury were found to have increased peak

36
knee valgus compared to female athletes who did not injury ACL. Pappas et al. stated that
females land with increased peak knee valgus and VGRF suggested that the stress on the inert
structures can become excessive and lead to traumatic injury (185). Fatigue elicit a similar
response in males and females, resulting in significantly increased peak VGRF, peak foot
abduction, and peak rectus femoris normalized EMG activity (185). Fatigue has been defined as
‘any reduction in the force generating capacity of the total neuromuscular system regardless of
the force required in any given situation’ (23). Recreational athletes preforming unilateral
landings, compared to bilateral landings, exhibit increases in knee valgus and normalized EMG
activity, and decreased knee flexion at initial contact and decreased peak knee flexion(184).
Localized quadriceps and hamstring fatigue also have been found to induce significant changes
in female lower-limb control during crossover cutting tasks (178). Clark et al. analyzed the
fatigability differences between men and women by accessing muscle activity of the thigh
musculature during a knee extension (46). Women appeared to have longer time-to-task failure
during a normal submaximal knee extension (46). Suggesting different fatigue induced muscle
activation patterns between sexes, especially in the rectus femoris (46). Generalized
neuromuscular fatigue has been suggested to increased ACL injury risk during stop jump tasks,
primarily via promotion of potentially hazardous anterior tibial shear loading, particularly in
females (43). Females have executed jump landing movements with more initial-contact ankle
plantar flexion, peak stance-phase ankle supination, peak knee abduction, and peak knee internal
rotation compared with men (151). In addition, women also executed jump landing movements
with larger peak stance-phase external knee adduction, knee abduction, and knee internal rotation
movements and smaller peak external ankle-dorsiflexion moments compared with men (151).
Fatigue causes large increases in initial-contact and peak stance-phase knee abduction and knee

37
internal rotation motions and in peak external knee-adduction, abduction, and internal rotation
moment (151). Lastly, fatigue-induced increases in external knee-abduction moments occur
noticeably earlier and are more pronounced in females than in males, suggestion a potential link
with the increased risk of noncontact ACL injuries observed in women (151).
P. BIOMECHANICS OF JUMP LANDINGS
Microfractures, medial tibial stress syndrome, spinal injuries and other degenerative
changes in joint and articular cartilage in humans also have been suggested to be significantly
increased by the body’s ability to attenuate the associated shock from continual impacts (55, 139,
153). These have been associated to propagate in humans whose lower extremities are subjected
to continual sub-maximal loading. The shock experienced by the body due jump landings must
be attenuated by several structures and mechanisms in the body in joint kinematics and muscular
activity (55, 131, 179). Several studies have reported significant decreases in shock attenuation
with fatigue during running (64, 157, 219). These studies have concluded that there is a
relationship between fatigue and increased heel strike-induced shock waves. It is thought that the
fatigue muscles will be less able to protect the body effectively from impact forces and
predispose the body to impact-related injuries (55). This loss in protection may be due to a
variety of changes that occur with fatigue, including both central and peripheral mechanisms
(55). The greater peak anterior shear force on the proximal tibia due to fatigue is associated with
decreased knee flexion ankle and increased valgus moment (43). The hip generally has the
greatest joint moment and power during two-legged landings, the knee has the greatest joint
excursion and preforms the greatest amount of work (59, 65). The landing strategy changes as
38
fatigue progresses in a way that maintained the same level of shock attenuation (55). During
single leg-landings, shock parameters did not change, however, altered body positions and use of
the hip and ankle may shift the locations of peak stresses (55). The energy absorption in the
lower extremity indicates from the ankle to the hip, but knee dynamics remained the same
despite the fatiguing exercise focusing on the muscle group (55). This may indicate that an
overriding goal of the neuromuscular system is to maintain the functionality of the knee joint in
order to maintain shock attenuation (55).
Q. BIOMECHANICS OF SINGLE LEG JUMPS
Biomechanical analysis of the landing portion of the single-leg hop may provide
insightful information about the lower extremity function in dynamic situations. Single-legged
jump landings have resulted in an increase valgus movement (angle from frontal plane) at the
knee joint, decreased knee flexion, and increase in rectus femoris muscle activity compared to
bilateral landings (35, 184) Increased valgus movement (increased frontal knee angle) and knee
extension are believed to contribute to increased stress on the ACL which may predispose an
individual to sustaining an ACL specific injury (35, 103, 229). The human body absorbs the
GRFs during movements, and if the musculature surrounding the joints are not properly
developed, maintained, or fatigued, it may lead to ligament susceptibility (35, 173). After
fatigue, individuals land with more knee flexion and ankle plantar flexion, display greater
VGRF, and require longer times to stabilize the body after landing (35). Bejaminse et al.
determined that both males and females used a stiff landing strategy following fatigue by landing
with less maximal knee valgus and less knee flexion at initial contact of the single-leg stop-jump,
without changing the hip joint angles (22). The decrease in knee flexion at the initial contact may
39
be an attempt to increase knee stability while relying on the static structures of the knee more
than the dynamic structures following fatigue (22).
Time to stabilization (TTS) is a common measure when researching postural stability and
the function of the ankle and knee (35, 36, 198, 225). Time to stabilization is defined as the
amount of time it takes for an individual to return to baseline, or static state, calculated from the
GRF. TTS is measured across the 3 axes, medial to lateral, anterior to postural, and vertical.
These are reported as individual measures (35).
R. BIOMECHANICS OF DEPTH (DROP) JUMP
A few of exercise for the lower body that have been previously discussed have suggested
that plyometric training could take place under fatigued conditions to maximize task-specific
adaptations. However, there may be an increased impact loads and accelerations when the body
impacts the ground in a fatigued state, as evidence in running (64, 162, 221), increased the risk
of injury (139, 142, 162, 221). Furthermore, when a foot contacts the ground during landings, a
GRF causes a transient acceleration (shock wave), which travels up the musculoskeletal system
from the foot to the head (63, 132, 162). When excessive shock wave is applied from
movements, impact accelerations can cause a number of musculoskeletal overuse injuries. Such
injuries include stress fractures, (159, 232), articular cartilage and joint degeneration (71, 190,
212), and osteoarthritis (190, 223, 231). Moran et al. indicated the relationship between high-
impact accelerations and various injuries (stress fractures, articular cartilage and joint
degeneration, and osteoarthritis), indicated that there an increased risk of injury in performing
plyometric drop jumps (30 and 50 cm) when fatigued through running (170). It is advice to

40
preform drop jumps at 30 cm when fatigued and higher drop jumps (50 cm) when non-fatigued
(170).
S. BIOMECHANICS DURING FATIGUE PROTOCOLS
Quammen et al. compared two fatigue protocols [slow linear oxidative fatigue protocol
(SLO-FP), and functional agility short-term fatigue protocol (FAST-FP)] to determine
biomechanical differences (189). Following fatiguing tasks, individuals appeared to be more
erect or extended position. Landing with the knee in a more extended position is thought to
increase an anterior shear force on the proximal end of the tibia via an increased patellar tendon-
tibia shaft angle (112). Blackburn and Padua have shown that landing with more erect posture
results in increased GRF and subsequent quadriceps activation (26). These participants might
have increased the strain placed on the ACL and increased loading. Decreased joint angles (i.e.
knee flexion) is thought to produce a mechanical disadvantage for the hamstring muscles by
decreasing their angles of pull and reducing the amount of posterior force that can be applied on
the tibia (183, 189). The decreased posterior force allows for an increased anterior translation,
which could increase the load placed on the ACL (183, 189). Quammen found that the FAST-FP
induced changes in frontal-plane hip and knee biomechanics when compared to the SLO-FP. Hip
abduction at peak knee flexion was greater during FAST-FP than during SLO-FP. FAST-FP may
induce greater amount of fatigue to the hip musculature resulting in greater hip abduction (189).
Furthermore FAST-FP produced increased in hip abduction, internal knee adduction moment,
and knee internal rotation, which results in increased valgus loading on the knee joint (35).
Fatigue-induced has been shown to decrease in hip and knee flexion, resulting in more extended
landing posture. Further increasing anterior tibial translation and increasing strain.

41
T. BIOMECHANICS COORDINATION FOLLOWING FATIGUE
Fostier and Nougier described different segment coordination patterns in response to
fatiguing upper limb multi-segment movements during throwing (77). Participants appeared to
increase the rigidity of the system and the proximal-distal segment motion order. Activation
amplitude of the knee extensor and flexor muscle increased at the end of fatiguing exercises, the
pattern of the electromyographic traces remained similar to the observed before fatigue (196).
Bonnard et al. reported that multi-segment movements under fatigue showed that hopping could
be maintained for long periods of time by using two difference strategies (earlier preactivation
and trade-offs between muscles across different joint levels) (31). Stiffness regulation under
fatigue conditions may have an effect on the motion of segments and different coordination
patterns may emerge (87, 195). Under fatigue, the inability of the neuromuscular system to
sustain the required power output around the joint, the segmental coordination of the vertical
jump many be rearrange (70, 195). It is disputed if a of the segmental movement and/or muscle
activation pattern would occur when muscle strength decreases due to fatigue. Following a
vertical jump fatiguing protocol a decline in vertical jump height was observed, however, no
modifications were observed in the proximal-distal sequence (195). Vertical jump performance is
affected by fatigue of the knee extensor muscle, but not by fatigue of knee flexors (196). Despite
the decrease in VJH, the subjects appeared to use a robust pattern which ensured consistent
responses to generate maximal performance. The same strategy was followed before and after a
fatigue protocol.
42
U. LANDING ERROR SCORING SYSTEM
The Landing Error Scoring System (LESS) is a clinical assessment tool that was
developed to provide a standardized instrument to identify subjects displaying jump-landing
biomechanics that potentially place them at risk for noncontact ACL injury (182). The LESS
may be used as a clinical assessment tool to use during large-scale screening to identify those at
risk for noncontact ACL injury and other lower extremity injury (182). It is comprised of two
standard video cameras for identifying potentially high-risk movement patterns (“errors”) during
a jump-landing maneuver (182). Furthermore, to determine and detecting an individual for the
high risk for an ACL injury by the presence of multiple high-risk movement patterns. Individuals
with poor (high) LESS scores demonstrate different lower extremity kinematics and kinetics
across multiple biomechanical factors and in multiple planes of motion. The individuals with
poor jump-landing technique demonstrated less knee and hip flexion motion, more knee valgus
and hip internal rotation, greater knee joint loading (anterior tibial shear force, knee extension
motion, and knee valgus), and greater vertical GRF (182).
V. REPEATED ANAEROBIC JUMP TEST
Repeated jumps protocols are becoming more prevalent for assessing athlete’s anaerobic
power and capacity. The Bosco test is a repeated-jump protocol in which an athlete performance
continuous vertical jumps for a specific duration (typically 60 sec) (32, 154). The jump test was
reported to be suitable to evaluate the power output of leg extensor muscle during natural motion
(32). The test evaluates an athlete’s anaerobic power utilizing SSC actions of the lower
extremity. Bosco test has shown to be strongly related to performance on the Wingate test, the
most commonly used measure of anaerobic power capacity (32, 123, 154). However, the

43
Wingate test is limited to concentric muscle actions, any may not reflect anaerobic processes
utilizing the SSC (106, 154). The SSC activities under fatigue conditions tend to reduce muscle
activation preceding contact and during the concentric phase of the movement, (13, 87, 126).
Angular displacements and velocities are reduced (87, 196), and force production deceases
(208). Reduction in muscular preactivation magnitude may indicate that fatigue in jumping task
impairs stiffness and other lower extremity, which in turn impairs the transfer of elastic energy
for eccentric phase to the concentric phase movement (154). According to Mclean et al. the flight
time was affect early in the jump series (20 sec) than was ground contact time, which was
significantly increased until 50 sec (154). As contact time increases it was assumed that the
coupling between the eccentric and concentric phases of the amortization phase is increased,
which reduces the efficiency of potentiation in performance the task (87, 154). The repeated
jump tests results in decrements in muscle activation, force production, and jumping technique
(154). Furthermore reductions in muscle activation and fight time appeared early in the jumping
protocol, whereas decrements in the force production appeared towards the end of the jump task
(154). When participants appeared to minimize the lower extremity involvement and began to
favor increasing contribution from truck motion (154). McNeal reported that repeated jump
protocols assessing fatigue during SSC activities should last a minimum of 20 sec; however, 40
sec was necessary to observe significant changes to all measured parameters (154).
W. ANAEROBIC SPRINT RUNNING TEST
There are wide variety of anaerobic tests that incorporate different modes of exercise or
movement patterns, which also varying in duration. Currently, the Wingate anaerobic test on a
cycle ergometer is the most used and most reported anaerobic performance test (19, 116, 150).

44
The non-motorized treadmill (NMT) offers a suitable tool for the assessment of all-out sprint
running performance in a controlled setting (133). The NMT offers measurement performance
such as time to peak running speed, distance covered, mean and peak power, mean and peak
velocity, and peak and peak force. A number of sports incorporate running, the NMT is more of
a sport specific anaerobic test. McLain et al. indicated that the 25 sec tethered maximal sprint
using an NMT represents an acceptable and reliable assessment of anaerobic power and capacity
(150). Zemkova and Hamar found that analysis of power during short-term bouts of cycling and
tethered running showed that sprinters performed significantly better and higher power on the
treadmill than cycle ergometer (234). Anerobic performance testing using a 25 sec with a load of
18% on an NMT has been reported to be a suitable method (150). The protocol has been shown
to provide the ability to exert peak anaerobic power and anaerobic capacity, mainly for athletes
whom train and preform weight-bearing activities that include running/sprinting.
X. CONCLUSION
Many studies have been conducted to comprehend the mechanical movements of the
human body during a vertical jump. The biomechanical motion research has observed that a
vertical jump is a complex ballistic multi-joint actions, where the musculature around the lower
extremity joints collectively operate to produce patterned movements (197). The analysis of
muscular function during a vertical jump is complicated due to the interactions of the position of
the body, angle of take-off, muscle involved, eccentric and concentric contractions of antagonist
muscle patterns, and the use of arm movements. The MCS which records the kinetic and
kinematic data provides the leading analysis tool that allows individual analysis of athlete’s
vertical jump signature in retrospect to the force-time curve. Furthermore, the relationship of the

45
kinetic and kinematic data provides the best representation of the forces generated by the body;
thus, allowing the researcher to quantify results. Segments and joints can further alter the forces
generated, particularly the upper limbs, which can influence the overall force-time curve.
Several studies support the notion that fatigue is a predisposing factor that is responsible
for the increased number of injuries Musculoskeletal injuries are common in sports which
require a high amount of energy and fatiguing muscular performance. The system of fatigue
increases the risk of noncontact injuries by altering the lower extremity landing strategies.
Biomechanical changes are believed to decrease shock absorption and knee stabilization during
landing. Furthermore, the shock experiences by the human body absorbs the GRFs during the
movements, and if the musculature surrounding the joints are not properly developed,
maintained, or fatigued, it may lead to ligament susceptibility. Understanding of the body
segments in motion during a vertical jump and following fatiguing tasks allows for improvement
in performance.
46
II. CHAPTER II – INTRODUCTION
Improvements in motion capture systems (MCS) have led to analytical tools that allow
detailed analyses of the counter-movement vertical jumps (CMVJ), and to determine the vertical
displacement of the center of mass (COM) (72, 73, 97, 136). MCS has been used to assess an
individual’s upper-and lower-body motions, both explosive and functional in nature. A MCS
allows derivation of the individual joint torques and the net ground reaction force (GRFs)
produced. Additionally, a markerless MCS quantifies the kinetic and kinematic movement of
body segments and joints which influence the forces generated, and the enhancement of
performance during a CMVJ with an arm swing (79, 171, 187). Advancements in MCS and
screening protocols is capable of identified American football athletes at high-risk for non-
contact season-ending injuries (172).
Vertical jumps (VJ) are commonly performed in many sports skills and athletic events
resulting in the incorporation of jump variations or sport specific motions into the training of
athletes. The VJ is well-recognized essential component of successful athletic performance. The
VJ relies upon the ability of involved muscles to actively synchronize to raise the COM of the
body. The VJ test was originally designed by Dr. D.A. Sargent in 1921 to test the physical
health status of an individual by examining the relationship of bodily movements and vital
functions (201). The CMVJ has been extensively used as a measurement of lower-body power
to label the increased performance among athletes. Typically, in the athletic performance
settings, coaches and teachers use a variety of devices to measure lower-body power and VJH,
however, evaluation of biomechanical of lower-muscular fatigue during CMVJ testing has not
been evaluated.

47
There are wide variety of anaerobic tests that incorporate different modes of exercise or
movement patterns, which also varying in duration. Repeated jumps and sprinting protocols are
becoming more prevalent for assessing athlete’s anaerobic power and capacity. The Bosco test is
a repeated-jump protocol in which an athlete performance continuous vertical jumps for a
specific duration (typically 60 sec) (32, 154). The jump test was reported to be suitable to
evaluate the power output of leg extensor muscle during natural motion (32). Currently, the
Wingate anaerobic test on a cycle ergometer is the most used and most reported anaerobic
performance test (19, 116, 150). However, a number of sports incorporate running. McLain et al.
indicated the non-motorized treadmill (NMT) (typically 25 sec with resistance of 18% body
weight) offers a suitable tool for the assessment of all-out sprint running performance to provide
the ability to exert peak anaerobic power and anaerobic capacity, mainly for athletes whom train
and preform weight-bearing activities that include running/sprinting in a controlled setting (150).
Anterior cruciate ligament (ACL) injuries are among the most common knee injuries
observed in athletes (4, 11, 66, 158). The ACL is considered an important ligament that limits
anterior movement and rotation of the tibia during activity (62, 177). Seventy percent of all ACL
tears happen in a non-contact mechanism when an athlete rapidly deaccelerates and pivots with a
large amount of torsion while the foot is planted (35, 92, 180, 191, 199, 205). Non-contact ACL
injuries are common in sports such as soccer, basketball, field hockey, and volleyball (4, 11, 66,
158). These sports required a high amount of energy and fatiguing muscular performance. When
fatigue occurs, reaction times to external stimuli are delayed and injuries are more likely to occur
(43). Fatigue is an extrinsic factor affecting the musculoskeletal and neurological systems (22,
43). The system of fatigue seems to create an environment that increases the risk of non-contact

48
ACL injuries by altering the lower extremity landing strategies. Fatigue has been reported to
result in decreased motor control performance (117, 230), increased knee joint laxity (199, 207,
230) decreased balance skill (117), and decreased proprioception (105, 134, 135, 160, 199).
Muscle fibers have a decreased capacity to absorb energy when fatigued, and altered
neuromuscular function with fatigue which has been shown to increase anterior tibial transition
(200, 206). These effects indicate a decreased capacity for controlling body movement after
fatigue and may indicate fatigue as a contributor to noncontact ACL injuries (22, 105, 178, 195).
Chappell et al. suggested that a fatigue protocol of vertical jumps and sprints caused subjects to
land with increased proximal tibia peak anterior shear force and decreased kneed flexion at the
time that peak anterior sheer force occur (43, 185). Muscle fatigue has been shown to alter the
lower extremity biomechanics of healthy individuals (178, 188). Madigan and Pidcoe, accessed
the effects of lower extremity muscle fatigue on drop-landing biomechanics and documented an
increase in performance at the hip to compensate for the weakness created in the thigh muscles
(142). Further evaluation and understanding the biomechanical changes in performance will give
future insight into how fatigue can be rated and prevent fatigue related injuries.
A. Problem Statement
The notion that fatigue is a predisposing factor responsible for the increased number of
musculoskeletal injuries is common in sports. The system of fatigue increases the risk of non-
contact injuries by altering the lower extremity takeoff and landing strategies. Biomechanical
changes are believed to decrease shock absorption and knee stabilization during landing.
Furthermore, the shock experiences by human body absorbs the GRFs during movements, and
if the musculature surrounding the joints are not properly developed, maintained, or fatigued, it

49
may lead to ligament susceptibility. Furthermore, evaluation of acute biomechanical fatigue
rates may determine when an athlete is able to return to sport following rehabilitation.
B. Purposes
The purposal of the present study is to determine the acute biomechanical alterations on
total-body following VJ fatiguing and sprint fatiguing tasks. Understanding acute total-body
biomechanical fatigue may further provide information for understanding when an athlete begins
altering mechanics to sustain performance.

50
III. CHAPTER III - METHODS
A. Experimental Approach to the Problem
To determine the acute biomechanical performance alterations of the lower extremities
following acute fatiguing protocols. Specifically, a markerless three-dimensional (3-D) video
motion capture system (MCS) and force place will be used to compare the kinetic and kinematic
changes in performance following a variety of fatiguing protocols. An experimental with-in
subjects design will be used to compare performance decrements.
B. Subjects
Eleven healthy, recreationally active women (�̅�±SD; age=20.81.1 yrs., hgt.=172.27.4
cm, wgt=68.07.2 kg) and eleven men (age=23.02.6 yrs., hgt.=180.34.8 cm, wgt.=80.47.3
kg) volunteered for this investigation (Table 1).
All subjects were physically active a minimum of one hour for three days a week for at
least the preceding three months. None of the participants reported a history of current or prior
neuromuscular diseases or musculoskeletal injuries specific to the ankle, knee, or hip joints.
Subjects demonstrated functional range of motion in hip, knee, ankle, and shoulder joints without
Table 1. Descriptives Characteristics
Mean ± SD Subjects (#) Age (yrs) Height (cm) Weight (kg)
Females 11 20.8 ± 1.1 172.2 ± 7.4 68.0 ± 7.2
Males 11 23.0 ± 2.6 180.3 ± 4.8 80.4 ± 7.3

51
limiting mechanical motion and performance during a VJ and running. This study was approved
by the University’s institutional review board for human subjects’ research. Each subject read
and signed an informed consent form and completed a health history questionnaire prior to
participating.
C. Procedures
Each subject visited the laboratory for four visits, one familiarization session, one control
session, and two experimental sessions. The familiarization consisted of subjects signing
informed consents, vertical jump and sprint screening, a warm-up protocol, practice of light
fatiguing protocols, and completion of the performance movement analysis (PMA). During the
experimental session, subjects completed a 10-min standardized warm-up protocol followed by
performing the pre-test PMA, starting with the jump motions, followed by the squat motions, and
then the remaining motions. The subjects preformed one of the three randomized acute fatiguing
protocols (i.e. control session, modified jump test, 25-second sprint test) followed by the post-
test PMA (Figure 1). Each subject completed 1 session per week at the same time of day. The
laboratory temperature (75-82°F) and humidity (38-42%) remained in a consistent range.
Figure 1.

52
D. Performance Motion Analysis
The Performance Motion Analysis (PMA) is a collection of nineteen different motions to
assess an individual’s upper extremity and lower extremity. The motions include shoulder ranges
of motion (ROM) (i.e. shoulder abduction and adduction, shoulder horizonal abduction, shoulder
internal and external rotation, shoulder flexion and extension), trunk rotation, bilateral overhead
squat, right and left unilateral squat, right and left leg lunge, right and left balance test, bilateral
CMVJ, right and left unilateral CMVJ, concentric VJ, 5 right leg and 5 left leg VJs, and depth
jump. All nineteen motions are incorporated into the PMA report.
The motions believed to be most affected by the acute fatigue were tested first. During
the experimental sessions the PMA began with the jump motions followed by the squat motions.
The order of the PMA during the experimental sessions is the following: bilateral CMVJ, right
and left unilateral CMVJ, concentric VJ, 5 right leg and 5 left leg VJs, and depth jump, bilateral
overhead squat, right and left unilateral squat, right and left leg lunge, right and left 20-sec
balance test, shoulder abduction and adduction, shoulder horizonal abduction, shoulder internal
and external rotation, shoulder flexion and extension, trunk rotation.
E. Performance Motion Analysis Scores
The 192 variables collected from the kinetic and kinematic variables during the 19
motions of the PMA were used to calculated six different analysis scores focusing on certain
movement variables. These scores consist of the Composite Score, Power, Score, Strength,
Score, Dysfunction Score, Exercise Readiness Score, and Vulnerability Score (Figure 2). The

53
Composite Score is a cumulative score based on the overall performance, (Power Score +
Functional Strength Score – Dysfunction Score). The Power Score consists of data from jump
heights and is an aggregate of all the jump performances. The Functional Strength Score is the
accumulation of squat depths and is an aggregate of all the squat performances. The Dysfunction
Score consists of asymmetries (upper limb, lower limb, and trunk), knee valgus, lower limb
kinetic chaining, and balance performances. The Exercise Readiness Score (ERS) is a scale that
the depicts the level of training and readiness. The score consists of three factors: rebalance,
development, and optimize. The rebalance (level 1) is to remove compensations and find
symmetry between right and left upper and lower extremities consisting of unilateral forces, joint
flexions and joint torques. Which the individual is depicted in the structuring phase and to focus
on basic mechanics. The development (level 2) is that the individual is on the right path and
needs to continue to the development, which the displays kinetic and kinematic symmetry and
the individual is in developmental performance phase. The optimize (level 3) is that the
individual needs to maintain, which the individual is displaying mechanics of peak performance.
The Vulnerability Score is the aggregate of the overall performances, stresses (consisting of
unilateral high forces, joint flexions and joint torques), and compensation patterns (overuse of
dominant side or limited usage due to history of an injury). This score is presented as a
percentage of 0-100%.
Mosier et al. has previously indicated from a k-means cluster analysis that vulnerability
score >60, MCS composite score <1800, functional strength and power score difference of ≥350
points, and joint torque differences greater than 30%, has indicated American collegiate football
athletes as a high risk for non-contact season-ending injuries (172). Of the 5 athletes indicated as

54
a high risk for injury, three suffered a non-contact season-ending injury to the lower-extremities.
Although two individuals were reported as false positives, there were no false negatives (i.e.,
suffered a season-ending non-contact injury but not identified by the MCS testing).
Shoulder abduction and Adduction
Combination of power score, strength score, and dysfunction score. Shoulder Horizontal Abduction
(power + strength - dysfunction) Shoulder Internal and External Rotation
Shoulder Flexion and Extension
Trunk Rotation
Bilateral (Overhead) Squats
Right Unilateral Squat
Left Unilateral Squat
Right Leg Lunge
Left Leg Lunge
Asymmetry, valgus, kinetic chaining, balance performances. Right Leg (20 sec) Balance Test
Left Leg (20 sec) Balance Test
Bilateral CMVJ
Right Unilateral Vertical Jump
Legft Unilateral Vertical Jump
Concentric Vertical Jump
5 Right Leg Vertical Jumps
5 Left Leg Vertical Jumps
Depth Jump
Scale of 0-100%.
if score >60% has been shown as high risk for injury.
Develop: (level 2) is the individual is on the right path and needs to
continue to the development, which the individual displays kinetic
and kinematic symmetry and is in developmental performance phase.
Optimize: (level 3) is the individual needs to maintain, which the
individual is displaying peak performance mechanics.
Aggregate of the overall performances, stresses (consisting of
unilateral high forces, joint flexions and joint torques), and
compensation patterns (overuse of dominant side or limited usage due
to history of an injury).
Scale of three levels consisting of rebalance, development, and
optimize.
Vulnerability Score
Figure 2. Functional/Performance Motion Analysis
Accumulation of jump heights, and aggregate of all of jump
performance metrics.
Functional Strength Score
Accumulation of squat depths, and aggregate of all squat performance
metrics.
Dysfunction Score
Exercise Readiness Score
Score Definitions Motions
Composite Score
Power Score
Rebalance: (level 1) is to remove compensations and find symmetry
between right and left upper and lower extremities consisting of
unilateral forces, joint flexions and joint torques. Which the
individual is in the structuring phase and focus on basic mechanics.

55
F. Acute Fatigue Protocols
F-1. Warm-up Protocol. Each subject was instructed through a 10-min dynamic warm-up
at the beginning of each experimental session. The warm-up consisted in the order of 10
quadricep pull to romanian deadlift reach, 10 tin soldiers, 10 figure 4, 10 walking lunges with a
T-spine, 5 inchworms, forward skip with forward arm circles, backward skip with backward arm
circles, forward skip with hip internal rotation, backward skip with hip external rotation, A-skip,
A-skip to squat, and 10 body weight squats.
F-2. Control Session. Each subject was instructed to sit for 15 min. The PMA was
completed before the rest period in order of the jump motions, followed by squat motions, and
remaining PMA motions. The PMA was completed following the blood samples which was
collected for lactate determination pre- and 2.5 min post-control period. In addition, heart rate
was collected throughout the entire session.
F-3. Modified Jump Test. Each subject was instructed to bend the knee to about 90
degrees and jump explosively, and repeat immediately on landing for one set (15 sec jumping, 15
sec rest, 15 sec jumping, 15 sec rest). Each subject completed 5 sets. The PMA was completed
before the jump test. The PMA was again completed following the blood samples which was
collected for lactate determination pre- and 2.5 min post-jump test. In addition, heart rate was
collected throughout the entire session. This fatigue test was used based on accumulated lactate
responses during pilot investigations the modified jump test was determined to be more fatiguing
than the Bosco 60 sec jump test.

56
F-4. 25-Second Sprint Test. Each subject was attached to the resistive harness of a non-
motorized treadmill (NMT) (Woodway Force 3.0 treadmill, Waukesha, WI), which was set to a
resistance equal to 18% of the subject’s body weight. Subjects carried out a 25-sec maximal
sprint on the Woodway treadmill (150). The PMA was completed before the sprint test in the
order of jump motions, followed by squat motions, and remaining motions. The PMA was again
completed following the blood samples which were collected for lactate determination pre- and
2.5 min post-sprint test. In addition, heart rate was collected throughout the entire session.
G. Blood Samples
Each subject gave three minimal blood samples (approximately one drop) at each testing
session (baseline, pre, and post) by way of a lancet finger stick. Fingertip samples were collected
into a lactate testing strip for analysis via a Lactate Plus handheld blood lactate analyzer.
Samples were collected immediately prior to the PMA, before the randomized experimental test,
and 2.5-min post jump or sprint tests.
H. Performance Tests
H-1. Motion Capture Device. During each PMA motion the kinetic and kinematic
variables were collected, and analyzed using the DARI (DARI Motion, Scientific Analytics,
Lincoln NE) 3D markerless MCS system (169). Anthropometric estimates (58) were used to
estimate the segmental COMs. In addition, full body GRFs and extremity joint kinematics were
assessed. This 3D MCS has been shown to validly measure full body and segmental kinetics and
kinematics without a force plate or video, thus providing accurate performance measures (79,
57
187). In addition, this system has been used to determine the contribution of the upper
extremities during a CMVJ (171).
H-2. Force Plate Device. During each squat and jump motions the kinetic variables was
collected and analyzed using a uni-axial force plate (Rice Lake Weighing Systems, Rice Lake,
WI) through a data acquisition system (Biopac MP 150 System, Goleta, CA) sampling at 1000
Hz was used to monitor the ground reaction force (GRF). In addition, the modified jump test
was collected and analyzed to determine flight time and positive impulse with a sampling rate at
1000 Hz.
H-3. Non-motorized Treadmill. During the 25-sec sprint test the kinetic variables was
collected on the non-motorized treadmill (NMT) (Woodway Force 3.0 treadmill, Waukesha,
WI), which was set to a resistance equal to 18% of the subject’s body weight.
I. Statistical Analyses
Statistical analyses were conducted for the performance measures using the scores
(Composite Score, Power Score, Functional Strength Score, Dysfunction Score, Exercise
Readiness Score, and Vulnerability Score) x conditions (VJ, Sprint, CON) x time (pre-test, post-
test) x between sex (females, males) repeated measures MANOVA. A Pearson correlation matrix
was used to compare the relationship between each of the PMA Scores during the familiarization
session. Two-way ANOVAs were used to examine the differences in HR [condition (VJ, Sprint,
CON) x time (pre-test, post-test)]. In addition, 2-way ANOVAs were used to examine the

58
differences in accumulated lactate [condition (VJ, Sprint, CON) x time (pre-test, 2.5 min post-
test)]. Paired samples t-tests were used to examine the differences in flight times and positive
impulses of the second jump of set 1 and last jump of set 10 during the modified jump test. These
VJs were selected to include the VJ rebound and the next CMVJ. Post hoc comparisons were
conducted when needed using the Bonferroni correction. The level of significant was set to P ≤
0.05 for the statistical tests. Statistical analyses were performed using SPSS 24 (IBM
Corporation, Amonk, New York USA) and Microsoft Excel 2016 (Microsoft Corporation,
Redmond WA, USA).

59
IV. CHAPTER IV - RESULTS
Table 2 lists the X̅ ± SD and pre- and post-test significance levels for the PMA Scores for
each pre-test and post-test during each condition. The Pearson correlations matrix (table 3)
indicated moderate to strong correlations between the PMA Scores, indicating that the PMA
Scores should be analyzed via a MANOVA (score x condition x time x sex). The MANOVA
indicated a three-way interaction (score x condition x time). Follow-up analyses indicated
significant differences between pre-and post-tests for the Composite Score, Power Score, and
ERS during the VJ experimental sessions.
Table 4 lists the HR during the pre- and post-tests, and accumulated lactate during the
pre- and 2.5 min post-tests. Two-way ANOVAs indicated a significant interaction (condition x
HR). Follow-up analysis indicated the post-test HR was significantly greater than the pre-tests.
Furthermore, the VJ and Sprint conditions were significantly greater compared to the CON
during the post-tests. In addition, 2-way ANOVA indicated a significant interaction (condition x
time for lactate) (table 4). Follow-up analysis indicated the post-test lactate were significantly
greater compared to the pre-tests, and the VJ and Sprint conditions were significantly greater
than the CON.
Table 5 lists the number of jumps, flight time, and positive impulse X̅ ± SD of set 1 and set 10
during the modified jump test. The paired samples t-tests indicated the flight time and positive
impulse during the last vertical jump during set 10 were significantly less than the second jump
of set 1 (table 5).

60
Table 6 lists the force, velocity and power during the 25-sec non-motorized sprint tests.
Females and males exhibited a reduction in power (Females, -47.36 ± 12.15) (Males, -66.24 ±
11.04) and velocity (-24.32 ± 6.77) (-33.86 ± 10.80). Table 7 lists the fatigue rates for each PMA
score per condition. The fatigue scores indicated the greatest reduction in the Composite Score,
Power Score, and ERS, during the VJ session.
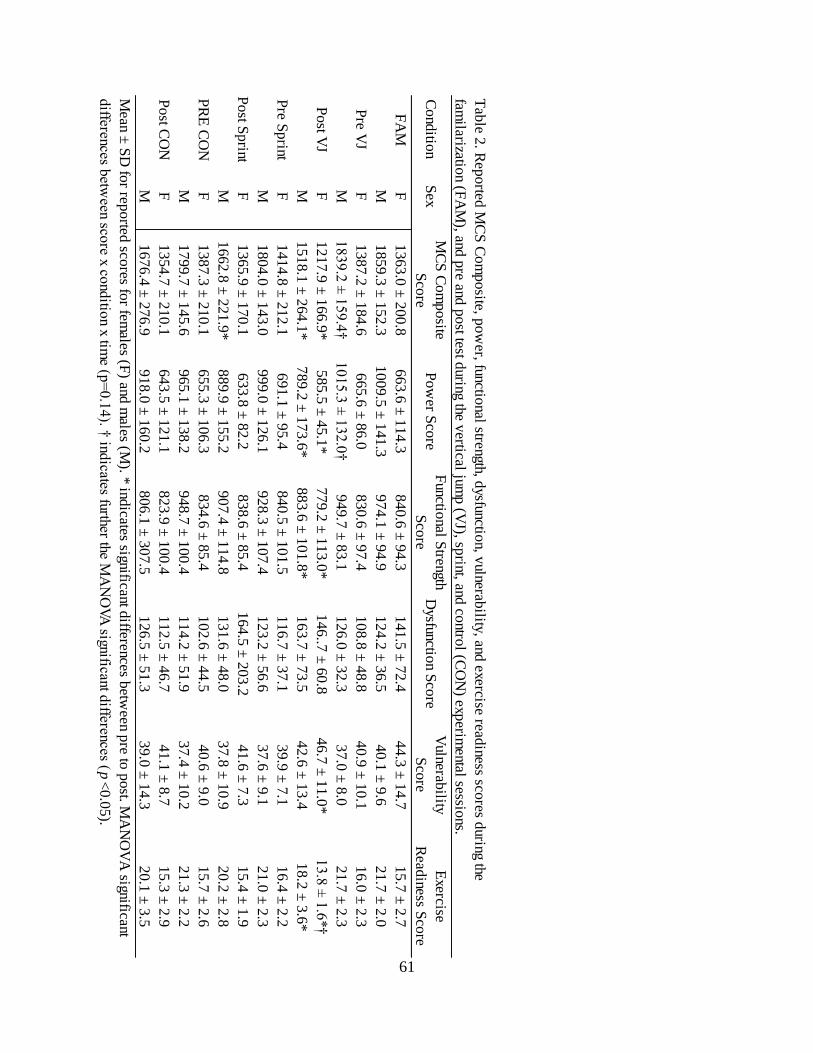
61
FA
MF
1363.0
± 2
00.8
663.6
± 1
14.3
840.6
± 9
4.3
141.5
± 7
2.4
44.3
± 1
4.7
15.7
± 2
.7
M1859.3
± 1
52.3
1009.5
± 1
41.3
974.1
± 9
4.9
124.2
± 3
6.5
40.1
± 9
.621.7
± 2
.0
Pre V
JF
1387.2
± 1
84.6
665.6
± 8
6.0
830.6
± 9
7.4
108.8
± 4
8.8
40.9
± 1
0.1
16.0
± 2
.3
M1839.2
± 1
59.4
†1015.3
± 1
32.0
†949.7
± 8
3.1
126.0
± 3
2.3
37.0
± 8
.021.7
± 2
.3
Post V
JF
1217.9
± 1
66.9
*585.5
± 4
5.1
*779.2
± 1
13.0
*146..7
± 6
0.8
46.7
± 1
1.0
*13.8
± 1
.6*†
M1518.1
± 2
64.1
*789.2
± 1
73.6
*883.6
± 1
01.8
*163.7
± 7
3.5
42.6
± 1
3.4
18.2
± 3
.6*
Pre S
F1414.8
± 2
12.1
691.1
± 9
5.4
840.5
± 1
01.5
116.7
± 3
7.1
39.9
± 7
.116.4
± 2
.2
M1804.0
± 1
43.0
999.0
± 1
26.1
928.3
± 1
07.4
123.2
± 5
6.6
37.6
± 9
.121.0
± 2
.3
Post S
F1365.9
± 1
70.1
633.8
± 8
2.2
838.6
± 8
5.4
164.5
± 2
03.2
41.6
± 7
.315.4
± 1
.9
M1662.8
± 2
21.9
*889.9
± 1
55.2
907.4
± 1
14.8
131.6
± 4
8.0
37.8
± 1
0.9
20.2
± 2
.8
PR
E C
ON
F1387.3
± 2
10.1
655.3
± 1
06.3
834.6
± 8
5.4
102.6
± 4
4.5
40.6
± 9
.015.7
± 2
.6
M1799.7
± 1
45.6
965.1
± 1
38.2
948.7
± 1
00.4
114.2
± 5
1.9
37.4
± 1
0.2
21.3
± 2
.2
Post C
ON
F1354.7
± 2
10.1
643.5
± 1
21.1
823.9
± 1
00.4
112.5
± 4
6.7
41.1
± 8
.715.3
± 2
.9
M1676.4
± 2
76.9
918.0
± 1
60.2
806.1
± 3
07.5
126.5
± 5
1.3
39.0
± 1
4.3
20.1
± 3
.5
Mean ±
SD
for rep
orted
scores fo
r females (F
) and m
ales (M). * ind
icates significant differences b
etween p
re to p
ost. M
AN
OV
A significant
differences b
etween sco
re x cond
ition x tim
e (p=
0.1
4). †
indicates further the M
AN
OVA
significant differences (p
<0.0
5).
Exercise
Read
iness Sco
re
Vulnerab
ility
Sco
reD
ysfunction S
core
Functio
nal Strength
Sco
reP
ow
er Sco
reM
CS
Com
posite
Sco
reS
exC
ond
ition
Tab
le 2. R
eported
MC
S C
om
posite, p
ow
er, functional strength, d
ysfunction, v
ulnerability, and
exercise readiness sco
res during the
familarizatio
n (FA
M), and
pre and
post test d
uring the vertical jum
p (V
J), sprint, and
contro
l (CO
N) exp
erimental sessio
ns.
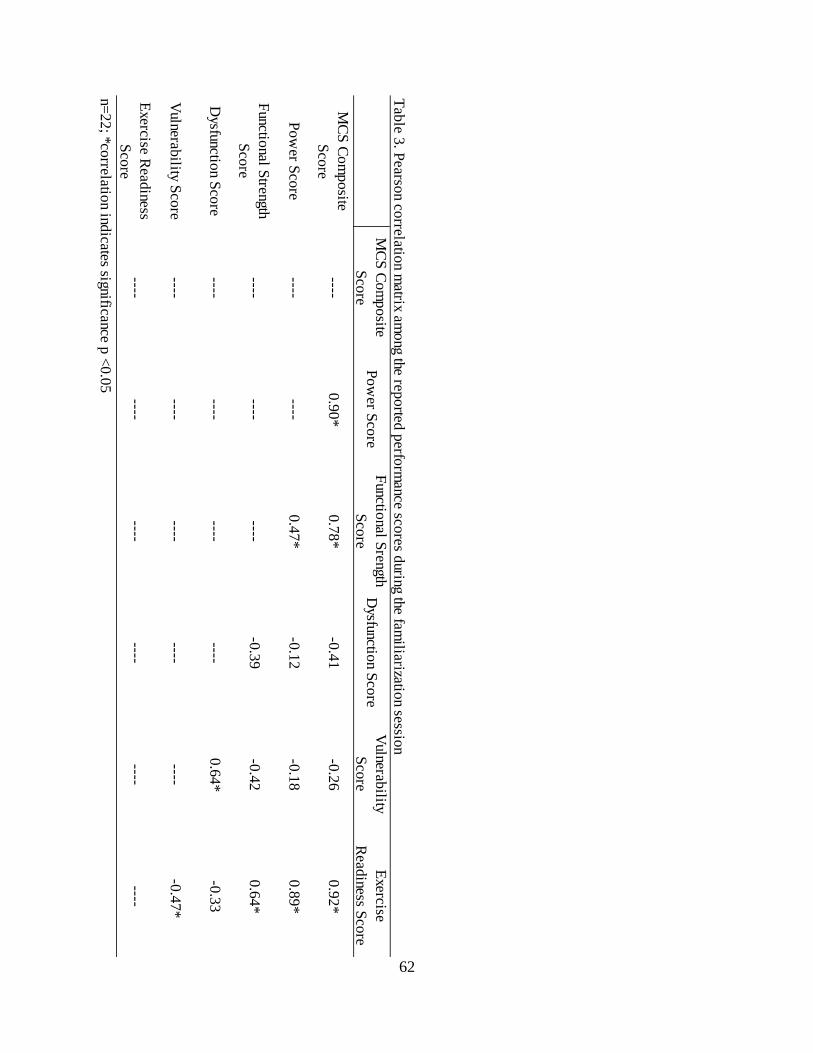
62
Tab
le 3. P
earson co
rrelation m
atrix among the rep
orted
perfo
rmance sco
res during the fam
iliarization sessio
n
n=22; *co
rrelation ind
icates significance p <
0.0
5
Exercise R
eadiness
Sco
re
Vulnerab
ility Sco
re
Dysfunctio
n Sco
re
Functio
nal Strength
Sco
re
Pow
er Sco
re
MC
S C
om
posite
Sco
re
--------
--------
--------
-0.4
7*
--------
--------
----
-0.3
30.6
4*
--------
--------
0.9
0*
----0.7
8*
----
--------
0.4
7*
-0.1
80.8
9*
0.9
2*
-0.2
6-0
.41
-0.1
2
0.6
4*
-0.4
2-0
.39
--------
Exercise
Read
iness Sco
re
MC
S C
om
posite
Sco
reP
ow
er Sco
reF
unctional S
rength
Sco
reD
ysfunction S
core
Vulnerab
ility
Sco
re

63
Condition Sex Pre Post Pre 2.5 min Post
VJ F 80.9 ± 15.5 183.9 ± 12.8*† 2.6 ± 1.7 11.2 ± 2.4*†
M 69.9 ± 10.5 171.2 ± 23.9*† 2.1 ± 1.2 13.6 ± 1.8*†
Sprint F 79.3 ± 18.9 168.5 ± 30.8*† 2.5 ± 1.6 10.7 ± 2.0*†
M 75.1 ± 10.0 176.6 ± 8.8*† 3.3 ± 3.0 14.8 ± 3.0*†
CON F 75.4 ± 18.9 74.7 ± 6.4 1.7 ± 0.5 3.1 ± 2.9
M 81.6 ± 17.0 86.7 ± 11.9 3.2 ± 2.5 2.3 ± 2.2
Heart rate and change in accumulated lactate for females (F) and males (M). * indicates
significant differences between pre to post, † indicates significant differences from the control
(p<0.05).
Heart Rate (bpm)
Table 4. Heart rate and accumulated lactate changes during multiple time points throughout the
vertical jump (VJ), sprint, and control (CON) sessions
Accumulated Lactate (mmol/L)

64
Sex
# o
f Jumps
Flight T
ime (sec)
Positiv
e Impulse (N
·sec)# o
f Jumps
Flight T
ime (sec)
Positiv
e Impulse (N
·sec)
F13.0
± 1
.00.4
± 0
.1250.0
± 4
8.5
13.0
± 1
.00.3
± 0
.0*
161.5
± 5
2.8
* -3
3.7
± 1
2.7
-33.8
± 2
0.4
M14.0
± 1
.00.5
± 0
.0381.4
± 4
6.5
13.0
± 1
.00.3
± 0
.1*
204.1
± 8
0.5
* -4
1.8
± 9
.7 -4
6.2
± 2
0.6
Fem
ales (F), M
ales (M). * ind
icates significant differences b
etween set 1
and set 1
0, (p
<0.0
5), C
hange in flight time and
positiv
e impulse d
uring the selected v
ertical jump
Set 1
Set 1
0
Last Jum
p o
f Set 1
0Jum
p 2
of S
et 1C
hange in Flight
Tim
e (%)
Change in P
ositiv
e
Impulse (%
)
Tab
le 5. V
ertical jump p
erform
ances ± S
D fo
r females (F
) and m
ales (M) d
uring the modifed
vertical jum
p test d
uring the first and last set

65
F70.2
± 7
.5155.4
± 1
5.9
400.4
± 7
6.2
1577.1
± 3
16.4
-47.4
± 1
2.2
2.8
± 0
.33.5
± 0
.5 -2
4.3
± 6
.8
M94.7
± 8
.0190.2
± 1
7.1
716.3
± 1
14.7
2825.2
± 4
39.9
-66.2
± 1
1.0
3.8
± 0
.35.1
± 0
.6 -3
3.9
± 1
0.8
Mean sum
force is the sum
of ho
rizontal and
vertical fo
rces; mean p
ow
er and m
ean velo
city is the average acro
ss the 25 sec sp
rint; peak p
ow
er and p
eak velo
city is the
maxim
um v
alue across the 2
5 sec sp
rint; change in pow
er and change in v
elocity is the d
ifference betw
een the maxim
um p
eak to the last p
eak represented
as a percent
Tab
le 6. S
print p
erform
ance ± S
D o
f females (F
) and m
ales (M) d
uring the 25 sec no
n-moto
rized resisted
sprint test
Distance (m
)S
exC
hange in Velo
city
(%)
Peak V
elocity
(m/s)
Mean V
elocity
(m/s)
Change in P
ow
er
(%)
Peak P
ow
er (W)
Mean P
ow
er (W)
Mean S
um F
orce
(N)

66
VJ
F -1
1.9
± 8
.1 -1
1.4
0±
9.2
-6.2
± 8
.357.9
± 9
6.7
17.2
± 2
3.4
-12.6
± 8
.9
M -1
7.7
± 1
0.1
-22.7
± 1
1.1
-7.0
± 5
.646.0
± 9
4.4
21.4
± 4
7.4
-16.2
± 1
1.8
Sprint
F -3
.0 ±
5.2
-8.0
± 7
.2 -0
.1 ±
6.8
48.7
± 1
70.4
5.3
± 1
8.3
-6.0
± 6
.3
M -7
.7 ±
10.9
-10.6
± 1
3.5
-1.9
± 9
.620.7
± 5
2.0
2.7
± 2
3.9
-3.6
± 1
2.6
Contro
lF
- 2.3
± 1
0.0
-1.0
± 1
7.7
-1.3
± 5
.526.6
± 8
0.5
4.0
± 2
3.4
-2.1
± 1
3.5
M -7
.1 ±
11.3
-5.2
± 3
.9 -1
5.1
± 3
1.6
25.4
± 6
2.7
3.6
± 1
5.5
-6.1
± 1
0.0
Fatigue rate is the d
ifference betw
een the pre sco
re and p
ost sco
re as a percent o
f mean change acro
ss subjects
Cond
ition
Tab
le 7. R
eported
the fatigue rates ± S
D fo
r the MC
S co
mposite, p
ow
er, functional strength, d
ysfunction, v
ulnerability, and
exercise readiness sco
res during the v
ertical jump (V
J), sprint, and
contro
l (CO
N) exp
erimental sessio
n
Exercise
Read
iness Sco
re
Vulnerab
ility
Sco
re
Dysfunctio
n
Sco
reS
trength Sco
reP
ow
er Sco
reM
CS
Com
posite
Sco
reS
ex

67
V. CHAPTER V - DISCUSSION
The notion that fatigue is a predisposing factor responsible for the increased number of
musculoskeletal injuries is common in sports. The currently investigation determined the MCS
was capable of detecting acute lower-body biomechanical changes due to acute fatigue. The
PMA Scores indicate the alterations of performance following the modified jump test. The
decrease in the Power Score can explain and account for the reduction in the Composite Score
since the Power Score is one of the three other scores that accounts for the Composite Score and
is based on the calculation of the Power Score which is an aggregate of VJ measurements. The
decrease in the score can be explained by a reduction in power and velocity due to fatigue onset
following the modified jump test. Although significant changes were not observed for the
Functional Strength Scores, this can be explained by the measurements of the score which is an
aggregate of all squat performances. Although there was an onset of muscle fatigue, the squat
motion mechanics were not affected by the fatiguing tasks. The differences in the Power and
Functional Strength Scores further indicates that high power and velocity movements are the first
to falter and are most susceptible to fatigue. Typically, the strength is maintained unless the
fatigue stimulus is extended for a longer duration (78). The significant decrease in the ERS
following the modified jump test indicates a change in one of the three categories (rebalance,
develop, optimize) used in determining ERS. It is speculated the decrease in ERS is resulted in a
decrease in the optimize score due to the acute decrease in the velocity and power performance.
There were no changes for either the Vulnerability Score and the Dysfunction Score suggesting
that these are more stable scores. Furthermore, the acute VJ fatigue did not significantly affect
the asymmetry, kinetic chaining, compensation, and balance performances. Differences were

68
observed between males and females performance scores, however, both sexes responded in a
similar manner during each fatiguing test.
The PMA fatigue rates indicate the greatest differences in the PMA Score from pre-to
post-test for each condition (Table 7). The fatigue protocols showed significant physiological
changes to confirm that fatigue occurred, further highlighting significant drops in all
performance scores. The greatest decrease in performance was indicated by the Composite
Score, Power Score, and ERS. Furthermore, the greatest decrease in PMA Scores were observed
during the modified jump test. No changes were observed by the Dysfunction Score and
Vulnerability Score, further indicating these are stable scores. Similar fatigue rates in PMA
Scores were indicated for both males and females, indicating biomechanical changes due to
fatigue for both sexes.
The significant increases for HR pre- to post-test and accumulated lactate from pre- to 2.5
min post-test indicates that the modified jump test and resisted sprint tests involved glycolytic
fatigue. In addition, both acute fatiguing tests were significantly different from the CON session.
Similar pre- to post-tests were observed for both fatiguing sessions. Previous research has
indicated blood lactate reaching 15.4 mmol·L following a Wingate test and 8.1 mmol·L
following the Bosco 60 sec jump test (32). Both of these measurements were collected 5 mins
post fatigue exercise. In comparison the modified jump test was more fatiguing than what was
previously reported for the Bosco 60 sec jump test. McLain et al. reported accumulated lactate of
15.8 mmol·L 5 min post following the 25 sec resistance sprint (150). The current investigation
measured accumulated lactate levels 2.5 min post fatigue test to prevent excessive recovery from

69
affecting biomechanical assessment during the post-PMA test. Furthermore, accumulated lactate
indicated that these fatigue tests still indicated significant fatigue responses. Suggested that these
performances were maximal efforts.
There were similar decreases in performance comparing the flight times and the positive
impulse during the modified jump test. Both the flight time and the positive impulse of the 2nd VJ
of set 1 to the last VJ indicated a significant decrease in performance. Equal numbers of VJs per
set were performed by both males and females. Previous literature has reported both a longer
flight time or great positive impulse have indicated a higher VJH (164). Therefore, individuals
spent more time on the ground than time spent in the air. There were similar decreases in
performance following the 25-sec non-motorized resisted sprint test. Previous literature has
reported similar decreases in velocity and power during the 25-sec sprint test (150). A greater
fatigue rate/index (% change) among males was indicated for the modified jump test (i.e. flight
times, positive impulses) and for the 25-sec resisted sprint test (power, velocity).
A. Conclusion
MCS have been used to assess individuals’ upper- and lower-body motions both
explosive and functional in nature. The current investigation demonstrated the viability of the
MCS test to evaluate changes in performance due to the acute fatigue. Differences in PMA
Scores and performances following acute fatigue protocols indicate biomechanical alterations on
the lower-extremities following modified jump test. Similar fatigue indexes and physiological
responses were reported for the modified jump test and the 25-sec non-motorized sprint test. The
PMA Scores indicated decrements in performance are first observed in the decreases in power

70
production during high velocity movements (i.e. VJs). Further research is needed with difference
populations, other fatiguing methods, and impact on performance.
B. Practical Application
Documentation and tracking of changes in performances will give future insights on how
fatigue can be rated and understand the PMA and modified jump test could be applied in
situations related to determine if an individual is ready for exercise. Advancements in technology
and screening protocols may be capable of predicting increased risk of season ending injuries.
This may provide the strength and conditioning professional helpful longitudinal information as
an athlete/patient/client progresses through a training program and season.
71
VI. REFERENCES
1. Kulund, D.N., J.B. Dewey, C.D. Brubaker, J.R. Roberts. Olympic weight-lifting injuries.
The Physical and Sports Medicine, 6: 11, 111-119.
2. Abdel-Aziz Y. Karara. HM (1971) Direct linear transformation from comparator
coordinates into object-space coordinates in close-range photogrammetry. Proceedings of
the S_vmp0 rium on C lose-Rarige Phomgramrnerry Falls Church VA: American Society
of Photogrammetry, 1971.
3. Acero RM, Sánchez JA, and Fernández-del-Olmo M. Tests of vertical jump:
Countermovement jump with arm swing and reaction jump with arm swing. Strength &
Conditioning Journal 34: 87-93, 2012.
4. Agel J, Olson DE, Dick R, Arendt EA, Marshall SW, and Sikka RS. Descriptive
epidemiology of collegiate women's basketball injuries: National Collegiate Athletic
Association Injury Surveillance System, 1988–1989 through 2003–2004. Journal of
athletic training 42: 202, 2007.
5. Alemany JA, Pandorf CE, Montain SJ, Castellani JW, Tuckow AP, and Nindl BC.
Reliability assessment of ballistic jump squats and bench throws. The Journal of Strength
& Conditioning Research 19: 33-38, 2005.
6. Alexander RM. Sequential joint extension in jumping: Reaction to GJ van Ingen Schenau
(1989). Human movement science 8: 339-345, 1989.
7. Anderson MK and Hall SJ. Sports injury management. Williams & Wilkins, 1995.
8. Aragon-Vargas L and Gross MM. Kinesiological factors in vertical jump performance:
Differences among individuals. Journal of applied Biomechanics 13: 24-44, 1997.

72
9. Aragón LF. Evaluation of four vertical jump tests: Methodology, reliability, validity, and
accuracy. Measurement in physical education and exercise science 4: 215-228, 2000.
10. Arendt E and Dick R. Knee injury patterns among men and women in collegiate
basketball and soccer: NCAA data and review of literature. The American journal of
sports medicine 23: 694-701, 1995.
11. Arendt EA, Agel J, and Dick R. Anterior cruciate ligament injury patterns among
collegiate men and women. Journal of athletic training 34: 86, 1999.
12. Augustsson J, Thomee R, Linden C, Folkesson M, Tranberg R, and Karlsson J. Single‐
leg hop testing following fatiguing exercise: reliability and biomechanical analysis.
Scandinavian journal of medicine & science in sports 16: 111-120, 2006.
13. Avela J and Komi PV. Interaction between muscle stiffness and stretch reflex sensitivity
after long‐term stretch‐shortening cycle exercise. Muscle & nerve 21: 1224-1227, 1998.
14. Baca A. A comparison of methods for analyzing drop jump performance. Medicine and
science in sports and exercise 31: 437-442, 1999.
15. Baker D. Improving Vertical Jump Performance Through General, Special, and Specific
Strength Training: A Brief Review. The Journal of Strength & Conditioning Research
10: 131-136, 1996.
16. Baker D, Wilson G, and Carlyon B. Generality versus specificity: a comparison of
dynamic and isometric measures of strength and speed-strength. European Journal of
Applied Physiology and Occupational Physiology 68: 350-355, 1994.
17. Balsalobre-Fernández C, Glaister M, and Lockey RA. The validity and reliability of an
iPhone app for measuring vertical jump performance. Journal of Sports Sciences 33:
1574-1579, 2015.

73
18. Balsalobre-Fernández C, Tejero-González CM, del Campo-Vecino J, and Bavaresco N.
The concurrent validity and reliability of a low-cost, high-speed camera-based method for
measuring the flight time of vertical jumps. The Journal of Strength & Conditioning
Research 28: 528-533, 2014.
19. Bar-Or O. The Wingate anaerobic test an update on methodology, reliability and validity.
Sports Medicine 4: 381-394, 1987.
20. Barker M, Wyatt TJ, Johnson RL, Stone MH, O'bryant HS, Poe C, and Kent M.
Performance Factors, Psychological Assessment, Physical Characteristics, and Football
Playing Ability. The Journal of Strength & Conditioning Research 7: 224-233, 1993.
21. Basford JR. Weightlifting, weight training and injuries. Orthopedics 8: 1051-1056, 1985.
22. Benjaminse A, Habu A, Sell TC, Abt JP, Fu FH, Myers JB, and Lephart SM. Fatigue
alters lower extremity kinematics during a single-leg stop-jump task. Knee Surgery,
Sports Traumatology, Arthroscopy 16: 400-407, 2008.
23. Bigland-Ritchie B, Johansson R, Lippold O, and Woods J. Contractile speed and EMG
changes during fatigue of sustained maximal voluntary contractions. Journal of
neurophysiology 50: 313-324, 1983.
24. Bishop PA. Measurement and Evaluation: In Physical Activity Application. Scottsdale,
Arizona: Holcomb Hathaway Publishers, Inc., 2008.
25. Blache Y and Monteil K. Effect of arm swing on effective energy during vertical
jumping: experimental and simulation study. Scandinavian journal of medicine & science
in sports 23: e121-129, 2013.
26. Blackburn JT and Padua DA. Sagittal-plane trunk position, landing forces, and
quadriceps electromyographic activity. Journal of athletic training 44: 174-179, 2009.

74
27. Bobbert M, Mackay M, Schinkelshoek D, Huijing P, and van Ingen Schenau G.
Biomechanical analysis of drop and countermovement jumps. European journal of
applied physiology and occupational physiology 54: 566-573, 1986.
28. Bobbert MF and Soest AJKv. Why Do People Jump the Way They Do? Exercise and
Sport Sciences Reviews 29: 95–102, 2001.
29. Bobbert MF and van Ingen Schenau GJ. Coordination in vertical jumping. Journal of
biomechanics 21: 249-262, 1988.
30. Boden BP, Dean GS, Feagin JA, and Garrett WE. Mechanisms of anterior cruciate
ligament injury. Orthopedics 23: 573-578, 2000.
31. Bonnard M, Sirin A, Oddsson L, and Thorstensson A. Different strategies to compensate
for the effects of fatigue revealed by neuromuscular adaptation processes in humans.
Neuroscience letters 166: 101-105, 1994.
32. Bosco C, Luhtanen P, and Komi PV. A simple method for measurement of mechanical
power in jumping. European journal of applied physiology and occupational physiology
50: 273-282, 1983.
33. Bottini E, Poggi E, Luzuriaga F, and Secin F. Incidence and nature of the most common
rugby injuries sustained in Argentina (1991–1997). British Journal of Sports Medicine
34: 94-97, 2000.
34. Bove M, Nardone A, and Schieppati M. Effects of leg muscle tendon vibration on group
Ia and group II reflex responses to stance perturbation in humans. J Physiol 550: 617-
630, 2003.

75
35. Brazen DM, Todd MK, Ambegaonkar JP, Wunderlich R, and Peterson C. The effect of
fatigue on landing biomechanics in single-leg drop landings. Clinical journal of sport
medicine 20: 286-292, 2010.
36. Brown CN and Mynark R. Balance deficits in recreational athletes with chronic ankle
instability. Journal of athletic training 42: 367, 2007.
37. Calhoon G and Fry AC. Injury rates and profiles of elite competitive weightlifters.
Journal of athletic training 34: 232, 1999.
38. Canavan PK, Garrett GE, and Armstrong LE. Kinematic and Kinetic Relationship
Between an Olympic-Style Lift and the Vertical Jump. Journal of Strength and
Conditioning Research 10: 127-130, 1996.
39. Carlock JM, Smith SL, Hartman MJ, Morris RT, Ciroslan DA, Pierce KC, Newton RU,
Harman EA, Sands WA, and Stone MH. The Relationship Between Vertical Jump Power
Estimates and Weightlifting Ability: A Field Test Approach Journal of Strength and
Conditioning Research 18: 534-539, 2004.
40. Carlock JM, Smith SL, Hartman MJ, Morris RT, Ciroslan DA, Pierce KC, Newton RU,
Harman EA, Sands WA, and Stone MH. The Relationship Between Vertical Jump Power
Estimates and Weightlifting Ability: A Field Test Approach. Journal of Strength and
Conditioning Research 18: 534-539, 2004.
41. Caruso J, Daily J, Olson N, Shepherd C, McLagan J, Drummond J, Walker R, and West
J. Reproducibility of vertical jump data from an instrumented platform. Isokinetics and
Exercise Science 19: 97-105, 2011.

76
42. Casartelli N, Müller R, and Maffiuletti NA. Validity and reliability of the Myotest
accelerometric system for the assessment of vertical jump height. The Journal of Strength
& Conditioning Research 24: 3186-3193, 2010.
43. Chappell JD, Herman DC, Knight BS, Kirkendall DT, Garrett WE, and Yu B. Effect of
fatigue on knee kinetics and kinematics in stop-jump tasks. Am J Sports Med 33: 1022-
1029, 2005.
44. Cheng KB, Wang CH, Chen HC, Wu CD, and Chiu HT. The mechanisms that enable arm
motion to enhance vertical jump performance-a simulation study. J Biomech 41: 1847-
1854, 2008.
45. Chiu LZ, Bryanton MA, and Moolyk AN. Proximal-to-distal sequencing in vertical
jumping with and without arm swing. The Journal of Strength & Conditioning Research
28: 1195-1202, 2014.
46. Clark BC, Collier SR, Manini TM, and Ploutz-Snyder LL. Sex differences in muscle
fatigability and activation patterns of the human quadriceps femoris. European journal of
applied physiology 94: 196-206, 2005.
47. Cordova ML and Armstrong CW. Reliability of ground reaction forces during a vertical
jump: implications for functional strength assessment. Journal of athletic training 31:
342, 1996.
48. Cormack SJ, Newton RU, and McGuigan MR. Neuromuscular and endocrine responses
of elite players to an Australian rules football match. International journal of sports
physiology and performance 3: 359-374, 2008.

77
49. Cormack SJ, Newton RU, McGuigan MR, and Cormie P. Neuromuscular and endocrine
responses of elite players during an Australian rules football season. International
Journal of Sports Physiology and Performance 3: 439-453, 2008.
50. Cormie P, McBride JM, and McCaulley GO. Validation of power measurement
techniques in dynamic lower body resistance exercises. Journal of Applied Biomechanics
23: 103-118, 2007.
51. Cormie P, McBride JM, and McCaulley GO. Power-time, force-time, and velocity-time
curve analysis during the jump squat: impact of load. Journal of applied biomechanics
24: 112-120, 2008.
52. Cormie P, McBride JM, and McCaulley GO. Power-time, force-time, and velocity-time
curve analysis of the countermovement jump: impact of training. The Journal of Strength
& Conditioning Research 23: 177-186, 2009.
53. Cormie P, McGUIGAN MR, and Newton RU. Changes in the eccentric phase contribute
to improved stretch-shorten cycle performance after training. Medicine and science in
sports and exercise 42: 1731-1744, 2010.
54. Cormie P, McGuigan MR, and Newton RU. Developing maximal neuromuscular power.
Sports medicine 41: 17-38, 2011.
55. Coventry E, O’Connor KM, Hart BA, Earl JE, and Ebersole KT. The effect of lower
extremity fatigue on shock attenuation during single-leg landing. Clinical Biomechanics
21: 1090-1097, 2006.
56. Cronin JB, Hing RD, and Mcnair PJ. Reliability and validity of a linear position
transducer for measuring jump performance. The Journal of Strength & Conditioning
Research 18: 590-593, 2004.
78
57. Cunningham C, Snow S, Cocke M, Moodie N, Wassom D, and Moodie P. Evaluation of
vertical jump to better understand population health applications. Presented at
International Journal of Exercise Science: Conference Proceedings, 2014.
58. David A. Winter. Biomechanics and Motor Control of Human Movement. A. Wiley.
Interscience Publication John Wiley & Sons. Inc, New York, 1990.
59. Decker MJ, Torry MR, Wyland DJ, Sterett WI, and Steadman JR. Gender differences in
lower extremity kinematics, kinetics and energy absorption during landing. Clinical
biomechanics 18: 662-669, 2003.
60. DeHaven KE and Lintner DM. Athletic injuries: comparison by age, sport, and gender.
The American journal of sports medicine 14: 218-224, 1986.
61. Delfico AJ and Garrett WE. Mechanisms of injury of the anterior cruciate ligament in
soccer players. Clinics in sports medicine 17: 779-785, 1998.
62. DeMorat G, Weinhold P, Blackburn T, Chudik S, and Garrett W. Aggressive quadriceps
loading can induce noncontact anterior cruciate ligament injury. The American journal of
sports medicine 32: 477-483, 2004.
63. Derrick TR. The effects of knee contact angle on impact forces and accelerations.
Medicine and science in sports and exercise 36: 832-837, 2004.
64. Derrick TR, Dereu D, and Mclean SP. Impacts and kinematic adjustments during an
exhaustive run. Medicine & Science in Sports & Exercise 34: 998-1002, 2002.
65. Devita P and Skelly WA. Effect of landing stiffness on joint kinetics and energetics in the
lower extremity. Medicine and science in sports and exercise 24: 108-115, 1992.

79
66. Dick R, Putukian M, Agel J, Evans TA, and Marshall SW. Descriptive epidemiology of
collegiate women's soccer injuries: National Collegiate Athletic Association Injury
Surveillance System, 1988–1989 through 2002–2003. Journal of athletic training 42:
278, 2007.
67. Domire ZJ and Challis JH. An Induced Energy Analysis to Determine the Mechanism for
Performance Enhancement as a Result of Arm Swing During Jumping. Sports
biomechanics / International Society of Biomechanics in Sports 9: 38-46, 2010.
68. Dowling JJ and Vamos L. Identification of kinetic and temporal factors related to vertical
jump performance. Journal of applied biomechanics 9: 95-110, 1993.
69. Earle RW and Baechle TR. NSCA's Essentials of Personal Training. Champaign, IL:
Human Kinetics, 2004.
70. Edwards RH. Human muscle function and fatigue. Human muscle fatigue: physiological
mechanisms: 1-18, 1981.
71. Ewers B, Dvoracek‐Driksna D, Orth M, and Haut R. The extent of matrix damage and
chondrocyte death in mechanically traumatized articular cartilage explants depends on
rate of loading. Journal of Orthopaedic Research 19: 779-784, 2001.
72. Feltner ME, Bishop EJ, and Perez CM. Segmental and kinetic contributions in vertical
jumps performed with and without an arm swing. Res Q Exerc Sport 75: 216-230, 2004.
73. Feltner ME, Fraschetti DJ, and Crisp RJ. Upper Extremity Augmentation of Lower
Extremity Kinetics During Countermovement Vertical Jumps. Journal of Sports Sciences
17: 449-466, 1999.
74. Ferber R, Davis IM, and Williams Iii DS. Gender differences in lower extremity
mechanics during running. Clinical biomechanics 18: 350-357, 2003.
80
75. Ferreira LC, Schilling BK, Weiss LW, Fry AC, and Chiu LZ. Reach height and jump
displacement: Implications for standardization of reach determination. The Journal of
Strength & Conditioning Research 24: 1596-1601, 2010.
76. Ford KR, Myer GD, and Hewett TE. Valgus knee motion during landing in high school
female and male basketball players. Medicine & Science in Sports & Exercise 35: 1745-
1750, 2003.
77. Forestier N and Nougier V. The effects of muscular fatigue on the coordination of a
multijoint movement in human. Neuroscience letters 252: 187-190, 1998.
78. Fry A, Kraemer W, Van Borselen F, Lynch J, Triplett N, Koziris L, and Fleck S.
Catecholamine responses to short-term high-intensity resistance exercise overtraining.
Journal of applied physiology 77: 941-946, 1994.
79. Fry AC, Herda TJ, Sterczala AJ, Cooper MA, and Andre MJ. Validation of a motion
capture system for deriving accurate ground reaction forces without a force plate. Big
Data Analytics 1: 11, 2016.
80. Fuller E, Wassom D, and Moodie N. The Influence Of Visual Focus On Vertical Jump
Height As Determined By A Standard Jump Station Measurement And Marker-less
Motion Capture. Presented at Medicine and science in sports and exercise, 2013.
81. Gabbett T. Incidence of injury in amateur rugby league sevens. British journal of sports
medicine 36: 23-26, 2002.
82. Gabbett TJ. Incidence, site, and nature of injuries in amateur rugby league over three
consecutive seasons. British Journal of Sports Medicine 34: 98-103, 2000.

81
83. García-López J, Morante JC, Ogueta-Alday A, and Rodríguez-Marroyo JA. The type of
mat (Contact vs. Photocell) affects vertical jump height estimated from flight time. The
Journal of Strength & Conditioning Research 27: 1162-1167, 2013.
84. Garcia-Lopez J, Peleteiro J, Rodgriguez-Marroyo J, Morante J, Herrero J, and Villa J.
The validation of a new method that measures contact and flight times during vertical
jump. International journal of sports medicine 26: 294-302, 2005.
85. Glatthorn JF, Gouge S, Nussbaumer S, Stauffacher S, Impellizzeri FM, and Maffiuletti
NA. Validity and reliability of Optojump photoelectric cells for estimating vertical jump
height. The Journal of Strength & Conditioning Research 25: 556-560, 2011.
86. Goertzen M, Schöppe K, Lange G, and Schulitz K. Injuries and damage caused by excess
stress in body building and power lifting. Sportverletzung Sportschaden: Organ der
Gesellschaft fur Orthopadisch-Traumatologische Sportmedizin 3: 32-36, 1989.
87. Gollhofer A, Komi P, Miyashita M, and Aura O. Fatigue during stretch-shortening cycle
exercises: changes in mechanical performance of human skeletal muscle. International
journal of sports medicine 8: 71-78, 1987.
88. Granhed H and Morelli B. Low back pain among retired wrestlers and heavyweight
lifters. The American journal of sports medicine 16: 530-533, 1988.
89. Gray J, Taunton J, McKenzie D, Clement D, McConkey J, and Davidson R. A survey of
injuries to the anterior cruciate ligament of the knee in female basketball players.
International journal of sports medicine 6: 314-316, 1985.
90. Griffin LY. Prevention of noncontact ACL injuries. Amer Academy of Orthopaedic,
2001.

82
91. Griffin LY, Agel J, Albohm MJ, Arendt EA, Dick RW, Garrett WE, Garrick JG, Hewett
TE, Huston L, Ireland ML, Johnson RJ, Kibler WB, Lephart S, Lewis JL, Lindenfeld TN,
Mandelbaum BR, Marchak P, Teitz CC, and Wojtys EM. Noncontact anterior cruciate
ligament injuries: risk factors and prevention strategies. The Journal of the American
Academy of Orthopaedic Surgeons 8: 141-150, 2000.
92. Griffin LY, Albohm MJ, Arendt EA, Bahr R, Beynnon BD, DeMaio M, Dick RW,
Engebretsen L, Garrett WE, and Hannafin JA. Understanding and preventing noncontact
anterior cruciate ligament injuries. The American journal of sports medicine 34: 1512-
1532, 2006.
93. Haff GG, Kirksey KB, Stone MH, Warren BJ, Johnson RL, Stone M, O'bryant H, and
Proulx C. The effect of 6 weeks of creatine monohydrate supplementation on dynamic
rate of force development. The Journal of Strength & Conditioning Research 14: 426-
433, 2000.
94. Hakkinen K. EMG, Muscle Fibre and Force Production Characteristics During a 1 Year
Training Period in Elite Weight-lifters. European Journal of Applied Physiology &
Occupational Physiology 56: 419-427, 1987.
95. Hakkinen K, Komi PV, and Hauhanen H. Electromyographic and Force Production
Characteristics of Leg Extensor Muscles of Elite Weight Lifters During Isometric,
Concentric, and Various Stretch- Shortening Cycle Exercises. International Journal of
Medicine 7: 144-151, 1986.
96. Hamill B. Relative safety of weightlifting and weight training. J Strength Cond Res 8: 53-
57, 1994.

83
97. Hara M, Shibayama A, Takeshita D, Hay DC, and Fukashiro S. A Comparison of the
Mechanical Effect of Arm Swing and Countermovement on the Lower Extremities in
Vertical Jumping. Human movement science 27: 636-648, 2008.
98. Harman EA, Rosenstein MT, Frykman PN, and ROSenStein RM. The effects of arms and
countermovement on vertical jumping. Medicine and science in sports and exercise 22:
825-833, 1990.
99. Hawkins RD, Hulse M, Wilkinson C, Hodson A, and Gibson M. The association football
medical research programme: an audit of injuries in professional football. British journal
of sports medicine 35: 43-47, 2001.
100. Herda TJ, Cooper MA, Andre MJ, Lane MT, Graham ZA, Gallagher PM, Vardiman P,
and Fry AC. Comparison of Ground Reaction Forces Derived from a Force Plate and
Motion Capture System During Body Weight Squats Department of Health, Sport &
Exercise Sciences, Biomechanics Laboratory, Unversity of Kansas
101. Hewett TE, Myer GD, and Ford KR. Prevention of anterior cruciate ligament injuries.
Current women's health reports 1: 218-224, 2001.
102. Hewett TE, Myer GD, and Ford KR. Decrease in neuromuscular control about the knee
with maturation in female athletes. J Bone Joint Surg Am 86-a: 1601-1608, 2004.
103. Hewett TE, Myer GD, Ford KR, Heidt RS, Colosimo AJ, McLean SG, Van den Bogert
AJ, Paterno MV, and Succop P. Biomechanical measures of neuromuscular control and
valgus loading of the knee predict anterior cruciate ligament injury risk in female
athletes. The American journal of sports medicine 33: 492-501, 2005.

84
104. Hewett TE, Stroupe AL, Nance TA, and Noyes FR. Plyometric training in female
athletes: decreased impact forces and increased hamstring torques. The American journal
of sports medicine 24: 765-773, 1996.
105. Hiemstra LA, Lo IK, and Fowler PJ. Effect of fatigue on knee proprioception:
implications for dynamic stabilization. Journal of Orthopaedic & Sports Physical
Therapy 31: 598-605, 2001.
106. Hoffman JR, Epstein S, Einbinder M, and Weinstein Y. A Comparison Between the
Wingate Anaerobic Power Test to Both Vertical Jump and Line Drill Tests in Basketball
Players. The Journal of Strength & Conditioning Research 14: 261-264, 2000.
107. Hoffman JR, Nusse V, and Kang J. The effect of an intercollegiate soccer game on
maximal power performance. Canadian journal of applied physiology 28: 807-817, 2003.
108. Hopkins WG. Measures of reliability in sports medicine and science. Sports medicine 30:
1-15, 2000.
109. Horita T, Komi P, Nicol C, and Kyröläinen H. Effect of exhausting stretch-shortening
cycle exercise on the time course of mechanical behaviour in the drop jump: possible role
of muscle damage. European journal of applied physiology and occupational physiology
79: 160-167, 1999.
110. Hubley C and Wells R. A work-energy approach to determine individual joint
contributions to vertical jump performance. European Journal of Applied Physiology and
Occupational Physiology 50: 247-254, 1983.
111. Hudson JL. Coordination of segments in the vertical jump. Medicine & Science in Sports
& Exercise, 1986.

85
112. Hughes G and Watkins J. A risk-factor model for anterior cruciate ligament injury. Sports
Medicine 36: 411-428, 2006.
113. Hunter JP, Marshall RN, and McNair PJ. Relationships between ground reaction force
impulse and kinematics of sprint-running acceleration. Journal of applied biomechanics
21: 31-43, 2005.
114. Huston LJ, Vibert B, Ashton-Miller JA, and Wojtys EM. Gender differences in knee
angle when landing from a drop-jump. Am J Knee Surg 14: 215-219; discussion 219-220,
2001.
115. Huston LJ and Wojtys EM. Neuromuscular performance characteristics in elite female
athletes. Am J Sports Med 24: 427-436, 1996.
116. Inbar O, Bar-Or O, and Skinner JS. The Wingate anaerobic test. John Wiley & Sons,
1996.
117. Johnston 3rd R, Howard ME, Cawley PW, and Losse GM. Effect of lower extremity
muscular fatigue on motor control performance. Medicine and science in sports and
exercise 30: 1703-1707, 1998.
118. Kawamori N and Haff GG. The optimal training load for the development of muscular
power. The Journal of Strength & Conditioning Research 18: 675-684, 2004.
119. Kawamori N, Rossi SJ, Justice BD, Haff EE, Pistilli EE, O'bryant HS, Stone MH, and
Haff GG. Peak force and rate of force development during isometric and dynamic mid-
thigh clean pulls performed at various intensities. The Journal of Strength &
Conditioning Research 20: 483-491, 2006.
120. Kenney WL, Wilmore JH, and Costill DL. Physiology of Sport and Exercise. Champaign,
IL: Human Kinetics, 2012.

86
121. Kersey RD and Rowan L. Injury account during the 1980 NCAA wrestling
championships. The American journal of sports medicine 11: 147-151, 1983.
122. Kibele A. Possibilities and limitations in the biomechanical analysis of countermovement
jumps: A methodological study. Journal of Applied Biomechanics 14: 105-117, 1998.
123. Kirkendall D and Street G. Mechanical jumping power in athletes. British journal of
sports medicine 20: 163-164, 1986.
124. Kirkendall DT and Garrett WE. The anterior cruciate ligament enigma: injury
mechanisms and prevention. Clinical orthopaedics and related research 372: 64-68,
2000.
125. Klavora P. Vertical-jump tests: a critical review. Strength & Conditioning Journal 22: 70,
2000.
126. Kuitunen S, Avela J, Kyröläinen H, Nicol C, and Komi P. Acute and prolonged reduction
in joint stiffness in humans after exhausting stretch-shortening cycle exercise. European
Journal of Applied Physiology 88: 107-116, 2002.
127. Kujala UM, Kettunen J, Paananen H, Aalto T, Battié MC, Impivaara O, Videman T, and
Sarna S. Knee osteoarthritis in former runners, soccer players, weight lifters, and
shooters. Arthritis & Rheumatism 38: 539-546, 1995.
128. Kulund D, Dewey J, Brubaker C, and Roberts J. Olympic weight-lifting injuries. The
Physician and sportsmedicine 6: 111-119, 1978.
129. Laffaye G and Wagner P. Eccentric rate of force development determines jumping
performance. Computer methods in biomechanics and biomedical engineering 16: 82-83,
2013.

87
130. Laffaye G, Wagner PP, and Tombleson TI. Countermovement jump height: Gender and
sport-specific differences in the force-time variables. The Journal of Strength &
Conditioning Research 28: 1096-1105, 2014.
131. Lafortune MA, Hennig EM, and Lake MJ. Dominant role of interface over knee angle for
cushioning impact loading and regulating initial leg stiffness. Journal of biomechanics
29: 1523-1529, 1996.
132. Lafortune MA, Lake MJ, and Hennig EM. Differential shock transmission response of
the human body to impact severity and lower limb posture. Journal of biomechanics 29:
1531-1537, 1996.
133. Lakomy H. An ergometer for measuring the power generated during sprinting. Presented
at Journal of Physiology at London, 1984.
134. Lattanizio P-J, Petrella RJ, Sproule JR, and Fowler PJ. Effects of fatigue on knee
proprioception. Clinical Journal of Sport Medicine 7: 22-27, 1997.
135. Lattanzio PJ and Petrella RJ. Knee proprioception: a review of mechanisms,
measurements, and implications of muscular fatigue. Orthopedics 21: 463-471, 1998.
136. Lees A, Vanrenterghem J, and Clercq DD. Understanding How an Arm Swing Enhances
Performance in the Vertical Jump. Journal of biomechanics 37: 1929-1940, 2004.
137. Lees A, Vanrenterghem J, and Clercq DD. The Energetics and Benefit of an Arm Swing
in Submaximal and Maximal Vertical Jump Performance. Journal of sports sciences 24:
51-57, 2006.
138. Lees A, Vanrenterghem J, and De Clercq D. Understanding how an arm swing enhances
performance in the vertical jump. Journal of biomechanics 37: 1929-1940, 2004.

88
139. Light L, McLellan G, and Klenerman L. Skeletal transients on heel strike in normal
walking with different footwear. Journal of biomechanics 13: 477-480, 1980.
140. Linthorne NP. Analysis of standing vertical jumps using a force platform. American
Journal of Physics 69: 1198-1204, 2001.
141. Lopez-Segovia M, Marques MC, Tillaar Rvd, and Gonzales-Badillo JJ. Relationships
Between Vertical Jump and Full Squat Power Ouputs with Sprint Times in U21 Soccer
Players. Journal of Human Kinetics 30: 135-144, 2011.
142. Madigan ML and Pidcoe PE. Changes in landing biomechanics during a fatiguing
landing activity. Journal of Electromyography and Kinesiology 13: 491-498, 2003.
143. Mazur LJ, Yetman RJ, and Risser WL. Weight-training injuries. Sports Medicine 16: 57-
63, 1993.
144. McBride JM, McCaulley GO, and Cormie P. Influence of preactivity and eccentric
muscle activity on concentric performance during vertical jumping. The Journal of
Strength & Conditioning Research 22: 750-757, 2008.
145. McBride JM, Triplett-McBride T, Davie A, and Newton RU. The effect of heavy-vs.
light-load jump squats on the development of strength, power, and speed. The Journal of
Strength & Conditioning Research 16: 75-82, 2002.
146. McBride JM, Triplett-McBride T, Davie A, and Newton RU. A Comparison of Strength
and Power Characteristics Between Power Lifters, Olympic Lifters, and Sprinters.
Journal of Strength and Conditioning Research 13: 58-66, January 1999.
147. McBride JM, Triplett-McBride T, Davie A, and Newton RU. A Comparison of Strength
and Power Characteristics Between Power Lifters, Olympic Lifters, and Sprinters.
Journal of Strength and Conditioning Research 13: 58-66, January 1999.

89
148. McGinnis PM. Biomechanics of Sport and Exercise. Champaign, IL: Human Kinetics,
2013.
149. McGuigan MR, Cormack S, and Newton RU. Long-term power performance of elite
Australian rules football players. The Journal of Strength & Conditioning Research 23:
26-32, 2009.
150. McLain TA, Wright GA, Camic CL, Kovacs AJ, Hegge JM, and Brice GA. Development
of an Anaerobic Sprint Running Test Using a Nonmotorized Treadmill. The Journal of
Strength & Conditioning Research 29: 2197-2204, 2015.
151. McLean SG, Felin RE, Suedekum N, Calabrese G, Passerallo A, and Joy S. Impact of
fatigue on gender-based high-risk landing strategies. Medicine & Science in Sports &
Exercise 39: 502-514, 2007.
152. McLellan CP, Lovell DI, and Gass GC. The role of rate of force development on vertical
jump performance. The Journal of Strength & Conditioning Research 25: 379-385, 2011.
153. McMahon TA, Valiant G, and Frederick EC. Groucho running. Journal of Applied
Physiology 62: 2326-2337, 1987.
154. McNeal JR, Sands WA, and Stone MH. Effects of fatigue on kinetic and kinematic
variables during a 60-second repeated jumps test. International Journal of Sports
Physiology and Performance 5: 218-229, 2010.
155. McNitt-Gray JL. Kinetics of the lower extremities during drop landings from three
heights. Journal of biomechanics 26: 1037-1046, 1993.
156. Menzel H-J, Chagas MH, Szmuchrowski LA, Araujo SR, Campos CE, and Giannetti
MR. Usefulness of the jump-and-reach test in assessment of vertical jump performance.
Perceptual and motor skills 110: 150-158, 2010.
90
157. Mercer J, Bates B, Dufek J, and Hreljac A. Characteristics of shock attenuation during
fatigued running. Journal of Sports Science 21: 911-919, 2003.
158. Mihata LC, Beutler AI, and Boden BP. Comparing the incidence of anterior cruciate
ligament injury in collegiate lacrosse, soccer, and basketball players. The American
journal of sports medicine 34: 899-904, 2006.
159. Milgrom C. The Israeli elite infantry recruit: a model for understanding the biomechanics
of stress fractures. Journal of the Royal College of Surgeons of Edinburgh 34: S18-22,
1989.
160. Miura K, Ishibashi Y, Tsuda E, Okamura Y, Otsuka H, and Toh S. The effect of local and
general fatigue on knee proprioception. Arthroscopy: The Journal of Arthroscopic &
Related Surgery 20: 414-418, 2004.
161. Miyasaka K. The incidence of knee ligament injuries in the general population. Am J
Knee Surg 1: 43-48, 1991.
162. Mizrahi J, Verbitsky O, Isakov E, and Daily D. Effect of fatigue on leg kinematics and
impact acceleration in long distance running. Human movement science 19: 139-151,
2000.
163. Moir G, Sanders R, Button C, and Glaister M. The influence of familiarization on the
reliability of force variables measured during unloaded and loaded vertical jumps. The
Journal of Strength & Conditioning Research 19: 140-145, 2005.
164. Moir GL. Three different methods of calculating vertical jump height from force platform
data in men and women. Measurement in Physical Education and Exercise Science 12:
207-218, 2008.

91
165. Moir GL, Garcia A, and Dwyer GB. Intersession reliability of kinematic and kinetic
variables during vertical jumps in men and women. International journal of sports
physiology and performance 4: 317-330, 2009.
166. Moodie N and Wassom D. Cross-validation of a 3D markerless motion capture system
against video and a 3D marker motion capture system. Dynamic Athletics Rockhurst
University.
167. Moodie N and Wassom D. Repeatability of 3D marless motion capture and how it could
affect between-session variability. Rockhurst University, Dynamic Athletics.
168. Moodie P. Apparatus and method for physical evaluation. Google Patents, 2013.
169. Moodie P. Apparatus and method for physical evaluation. US: Google Patents, 2013.
170. Moran KA and Marshall BM. Effect of fatigue on tibial impact accelerations and knee
kinematics in drop jumps. Medicine and science in sports and exercise 38: 1836-1842,
2006.
171. Mosier EM, Fry AC, and Lane MT. Kinetic contributions of the upper limbs during
counter-movement vertical jumps with and without arm swing. Journal of Strength and
Conditioning Research In Press., 2017.
172. Mosier EM, Fry AC, Moodie PG, Moodie NG, and Nicoll JX. Movement analysis via
motion capture systems help identify injury at-risk NCAA D1 football players. Presented
at National Strength and Conditioning Association, Indianapolis, IN, 2018.
173. Myer GD, Ford KR, and Hewett TE. Rationale and clinical techniques for anterior
cruciate ligament injury prevention among female athletes. Journal of athletic training
39: 352, 2004.
92
174. Neelly KR. Vertical Jump Kinetics in Young Children, in: Department of Health, Sports,
and Exercise Sciences. University of Kansas, 2002, p 167.
175. Nibali ML, Chapman DW, Robergs RA, and Drinkwater EJ. Validation of jump squats as
a practical measure of post-activation potentiation. Applied Physiology, Nutrition, and
Metabolism 38: 306-313, 2013.
176. Nibali ML, Tombleson T, Brady PH, and Wagner P. Influence of Familiarization and
Competitive Level on the Reliability of Countermovement Vertical Jump Kinetic and
Kinematic Variables. The Journal of Strength & Conditioning Research 29: 2827-2835,
2015.
177. Nunley RM, Wright D, Renner JB, Yu B, and Garrett Jr WE. Gender comparison of
patellar tendon tibial shaft angle with weight bearing. Research in Sports Medicine 11:
173-185, 2003.
178. Nyland JA, Shapiro R, Caborn DN, Nitz AJ, and Malone TR. The effect of quadriceps
femoris, hamstring, and placebo eccentric fatigue on knee and ankle dynamics during
crossover cutting. Journal of Orthopaedic & Sports Physical Therapy 25: 171-184, 1997.
179. Nyland JA, Shapiro R, Stine RL, Horn TS, and Ireland ML. Relationship of fatigued run
and rapid stop to ground reaction forces, lower extremity kinematics, and muscle
activation. Journal of Orthopaedic & Sports Physical Therapy 20: 132-137, 1994.
180. Olsen O-E, Myklebust G, Engebretsen L, and Bahr R. Injury mechanisms for anterior
cruciate ligament injuries in team handball. The American journal of sports medicine 32:
1002-1012, 2004.
181. Orishimo KF and Kremenic IJ. Effect of fatigue on single-leg hop landing biomechanics.
Journal of applied biomechanics 22: 245-254, 2006.
93
182. Padua DA, Marshall SW, Boling MC, Thigpen CA, Garrett Jr WE, and Beutler AI. The
Landing Error Scoring System (LESS) is a valid and reliable clinical assessment tool of
jump-landing biomechanics: the JUMP-ACL study. The American journal of sports
medicine 37: 1996-2002, 2009.
183. Pandy MG and Shelburne KB. Dependence of cruciate-ligament loading on muscle
forces and external load. Journal of biomechanics 30: 1015-1024, 1997.
184. Pappas E, Hagins M, Sheikhzadeh A, Nordin M, and Rose D. Biomechanical differences
between unilateral and bilateral landings from a jump: gender differences. Clinical
Journal of Sport Medicine 17: 263-268, 2007.
185. Pappas E, Sheikhzadeh A, Hagins M, and Nordin M. The Effect of Gender and Fatigue
on the Biomechanics of Bilateral Landings from a Jump: Peak Values. Journal of Sports
Science & Medicine 6: 77-84, 2007.
186. Payne AH, Slater WJ, and Telford T. The Use of a Force Platform in the Study of
Athletic Activities. A Preliminary Investigation. Ergonomics 11: 123-143, March 1968.
187. Perrott MA, Pizzari T, Cook J, and McClelland JA. Comparison of lower limb and trunk
kinematics between markerless and marker-based motion capture systems. Gait Posture
52: 57-61, 2017.
188. Pinniger GJ, Steele JR, and Groeller H. Does fatigue induced by repeated dynamic efforts
affect hamstring muscle function? Medicine & Science in Sports & Exercise 32: 647-653,
2000.
189. Quammen D, Cortes N, Van Lunen BL, Lucci S, Ringleb SI, and Onate J. Two different
fatigue protocols and lower extremity motion patterns during a stop-jump task. Journal of
athletic training 47: 32-41, 2012.

94
190. Radin EL, Parker HG, Pugh JW, Steinberg RS, Paul IL, and Rose RM. Response of joints
to impact loading—III: Relationship between trabecular microfractures and cartilage
degeneration. Journal of biomechanics 6: 51IN955-954IN1157, 1973.
191. Renstrom P, Ljungqvist A, Arendt E, Beynnon B, Fukubayashi T, Garrett W, Georgoulis
T, Hewett TE, Johnson R, and Krosshaug T. Non-contact ACL injuries in female
athletes: an International Olympic Committee current concepts statement. British journal
of sports medicine 42: 394-412, 2008.
192. Requena B, García I, Requena F, de Villarreal ES-S, and Pääsuke M. Reliability and
validity of a wireless microelectromechanicals based system (Keimove™) for measuring
vertical jumping performance. Journal of Sports Science & Medicine 11: 115, 2012.
193. Risser WL. Musculoskeletal injuries: Caused by weight training guidelines for
prevention. Clinical Pediatrics 29: 305-310, 1990.
194. Robertson DGE, Caldwell GE, Hamill J, Kamen G, and Whittlesey SN. Research
Methods in Biomechanics. Champaign, IL: Human Kinetics, 2004.
195. Rodacki AL, Fowler NE, and Bennett SJ. Multi-segment coordination: fatigue effects.
Medicine & Science in Sports & Exercise 33: 1157-1167, 2001.
196. Rodacki ALF, Fowler NE, and Bennett SJ. Vertical jump coordination: fatigue effects.
Medicine & Science in sports & exercise 34: 105-116, 2002.
197. Rodano R, Squadrone R, and Mingrino A. Gender differences in joint moment and power
measurements during vertical jump exercises. Presented at Proceedings of the XIV ISBS
Symposium, Funchal-Madera, Portugal, 1996.
198. Ross SE, Guskiewicz KM, and Yu B. Single-leg jump-landing stabilization times in
subjects with functionally unstable ankles. Journal of athletic training 40: 298, 2005.

95
199. Rozzi SL, Lephart SM, and Fu FH. Effects of muscular fatigue on knee joint laxity and
neuromuscular characteristics of male and female athletes. Journal of Athletic Training
34: 106, 1999.
200. Rozzi SL, Lephart SM, Gear WS, and Fu FH. Knee joint laxity and neuromuscular
characteristics of male and female soccer and basketball players. The American journal of
sports medicine 27: 312-319, 1999.
201. Sargent DA. The Physical Test of Man. American Physical Education Review 26: 188-
194, 1921.
202. Sawyer DT, Ostarello JZ, Suess EA, and Dempsey M. Relationship between football
playing ability and selected performance measures. The Journal of Strength &
Conditioning Research 16: 611-616, 2002.
203. Sheppard JM, Cormack S, Taylor K-L, McGuigan MR, and Newton RU. Assessing the
force-velocity characteristics of the leg extensors in well-trained athletes: the incremental
load power profile. The Journal of Strength & Conditioning Research 22: 1320-1326,
2008.
204. Shetty AB and Etnyre BR. Contribution of Arm Movement to the Force Components of a
Maximum Vertical Jump. Journal of Orthopaedic and Sports Physical Therapy 11: 198-
201, 1989.
205. Shimokochi Y and Shultz SJ. Mechanisms of noncontact anterior cruciate ligament
injury. Journal of athletic training 43: 396-408, 2008.
206. Skinner H, Wyatt M, Hodgdon J, Conard D, and Barrack R. Effect of fatigue on joint
position sense of the knee. Journal of Orthopaedic Research 4: 112-118, 1986.

96
207. Skinner H, Wyatt M, Stone M, Hodgdon J, and Barrack R. Exercise-related knee joint
laxity. The American journal of sports medicine 14: 30-34, 1986.
208. Skurvydas A, Jascaninas J, and Zachovajevas P. Changes in height of jump, maximal
voluntary contraction force and low-frequency fatigue after 100 intermittent or
continuous jumps with maximal intensity. Acta Physiologica Scandinavica 169: 55-62,
2000.
209. Stone MH, Fry AC, Ritchie M, Stoessel-Ross L, and Marsit JL. Injury potential and
safety aspects of weightlifting movements. Strength & Conditioning Journal 16: 15-21,
1994.
210. Taylor KL, Cronin J, Gill ND, Chapman DW, and Sheppard J. Sources of variability in
iso-inertial jump assessments. Int J Sports Physiol Perform 5: 546-558, 2010.
211. Timm KE, Wallach JM, Stone JA, and Ryan III EJ. Fifteen years of amateur boxing
injuries/illnesses at the United States Olympic Training Center. Journal of athletic
training 28: 330, 1993.
212. Torzilli P, Grigiene R, Borrelli J, and Helfet D. Effect of impact load on articular
cartilage: cell metabolism and viability, and matrix water content. Journal of
biomechanical engineering 121: 433-441, 1999.
213. Toumi H, Thiery C, Maitre S, Martin A, Vanneuville G, and Poumarat G. Training
Effects of Amortization Phase with Eccentric/Concentric Variations - The Vertical Jump.
International Journal of Medicine 22: 605-610, 2001.
214. Tricoli V, Lamas L, Carnevale R, and Ugrinowitsch C. Short-Term Effects on Lower-
Body Functional Power Development: Weightlifting Vs. Vertical Jump Training
Programs Journal of Strength and Conditioning Research 19: 433-437, 2005.
97
215. Tricoli V, Lamas L, Carnevale R, and Ugrinowitsch C. Short-Term Effects on Lower-
Body Functional Power Development: Weightlifting Vs. Vertical Jump Training
Programs. Journal of Strength and Conditioning Research 19: 433-437, 2005.
216. van Ingen Schenau GJ. From rotation to translation: constraints on multi-joint movements
and the unique action of bi-articular muscles. Human movement science 8: 301-337,
1989.
217. Vanezis A and Lees A. A biomechanical analysis of good and poor performers of the
vertical jump. Ergonomics 48: 1594-1603, 2005.
218. Vardiman P, Andre M, Graham Z, Maresh J, Lane M, Alayafi Y, Carr D, and Gallagher
P. The Use of Instrument Assisted Soft Tissue Moblization to Change Perception of
Functional Ability in College-Aged Students Department of Health, Sport, and Exercise
Sciences University of Kansas
219. Verbitsky O, Mizrahi J, Voloshin A, Treiger J, and Isakov E. Shock transmission and
fatigue in human running. Journal of Applied Biomechanics 14: 300-311, 1998.
220. Villarreal ESSd, Izquierdo M, and Gonzalez-Badillo JJ. Enhancing Jump Performance
After Combined Vs. Maximal Power, Heavy-Resistance, and Plyometric Training Alone.
Journal of Strength and Conditioning Research 25: 3274-3281, 2011.
221. Voloshin AS, Mizrahi J, Verbitsky O, and Isakov E. Dynamic loading on the human
musculoskeletal system—effect of fatigue. Clinical Biomechanics 13: 515-520, 1998.
222. Wassom D, Chandler P, and Moodie N. Comparison of Vertical Jump Measurement
Techniques Using Markerless 3D Motion Capture and Inertial Sensors Dynamic Athletics
Rockhurst University.

98
223. Whiteside R, Jakob R, Wyss U, and Mainil-Varlet P. Impact loading of articular cartilage
during transplantation of osteochondral autograft. Bone & Joint Journal 87: 1285-1291,
2005.
224. Whitmer TD, Fry AC, Forsythe CM, Andre MJ, Lane MT, Hudy A, and Honnold DE.
Accuracy of a vertical jump contact mat for determining jump height and flight time. The
Journal of Strength & Conditioning Research 29: 877-881, 2015.
225. Wikstrom EA, Tillman MD, Smith AN, and Borsa PA. A new force-plate technology
measure of dynamic postural stability: the dynamic postural stability index. Journal of
Athletic Training 40: 305, 2005.
226. Wilson GJ, Lyttle AD, Ostrowski KJ, and Murphy AJ. Assessing Dynamic Performance:
A Comparison of Rate of Force Development Tests. The Journal of Strength &
Conditioning Research 9: 176-181, 1995.
227. Winter D. Biomechanics of Human Movement. New York: John Wiley & Sons, 1979.
228. Winter DA. Biomechanics and Motor Control of Human Movement. New York: John
Wiley & Sons, Inc., 1990.
229. Withrow TJ, Huston LJ, Wojtys EM, and Ashton-Miller JA. The relationship between
quadriceps muscle force, knee flexion, and anterior cruciate ligament strain in an in vitro
simulated jump landing. The American journal of sports medicine 34: 269-274, 2006.
230. Wojtys EM, Wylie BB, and Huston LJ. The effects of muscle fatigue on neuromuscular
function and anterior tibial translation in healthy knees. The American journal of sports
medicine 24: 615-621, 1996.
231. Wosk J and Voloshin A. Wave attenuation in skeletons of young healthy persons.
Journal of Biomechanics 14: 261265-263267, 1981.

99
232. Yoshikawa T, Mori S, Santiesteban A, Sun T, Hafstad E, Chen J, and Burr DB. The
effects of muscle fatigue on bone strain. Journal of Experimental Biology 188: 217-233,
1994.
233. Young W, Cormack S, and Crichton M. Which jump variables should be used to assess
explosive leg muscle function? International journal of sports physiology and
performance 6: 51-57, 2011.
234. Zemková E and Hamar D. All-out” tethered running as an alternative to Wingate
anaerobic test. Kinesiology 36: 165-172, 2004.

VII. APPENDIX A
Informed Consent

KU Lawrence IRB # STUDY00141851 | Approval Period 2/16/2018 – 2/15/2019
The Effects of Vertical Jump Fatigue and Sprint Fatigue on Lower-Body
Biomechanics
INTRODUCTION
The Department of Health, Sport, and Exercise Sciences, at the University of Kansas supports the
practice of protection for human subjects participating in research. The following information is
provided for you to decide whether you wish to participate in the present study. This study will be
conducted in the Jayhawk Athletic Performance Laboratory (Robinson Center 207). Sports
performance monitoring equipment and video recording will be used to analyze lower-body
biomechanics. The following information is provided to help you make an informed decision on
whether or not to participate in the present study. You may refuse to sign this form and not
participate in this study. You should be aware that even if you agree to participate, you are free to
withdraw at any time. If you do withdraw from this study, it will not affect your relationship with
this unit, the services to you, or the University of Kansas.
PURPOSE OF THE STUDY
The purposal of the present study is to determine the acute biomechanical alterations on the
lower-body following VJ fatiguing and sprint fatiguing tasks. Specifically, a markerless motion
capture system will be used to determine biomechanical differences following fatiguing tasks. It is
hypothesized that the performance motion analysis protocol can be used to determine
biomechanical alterations immediately following fatiguing tasks.
PROCEDURES
A time-line of the testing procedures and an overview of the testing sequence are below. You will
be asked to visit the Jayhawk Athletic Performance Laboratory (Robinson Center, Rm 207) for 4
sessions, in a randomized order. These sessions include one familiarization session, one control
session, and two experimental sessions. The first visit will be a familiarization session and will
last approximately 30 minutes, and the control and experimental sessions will last about 30
minutes. You will complete session 2-4 in a randomized order.
Session 1: (Familiarization visit, 30 minutes): You will be informed of the details of the study.
You will be asked to complete the consent form, health exercise status questionnaire, and
audio/video authorization form. Anthropometric data will be collected (age, height, weight, etc.)
You will be familiarized with the markerless motion capture system, audio/video recording
procedure, testing protocol, and the vertical jump and sprint technique. You will then practice
the performance motion analysis, the vertical jump fatigue task, and the sprint task.
Session 2: (Control visit, 30 minutes): You will complete a 10-minute standardized warm-up.
You will be asked to perform the performance motion analysis before and after a rest period of
15 minutes. Small blood samples will be collected from a finger prick for lactate determination
2.5 min pre- and post-rest period. In addition, heart rate will be collected throughout the entire
session.
1

KU Lawrence IRB # STUDY00141851 | Approval Period 2/16/2018 – 2/15/2019
Session 3: (Experimental visit, 30 minutes): You will complete a 10-minute standardized warm-
up. You will be asked to perform the performance motion analysis before and after a vertical
jump fatigue task. You will be instructed to place your hands on your hips, bend the knee to
about 90 degrees and jump explosively, and repeat immediately on landing for a total of 5 sets.
Each set consists of 15 seconds of jumping followed by 15 seconds of rest and repeat for a
duration of a min. Small blood samples will be collected from a finger prick for lactate
determination 2.5 min pre- and post-rest period. In addition, heart rate will be collected
throughout the entire session.
Session 4: (Experimental visit, 30 minutes): You will complete a 10-minute standardized warm-
up. You will be asked to perform the performance motion analysis before and after a sprint task
on a non-motorized treadmill against a resistance of 18% of your body weight. Small blood
samples will be collected from a finger prick for lactate determination 2.5 min pre- and post-rest
period. In addition, heart rate will be collected throughout the entire session.
Motion capture system – Dynamic Athletics Research Institute (DARI) 3D motion capture marker
less system will be used to access and analyze kinetic and kinematic data. Eight separate cameras
film and record the human body segmental movements to calculated position, velocity, and force
acting on each part of the body 50 times per second (50 Hz). Participants will step into the center
of the 8 cameras and assume a standardized pose; standing upright and raising the arms until
abducted and perpendicular to the torso, and 90 degrees flexion at the elbows. The system quickly
converts the pose into a stick figure. The full body motion capture system tracks and records the
human body as a stick figure moving in real time. Human body kinematics and kinetics are
accurately measured simultaneously without a force platform to provide performance data.
Performance Motion Analysis - The Performance Motion Analysis (PMA) is a collection of
nineteen different motions to assess individual upper extremities and lower extremities mechanics
that is tailored to the individual. The motions include flexibility measures, body weight strength
and jumping movements. In all, nineteen motions are incorporated into the PMA report.
Blood Samples - Each subject will give two small blood samples (approximately one drop) at
each testing session by way of a lancet finger stick. Samples will be collected into a lactate testing
strip for analysis via a Lactate Plus handheld blood lactate analyzer. Sampling will take place
immediately prior to the PMA, as well as 2.5-min post jump or sprint tests.
Force Plate – The jumps during the jump fatiguing task will be performed on a force plate.
Ground reaction forces will be collected, and analyzed using a uni-axial force plate (Rice Lake
Weighing Systems, Rice Lake, WI) through a data acquisition system (Biopac MP 150 System,
Goleta, CA) sampling at 1000 Hz from which velocities and powers will be derived.
Non-motorized Treadmill – During the 25-second sprint task performance variables will be
collected on a non-motorized treadmill (NMT) [Woodway Force, Woodway Force 3.0 treadmill
(Waukesha, WI)], You will sprint against a resistance equal to 18% of the subject’s body weight.
2

KU Lawrence IRB # STUDY00141851 | Approval Period 2/16/2018 – 2/15/2019
RISKS
As with all types of physical activity, the vertical jump and sprint protocols in this study carry a
low risk of injury or harm to the musculoskeletal system. A medical history record will also be
required prior to participation, which will include personal and private information. You may
experience muscle soreness during the 48-72 hours following your testing sessions. There is also
the possibility of injury to your shoulder, hips, knees, ankles, and skeletal muscles when
performing the activities in this study. You may also experience some bruising or discomfort at
the site of the blood sampling. You will be given a 24-hour contact number for study personnel to
convey any type of unusual discomfort or injury.
BENEFITS
You will be given a chance to learn about Dynamic Athletic Research Institute (DARI) 3-D
motion capture system. You will be able to observe your body’s biomechanics following fatiguing
tasks, and receive Performance Motion Analysis results based on your performance. In addition,
you will receive a chance to learn about your body’s lactate production following different
fatiguing exercise tasks.
PAYMENT TO PARTICIPATIONS
There will be no compensation for participation in this study.
PARTICIPANT CONFIDENTIALITY
Confidentiality will be maintained by coding all information with your identification numbers.
The master list will be kept in a locked file cabinet in the Jayhawk Athletic Performance
laboratory. By signing this form and audio/video authorization forms you give permission for the
use and disclosure of your information for the disclosure of this study. Only qualified research
personnel at the Jayhawk Athletic Performance Laboratory and University of Kansas
Institutional Review Board (IRB) will have access to the database containing study information.
Your identifiable information will be shared unless (a) it is required by law or university policy,
or (b) you give written permission. All study data entered into statistical analyses and
publications reports will refer to group mean data. No individual or group other than the research
team will be given information, unless specifically requested by the IRB. Jayhawk Athletic
Performance Laboratory employees will only be granted access to the audio/video recordings
and performance data collected. All electronic data will be kept on password protected
computers. All data will be stored for a minimum of three years or until papers and abstracts can
no longer be published off the data, and then these recordings will then be destroyed. Only
abstracts and papers without identifying information will be transmitted through email with the
study participation and research personnel that are involved with the project.
Permission granted on this date to use and disclose your information remains in effect
indefinitely. By signing this form, you give permission for the use and disclosure of your
information for purposes of this study at any time in the future.
3
KU Lawrence IRB # STUDY00141851 | Approval Period 2/16/2018 – 2/15/2019
DISCLAIMER STATEMENT
In the event of injury, the Kansas Tort Claims Act provides for compensation if it can be
demonstrated that the injury was caused by the negligent or wrongful act or omission of the state
employee acting within the scope of his/her employment.
INFORMATION TO BE COLLECTED
To perform in this study, researchers will collect information about you. This information will be
obtained from the medical history form. Your name and personal information will not be
associated in any way with the information collected about you or with the research findings from
this study. The researchers will use a numbering system in which you will be randomly assigned
to any number between in which you will be randomly assigned to any number between 01
through 20 as your study identification. All screen forms will only contain the subject number that
is assigned to you. The audio/video recording is required to participate in the study. All the data
collected will be stored on a password protected computer in a locked office of the Jayhawk
Athletic Performance Laboratory (Robinson Center 207).
REFUSAL TO SIGN CONSENT AND AUTHORIZATION
You are not required to sign this Consent and Audio/Video Authorization forms and you may
refuse to do so without affecting your right to any services you are receiving or may receive from
the University of Kansas or to participate in any programs or events of the University of Kansas.
However, if you refuse to sign the informed consent and audio/video authorization form, you
cannot participate in this study. You have the option to cancel your authorization and/or stop the
recording at any time.
DISQUALIFICATION
You will be excluded from the study if you report any on the following information on the health
history questionnaire. If you report any cardiovascular disease or metabolic, renal, hepatic
disorders, and/or any history of severe ankle, knee, and/or hip injury, and other pathological
conditions that could impair your jumping, or running.
CANCELLING THIS CONSENT AND AUTHORIZATION
You may withdraw your consent to participate in this study at any time. You also have the right to
cancel your permission to use and disclose further information collected about you, in writing, at
any time, by sending your written request to: Andrew C. Fry, 1301 Sunnyside Avenue 146C,
Robinson Center, Lawrence, KS 66045.
If you cancel permission to use your information, the researchers will stop collecting additional
information about you. However, the research team may use the disclosure information that was
gathered before they receive your cancellation, as described above.
4

KU Lawrence IRB # STUDY00141851 | Approval Period 2/16/2018 – 2/15/2019
QUESTIONS ABOUT PARTICIPATION
Questions about procedures should be directed to the researcher(s) listed at the end of this consent
form.
PARTICIPANT CERTIFICATION:
I have read this Consent and Authorization form. I have had the opportunity to ask, and I have
received answers to, any questions I have regarding the study. I understand that if I have any
additional questions about my rights as a research participant, I may call (785) 864-7429 or (785)
864-7385, write the Human Research Protection Program (HRPP), University of Kansas, 2385
Irving Hill Road, Lawrence Kansas 66045-7568, or email [email protected].
I agree to take in this study as a research participant. By my signature I affirm that I am at least
18 years old and I have received a copy of this Consent and Authorization form.
Print Participant’s Name Date
Participant’s Signature
Print Person Name Obtaining Consent Date
Signature of Person Obtaining Consent
Research Contact Information
Eric Mosier, M.S.E. Andrew C. Fry, Ph.D.
Principle Investigator Faculty Supervisor
Health, Sport, and Exercise Sciences Health, Sport, and Exercise Sciences
208 Robinson Center
University of Kansas
Lawrence, KS 66045
101A Robinson Center
University of Kansas
Lawrence, KS 66045

KU Lawrence IRB # STUDY00141851 | Approval Period 2/16/2018 – 2/15/2019
5

VII. APPENDIX B
Authorization for Release of Photography and/or Video
AUTHORIZATION FOR RELEASE OF PHOTOGRAPH AND/OR VIDEO
I, (name of individual), by signing this release, authorize
the University of Kansas, the Department of Health, Sport and Exercise Science, and their staff
to use photographs, and video images, or other likenesses of myself, for the following purposes:
1. Use in University and Department of Health, Sport and Exercise Science education and
training activities and materials (including print and on line or electronic instructional
materials); and
2. Use in print or electronic form in University or Department of Health, Sport and
Exercise Science publications, presentations, brochures, newsletters/bulletins, and
websites for educational, public relations or promotional purposes which may result in
the rising of funds for Department of Health, Sport and Exercise Science.
I understand that the images and written testimonials described above may be included in, copied
and distributed by means of various print or electronic media. I understand that my name will not
be included with the images or testimonials.
I understand that the study involves audio and/or visual recordings. I am not required to sign
Authorization form and I may refuse to do so without affecting my right to any services I am
receiving or may receive from the University of Kansas or to participate in any programs or
events of the University of Kansas. However, these recordings are required to participate so if I
refuse to sign the Authorization form, I cannot participate in the study. I have the option to
cancel my authorization or stop the recordings at any time.
I understand that this Authorization can be revoked at any time to the extent that the use or
disclosure has not already occurred prior to my request for revocation. In order to revoke the
authorization, I must notify Department of Health, Sport and Exercise Science in writing at the
following address:
Department of Health, Sport and Exercise Science
University of Kansas
Lawrence, KS 66045
(785) 864-4656
If I cancel this Authorization after publication of the materials outlined above, I understand that
my cancellation may not be able to be honored. If I revoke this Authorization, the University and
Department of Health, Sport and Exercise Science shall not engage in any new uses or
disclosures of the images or testimonials.
All of the data collected from this project will be stored on a password protected computer in a
locked office of the Jayhawk Athletic Performance Laboratory. Jayhawk Athletic Performance
Laboratory employees only will be granted access to the data collected. The recordings will be
stored on a password protected computer from a minimum of three years or until papers can no
longer be published off the data, and then these recordings will then be destroyed.
1

The University and Department of Health, Sport and Exercise Science will not condition
treatment, payment, enrollment or eligibility for services or benefits on the execution of this
Authorization. I understand that the images and recordings may be subject to disclosure by the
person or entity receiving such information and thus will no longer be protected by federal
privacy regulations.
This Authorization is given without promise of compensation. The photos and video images
specified above become the property of the University of Kansas and I release to the University
any right, title and/or interest of any kind that I may have in the information or images produced.
I have read this document and understand its contents.
Type/Print Participant’s Name Date
Participant’s Signature
The Authorization must be signed, dated, and a copy, provided to the individual completing the
form.
2

IX. APPENDIX C
Medical History Form

PRE-EXERCISE
TESTING HEALTH &
EXERCISE STATUS
QUESTIONNAIRE
Name Date
Home Address
Phone Number
Birthday (mm/dd/yy) / /
Person to contact in case of emergency
Emergency Contact Phone
Personal Physician Physician’s Phone
Gender Age (yrs) Height (ft) (in) Weight (lbs)
Does the above weight indicate: a gain a loss no change in the past year?
If a change, how many pounds? (lbs)
A. JOINT-MUSCLE STATUS (Check areas where you currently have problems)
Joint Areas Muscle Areas
( ) Wrists ( ) Arms
( ) Elbows ( ) Shoulders
( ) Shoulders ( ) Chest
( ) Upper Spine & Neck ( ) Upper Back & Neck
( ) Lower Spine ( ) Abdominal Regions
( ) Hips ( ) Lower Back
( ) Knees ( ) Buttocks
( ) Ankles ( ) Thighs
( ) Feet ( ) Lower Leg
( ) Other ( ) Feet
( ) Other
B. HEALTH STATUS (Check if you currently have any of the following conditions)
( ) High Blood Pressure ( ) Acute Infection
( ) Heart Disease or Dysfunction ( ) Diabetes or Blood Sugar Level Abnormality
( ) Peripheral Circulatory Disorder ( ) Anemia
( ) Lung Disease or Dysfunction ( ) Hernias
( ) Arthritis or Gout ( ) Thyroid Dysfunction
( ) Edema ( ) Pancreas Dysfunction
( ) Epilepsy ( ) Liver Dysfunction
( ) Multiple Sclerosis ( ) Kidney Dysfunction
( ) High Blood Cholesterol or ( ) Phenylketonuria (PKU)
Triglyceride Levels ( ) Loss of Consciousness
( ) Allergic reactions to rubbing alcohol
* NOTE: If any of these conditions are checked, then a physician’s health clearance will required.

C. PHYSICAL EXAMINATION HISTORY
Approximate date of your last physical examination
Physical problems noted at that time
Has a physician ever made any recommendations relative to limiting your level of
physical exertion? YES NO
If YES, what limitations were recommended?
D. CURRENT MEDICATION USAGE (List the drug name, the condition being managed, and
the length of time used)
MEDICATION CONDITION LENGTH OF USAGE
E. PHYSICAL PERCEPTIONS (Indicate any unusual sensations or perceptions. Check if you
have recently experienced any of the following during or soon after physical activity (PA); or
during sedentary periods (SED)) PA SED PA SED
( ) ( ) Chest Pain ( ) ( ) Nausea
( ) ( ) Heart Palpitations ( ) ( ) Light Headedness
( ) ( ) Unusually Rapid Breathing ( ) ( ) Loss of Consciousness
( ) ( ) Overheating ( ) ( ) Loss of Balance
( ) ( ) Muscle Cramping ( ) ( ) Loss of Coordination
( ) ( ) Muscle Pain ( ) ( ) Extreme Weakness
( ) ( ) Joint Pain ( ) ( ) Numbness
( ) ( ) Other ( ) ( ) Mental Confusion
F. FAMILY HISTORY (Check if any of your blood relatives . . . parents, brothers, sisters,
aunts, uncles, and/or grandparents . . . have or had any of the following) ( ) Heart Disease
( ) Heart Attacks or Strokes (prior to age 50)
( ) Elevated Blood Cholesterol or Triglyceride Levels
( ) High Blood Pressure
( ) Diabetes
( ) Sudden Death (other than accidental)
G. EXERCISE STATUS Do you regularly engage in aerobic forms of exercise (i.e., jogging, cycling, walking, etc.)? YES NO
How long have you engaged in this form of exercise? years months
How many hours per week do you spend for this type of exercise? hours
What is your fastest 5 km time?
What is your fasted 10 km time?
What is your fasted mile time?
What is your fasted times at other distances not listed?

Do you regularly lift weights? YES NO
How long have you engaged in this form of exercise? years months
How many hours per week do you spend for this type of exercise? hours
What is your back squat 1 repetition maximum (RM)?
What is your deadlift 1 RM?
What is your power clean 1 RM?
What are your other 1 RMs that are not listed?
Do you regularly play recreational sports (i.e., basketball, racquetball, volleyball, etc.)? YES NO
How long have you engaged in this form of exercise? years months
How many hours per week do you spend for this type of exercise? hours