campussuite-storage.s3.amazonaws.com€¦ · web viewduring the spring 2019 semester, the...
TRANSCRIPT

Campus Climate Report 2019
Feather River College


Acknowledgements
We would like to thank FRC administration, faculty, staff and students for their support and assistance who helped make this project possible. We
would also like to thank all those staff and supporters of FRC student success.

CONTENTSLIST OF FIGURES..........................................................................4EXECUTIVE SUMMARY..................................................................5
Recommendations...........................................................................................6INTRODUCTION............................................................................7
Why this Project?..............................................................................................7The Significance of Campus Climate for FRC...................................................7Measuring Campus Climate at FRC..................................................................9
SURVEY RESPONDENTS..............................................................121. Demographics.......................................................................................12Demographics Summary................................................................................15
QUESTION AREAS.......................................................................162. Comfort Level and Diversity..................................................................163. Isolation and/or Discrimination..............................................................204. Happiness..............................................................................................225. Program Awareness...............................................................................246. Measures of Success AMONG Student Categories.................................257. Perspectives around support in achieving educational goals................27
CONCLUSIONS AND RECOMMENDATIONS...................................28REFERENCES..............................................................................30APPENDIX A: SURVEY.................................................................31
Survey questions and raw results..................................................................32

LIST OF FIGURES

Figure 1.1: Survey Response Rates, 2009-2019................................................12Figure 1.2: Male/Female Survey Response Rates..............................................13Figure 1.3 Student Responses by Race/Ethnic Categories...............................14Figure 2.1 Student Responses on Classroom and Overall Comfort.................16Figure 2.2 Employee Responses on Workplace and Overall Comfort..............17Figure 2.3: Perceptions of Equal Treatment of Students..................................18Figure 2.4: Perspectives of Diversity Among Students and Employees..........19Figure 3.1: Respondents Reporting Feelings of Isolation (Often/Sometimes) 20Figure 3.5: Respondents Reporting “Often/Sometimes” Feeling isolated or discrimination.........................................................................................................22Figure 4.1: Overall Happiness 2019.....................................................................23Figure 4.2: How Happy are you at FRC?..............................................................23Figure 5.1: Student Awareness of Programs and Resources 2019..................24Figure 6.1: Success rates By On-campus Student Groups In 2017-18............26Figure 6.2: Number of Students in Each Student Group in 2017-18...............26

EXECUTIVE SUMMARY
During the Spring 2019 semester, the “campus climate” survey was administered on Feather River College (FRC) campus. This year the survey was revised slightly to gather information for Student Equity and Achievement Program reporting purposes. The survey was hosted on Survey Monkey. Survey respondents answered questions in categorical areas: campus comfort and diversity, isolation, discrimination and/or harassment, overall happiness, and events/activities/services awareness. Highlights from the survey results include:
Despite attempts to solicit participation, the diversity of the FRC campus is not accurately represented in the survey sample.
82% of all respondents report being “Very” or “Rather” happy at FRC. 80% of all students report that “Being a part of the FRC campus
community is a positive experience….” 91% of students indicate high/positive levels of comfort in their FRC
classes. 83% of students and 75% of employees are “Very Comfortable” or
“Comfortable” with the climate of diversity at FRC. 75% of employees indicate that they are “Very Comfortable” or
“Comfortable” with the climate in their department/work unit. Experiences with isolation or discrimination may cause a student or
employee to want to leave FRC or seek employment elsewhere. While the rates are small, the implications on a small campus may be profound.
Students who reported negative experiences around isolation or discrimination responded that these have negatively affected their academic performance and access to courses. As the college analyzes obstacles to student success, these results should be further investigated.
Most student respondents report a familiarity with student services and programs offered on campus.
The programs that students are least aware of are the Internship Program, Student Ambassador Program, CalWorks, EOPS/CARE, and Health Services.

79% of student respondents believe students are treated equally. Some comments reveal perceptions of inequity and sentiments that student athletes experience favorable treatment.
A majority of students indicated that FRC cares about them as a person and that being a part of the FRC campus. The responses from employees are notably lower.
Women may experience the campus environment differently than men. 17% of female students and 33% of female employees report some kind of harassment and/or discrimination based on sex.
This information has been analyzed with specific attention to the topic of student success. The analysis of the survey data has been complimented with a review of secondary data and research on California community colleges. The intent of this approach is to locate FRC’s experiences with diversity and student success in the system-wide context. This project and the accompanying analysis may assist Feather River College in its efforts to create a welcoming climate for all students and employees and contribute to an environment of student success.
RECOMMENDATIONSAs in previous years, it is recommended that the information gleaned from this survey and report be used for planning across campus.
Use the Climate Project Report in the College’s planning, especially Guided Pathways and Student Equity and Achievement Program reporting and implementation.
Consider gather supplemental data and information using additional research methods such as interviews or focus groups. Follow-up interviews or focus groups with employees may be useful and approached with sensitivity.
Build publicity and improve advertising of campus services, resources, programs and activities with available, accessible, current, and thorough information.
Continue sponsoring activities and events that facilitate learning and discussion around issues surrounding race, ethnicity, class, sex/gender, and sexual orientation.

INTRODUCTION
WHY THIS PROJECT?
This survey and report provide a snapshot of FRC and the experiences of individuals on campus and with the campus community.
THE SIGNIFICANCE OF CAMPUS CLIMATE FOR FRC
“Campus climate” refers to the general atmosphere experienced by the students, faculty, staff and administration of FRC, primarily in terms of their overall comfort, their sense of safety and belonging, and whether they feel valued, treated fairly with respect and without discrimination. FRC recognizes the importance of diversity, inclusion, and providing a safe learning and working environment for all students and employees.
DIVERSITY IN K-12 MEANS MORE DIVERITY IN CALIFORNIA COMMUNITY COLLEGES
The early 21st century in the United States will be known for the election of the country’s first African American president and the opportunities and possibilities for all groups of people presented by rapid technological advancements. However, backlash to advancements in equality have subsequently occurred. The climate of ongoing court battles around affirmative action practices continue as do heightened racial tensions. Researchers, activists, educators and policy makers have given increased attention to “equity” in areas of employment, education, housing, and health care. Public education and a college education more specifically, has traditionally been seen as an equalizing force amidst social inequality. Yet equity is more than assuring equal opportunity. It is about recognizing that every student brings a unique experience to the classroom and learning. According to the California Department of Education,
Students come to school with diverse backgrounds, abilities, talents, and challenges. Schools ensure equity by recognizing, respecting, and acting on this diversity. A common misperception is that equity means that all students are treated equally in all situations. In fact, high-quality schools have the capacity to differentiate instruction, services, and resource distribution to respond effectively to the diverse needs of their students, with the aim of ensuring that all students benefit equally. (https://www.cde.ca.gov/qs/ea/)

In short, access to education has been seen as a pathway to success for all groups in society but access in and of itself is incomplete. As higher education, especially California community colleges, is more diverse than ever amidst shifting demographics, and more people seek educational opportunities, meeting the needs of students by understanding what they bring to the learning environment has never been more important for assuring success.
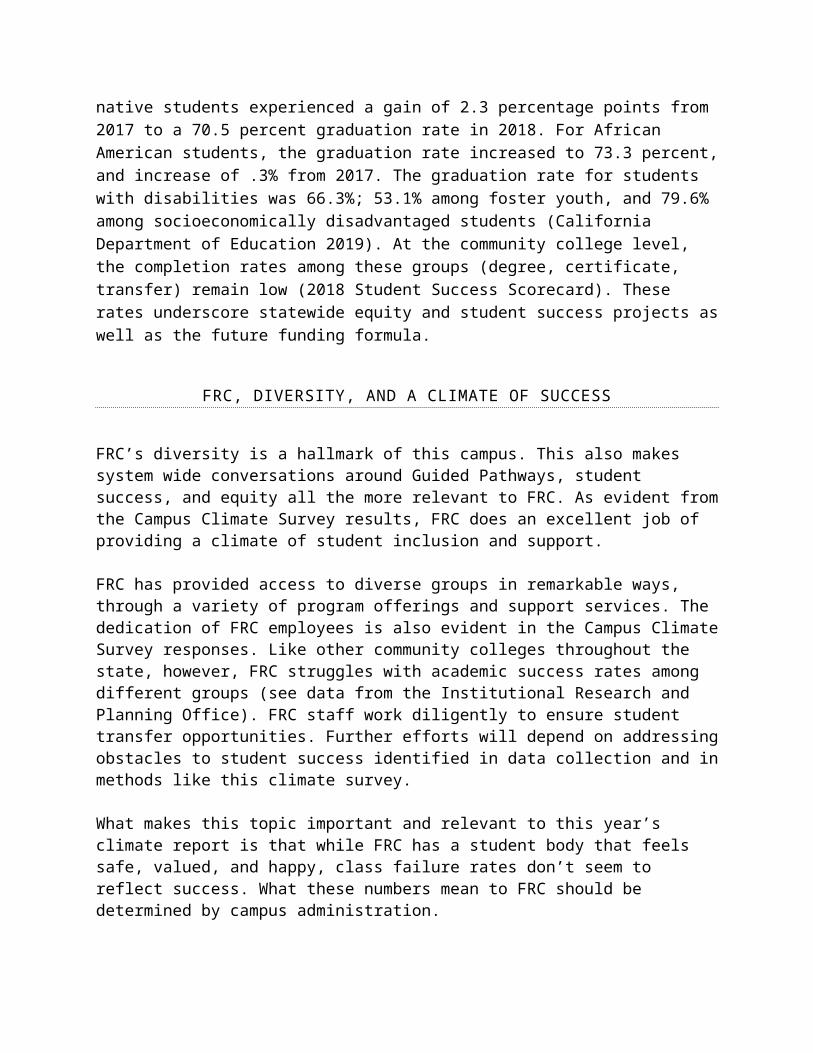
According to reports on the future of education in California, the state’s community colleges should be aware of the increased diversity of college-going students as the high school graduation rates among minorities continue to steadily rise. According to its 2018 “State of Higher Education for Latinx in California” report by the Campaign for College Opportunity, over 50% of K-12 students in the state are Latinx, and there are 1.3 million Latinx students enrolled in California colleges. Despite comprising 40% of the state’s population, and these increases in college enrollment, graduation rates remain disproportionately lower among Latinx students compared to other races (Campaign for College Opportunity, 2018). As California high school graduation rates among various groups increase, the state’s community colleges have an opportunity to meet the educational demands of an increasingly diverse population. In 2018, high school graduation rates increased for many groups from previous years. For Hispanic or Latino students the rate was 80.6%, up .3 percentage points from the year before. American Indian or Alaska native students experienced a gain of 2.3 percentage points from 2017 to a 70.5 percent graduation rate in 2018. For African American students, the graduation rate increased to 73.3 percent, and increase of .3% from 2017. The graduation rate for students with disabilities was 66.3%; 53.1% among foster youth, and 79.6% among socioeconomically disadvantaged students (California Department of Education 2019). At the community college level, the completion rates among these groups (degree, certificate, transfer) remain low (2018 Student Success Scorecard). These rates underscore statewide equity and student success projects as well as the future funding formula.
FRC, DIVERSITY, AND A CLIMATE OF SUCCESS
FRC’s diversity is a hallmark of this campus. This also makes system wide conversations around Guided Pathways, student success, and equity all the more relevant to FRC. As evident from the Campus Climate Survey results, FRC does an excellent job of providing a climate of student inclusion and support.

FRC has provided access to diverse groups in remarkable ways, through a variety of program offerings and support services. The dedication of FRC employees is also evident in the Campus Climate Survey responses. Like other community colleges throughout the state, however, FRC struggles with academic success rates among different groups (see data from the Institutional Research and Planning Office). FRC staff work diligently to ensure student transfer opportunities. Further efforts will depend on addressing obstacles to student success identified in data collection and in methods like this climate survey.
What makes this topic important and relevant to this year’s climate report is that while FRC has a student body that feels safe, valued, and happy, class failure rates don’t seem to reflect success. What these numbers mean to FRC should be determined by campus administration. The Campus Climate survey is one mechanism for the College to evaluate its progress towards its strategic goals and accomplishment of its mission. This information may assist in institutional planning and provide the College some data from which they can make improvements in order to better serve the campus’s diverse population and increase student success.
MEASURING CAMPUS CLIMATE AT FRC
As shown, campus climate is important when it comes to student success. Measuring this climate includes looking at comfort and inclusion levels, experiences with a sense of equality, opportunity, and students’ awareness of services and programs. This has consistently been the intent of the campus climate efforts.
SURVEY
Once the questions were reviewed the survey was finalized and the instrument was uploaded into the survey website, “Survey Monkey.” This site was selected because of FRC’s institutionally held account, the ease of survey disseminating, and because the past survey results are archived in the FRC Survey Monkey account.
The survey was open for four weeks, from March 6 and closed April 8.
As an incentive, survey participants were given the opportunity to enter a drawing for prizes. All measures were taken to secure the anonymity of the respondents. After the survey closed, email addresses were randomly drawn from the list of entries. Winners were contacted and awarded their prizes.
QUESTION AND REPORT CATEGORIES Depending on a how a respondent identified, whether student or employee, they were directed to answer a series of questions in the survey categories.
Demographics: In order to filter responses in useful ways, several demographic questions were asked at the end of the survey. Group categories were slightly revised.
Campus Comfort and Diversity: The first category included a series of questions regarding comfort levels among groups on the FRC campus; this category is common among campus climate surveys elsewhere in the country.
Isolation, Harassment, Discrimination: This section corresponds with “campus comfort and diversity,” but is more specific in that it asked respondents directly about their perceptions of, or experiences with isolation, harassment, and discrimination. Any reported occurrence or perceived behavior of discrimination or harassment is important to document.
Program Awareness: The program awareness category asked students about their awareness level of specific campus services, programs, and resources. The intent of this category is to gather information about which groups are familiar with campus resources. This may assist in improving outreach to various groups and increasing awareness of these programs.
Overall Happiness: As previously mentioned, this category was introduced this year in an effort to gauge happiness and satisfaction on campus. Inspired by the World Happiness Report, these questions asked whether

respondents felt valued by FRC, whether their campus experience is positive, and about their overall level of happiness at FRC. 1
ASSURING PRIVACY Due to the nature of this research, and in compliance with federal law, the POL 140 students were briefed on the “Education Rights and Privacy Act” or FERPA. Students agreed to FERPA guidelines on confidentiality and research. All potential identifiers (emails entered in the drawing and IP addresses) were accessed exclusively by the course professor and deleted at the end of the project.
1 World Happiness Report, 2013. http://unsdsn.org/files/2013/09/WorldHappinessReport2013_online.pdf

SURVEY RESPONDENTS
1. DEMOGRAPHICS
According to the “unique headcount” data from the Institutional Research and Planning Office at FRC, the total amount of students taking class on the FRC campus in 2019 was 818.2 According to the Office of Human Resources, there were 239 FRC employees (not including student workers). This section uses these base-line figures to show the strength of the survey response rates.
FIGURE 1.1: SURVEY RESPONSE RATES, 2009-2019
2009 2011 2013 20190%
5%
10%
15%
20%
25%
30%
35%
40%
45%
50%
12% 16%19%
18%
46%
33% 32%
17%
16%
17% 21%
17%
students employees campus response rates
The figure shows that there was a decrease in 2019 overall respondents compared to past years. This is especially the case for employees. The response rate among FRC employee respondents (faculty/staff/administrators) has continuously declined from 46% in 2009 to 17% in 2019.
2 Students in the incarcerated program and contract ed. students are not included because the survey did not target/include these groups.

The following figures show the overall demographics of the survey respondents.
FIGURE 1.2: MALE/FEMALE SURVEY RESPONSE RATES
Men Women Non-Binary Did Not Specify0
102030405060708090
100
42
91
2 81125
1 3
Number of Male/Female Survey Re-spondents
Students Employees
Figure 1.2 shows that among all 239 employees on campus, 25 female employees took the survey. Among 450 female students, 91 took the survey. As in past years, females continue to constitute the majority of survey respondents.
The breakdown of the student population by sex and ethnicity illustrates the representative sample of the campus population captured by the survey. However, in 2019 respondents were able to check multiple race/ethnicities if they identify or categorize themselves in more than one. This obviously skews the accuracy of the data, but allowed respondents to be more honest in their self-identification.

FIGURE 1.3 STUDENT RESPONSES BY RACE/ETHNIC CATEGORIES
ETHNICITYApproximat
e %of Campus
Group
Am. Indian or Alaskan Native
6%
Asian or Pacific Islander 2%Black Non-Hispanic 6%Hispanic 13%Other3 7%White Non-Hispanic 78%
RACE/ETHNIC BREAKDOWN AMONG EMPLOYEE RESPONDENTS
It was determined that employee demographic data is not relevant in this report since over 81% of FRC employees indicate “White non-Hispanic” as their race/ethnic category.
ADDITIONAL STUDENT RESPONDENT DEMOGRAPHICS
Student Respondents by Age: As in past years, the majority of student respondents (75%) were in the 18-25 year-old range.
Respondents Who Identify as First-Generation College Students: This responses rate mirrored past years as 50% of students surveyed identified as first-generation college students.
Student Athletes: Thirty-five percent of student respondents identified as a student athlete.
3 This may include “bi” or “multi-racial.” See http://www.huffingtonpost.com/2012/09/27/multiracial-americans-2010-census_n_1919070.html

DEMOGRAPHICS SUMMARY
Response rates among female students in the different race/ethnicity categories were significantly higher than males in different race/ethnicity categories, however both were still very low compared to responses from students and employees who identified as “White non-Hispanic.” This leads to the conclusion that the survey data from 2019 does not accurately represent the actual presence of these populations on the FRC campus. The most notable shortcoming in these response rates is among African American students (only 6%). The results presented in this report should be interpreted with these response rates in mind.4 Improving response rates among African American students, male students and employees should be a priority for future surveys.
4 The number of respondents answering each question ranged from 92-183.

QUESTION AREAS
The results of this survey are presented according to four categories: (1) Comfort Level and Diversity; (2) Discrimination and Isolation; (3) Overall Happiness; and (4) Program Awareness.
2. COMFORT LEVEL AND DIVERSITY
The results from the comfort level questions revealed a very high sense of comfort among students and employees.
FIGURE 2.1 STUDENT RESPONSES ON CLASSROOM AND OVERALL COMFORT
% “Strongly Agree” or “Agree”
My instructors treat students of diverse backgrounds with equal respect. 92%
My instructors treat men and women equally in class. 91%
The data in Figure 2.1 show that student respondents report a high sense and experience of equality on the FRC campus. Students overwhelmingly reported that instructors treat students from diverse backgrounds with equal respect, and these perceptions do not vary by gender. It appears that students feel included, valued and treated fairly at Feather River College. When asked about their overall comfort levels in their classes, 88% of students reported being “very comfortable” to “comfortable.”

FIGURE 2.2 EMPLOYEE RESPONSES ON WORKPLACE AND OVERALL COMFORT
% of “Strongly Agree” or “Agree”
My supervisor/ manager treats employees of diverse backgrounds with equal respect. 87% My supervisor/ manager treats men and women in the workplace with equal respect. 82% Overall, how comfortable are you with the climate in your department/work unit? 80%
As depicted in Figure 2.2, the majority of employees responded with a sense of equal treatment by their supervisors and overall comfort in their workplace. The question about comfortability with the workplace climate had the lowest “agreement” response rate.
As with the student responses, employee response rates are almost identical to previous campus surveys. There is no notable difference to report and 87% of employees responded favorably in regard to experiencing equal treatment in the workplace.
Employees were also asked if they thought students were treated equally. These responses were compared to student responses and broken out by student-athlete identifiers.

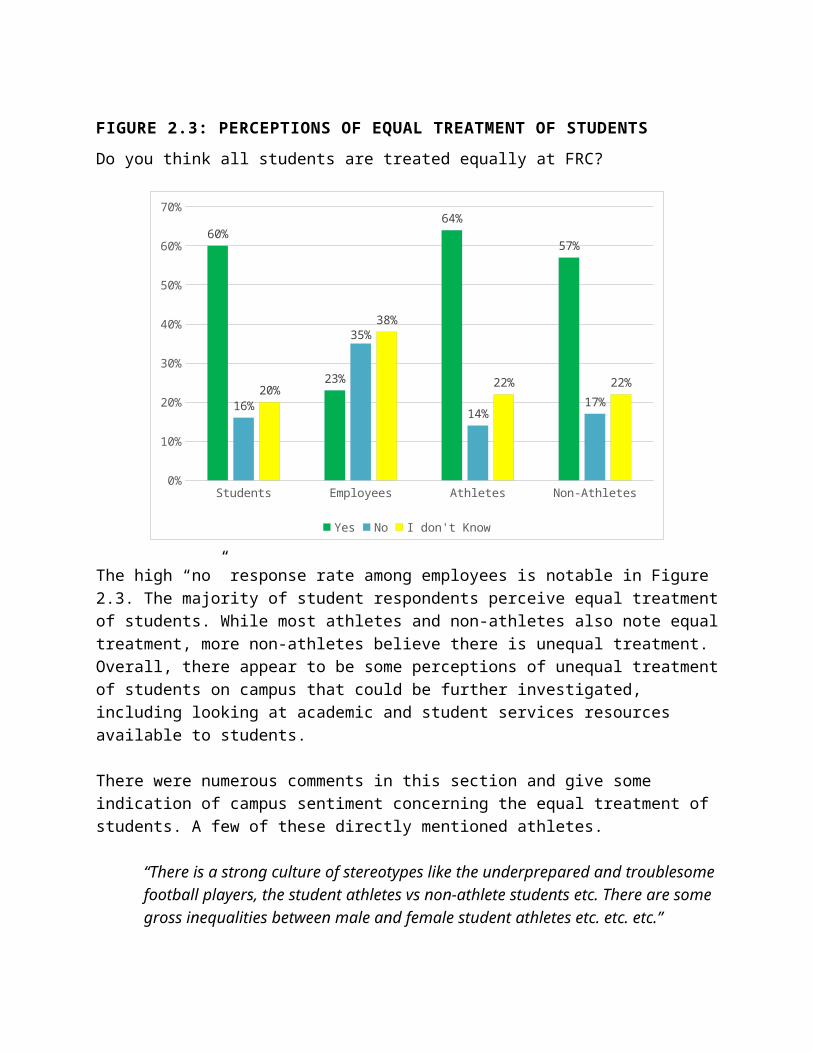
FIGURE 2.3: PERCEPTIONS OF EQUAL TREATMENT OF STUDENTS Do you think all students are treated equally at FRC?
Students Employees Athletes Non-Athletes0%
10%
20%
30%
40%
50%
60%
70%
60%
23%
64%
57%
16%
35%
14%17%
20%
38%
22% 22%
Yes No I don't Know
The high “no” response rate among employees is notable in Figure 2.3. The majority of student respondents perceive equal treatment of students. While most athletes and non-athletes also note equal treatment, more non-athletes believe there is unequal treatment. Overall, there appear to be some perceptions of unequal treatment of students on campus that could be further investigated, including looking at academic and student services resources available to students.
There were numerous comments in this section and give some indication of campus sentiment concerning the equal treatment of students. A few of these directly mentioned athletes.
“There is a strong culture of stereotypes like the underprepared and troublesome football players, the student athletes vs non-athlete students etc. There are some gross inequalities between male and female student athletes etc. etc. etc.”
“I feel like the students who does sports gets treated better when it comes to class work.”
“Students who play sports are usually treated better.”

“Students who play sports need to do their school work.”
“Student who play sports gets treated a little better for half the work.”
“Sports players are treated better.”
“The inequality on campus is not about race, ethnicity, gender, etc. it’s more of a difference between sports students and those not in a sport. Teachers know the sports students better and they tailor examples in class towards sports when some of us have no idea what happened in most sports.”
On the other hand, the perception of equality was also noted in these comments:
“I don't know every teacher but my teachers treat everyone equally.”
Perceptions of diversity on the FRC campus were positive with 83% of students and 75% of employees reporting comfort with the campus’s level of diversity.
FIGURE 2.4: PERSPECTIVES OF DIVERSITY AMONG STUDENTS AND EMPLOYEES

FRC should put more diversity into curricu-
lum
FRC should offer more diversity themed
courses
FRC should strive for a more diverse staff
It is important that FRC has a diverse
campus
0%
10%
20%
30%
40%
50%
60%
70%
80%
90%
100%
42% 40% 38%
71%
53%
68%73%
90%
Students Employees
Figure 2.4 shows a notable difference between students and employees on their value of diversity in curriculum, diversity events, and having greater diversity among employees. This is most evident in whether “FRC should strive for a more diverse staff”. Employees seem more favorable to this statement than students. However, the majority of both students and employees value the overall diversity of campus.
3. ISOLATION AND/OR DISCRIMINATION
The numbers of respondents indicating experiences of isolation or discrimination on the FRC campus are low. This was determined from information gathered in several areas: race or ethnicity, sex, sexual orientation, gender identity, disability/ability, age, homelessness, foster youth status, religious preference, veteran status, appearance, country of origin, language/accent, immigration status and financial standing. Instances of “rarely” were aggregated into this reporting. The authors believe “rarely” indicates the sentiment, observation, or experience has occurred at least once.

FIGURE 3.1: RESPONDENTS REPORTING FEELINGS OF ISOLATION (OFTEN/SOMETIMES)
Race/
Ethnicity Se
x
Sexu
al Orie
ntation
Disabili
ty/Ab
ility Age
Religi
ous P
refera
nce
Veter
an Stat
us
Appe
arance
Coun
try of
Origin
Homele
ssness
Foster
Youth St
atus
Langu
age
Finan
cial S
tanding
Immigr
ation
Status
0
5
10
15
20
25
30
8 95
14 14
8
0
24
3 42
4
9
22 3 2 36
41 2 1 0 0 1
30
Number of Respodents who have felt isolated because of....
Students Employees
Figure 3.1 shows respondent perceptions of isolation on the FRC campus are low. However, as in previous years’ reporting, age and appearance continue to elicit the highest response. Isolation due to disability/ability also elicited a high response. These responses may reflect the importance that physical attributes (such as race, appearance, age, and disability/ability) have on an individual’s experience. Responses of feeling isolated based on race and ethnicity were higher for students which may reflect the fact that the student body is much more racially diverse than the staff. The high response of students who report feelings of isolation because of age and disability/ability also stands out.
FIGURE 3.2: Respondents Reporting Experience with Discrimination (Often/Sometimes)
Race/
Ethnicity Se
x
Sexu
al Orie
ntation
Disabili
ty/Ab
ility Age
Religi
ous P
refera
nce
Veter
an Stat
us
Appe
arance
Coun
try of
Origin
Homele
ssness
Foster
Youth
Statu
s
Langu
age
Finan
cial S
tanding
Immigr
ation
Statu
s
Gender
Identity
05
101520253035
1924
8
20 22
12
3
29
8 74
813
4 42
11
1 2
127
0
10
2 0 0 26
1 1
Number of respondents who've perceived discrimnation
Students Employees
The data in Figure 3.2 shows that students had high response rates for feelings of discrimination based on race/ethnicity, sex, disability/ability, age and appearance. It should be noted that these results are based on perceptions, not reported incidents.
FIGURE 3.5: RESPONDENTS REPORTING EFFECTS OF “OFTEN/SOMETIMES” FEELING ISOLATED OR SENSE OF DISCRIMINATION AND/OR HARASSMENT

Cause
d me t
o perf
orm poor
ly
Negati
vely a
ffecte
d my g
rades
Led m
e to d
rop a
class
Influen
ced m
e to c
onsid
er lea
ving
Led m
e to s
eek em
ploym
ent e
lsewhere
02468
10121416
9
12
9
14
97
0 0
7 8
Students Employees
Participants were asked to reflect on whether any feeling of isolation or discrimination has affected their experiences or sense of belonging at FRC. While the overall responses in these areas are low, the numbers should still be considered. For example, experiences with isolation, discrimination and/or harassment may cause a student or employee to want to leave FRC or seek employment elsewhere. Again, while the rates are small, the implications on a small campus may be profound. Similarly, students who reported negative experiences around isolation or discrimination responded that these have negatively affected their academic performance and access to courses. As the college analyzes obstacles to student success, these results should be further investigated.
4. HAPPINESS
Measuring student and employee happiness provides yet another perspective of campus comfort levels.
FIGURE 4.1: OVERALL HAPPINESS 2019

FRC cares about me as a person Being a part of FRC is a positive experience
64%66%68%70%72%74%76%78%80%82%
74%
80%
70%
73%
Students Employees
A majority of students indicated that FRC cares about them as a person and that being a part of the FRC campus. The responses from employees are notably lower.
FIGURE 4.2: HOW HAPPY ARE YOU AT FRC?
“Very Happy”/ “Rather Happy”
Students 88%Employees 75%Women 91%Men 96%
Figure 4.2 shows a significant level of happiness among groups at FRC. Among all respondents, over 85% stated that they are rather happy at FRC.
However, when all respondents were asked about a “sense of belonging” at FRC (question 17), the response rates were more nuanced. While close to 70% of all respondents “strongly agreed” or “agreed” with this statement, 22% had “no opinion” about this, and over 8% of respondents “disagreed” or “disagreed strongly” about feeling like they “belong.” Among non-white student respondents (n=47), 8% indicated they did not feel like they belonged, and 19% had no opinion about this.
5. PROGRAM AWARENESS

As in past reports, over 85% of student respondents indicate their awareness of programs and services on campus, including Admissions and Records, Student Accounts, Academic Advising, Financial Aid/Scholarship Office, Instructional Resource Center/Library, Student Ambassador Program, Tutoring, TRiO/Student Support Services/Achieve Center, Child Development Center, Health Services, Book Voucher and Student Success Program, Wellness Center, Student housing, Internship program, DSPS (Disabled Students Programs & Services), CalWorks, and EOPS/CARE.
Listed in Figure 5.1 are programs on campus that are not well known to the students here at FRC.
FIGURE 5.1: STUDENT AWARENESS OF PROGRAMS AND RESOURCES 2019
Student HousingInternship Program
Wellness Center (Mental Health)Book Voucher and Student Success Program
Student Ambassador ProgramDSPS (Disabled Students Program and Services)
Instructional Resource Center/LibraryCalWorks
EOPS/CAREChild Development Center
TRiO/Student Support Services/Achieve CenterTutoring
Health ServicesAcademic Advising
Financial Aid/Scholarship OfficeStudent Accounts
Admissions and Records
0% 2% 4% 6% 8% 10% 12%3%
8%5%
4%9%
4%1%
11%8%
6%4%
1%8%
3%1%1%
0%
Percentage of Students Unaware of Certain Programs

Students are least aware of the Internship Program, Student Ambassador Program, CalWorks, EOPS/CARE, Child Development Center and Health Services. While some of these programs serve specific populations, others do not. The rates of unfamiliarity with health services, the Internship Program, and the Student Ambassador Program, of which provide resources for all students, deserve further analysis and discussion.
6. MEASURES OF SUCCESS AMONG STUDENT CATEGORIES
Education remains a valuable resource facilitating an individual’s opportunities and career success. Students who enter higher education often do so with these aspirations. Further, an educated population is a cornerstone for building a democratic society. Ensuring these opportunities for all students is a hallmark of the California community college system. FRC is committed to providing all students equal access to resources and a quality education. As throughout the system, success is measured in grades, graduation and transfer rates.
How different groups fare along these measures of success is an important area of research in the state of California today as explained in the introduction to this report. In addition, the research shows that the more hospitable the community college campus, and the more advising, counseling, and other support services provided, the greater the success rates among minority students.
With the theme of student success in mind, this report looks more qualitatively at measures of “success” by different groups at FRC as provided by the Institutional Research and Planning Office. From these observations it may be concluded that the success rates of some student groups appear to reflect the statewide data. Given this similarity, this report will highlight some of the recommendations from recent literature on student success and California community colleges.

FIGURE 6.1: SUCCESS RATES BY ON-CAMPUS STUDENT GROUPS IN 2017-18
Asian
Africa
n-American
Hispan
icWhit
eFili
pino
Native
Ameri
cans
Pacific I
slande
r0%
5%
10%
15%
20%
25%
30%
35%31%
14% 14%
9% 8%11%
9%
FIGURE 6.2: NUMBER OF STUDENTS IN EACH STUDENT GROUP IN 2017-18
On-campus Success Cohort
Asian 9 29
African-American 21 149
Hispanic 23 166
White 93 1091
Filipino 1 12
Native American 6 54
Pacific Islander 3 33
The data available from the Institutional Research and Planning Office defines success as students who received an associate’s degree, transfer degree, or certificate. This data shows that even though White students make up the majority of the on-campus student group, they have one of the

lowest success rates. This reveals a common trend among community colleges of students who belong to privileged racial groups that are under-performing. Further disaggregation of these numbers is necessary. For example, what other variables affect this population’s success?
FRC greatest advantage to build upon when assuring a climate of student success is its supportive campus environment where most students are comfortable and happy.
7. PERSPECTIVES AROUND SUPPORT IN ACHIEVING EDUCATIONAL GOALS
Students were asked an open-ended question about the support they receive in order to meet their academic and career goals. The majority of comments were overwhelmingly positive, praising FRC for its supportive environment, staff, and its family-like system of support.
Some students offered more specific feedback. Among the over seventy responses, a few areas stood out: tutoring services, advising support, and scheduling. Here are some of these responses.
Transportation is the main thing holding me back. I signed up for a tutor weeks ago no response
I wish tutoring wasn't tutored by fellow students. I think there should be an actual professor that tutors each subject but i understand that would be difficult.
More tutoring options and study groups
FRC can help me as well as many other students with helping in completing our educational goal would be offering more workshops that help you choose a career you would seek interest in so that students know what they are trying to earn so that they have a certain goal in mind. If there was also a more tutoring available all the time during the day that would help greatly because most of the time tutors are not available when you need them.
FRC could help me and many other students by somehow encouraging more students to sign-up. Though it is a very small school, there still are a lot of brilliant minded individuals who could help other students and help themselves my making a little extra money. My first semester here, I struggled with math. There wasn’t very many options and not enough time to get help. I wanted more time with my tutor, but there wasn’t any available. Due to a lack of tutors available for calculus. Other than that, I’ve had a great experience.

I was told that I was signed up for enough units to stay on track for my bachelors and found out I was not
I need to be able to complete my educational goal; receiving my AA degree by not being held back because of having too many units.
I would like help to choose my classes and major around my work schedule
I feel FRC could help with assisting with the right classes needed in what we're majoring in because it seems as if they just put us on classes that have openings.
Offer events that fit better with athlete schedules since that is the bulk of student population
FRC has helped me overcome the financial challenges that have come with college. Through book vouchers, trio, and helping me find outside scholarship college has become a reality and I am no longer afraid of accumulating a lot of debt.
If I’m considering transferring I want to know that I’m on the right path to transferring and I feel there is no communication with academic advisors.
Additionally, a few comments were made about the poor condition of the student lounge, and one comment worth noting was about the need for more lighting on campus for safety reasons.
CONCLUSIONS AND RECOMMENDATIONS
Use the Climate Project Report in the College’s planning. Some
changes to the climate survey should be considered, such as the omission of respondent perceptions of others’ comfort on campus. A future survey should also include demographic questions on years at FRC.
Build publicity and improve advertising of campus services, programs and activities with publically available, accessible, current, and thorough information. This is important as these are services and resources that provide students avenues to success or provide important social connections for students at FRC who are a long way from home. Progress towards and completion of the College website will be instrumental for addressing this recommendation.

Capitalize on the campus’s overall comfort with and support for diversity by sponsoring activities and events that facilitate learning and discussion around issues surrounding race, ethnicity, class, sex and gender. Such programming can be supported by the Diversity Committee, the Professional Development Committee, and with some budget allocation to support curriculum and the College’s mission and accomplishment of student learning outcomes.
Continue sexual-harassment training among employees, and consider including a more robust (re-)training every 3-5 years to avoid complacency and redundancy (i.e., mandatory Safe-Spaces training, guest speakers/trainers, EEO awareness activities). Consider expanding this training to students.
Review current literature on student success among different race/ethnic groups in California (e.g., The Civil Rights Project at UCLA) and include these in campus conversations about advising and counseling resources. Advisors and student services personnel should also be supported in researching best practices and approaches for serving minority student populations.

REFERENCES
California Community College Student Success Initiative. 2016-2017 Student Success Scorecard. California Community College Chancellors Office. https://scorecard.cccco.edu/scorecardrates.aspx?CollegeID=000#home. Accessed June 3, 2019.
California Department of Education. Graduation Rates - 2016, edited by Tom Torlakson, California Department of Education, 17 May 2016, www.cde.ca.gov/nr/ne/yr16/yr16rel38.asp. Accessed 25 May 2019.
Campaign for College Opportunity.2018. “State of Higher Education for Latinx in California.”
November 14, 2018. https://collegecampaign.org/portfolio/state-higher-education-latinx-california/ (June 3, 2019).

APPENDIX A: SURVEY
Campus Climate Survey 2019
Introduction
Dear Survey Participant,
Thank you for participating in this survey. The purpose of this survey is to gain information about student and employee perceptions of campus diversity, comfort levels on campus, and experiences with equality and diversity at FRC.
Campus "climate" refers to the general atmosphere of the campus as a unique community and the degree to which members of the campus community feel included, personally safe, listened to, valued and treated fairly. Campus "climate," is NOT about the temperature of offices and classrooms =)
In order to draw as much meaning as possible from the survey results, please answer these questions as honestly as possible. The decision to participate in this study is completely voluntary. Your responses will not be identified with you personally. Answers will only be reported in aggregate - as part of a group response.
The survey will take about 10-15 minutes to complete. Once you’re done, you can click on a link that will take you to the survey drawing for prizes. Prizes include a week-long, upper-lot parking pass, Eagle's Perch meal cards, and various other gift cards for local businesses. If you choose to enter the drawing, you will be asked to provide an email address at the end of the survey (a link to a separate survey tool). This information is not linked to your survey responses!
If you have any questions about this survey, please forward them to:
Michelle PetroeljeDirector, Student Success and Support [email protected]
or
Katie Desmond [email protected]

SURVEY QUESTIONS AND RAW RESULTS
Q1. I have read and understood the informed consent and agree the participate in the study
Yes No
Q2. Check which category applies best to you and your role on the FRC campus: Staff/Administrator Faculty (Full-Time or Associate) Student
Q3. Student Status
Full-time Student (12 units or more) 81.12% 116Online only student 0.70% 1Part-time Student (11 units or less) 18.18% 26TOTAL 143
Q4. Are you a first generation college student?
Yes 50.35% 72No 45.45% 65I don't know 4.20% 6TOTAL 143
Q5. Are you a student athlete?
Yes 34.97% 50No 65.03% 93TOTAL 143
Q6. Do you receive any of the following financial assistance?
California College Promise Grant (formerly called the BOG Waiver)
71.74% 66
Pell grant 75.00% 69Cal grant 38.04% 35Total Respondents: 92

Q7. How would you rate the following support programs?
Excellent Good Average Poor No Opinion / Never
Utilized
Not aware of the
program
Total
Weighted
Average
Admissions and Records
50.35% 71
39.01%
55
7.09%
10
0.71%
1 2.84%
4 0.00% 0 141 1.67
Student Accounts 37.59% 53
46.10%
65
7.80%
11
0.00%
0 7.09%
10 1.42% 2 141 1.97
Financial Aid/Scholarship Office
41.84% 59
34.75%
49
10.64%
15
0.71%
1 11.35%
16 0.71% 1 141 2.07
Academic Advising/Transfer Center
45.39% 64
29.79%
42
8.51%
12
0.71%
1 12.77%
18 2.84% 4 141 2.14
Health Services 22.14% 31
28.57%
40
5.00%
7 0.71%
1 35.71%
50 7.86% 11 140 3.23
Tutoring 27.66% 39
24.11%
34
6.38%
9 2.84%
4 37.59%
53 1.42% 2 141 3.03
TRiO/Student Support Services/Achieve Center
35.46% 50
21.99%
31
1.42%
2 0.71%
1 36.88%
52 3.55% 5 141 2.92
Child Development Center
16.43% 23
12.14%
17
3.57%
5 0.00%
0 62.14%
87 5.71% 8 140 3.96
EOPS/CARE 31.43% 44
18.57%
26
3.57%
5 0.71%
1 37.86%
53 7.86% 11 140 3.19
CalWorks 18.44% 26
14.89%
21
4.96%
7 0.71%
1 49.65%
70 11.35%
16 141 3.82
Instructional Resource Center/Library
56.74% 80
31.91%
45
4.26%
6 0.00%
0 5.67%
8 1.42% 2 141 1.7
DSPS (Disabled Students Programs & Services)
29.08% 41
17.73%
25
0.71%
1 0.71%
1 47.52%
67 4.26% 6 141 3.33
Student Ambassador Program
16.31% 23
15.60%
22
4.96%
7 0.00%
0 53.90%
76 9.22% 13 141 3.87
Book Voucher and 49.65% 7 20.57 2 4.26 6 0.00 0 21.99 31 3.55% 5 141 2.35

Student Success program
0 % 9 % % %
Wellness Center (Mental Health)
22.86% 32
21.43%
30
2.86%
4 0.71%
1 47.14%
66 5.00% 7 140 3.43
Internship program 20.71% 29
18.57%
26
2.86%
4 0.00%
0 50.00%
70 7.86% 11 140 3.64
Student housing 11.43% 16
15.00%
21
19.29%
27
8.57%
12
42.86%
60 2.86% 4 140 3.65

Q8. How would you rate the following student activities and resources?
Excellent Good Average Poor No Opinion /
Never Utilized
Not aware of
the program
Total
Weighted
Average
Student Research Symposium
14.89%
21 18.44%
26
7.80%
11
3.55%
5 39.01%
55 16.31%
23
141 3.82
First Year Experience program
18.44%
26 25.53%
36
8.51%
12
0.71%
1 31.21%
44 15.60%
22
141 3.48
Week of Welcome/ Week of Welcome Back (Dinner & Inflatables, Bowling & Tacos, Movie on the Green, Climbing Wall, Resource Fair, etc.)
42.55%
60 32.62%
46
7.80%
11
0.00%
0 14.89%
21 2.13%
3 141 2.18
Spirit Week (Green & Gold lunch, Chili cook off, PJ & Pancake Dinner, Rodeo and athletic games)
38.57%
54 27.86%
39
11.43%
16
1.43%
2 15.71%
22 5.00%
7 140 2.43
ASFRC (Associated Students of Feather River College)
13.48%
19 19.15%
27
7.09%
10
0.71%
1 47.52%
67 12.06%
17
141 3.86
Phi Theta Kappa 21.99%
31 12.06%
17
4.26%
6 0.71%
1 47.52%
67 13.48%
19
141 3.8
The Annual Horse Sale 10.64%
15 14.18%
20
0.71%
1 0.00%
0 56.74%
80 17.73%
25
141 4.31
Eagle Pride 29.79%
42 20.57%
29
8.51%
12
2.13%
3 30.50%
43 8.51%
12
141 3.09
Student Environmental Association
17.02%
24 19.15%
27
3.55%
5 0.71%
1 44.68%
63 14.89%
21
141 3.82
Black Student Union 16.31%
23 14.18%
20
2.13%
3 0.71%
1 56.74%
80 9.93%
14
141 3.97
Bike Barn bicycle lending program
8.51%
12 7.09%
10
4.26%
6 0.00%
0 53.19%
75 26.95%
38
141 4.63
Climbing Wall student hours 19.86%
28 18.44%
26
4.26%
6 0.00%
0 45.39%
64 12.06%
17
141 3.69
Student Lounge 27.66%
39 34.75%
49
13.48%
19
7.80%
11
13.48%
19 2.84%
4 141 2.53

The FRC mobile app 42.55%
60 35.46%
50
7.80%
11
2.13%
3 7.80%
11 4.26%
6 141 2.1

Q9. How can FRC help you overcome challenges in order for you to complete your educational goal? For example, feel a part of a community at FRC; help you with academic struggles; help you choose a major and classes; assist with career preparation and planning; or other?
By not making you believe you will receive a degree(s) then tell you after the fact that you may only choose one.
I would like help to choose my classes and major around my work schedule
Offering the current line up of services, FRC has already help me overcome the challenges ive faced.
free food
FRC is the best college I have attended, I would not change a single thing.
Better explaining on what the plan is for classes of your major. Better planning out of the years here at FRC.
I wish tutoring wasn't tutored by fellow students. I think there should be an actual professor that tutors each subject but i understand that would be difficult.
I fell that being part of Feather River College is like home to me. Some struggles I get were passing my tests and hard assignments that are given. My major goal is to do Culinary Arts and receive an Associates Degree. My assistance from the DSPS by Mrs. Marcy gave me the opportunity to move on and become a
The student lounge could be cleaner, I have my 2 yr old grandson in there, most days its gross in there
Maybe a meal plan.
I wish we could have more time with counselors to help plan our future
FRC can help in providing more information on when athletic home games are happening.
Transportation is the main thing holding me back. I signed up for a tutor weeks ago no response
I would like to see the students who play sports work harder in class
I feel as if I can go up to anyone and talk to them about anything whether it has to do with school or personal. I also feel all the classes I have taken are very useful and I use the information in my daily life.
FRC doesn't need to do anything for me to complete my education goal, I just need to put myself out there.
FRC has helped me with the process of completing my education goals by having great programs and amazing staff that can be utilized to help steer me in the right direction.

Everyone and everything has been great
I feel like the students who do sports need to do their work
I think FRC is doing a great job
Get better WiFi
I have been getting the help I need through the programs I'm in.
I feel like FRC is doing a pretty good job. The only thing that may be a bit lacking, is the counseling office. There seems to be a confusion about which classes should or could be taken in certain programs.
I feel that being able to connect with other students of the same major or mindset could prove beneficial as you can discuss similar classes and attitudes. If there were certain clubs or ways to get ahold of other students I believe it would prove extremely helpful.
Help with academic struggles, and help me not to stress bout personal relations and school.
Advisers. Also having a place open for food or snacks later in the day would help.
Unify the students
Our campus does a great job of making students feel included
I’m motivated a lot through the sport I play. I feel like it’s one of the main reasons I’m in school. If I can’t get a scholarship to go to the next level, it could be over for me and FRC provides me an opportunity to get out.
Get more student ambassadors to encourage students to get out there
FRC can help me as well as many other students with helping in completing our educational goal would be offering more workshops that help you choose a career you would seek interest in so that students know what they are trying to earn so that they have a certain goal in mind. If there was also a more tutoring available all the time during the day that would help greatly because most of the time tutors are not available when you need them.
FRC could help me and many other students by somehow encouraging more students to sign-up. Though it is a very small school, there still are a lot of brilliant minded individuals who could help other students and help themselves my making a little extra money. My first semester here, I struggled with math. There wasn’t very many options and not enough time to get help. I wanted more time with my tutor, but there wasn’t any available. Due to a lack of tutors available for calculus. Other than that, I’ve had a great experience.
Have more diversity thing, like the BSU club is really helpful.
I was told that I was signed up for enough units to stay on track for my bachelors and found out I was not

I think FRC has done a great job at a lot of things. But if anything you could always get more help with career preparation.
I need to be able to complete my educational goal; receiving my AA degree by not being held back because of having too many units.
I feel there is a lot of support for anyone facing challenges.
I feel FRC could help with assisting with the right classes needed in what we're majoring in because it seems as if they just put us on classes that have openings.
Offer events that fit better with athlete schedules since that is the bulk of student population
Staff and students make you feel welcomed and at home Teachers are so helpful in anything you need along with our staff Everyone’s so encouraging to get you to graduate and do better things in life
FRC has helped me over come the financial challenges that have come with college. Through book vouchers, trio, and helping me find outside scholarship college has become a reality and I am no longer afraid of accumulating a lot of debt.
Honestly nothing as of right now. I’ll be graduating this May.
I feel that FRC has done an excellent job taking care of me for the time that I've been here. The only time that I ever had any trouble was when I was trying to get out of academic probation, no one seemed to know what to do or what papers I needed to fill out and I had to go to the office 3 separate times to get that managed properly. All considered though you are all very supportive! Thank you!
FRC is like a family run community. Everyone is looking out for you and wants you to succeed. There is always someone to help if you need it. Great environment!
Have better ways to get the word out about these programs and how to get involved with them.
FRC really helps me with classes and being successful academically.
More tutoring options and study groups
If I’m considering transferring I want to know that I’m on the right path to transferring and I feel there is no communication with academic advisors.
Bring in more speakers from different parts of the medical field

Q10. Please rate your opinion on the following statements.
0.00%10.00%20.00%30.00%40.00%50.00%60.00%70.00%80.00%
Strongly AgreeAgreeNo Opinion/ NeutralDisagreeStrongly DisagreeDoes Not Apply

Q11. Overall, how comfortable are you with the climate (degree to which you feel included, personally safe, listened to, valued and treated fairly) in your classes?
Very Comfortable 43.17% 60Comfortable 47.48% 66Neutral/Indifferent 8.63% 12Uncomfortable 0.72% 1Very Uncomfortable 0.00% 0Not Applicable 0.00% 0TOTAL 24
If you would like to comment or elaborate on any of your answers, please do so here.
As a brown woman I have felt that FRC has been making efforts towards a more safe and diverse environment and I appreciate it
"Clicks" of students from wealthy families are common and seem to look down on anyone outside of their group and it causes self confidence issues for the outsiders. Even more so when instructors have a obvious bond with the group engaging in conversation that seems to take over the time span.
Student lounge floor is gross that's where I have my 2yr old grandson in there
The only question I was wondering was where did someone get all these wonderful instructors
Students who play sports should not be able to slide by in class
The students who play sports need to do their school work and not to be allowed to skate by
I do not care for the students that are not prepared for the class. ie books and materials. I cannot stand the high schoolers that think I am here to pick up after them and because they are here their shit doesn't stink. They treat this student as if I'm their lackey. I am not their mother, this is college, act like an adult, if you can't, don't be here.
Thanks for a fun and welcoming little campus!
I know that this college focuses heavily on the two major aspects of the school, equine/agriculture, and sports, but this heavy reliance segregates the others who don’t share the same major or interests. I’m a nursing major at FRC, and don’t know who the instructor is who teaches the class.
I think it would be best if Instructors didn't mark down due to weather because we can't control it.

FRC provides a great, friendly environment that allows us students to feel comfortable to speak and just be ourselves in class.
There are some people on this campus that has a confederate flag and makes me feel uncomfortable.
As students of color, I would just add that sometimes there’s an uneasy feeling around non colored people, which is the majority of Quincy.
This campus is super diverse and the professors bring in learning opportunities through culture.
There is a teacher who constantly picks favorites and it is very obvious but she does not seem to care.
I think that the questions offered here are a little broad, I think narrowing them down will help, for example someone might feel comfortable in one class and not another.
Given my...unorthodox educational background (being homeschooled before skipping high school and coming to FRC as a young teen), this place may have had more of an impact on my development than any other in my entire life. Of course I'm comfortable here!
How to make child care not expensive, when your on a fixed income
So far I love all my teachers, I'm usually better at talking with women though.
Please pay attention to the issues of heat in the classrooms. It is so uncomfortable and affects the ability to do well.
All the staff that I have met over the two years I was here has been very interacting and respectful.
I think the teachers here support diversity, and are very great here at FRC.
This semester all of my teachers are doing an outstanding job
Nicest staff I’ve had the pleasure to associate with

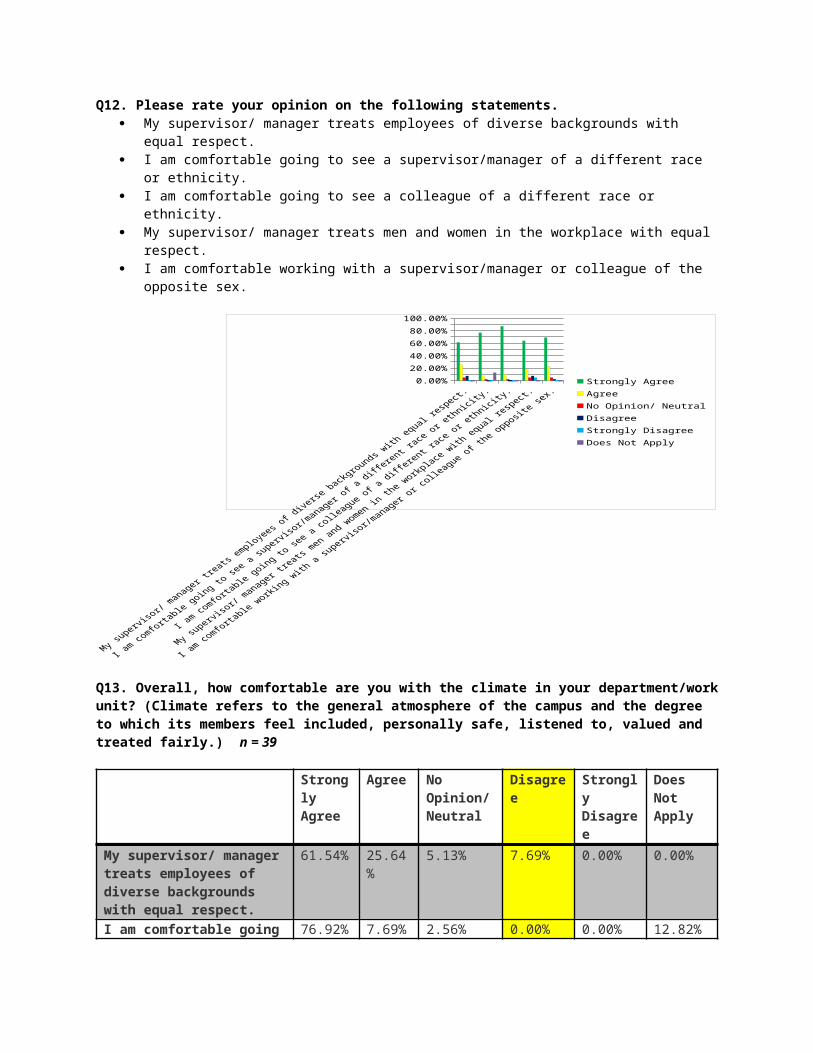
Q12. Please rate your opinion on the following statements. My supervisor/ manager treats employees of diverse backgrounds with equal respect. I am comfortable going to see a supervisor/manager of a different race or ethnicity. I am comfortable going to see a colleague of a different race or ethnicity. My supervisor/ manager treats men and women in the workplace with equal respect. I am comfortable working with a supervisor/manager or colleague of the opposite
sex.
0.00%20.00%40.00%60.00%80.00%
100.00%
Strongly AgreeAgreeNo Opinion/ NeutralDisagreeStrongly DisagreeDoes Not Apply
Q13. Overall, how comfortable are you with the climate in your department/work unit? (Climate refers to the general atmosphere of the campus and the degree to which its members feel included, personally safe, listened to, valued and treated fairly.) n = 39
Strongly Agree
Agree No Opinion/ Neutral
Disagree
Strongly Disagree
Does Not Apply
My supervisor/ manager treats employees of diverse backgrounds with equal respect.
61.54% 25.64%
5.13% 7.69% 0.00% 0.00%
I am comfortable going to see a supervisor/manager of a different race or ethnicity.
76.92% 7.69% 2.56% 0.00% 0.00% 12.82%
I am comfortable going to see a colleague of a different race or ethnicity.
87.18% 10.26%
2.56% 0.00% 0.00% 0.00%
My supervisor/ manager 64.10% 17.95 5.13% 7.69% 5.13% 0.00%

treats men and women in the workplace with equal respect.
%
I am comfortable working with a supervisor/manager or colleague of the opposite sex.
69.23% 23.08%
5.13% 2.56% 0.00% 0.00%
Q14. Please read these statements carefully and indicate your opinion. n= 175
Strongly Agree
Agree No Opinion/ Neutral
Disagree
Strongly Disagree
I feel uncomfortable around members of the campus whose race/ethnicity is different from mine.
6.86% 5.14% 6.29% 31.43% 50.29%
I feel uncomfortable around members of the campus whose social class is different from mine.
5.14% 8.00% 9.71% 29.71% 47.43%
I feel uncomfortable around members of the campus whose sex is different from mine.
5.14% 4.57% 9.14% 30.29% 50.86%
I feel uncomfortable around members of the campus whose sexual orientation is different from mine.
4.57% 5.71% 7.43% 28.00% 54.29%
I feel uncomfortable in a setting where I am the only person of my race, ethnicity, religion, sexual orientation or ability.
5.14% 9.71% 17.14% 27.43% 40.57%
I feel uncomfortable around members of the campus whose gender identity is different from mine.
4.57% 4.00% 8.57% 30.29% 52.57%
I feel uncomfortable with the backgrounds or lifestyles of others on the FRC campus.
4.57% 4.00% 10.29% 33.71% 47.43%
Q15. I am guarded or cautious in my interactions with individuals I perceive to be from a racial/ ethnic group other than my own.

Alway
sOfte
n
No Opin
ion/ N
eutral
Someti
mesNeve
r0.00%5.00%
10.00%15.00%20.00%25.00%30.00%35.00%40.00%45.00%
Responses

Q16. Do you think all students are treated equally at FRC?
Yes No I don't know0.00%
10.00%
20.00%
30.00%
40.00%
50.00%
60.00%
Responses
Comments:
I would like to see more diversity among Feather River staff, including and especially professors.
There is a strong culture of stereotypes like the underprepared and troublesome football players, the student athletes vs non-athlete students etc. There are some gross inequalities between male and female student athletes etc etc etc
Ethnic "clicks" also form and are closed off to opposite race in the same way social classes have closed off groups.
I feel like the students who does sports gets treated better when it comes to class work
I think that students who make the effort to engage with faculty and staff benefit from their efforts. College is like most things in life, the more you put in, the more you get out.
The degree of discomfort or comfort, asked in the previous questions, might come largely from personal background and professional experience considering how the questions are asked, not necessarily from a "campus climate". The questions don't really differentiate the two and yet this distinction seems relevant to the survey.
Students who play sports are usually treated better

Students who play sports need to do their school work,
I think there is some stigma related to black male students. I also think there is stigma related to students with disabilities.
I have not personally witnessed students being treated unequally, but I have heard race-based comments from staff about students, so I assume it is unlikely that students are treated equally by all staff.
Student to an unknown student, some are not friendly, they would rather associate with in their group.
Everyone’s pretty kind to each other at FRC from what I can tell! It’s a pretty special campus really.
Some teachers are different from others
The college is very diverse and I feel that everybody is comfortable with each other because we do have that diversity.
I noticed that events for people of different races or sexuality are much more advertised than any other kind of event
out of state students are not
I think that people will see people how they want. You can enlighten them on the different perspectives on it but overall you may not change them.
Student who play sports gets treated a little better for half the work
So far from what I've seen everyone is treated pretty nicely.
I don't think the students necessarily always respect different; however, I believe there is more acceptance here than another university or JUCO. The faculty is always willing to help, and that isn't based on color, gender, or sexual orientation-- rather the programs they fit in, if it will benefit them, and/or the students wants and needs.
I've heard good and bad on how some students were treated.
I think the instructors treat the students equally but the students can be mean to each other, no matter what is different about them.
I don't know every teacher but my teachers treat everyone equally.
Sports players are treated better
My biggest fear is accidentally offending someone of different ethnic background or sexual orientation even though I have no prejudices

The inequality on campus is not about race, ethnicity, gender, etc. it’s more of a difference between sports students and those not in a sport. Teachers know the sports students better and they tailor examples in class towards sports when some of us have no idea what happened in most sports
The question about being uncomfortable when I am the only person of my "kind" (on previous page, in item 1) - I feel this never / rarely happens to me, given I am a white, straight female. I imagine that if it did, I might feel slightly uncomfortable.
I have heard of favoritism with faculty who treat some students better than others especially those who come from comfortable life styles.
I am guarded with my interactions with everybody, including staff. It has nothing to do with ethnicity or race.

Q17. Please read these statements carefully and indicate your opinion: n=172
0.00%10.00%20.00%30.00%40.00%50.00%60.00%70.00%
Strongly AgreeAgreeNo Opinion/ NeutralDisagreeStrongly Disagree

Q18. Overall, how comfortable are you with the climate of diversity at FRC? n=172
Very Comfortable 46.51% 80
Comfortable 40.12% 69Neutral/Indifferent 11.63% 20Uncomfortable 1.74% 3Very Uncomfortable 0.00% 0If you would like to comment or elaborate on any of your answers, please do so here.
17
Answered 172
Comments:
As I mentioned before, as student diversity increases, I believe it is important to also increase staff diversity. It is hard to relate sometimes, when that person does not see things the same.
It’s not a diverse campus run by mostly white males.... and where it is accepted culture that female employees do way more work.
Campus clubs are easy to form bonds with peers. However groups in general that are formed by ethnic or social class are obviously separate from from their opposites but few of these groups exist.
To be clear, the lack of safety comes from administration.
I dont feel safe on campus when I'm walking to my vehicle after an evening class. It's really dark and I think more light posts should be distributed around campus, especially by the science building.
To be clear, since I think this question is worded somewhat unclearly, I am answering "uncomfortable," meaning that I feel strongly that the staff needs to better reflect the diversity of the student body if our diverse students are to feel respected, understood, and safe. I do not mean that I feel uncomfortable with people of diverse backgrounds.
I'm a social outcast and it is hard to make friends
I love FRC and how welcoming everyone is! I also like how we have so much diversity and people from all over the country and from other countries. You learn many things from new people you meet and it’s very neat to me!
This campus has a lot of love to offer be open to it
I love how diverse It is here at FRC. Feels like home since I am from Hawaii were kind of the same.
more diversity would be cool
Sometimes I'm worried about the possibility of bears or mountain lions on campus, especially at night.

Since I'm back it's been a great experience
I would like to push myself out of my "bubble" of liberalness more.

Q19. Please rate your opinion on the following statements.
Strongly Agree
Agree No Opinion/ Neutral
Disagree Strongly Disagree
FRC should put more emphasis on diversity in curriculum.
16.86%
29
22.09%
38 54.07%
93 6.40%
11 0.58%
1
FRC should offer more diversity-themed courses.
15.70%
27
33.72%
58 45.35%
78 4.65%
8 0.58%
1
FRC should strive for a more diverse staff, faculty, and administration.
24.42%
42
23.84%
41 44.77%
77 5.81%
10 1.16%
2
It is important for FRC to have a diverse campus community.
39.53%
68
40.70%
70 18.60%
32 1.16%
2 0.00%
0
Comments:I'm not sure what putting more emphasis on diversity in curriculum means. Too vague.
Under the current administration FRC won't have diversity among employees.
The only reason I disagree is because I feel like are campus is incredibly diverse. It's one of the most diverse campus' I've been to and I don't think FRC needs to add more. We're doing a good job at being diverse!
There should be an effort to match up or get close to matching the percentage of staff/faculty who are people of color as it relates to the percentage of students who are of color
There is not a single Black male or female professor that I know of... not to mention all the other ethnicities underrepresented - especially when the student body has a good amount of African American students there needs to be more staff and leadership positions with Black men and women
The lack of diversity that I’ve had in my own experience of teachers is poor. Though they were all great, they just weren’t a diverse group racially. FRC does a great job when it comes to diversity in gender.
As students I feel our campus is very diverse with people from all over the US and even people who are from all over the world!
Don’t need more, for a small school there are plenty
I feel on the topic regarding the diversity of staff I strongly disagree with having a more diverse campus because it’s not about diversity. It’s about who can do their job the best and who can provide the best atmosphere for student learning. If someone who is white is more qualified to teach and be a role model than someone of color. We should not put the fact we need diversity over the fact we need a safe and strong
learning environment for the students. It should be about student life and students growing and learning. Not the diversity of the teachers race.
Creative writing. Woman studies. Possibly BA program for Art History and Studio Arts.

Q20. Please rate the frequency of occurrence in the following questions. You can comment on or elaborate your answers in the text box below. I have felt DISCRIMINATED &/or HARASSED at FRC because of my: n=172
Often Sometimes
Rarely Never No Opinion
Weighted
Average
Race or ethnicity
1.16%
2 2.33%
4 9.88%
17 80.23%
138 6.40%
11
3.88
Sex 2.33%
4 6.98%
12
12.21%
21 74.42%
128 4.07%
7 3.71
Sexual orientation
1.16%
2 1.74%
3 2.33%
4 88.95%
153 5.81%
10
3.97
Gender identity
1.16%
2 0.00%
0 1.74%
3 90.70%
156 6.40%
11
4.01
Disability/ Ability
1.16%
2 5.81%
10
5.81%
10 77.33%
133 9.88%
17
3.89
Homelessness 1.16%
2 1.16%
2 1.74%
3 76.74%
132 19.19%
33
4.12
Foster youth status
1.16%
2 0.58%
1 0.58%
1 75.00%
129 22.67%
39
4.17
Age 2.91%
5 6.98%
12
11.05%
19 74.42%
128 4.65%
8 3.71
Religious preference
0.58%
1 6.40%
11
4.07%
7 77.33%
133 11.63%
20
3.93
Veteran status
1.16%
2 0.00%
0 0.58%
1 74.42%
128 23.84%
41
4.2
Appearance 2.91%
5 6.40%
11
14.53%
25 68.60%
118 7.56%
13
3.72
Country of origin
1.16%
2 0.58%
1 4.65%
8 80.81%
139 12.79%
22
4.03
Language/ Accent
1.16%
2 1.74%
3 2.91%
5 80.81%
139 13.37%
23
4.03
Financial standing
1.16%
2 4.07%
7 5.81%
10 79.65%
137 9.30%
16
3.92
Immigration status
1.16%
2 0.58%
1 1.16%
2 77.91%
134 19.19%
33
4.13
Q21. Feeling discriminated against or harassed has... n=172
Strongly Agree
Agree
Somewhat Agree
Somewhat Disagree
Disagree
Strongly Disagree
N/A Weighted Average
caused me to perform poorly in school or work
1.16% 3.49% 4.65% 0.58% 18.02% 19.19% 52.91% 3.98
negatively affected my grades
1.16% 2.33% 3.49% 1.16% 16.28% 18.02% 57.56% 4.04

led me to drop a class
1.16% 3.49% 0.58% 1.16% 15.70% 20.35% 57.56% 4.18
influenced me to consider leaving FRC
3.49% 4.07% 4.65% 3.49% 11.63% 24.42% 48.26% 3.87
led me to seek employment elsewhere
1.74% 3.49% 4.65% 0.58% 11.05% 25.00% 53.49% 4.06
Comments:
It was semester of Fall 2018 and I was told I was to slow in Culinary and wasn't doing anything right regardless if I was having back problems. I still passed the class with a 93%
As a white cis-gender heterosexual female I don't feel discriminated against but I also have a lot of privilege so I can't really say how these factors affect others
I did drop a class once because the Professor kept spouting political opinions instead of teach psychology but, now that professor is gone anyway.
Q22. Please rate the frequency of occurrence in the following questions. You can comment on or elaborate your answers in the text box below. n=172
I have felt ISOLATED (alone) at FRC because of my:
Often Sometimes
Rarely Never No Opinion
Race or ethnicity 1.16% 2.33% 2.91% 83.14% 10.47%Sex 0.58% 4.07% 2.33% 83.14% 9.88%Sexual orientation 1.16% 0.00% 2.91% 84.88% 11.05%Gender identity 0.58% 1.16% 1.16% 86.05% 11.05%Disability/ Ability 1.74% 4.65% 3.49% 75.58% 14.53%Homelessness 0.58% 1.16% 0.58% 76.74% 20.93%Foster youth status 0.58% 0.58% 0.00% 76.74% 22.09%Age 2.33% 6.98% 4.07% 77.91% 8.72%Religious preference 1.16% 2.91% 2.91% 77.33% 15.70%Veteran status 0.58% 0.00z 0.00% 75.58% 23.84%Appearance 1.74% 7.56% 6.40% 71.51% 12.79%Country of origin 0.58% 1.16% 0.58% 80.81% 16.86%Language/ Accent 0.58% 0.58% 1.74% 80.23% 16.86%Financial standing 0.58% 2.33% 4.07% 80.81% 12.21%Immigration status 0.58% 0.58% 0.00% 78.49% 20.35%

Q23. Feeling isolated (alone) has... n=172
Strongly Agree
Agree
Somewhat Agree
Somewhat Disagree
Disagree
Strongly Disagree
N/A Weighted Total
caused me to perform poorly in school or work
1.74% 2.91%
6.40% 2.91% 15.12% 27.33% 43.60%
4.01
negatively affected my grades
0.58% 2.33%
5.23% 0.58% 14.53% 24.42% 52.33%
4.15
led me drop a class
0.58% 1.16%
1.16% 1.74% 16.28% 26.16% 52.91%
4.38
influenced me to consider leaving FRC
2.33% 2.33%
6.40% 0.58% 13.95% 30.23% 44.19%
4.09
led me to seek employment elsewhere
1.16% 1.16%
2.91% 1.74% 13.37% 27.33% 52.33%
4.29
Comments: Employment status as an AF has led to professional isolation. There is no orientation or support programs for AF. I feel I could be a better instructor if I was given more professional support of FRC’s academic culture/expectations.
Need a new food that has taste and cheaper
I feel in a class like Sociology 100, where we talk about masculinity and femininity, we need to have an even split of males and females in the class. I feel that classes such as these need to have a pretty even split of males to females because having a class swayed heavily to the female side only perpetuates discussion around female problems because males feel they cannot speak about their problems or views because we live in a day and age where female problems are talked about way more often than male problems. Having an even split would create more discussions and perpetuate conversations that can add the growth of those taking the class.
Q24. FRC cares about me as a person. n=172
Strongly Agree 31.98% 55Agree 45.35% 78No Opinion/ 18.60% 32

NeutralDisagree 2.91% 5Strongly Disagree
1.16% 2
Q25. Being a part of the FRC campus community is a positive experience for me.
Strongly Agree 37.79% 65Agree 45.35% 78No Opinion/ Neutral 13.37% 23Disagree 2.33% 4Strongly Disagree 1.16% 2Please elaborate if you would like.
16
Comments: This IS a great college, with great staff. Very helpful with smiles all around.
I am old, poor, and disabled. I feel alone a lot I have a hard time keeping information straight in my head
It’s hard having a major that is not focused on.
The FRC community is very strong and welcoming to all students.
I feel that our staff works hard for everyone and cares for everyone that is why FRC is so special
I met my awesome girlfriend
This place is my home. That is all I have to say.
Staff has encouraged me and assisted me in ways that I would never be able to express my gratitude. so blessed to have entered this community college.
I don't think I would have been as successful without attending FRC
Making me feel wanted In the school helps a lot.
I don't feel like FRC encourages individual thought in many classes. A lot of it is just repeating information that your teacher told you because it's going to be on a test - my main problem with high school. If there were more open ended assignments, that would be beneficial, especially since the staff to student ratio is so high, allowing for instructors to give real feedback to their students.
My colleagues are friendly, respectful, and supportive. The campus atmosphere is a lot calmer here than at really large universities. I enjoy attending the special events and listening to the guest speakers. Prices are very reasonable.
I love that everyone has treated me with respect regardless of sex, gender, sexual orientation etc.

I’m terrible at making friends, I feel like I’m missing that part of my college experience but FRC has been wonderful for me
I love working at FRC and am proud to be an employee of this college.
I don't really participate in any community, no friends.

Q26. Would you say you are…
Very happy at FRC. 46.51% 80Rather happy at FRC. 44.77% 77Not very happy at FRC. 8.14% 14Not at all happy at FRC. 0.58% 1
Q27. In this section, you will be asked demographic questions that will be used to sort and analyze responses.What gender do you identify with?
Female 67.44% 116Male 30.81% 53Non-binary / Gender fluid
1.16% 2
Other 0.58% 1
Q28. What is your age?
under 18 years old
1.74% 3
18-25 years old 63.37% 10926-30 years old 4.07% 731-40 years old 9.30% 1641-50 years old 10.47% 1851-64 years old 10.47% 1865 years and over
0.58% 1
Q29. Select one for more of the following “races”/ethnicities you best relate to (mark all that apply) (Note: categories are defined by the Department of Education as of 2011. For more information: http://nces.ed.gov/ipeds/reic/collecting_re.asp).
American Indian or Alaska Native 6.40% 11Asian 1.74% 3Black or African American 5.81% 10Hispanic or Latino 12.79% 22Native Hawaiian or other Pacific Islander
1.74% 3
White 77.91% 134More than one race 6.98% 12Other (please specify) 5
Q30. Additional survey comments:
FRC does a poor job supporting faculty and staff well. Administration is always happy to add something to the workload but does not provide much support or training. The gender inequalities are glaring and largely unaddressed- it’s like everyone just accepts it and end of story. Women, especially in administration also comply with this norm which makes it so difficult to initiate change. Things like sexual assault are

more or less swept under the carpet whenever possible. There is a huge reluctance to use laws like Title 9 to make meaningful changes rather than just meeting some minimum requirement on paper only.
Feather River College is a beautiful campus to be at
I feel like the students who play sports who try to skate by in class, if they can't or won't do the work shouldn't be able to play sports
Cheaper food that taste better
FRC has been a great experience for me and I'm very glad I chose to come here.
Tutoring was interesting. I had signed up for help in math and my tutor was not sure how to do the problems. Also, she spent half of one sessions texting someone instead of helping me. I ended up walking out and not going back. Overall I maybe attended four/five sessions.
I don't other than that coming back to school was one of the best decisions I have ever made
I mentioned in my responses that i feel alone and im not very happy at FRC; this isn't really to do with the school but with my ongoing mental and physical health issues, which FRC staff have been extremely helpful and accommodating with.
There is too much nepotism and favoritism at FRC.
I answered "not very happy at FRC" because I'm not really happy anywhere.
I do not consider myself white. My race, not my religion, is Jewish. When I put this in other it would accept my answer. I had to check a box, I checked white with a comment. Please add a box to other so people can identify their race as they live it.