can “home grown rations” supply proteins of adequate quality … · 2005-03-21 · can “home...
TRANSCRIPT

CAN “HOME GROWN RATIONS” SUPPLY PROTEINS OF ADEQUATE QUALITY AND QUANTITY FOR
HIGH MILK PRODUCTION?*
BY E. B. HART AND G. C. HUMPHREY.
WITH THE COOPERATION OF H. H. SOMMER.
(From the Departments of Agricultural Chemistry and Animal Husbandry, University of Wisconsin, Madison.)
(Received for publication, May 20,lQlQ.)
In modern dairy farming clover or alfalfa has become recog- nized ris an ahnost indispensable roughage. The farmer has been taught that these materials are high in protein, in consequence of which they can supplement his more starchy grains and low protein silage. Therefore, the “home grown ration,” consisting of the cereal grains, silage, and clover or* alfalfa hay would become, in the minds of some farmers and teachers, sufficiently adequate in protein content for high milk production.
With the newer view-point of protein chemistry emphasizing the fact that the value of a protein mixture for growth or milk production will depend upon its qualitative and quantitative make-up and not memly on the quantity of the proteins ingested, it is impossible .to state whether the “home grown ration” would furnish a protein supply of proper quality for high milk produc- tion without drawing on the protein tissue reserves of the animal.
The question raised can be settled only by metabolism in- vestigations. In the present state of our knowledge it is just as probable s% not that a ration made of clover hay, corn silage, and corn-meal would furnish an excellent and adequate protein mix- ture. The time is past for set nutritive ratios. A protein intake that will keep a cow in nitrogen equilibrium and maintain her flow of milk is all that is required and the quantity of proteins necessary to accomplish this will depend on the source of the proteins and on the quality of the amino-acids they can furnish.
In milk production we have undoubtedly followed in the paat
* Published with the permission of the Director of the Wisconsin Agri- cultural Experiment Station, Madison.
515
by guest on June 3, 2020http://w
ww
.jbc.org/D
ownloaded from

516 Proteins for Milk Production
a safe procedure by using a narrow nutritive ratio, which implies a liberal protein intake, for all the evidence accumulated indicates that the comnion sources of proteins used in feeding dairy cows,- and they have always been plant sources-will not yield a protein mixture of the highest possible production value. Our experience with a “home grown ration,” the results of which are here reported, is,in harmony with this view. A protein mixture derived from clover hay, corn silage, and corn grain, oat grain, barley grain, or a mixture of the three grains will be a protein mixture of com- paratively low efhciency for maintenance and milk production. It will suffice for cows of large consumption capacity and low mammary gland activity, in other words, for poor cows. But where a cow comes into lactation with a large milk flow her con- sumption capacity will be inadequate to furnish from such a ration sufficient protein for a positive nitrogen balance or dquilib- rium and the maintenance of a high milk yield. The result is a partial withdrawal of tissue nitrogen for milk production with an accompanying rapid decline in milk flow.
Undoubtedly the fact ‘that generally in dairy practice the proteins used are of low production value and that the plane of protein intake often fed dairy cows is lower than it should be, is partly responsible for the rapid decline in milk production during the progress of lactation. Probably more cows than imagined are in negative nitrogen balance during the early period of lac- tation and under such conditions rapidly decline in milk flow to offset the losses sustained by autolyzing tissue.
It is undoubtedly true that some cows of strong milking ten- dencies and with a considerable reserve of muscular tissue will maintain for a long time a constant level of milk protein pro- duction even when in a negative nitrogen balance, but more often the tendency will be toward a condition of equilibrium.’ That is exactly what happened in the experiments to be detailed below.
The experiments reported here involve only clover hay, corn silage, and the cereal grains. While the high protein legume seeds, such as peas and beans, are “home produced”’ yet their reletively low yield per acre and high market value for human food have not made them common adjuncts to ration construction on dairy farms.
1 See records of Animals 1 and 2, Charts 1 and 2, J. Biol. Chem., 1918, xxxv, 367.
by guest on June 3, 2020http://w
ww
.jbc.org/D
ownloaded from

E. B. Hart and G. C. Humphrey 517
EXPERIMENTAL.
The plan followed was to use a ration of corn silage and clover hay (medium red) to which ground oats were added in the first period of 4 weeks; ground barley in the second period of 4 weeks; ground corn in the third period of 4 weeks; and a mixture of approximately an equal part of the three grams in the fourth period of 4 weeks. Provision for a constant energy supply in the different rations was made through the use of corn-starch. The proportion of grains and starch fed to Cows 1, 2, and 4 was in conformity to a rule of animal husbandry teachers, namely, 1 pound of grain to 3 pounds of milk, while in the case of Cows 3 and 5 a departure from this rule was made. In the latter cases a larger proportion of grain was used.
Originally our plan was to use but three animals, carrying each one through four succeeding periods of 4 weeks each; This, however, could not be accomplished. Cows 1 and 3 were fairly large producers, producing 34 to 37 pounds of milk daily at the time the experiment was initiated. Although these cows were given all the ration they would consume they were in a negative nitrogen balance from the beginning of the experiment for from 5 to 6 weeks and gradually decreased their milk flow to a point where the ration consumed maintained a state of nitrogen equilib- rium; this point was reached before the termination of the second feeding period. To continue these individuals during the next 4 weeks feeding period with the corn grain ration would not have answered the question for which we sought an answer, namely, could our protein mixture derived from corn grain, clover hay, and corn silage maintain a. high milk production and nitrogen equilibrium? Consequently two other animals, Cows 4 and 5, were substituted at this point and continued through the corn and mixed grain periods.
Two of the animals used were pure bred Guernseys, one a grade Jersey, and two pure bred Holsteins. They were fed twice daily, the excreta were quantitatively collected and analyzed daily, while the milk was a 7 day composite sample. The com- position of the rations fed is shown in Table I. A nutritive ratio of approximately 1: 8.8 was obtained, with a total protein intake varying from 2.1 pounds per day for the smaller grade Jersey
by guest on June 3, 2020http://w
ww
.jbc.org/D
ownloaded from

518 Proteins for Milk Production
TABLE I.
Composition of Rations.
Oat grain ration, fed daily.
I Animal 1. T Animal 2. I Animal 3.
lbs.
Silage.. _. _. . . 25.5 Clover Hay. _ 10.2 Grain.. . . . . . . 8.1 Starch.. . .,. . . 2.1
Total . . .._.. 1 45.9
.-- v=
37.1 4.22 83.3 3.53 56.7 5.35 - 2.io
.-- 177.1 15.2
Silage . . . . . . . . Clover hay. . Grain.. _ . . . . . Starch.. _ . . . .
Total. _ _ . _ _
-
---- lbe. ima. Ibs.
25.5 37.1 4.22 25.2 10.2 83.3 3.53 7.2 8.1 56.7 5.35 9.9 2.1 - 2.10 3.6
-- -- 45.9 177.1 15.2 45.9
ti . 3 E i: F
-- am.
44.0 4.15 56.7 2.49 76.4 6.55 - 3.60
-- 177.1 16.79
Barley grain ration, fed daily.
Animal 1. Animal 2. Animal 3.
23.7 35.9 3.95 25.5 37.1 4.2 23.7 35.9 3.95 9.5 74.9 3.29 10.2 83.3 3.65 6.7 54.4 2.32 6.2 54.2 5.16 6.7 56.7 5.31 7.6 64.5 6.03 1.9 - 1.90. 2.0 - 2.00 3.4 - 3.40
-- -------- 41.3 165.0 14.3 44.4 177.1 15.1 41.4 154.8 15.7
Corn grain ration, fed daily.
Silage. . _ . . . . _ 26.6 43.1 Clover hay.. . 10.6 83.5 Grain.. . . . . _ . 8.7 58.7 Starch.. . . . _ . - -
Total.. . . . . . -- 45.9 185.3
Animal 4.
4.4 25.5 37.1 3.6 10.2 83.3 8.1 8.3 56.7 - - -
16.1
T . Atimal2.
I Animal ii.
-- 44.0 177.1
4.3 28.9 45.4 4.8 3.5 8.2 64.4 2.8 f7.3 11.7 so.5 10.2 - 1.2 - 1.2
---- 15.1 50.0 190.3 19.0
Mixed grain ration, fed daily.
I Animal 4. I Animal 2. I Animal 6.
Silage.. . . . . . . 26.6 43.1 4.4 25.5 37.1 Clover hay.. . 10.6 63.5 3.6 10.2 83.3
Oats. . . . _ . . . . Barley . . . . .._ 2.2
2.7 I 55.0 6.2 2.1 53.9
Corn. . . . . . . . . 2.9 2.6 1 2.8 Starch.. . . . _ . . 1.4 - 1.4 1.4 -
--__-- Total.. . . . . . 46.4 181.6 15.6 44.6 174.3
4.3 28.9 45.4 4.8 3.5 8.2 64.4 2.8
3.6 5.8 3.0 75.4 9.3
1 3.9 1.4 2.5 - 2.5
---- 15.0 50.1 135.2 .18.4
by guest on June 3, 2020http://w
ww
.jbc.org/D
ownloaded from

E. B. Hart and G. C. Humphrey
(No. 3) to 2.6 pounds for the larger Holstein animals (Nos. 4 and 5). In some instances not all the ration allowed was consumed. The nitrogen content of these residues was deducted from the total nitrogen fed. In Tables II, III, and IV are given the records
TABLE II.
Record of Nitrogen Balance, Milk Produced, Etc.
Nitrogen.
Dd‘% Intake. 1 Feces. 1 Urine. 1 Mii. 1 Balance. I,,,$$Lk.
Oat grain period, Animal 1.
am. Dec. 3- 9 ........... 1,239.7
“ 10-16.. ......... 1,239.7 “ 17-23. .......... 1,117.l “ 24-30 ........... 1,013.6
gm. gm. 5443 239.3 547.9 211.9 538.3 228.3 488.0 183.0
Barley grain period, Animal 1.
gm. gm. lbs.
516.9 - 60.8 227.8 510.2 - 30.3 230.6 483.0 -132.5 226.1 439.4 - 96.8 208.8
Dec. al-Jan. 6 ....... 1,150.O Jan. 7-13 ............ 1,155.0
“ 14-20 ............ 1,155.0 “ 21-27.. ......... 1,155.0
518.6 209.8 439.1 - 17.5 204.6 527.5 197.9 404.5 + 25.1 180.7 563.6 805.3 390.5 - 4.4 187.8 539.7 211.8 388.9 + 14.6 171.8
Corn grain period, Animal 4.
Jan. 2SFeb. 3. ...... 1,321.4 628.4 391.0 429.8 -127.8 210.5 Feb. 4-10 ............ 1,297.l 631.7 360.1 408.7 -103.4 191.3
“ 11-17 ........... 366.4 369.4 - 46.1 178.0 “ 18-24.. .. .
1,297.l 617.4 ...... 1,297.l 668.7 402.4 358.7 -132.7 158.6
Mixed grain period, Animal 4.
Feb. 25-Mar. 3 ....... 1,271.2 613.2 341.8 336.2 - 20.0 157.6 Mar. 4-10.. ......... 1,271.2 608.2 310.9 342.3 + 9.8 136.4
“ 11-17.. ......... 1,271.2 581.7 302.5 339.1 + 76.9 133.5 I‘ 18-25 ........... 1,271.2 600.2 310.5 332.4 + 28.1 132.9
of nitrogen balance. These figures represent the intake and outgo for a 7 day period. Charts 1 to 5 graphically illustrate the nitrogen metabolism.
A study of the data shows that Cows 1 and 3 were in a decidedly negative nitrogen balance on the oat grain ration and passed to
by guest on June 3, 2020http://w
ww
.jbc.org/D
ownloaded from

520 Proteins for Milk Production
a status of nitrogen equilibrium during the feeding of the barley ration. This is not to be interpreted as indicating a better pro- tein mixture with the barley grain ration, but as due to a decreased production of milk nitrogen during the progress of the experi-
TABLE III.
Record of Nitrogen Balance, Milk Pro&&d, Etc.
Date.
Nitrogen.
Intake. 1 Fecee. 1 Urine. 1 Milk. 1 Balance. 1 pey!&k.
Oat grain period, Animal 2.
sm. um. pm. gm. l7m. lbs.
Dec. 3- 9. . . . . . . . 1,239.7 546.1 297.6 405.9 - 9.9 167.6 “ l&16.. . . . 1,239.7 536.7 307.8 409.8 -14.6 169.7 “ 17-23.. . . . . . . . 1,239.7 564.7 289.6 395.7 -10.3 167.4 “ 24-30.. . 1,239.7 541.3 300.2 376.9 +19.3 165.2
Barley grain period, Animal 2.
Dec. 31-Jan. 6 1,239.7 580.2 264.4 356.0 ....... +39.7 154.7 Jan. 7-13 ............ 1,239.7 525.4 264.4 348.4 +99.5 149.5
“ 14-20 ............ 1,239.7 550.0 286.5 317.0 +76.2 147.9 “ 21-27 ............ 1,239.7 534.7 290.1 324.8 +90.1 139.0
Corn grain period, Animal 2.
Jan. 28-Feb. 3. . 1,239.7 555.4 297.7 328.4 +58.2 141.0 ‘I 4-10.. . . . 1,239.7 593.4 325.7 362.8 -52.2 150.8 “ 11-17.. - . . 1,239.7 575.8 304.1 367.4 7.6 147.4 “ 18-24.. . . . . 1,239.7 565.2 334.9 363.1 -23.5 140.0
Mixed grain period, Animal 2.
Feb. 25-Mar. 3 ....... 1,220.l 566.8 332.5 354.7 -33.9 138.6 “ 4-10 ........... 1,220.l 577.0 301.3 337.5 + 4.3 139.9 “ 11-17 ........... 1,220.l 602.5 303.0 342.0 -27.4 141.3 “ 18-25 ........... 1,220.l 580.5 305.8 335.5 - 1.7 140.7
ment, with less drain on the fragments of tissue autolysis. The initial daily milk production of these two animals was well over 30 pounds and from the data it is clearly evident that such a ration will contain too poor a protein mixture for the production of so large a quantity of milk proteins without a considerable
by guest on June 3, 2020http://w
ww
.jbc.org/D
ownloaded from

E. B. Hart and G. C. Humphrey
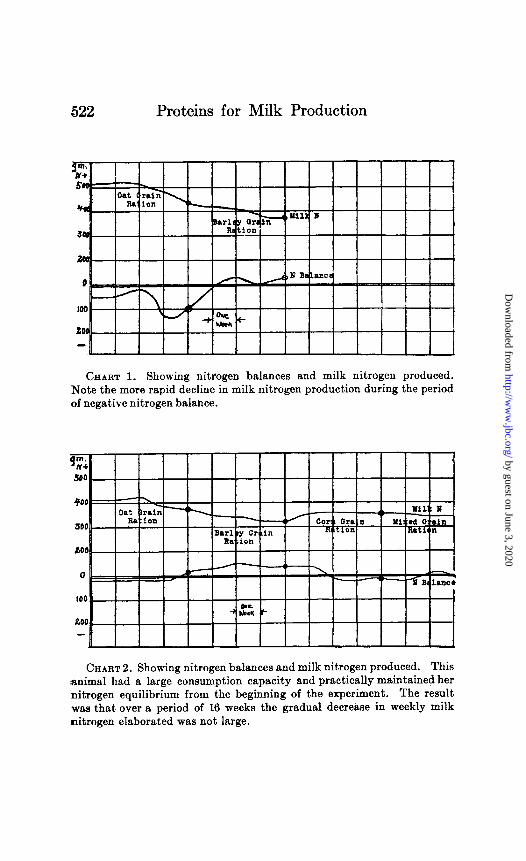
dram on the animal’s tissues. Animal 1 during the 8 weeks of feeding the oat and barley grain rations decreased the amount of nitrogen secreted in the milk per week by over 100 gm.; Animal 3 likewise decreased the milk nitrogen produced in a week by
TABLE IV.
Record of Nitrogen Balance, Milk Production, Etc.
Date.
Nitrogen.
Intake. 1 Fee&. 1 Urine. 1 Milk. 1 Balance. 1 peFitek.
Oat grain period, Animal 3.
gm.
Dec. 3- 9.. ......... 1,200.O “ N-16.. .......... 1,X4.7 “ 17-23 ............ 1,039.2 “ 24-30 ........... 984.2
om. gm. l7m.
497.2 206.0 542.7 544.9 211.8 514.4 496.4 168.2 457.1 435.5 168.1 435.9
Barley grain period, Animal 3.
gm. tbs.
- 45.9 247.9 -106.4 228.6 - 82.5 229.4 - 55.3 205.0
-
Dec. al-Jan. 6. _ . . . . 965.2 453.0 157.8 398.8 Jan. 7-13 . . . . . . . 999.6 468.7 135.9 402.9
“ ,142O.. . . . . . . 1,002.O 470.0 142.1 377.0 “ 21-27.. . . . _. . . 978.0 446.9 139.7 380.3
- 44.4 195.4 - 7.9 184.8 + 12.9 184.4 + 12.1‘ 168.5
Corn grain ration, Animal 5.
Fed 410.:. . . . . . . 1’332.1’ 723.8 J;;.28-Feb 3 . . . . . . . 1,296.4 685.4 $i 1:;
11-17.. . . . . . _. 1,332.l 725.7 “ 18-24.. . . . . _. . 1,332.l 708.8
Mixed grain period, Animal 5.
- 75.6 198.9 - 59.1 184.8 - 45.7 187.4 - 46.4 166.6
Feb. 25-Mar. 3 ...... 1,296.4 Mar. 4-10 ........... 1,296.4
“ 11-12 ........... 1,296.4 ‘I 18-25 ........... 1,296.4
662.8 260.9 371.1 f 1.6 165.7 708.8 203.6 371.2 + 7.2 165.7 714.1 216.6 370.9 - 5.2 163.5 710.1 218.8 365.4 + 2.1 163.5
150 gm. The volume of milk produced by No. 1 on December 3, when the experiment was started, was.33.8 pounds, but 8 weeks later, or on February 3, it was but 23.7 pounds. No. 3 produced on December 3, 36.9 pounds of milk, but on February 3, or 8 weeks Iater, she produced but 25.9 pounds.
by guest on June 3, 2020http://w
ww
.jbc.org/D
ownloaded from
522 Proteins for Milk Production
CHART 1. Showing nitrogen balances and milk nitrogen produced. Note the more rapid decline in milk nitrogen production during the period of negative nitrogen balance.
qm. Iy+ I I I I I I I I I I I I I Ii 500. 1 I I I I I I I I
400 --!--. , * 1 I I J.. I I oat brain- I I
CHART 2. Showing nitrogen balances and milk nitrogen produced. This animal had a large consumption capacity and practically maintained her nitrogen equilibrium from the beginning of the experiment. The result was that over a period of 16 weeks the gradual decrease in weekly milk nitrogen elaborated was not large.
by guest on June 3, 2020http://w
ww
.jbc.org/D
ownloaded from
E. B. Hart and G. C. Humphrey 523
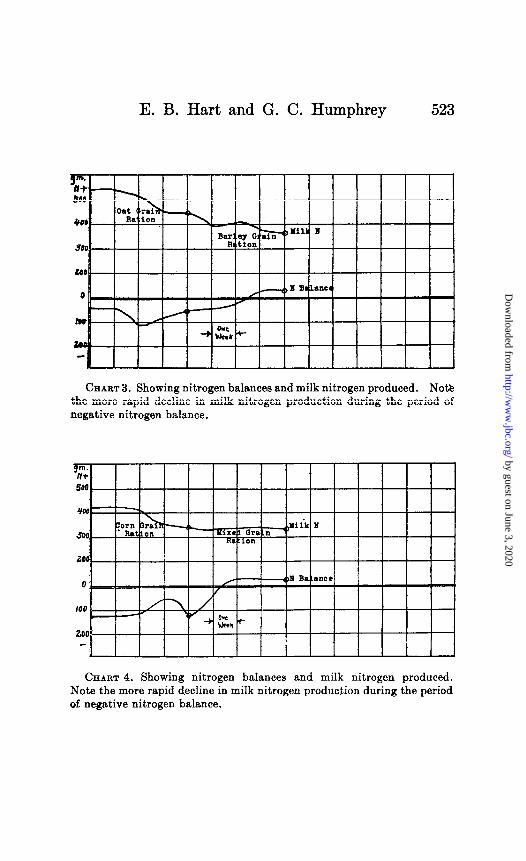
CHART 3. Showing nitrogen balances and milk nitrogen produced. Not& the more rapid decline in milk nitrogen production during the period of negative nitrogen balance.
% I I I I I I I i I I I I I I
CHART 4. Showing nitrogen balances and milk nitrogen produced. Note the more rapid decline in milk nitrogen production during the period of negative nitrogen balance.
by guest on June 3, 2020http://w
ww
.jbc.org/D
ownloaded from
524 Proteins for Milk Production
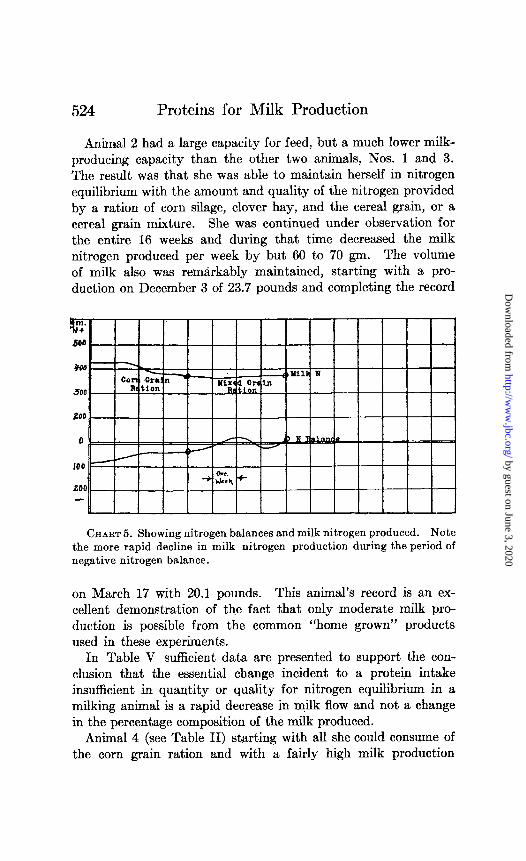
Animal 2 had a large capacity for feed, but a much lower milk- producing capacity than the other two animals, Nos. 1 and 3. The result was that she was able to maintain herself in nitrogen equilibrium with the amount and quality of the nitrogen provided by a ration of corn silage, clover hay, and the cereal grain, or a cereal grain mixture. She was continued under observation for the entire 16 weeks and during that time decreased the milk nitrogen produced per week by but 60 to 70 gm. The volume of milk also was remarkably maintained, starting with a pro- duction on December 3 of 23.7 pounds and completing the record
CHART 5. Showing nitrogen balances and milk nitrogen produced. Note the more rapid decline in milk nitrogen production during the period of negative nitrogen balance.
on March 17 with 20.1 pounds. This animal’s record is an ex- cellent demonstration of the fact that only moderate milk pro- duction is possible from the common “home grown” products used in these experiments.
In Table V sufficient data are presented to support the con- clusion that the essential change incident to a protein intake insufficient in quantity or quality for nitrogen equilibrium in a milking animal is a rapid decrease in milk flow and not a change in the percentage composition of the milk produced.
Animal 4 (see Table II) st.art,ing with all she could consume of the corn grain ration and with a fairly high milk production
by guest on June 3, 2020http://w
ww
.jbc.org/D
ownloaded from

E. B. Hart and G. C. Humphrey 525
(33.3 pounds of milk per day) was immediately plunged into a negative nitrogen balance. The sequel to this condition was a rapid decrease in milk flow. Apparently the corn grain ration gave no better protein mixture than did the oat grain or barley grain ration. This animal reached nitrogen equilibrium in the mixed grain ration (oat-barley-corn mixture), but only after a decrease of 90 gm. per week in milk nitrogen elaboration and a
TABLE V.
Decrease in Milk Volume with Cows in Negative Nitrogen Balance, but Main- tenance of Percentage Composition of Milk.
Animal 1. Animal 4.
Dec. 16. Jan. 13. Feb. 10. Mar. 10. ___~
Total solids, per cent. _. . . . . . . . . . . . . 13.57 13.52 10.96 11.90 Fat, per cent __.. __ ._.. . . . _. . . . . . . . 4.60 4.45 2.80 3.50 Nitrogen, per cent.. . _. . _ . . . . . . . . . . 0.49 0.47 0.41 0.48 Milk daily, lbs.. . . _. . . . _ . . . . . . . . . 32.7 26.8 32.9 19.6
Animal 2.’
Total solids, per cent. . . . . . . . . 14.27 14.26 13.88 14.17 Fat, per cent. . . . . . . . . . . . . 4.70 4.60 4.70 5.10 Nitrogen, per cent. . . . . . . . . . 0.53 0.51 0.55 0.53 Milk daily, 16s.. . . . . . . . . . . . . . . . . . 24.3 21.60 22.2 21.2
Animal 3. Animal 5.
Total solids, per cent.. . . . . . . . . . 13.07 12.73 12.07 12.58 Fat, per cent.. . . . . . _. . . . _. . _. . . . . . 4.10 3.50 3.10 3.60 Nitrogen, per cent. _. . . . . . . . . 0.46 0.47 0.45 0.49 Milk daily, lbs. _. . . . . . . . . . . . . . 32.6 26.0 31.3 23.0
* Cow 2 maintained volume of milk, but was not in negative nitrogen balance.
shrinkage in daily milk volume from 33.3 pounds per day to 19.5 pounds per day.
The behavior of Animal 5 was an exact duplication of the records of the other high producing animals with which we experimented. There was a decided negative nitrogen balance on the corn grain- corn silage-clover hay ration, with a progressive decrease in flow
of milk until nitrogen equilibrium was reached. In ihe case of this individual there was a decrease in daily milk flow from 31.3
by guest on June 3, 2020http://w
ww
.jbc.org/D
ownloaded from

Proteins for Milk Production
pounds at the beginning of the experiment to 23.6 pounds at the time that nitrogen equilibrium was reached and the weekly amount of nitrogen secreted in the milk was reduced by 50 gm. in 4 weeks.
Our data on the value of the proteins of the mixed grain ration are not so conclusive as those on the single grain mixtures. All the animals had practically reached nitrogen equilibrium when they were changed to the mixed grain ration. From available evidence on the value of a mixture of cereal grain proteins for growth2s3 it is altogether probable that such a mixture of grains as used here would furnish no better quality of proteins than the single grain itself. The elaboration of milk proteins is to be looked upon as a phenomenon analagous to growth. While the distribution of amino-acids in the milk proteins is different from what it is in new tissue formed in growth, yet their origin in either case is the food supply, since probably no distinctive capacity for amino-acid synthesis is inherent in the mammary gIand.4 Further, had the amino-acid content of the mixed grain ration been of a quality superior to that of any of the single grain mix- tures used, there would have been a larger storage of nitrogen following the periods of negative nitrogen balance experienced during the corn grain period. This, however, was not the case (see records of Animals 4 and 5, Tables II and IV).
The live weight of our animals gave no indication in the period of observation as to the status of their nitrogen equilibrium. Two of them, Nos. 1 and 3, lost considerable weight under conditions of a negative nitrogen balance; No. 2 which was in nitrogen equilibrium during the entire 16 weeks neither gained nor lost appreciably in weight. Nos. 4 and 5, although in negative nitro- gen balance 4 to 5 weeks showed no decrease in live weight,-in fact they actually increased in weight. Records of live weight are given in Table VI.
The animals in negative nitrogen balance decreased their milk flow in the course of 5 to 6 weeks by 8 to 10 pounds. This amount of milk would have a market value of at least 50 cents. For 7 cents per day 2 pounds of any of the common plant protein con-
p McCollum, E. V., J. Biol. Chem., 1914, xix, 323. a Hart, E, B., and Steenbock, H., J. Biol. Chem., 1919, xxxviii, 267. 4 Hart, E. B., Nelson, V. E., and Pits, W., J. Biol. Chem., 1918, xxxvi,
291.
by guest on June 3, 2020http://w
ww
.jbc.org/D
ownloaded from

E. B. Hart and G. C. Humphrey 527
centrates could have been added to the ration, and thereby raised the plane of protein intake, without the animals experiencing any such rapid. shrinkage in milk flow as took place. From what we know of the physiology of milk secretion and the relation of protein to that function it would appear to be unprofitable not to supply protein in quantities sufficient to maintain nitrogen equilibrium in a milking animal.
TABLE VI.
Records of Live Weights of Animals.
Animal No. December 2. January 20. March 17.
Ibs. lbs. 6%.
1 1,024 935 2 l,O@ iJO 3 885 762 4 1,356 1,395 5 1,135 1,200
SUMMARY.
1. In this paper data are presented which show that it is not possible to furnish dairy cows of high milk-producing capan’& with a protein level of suflicient magnitude or quality to maintain that capacity from a clover-corn silage-cereal grain mixture, the latter being corn, barley, or oats alone or a mixture of the three.
2. A cow with low mammary capacity but with large food consumption can be kept in nitrogen equilibrium by such rations. One of our animals gave 22.24 pounds of milk daily for 16 weeks and maintained nitrogen equilibrium on such a ration.
3. In the present state of our knowledge the only safe pro- cedure for the maintenance of high milk production is through the use of a high plane of protein intake which, although of low relative efficiency, should be drawn from the plant protein con- centrates rather than from those of animal origin.
Further studies will be made of the possibilities of other “home grown” protein combinations. It is entirely possible that highly efficient protein mixtures used at comparatively low levels of intake maycyet be found among the common plant sources.
by guest on June 3, 2020http://w
ww
.jbc.org/D
ownloaded from
cooperation of H. H. SommerE. B. Hart, G. C. Humphrey and With the
MILK PRODUCTION?QUALITY AND QUANTITY FOR HIGH
SUPPLY PROTEINS OF ADEQUATE CAN "HOME GROWN RATIONS"
1919, 38:515-527.J. Biol. Chem.
http://www.jbc.org/content/38/3/515.citation
Access the most updated version of this article at
Alerts:
When a correction for this article is posted•
When this article is cited•
alerts to choose from all of JBC's e-mailClick here
ml#ref-list-1
http://www.jbc.org/content/38/3/515.citation.full.htaccessed free atThis article cites 0 references, 0 of which can be
by guest on June 3, 2020http://w
ww
.jbc.org/D
ownloaded from