canada food processing ingredients an overview of the food
TRANSCRIPT

Canada Food Processing Sector December 2013
1
THIS REPORT CONTAINS ASSESSMENTS OF COMMODITY AND TRADE ISSUES MADE BY
USDA STAFF AND NOT NECESSARILY STATEMENTS OF OFFICIAL U.S. GOVERNMENT
POLICY
Date:
GAIN Report Number:
Approved By:
Prepared By:
Report Highlights:
Opportunities exist to expand U.S. food product sales to Canada's food and beverage processing sector. In this C$97 billion industry, demand is increasing for many U.S. raw and processed horticultural products, other processed ingredients and food flavorings. The following report highlights the performance of the various sectors of Canada's food and beverage processing industry.
Post:
Ottawa
Sonya Jenkins
Jeff Zimmerman
An Overview of the Food Processing Sector in Canada
Food Processing Ingredients
Canada
CA13074
12/20/2013
Required Report - public distribution

Canada Food Processing Sector December 2013
2
TABLE OF CONTENTS Section 1: Market summary .......................................................................................................................................... 3
Overview of Canadian Market ................................................................................................................................. 3
Canadian Exports of Processed Food and Beverage Products ................................................................................. 5
Imports of Ingredients for the Canadian Food Processing Industry ........................................................................ 5
Advantages and Challenges Facing U.S. Products in Canada ................................................................................... 6
Section 2: Road Map for Market Entry ......................................................................................................................... 6
Entry Strategy .......................................................................................................................................................... 6
1) Contact your State Regional Trade Group or Commodity Group ............................................................... 7
2) Research the Competitive Marketplace ...................................................................................................... 8
3) Locate a Broker/Distributor/Importer ........................................................................................................ 9
4) Understand Canadian government standards and regulations that pertain to your product .................... 9
5) SIAL Canada ............................................................................................................................................... 11
Market Structure .................................................................................................................................................... 12
Company Profiles ................................................................................................................................................... 13
General Health and Wellness ................................................................................................................................. 15
Organic and Natural ............................................................................................................................................... 16
Ethical/Environmental Eating ................................................................................................................................ 16
Traceability ............................................................................................................................................................. 17
Ethnic Shoppers ..................................................................................................................................................... 17
Food Allergies ......................................................................................................................................................... 18
Section 3: Leading U.S. Products and the Competition ............................................................................................. 18
Products Imported in Canada Facing Significant Barriers ...................................................................................... 22
Section 4: Best Product Prospects High Physical Growth ........................................................................................... 24
Source: Canadian Grocer Category Captains 2012 Report .................................................................................... 25
Section 5: Regulatory Environment ............................................................................................................................ 26
Other Information Affecting Imports of Food Ingredients .................................................................................... 27
Post Contact and Further Information ........................................................................................................................ 30

Canada Food Processing Sector December 2013
3
SECTION 1: MARKET SUMMARY
OVERVIEW OF CANADIAN MARKET
Opportunities exist to expand U.S. food product sales to Canada's food and beverage processing sector. In this C$97 billion industry, demand is increasing for many U.S. raw and processed horticultural products, other processed ingredients and food flavorings. The following report highlights the performance of the various sectors of Canada's food and beverage processing industry. In 2012, U.S. agricultural exports to Canada reached a record C$20.6 billion. Exports to Canada accounted for 14.5 percent of total U.S. food and agricultural products, which reached C$141 billion. American products account for approximately 63 percent of Canada's total agricultural imports. In the first three quarters of CY2013, U.S. agriculture exports to Canada have increased by 5 percent over the same time frame last year and already stand at C$17.9 billion. Under the tariff elimination provision of the North American Free Trade Agreement (NAFTA), the majority of U.S. agricultural products have entered Canada duty-free since January 1, 1998. Trade with Canada is facilitated by proximity, similar culture, language, common lifestyle pursuits, and the ease of travel among citizens for business or pleasure. Many American products have gained an increased competitive edge over goods from other countries as the result of the FTA/NAFTA. Canada's grocery product and food service trades have been quick to seize opportunities under FTA/NAFTA, which permitted them to expand their geographical sourcing area to include the United States. Declining import duties under the trade agreements and an easing of Canadian packaging requirements for processed horticultural products for the food service market have resulted in significant gains in the Canadian market for U.S. consumer-ready foods and food service products. Food and beverage processing in Canada began in the mid-1800's and has successfully evolved into a sophisticated and vital contributor to Canada's food, agriculture and economic sectors. In 2012, the food and beverage processing industry produced shipments worth C$97 billion, two percent of Canada's total GDP. The industry supplies 75 percent of the processed food and beverage products available in Canada. Exports in 2012 reached $24.6 billion, with 67 percent of that total going to the United States. Food and beverage processing is an important contributor to the Canadian economy. In 2011, employment in the sector increased modestly to 251,800. Agriculture and Agri-Food Canada estimates that the Canadian food and beverage processing industry supplies approximately 80 percent of the processed food and beverage products available in Canada. Beverage processing includes soft drinks and bottled water manufacturing, wineries, breweries and distilleries. A breakdown of the manufacturing industry from 2011, is as follows. Agriculture and Agri-Food Canada has more information on the food and beverage processing industry on their website at: http://www4.agr.gc.ca/AAFC-AAC/display-afficher.do?id=1171288446081&lang=eng.

Canada Food Processing Sector December 2013
4
Source: Agriculture and Agri-Food Canada “Significance of the Food and Beverage Processing Sector in Canada”
The majority of food manufacturers are located in Ontario, the most populous province in Canada.
Number of employer establishments by employment size category and region: December 2012 Food Manufacturing (NAICS311)
Province or Territory Employment Size Category (Number of employees)
Micro 1-4
Small 5-99
Medium 100-499
Large 500+
Alberta 131 275 39 3
British Columbia 220 466 67 4
Manitoba 40 151 13 3
New Brunswick 27 84 35 3
Newfoundland and Labrador 20 66 30 4
Northwest Territories 0 0 0 0
Nova Scotia 90 137 21 1
Nunavut 1 4 0 0
Ontario 435 1,136 177 22
Prince Edward Island 16 34 10 0
Quebec 292 916 142 11
Saskatchewan 72 86 16 1
Yukon Territory 1 3 0 0
CANADA 1,345 3,358 550 52
Percent Distribution 25.4% 63.3% 10.4% 1.0%
Source : Statistics Canada, Canadian Business Patterns Database, December 2012.

Canada Food Processing Sector December 2013
5
CANADIAN EXPORTS OF PROCESSED FOOD AND BEVERAGE PRODUCTS
Canadian exports of processed food products stood at C$24.6 billion in 2012, up 5 per cent from 2011. Canadian processed food products are exported all over the world; however a significant portion is focused in a small number of countries. In 2012, 82 percent of those exports went to three major markets; the United States (66 per cent), China (9 percent) and Japan (7 percent). As of October 2013, these three markets were on track to again be Canada’s largest export destinations for agricultural products, with exports to the U.S. growing 7.8 per cent over the same period in 2012. Exports to both China and Japan have declined slightly.
Canadian Food and Beverage Industry 2010 2011 2012
Shipments C$ Million 91,633 95,170 97,330
Change (%) 2.2 3.9 2.3
Imports C$ Million 21,047 23,150 24,976
Change (%) -0.005 9.9 7.9
Exports C$ Million 20,755 23,335 24,601
Change (%) 7.7 12.4 5.4
Domestic Market C$ Million 91,925 94,985 97,705
Change (%) 0.004 3.2 2.9
Sources: Industry Canada, Trade Data Online and StatsCan CANSIMtable 304-0014
IMPORTS OF INGREDIENTS FOR THE CANADIAN FOOD PROCESSING INDUSTRY
Canadian food processors utilize both raw and semi-processed ingredients from imported and domestic sources. No data exists on the total value of imported ingredients destined for the Canadian processed food and beverage industry; however imported ingredients are vital inputs to Canadian manufacturers. Imported ingredients cover virtually all food categories. For example, whole raw products such as strawberries, semi-processed products such as concentrated juices and fully prepared products such as cooked meat products have proven to be essential to processors in Canada. Some ingredients, such as tropical and sub-tropical products, are entirely imported while substantial imports of numerous other products may also be required. These products include spices, food manufacturing aids and flavorings. For example, 90 percent of the Canadian sugar supply is imported and 40 percent of the demand for flour, edible oils and breakfast cereals is supplied by imports.
Canada Food Processing Sector December 2013
6
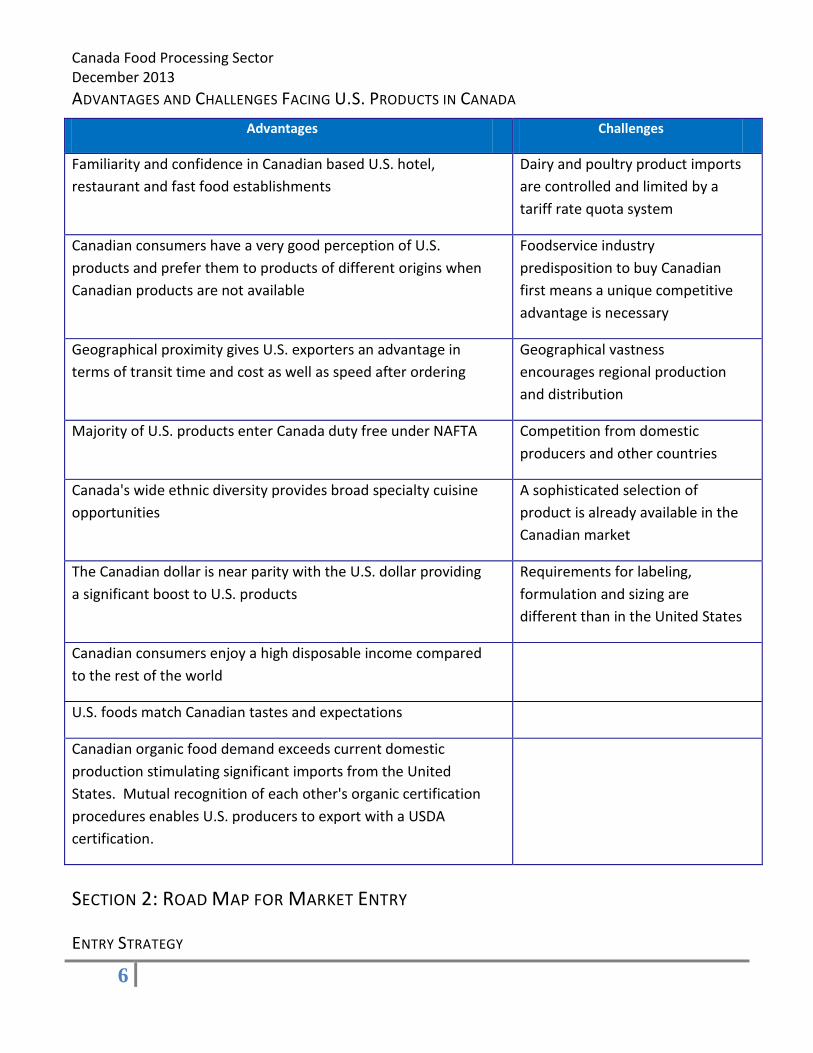
ADVANTAGES AND CHALLENGES FACING U.S. PRODUCTS IN CANADA
Advantages Challenges
Familiarity and confidence in Canadian based U.S. hotel,
restaurant and fast food establishments
Dairy and poultry product imports
are controlled and limited by a
tariff rate quota system
Canadian consumers have a very good perception of U.S.
products and prefer them to products of different origins when
Canadian products are not available
Foodservice industry
predisposition to buy Canadian
first means a unique competitive
advantage is necessary
Geographical proximity gives U.S. exporters an advantage in
terms of transit time and cost as well as speed after ordering
Geographical vastness
encourages regional production
and distribution
Majority of U.S. products enter Canada duty free under NAFTA Competition from domestic
producers and other countries
Canada's wide ethnic diversity provides broad specialty cuisine
opportunities
A sophisticated selection of
product is already available in the
Canadian market
The Canadian dollar is near parity with the U.S. dollar providing
a significant boost to U.S. products
Requirements for labeling,
formulation and sizing are
different than in the United States
Canadian consumers enjoy a high disposable income compared
to the rest of the world
U.S. foods match Canadian tastes and expectations
Canadian organic food demand exceeds current domestic
production stimulating significant imports from the United
States. Mutual recognition of each other's organic certification
procedures enables U.S. producers to export with a USDA
certification.
SECTION 2: ROAD MAP FOR MARKET ENTRY
ENTRY STRATEGY

Canada Food Processing Sector December 2013
7
Canada remains the top U.S. agricultural export destination for consumer-oriented products with plenty of opportunities for companies interested in exporting. As a well-established market, in Fiscal Year 2013 (October 2012 to September 2013), U.S. agricultural exports to Canada grew by US $1.4 billion dollars, or 7 percent over FY2012. Companies in the United States enjoy advantages made possible by an established shipping corridor, similar consumer preferences and expectations as well as favorable duty rates under NAFTA. Canadians are always on the lookout for new and innovative U.S. products, but each sector and product can pose its own challenges. These obstacles can include currency, labeling and customs. With the right tools, these can be overcome. Following are the main steps for U.S. exporters who are looking to enter the Canadian market.
1) CONTACT YOUR STATE REGIONAL TRADE GROUP OR COMMODITY GROUP
State Regional Trade Groups (SRTGs) are non-profit organizations representing state agricultural promotion agencies that use federal, state and industry resources to promote the export of food and agricultural products. They can help qualifying exporters to obtain partial reimbursement for some marketing costs. In addition, they help oversee the branded product program funding targeting small and medium U.S. exporters that reimburses some marketing costs for products of the U.S.A. In 2013, USDA’s Market Access Program cooperators will spend over $7 million on generic and brand promotion activities in Canada.
Food Export Association of the Midwest USA
Illinois, Indiana, Iowa, Kansas, Michigan, Minnesota, Missouri, Nebraska, North Dakota, Ohio, South Dakota, Wisconsin
www.foodexport.org 309 West Washington Suite 600 Chicago, IL 60606 USA Phone (312) 334-9200 Fax (312) 334-9230
Food Export USA Northeast
Connecticut, Delaware, Maine, Massachusetts, New Hampshire, New Jersey, New York, Pennsylvania, Rhode Island, Vermont
www.foodexport.org One Penn Center 1617 JFK Blvd Suite 420 Philadelphia, PA 19103 USA Phone (215) 829-9111 Fax (215) 829-9777
Southern United States Trade Association
Alabama, Arkansas, Florida, Georgia, Kentucky, Louisiana, Maryland, Mississippi, North Carolina, Oklahoma, South Carolina, Tennessee, Texas, Virginia, West Virginia, the Commonwealth of Puerto Rico
www.susta.org 701 Poydras Street Suite 3725 New Orleans, LA 70139 Phone: (504) 568-5986 Fax: (504) 568-6010
Western United States Agricultural
Alaska, Arizona, California, Colorado, Hawaii, Idaho, Montana, Nevada, New Mexico, Oregon, Utah,
www.wusata.org 4601 NE 77th Ave
Canada Food Processing Sector December 2013
8
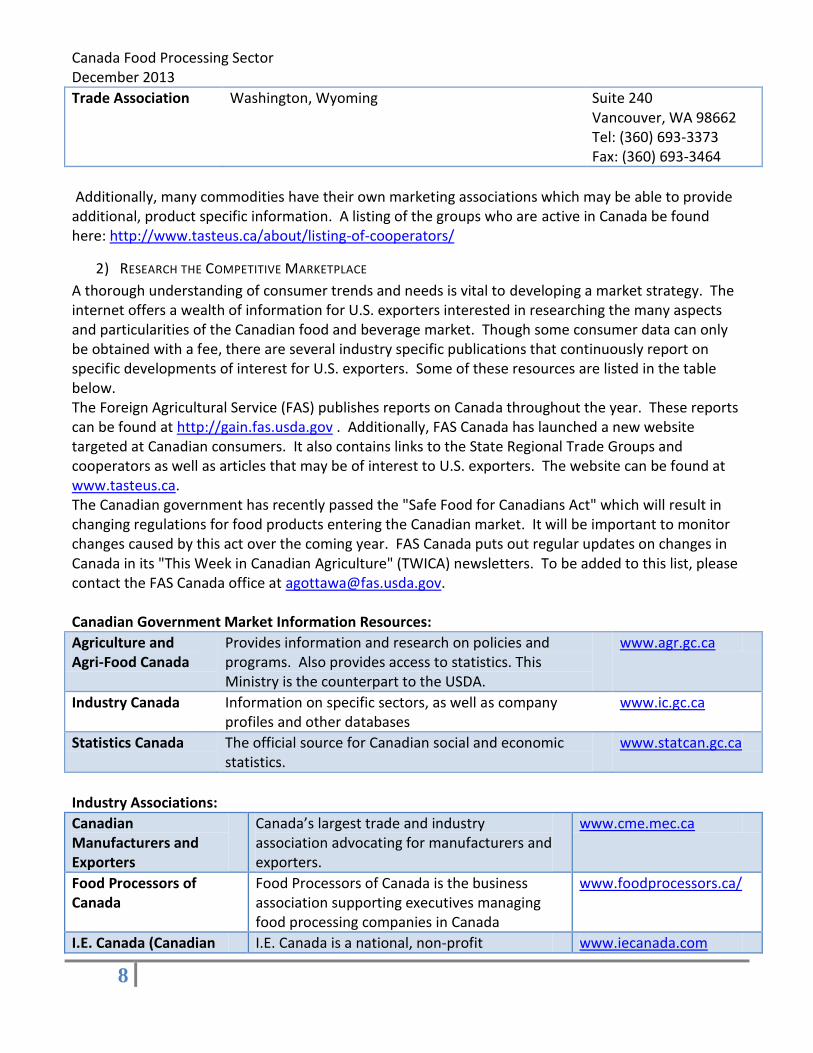
Trade Association Washington, Wyoming Suite 240 Vancouver, WA 98662 Tel: (360) 693-3373 Fax: (360) 693-3464
Additionally, many commodities have their own marketing associations which may be able to provide additional, product specific information. A listing of the groups who are active in Canada be found here: http://www.tasteus.ca/about/listing-of-cooperators/
2) RESEARCH THE COMPETITIVE MARKETPLACE
A thorough understanding of consumer trends and needs is vital to developing a market strategy. The internet offers a wealth of information for U.S. exporters interested in researching the many aspects and particularities of the Canadian food and beverage market. Though some consumer data can only be obtained with a fee, there are several industry specific publications that continuously report on specific developments of interest for U.S. exporters. Some of these resources are listed in the table below. The Foreign Agricultural Service (FAS) publishes reports on Canada throughout the year. These reports can be found at http://gain.fas.usda.gov . Additionally, FAS Canada has launched a new website targeted at Canadian consumers. It also contains links to the State Regional Trade Groups and cooperators as well as articles that may be of interest to U.S. exporters. The website can be found at www.tasteus.ca. The Canadian government has recently passed the "Safe Food for Canadians Act" which will result in changing regulations for food products entering the Canadian market. It will be important to monitor changes caused by this act over the coming year. FAS Canada puts out regular updates on changes in Canada in its "This Week in Canadian Agriculture" (TWICA) newsletters. To be added to this list, please contact the FAS Canada office at [email protected]. Canadian Government Market Information Resources:
Agriculture and Agri-Food Canada
Provides information and research on policies and programs. Also provides access to statistics. This Ministry is the counterpart to the USDA.
www.agr.gc.ca
Industry Canada Information on specific sectors, as well as company profiles and other databases
www.ic.gc.ca
Statistics Canada The official source for Canadian social and economic statistics.
www.statcan.gc.ca
Industry Associations:
Canadian Manufacturers and Exporters
Canada’s largest trade and industry association advocating for manufacturers and exporters.
www.cme.mec.ca
Food Processors of Canada
Food Processors of Canada is the business association supporting executives managing food processing companies in Canada
www.foodprocessors.ca/
I.E. Canada (Canadian I.E. Canada is a national, non-profit www.iecanada.com
Canada Food Processing Sector December 2013
9
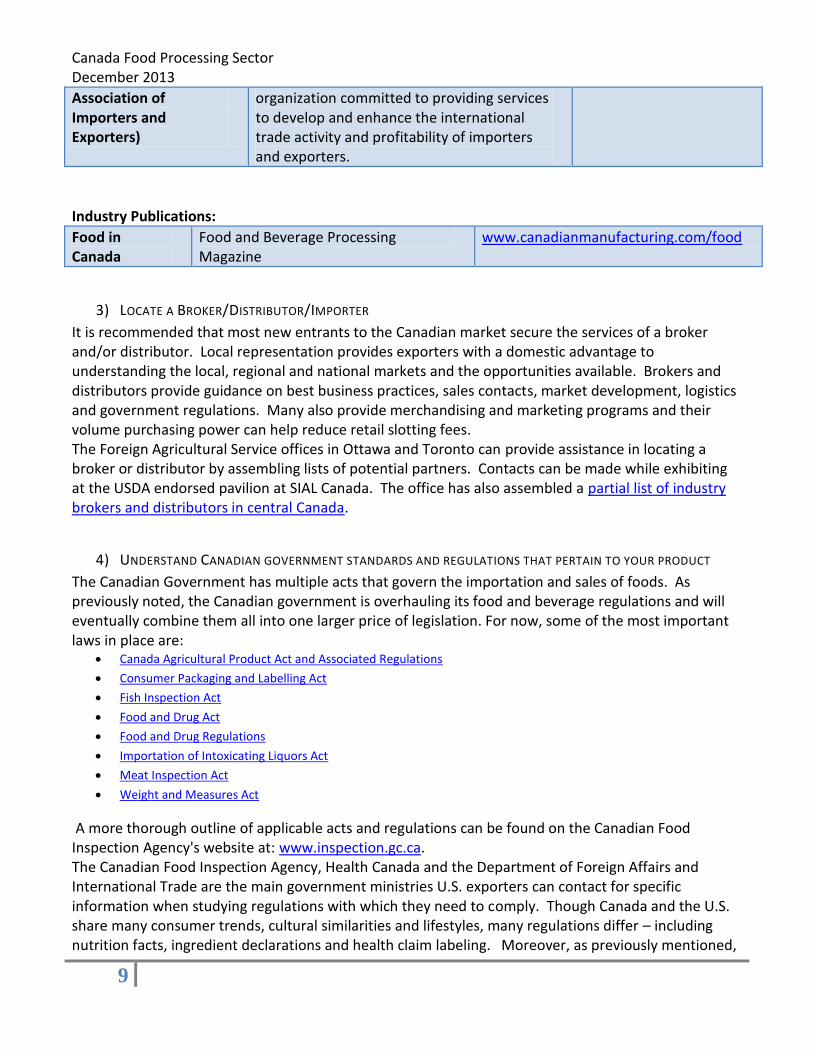
Association of Importers and Exporters)
organization committed to providing services to develop and enhance the international trade activity and profitability of importers and exporters.
Industry Publications:
Food in Canada
Food and Beverage Processing Magazine
www.canadianmanufacturing.com/food
3) LOCATE A BROKER/DISTRIBUTOR/IMPORTER
It is recommended that most new entrants to the Canadian market secure the services of a broker and/or distributor. Local representation provides exporters with a domestic advantage to understanding the local, regional and national markets and the opportunities available. Brokers and distributors provide guidance on best business practices, sales contacts, market development, logistics and government regulations. Many also provide merchandising and marketing programs and their volume purchasing power can help reduce retail slotting fees. The Foreign Agricultural Service offices in Ottawa and Toronto can provide assistance in locating a broker or distributor by assembling lists of potential partners. Contacts can be made while exhibiting at the USDA endorsed pavilion at SIAL Canada. The office has also assembled a partial list of industry brokers and distributors in central Canada.
4) UNDERSTAND CANADIAN GOVERNMENT STANDARDS AND REGULATIONS THAT PERTAIN TO YOUR PRODUCT
The Canadian Government has multiple acts that govern the importation and sales of foods. As previously noted, the Canadian government is overhauling its food and beverage regulations and will eventually combine them all into one larger price of legislation. For now, some of the most important laws in place are:
Canada Agricultural Product Act and Associated Regulations
Consumer Packaging and Labelling Act
Fish Inspection Act
Food and Drug Act
Food and Drug Regulations
Importation of Intoxicating Liquors Act
Meat Inspection Act
Weight and Measures Act
A more thorough outline of applicable acts and regulations can be found on the Canadian Food Inspection Agency's website at: www.inspection.gc.ca. The Canadian Food Inspection Agency, Health Canada and the Department of Foreign Affairs and International Trade are the main government ministries U.S. exporters can contact for specific information when studying regulations with which they need to comply. Though Canada and the U.S. share many consumer trends, cultural similarities and lifestyles, many regulations differ – including nutrition facts, ingredient declarations and health claim labeling. Moreover, as previously mentioned,

Canada Food Processing Sector December 2013
10
Canada is in the process of drafting several major regulatory changes. Exporters should make an effort to stay abreast of the latest developments.
Canada Border Services Agency
The Canada Border Services Agency (CBSA) ensures the security and prosperity of Canada by managing the access of people and goods to and from Canada.
www.cbsa.gc.ca
Canadian Food Inspection Agency (CFIA)
Government of Canada's regulator for food safety (along with Health Canada), animal health and plant protection.
www.inspection.gc.ca
Canada Revenue Agency
The Canada revenue Agency (CRA) administers tax laws for the Government of Canada and for most provinces and territories as well as various social and economic benefit and incentive programs delivered through the tax system.
www.cra-arc.gc.ca
Foreign Affairs, Trade and Development Canada (DFATD)
The mandate of Foreign Affairs, Trade and Development Canada is to manage Canada's diplomatic and consular relations and to encourage the country's international trade. DFATD manages all tariff rate quotas and supplemental import permits for controlled products (primarily dairy and poultry).
www.international.gc.ca
Department of Justice Canada – Justice Laws Website
Online consolidation of PDFs of Canadian Government Acts and regulations.
http://laws-lois.justice.gc.ca/eng/
Health Canada Administers the Food Safety Assessment Program, which assesses the effectiveness of the CFIA's activities related to food safety.
www.hc-sc.gc.ca
For more information on food labeling and other information useful to U.S. food exporters, refer to the Canada 2013 Exporter Guide on the FAS Website at http://gain.fas.usda.gov. Information exporters need to understand about labeling regulations can be found on the following sites: Nutrition Labelling Resource Page http://www.inspection.gc.ca/english/fssa/labeti/quest/gengene.shtml The Guide to Food Labelling and Advertising http://www.inspection.gc.ca/food/labelling/guide-to-food-labelling-and-advertising/eng/1300118951990/1300118996556 In order to better provide information, the CFIA maintains a National Import Service Centre (NISC), which handles telephone inquiries regarding import requirements and inspections, in addition to processing import documentation and data. The contact information of the NISC is as follows:

Canada Food Processing Sector December 2013
11
7:00 a.m. to 03:00 a.m. (Eastern Time) Telephone and EDI: 1-800-835-4486 (Canada or U.S.A.) 1-289-247-4099 (local calls and all other countries) Facsimile: 1-613-773-9999
5) SIAL CANADA
The USDA and FAS Canada endorse and organize a U.S. pavilion at SIAL Canada every year. The next SIAL Canada show is scheduled for April 2nd to 4th, 2014 in Montreal, Quebec. For further information, please contact: Office of Agricultural Affairs Embassy of the United States of America P.O. Box 866, Station B Ottawa, Ontario Phone: (613) 6885267 Fax: (613) 6883124 Email: [email protected]

Canada Food Processing Sector December 2013
12
MARKET STRUCTURE
Consolidation of the Canadian food industry has eliminated numerous intermediary procurement processes. Most food and beverage processing companies now prefer to import directly. Buying direct reduces handling, expedites shipments and generally reduces product costs, provided that volumes are large enough to benefit from a full truck load or consolidated shipments. Small volumes (less than a truckload) are usually procured locally from a Canadian wholesaler, importer, broker or agent. Procurement methods do vary from company to company and from product to product. However, regardless of the method of procurement, all products must be in alignment with government import regulation and meet minimum Canadian standards.
Consolidation of the Canadian retail and food service industry has meant that U.S. food and beverage processing companies face increasingly demanding buyers with significant market power. Aside from the continuous pressure on margins, processors are being asked to assist retail and food service companies to help define points of differentiation. New products that truly address specific consumer needs are the best means for processors to stave off the inevitable demand to produce private label product for retail and food service operators.
U.S. Exporter
Regulators
Importer Distributor Wholesaler Broker Repacker
Food Processor
Retail Foodservice
Consumer
Canada Food Processing Sector December 2013
13
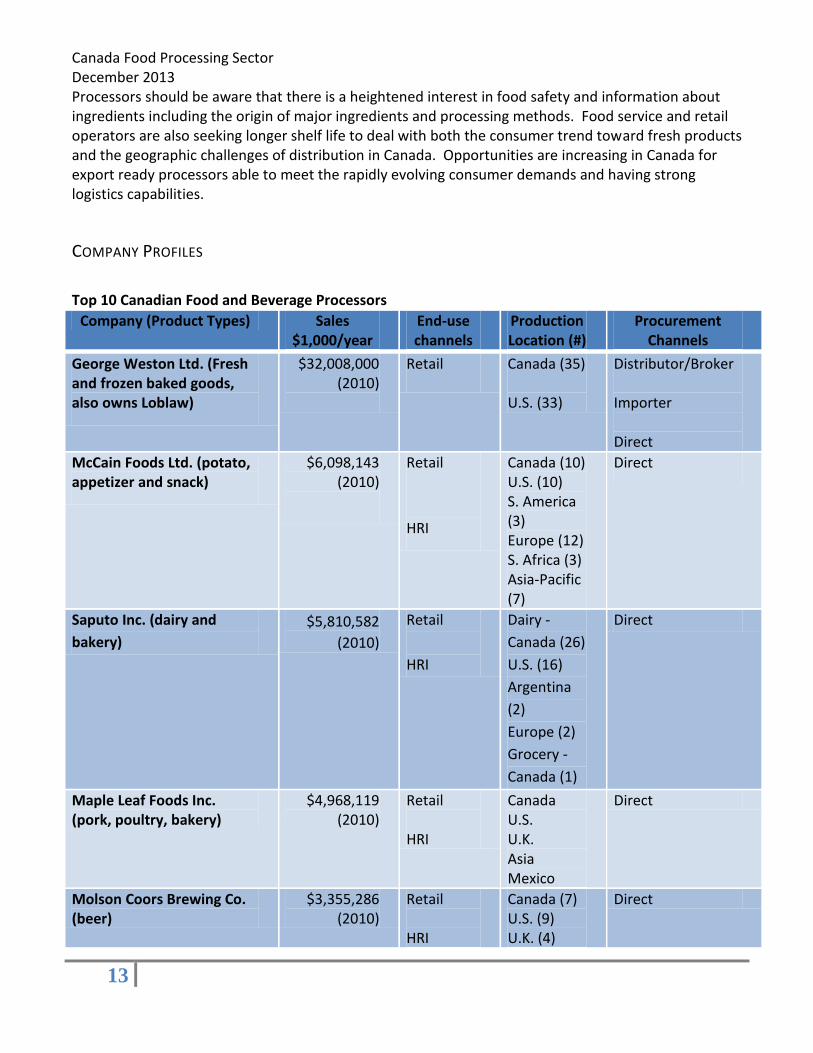
Processors should be aware that there is a heightened interest in food safety and information about ingredients including the origin of major ingredients and processing methods. Food service and retail operators are also seeking longer shelf life to deal with both the consumer trend toward fresh products and the geographic challenges of distribution in Canada. Opportunities are increasing in Canada for export ready processors able to meet the rapidly evolving consumer demands and having strong logistics capabilities.
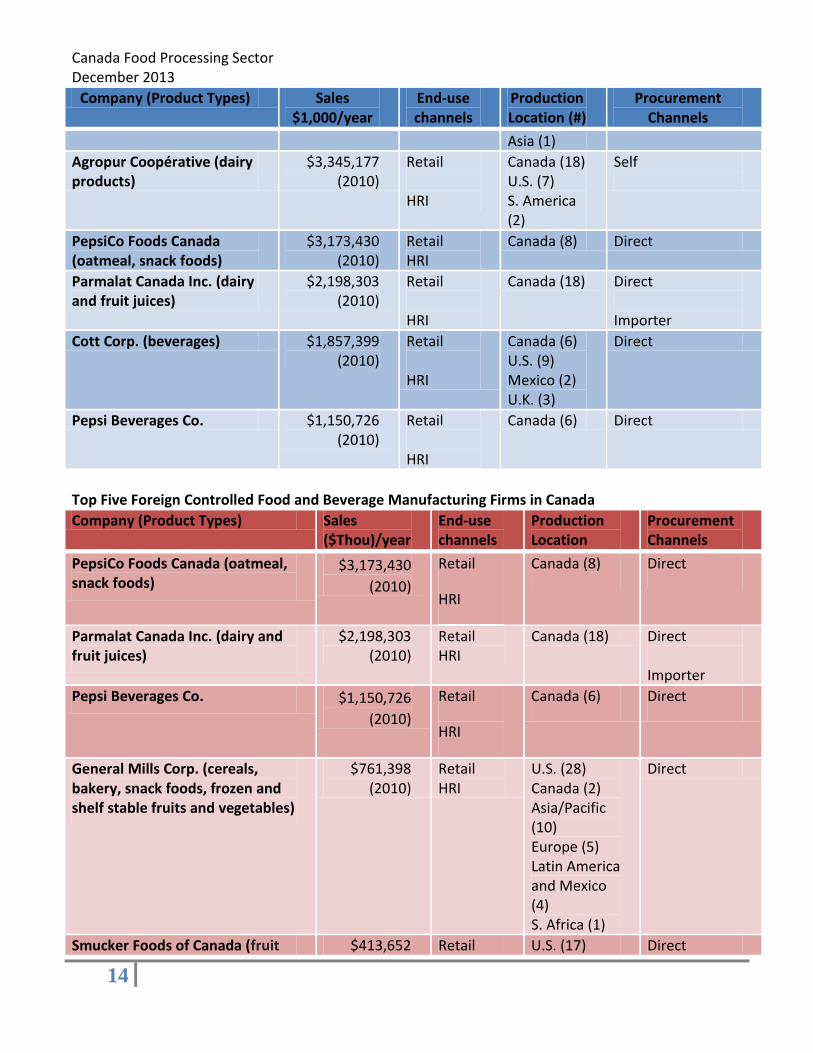
COMPANY PROFILES
Top 10 Canadian Food and Beverage Processors
Company (Product Types) Sales $1,000/year
End-use channels
Production Location (#)
Procurement Channels
George Weston Ltd. (Fresh and frozen baked goods, also owns Loblaw)
$32,008,000 (2010)
Retail
Canada (35) U.S. (33)
Distributor/Broker Importer Direct
McCain Foods Ltd. (potato, appetizer and snack)
$6,098,143 (2010)
Retail
HRI
Canada (10) U.S. (10) S. America (3) Europe (12) S. Africa (3) Asia-Pacific (7)
Direct
Saputo Inc. (dairy and
bakery)
$5,810,582
(2010)
Retail
HRI
Dairy -
Canada (26)
U.S. (16)
Argentina
(2)
Europe (2)
Grocery -
Canada (1)
Direct
Maple Leaf Foods Inc. (pork, poultry, bakery)
$4,968,119 (2010)
Retail HRI
Canada U.S. U.K. Asia Mexico
Direct
Molson Coors Brewing Co. (beer)
$3,355,286 (2010)
Retail HRI
Canada (7) U.S. (9) U.K. (4)
Direct
Canada Food Processing Sector December 2013
14
Company (Product Types) Sales $1,000/year
End-use channels
Production Location (#)
Procurement Channels
Asia (1)
Agropur Coopérative (dairy products)
$3,345,177 (2010)
Retail HRI
Canada (18) U.S. (7) S. America (2)
Self
PepsiCo Foods Canada (oatmeal, snack foods)
$3,173,430 (2010)
Retail HRI
Canada (8) Direct
Parmalat Canada Inc. (dairy and fruit juices)
$2,198,303 (2010)
Retail HRI
Canada (18) Direct Importer
Cott Corp. (beverages) $1,857,399 (2010)
Retail HRI
Canada (6) U.S. (9) Mexico (2) U.K. (3)
Direct
Pepsi Beverages Co. $1,150,726 (2010)
Retail HRI
Canada (6) Direct
Top Five Foreign Controlled Food and Beverage Manufacturing Firms in Canada
Company (Product Types) Sales ($Thou)/year
End-use channels
Production Location
Procurement Channels
PepsiCo Foods Canada (oatmeal, snack foods)
$3,173,430
(2010)
Retail
HRI
Canada (8) Direct
Parmalat Canada Inc. (dairy and fruit juices)
$2,198,303 (2010)
Retail HRI
Canada (18) Direct Importer
Pepsi Beverages Co. $1,150,726
(2010)
Retail
HRI
Canada (6) Direct
General Mills Corp. (cereals, bakery, snack foods, frozen and shelf stable fruits and vegetables)
$761,398 (2010)
Retail HRI
U.S. (28) Canada (2) Asia/Pacific (10) Europe (5) Latin America and Mexico (4) S. Africa (1)
Direct
Smucker Foods of Canada (fruit $413,652 Retail U.S. (17) Direct

Canada Food Processing Sector December 2013
15
Company (Product Types) Sales ($Thou)/year
End-use channels
Production Location
Procurement Channels
spreads, retail packaged coffee, peanut butter, shortening and oils, ice cream toppings, sweetened condensed milk, and health and natural foods beverages)
(2010) HRI Canada (4) Importer
Industry Canada maintains a more complete company directory on their website. A directory of food manufacturing companies can be found at: http://strategis.ic.gc.ca/app/ccc/sld/cmpny.do?letter=A&lang=eng&profileId=1461&naics=311. A listing of beverage manufacturing companies can be found at: http://strategis.ic.gc.ca/app/ccc/sld/cmpny.do?letter=A&lang=eng&profileId=1461&naics=312 Sector Trends Consumer trends have always created opportunities for food manufacturers. However, more recently consumer trends have affected choice and source of ingredients used in food manufacturing. Some of the more important drivers of change influencing consumer trends and manufacturing opportunities include:
Aging population, obesity and the health care crisis leading to the wellness trend
Increasing reliance on imported foods and growing worries of food contamination raising the organic, natural and local food trend
Global warming and other serious environmental challenges driving the ethical eating trends
Traceability
Ethnic shoppers
Food allergies
GENERAL HEALTH AND WELLNESS
As consumers get older, their desire to lead healthy and active lives is of increasing importance to them. In response to initiatives by governments, health organizations and consumers, 88 percent of manufacturers report that they are planning to release new products with specific nutritional benefits in the next two to three years. Already, 61 percent of manufacturers have reformulated products to make them healthier. Companies will continue to work to lower the amount of sodium, sugar and high-fructose corn syrup in their products. One of the fastest growing areas under wellness is functional foods. The market in Canada is currently valued at C$4 billion. Functional foods are conventional foods that have had healthy ingredients added to them that go beyond regular nutritional functions. Examples of functional foods include probiotic yogurts (added bacteria cultures to promote health in the gastrointestinal tract); omega-3 fortified eggs, and beverages with added vitamins and minerals. The market for functional foods is large and
Canada Food Processing Sector December 2013
16
growing as more and more people are beginning to see the benefits of making small changes to their diets. The market is expected to continue to grow rapidly as consumers gain a better understanding of the relationship between diet and health and as the aging population increasingly turns to preventative health initiatives. For more information on functional foods and nutraceuticals in Canada, visit http://www4.agr.gc.ca/AAFC-AAC/display-afficher.do?id=1170856376710&lang=eng.
ORGANIC AND NATURAL
The Canadian Organic Trade Association recently estimated that the Canadian market for organic products reached C$3.5 billion in 2012. Their full report can be found at http://www.ota.com/otacanada.html. The following is a breakdown of the market:
1) Organic food and beverages - $2.9 billion
a. Fruits and vegetables – 40 per cent
b. Beverages – 16 per cent
c. Dairy and eggs – 15 per cent
2) Organic alcohol - $135 million
3) Organic pet food - $4.1 million
The Canadian introduction of retail chain giant Whole Foods has solidified an industry commitment to healthy eating alternatives. As of January 2013, Whole Foods Canada has eight stores (4 in the Greater Toronto Area and 4 in Vancouver) with plans to open 2-3 more stores per year for the next five year. The number of organic items carried in mainstream supermarkets is rising steadily and many of the largest companies, including major U.S. food processors, have now launched organic products under some of Canada's best known brands. An example of this is the new organic line of products from Kraft Foods. Products that claim attributes such as "no antibiotics", "no hormones", and "100% vegetarian feed" do not command the same price premiums as those labeled as certified organic. However, these products are growing because they serve the store interest of differentiation and still carry a 10% to 20% premium compared to regular products while being generally more affordable than organics.
ETHICAL/ENVIRONMENTAL EATING
Experts are suggesting that the trend is destined to have the most impact on the food processing industry is the growing interest in sustainability. This trend overlaps with the wellness and organic foods, however ethical eating goes beyond taste and health concerns and into the realm of green politics and anti-globalization. It includes concepts of "fair trade" and "sustainable" and also "food miles" which bring together the related concepts of locality and seasonality. Good farming practices in terms of the treatment of livestock are also part of this trend.

Canada Food Processing Sector December 2013
17
Multinational food processors are actively involved in the sustainability movement with many seeking sustainability certifications from third party organizations such as Ocean Wise, administered by the Vancouver Aquarium, or the Marine Stewardship Council for seafood products. For other products, organizations like the World Wildlife Federation (WWF) and the Forest Stewardship Council (FSC) can provide certification that products were produced in a sustainable fashion. Large companies such as Loblaw, McDonald's and Wal-Mart are beginning to make sustainability an important part of their business plans throughout their entire supply chains.
TRACEABILITY
As seen in the growing "Buy Local" movement in Canada, consumers increasingly care about where their food comes from. Reasons for this include concern for the local economy and environmental concerns regarding how far food must travel before it reaches the consumers. The concern is also being driven by high profile food safety breaches some of which are related to imported foods as well as issues raised under the wellness and ethical eating headings. However, it is also a food trend in its own right as traditionally certain foods from certain areas were considered to be the gold standard in taste or health. This trend can be an opportunity for U.S. producers since Canadian consumers view products from the United States as safer and of better quality than imports from other countries. Consumers in the internet age no longer accept anything less than transparency. As is the case for the ethical food and organic trend, the ability to prosper from this trend will be closely ties to the ability to track, trace and verify product. This represents more changes for food processors as it requires an ability to know one's supply chain to a far greater degree than is the case today. Significant improvements have been made in technologies to assist with trace back and product verification. For example, Sobey's (major Canadian supermarket chain) has launched an initiative that allows consumers to enter a code found on the packaging of their seafood on the Sobey's website to fund out exactly when, where and how their fish was caught, right down to the name of the fisherman who landed the fish.
ETHNIC SHOPPERS
Ethnic food markets in Canada are worth an estimated C$65 billion today and are growing by an approximate 15 to 20 percent annually. They are projected to reach C$128 billion by 2020. By 2031, 72 percent of the population growth in Canada will be driven by people who are visible minorities. Consumers of South Asian and Chinese backgrounds make up the largest ethnic groups and are projected to continue growing. Immigration from Europe accounts for a smaller percentage than it traditionally has. Within immigrants from the Americas, origin is shifting from the United States and Caribbean to Mexico and South America.

Canada Food Processing Sector December 2013
18
FOOD ALLERGIES
In Canada, the priority allergens are: peanuts, tree nuts, sesame seeds, wheat and triticale, milk, eggs, fish, crustaceans, shellfish, soybeans, mustard seeds, grains containing gluten, and added sulphites. Beginning August 4, 2012 these allergens must be listed on a product label, more information on food allergens and labeling can be found at: http://www.inspection.gc.ca/english/fssa/labeti/allerg/allerginduse.shtml
SECTION 3: LEADING U.S. PRODUCTS AND THE COMPETITION
Product Category Major
Supply
Sources
Strengths of Key Supply
Countries
Advantages and Disadvantages
of Local Suppliers
FRESH FRUITS & VEGETABLES VEGETABLES: CANADIAN GLOBAL IMPORTS (2012): U.S.$2.1 BILLION
VEGETABLES: 1. U.S.: 67% 2. Mexico:
26% 3. China: 2%
Canada is the largest foreign buyer of U.S. fruits and vegetables. The U.S. benefits from relatively unimpeded export access into Canada during Canada’s winter or non-growing months.
Among imports, U.S. fruits and vegetables are viewed by most Canadians as their number one choice to other imports.
Mexico gained significant share of the market due to lower prices. Their leading products are tomatoes, peppers, avocados, mangos, and limes. Strawberries are a recent addition.
Chile is competitive with their leading exports of grapes, berries. They offer apples and cherries as well.
Dry onions, carrots, lettuce, sweet corn, cabbage are the leading vegetables sold in the fresh market.
Apples are the largest production item, followed by blueberries, cranberries, grapes and peaches.
Seasonality poses a constraint to growers; Canada imports 80% of its fresh vegetables between November and June.
The ‘Buy Local’ campaigns are well supported by grocery retailers starting in June through October.
FRUIT: CANADIAN GLOBAL IMPORTS (2012): U.S. $3.4 BILLION
FRUIT: 1. U.S.: 49% 2. Mexico:
12% 3. Chile: 9%
PROCESSED FRUITS AND VEGETABLES CANADIAN GLOBAL IMPORTS (2012): U.S. $ 2.1 BILLION
1. U.S.: 60% 2. China: 8% 3. Thailand:
3%
There is a full range of prepared and frozen products. Major products are prepared potatoes, tomato paste, mixes fruits, and variety of processed vegetables.
U.S. is a major player in the market with established process brands in the market.
China has seen a 15% growth in the category of dried fruits and vegetables.
Thailand’s major products are pineapples and fruit mixtures.
Canadian companies process a wide range of canned, chilled, and frozen products.
Adoption of advanced technologies in food processing has been fairly extensive among Canadian processors. Statistics Canada reported almost 50% companies reported adopted more than 5 new technologies in their operations.
Higher manufacturing and operation costs than in the U.S.

Canada Food Processing Sector December 2013
19
Product Category Major
Supply
Sources
Strengths of Key Supply
Countries
Advantages and Disadvantages
of Local Suppliers
SNACK FOODS CANADIAN GLOBAL IMPORTS (2012): U.S. $ 1.5 BILLION (excluding nuts)
1. U.S.: 58% 2. Germany: 5% 3. Belgium: 5 %
The U.S. dominates this category considering the more perishable and bulky nature of some products such as chips, which adds significantly to shipping costs.
Competitors vary by sub category with the main competitor and sub category as follows: Germany: cocoa, confectionaries and chocolate; Belgium: chocolate and confections. U.K. and Switzerland; chocolate, along with confection and non-confection items.
Canada’s snack food imports have grown by U.S. $ 316 million since 2006. The category includes chocolate and non-chocolate confectionary, cookies, crackers, potato chips, corn chips, popped popcorn, pretzels, and extruded cheese snacks, seed snacks, mixed nuts, peanuts and peanut butter, as well as pork rinds.
The snack food industry is served primarily by domestic manufacturers however domestic market share is being lost to imports. The rapid increase in imports is due both to the strengthening Canadian dollar and a number of new products in the category, many targeted at specific ethnic groups
Canada does have domestic raw materials for the grain based products but has to import sugar, chocolate, cacao, and nuts for manufacturing and is not competitive on dairy and egg ingredients used in some of the processing.
RED MEATS (Fresh/Chilled/Frozen) CANADIAN GLOBAL IMPORTS (2012): U.S. $1.9 BILLION RED MEATS (Prepared/Preserved)
CANADIAN GLOBAL IMPORTS (2012): U.S. $890 MILLION
1. U.S.: 79% 2. New
Zealand: 9%
3. Australia: 9%
1. U.S.: 93% 2. Brazil 2% 3. Thailand 2%
Beef imports fall into two distinct categories. The largest portion of imports being chilled cuts traditionally from the U.S. Midwest heavily destined for the Ontario region. The other part is frozen manufacturing meat from Australia (for grinding) and New Zealand (largely for specific manufacturing purposes).
Many parts of South America, remain ineligible for entry to Canada (except as a supplier of cooked and canned beef) due to sanitary reasons.
U.S. competitors are limited by a beef quota.
Canada maintains a narrow acquired feed cost advantage.
Canada continues to grow as a key U.S. pork export market. Canadian hog production numbers have been declining across the country and U.S. pork imports are up 16% due to market structures and the Canadian strong dollar.
The industry has worked its way out of the inventory surge from the BSE trade disruption. Canadian exports have been sluggish due to a strong Canadian dollar but increased by 10% in 2012.
Canadian per capita basis consumption has declined since 2006 from 31 kg to 29 kg.
FISH & SEAFOOD CANADIAN GLOBAL IMPORTS (2012): U.S. $ 2.4 BILLION
1. U.S.: 36% 2. Thailand: 17% 3. China: 15%
Two major categories make up approximately half of the imports
Fish filleting is extremely labor intensive, which accounts for the rapid penetration of China and Thailand in this segment.
With ocean catches having peaked, aqua culture is becoming a more important source of product and China is the dominant producer of farmed fish and seafood in the
Declining fish stocks have lad to almost zero growth in fish and seafood catch over the last decade.
In total, the capture fishery accounts
for 76 percent of total fish and seafood production in Canada.
Lobster, crab and shrimp comprise 67% of the landed value of all fish and shellfish harvested in Canada.
Aquaculture is increasing in importance. Key products include

Canada Food Processing Sector December 2013
20
Product Category Major
Supply
Sources
Strengths of Key Supply
Countries
Advantages and Disadvantages
of Local Suppliers
world.
A growing concern among consumers and retailers for sustainable production practices may help some U.S. fish processors.
More than two-thirds of seafood is sold by retailers.
farmed salmon, trout, steelhead, arctic char, blue mussels, oysters and manila clams.
At approximately 50 lbs. per person, Canadian consumption of fish is significantly higher than in the U.S. 16.5 lbs. per person, making Canada an excellent export market for U.S. exporters.
BREAKFAST CEREALS/PANCAKE MIXES CANADIAN GLOBAL IMPORTS (2012): U.S. $ 463 MILLION
1. U.S.: 93% 2. U.K.: 2% 3. Spain: 1%
Breakfast cereal imports have grown by over US $150 million since 2006. The U.S. continues to dominate imports although a variety of competitors are all growing small niche positions.
Canada represents the largest market for U.S. Breakfast cereals accounting for approximately half of U.S. exports.
Sales and manufacturing in Canada is largely controlled by U.S. based companies.
Domestic non-U.S. owned competitors tend to be in the specialty or organic breakfast cereal business.
Canadian consumption of breakfast cereals reached an annual 9 lbs per person.
Three key trends in cereal consumption have driven continues growth, reduced sugar, high fiber whole wheat, and hot cereals.
FRUIT & VEGETABLE JUICES CANADIAN GLOBAL IMPORTS (2012): U.S. $757 MILLION
1. U.S.: 59% 2. Brazil 16% 3. China 9%
U.S. imports to Canada increased and fastest growing juice category, fresh orange juice.
Brazil is the leader in frozen orange juice concentrate, the second largest imported juice category, with 70% of the import share.
China’s major juice export to Canada is fortified apple juice; China represents 89% of this import market.
Canada is a major per capita consumer of citrus juices but is unable to grow these products. It will continue to be an exceptional value added market for the U.S.
Both Canada and the U.S. have experienced major penetration by Chinese apple juice due to the major shift of Chinese agriculture toward labor-intensive crops and labor intensive processing.
NUTS CANADIAN GLOBAL IMPORTS (2012): Tree Nuts
U.S. $ 544 MILLION Peanuts U.S. $ 137 MILLION
Tree Nuts 1. U.S. 57% 2. Turkey 16% 3. Vietnam 8% Peanuts 1. U.S. 65% 2. China 20% 3. Argentina 7%
From 2011 and 2012 U.S. imports of peanuts increased 2%. Tree nuts increased 16% during the same period.
US products lead with peanuts and almonds is preferred by Canadian importers as it meets Canadian sanitary and phytosanitary standards consistently.
Turkey is a competitive supplier of Hazelnuts.
Vietnam competes with cashew nuts.
Growing trend of nut allergens by Canadians has caused the Canadian Food Inspection Agency and Health Canada to set specific
Canada has areas of Ontario, which can grow peanuts, but it has not done so in commercial quantities as the returns are not competitive with other crop alternatives. Similarly British Columbia and other provinces produce small quantities of a number of tree nuts including hazelnuts. However, in general, Canada is not price competitive.

Canada Food Processing Sector December 2013
21
Product Category Major
Supply
Sources
Strengths of Key Supply
Countries
Advantages and Disadvantages
of Local Suppliers
allergen labeling regulations for all suppliers.
PET FOOD ( Dog and Cat) CANADIAN GLOBAL IMPORTS (2012): U.S. $ 579 MILLION
1. U.S.: 93% 2. China: 3% 3. Thailand: 3%
U.S. imports of dog and cat food registered at U.S. $ 541 million in 2012.
Canadians regard U.S. pet foods as a trusted and quality product.
Pet food sector is largely U.S. owned multinationals.
Canada has approximately 17 (non-raw) pet food manufacturers.
New pet food importation requirements have been in place as of June 2009.
More than 322,000 tonnes of pet food is sold in Canada.

Canada Food Processing Sector December 2013
22
PRODUCTS IMPORTED IN CANADA FACING SIGNIFICANT BARRIERS
Product Category (continued)
Major Supply Sources
Strengths of Key Supply Countries
Advantages and Disadvantages of Local Suppliers
POULTRY MEAT CANADIAN GLOBAL IMPORTS (2012): U.S. $453 MILLION
1. U.S.: 88% 2. Brazil: 9 % 3. Chile: 2 %
The U.S. is the world’s largest producer of poultry meat. Brazil is the largest exporter of poultry meat and can land product in Canada at a lower cost compared to the U.S.
Brazil has rapidly expanded its share of the Canadian broiler market except with Canadian further processing plants that do not want to take the risk of commingling U.S. and Brazilian origin which would result in being unable to sell processed products to the U.S.A.
Increases in imports of U.S. chicken are due in part to imports under the Canadian Import for Re-Export Program (IREP).
The Canadian poultry industry is a Tariff Regulated Industry with live bird and meat prices well above the world market. The Canadian strategy has been to differentiate the product particularly at retail through air chilling and such additional attributes as ‘vegetable grain fed chicken” However the scale of plant operations in Canada remains relatively small due to the supply managed system. In an effort to mitigate this and to offset difficulty obtaining labor, Canadian processing plants are among the most highly mechanized sectors in Canadian agriculture and employ the latest in robotics.
The Canadian industry has significantly increased surveillance since the A.I. outbreaks in B.C. in 2004 and has continuously improved bio-security measures.

Canada Food Processing Sector December 2013
23
Products Imported in Canada Facing Significant Barriers
Product Category
Major Supply Sources
Strengths of Key Supply Countries
Advantages and Disadvantages of Local Suppliers
DAIRY CANADIAN GLOBAL IMPORTS (2012): (excluding cheese): U.S. $ 305 MILLION (Cheese) : U.S. $ 266 MILLION
1. U.S.: 60% 2. New Zealand:
16 % 3. Argentina: 9%
1. U.S. 25% 2. Italy 21% 3. France 19%
The U.S.’s close proximity to market, speedy delivery, and significant freight advantage has allowed it to be competitive in the Canadian Import for Re-export Program (IREP) which allows U.S. dairy product to be imported into Canada duty free, and used in further processing, provided the product is subsequently exported.
The European Union has a distinct advantage in the cheese trade since it has been allocated 66% of Canada’s cheese quota as a result of the 1994 Agreement on Agriculture (AoA). Though details of the CETA free trade agreement between Canada and the EU have yet to be finalized, it is expected that this advantage will either increase or be maintained.
New Zealand has a cost leadership advantage. Low costs of production due to the availability of year-round pasturage have helped New Zealand achieve a 30% share of world dairy exports. New Zealand has an additional advantage on butter imports into Canada and hold 61% of Canada’s import quota for butter.
The Canadian dairy market operates under a supply management system, which attempts to match domestic supply with domestic demand while paying producers on a cost of production related formula. This system has tended to price dairy products above prevailing world levels. Imports are controlled under Tariff-rate-quota (TRQ) and over quota imports are subject to high tariffs.
American suppliers have taken advantage of the Import for Re-export Program (IREP), which allows Canadian processors to import dairy products used in manufacturing provided the product is exported. The U.S. is the largest user of this program due to the perishable nature of the products.
Canadian tariff rate quotas stipulate a 50-per-cent dairy content guideline for imported product, resulting in the creation of ingredients and blend products that are designed to circumvent this guideline. Butter-oil-sugar blends were the first major products to be imported tariff-free, displacing Canadian milk for ice cream. More recently there has been an increase in flavored milks imported as “beverages” and a number of milk proteins which are not captured by the dairy TRQ.

SECTION 4: BEST PRODUCT PROSPECTS
High Physical Growth
Growing
Category +4% to 10% Over 10%
Beverages Bottled water - still, 2L and less (7%) Sparkling water (15%)
Products Imported in Canada Facing Significant Barriers
Product Category
Major Supply Sources
Strengths of Key Supply Countries
Advantages and Disadvantages of Local Suppliers
EGGS & EGG PRODUCTS CANADIAN GLOBAL IMPORTS (2012): U.S. $ 84 MILLION
1. U.S.: 95%
2. China: 3%
The U.S. egg industry traditionally fills Canada’s needs when supply is seasonally low. There were significant increases in U.S. imports following the Avian Flu outbreaks in B.C. to both avert shortages in the market and rebuild the hatching egg supply.
The U.S. has also become a supplier of organic eggs to Canada.
Canada’s egg industry operates under Supply Management, which is designed to encourage production of a sufficient volume of eggs to meet market needs without creating surplus. The market is protected by high tariffs. Today, about 75% of Canada’s total egg production is sold for the table market, while the remaining 25% is used in the manufacturing of value-added food and other products (liquid, frozen or dried form). These supplies are supplemented by imports and a Tariff Rate Quota system.
The Canadian industry has made considerable inroads at retail with differentiated egg offerings such as “free range”, Omega 3, and Organic all of which are sold at a premium.. The Canadian Egg Marketing Agency has a sustained media campaign focused on the health benefits of eggs to support retail movement.

Canada Food Processing Sector December 2013
25
Chilled drinks and nectars (24%) Family service Smoothies (39.5%) Coffee (29%)
Dry Grocery Sugar (10%) Flour (10%) Baking Chips (8%) Cake Mixes (7%) Icing Products (8%) Candy Confections (6%) Hot Sauce (9%)
Snack Crackers (15.3%)
Frozen Foods Thin Crust Pizza (7%) Thick Crust Pizza (15%) 1-2 Serving Size Pizza (26%)
Perishables Bread – commercial (4%) Dips (6% - Hummus=19%) Pre-packaged Salad (5%)
Eggs (9%)
Prepared Foods Indian Food (8%) Snack Foods (4%) Chocolate (4%)
Refrigerated & Dairy Natural Cheese (6%) Yogurt (5%)
Luncheon Meat (13%)
Source: Canadian Grocer Category Captains 2012 Report

Canada Food Processing Sector December 2013
26
SECTION 5: REGULATORY ENVIRONMENT
For a more in-depth review of Canada's food laws and regulations and how they may affect U.S. food exporters, please see FAS Canada's Food and Agricultural Import regulations (FAIRS) Report. Due to the complexity of legislative requirements, it is recommended to contact a Canadian Food Inspection Agency (CFIA) Import Service Centre to obtain complete and current information regarding your specific product. The CFIA is responsible for the inspection of food products at all levels of trade. Following are some of the key restrictions that could inhibit certain products from entering the country. Tariff Rate Quota (TRQ) Under the General Agreement on Tariffs and Trade (GATT), Canada is permitted to control and limit certain imports under its supply management system. With the signing of the World Trade Organization's (WTO) Agreement on Agriculture in December 1993, Canada converted its existing agricultural quantitative import controls to a system of tariff rate quotas (TRQs) that came into effect in 1995. Under the TRQ system, applicable products up to a certain volume are imported at the "within access commitment" tariff rate. Over this permitted level, the "over-access commitment" tariff rate escalates. These higher tariffs enable Canada to maintain its system of supply management for certain agricultural products. The method for establishing the allocation of import access quantities is prescribed in the Exports and Import Permits Act and is administered by the Export and Import Controls Bureau (EICB) of Foreign Affairs, Trade and Development Canada (DFATD). Documentation on the allocation system and principle of TRQ allocation, together with data on permits issued can be found at: http://www.international.gc.ca/controls-controles/index.aspx. Issuance and control of import quota is administered by the EICB in collaboration with the Canada Border services Agency. U.S. products that fall into this category include:
Broiler hatching chicks and eggs
Turkey
Cheese
Milk and Cream
Yogurt
Eggs
Chicken
Butter
Buttermilk
Dairy Blends
Margarine

Canada Food Processing Sector December 2013
27
OTHER INFORMATION AFFECTING IMPORTS OF FOOD INGREDIENTS
The Canadian Government has multiple acts that govern the importation and sales of foods. Under the Canadian Food Inspection Agency’s modernization initiative, these acts will eventually be combined into a single piece of legislation. To receive updates on changes in the Canadian regulatory system, please email [email protected] and ask to be added to the mailing list for This Week in Canadian Agriculture. Currently, some of the most important acts for companies involved in the food and beverage industry include:
Canada Agricultural Product Act and Associated Regulations
Consumer Packaging and Labelling Act
Fish Inspection Act
Food and Drug Act
Food and Drug Regulations
Importation of Intoxicating Liquors Act
Meat Inspection Act
Weight and Measures Act
Health Canada Health Canada continues to develop standards and policies for the safety of the food supply, which are applied by the CFIA. All foods sold in Canada are subject to the Food and Drugs Act and Regulations which contains health and safety requirements, labeling requirements and provision preventing deception and fraud. However, many agricultural and fish products are also subject to other legislations. Consequently, the need for licensing, permits and certificates depends upon the type of food being imported and in some cases on the country or area from which the food is imported. It should be noted that in some provinces, there are additional requirements for certain foods, such as dairy products, bottled water and maple syrup. The Food and Drug Regulations (FDR) outline the specifications and further requirements for standardized and non-standardized products. The following are just a few examples of regulatory issues, which could pose a barrier for some United States food companies attempting to sell in Canada. Food Additives: Canadian regulations pertaining to food additives differ from those in the U.S. Please visit Agriculture and Agri-Food Canada’s Food Additives page for more information. Health Canada’s list of permitted food additives can be found at http://www.hc-sc.gc.ca/fn-an/securit/addit/list/index-eng.php.

Canada Food Processing Sector December 2013
28
Food Color: Synthetic food colors are the only additives that must be certified by the Health Products and Food Branch of Health Canada before being used in foods. Regulations concerning food colors are listed in Division 6 and Table III of Division 16 of the FDR. Diet-Related Health Claims: The Canadian Food Inspection Agency enforces specific regulations regarding health claims that can be made about a product or ingredient. These regulations are in place to ensure accuracy and validity. For exact wording, visit http://www.inspection.gc.ca/english/fssa/labeti/guide/ch8e.shtml#8.4. Agricultural Pesticide and other contaminants: Some agricultural pesticides approved for use in the United States are not registered for use in Canada. Foods which are found to contain unregistered residues over 0.1 parts per million are deemed to be adulterated. Specific acceptable Maximum Residue Limits (MRLs) exist for registered pesticides. For further information see: http://www.hc-sc.gc.ca/cps-spc/pest/part/protect-proteger/food-nourriture/mrl-lmr-eng.php. Vitamin and Mineral Fortification: Fortification in Canada is under review. Health Canada has signaled it is looking at expanding discretionary fortification but with restrictions on which vitamins and minerals and what amounts. However, differences remain such as the folic acid exclusion on milled grain and bakery products. For more information on fortification see: www.hc-sc.gc.ca/fn-an/nutrition/vitamin/index_e.html. Trans Fats: Canada is one of the few countries of the world to require labelling of products containing trans fats. Reducing the amount of trans fats in food products is voluntary, but many manufacturers are looking for ingredients that will help them acheive this goal. For more information on trans fat regulations, visit http://www.hc-sc.gc.ca/fn-an/nutrition/gras-trans-fats/index-eng.php. Sodium: Similar to the action taken with trans fats, Canada has begun efforts to reduce the amount of sodium found in food and beverage products. More information can be found at http://www.agr.gc.ca/eng/industry-markets-and-trade/food-regulations/food-policy-and-regulatory-issues/current-food-policy-and-regulatory-issues/sodium/?id=1264777758642. Organic Standards: As of June 30, 2009, the Organic Products Regulations require mandatory certification to the revised National Organic Standard for agricultural products represented as organic in international and inter-provincial trade, or that bear the federal organic agricultural product legend (or federal logo). Due to the equivalency agreement with the United States, the USDA organic certification is fully recognized in Canada and there is no need for further certification in Canada for USDA-certified organic products. The CFIA has more information on regulations for organic products on their website at: http://www.inspection.gc.ca/food/organic-products/eng/1300139461200/1300140373901. Novel Foods: Health Canada defines novel foods as products that have never been used as food, foods which result from a process that has not previously been used for food, or foods that have been modified by genetic manipulation. Novel foods regulations cover a variety of new food processes including the addition or deletion of genes (commonly referred to as genetically modified foods). For

Canada Food Processing Sector December 2013
29
example, Health Canada has reviewed food produced by chemical mutagenesis of seed combined with traditional breeding, the use of new food processing techniques to extend shelf life and improve food quality and the use of natural coloring products introduced to food for purposes either than coloring. Canada's novel foods regulations require that the company, who wants to sell the products, prior to the marketing or advertising of a novel food, make notification to Health Products and Food Branch (HPFB). For more information on the novel food regulations and approval procedure, see: www.hc-sc.gc.ca/fn-an/gmf-agm/index_e.html.

Canada Food Processing Sector December 2013
30
POST CONTACT AND FURTHER INFORMATION CONVERSION RATE Per the most recent Bank of Canada noon rate, on 19 December 2013, 1.00 Canadian Dollar(s) = 0.94 U.S. dollar(s), at an exchange rate of 0.9367 (using nominal rate).
FOREIGN AGRICULTURAL SERVICE (FAS) OTTAWA
From the U.S.: Office of Agricultural Affairs American Embassy P.O. Box 5000 Ogdensburg, NY 13669 USA
From Canada: Office of Agricultural Affairs P.O. Box 866, Station B Ottawa ON K1P 5T1 Canada
Telephone: (613) 688-5267 Fax: (613) 688-3124 Email: [email protected] Kathryn Ting, Agricultural Minister-Counselor Jeff Zimmerman, Agricultural Attaché Darlene Dessureault, Senior Agricultural Specialist Mihai Lupescu, Agricultural Specialist Sonya Jenkins, Agricultural Marketing Specialist Joyce Gagnon, Administrative Assistant
FAS TORONTO:
From the U.S.: Foreign Agricultural Service U.S. Consulate General Toronto P.O. Box 135 Lewiston, NY 14092-0135 USA
From Canada: Foreign Agricultural Service U.S. Consulate General Toronto 480 University Avenue, Suite 602 Toronto, ON M5G 1V2 Canada
Telephone: (416) 646-1656 Fax: (416) 646-1389 Email: [email protected] Maria Arbulu, Senior Agricultural Marketing Specialist
Canada Food Processing Sector December 2013
31
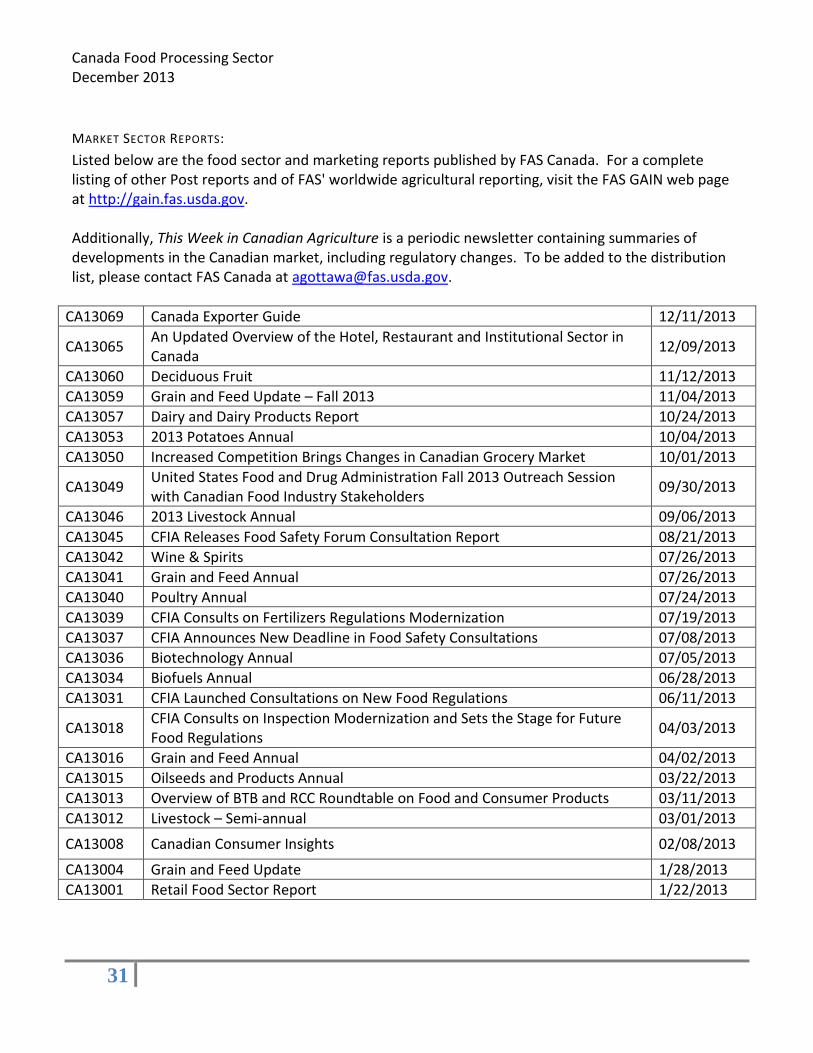
MARKET SECTOR REPORTS:
Listed below are the food sector and marketing reports published by FAS Canada. For a complete listing of other Post reports and of FAS' worldwide agricultural reporting, visit the FAS GAIN web page at http://gain.fas.usda.gov. Additionally, This Week in Canadian Agriculture is a periodic newsletter containing summaries of developments in the Canadian market, including regulatory changes. To be added to the distribution list, please contact FAS Canada at [email protected].
CA13069 Canada Exporter Guide 12/11/2013
CA13065 An Updated Overview of the Hotel, Restaurant and Institutional Sector in Canada
12/09/2013
CA13060 Deciduous Fruit 11/12/2013
CA13059 Grain and Feed Update – Fall 2013 11/04/2013
CA13057 Dairy and Dairy Products Report 10/24/2013
CA13053 2013 Potatoes Annual 10/04/2013
CA13050 Increased Competition Brings Changes in Canadian Grocery Market 10/01/2013
CA13049 United States Food and Drug Administration Fall 2013 Outreach Session with Canadian Food Industry Stakeholders
09/30/2013
CA13046 2013 Livestock Annual 09/06/2013
CA13045 CFIA Releases Food Safety Forum Consultation Report 08/21/2013
CA13042 Wine & Spirits 07/26/2013
CA13041 Grain and Feed Annual 07/26/2013
CA13040 Poultry Annual 07/24/2013
CA13039 CFIA Consults on Fertilizers Regulations Modernization 07/19/2013
CA13037 CFIA Announces New Deadline in Food Safety Consultations 07/08/2013
CA13036 Biotechnology Annual 07/05/2013
CA13034 Biofuels Annual 06/28/2013
CA13031 CFIA Launched Consultations on New Food Regulations 06/11/2013
CA13018 CFIA Consults on Inspection Modernization and Sets the Stage for Future Food Regulations
04/03/2013
CA13016 Grain and Feed Annual 04/02/2013
CA13015 Oilseeds and Products Annual 03/22/2013
CA13013 Overview of BTB and RCC Roundtable on Food and Consumer Products 03/11/2013
CA13012 Livestock – Semi-annual 03/01/2013
CA13008 Canadian Consumer Insights 02/08/2013
CA13004 Grain and Feed Update 1/28/2013
CA13001 Retail Food Sector Report 1/22/2013