canon report
DESCRIPTION
Canon reportTRANSCRIPT

October 24, 2013 Canon Inc.
Canon Inc.
Third Quarter 2013 Results
October 24, 2013
Toshizo Tanaka
Executive Vice President & CFO
This presentation contains forward-looking statements with respect to future results, performance and achievements that are subject to risk and uncertainties and reflect management’s views and assumptions formed by
available information. All statements other than statements of historical fact are statements that could be considered forward-looking statements. When used in this document, words such as “anticipate,” “believe,” “estimate,”
“expect,” “intend,” “may,” “plan,” “project” or “should” and similar expressions, as they relate to Canon, are intended to identify forward-looking statements. Many factors could cause the actual results, performance or
achievements of Canon to be materially different from any future results, performance or achievements that may be expressed or implied by such forward-looking statements, including, among others, changes in general
economic and business conditions, changes in currency exchange rates and interest rates, introduction of competing products by other companies, lack of acceptance of new products or services by Canon’s targeted
customers, inability to meet efficiency and cost reduction objectives, changes in business strategy and various other factors, both referenced and not referenced in this presentation. A detailed description of these and other
risk factors is included in Canon’s annual report on Form 20-F, which is on file with the United States Securities and Exchange Commission. Should one or more of these risks or uncertainties materialize, or should underlying
assumptions prove incorrect, actual results may vary materially from those described herein. Canon does not intend or assume any obligation to update these forward-looking statements.

October 24, 2013 Canon Inc.
3Q 2013 Results P3 – 5
FY 2013 Projections P6 – 9
Details by Business P10 – 15
Financial Situation P16 – 18
Supplementary Information P19 – 24
2
Agenda

October 24, 2013 Canon Inc.
External Environment Increasing signs of slowdown amid prolonged global
economic weakness
Yen’s depreciation
Results Posted second consecutive quarter of growth in both net
sales and profits Maintaining or improving market share – enhancing competitiveness
through the launch of new products that take advantage of
technological strengths
Continuing efforts to reduced costs and expenses
3
3Q 2013 in Summary

October 24, 2013 Canon Inc.
3Q 2013 3Q 2012 Pct. Change
Actual Actual
Net Sales 913.1 799.9 +14.2%
Gross Profit 447.1 386.8 +15.6%
(% Sales) 49.0% 48.3%
Op. Profit 90.6 70.9 +27.8%
(% Sales) 9.9% 8.9%
Net Income
Attributable to Canon Inc. 58.8 50.1 +17.3%
(% Sales) 6.4% 6.3%
Foreign Exchange Rate
Yen – 1USD 98.91 78.58
Yen – 1EURO 131.09 98.48
Summary of Results 3Q 2013 Actual
(Billions of yen)
4

October 24, 2013 Canon Inc.
Change in Exchange Rate
•1USD:
•1EURO:
78.58 to 98.91 yen
98.48 to 131.09 yen
5
Transition in Sales and Op. Profit 3Q 2013 Actual v. 3Q 2012 Actual
(Billions of yen)
Sales Op. Profit
3Q 2012 Actual 799.9 70.9
Foreign Exchange Impact +141.3 +53.1
(Net Sales, Cost of Sales, Expenses)
Sales Volume Impact
Office +21.8
Imaging System -12.1
Industry and Others -1.7
Total +8.0 -8.8
Others -36.1 -24.6
Total Change +113.2 +19.7
3Q 2013 Actual 913.1 90.6

October 24, 2013 Canon Inc.
Average
Exchange Rate 4Q13 FY13 FY12
Yen-1USD 97.00 yen 96.95 yen 79.96 yen
Yen-1EURO 130.00 yen 128.24 yen 102.80 yen
Impact of Exchange Rate Movement (4Q Impact Given a One Yen Change)
Net Sales Operating Profit
USD 4.7 billion yen 1.8 billion yen
EURO 2.1 billion yen 1.2 billion yen
Assumptions 2013 Current Projection
6

October 24, 2013 Canon Inc.
External Environment Uncertainty towards year-end selling season amid
expectations that economic situations in Europe and
emerging markets such as China will remain challenging
Outlook Revised projections, primarily for interchangeable-lens
cameras
Aim to firmly secure sales and profit growth in the fourth
quarter and for the full year Execute product and regionally tailored sales strategies
Continue efforts to reduce costs and expense
Promote measures that emphasize profitability to maintain sound
financial condition
Key Points FY2013
7
October 24, 2013 Canon Inc.
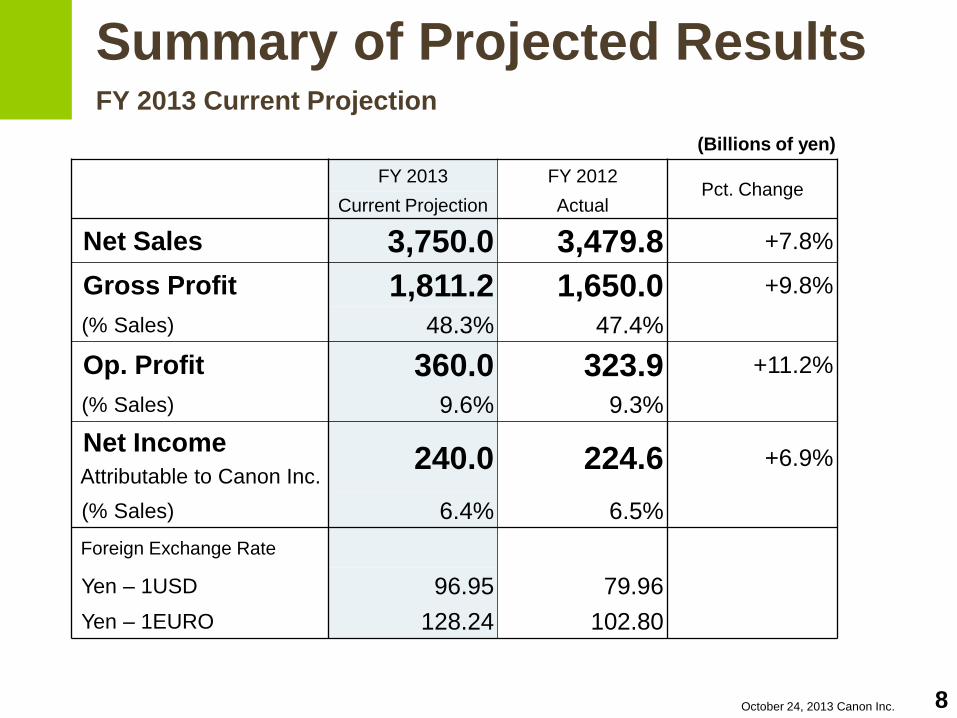
Summary of Projected Results FY 2013 Current Projection
(Billions of yen)
FY 2013 FY 2012 Pct. Change
Current Projection Actual
Net Sales 3,750.0 3,479.8 +7.8%
Gross Profit 1,811.2 1,650.0 +9.8%
(% Sales) 48.3% 47.4%
Op. Profit 360.0 323.9 +11.2%
(% Sales) 9.6% 9.3%
Net Income
Attributable to Canon Inc. 240.0 224.6 +6.9%
(% Sales) 6.4% 6.5%
Foreign Exchange Rate
Yen – 1USD 96.95 79.96
Yen – 1EURO 128.24 102.80
8

October 24, 2013 Canon Inc. 9
Transition in Sales and Op. Profit FY 2013 Current Projection v. FY 2013 Previous Projection
(Billions of yen)
Change in Exchange Rate
•1USD:
•1EURO:
95.46 to 96.95 yen
125.42 to 128.24 yen
Sales Op. Profit
Previous Projection (Jul. 24, 2013) 3,850.0 380.0
Foreign Exchange Impact +47.7 +24.0
(Net Sales, Cost of Sales, Expenses)
Sales Volume Impact
Office -41.8
Imaging System -112.6
Industry and Others -3.3
Total -157.7 -92.7
Others +10.0 +48.7
Total Change -100.0 -20.0
Current Projection (Oct. 24, 2013) 3,750.0 360.0

October 24, 2013 Canon Inc.
Office 3Q 2013 Actual
10
3Q13 Color Ratio
Copiers Printers
Value Base* 54% 46%
Unit Base 36% 15%
3Q13 Growth Rate y/y (Unit Base)
Copiers Printers
Color +9% +31%
Monochrome -7% +22%
Total -2% +24%
41 51
60
76 67
10.1%
11.2%
12.9%
14.7%
13.6%
3Q12 4Q12 1Q13 2Q13 3Q13
Op. Profit (Billions of yen)
Op. Profit Ratio
0
200
400
600
800
3Q12 4Q12 1Q13 2Q13 3Q13
Monochrome copiers Color copiers
Printers Others
Growth rate y/y ( ) Local currency base Sales (Billions of yen)
+16.8%(-2.1%)
+15.8%(-3.0%)
Copier total
Printers
Office total Op.Profit
+63.1%
Growth rate y/y
+20.6%(-0.8%)
+20.8%(-2.6%)
+16.3%(-2.6%)
409
456
*Includes Consumables
464
520 494

October 24, 2013 Canon Inc.
Office FY 2013 Projection
11
204
264 272
11.6%
13.0% 13.6%
FY12 FY13 FY13
Op. Profit (Billions of yen)
Op. Profit Ratio
0
500
1,000
1,500
2,000
2,500
3,000
FY12 FY13 FY13
Monochrome copiers Color copiers
Printers Others
Growth rate y/y ( ) Local currency base
(Billions of yen)
+13.5%(-1.8%)
+15.7%(+0.3%)
Copier total
Office total
Sales
+33.8%
Growth rate y/y
+13.5%(-3.2%)
+8.9%(-8.8%)
+14.7%(-0.7%)
Op.Profit
1,758
Previous
Projection
Current
Projection
Printers
FY13 Color Ratio
Copiers Printers
Value Base* 55% 47%
Unit Base 36% 14%
FY13 Growth Rate y/y (Unit Base)
Copiers Printers
Color +10% +15%
Monochrome -2% +12%
Total +2% +12% *Includes Consumables
Previous
Projection
Current
Projection
2,020 1,995

October 24, 2013 Canon Inc.
0
200
400
600
3Q12 4Q12 1Q13 2Q13 3Q13
Cameras IJP Others
Imaging System 3Q 2013 Actual
12
Interchangeable Lens
Digital Camera Ratio *
3Q13
Value Base 83%
Unit Base 41%
Growth Rate y/y (Unit Base)
3Q13
Interchangeable Lens
Digital Cameras -3%
Compact Digital
Cameras -31%
Total Digital Cameras -22%
IJP -2%
* Proportion of
Total Digital Cameras
* Value Base Includes
Interchangeable Lenses
53 55
28
56 57
16.3%
13.4%
9.6%
14.6% 16.3%
3Q12 4Q12 1Q13 2Q13 3Q13
Op. Profit (Billions of yen)
Op. Profit Ratio
(Billions of yen)
+3.7%(-16.6%)
+19.2%(-0.5%)
+8.2%(-12.0%)
Imaging
System
IJP
Cameras
+8.2%
Growth rate y/y
Op.Profit
Growth rate y/y ( ) Local currency base Sales
322
411
298
386
349

October 24, 2013 Canon Inc.
Imaging System FY 2013 Projection
210 254
212
15.0% 16.5%
14.5%
FY12 FY13 FY13
Op. Profit (Billions of yen)
Op. Profit Ratio
0
500
1,000
1,500
2,000
2,500
FY12 FY13 FY13
Cameras IJP Others
(Billions of yen)
+0.7%
Growth rate y/y
+0.0%(-16.3%)
+16.0%(+0.6%)
+4.2%(-11.9%)
Imaging
System
IJP
Cameras
Op.Profit
Previous
Projection
Current
Projection
Previous
Projection
Current
Projection
1,406
Growth rate y/y ( ) Local currency base Sales
Interchangeable Lens
Digital Camera Ratio *
FY13
Value Base 81%
Unit Base 36%
Growth Rate y/y (Unit Base)
FY13
Interchangeable Lens
Digital Cameras -3%
Compact Digital
Cameras -24%
Total Digital Cameras -17%
IJP +1%
* Proportion of
Total Digital Cameras
* Value Base Includes
Interchangeable Lenses
13
1,537 1,465

October 24, 2013 Canon Inc.
Industry and Others 3Q 2013 Actual
14
IC Lithography Unit
Breakdown by Light Source
3Q12 3Q13
ArF 0 0
KrF 0 0
i-line 8 10
Lithography Equipment
(Unit Sales)
3Q12 3Q13
IC 8 10
FPD 3 0
5
-9 -8
-6 -8
5.4%
-8.9% -10.0%
-6.8% -8.6%
-15.0%
-10.0%
-5.0%
0.0%
5.0%
10.0%
15.0%
20.0%
25.0%
30.0%
-10
-5
0
5
10
15
20
3Q12 4Q12 1Q13 2Q13 3Q13
Op. Profit (Billions of yen)
Op. Profit Ratio
-22 -20 -18 -22 -23
13 9 6 11 9
80 98
69
75 86
-30
0
30
60
90
120
150
180
3Q12 4Q12 1Q13 2Q13 3Q13
Sales Eliminations Lithography Equipment Others
+1.7%(-3.9%)
Industry and Others
Net Sales
Gross
93
Gross Sales
(Includes
sales among
Group
businesses)
Gross
95
Growth Rate y/y ( ) Local Currency Base
*Calculation of operating profit ratio
includes intersegment sales
Net Sales
+2.3%(-1.9%)
Gross Sales
(Litho. Equip.)
(Billions of yen)
Op.Profit
Sales
Eliminations
(Sales
among Group
businesses)
-32.4%(-36.9%)
Sales
71
86
57
64 72
October 24, 2013 Canon Inc.
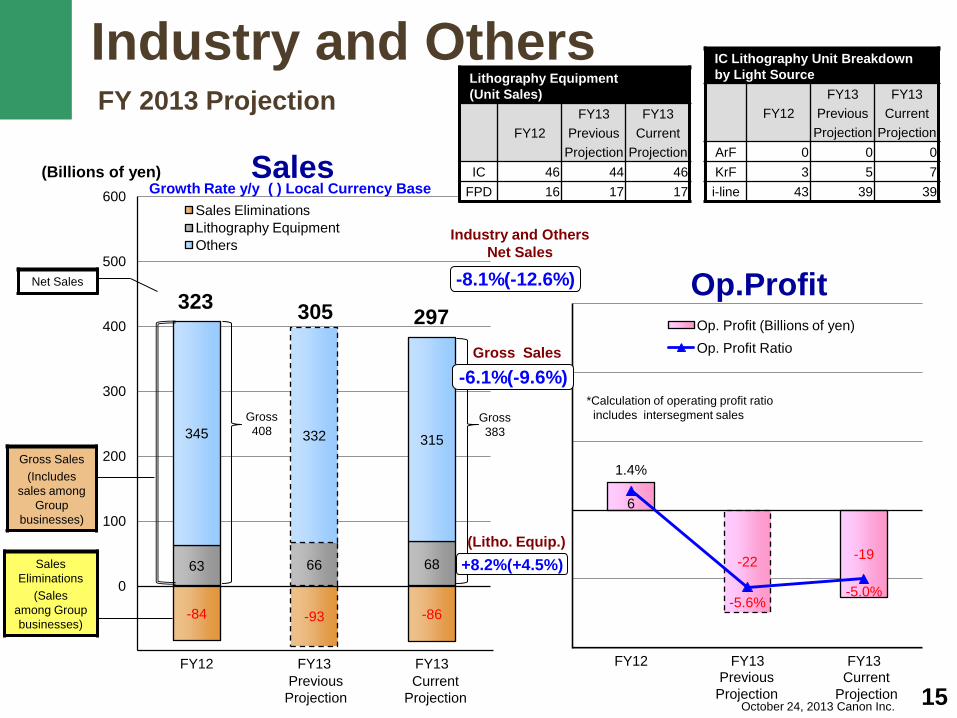
Industry and Others FY 2013 Projection
15
6
-22 -19
1.4%
-5.6% -5.0%
-10.0%
-5.0%
0.0%
5.0%
10.0%
15.0%
-30
-15
0
15
30
45
FY12 FY13 FY13
Op. Profit (Billions of yen)
Op. Profit Ratio
-84 -93 -86
63 66 68
345 332 315
-100
0
100
200
300
400
500
600
FY12 FY13 FY13
Sales Eliminations
Lithography Equipment
Others Industry and Others
Net Sales
Gross Sales
(Includes
sales among
Group
businesses)
Gross
383
Growth Rate y/y ( ) Local Currency Base
*Calculation of operating profit ratio
includes intersegment sales
Net Sales
-6.1%(-9.6%)
Gross Sales
(Litho. Equip.)
(Billions of yen)
Op.Profit 323
Sales
Eliminations
(Sales
among Group
businesses)
Gross
408
-8.1%(-12.6%)
Sales
Previous
Projection
Current
Projection
Previous
Projection
Current
Projection
IC Lithography Unit Breakdown
by Light Source
FY12
FY13
Previous
Projection
FY13
Current
Projection
ArF 0 0 0
KrF 3 5 7
i-line 43 39 39
Lithography Equipment
(Unit Sales)
FY12
FY13
Previous
Projection
FY13
Current
Projection
IC 46 44 46
FPD 16 17 17
+8.2%(+4.5%)
305 297

October 24, 2013 Canon Inc.
Inventories
16
518
477
554 542
591
552
589 582 608
54 46
56 57 63
57 61 60 59
-50
-30
-10
10
30
50
70
90
300
400
500
600
700
800
3QE11 4QE11 1QE12 2QE12 3QE12 4QE12 1QE13 2QE13 3QE13
Amount (Billions of yen)
Turnover (Days)
(Billions of yen)
October 24, 2013 Canon Inc.
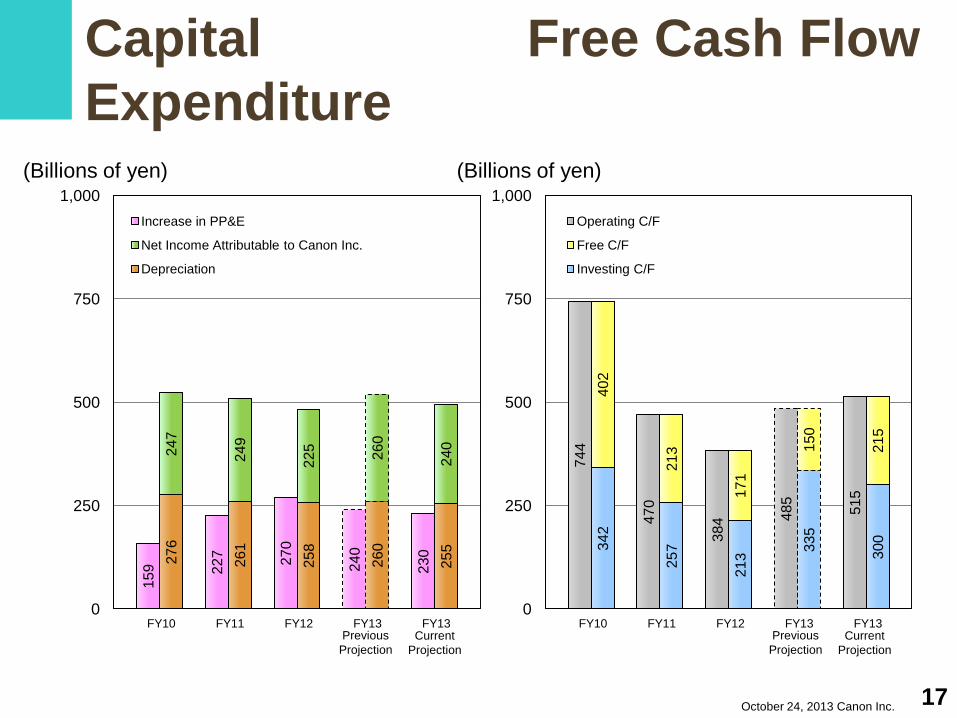
276
261
258
260
255
247
24
9
225
260
24
0
159
227
270
240
230
0
250
500
750
1,000
FY10 FY11 FY12 FY13 FY13
Increase in PP&E
Net Income Attributable to Canon Inc.
Depreciation
342
257
213 3
35
300
402
213
171
150
215
744
470
384 485
515
0
250
500
750
1,000
FY10 FY11 FY12 FY13 FY13
Operating C/F
Free C/F
Investing C/F
Free Cash Flow Capital
Expenditure (Billions of yen) (Billions of yen)
17
Previous
Projection
Current
Projection
Previous
Projection
Current
Projection

October 24, 2013 Canon Inc.
Cash on Hand
18
Note : 450, 100, 50, 100, 150, and 50 billion yen was used to acquire own shares
in 2007, 2008, 2010, 2011, 2012, and 2013, respectively.
Cash on Hand (Year-end)
795 841
773
667 690 710
2.8
2.5 2.5
2.3 2.0
2.2
0
0.5
1
1.5
2
2.5
3
3.5
4
0
500
1000
1500
FYE09 FYE10 FYE11 FYE12 FYE13 Previous
Projection
FYE13 Current
Projection
Cash-on-hand (Bilions of yen)
Cash-on-hand (In months of 2nd-half net sales)
October 24, 2013 Canon Inc.
Supplementary Information
19

October 24, 2013 Canon Inc.
Change in Exchange Rate
•1USD:
•1EURO:
79.96 to 96.95 yen
102.80 to 128.24 yen
Transition in Sales and Operating Profit FY 2013 Current Projection v. FY 2012 Actual
(Billions of yen)
Supplementary Information 20
Sales Op. Profit
FY 2012 Actual 3,479.8 323.9
Foreign Exchange Impact
+488.7 +217.8 (Net Sales, Cost of Sales, Expenses)
Sales Volume Impact
Office +27.1
Imaging System -66.1
Industry and Others -39.5
Total -78.5 -92.6
Others -140.0 -89.1
Total Change +270.2 +36.1
FY 2013 Current Projection 3,750.0 360.0

October 24, 2013 Canon Inc.
141.3
-8.8
-36.1 -47.7
11.6
60.3
-100
-50
0
50
100
150
Forex Impact
on Sales
Sales Volume Impact
Price Change
Forex Impact
on Costs
Cost Reduction
Total Change in Gross
Profit
(Billions of yen)
Gross Profit Variance Analysis 3Q 2013 Actual v. 3Q 2012 Actual
(Billions of yen)
Supplementary Information
3Q13 3Q12 Change
Gross Profit 447.1 386.8 +60.3
% Sales 49.0% 48.3% +0.7pt.
21

October 24, 2013 Canon Inc.
Operating Profit Variance Analysis 3Q 2013 Actual v. 3Q 2012 Actual
3Q13 3Q12 Change
Op. Profit 90.6 70.9 +19.7
% Sales 9.9% 8.9% +1.0pt.
(Billions of yen)
(Billions of yen)
Supplementary Information
60.3
-0.1
-40.5
19.7
-100
-50
0
50
100
150
Total Change in
Gross Profit
Change in SG & A
(Excluding Forex Impact)
Change in SG & A
(Forex Impact)
Total Change in
Operating Profit
22

October 24, 2013 Canon Inc.
Interest Bearing Debt
Supplementary Information
10 11 12
4 3 0.3% 0.3% 0.3%
0.1% 0.1% 0.0%
1.0%
2.0%
3.0%
4.0%
5.0%
0
10
20
30
40
50
FYE09 FYE10 FYE11 FYE12 3QE13
Debt
Debt/Total Assets
(Billions of yen)
23

October 24, 2013 Canon Inc.
Financial Ratios
(Yen)
Supplementary Information
106.64
199.71 204.49 191.34 209.07
4.9%
9.2% 9.6%
8.7% 8.9%
3.4%
6.3% 6.3% 5.7% 5.9%
0%
5%
10%
15%
0
300
600
900
FY09 FY10 FY11 FY12 FY13 Current
Projection EPS(Basic) (Attributable to Canon Inc.)
ROE ROA
24