canterbury wellbeing index, september 2016, … · canterbury wellbeing index 2016 | mental...
TRANSCRIPT

Canterbury Wellbeing Index 2016 | Mental wellbeing | 1
2016
Canterbury Wellbeing Index
Mental wellbeing
The Canterbury Wellbeing Index tracks the progress of social recovery in greater Christchurch following the earthquakes using indicators to identify emerging social trends and issues.
Why is mental wellbeing important? Mental wellbeing is a positive state where people are emotionally healthy, are able to live full and creative lives, and can deal with life’s challenges. Mental wellbeing can also be defined as flourishing, where people are engaged with life, and have a sense of meaning and purpose. Mental wellbeing can positively affect most dimensions of people’s lives: family and friendships, employment, education, physical health, and life expectancy.1 People who are mentally well are more productive in the workforce, do better in education, and are able to function better cognitively. They are also more likely to live longer, are less likely to engage in adverse behaviours like smoking, hazardous drinking, drug use, and risky sexual behaviour, and they are less likely to be obese.1 One in four people will experience a mental health problem at some point in their life. At any given time, one in every six adults is experiencing mental ill health.2,3
Experts agree that disasters have a negative impact on people’s mental wellbeing, particularly at the severe end of the spectrum.4 The World Health Organization estimates that after a disaster, severe mental health disorders increase from 2–3 per cent to 3–4 per cent of the population, and mild to moderate mental disorders can double from 10 per cent to 20 per cent.5 However, it is agreed that over time, those experiencing mild psychological reactions will be able to cope and recover if they receive basic support.6,7,8
In May 2011 Chief Science Advisor Professor Sir Peter Gluckman indicated that 5-10 per cent of people may need some help, and up to 5 per cent of the population may continue to have ongoing significant psychological ill health requiring professional help as a result of the earthquakes.9
Recovery from the psychosocial effects of disaster includes how individuals and communities feel and relate to each other. The recovery process can be very protracted, taking 5-10 years or even longer.10
International experience suggests that post-disaster stressors, such as delayed decisions about property and insurance, are some of the most significant factors that increase the risk of mental ill health and hold back recovery. Primary stressors are defined as stressors that are directly related to the disaster; for example, injuries sustained or aftershocks. Secondary stressors are circumstances, events, or policies that are indirectly related or ‘non-inherent and consequential’ to the earthquakes.11 Examples are housing difficulties, problems with insurance, and loss of social networks.12
The mental wellbeing of some population groups may be particularly vulnerable after a disaster. These groups include people who already had mental health issues and those who lack the social supports necessary to help them cope. A review of disasters in the United States found that the poor are more vulnerable at all stages of a disaster, including to both physical and psychological impacts.13 The review noted that poor people are more likely to be financially devastated by a disaster and specifically referred to those of low socioeconomic status reporting greater stress related to the possibility of losing their jobs. The review also noted that “the poor were less likely to have access to physical resources and mental health services… further exacerbating emotional vulnerability” (p.96).
Disparities in the impacts of disasters between different ethnic groups have also been found in United States research.14 Following Hurricane Ike, research found that African Americans reported significantly higher depressive and post-traumatic stress disorder symptoms than ‘White’a survivors. Other vulnerable people are those who had no previous difficulties, but who have experienced significant loss as a result of the earthquakes. This may include loss of a loved one, personal injury, loss of property, or financial problems. Recovery is improved where affected people perceive that social supports are available and are able to access these supports.15
a The researchers asked people to specify their “racial background (i.e. Asian, Black or African American, American Indian or Alaska Native, Native Hawaiian or other Pacific Islander, White, Latino, or Other”).

Canterbury Wellbeing Index 2016 | Mental wellbeing | 2
How was mental wellbeing impacted by the earthquakes?The earthquakes have deeply affected the residents of greater Christchurch. Psychological recovery was interrupted by the sequence of aftershocks during 2011 and 2012 which meant that people had to continually respond to new events.16 The latest substantial aftershock likely to have caused many residents further distress and anxiety was on the 14 February 2016. Levels of general distress in the population were high immediately after the earthquakes.b Some health and welfare services reported high demand for assistance with general symptoms of stress and anxiety. For some people, these symptoms continued for a long time.
By the middle of 2012, services were reporting that people’s mental wellbeing was less affected by aftershocks. However, a growing number of people were reporting that secondary stressors such as uncertainty around decisions relating to their insurance and the repair or rebuild of their homes were causing stress and anxiety.17
Several studies have attempted to measure the impact of the earthquakes on adult and child mental wellbeing. A study of middle-aged Christchurch residents 18 months after the February 2011 earthquake found that rates of major depressive disorder and bipolar disorder were higher than rates found in a pre-earthquake and a national study.18 In 2012, a study of the Christchurch Health and Development cohortc found that after controlling for various factors including prior mental health, those from the cohort who were exposed to the Canterbury earthquakes were at greater risk of major depression, post-traumatic stress disorder, other anxiety disorders, and nicotine dependence.19
For children, one study analysed Strengths and Difficulties Questionnaire data from the B4 School Check and found no significant differences in pre and post-earthquake scores for behavioural and emotional problems.20 However, a study which measured post-traumatic stress symptoms in one pre-earthquake group of Christchurch five year olds and one post-earthquake group of Christchurch five year olds three to four years after the first earthquake found that the post-earthquake group had significantly more teacher-reported behaviour problems, and post-traumatic stress symptoms and scores.21
Table 1 shows key findings from the 2012 CERA Wellbeing Survey, which asked a number of questions about secondary stressors associated with the earthquakes.22 In 2012 the largest secondary stressor was ‘distress or anxiety associated with ongoing aftershocks’. The survey also found that secondary stressors around insurance and repairs as well as loss of leisure facilities had impacted the majority of the population.
Table 1: Most common negative outcomes of the earthquakes, as reported in September 2012
Negative outcome% who had experienced
outcome
% who reported moderate or major
negative impactLoss of other recreational, cultural and leisure time facilities (cafes, restaurants, libraries etc) 69 34
Distress or anxiety associated with on-going aftershocks 66 42
Dealing with EQC/insurance issues in relation to personal property and/or house 65 37
Making decisions about house damage, repairs and relocation 54 29
While there were some obvious challenges to mental wellbeing due to the earthquakes, people also reported many positives.
Table 2 shows the four most common positive outcomes, which include ‘renewed appreciation of life’, ‘pride in ability to cope’ and ‘heightened sense of community’. Research has shown that bonds with family and friends can become stronger, and that people become more knowledgeable about themselves, wiser, more compassionate, and find new perspectives on life after facing adversity.23
a See Table 1 for example, which notes that 42 per cent of respondents to the 2012 CERA Wellbeing Survey reported that anxiety associated with ongoing aftershocks caused a moderate or major negative impact.b An ongoing cohort study of 1265 children born in Christchurch in 1977.

Canterbury Wellbeing Index 2016 | Mental wellbeing | 3
Table 2: Most common positive outcomes of the earthquakes, as reported in September 2012
Positive outcome% who had experienced
outcome
% who reported moderate or major
positive impact
Pride in ability to cope under difficult circumstances 76 41
Family’s increased resilience 69 36Renewed appreciation of life 68 45Heightened sense of community 67 34
What is happening now?Since September 2010, government and non-government social service agencies have worked together to develop a layered system of wellbeing support for people experiencing distress, based on the Psychosocial Intervention Pyramid (Figure 1).d Many of these services and supports are focused on early intervention, to ensure that people can access help and support that will prevent them from developing more severe mental health conditions. This stepped approach is illustrated in the following pyramid; services, support, and information are then outlined below.
Figure 1: Psychosocial Intervention Pyramid
d adapted from Inter-Agency Standing Committee http://www.who.int/mental_health/emergencies/guidelines_iasc_mental_health_psychosocial_june_2007.pdf

Canterbury Wellbeing Index 2016 | Mental wellbeing | 4
Across the pyramid a number of community and family services are in place to help people accessinformation and the health and social services they need.
• The 0800 Canterbury Support Line, established immediately after the September 2010 earthquake, provides callers with advice and referral to timely and appropriate support. The 0800 Canterbury Support Line, counselling services, and the Earthquake Support Coordination Service were funded for three years from 1 July 2010 to 30 June 2014 through the Government’s Canterbury Earthquake Recovery Fund. The Government announced new operating funding of $13.5 million in 2014 which will see the provision of these services, based on need, for four years (from 1 July 2014 to 30 June 2018). The 0800 Canterbury Support Line was funded through the Ministry of Social Development (MSD) and is now funded through Canterbury District Health Board (Canterbury DHB).
• Counselling services have been provided at no cost to residents affected by the earthquakes. The main provider until May 2015 was Relationships Aotearoa (formerly Relationship Services). This service is now being transitioned to a range of counsellors in Christchurch under the umbrella of the Mental Health Education and Resource Centre who act as fund holder. Access to these counselling services is via the Canterbury Support Line.
• The Earthquake Support Coordination Service is available for people who require more support. This service includes 21.4 full-time equivalent staff including Kaitoko workers who support vulnerable and at-risk whānau. The Earthquake Support Coordinators and Kaitoko provide practical information and support to people displaced from their homes or who have ongoing issues relating to the earthquakes.
• The All Right? social marketing campaign, launched in February 2013, works to support and improve Cantabrians’ mental health and wellbeing as Canterbury recovers and rebuilds from the earthquakes. The campaign is a Healthy Christchurch initiative, led by Canterbury DHB and Mental Health Foundation.
• All Right? uses a mental health promotion approach to support the wellbeing of the people of Canterbury. Mental health promotion is “the process of enhancing the capacity of individuals and communities to take control of their lives and improve their mental health while showing respect for culture, equity, social justice and personal dignity (p. 16)”.24 While the campaign is focused on the whole population, specific streams have been designed for parents, Māori, Pacific, youth, and culturally and linguistically diverse (CALD) communities.
The aim of the campaign is to actively support Cantabrians to become champions of their own wellbeing, to capture what Cantabrians have learnt as a community over the past four years, and to provide ways the region can share this information with others - be it by assisting other global communities post-disaster, when in need, or simply by becoming a leader for wellbeing promotion in New Zealand.
• Canterbury DHB developed new mental health services and expanded many existing services in response to earthquake related needs. High demand has been maintained, and Canterbury DHB is currently working with the Ministry of Health on the implementation of a package of additional services that are expected to support the system to better meet the needs of its community. Children, young people and families are considered priority groups by the Canterbury Clinical Network Mental Health Workstream who have oversight of the development of additional services across primary care, the community and the DHB.
• Funding for extended general practitioner (GP) consultations is available to enable people with complex needs/issues, including people with mental and physical health effects, to spend longer with their general practice team. These will be further extended in 2016/17.
• Brief intervention counsellors have provided up to five sessions of treatment for individual patients. Primary mental health teams continue to provide brief interventions to individual patients and there is work underway to strengthen the response to people with more complex challenges.
• Many agencies and businesses including Canterbury DHB and MSD have introduced or increased a range of wellbeing and support initiatives for their staff.
Canterbury Wellbeing Index 2016 | Mental wellbeing | 5
• The Residential Advisory Service was established in May 2013 to help address rebuild-related stressors for property owners with insurance and other repair or rebuilding challenges. The service provides impartial and independent legal advice and assistance to help residential property owners understand and progress the repair and rebuild. By May 2016, this service had received 14,080 contacts from residential property owners; of these, 3,656 have met with an independent advisor and 1,047 have been referred to other agencies or organisations better matching their individual needs.
• New Zealand Red Cross is continuing to work in post-quake greater Christchurch, implementing the River and Reeds Community Resilience Programme. The River and Reeds programme has been designed to work in partnership with communities and other agencies to build community connections and social capital and provide a legacy of stronger communities in greater Christchurch, better prepared to withstand shocks and disasters in the future.
The River and Reeds programme will work to:
- increase the capability of individuals, households, and communities in greater Christchurch to cope with new shocks and disasters;
- ensure people have the knowledge, skills, and motivation needed, and are taking steps to strengthen their resilience; and
- support the creation of stronger social connections between individuals, neighbourhoods, and organisations.
• A range of funders including MSD, Red Cross, Rātā Foundation, Christchurch City Council, Canterbury DHB, the Tindall Foundation, and the Wayne Francis Trust have funded the Leadership in Communities (LinC) course, run by Leadership Lab, to help support community leaders, frontline staff, and professional health and social service staff working with affected clients and communities.
• The Ministry of Education continues to offer tailored support to early childhood centres, schools, and students, which is evidence informed and promotes wellbeing, where the need for this support is identified.
• The Ministry of Education, MSD and Canterbury DHB continue to work closely to identify issues impacting on children and young people, ensuring joined up planning and responses in terms of support provided to schools. This partnership has led to the development of Schools Based Mental Health Services (now in 107 Canterbury schools) and shared workforce development.
• A Canterbury-wide parent support package brings together information and services to help parents of children manage the challenges of dealing with direct stressors arising from the experiences of the Canterbury earthquakes and secondary stressors that affect them and their children. Examples of secondary stressors that can have social and psychological impacts on children include change, relocation, resettlement, rebuilding, loss of services, and stress arising from parental housing, property, and employment-related stress.25
• Earthquake Assistance Centres in Avondale and Kaiapoi provided information and assistance for home owners. The Avondale Centre was closed in December 2013 after providing residents with a total of 13,582 face-to-face appointments with specialists since it was set up in August 2011. The Kaiapoi Centre saw a total of 4,828 people before its closure in 2014.
• The In the Know Hub was set up at Eastgate Mall in April 2015 with earthquake recovery agencies and support services able to advise on progressing home repair and rebuild processes. This service is now closed.
Canterbury Wellbeing Index 2016 | Mental wellbeing | 6
Looking forward
In February 2014 Cabinet approved the Community in Mind Strategy – a psychosocial strategy for greater Christchurch. The Strategy was released in June 2014 with the associated Shared Programme of Action launched in May 2015.
The Programme is intended to guide agencies and community groups in developing, targeting, and coordinating their programmes and activities for the psychosocial recovery of greater Christchurch over the next five years. It has three focus areas:
1. Community-led (Kurupae Hāpori) – strengthening and supporting communities to drive their own recovery
2. Communication and engagement (Taumata Kōrero) – ensuring coordination of recovery information and facilitating engagement opportunities
3. Innovative services (Pāpori Rerekē) – promoting the development and delivery of innovative services, supports, and information to assist psychosocial recovery.
The Shared Programme of Action sets out the activities that will improve community and individual resilience, deliver positive outcomes, and support people to shape and lead their own recovery.
The Greater Christchurch Psychosocial Committee supports the ongoing development, implementation and review of the Shared Programme of Action. The Committee is now overseen and supported by the Psychosocial Governance Group led by Canterbury DHB and connected to a governance group that has been convened as a part of the greater Christchurch Urban Development Strategy Implementation Committee (UDSIC).
Partners in this work programme include the three territorial authorities in greater Christchurch, Canterbury DHB, Ministry of Education, MSD, Ministry of Health, Police, MBIE, and a wide range of other networks, agencies, and organisations.
Canterbury DHB has received new funding of $20 million over three years in recognition of the pressures faced in Mental Health Services. This will fund: an extension of the All Right? campaign; more specialist staff to provide brief interventions to children, adolescents, and adults with mental health issues; an increase in School Based Mental Health Team capacity; extended GP consults; consult/liaison and interventions for Specialist Mental Health Child, Adolescent and Family Services; online support for Māori exiting alcohol and drug treatment and for children and young people in primary care; telehealth support; workforce wellbeing support; and alternatives to inpatient care.
Canterbury Wellbeing Index 2016 | Mental wellbeing | 7
What are the indicators telling us?Overall quality of life
This is measured using data from two surveys: the New Zealand Quality of Life Survey; and the Canterbury Wellbeing Survey.
Prior to the earthquakes, quality of life in Christchurch City was monitored every two years using the New Zealand Quality of Life Survey.26 Substantial changes were made to the methodology of this survey between 2010 and 2012, resulting in a loss of time series. This means that direct comparisons of the data pre and post these changes are not possible.e Since 2012, quality of life in greater Christchurch has also been measured using the twice-yearly Canterbury Wellbeing Survey (formerly the CERA Wellbeing Survey). This survey asks the same quality of life question as the New Zealand Quality of Life Survey “Would you say that your overall quality of life is: extremely poor; poor; neither poor nor good; good; extremely good’ although it is couched in an earthquake recovery context,f which may have a different influence on how people respond to the question.
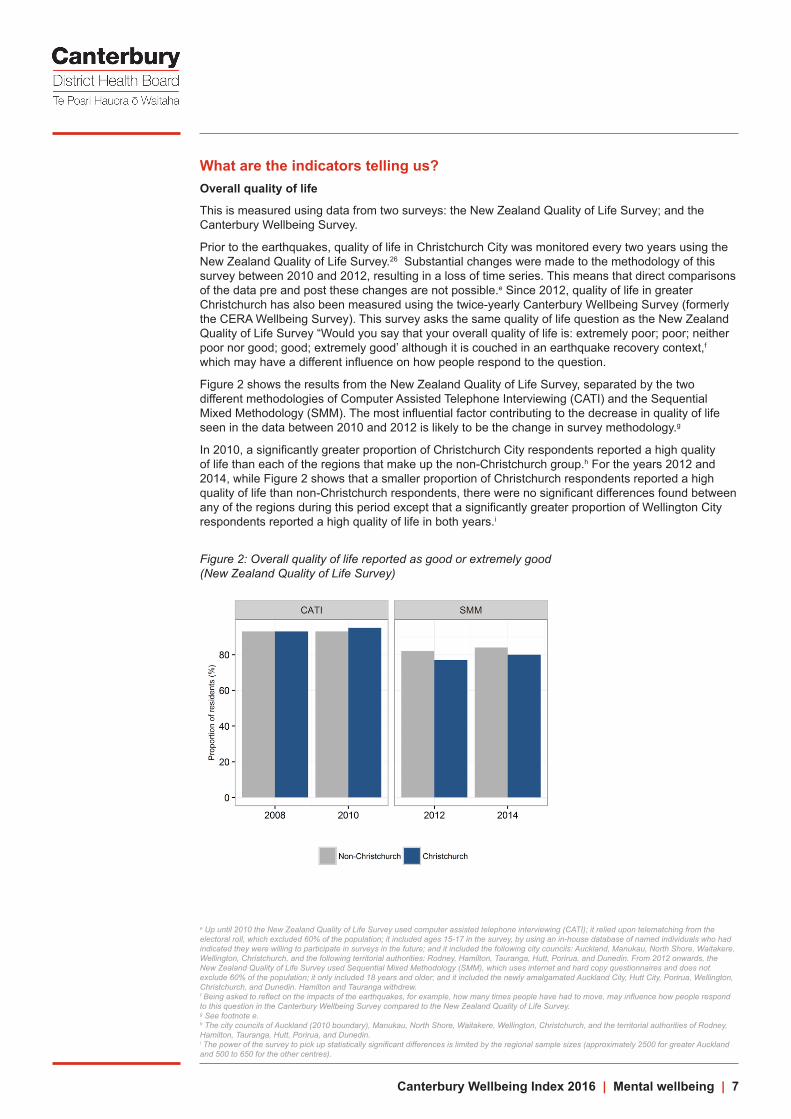
Figure 2 shows the results from the New Zealand Quality of Life Survey, separated by the two different methodologies of Computer Assisted Telephone Interviewing (CATI) and the Sequential Mixed Methodology (SMM). The most influential factor contributing to the decrease in quality of life seen in the data between 2010 and 2012 is likely to be the change in survey methodology.g
In 2010, a significantly greater proportion of Christchurch City respondents reported a high quality of life than each of the regions that make up the non-Christchurch group.h For the years 2012 and 2014, while Figure 2 shows that a smaller proportion of Christchurch respondents reported a high quality of life than non-Christchurch respondents, there were no significant differences found between any of the regions during this period except that a significantly greater proportion of Wellington City respondents reported a high quality of life in both years.i
Figure 2: Overall quality of life reported as good or extremely good (New Zealand Quality of Life Survey)
e Up until 2010 the New Zealand Quality of Life Survey used computer assisted telephone interviewing (CATI); it relied upon telematching from the electoral roll, which excluded 60% of the population; it included ages 15-17 in the survey, by using an in-house database of named individuals who had indicated they were willing to participate in surveys in the future; and it included the following city councils: Auckland, Manukau, North Shore, Waitakere, Wellington, Christchurch, and the following territorial authorities: Rodney, Hamilton, Tauranga, Hutt, Porirua, and Dunedin. From 2012 onwards, the New Zealand Quality of Life Survey used Sequential Mixed Methodology (SMM), which uses internet and hard copy questionnaires and does not exclude 60% of the population; it only included 18 years and older; and it included the newly amalgamated Auckland City, Hutt City, Porirua, Wellington, Christchurch, and Dunedin. Hamilton and Tauranga withdrew. f Being asked to reflect on the impacts of the earthquakes, for example, how many times people have had to move, may influence how people respond to this question in the Canterbury Wellbeing Survey compared to the New Zealand Quality of Life Survey. g See footnote e.h The city councils of Auckland (2010 boundary), Manukau, North Shore, Waitakere, Wellington, Christchurch, and the territorial authorities of Rodney, Hamilton, Tauranga, Hutt, Porirua, and Dunedin.i The power of the survey to pick up statistically significant differences is limited by the regional sample sizes (approximately 2500 for greater Auckland and 500 to 650 for the other centres).

Canterbury Wellbeing Index 2016 | Mental wellbeing | 8
Figure 3 displays data solely from the Canterbury Wellbeing Survey. Eighty two per cent of greater Christchurch residents reported their quality of life was good or extremely good in April 2016, which was significantly greater than the previous time point. Over the time period of the survey, there has been a significant trend of increasing proportions of respondents reporting good or extremely good quality of life. This has tracked up slowly following a low of 73 per cent in September 2013. From September 2012 until April 2016, the proportion of respondents indicating that their quality of life is poor has not changed significantly; at April 2016, the figure was five per cent, and it has ranged from five to seven per cent.
Those more likely to rate their overall quality of life positively in April 2016 were from higher income households (i.e. $60,000-$100,000 or more than $100,000) (87 per cent and 91 per cent), those whose total value of their dwelling claim was up to $15,000 (90 per cent) or $15,001 to $50,000 (91 per cent), or those who had not needed to make an insurance claim (88 per cent).
In comparison, those less likely to rate their overall quality of life positively were from a household with an income of less than $30,000 (63%), living with a health condition or disability (64%), living in temporary housing (68%), renting the dwelling they usually live in (72%), or of Pacific, Asian, or Indian ethnicity (73%).
Figure 3: Overall quality of life reported as good or extremely good (Canterbury Wellbeing Survey)
Change in quality of life
The September 2012 CERA Wellbeing Survey asked respondents if their quality of life had changed since the earthquakes. Over half (54 per cent) reported that their quality of life had ‘decreased significantly’ (10 per cent) or ‘decreased to some extent’ (44 per cent). By April 2016, only 13 per cent of respondents reported deterioration in their quality of life compared to 12 months ago. Population groups more likely to report deterioration in their quality of life were those living with a health condition or disability (28%), those who had unresolved claims at the property they own and usually live in (25%), those from a household with an income of less than $30,000 (24%), those aged 75 years old or over (24%), those living in temporary housing (20%), and those whose total value of their dwelling claim was over cap ($100,001 or more) (17%).
Eighty two per cent of greater Christchurch residents reported their quality of life was good or extremely good in April 2016, which was significantly greater than the previous time point.

Canterbury Wellbeing Index 2016 | Mental wellbeing | 9
Impacts of the earthquake on stress and emotional wellbeing
Stress is measured using data from two surveys: the New Zealand Quality of Life Survey;j and the Canterbury Wellbeing Survey. Both surveys ask respondents:
“At some time in their lives, most people experience stress. Which statement below best applies to how often, if ever, over the past 12 months you have experienced stress that has had a negative effect on you?k Always; most of the time; sometimes; rarely; never.”
Figure 4 shows that in 2014, 19 per cent of Christchurch city residents reported experiencing stress often (always or most of the time). As with Figure 2 above, the most influential factor contributing to the increase in stress for non-Christchurch and Christchurch seen in Figure 4 between the Computer Assisted Telephone Interviewing (CATI) surveys and the Sequential Mixed Methodology (SMM) surveys is likely to be the change in survey methodology.l From 2008 to 2014, there was no statistically significant difference between the proportion of Christchurch respondents reporting stress always or most of the time and each of the regions making up the non-Christchurch group.m
Figure 4: Proportion of respondents reporting stress always or most of the time (New Zealand Quality of Life Survey)
Figure 5 displays data solely from the Canterbury Wellbeing Survey. Just under three quarters (73%) of respondents from greater Christchurch have experienced stress at least sometimes in the past 12 months that has had a negative impact on them. There has been a statistically significant downward trend since the earthquakes – 80% in September 2012 to 73% in April 2016.
The proportion of respondents reporting stress always or most of the time (represented by the grey and blue portions of the bars) has ranged from 23 per cent in September 2012 to 19 per cent in April 2015. There is no statistically significant trend for change for this data. In April 2016, 21 per cent of respondents reported stress always or most of the time. The groups more likely to report experiencing stress always or most of the time in April 2016 were those living in temporary housing (38%), those living with a health condition or disability (31%), those renting the dwelling they usually live in (28%), and those aged 18 to 24 (27%) or 25 to 34 years old (26%).
Those less likely to say they had experienced stress always or most of the time were those aged 65 to 74 years old (11%) or 75 years or over (13%), and those who had not needed to make an insurance claim on their dwelling (13%). A lower proportion of Selwyn District (16%) and Waimakariri District (17%) residents reported experiencing stress often than those living in Christchurch City..
j See footnotes above for the methodological changes in the New Zealand Quality of Life survey, and the difference in context of the Canterbury Wellbeing Survey compared to the New Zealand Quality of Life Survey.k The following sentence is also included in the question; “Stress refers to things that negatively affect different aspects of people’s lives, including work and home life, making important life decisions, their routines for taking care of household chores, leisure time and other activities.”l See footnote e.m The power of the survey to pick up statistically significant differences is limited by the regional sample sizes (approximately 2500 for greater Auckland and 500 to 650 for the other centres).
Just under three quarters of respondents from greater Christchurch have experienced stress at least sometimes in the past 12 months that has had a negative impact on them. There has been a statistically significant downward trend since the earthquakes – 80% in September 2012 to 73% in April 2016.

Canterbury Wellbeing Index 2016 | Mental wellbeing | 10
Figure 5: Proportion of respondents reporting experiencing stress often (sometimes, always or most of the time) (Canterbury Wellbeing Survey)
The WHO-5 index is a self-rated measure of emotional wellbeing, which is scored out of 25, with higher scores indicating better wellbeing.n Respondents are asked to rate the extent to which each of five wellbeing indicators has been present or absent in their lives over the previous two-week period, using a six-point scale ranging from ‘all of the time’ to ‘at no time’.
The five wellbeing indicators are:
• I have felt cheerful and in good spirits
• I have felt calm and relaxed
• I have felt active and vigorous
• I woke up feeling fresh and rested
• My daily life has been filled with things that interest me.
Table 3 shows that the overall mean WHO-5 score for greater Christchurch increased by a small but statistically significant amount between September 2015 and April 2016. A significant increase in mean score was also seen between September 2014 and April 2015.o Those living in Selwyn District have a significantly higher mean than those living in Christchurch City and Waimakariri District.
Those more likely to have WHO-5 scores below the greater Christchurch mean are those living with a health condition or disability and those renting the dwelling they usually live in. Those more likely to have WHO-5 scores above the greater Christchurch mean are those aged 65 to 74 years old and those who have not needed to make an insurance claim on their dwelling.
The WHO-5 has not been used in any other population based surveys of adults in New Zealand, so there is no New Zealand comparison for the findings in Table 3. However, the WHO-5 was used in a representative survey of adults in the UK in 2012, where the mean was 14.65, similar to Christchurch City and Waimakariri District means, and slightly lower than Selwyn District’s mean.27,p
n The WHO-5 was developed for use with individuals in clinical settings but has subsequently been used to measure the emotional wellbeing of groups or populations.o At a 95% confidence level using a two tailed t-test.p Confidence intervals were not available for the UK data, so it is not known whether the Christchurch City and Selwyn District WHO-5 mean scores are statistically significantly different from the UK mean score.
Those more likely to have WHO-5 scores below the greater Christchurch mean are those living with a health condition or disability and those renting the dwelling they usually live in.

Canterbury Wellbeing Index 2016 | Mental wellbeing | 11
Table 3: Trend – WHO-5 raw score mean over time (Mean and margin of error (95% CI level))
TLAApril Sep April Sep April Sep April2013 2013 2014 2014 2015 2015 2016
Greater Christchurch
13.8 (± 0.22) 13.7 (± 0.21) 13.6 (± 0.22) 13.9 (± 0.20) 14.2ü(± 0.21) 14.1 (± 0.21) 14.4ü (± 0.18)
n=2343 n=2398 n=2405 n=2658 n=2453 n=2445 n=2999
Christchurch City
13.6 (± 0.31) 13.5 (± 0.30) 13.3 (± 0.30) 13.7 (± 0.29) 14.0 (± 0.29) 13.9 (± 0.30) 14.3ü (± 0.26)
n=1171 n=1204 n=1219 n=1359 n=1285 n=1178 n=1437
Selwyn District14.6 (± 0.41) 14.9 (± 0.38) 15.1 (± 0.41) 14.9 (± 0.38) 15.0 (± 0.40) 14.7 (± 0.40) 15.3ü (± 0.35)
n=599 n=628 n=610 n=629 n=571 n=626 n=800
Waimakariri District
14.8 (± 0.43) 14.4 (± 0.43) 14.3 (± 0.43) 14.4 (± 0.39) 14.9 (± 0.40) 15.1 (± 0.39) 14.6 (± 0.36)
n=573 n=566 n=576 n=670 n=597 n=641 n=762
Map 1 shows that there are geographic differences in mean WHO-5 scores in greater Christchurch. Survey respondents living in the East had the lowest WHO-5 mean score, which was the only mean score statistically significantly lower than the mean score for all greater Christchurch respondents. It was also statistically significantly lower than all other regions’ mean scores except for the Inner South and North East. Survey respondents living in Selwyn had the highest WHO-5 mean score, which was the only mean score statistically significantly higher than the mean score for all greater Christchurch respondents.
Map 1: Mean WHO-5 score by geographic area, April 2016
Canterbury Wellbeing Index 2016 | Mental wellbeing | 12
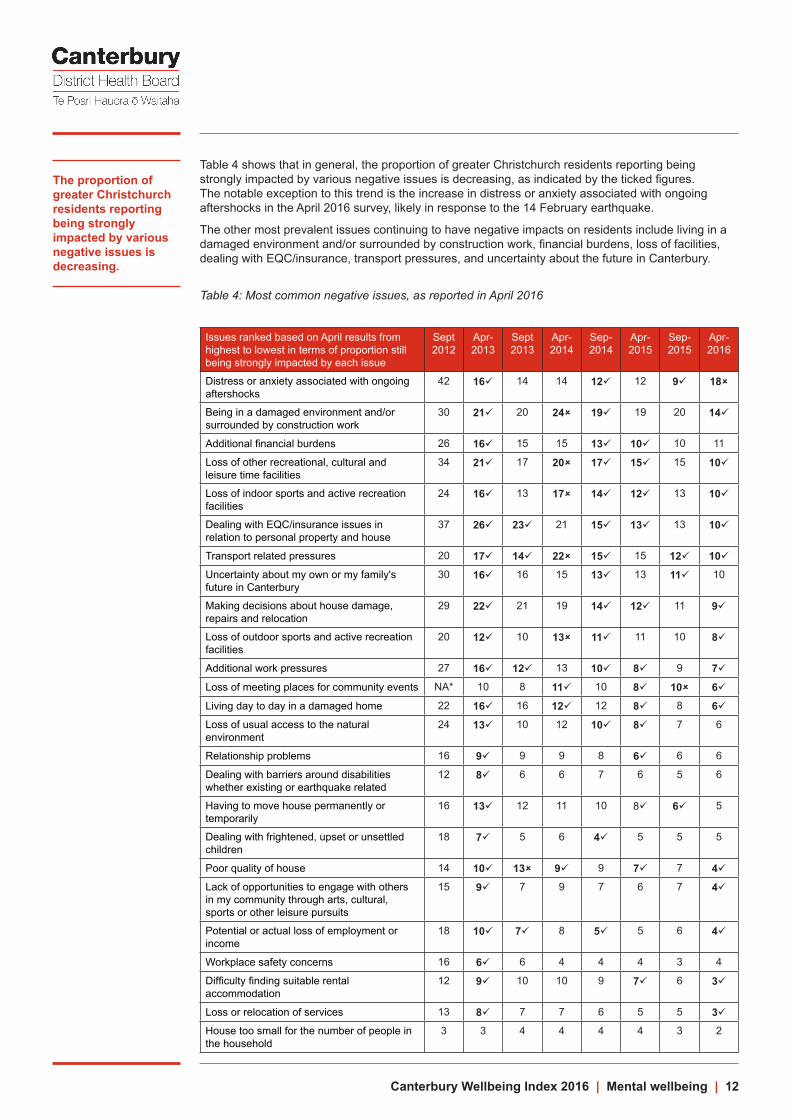
Table 4 shows that in general, the proportion of greater Christchurch residents reporting being strongly impacted by various negative issues is decreasing, as indicated by the ticked figures. The notable exception to this trend is the increase in distress or anxiety associated with ongoing aftershocks in the April 2016 survey, likely in response to the 14 February earthquake.
The other most prevalent issues continuing to have negative impacts on residents include living in a damaged environment and/or surrounded by construction work, financial burdens, loss of facilities, dealing with EQC/insurance, transport pressures, and uncertainty about the future in Canterbury.
Table 4: Most common negative issues, as reported in April 2016
Issues ranked based on April results from highest to lowest in terms of proportion still being strongly impacted by each issue
Sept 2012
Apr-2013
Sept 2013
Apr-2014
Sep-2014
Apr-2015
Sep-2015
Apr-2016
Distress or anxiety associated with ongoing aftershocks
42 16ü 14 14 12ü 12 9ü 18û
Being in a damaged environment and/or surrounded by construction work
30 21ü 20 24û 19ü 19 20 14ü
Additional financial burdens 26 16ü 15 15 13ü 10ü 10 11
Loss of other recreational, cultural and leisure time facilities
34 21ü 17 20û 17ü 15ü 15 10ü
Loss of indoor sports and active recreation facilities
24 16ü 13 17û 14ü 12ü 13 10ü
Dealing with EQC/insurance issues in relation to personal property and house
37 26ü 23ü 21 15ü 13ü 13 10ü
Transport related pressures 20 17ü 14ü 22û 15ü 15 12ü 10üUncertainty about my own or my family's future in Canterbury
30 16ü 16 15 13ü 13 11ü 10
Making decisions about house damage, repairs and relocation
29 22ü 21 19 14ü 12ü 11 9ü
Loss of outdoor sports and active recreation facilities
20 12ü 10 13û 11ü 11 10 8ü
Additional work pressures 27 16ü 12ü 13 10ü 8ü 9 7ü
Loss of meeting places for community events NA* 10 8 11ü 10 8ü 10û 6ü
Living day to day in a damaged home 22 16ü 16 12ü 12 8ü 8 6üLoss of usual access to the natural environment
24 13ü 10 12 10ü 8ü 7 6
Relationship problems 16 9ü 9 9 8 6ü 6 6
Dealing with barriers around disabilities whether existing or earthquake related
12 8ü 6 6 7 6 5 6
Having to move house permanently or temporarily
16 13ü 12 11 10 8ü 6ü 5
Dealing with frightened, upset or unsettled children
18 7ü 5 6 4ü 5 5 5
Poor quality of house 14 10ü 13û 9ü 9 7ü 7 4üLack of opportunities to engage with others in my community through arts, cultural, sports or other leisure pursuits
15 9ü 7 9 7 6 7 4ü
Potential or actual loss of employment or income
18 10ü 7ü 8 5ü 5 6 4ü
Workplace safety concerns 16 6ü 6 4 4 4 3 4
Difficulty finding suitable rental accommodation
12 9ü 10 10 9 7ü 6 3ü
Loss or relocation of services 13 8ü 7 7 6 5 5 3üHouse too small for the number of people in the household
3 3 4 4 4 4 3 2
The proportion of greater Christchurch residents reporting being strongly impacted by various negative issues is decreasing.

Canterbury Wellbeing Index 2016 | Mental wellbeing | 13
As can be seen in Map 2, there are large geographic differences between the impacts of the top four negative issues on people living in different parts of greater Christchurch. In general, a higher proportion of people living in the North East and East have reported being impacted by the top four negative issues, followed by the Inner North, South, and Inner South. In general, fewer people living in the west of greater Christchurch have reported being impacted by the top four negative issues.
Map 2: Impact of most common negative issues by geographic area, April 2016

Canterbury Wellbeing Index 2016 | Mental wellbeing | 14
Access to earthquake support services
The 0800 Canterbury Support Line is a government-funded service providing information about a range of services and supports to callers affected by the earthquakes and subsequent recovery. Figure 6 shows there was a spike in calls to the 0800 Canterbury Support Line immediately after the February 2011 earthquake. A smaller increase in calls in February 2012 may have been due to the anniversary of the 2011 earthquake and the increase in August 2012 may have followed land zoning announcements. Between September 2010 and June 2016, more than 23,000 residents have sought assistance through this service. The small spike in February 2016 is likely to be a result of the Valentine’s Day aftershock. In the year to June 2016, there have been 1,370 calls compared to 1,934 calls for the year to June 2015.
Figure 6: Calls to the 0800 Canterbury Support Line
The Earthquake Support Coordination Service was established to provide information and practical support for those whose homes and lives have been affected by the Canterbury earthquakes.28 Figure 7 shows that between 28 and almost 400 households have enrolled with the service each month since October 2011. The number of active households peaked at 2,511 in September 2012 and has since gradually declined. Overall, 10,468 households have been supported by the service as at April 2016, and of those 806 households remain registered.
Figure 7: Households registered with Earthquake Support Coordination Service

Canterbury Wellbeing Index 2016 | Mental wellbeing | 15
Access to brief intervention counselling in general practice
Brief intervention counselling provides people with mild to moderate mental health issues up to five sessions of free psychological intervention mostly from their general practice team, with the possibility of onward referral to a related community agency.29
Figure 8 shows there has been an increase in the number of people seeking brief intervention counselling services in the CDHB region monthly from July 2011 with the service employing additional staff to meet increased demand following the earthquakes. Attendances peaked at over 1,300 per month in August 2013 which was nearly triple the rate in August 2010 (486 presentations). For the year to December 2015, 993 people attended sessions, which remains around double the pre-earthquake number.
Figure 8: Number of attendances for brief intervention counselling by age
Total number of clients accessing existing CDHB mental health services
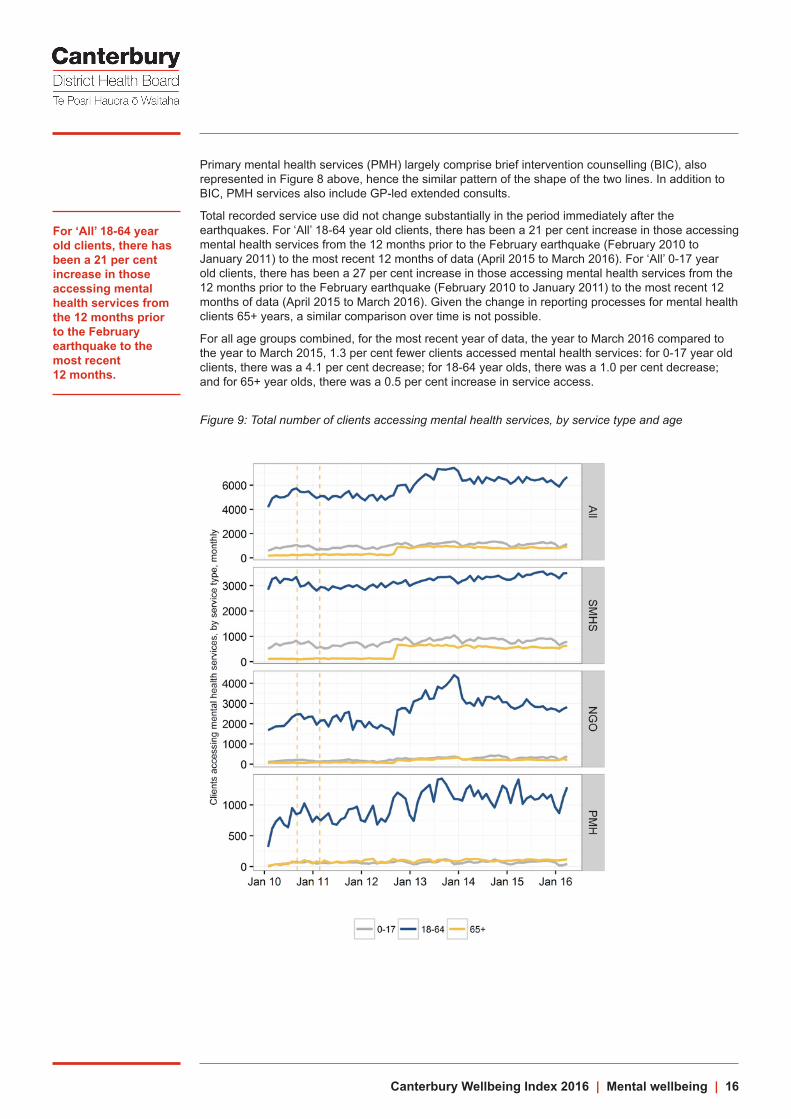
Figure 9 shows the total number of clients accessing mental health services in the CDHB region and provides a breakdown by service type: specialist mental health services (SMHS), non-government organisations (NGOs), and primary mental health (PMH). Many factors influence service use data, including data recording processes, service delivery models, policy and funding, barriers to service access, service capacity, and service demand. Direct comparison between DHBs is difficult, due to the effects of population size and geography on case mix and service delivery. Figure 9 presents the number of times services have been used per month (a service user may be recorded more than one time in each month if they have had more than one service use event in that month), not population rates of service use, so the data is not adjusted for population changes over time.
The most prominent feature of Figure 9 is the large peak in the 18-64 year old NGO data: The number of clients accessing NGO services has increased since January 2010, although the peak seen is largely due to a data collection issue. There was an expansion of services before the data was fully captured, so the peak represents when this service activity was “caught-up” in the system. A gradually increasing line from mid-2012 to early 2014 would more closely reflect the reality of service use.30 This data collection issue for NGO services has caused a corresponding peak in the ‘All’ services 18-64 years line at the top of the figure.
The ‘step’ increase seen in the 65+ specialist mental health services (SMHS) from August to September 2012 is due to a change in reporting process to adequately capture mental health service activity formerly recorded under ‘Older Person’s Health’.30 This ‘step’ increase has caused a corresponding increase in the ‘All’ services 65+ years line.
Canterbury Wellbeing Index 2016 | Mental wellbeing | 16
Primary mental health services (PMH) largely comprise brief intervention counselling (BIC), also represented in Figure 8 above, hence the similar pattern of the shape of the two lines. In addition to BIC, PMH services also include GP-led extended consults.
Total recorded service use did not change substantially in the period immediately after the earthquakes. For ‘All’ 18-64 year old clients, there has been a 21 per cent increase in those accessing mental health services from the 12 months prior to the February earthquake (February 2010 to January 2011) to the most recent 12 months of data (April 2015 to March 2016). For ‘All’ 0-17 year old clients, there has been a 27 per cent increase in those accessing mental health services from the 12 months prior to the February earthquake (February 2010 to January 2011) to the most recent 12 months of data (April 2015 to March 2016). Given the change in reporting processes for mental health clients 65+ years, a similar comparison over time is not possible.
For all age groups combined, for the most recent year of data, the year to March 2016 compared to the year to March 2015, 1.3 per cent fewer clients accessed mental health services: for 0-17 year old clients, there was a 4.1 per cent decrease; for 18-64 year olds, there was a 1.0 per cent decrease; and for 65+ year olds, there was a 0.5 per cent increase in service access.
Figure 9: Total number of clients accessing mental health services, by service type and age
For ‘All’ 18-64 year old clients, there has been a 21 per cent increase in those accessing mental health services from the 12 months prior to the February earthquake to the most recent 12 months.

Canterbury Wellbeing Index 2016 | Mental wellbeing | 17
Health of the Nation Outcome Scales
The Health of the Nation Outcome Scales (HoNOS) are the national clinical outcome collection tool administered by clinicians and mandated by the Ministry of Health to measure a mental health service user’s mental health problems and problems with functioning. The figures in the Canterbury Wellbeing Index use data from one of the five HoNOS family of measures: HoNOS for adults aged 18-64 years.q
HoNOS (18-64 years) includes twelve items:31
1. Overactive, aggressive, disruptive or agitated behaviour
2. Non-accidental self-injury
3. Problem drinking or drug-taking
4. Cognitive problems
5. Physical illness or disability problems
6. Problems associated with hallucinations and delusions
7. Problems with depressed mood
8. Other mental and behavioural problems
9. Problems with relationships
10. Problems with activities of daily living
11. Problems with living conditions
12. Problems with occupations and activities.
A score of 0–4 is assigned to each item according to the severity of symptoms (0 indicating no problem and 4 indicating a severe problem).r A score of 2-4 is clinically significant. A score of 2 represents a mild problem that requires monitoring and may require active treatment or a management plan. A score of 3 or 4 represents a moderate or severe problem that requires monitoring and requires active treatment or a management plan.
The Ministry of Health notes five uses for HoNOS scores.32 The first two use data at an individual user level, and the last three use data at an aggregated level:
• Clients can use their own outcomes data to: reflect on their health, wellbeing, and circumstances; talk to clinicians about their support needs; and inform their recovery plans.
• Clinicians can use outcomes data to: inform therapeutic discussion with clients; support their decision-making in day-to-day practice; monitor change; improve their understanding of client needs; and evaluate the effectiveness of different interventions.
• Service and general managers can use outcomes data to: inform service provision and identify workforce development and community needs.
• Planners and funders can use outcomes data to: assess population needs for mental health services and assist with allocation of resources.
• Policy and mental health strategy developers can use outcomes data to develop policy based on nationally aggregated data.
HoNOS data is collected in specialist community and in-patient settings. This Index uses community ‘outpatient’ data, with the aim of monitoring an indicator of wellbeing for the group of DHB mental health service users still living in the community. It is likely that the wellbeing of this group will be more sensitive to the greater Christchurch recovery than the in-patient group. HoNOS data should be regularly collected on admission to a service, and on discharge. It may also be collected for the purposes of review during a period of contact with a service. This Index only uses admission HoNOS data, with the aim of measuring the severity of symptoms on presentation, rather than after receiving care from a service.
q The other four HoNOS measures are: HoNOSCA for children and adolescents aged 4-17 years; HoNOS65+ for adults aged 65 years and over; HoNOS-LD for adults who have a dual diagnosis, such as mental illness and an intellectual disability; and HoNOS-secure, for adults who are being supported by forensic services.r Items with scores 0 (no problem) or 1 (minor problem) require no formal action and are not clinically significant. Items with scores greater or equal to 2 (mild to severe problems) warrant recording in the clinical file; these scores are clinically significant and may be incorporated into a care plan.
Canterbury Wellbeing Index 2016 | Mental wellbeing | 18
While HoNOS enables the possibility of comparing Canterbury mental health service user data with New Zealand service user data, the Ministry of Health notes two limitations of the HoNOS data. Firstly, it does not require NGO organisations, and some teams, such as alcohol and drug teams, to collect outcomes data. This limitation is common to all DHBs. Secondly, that among those DHB organisations where outcome data collection is mandated, the data is incomplete.
For the HoNOS data represented in the figures in this index (HoNOS (18-64 years) community admission scores), quarterly completeness for the period from 2009 - 2015 ranges from 25.0 per cent to 74.2 per cent for Canterbury DHB, and 16.8 per cent to 31.8 per cent for New Zealand. There are several reasons why achieving 100 per cent completeness of admission data is practically not possible. These reasons are listed in the technical notes at the end of this chapter. The influence that these differences in completeness of data has, both over time and regionally, on the average totals displayed in the figures below, needs to be considered before drawing conclusions about differences over time and between regions.
In general, more complete community admission data may be more likely to capture those people who have briefer contact with mental health services due to less severe symptoms, thus lowering the average total HoNOS scores and decreasing the proportion of clients with severe symptoms. Therefore if the HoNOS collections were more complete nationally, the differences found in the HoNOS (18-64) results in recent years (higher HoNOS totals for Canterbury DHB data since 2012 than for New Zealand) are likely to be even greater. Given that it is not known whether the proportion of clients with admission data captured in HoNOS are representative of the whole population of clients accessing community mental health DHB services, it is possible that factors other than those discussed above are influencing the observed results.
Trends in the HoNOS dataset for clients using community mental health services at admission are monitored using the following indicators:s
• The total average score across all 12 HoNOS items as a high level indicator of symptoms and functioning.
• The index of severity across the first 10 HoNOS items as an indicator of the severity of clients’ conditions.t
• Average scores for each of the 12 HoNOS items.
Figures 10 – 12 generally show increases across the first two measures for the period from 2010 to 2013, and higher scores for the first two measures from 2011 to 2015 in Canterbury DHB community mental health services compared to New Zealand. In contrast, HoNOS (18-64 years) inpatient admission scores (not graphed) show lower average HoNOS totals and severity scores in Canterbury compared to New Zealand each year from 2009 to 2015. It is not expected that inpatient HoNOS totals and severity scores will be susceptible to change due to the earthquakes or recovery, since admission to inpatient services is dependent on clinical thresholds of severity of symptoms.
Figure 10 illustrates that for those with a completed HoNOS on admission to community mental health services, total scores have been higher in Canterbury for the period from 2011 to 2015. Higher HoNOS scores indicate either more symptoms or more severe symptoms or a combination of both.
s Confidence Intervals for these data cannot be calculated because it cannot be known whether those service users with a completed HoNOS collection are a representative sample of all service users. t See technical notes for more detail.

Canterbury Wellbeing Index 2016 | Mental wellbeing | 19
Figure 10: Average total HoNOS score for clients accessing community mental health services, by areau
Figure 11 uses the HoNOS index of severity, which is a measure designed to assess whether severity of symptoms has changed over time for a chosen population. Higher scores represent higher severity of symptoms. The index of severity uses the scores in the first 10 HoNOS items listed above. Of those community DHB service users with a completed admission HoNOS, those in Canterbury have been more likely to exhibit severe symptoms than those in New Zealand overall, since 2010.
u Quarterly completeness of Canterbury DHB data ranges from 25.0 per cent to 74.2 per cent, has increased every year since 2011, averages 41.7 per cent for the period 2009-2015, and was 69.5 per cent in 2015. Quarterly completeness of New Zealand data ranges from 16.8 per cent to 31.8 per cent, averages 25.1 per cent, and was 30.5 per cent in 2015.

Canterbury Wellbeing Index 2016 | Mental wellbeing | 20
Figure 11: Distribution of Index of Severity for clients accessing community health services, by areav
Figure 12 shows the breakdown of the percentage of clients in the clinical range for the 12 items that make up HoNOS. For those community DHB mental health users with completed HoNOS admission data, the items that are contributing to higher severity scores in Canterbury compared to New Zealand are: Overactive, aggressive, disruptive or agitated behaviour; Non-accidental self-injury; Problem drinking or drug-taking; Problems with depressed mood; Problems with relationships; Problems with activities of daily living; Problems with living conditions; and Problems with occupations and activities.
v See above footnote.

Canterbury Wellbeing Index 2016 | Mental wellbeing | 21
Figure 12: Per cent of clients in the clinical range accessing community health services, by item and areaw
w See above footnote.

Canterbury Wellbeing Index 2016 | Mental wellbeing | 22
Dispensing of pharmaceuticals for mental health
These indicators are measured by using the number of anti-depressants and anti-anxiety medication units dispensed. The dispensing of mental health pharmaceuticals is followed as another way of monitoring any possible changes in mental health needs. Several factors may influence these data, including service use and access to primary care and mental health services, and dispensing practices. Compared to nationally, Canterbury DHB has a higher than average rate of dispensing of mental health pharmaceuticals, but that rate is increasing more slowly than nationally. In general, Canterbury DHB is an early adopter of new treatments and has always had higher use of mental health pharmaceuticals.33
Figure 13 shows that overall the number of anti-depressants dispensed has gradually increased in Canterbury DHB since 2008. Anti-depressants are used to treat a range of mental health issues. For the most recent data, for the year to February 2016, the number of anti-depressants dispensed in Canterbury DHB increased by 3.6 per cent compared to the year to February 2015. This rate of increase has slowed compared with the pre-earthquake rate of increase.
A study of anti-depressant dispensing in Canterbury compared to the rest of New Zealand for the period of July 2007 to January 2014 found no significant change in Canterbury DHB dispensing following the earthquakes.34 It also found that there was a national trend for increased dispensing, but this was less prominent in Canterbury DHB.
Figure 13: Number of anti-depressant units dispensed, Canterbury DHB

Canterbury Wellbeing Index 2016 | Mental wellbeing | 23
Figure 14 shows that the number of anti-anxiety medications (anxiolytics, sedatives and hypnotics) dispensed in the Canterbury DHB region increased immediately after the February 2011 earthquake. Levels peaked in March 2011 when 363,246 units of anxiolytics and 419,623 units of sedatives and hypnotics were dispensed. This represented an increase of 33 and 32 per cent respectively compared with a year earlier (March 2010). These medications are usually prescribed in response to acute stress and sleep difficulties. Since then the number of units dispensed has generally been decreasing or has been steady, in contrast to an increasing trend before the earthquakes. For the year to February 2016, the number of anti-anxiety medications dispensed in Canterbury DHB increased by only 0.02 per cent compared to the year to February 2015.
The same study referred to above also analysed dispensing data for anti-anxiety medications for Canterbury DHB and the rest of New Zealand and found that there was a short-term increase in dispensing in the Canterbury DHB catchment area after the February 2011 earthquake, but this increase was not sustained.34
Figure 14: Number of anti-anxiety units dispensed, Canterbury DHB

Canterbury Wellbeing Index 2016 | Mental wellbeing | 24
Find out moreFind out more about the Canterbury Wellbeing Index: www.cph.co.nz/your-health/canterbury-wellbeing-index/
Find out more about the All Right? Campaign on their website http://allright.org.nz/.
Ring the Canterbury Support Line on: 0800 777 846
Be connected to an Earthquake Support Coordinator: 0800 673 227
Be connected to a Kaitoko Whānau Earthquake Support Worker on: 0800 KAI TAHU or 0800 524 8248
Technical notes
Canterbury Wellbeing Survey (formerly the CERA Wellbeing Survey)
Data source: Canterbury Earthquake Recovery Authority, Canterbury District Health Board
Data frequency: Six-monthly September 2012, April 2013, September 2013, April 2014, September 2014, April 2015, September 2015 (all CERA) and April 2016 (CDHB)
Data complete until: April 2016
Notes: The April 2016 Canterbury Wellbeing Survey (formerly the CERA Wellbeing Survey) is the eighth survey in the series providing information about the residents of greater Christchurch. Respondents were randomly selected from the electoral roll. The survey was delivered online and by hard copy from 30 March to 18 May 2016.The response rate was 41 per cent. Weighting was used to correct imbalances in sample representation. The survey was originally developed in partnership with Christchurch City Council, Waimakariri District Council, Selwyn District Council, the Canterbury District Health Board, Ngāi Tahu and the Natural Hazards Research Platform. For results from the surveys, see: www.cph.co.nz/your-health/wellbeing-survey/
New Zealand Quality of Life Survey
Data source: The New Zealand Quality of Life Survey
Data frequency: 2006, 2008, 2010, 2012, and 2014
Data complete until: October 2014
Notes: The New Zealand Quality of Life Survey is a national survey run every two years. Up until 2010 the New Zealand Quality of Life Survey used computer assisted telephone interviewing (CATI); it relied upon telematching from the electoral roll, which excluded 60% of the population; it included ages 15-17 in the survey, by using an in-house database of named individuals who had indicated they were willing to participate in surveys in the future; and it included the following city councils: Auckland, Manukau, North Shore, Waitakere, Wellington, Christchurch, and the following territorial authorities: Rodney, Hamilton, Tauranga, Hutt, Porirua, and Dunedin. From 2012 onwards, the New Zealand Quality of Life Survey used Sequential Mixed Methodology (SMM), which uses internet and hard copy questionnaires and does not exclude 60% of the population; it only included 18 years and older, and it included the newly amalgamated Auckland City, Hutt City, Porirua, Wellington, Christchurch and Dunedin. Hamilton and Tauranga withdrew.
The 0800 Canterbury Support Line
Data source: Family and Community Services Southern, Ministry of Social Development
Data frequency: Monthly
Data complete until: May 2016
Notes: Calls are logged as low, medium or high priority by staff. Calls are also categorised by reason for call.

Canterbury Wellbeing Index 2016 | Mental wellbeing | 25
Earthquake Support Coordination Service
Data source: Canterbury Earthquake Temporary Accommodation Service
Data frequency: Monthly
Data complete until: April 2016
Notes: Data from February 2011 to September 2011 were not available for graphing as they were previously collated monthly.
Brief intervention counselling services
Data source: Canterbury District Health Board
Data frequency: Monthly
Data complete until: December 2015
Notes: The BIC service provides up to five sessions of free psychological intervention for clients and, in some cases, also refers clients to other community services for ongoing support, such as Presbyterian Support and the Stop Trust. Clients are referred to the BIC service through their general practice teams.
Mental health referrals to pre-existing services
Data source: Canterbury District Health Board
Data frequency: Monthly
Data complete until: March 2016
Notes: The data represent all referrals received from all sources, and referrals seen. Referrals seen are those referrals that proceeded to be seen for assessment/treatment (one day or more) for one or more contacts and include mental health earthquake-related services.
Note: there have been some data integrity issues that have affected capturing of NGO data. There was an expansion of services before the NGO data was fully captured, and a subsequent “catch-up” of the data from this expansion of services.
Health of the nation outcomes scales
Data source: Te Pou
Data frequency: Yearly
Data complete until: 2015
Notes: Data was sourced from Ministry of Health Programme for the Integration of Mental Health Data (PRIMHD).
Overall caveats: Only service users in mental health and alcohol and drug services who have HoNOS collected are included i.e. the information provided only applies to service users who have an outcome collection. Canterbury DHB mix of service users can be different to that of New Zealand.
Average Total HoNOS Score: Total score is the sum of the valid items in HoNOS (12 items in total). It is an aggregated ordinal scale, not a continuum scale. A HoNOS score of 4 is not twice as severe as a 2, and 2 is not twice as severe as 1. Summing the 12 HoNOS items may not adequately capture the clinical severity in situations where a client has severe symptoms on a few items and no problems on the rest.
Index of severity: The index of severity is a measure of outcome in which different levels of acuity are defined by the items in the clinical range for the first 10 HoNOS items. Index of severity provides a measure of whether severity is increasing, declining or staying the same for a chosen individual or population. The data is not case mix adjusted, so care needs to be taken when making direct comparisons between different services.

Canterbury Wellbeing Index 2016 | Mental wellbeing | 26
Index of severity categories:
• The sub – clinical category has no HoNOS scores greater than two (mild problem)
• The mild category has all scores less than three (moderate problem) and at least one item greater than one (minor problem)
• The moderate category has only one item which is a moderate or severe problem
• The severe category has at least two items which are a moderate or severe problem
More information on the meaning of the variables can be found here: www.tepou.co.nz/resources/mental-health-outcomes-information-collection-protocol-honos-family-version-21/93
More information on the HoNOS tool can be found here: www.tepou.co.nz/outcomes-and-information/honos-e-books/131
PRIMHD outcome compliance limitations: Measuring compliance is not a simple process. Data for PRIMHD is based on a referral, where outcome data is based on an episode, or episodes, of care. An episode of care can be made up of multiple referrals, or it could be split by an inpatient episode of care, with a community episode of care on either side. Below lists some of the limitations of PRIMHD outcome compliance.
• The HoNOS family of measures is only required for mental health secondary DHB services. It requires a comprehensive assessment. Community compliance is affected by crisis teams doing triage or brief assessment type activity which is not a comprehensive assessment.
• Overall compliance measures that a service user has at least one collection at any point in the period. It can be an assessment only, admission, review or discharge collection. This does not necessarily mean the collection is done at the correct point of time.
• Each DHB uses a different IT system, this results in data being collected differently. It means that for admission and discharge compliance some DHBs show lower compliance because their system makes fitting the collection rules difficult. They may collect the admission and discharge information but it will not fit within the specified timeframes required.
• DHBs have different ways of configuring their services. For example it is possible to have a team type which is a community mental health service but who also have drug and alcohol services integrated. Drug and Alcohol service users are not required to collect HoNOS therefore this will affect the compliance.
• Admission and discharge compliance is only measured when overlapping referrals end. If a referral is kept open in the community, while in an inpatient stay, then it is not possible to measure if the community discharge and subsequent admission is carried out.
Age grouping 4 to 17 years, 18 to 64 years and 65 years and over generally align with HoNOSCA, HoNOS and HoNOS65+. However, it does not mean that they are the only outcome measures used and/or collected. For example a service user aged between 4 to 17 years could have a HoNOS collection, likewise, a service user aged 18 to 64 years could have a HoNOSCA collection. Also note, if the service user is in a forensic service then a HoNOS secure collection could occur; in an intellectual disability dual diagnosis team a HoNOS-LD collection could occur.
Mental health pharmaceuticals
Data source: Pharms Data Mart via Canterbury District Health Board
Data frequency: Monthly
Data complete until: February 2016
Notes: The data presented are for units within prescriptions that are dispensed. This does not measure the number of people that are actually taking prescribed medications, rather the volume of medication. Further, some people do not fill prescriptions due to cost (5.1 per cent in 2014/15 in the Canterbury DHB region – according to the New Zealand Health Survey) and these people may be disproportionately represented in those prescribed mental health pharmaceuticals.
Paxam (Clonazepam) is a drug primarily used to treat epilepsy. This has changed therapeutic groups and now is classified as an anxiolytic.

Canterbury Wellbeing Index 2016 | Mental wellbeing | 27
References1. UK Government. (2010). Confident communities, brighter futures: a framework for developing
wellbeing. Department of Health and New Horizons.
2. Wells, J., Oakley Browne, M., Scott, K. et al. (2006). Prevalence, interference with life and severity of 12 month DSM-IV disorders in Te Rau Hinengaro: New Zealand Mental Health Survey. Australian and New Zealand Journal of Psychiatry 40: 845–54.
3. UK Government. (2010). Confident communities, brighter futures: a framework for developing wellbeing. Department of Health and New Horizons.
4. Bidwell, S. (2011). Long term planning for recovery after disasters: ensuring health in all policies (HiAP). Community and Public Health for Healthy Christchurch, pp 4–5.
5. Adapted from Van Ommeren, M. (2006). Inter-Agency Standing Committee (IASC) guidance on mental health and psychological support in emergency settings. Paper presented at Public Health Pre-deployment Training, 28 November 2006: Chavannes de Bogis, Switzerland.
6. Bidwell, S. (2011). Long term planning for recovery after disasters: ensuring health in all policies (HiAP). Community and Public Health for Healthy Christchurch. Version 1. Galea, S., Nandi, A. and Vlahov, D. (2005). The epidemiology of post-traumatic stress disorder after disasters. Epidemiologic Reviews 27: 78–91.
7. Galea, S., Nandi, A. and Vlahov, D. (2005). The epidemiology of post-traumatic stress disorder after disasters. Epidemiologic Reviews 27: 78–91.
8. Lock, S., Rubin, G.L., Murray, V. et al. (2012). Secondary stressors and extreme events and disasters: a systematic review of primary research from 2010-2011. PLoS Current. doi: 10.1371/currents.dis.a9b76fed1b2dd5c5bfcfc13c87a2f24f
9. Gluckman, P. (2011). The psychological consequences of the Canterbury earthquakes. Retrieved from: www.pmcsa.org.nz/wp-content/uploads/Christchurch-Earthquake-Briefing-Psychosocial-Effects-10May11.pdf
10. Chathapuram S. Ramanathan, Subhabrata Dutta. (2013). Governance, Development, and Social Work, published by Routledge Publishers, 17 September 2013 (Taylor and Francis Group) London, UK. p. 172.
11. Department of Health. (2009). NHS emergency planning guidance: planning for the psychosocial and mental health care of people affected by major incidents and disasters: Interim national strategic guidance. London: Department of Health.
12. Lock, S., Rubin, G.L., Murray, V., et al. (2012). Secondary stressors and extreme events and disasters: a systematic review of primary research from 2010-2011. PLoS Current. doi: 10.1371/currents.dis.a9b76fed1b2dd5c5bfcfc13c87a2f24f
13. Fothergill, A., & Peek, L. A. (2004). Poverty and disasters in the United States: A review of recent sociological findings. Natural Hazards, 32(1), 89-110.
14. Davidson, T. M., Price, M., McCauley, J. L., & Ruggiero, K. J. (2013). Disaster impact across cultural groups: Comparison of Whites, African Americans, and Latinos. American Journal of Community Psychology, 52(1-2), 97-105.
15. Lock, S., Rubin, G.L., Murray, V. et al. (2012). Secondary stressors and extreme events and disasters: a systematic review of primary research from 2010-2011. PLoS Current. doi: 10.1371/currents.dis.a9b76fed1b2dd5c5bfcfc13c87a2f24f
16. Geonet. (2012). Aftershocks. Retrieved from: www.geonet.org.nz/canterbury-quakes/aftershocks
17. Information from Canterbury Earthquake Recovery Authority.
18. Spittlehouse, J. K., Joyce, P. R., Vierck, E., Schluter, P. J., & Pearson, J. F. (2014). Ongoing adverse mental health impact of the earthquake sequence in Christchurch, New Zealand. Australian and New Zealand Journal of Psychiatry, 48(8), 756-763.
19. Fergusson, D. M., Horwood, L. J., Boden, J. M., & Mulder, R. T. (2014). Impact of a major disaster on the mental health of a well-studied cohort.JAMA psychiatry, 71(9), 1025-1031.

Canterbury Wellbeing Index 2016 | Mental wellbeing | 28
20. Thomson, J., Seers, K., Frampton, C., Hider, P., & Moor, S. (2016). Sequential population study of the impact of earthquakes on the emotional and behavioural well‐being of 4‐year‐olds in Canterbury, New Zealand Journal of Paediatrics and Child Health, 52(1), 18-24.
21. Liberty K, Tarren-Sweeney M, Macfarlane S, Basu A, Reid J. (2016). Behavior Problems and Post-traumatic Stress Symptoms in Children Beginning School: A Comparison of Pre- and Post-Earthquake Groups. PLOS Currents Disasters. Jun 22. Edition 1. doi: 10.1371/currents.dis.2821c82fbc27d0c2aa9e00cff532b402.
22. CERA Wellbeing Survey. (2012). Retrieved from: http://www.cph.co.nz/wp-content/uploads/cerawellbeingsurvey2012.pdf
23. Joseph, F. (2011). What doesn’t kill Us: the new psychology of posttraumatic growth. Basic Books.
24. Joubert, N., & Raeburn, J. (1998). Mental health promotion: people, power and passion. International Journal of Mental Health Promotion, 15-22.
25. CERA on behalf of partner agencies within the Psychosocial Committee. (2015). The Business Case for a Canterbury-Wide Parent Support Package. Unpublished.
26. See www.qualityoflifeproject.govt.nz/survey.htm
27. Topp, C. W., Østergaard, S. D., Søndergaard, S., & Bech, P. (2015). The WHO-5 Well-Being Index: a systematic review of the literature. Psychotherapy and Psychosomatics, 84(3), 167-176.
28. Retrieved from: www.familyservices.govt.nz
29. Canterbury District Health Board. (2016). Retrieved from: www.cdhb.health.nz
30. Personal communication, Planning and Funding, Canterbury DHB.
31. Te Pou. (2016). HoNOS e-books. Retrieved from: http://www.tepou.co.nz/outcomes-and-information/honos-e-books/131
32. Ministry of Health. (2012). Mental Health Outcomes Factsheet 2009/10. Wellington: Ministry of Health.
33. Canterbury District Health Board. (2016). Personal communication.
34. Beaglehole, B., Bell, C., Frampton, C., Hamilton, G., & McKean, A. (2015). The impact of the Canterbury earthquakes on prescribing for mental health. Australian and New Zealand Journal of Psychiatry, 49(8), 742-750.