teacher wellbeing index 2019
TRANSCRIPT

TEACHER WELLBEING INDEX 2019
The charity for everyone working in education

Education Support is the UK’s only charity providing mental health and wellbeing support services to all education staff and organisations.

3
Foreword
It is time to address the current high levels of unproductive stress experienced by those working in education.This is important because they operate in an unpredictable environment where not everyone chooses, or wants, to be there.
They manage diverse learner needs; understanding the intricacies of child development.
They promote inclusion and collaboration, alongside assessment and feedback.
We also expect them to be creative, caring, considered and passionate; ensuring that every pupil and student feels understood and valued.
They participate in thousands of interpersonal contacts in the classroom every week.
And it is this interaction that inspires, develops and transforms the lives of children and young people; and it is why teaching is perhaps the most important, fulfilling and rewarding role that exists in society.
Good teaching requires the highest levels of physical, social and emotional energy. That is why the mental health and wellbeing of this workforce is so critical; and why the trends we are seeing in the Teacher Wellbeing Index present such a concerning picture.
For all that our understanding of mental health and emotional development has grown over recent decades, we do not yet widely and openly acknowledge the extent of the emotional work inherent in
education. The disproportionately high levels of stress reported by the workforce impede their ability to effectively nurture children and young people, including an increasing number who are vulnerable.
The interaction in the classroom of a stressed, overwhelmed, tired and unsupported teacher will be different to that of a supported teacher with a strong sense of professional autonomy, self-efficacy and balance between personal and professional life.
In short bursts, stress can be a good thing. It can help us to prepare and focus for challenging or urgent situations. However, when the stress response becomes increasingly frequent and prolonged it negatively impacts on attention, memory, and the way that we deal with emotions.
It is at this point that stress can contribute to mental health issues – something experienced by a third of staff surveyed in this year’s Teacher Wellbeing Index. This is the highest figure recorded since the Index began.
At a time of mounting pressure on the education workforce, our charity has witnessed unprecedented levels of demand for our services. In the past 12 months alone, we directly supported a record 14,081 people, with the severity of the cases managed significantly higher than at any point in this century so far.

4
Teachers tend toward the stoic, and usually wait until a crisis point before accessing support. This is simply not sustainable, let alone desirable.
Encouragingly, knowledge into the causes and impact of teacher wellbeing has grown steadily in recent years. We are proud to be working closely with a range of academics and other stakeholders to help accelerate this process.
In addition, we remain committed to contributing our own research and insight, including this annual Teacher Wellbeing Index publication, conducted in partnership with YouGov.
This improved evidence base has coincided with an appetite and energy from across the sector, and among policymakers, to address the issue.
We must harness this current enthusiasm to introduce measures that deliver meaningful and sustainable change, creating the systems, policies, conditions and support to allow teachers and school staff to flourish.
Teaching professionals are among the most valuable assets in our society and ought to feel respected, supported and resilient.
Across the whole lifecycle of an education career, it is time to take meaningful action to look after the people who look after our children and young people.
Sinéad Mc Brearty CEO at Education Support

Table of Contents
Executive Summary ...........................................62019 Findings in Numbers ................................... 6
Index Comparison of 2017-2019 .......................... 10
Regional comparisons of key indicators - 2019 ..... 18
About the report ..............................................20
SECTION 1: Working in the Education Sector Building a picture of staffing ......................... 22
SECTION 2: The mental health and wellbeing of education professionals – the individual ........................ 32
SECTION 3: The impact of an individual’s mental health and wellbeing on others studying and working in the education sector ...................................50
SECTION 4: The mental health and wellbeing support and guidance available to staff working in the education sector ..............................................58
SECTION 5: Using the Warwick-Edinburgh Mental Wellbeing Scale to measure mental health in the education sector ........................................ 70
Conclusions ...................................................... 76
Recommendations ........................................... 77
Acknowledgements ......................................... 77
References ........................................................ 78
Sample profile ..................................................80
Page Index ........................................................82
5

6
Executive Summary
2019 Findings in Numbers
Building a picture of what it means to work in the education sector
The Teacher Wellbeing Index 2019, this publication, uses a series of indicators to benchmark educational professionals’ mental health and wellbeing, which also affords the ability to analyse trends over time. It includes responses received from education professionals working in all job roles – including a) Teachers (Qualified, Newly-Qualified, Trainees, Teaching Assistants and Supply Teachers) and those working with Special Education Needs; b) Senior Teachers with specific roles (Head of Department, Head of Year, Assistant Head, Deputy Head, Head Teachers); and c) staff working in non-teaching roles (such as School Business Managers). Where the findings differ between different job roles, such as Senior Leaders, Teachers and other roles, these have been noted in this report.
72%
74%
33%Of all educational professionals described themselves as stressed (84% of senior leaders)Section 1e, Page 26)
Of education professionals considered the inability to switch off and relax to be the major contributing factor to a negative work/life balanceSection 1d, Page 25
Of school teachers (68% of senior leaders) worked more than 51 hours a week on average. Working long hours and stress appear to be closely linkedSection 1c, Page 24

7
EXECUTIVE SUMMARY
The mental health and wellbeing of education professionals – the individual
34%Of all education professionals have experienced a mental health issue in the past academic yearSection 2b, Page 36
57%More than half of all education professionals have considered leaving the sector over the past two years due to pressures on their health and wellbeingSection 2h, Page 45
49%Of all education professionals considered their organisational culture had a negative effect on their mental health and wellbeingSection 2g, Page 44
51%Of school teachers attributed work symptoms to pupil/student behavioural issuesSection 2c, Page 4771%
Of education professionals cited workload as the main reason for considering leaving their jobsSection 2h, Page 47
78%
46% and 35%
Of all education professionals have experienced behavioural, psychological or physical symptoms due to their workSection 2b, Page 37
Of those who experienced symptoms
Thought they could be signs of anxiety or depression respectively – both considerably higher than nationally reported. More than 50% of those showing such signs were formally diagnosed by their General Practitioner (GP)Section 2a, Page 34

8
EXECUTIVE SUMMARY
The impact of an individual’s mental health and wellbeing on others studying and working in the education sector
41%50%Of education professionals with mental health symptoms were absent for a month or more over the academic yearSection 3a, Page 50
Of senior leaders believed that having time off work due to mental health symptoms would have a negative impact on their pupils’/students’ studiesSection 3b, Page 52
32%Of education professionals (40% of senior leaders) believed that taking time off work due to mental health symptoms would have a negative effect on team moraleSection 3c, Page 53
49%Of education professionals felt compelled to come to work all of the time when they were unwell (known as presenteeism)Section 3d, Page 54
1m+

9
EXECUTIVE SUMMARY
The mental health and wellbeing support and guidance available to staff working in the education sector
Using the Warwick-Edinburgh Mental Wellbeing Scale to measure mental health in the education sector
44.7WEMWBS score for all education professionals. (Note: Regional comparisons can be found in the key indicators’ section). Section 5, Page 72
60%Of education professionals would not feel confident in disclosing unmanageable stress/mental health issues to their employerSection 4b, Page 60
69%Of education professionals considered they did not have enough guidance about mental health and wellbeing at workSection 4c, Page 61
39%Of education professionals would not speak to anyone at work about mental health issues because they felt it would negatively affect people’s perceptions of themSection 4a, Page 59
43%Of education professionals believed that their institutions did not properly support employees who experienced mental health and wellbeing problemsSection 4d, Page 62
26%Of education professionals (31% of senior leaders) considered there was a stigma (feeling of shame) which prevented them from talking about mental health problems at workSection 4a, Page 59
27%Of education professionals had access to Employee Assistance Counselling Services and also to Unions they could talk to for mental health support at workSection 4e, Page 63
54%Of educational institutions did not regularly survey their staff to establish levels of employee wellbeingSection 4h, Page 68

10
Index Comparison of 2017-2019
This summary allows the reader to compare possible differences in mental health and wellbeing statistics across the years. A traffic-light spot system indicates any changes found, and an arrow next to the spot indicates whether this is positive or negative change. The percentage change is shown next to the category, and a summary descriptive term included for clarity.
KEY
Red light indicates a change of (+/- 10% and over) = Summarised as either ‘getting better’ or ‘getting worse’
Amber light indicates a change of (+/- 5-9%) = Summarised as either ‘getting better’ or ‘getting worse’
Green light indicates a change of (+/- 0-4%) = Summarised as ‘similar findings’
Note: Many of the categories of answer below included the option for education professionals to say they “don’t know”. These have generally been excluded from this Index comparison.
Working in the education sector – a picture of staffing
2017 2018 2019 2019 Summary
Work/life balance – Factors which contributed a great deal or somewhat to a negative work-life balance
Inability to switch off and relax Similar findings
Working long hours on weekdays (- 5%) ↓ Getting better
Not finding time to be with my family/friends Similar findings
Working over the weekends (- 7%) ↓ Getting better
Working during holidays Similar findings
Family commitments preventing me from doing a good job at work
Similar findings
Levels of stress working in the education sector (+ 5%) ↑ Getting worse
Levels of resilience working in the education sector New n/a
How education professionals coped with workplace stress or anxietyFood/eating Similar findings
Alcohol Similar findings
Unnecessary spending Similar findings
Drugs Similar findings
Gambling Similar findings
Other Similar findings
None of these Similar findings
EXECUTIVE SUMMARY

11
The mental health and wellbeing of education professionals – the individual
2017 2018 2019 2019 Summary
The symptoms experienced and the signs in the last year (NB a reflective question asked in 2019 for perceptions relating to both 2019 and 2018)
Insomnia/difficulty sleeping (+ 14%) ↑ Getting worse
Irritability/mood swings (+ 13%) ↑ Getting worse
Tearfulness (+ 15%) ↑ Getting worse
Over-eating (+ 10%) ↑ Getting worse
Forgetfulness (+ 13%) ↑ Getting worse
Difficulty concentrating (+ 15%) ↑ Getting worse
Muscle tension (+ 8%) ↑ Getting worse
Recurring headaches/migraines (+ 6%) ↑ Getting worse
Dizziness (+ 12%) ↑ Getting worse
Changes in appetite (+ 8%) ↑ Getting worse
Panic attacks Similar findings
Under-eating Similar findings
High blood pressure Similar findings
None of these (- 5%) ↓ Getting better
Symptoms experienced linked to possible signs of mental health issues – Self-defined or suggested by someone else
Anxiety Similar findings
Depression ↑ Similar findings
Exhaustion Similar findings
Post-traumatic stress disorder (PTSD) Similar findings
Obsessive compulsive disorder (OCD) Similar findings
Eating disorder (including Anorexia, Bulimia, Binge Eating Disorders)
Similar findings
Personality disorder Similar findings
Bipolar disorder Similar findings
Schizophrenia/psychosis Similar findings
None of these ↓ Similar findings
Formal diagnosis by a General Practitioner (GP) following mental health signs displayed (NB: highest four signs only)
Anxiety ↑ Similar findings
Depression (+ 6% diagnosis) ↑ Getting worse
Exhaustion Similar findings
Acute Stress Similar findings
EXECUTIVE SUMMARY

12
Education professionals experiencing mental health issues in the last yearYes Similar findings
No Similar findings
Prefer not to say Similar findings
Mental health issues experienced by education professionals due to work where work was a contributing factor
Behavioural (eg changes to appetite, irritability, procrastination, mood swings) Similar findings
Physical symptoms (eg raised blood pressure, muscletension, sweating, dizziness, headaches or migraines) Similar findings
Psychological symptoms (eg depression, anxiety, panic attacks) Similar findings
Work issues that symptoms were related to
Excessive workload ↓ Similar findings
Work/life balance ↓ Similar findings
Pupils'/students' behaviour ↑ Similar findings
Low income (- 8%) ↓ Getting better
Unreasonable demands from manager ↓ Similar findings
Rapid pace of change (eg National Curriculum) ↓ Similar findings
Problems with pupils'/students' parents ↑ Similar findings
Bullying by colleagues Similar findings
Redundancy/restructure Similar findings
Lack of opportunities to work independently Similar findings
Lack of trust from managers (+ 6%) ↑ Getting worse
Discrimination Similar findings
Retirement Similar findings
Mental health issues experienced by education professionals due to personal reasons Family issues ↓ Similar findings
Financial worries ↓ Similar findings
Health concerns ↓ Similar findings
Bereavement Similar findings
Trauma ↓ Similar findings
Housing problems Similar findings
Problems with neighbours Similar findings
None of these (- 5%) ↑ ↓ Getting better
Sources of support accessed by those who used substances or behaviours to cope with workplace stress and/or anxiety (NB only those with 10%+ responses are shown)
Family/friends ↑ Similar findings
Partner/spouse Similar findings
GP/NHS/Health professionals Similar findings
EXECUTIVE SUMMARY

13
Peers/colleagues Similar findings
None of these Similar findings
Employer/line manager/senior staff member at work ↑ Similar findings
Websites/a general internet search Similar findings
Counsellor/psychiatrist/psychologist Similar findings
A union Similar findings
Ways in which mental health problems experienced at work were alleviatedPhysical exercise ↓ Similar findings
Meditation/mindfulness Similar findings
Alcohol Similar findings
Therapy/counselling Similar findings
I didn’t try to alleviate/solve them Similar findings
Self-medication Similar findings
Other Similar findings
Drugs Similar findings
How organisational culture related to education professionals’ mental health and wellbeing
Positive effect New n/a
Negative effect New n/a
No effect New n/a
Education professionals who had considered leaving the profession due to health and wellbeing issues in the last two years
Volume of workload ↓ Similar findings
Seeking better work/life balance (- 4%) ↓ ↓ Getting better
Unreasonable demands from managers (- 5%) ↓ Getting better
Pupil/student behaviour ↑ Similar findings
Mental health concerns Similar findings
Seeking higher pay (- 4%) ↑ ↓ Getting better
Rapid pace of organisational change (- 5%) ↓ ↓ Getting better
Physical health concerns Similar findings
Retiring from profession/sector Similar findings
Target-driven culture New n/a
Lack of resources (staff and general) New n/a
Unnecessary paperwork/data gathering New n/a
Not feeling valued New n/a
Other Similar findings
EXECUTIVE SUMMARY

The impact of an individual’s mental health and wellbeing on others studying and working in the education sector
2017 2018 2019 2019 Summary
Time taken off workA day here and there (- 4%) ↑ ↓ Getting better
More than a week in total over the academic year Similar findings
More than a month in total over the academic year Similar findings
Signed off for up to six months Similar findings
Signed off for over six months Similar findings
Impact on pupils/studentsNo impact ↓ Similar findings
Negative impact on their studies Similar findings
Negative impact on their results Similar findings
Negative impact on their own mental health Similar findings
Positive impact on their studies Similar findings
Positive impact on their results Similar findings
Positive impact on their own mental health Similar findings
Impact on colleagues No impact Similar findings
Negative impact on our working relationship(s) Similar findings
Negative impact on team morale (+ 17%) ↑ Getting worse
Negative impact on their own performance Similar findings
Positive impact on our working relationship(s) Similar findings
Positive impact on team morale Similar findings
Positive impact on their own performance Similar findings
Impact of presenteeismFeeling compelled to come into work when unwell – yes (always, most or some of the time) New n/a
Feeling compelled to come into work when unwell – no/never New n/a
Other impactMy personal relationships suffered Similar findings
My work performance suffered (+ 5%) ↑ Getting worse
I had to take time off work Similar findings
My work relationships suffered Similar findings
I felt suicidal Similar findings
I had to leave my job Similar findings
My personal relationships broke down Similar findings
None of these Similar findings
14
EXECUTIVE SUMMARY

15
The mental health and wellbeing support and guidance available to staff working in the education sector
2017 2018 2019 2019 Summary
Who education professionals would speak to first at work about mental healthSomebody outside of work Similar findings
I did not speak to anybody about it Similar findings
Colleague Similar findings
Line Manager Similar findings
Human Resources/central office Similar findings
Employee Assistance Programme Similar findings
Other Similar findings
Why educational professionals did not speak to anyone at workThey wouldn’t be supportive (- 5%) ↑ ↓ Getting better
They would see it as a sign of weakness (- 7%) ↓ Getting better
I prefer to seek support from people outside of work (+7%) ↓ ↑ Getting better1
There is a stigma (eg a feeling of shame) which stops me from talking to anyone at work New n/a
I would be worried about losing my job Similar findings
People at work have been the cause of my difficulties in the past (+ 4%) ↑ Getting worse
No-one talks about their problems at work (- 10%) ↓ Similar findings
It would negatively affect their perception of me Similar findings
Other Similar findings
Confidence in sharing mental health issues at workConfident Similar findings
Not very confident (- 6%) ↓ Getting better
Education professionals who spoke to someone at work or outside work and how this helpedIt gave me perspective and helped me realise I am not alone (+ 7%) ↓ ↑ Getting better
It restored my confidence in my abilities Similar findings
It equipped me with practice advice Similar findings
It enabled me to seek professional support Similar findings
I don’t think it helped Similar findings
I gained permission to seek help/it removed the stigma Similar findings
Other Similar findings
Mental health and wellbeing guidance available at workSufficient guidance (+ 5%) ↑ Getting better
Insufficient guidance (- 5%) ↓ Getting better
1 Summarised as ‘getting better’, as interpreted as an increase noted in education professionals seeking support
EXECUTIVE SUMMARY

16
Levels of support received at work by those who experienced mental health and wellbeing problems
Well supported (+ 7%) ↑ Getting better
Not very well supported (- 10%) (NB difference due to corresponding change in ‘don’t know’ category answer) ↑ ↓ Getting better
The help available at workUnion people to talk to Similar findings
Employee assistance counselling services (+ 6%) ↑ Getting better
Encouragement to speak up when struggling (+ 5%) ↑ Getting better
HR staff to talk to Similar findings
Exercise classes, groups or programmes (+ 5%) ↑ Getting better
Mindfulness classes or programmes Similar findings
Training on common mental health conditions Similar findings
Mentoring/co-worker support schemes Similar findings
Health-related support staff to talk to Similar findings
Mental health first aid training (+ 6%) ↑ Getting better
Resilience, energy or stress management classes or programmes Similar findings
Massage or relaxation classes or programmes Similar findings
Other Similar findings
None of these (- 8%) ↓ Getting better
How educational institutions could improve the mental health and wellbeing of their workforce Managers working with their staff to reduce workload Similar findings
Changes being better communicated to staff by managers Similar findings
My employer having a well-implemented pupil/student behaviour policy Similar findings
The leadership team being more approachable Similar findings
My employer implementing a structured staff health and wellbeing programme (eg stress management workshops, support groups etc)
Similar findings
My employer allowing flexible working hours to fit with other commitments Similar findings
My employer having to meet high standards of health and wellbeing provision for staff regulated by an independent body
↓ Similar findings
My employer making us more aware of the support available (eg Employee Assistance Programmes) Similar findings
Colleagues being more understanding and accommodating of each other’s needs and feelings (+ 4%)
↑ Getting better
EXECUTIVE SUMMARY

17
Mental health and wellbeing policiesHas a policy ↑ Getting better
Does not have a policy ↓ Getting better
How well mental health and wellbeing policies were being implemented Always ↓ Similar findings
Most/some of the time (NB the ‘some’ category was added in 2018, so only 2019-2018 comparisons are on the same basis)
Similar findings
No/never (- 5%) ↓ ↓ Getting better
Educational organisations regularly surveying their staffYes (+ 9%) ↑ Getting better
No (- 9%) ↓ Getting better
Educational organisations having budgets/resources for staff wellbeingYes Similar findings
No Similar findings
Measuring wellbeing in the education sector
2017 2018 2019 2019 Summary
WEMWBS Score (all education staff) (NB – Regional comparisons can be found in the associated Key Indicators’ section)
44.7 New n/a
Overall tally of data changes identified between 2018-2019
Category Tally Number % of Total
Red spotlight (change of +/- 10%+): getting better 1 0%Red spotlight (change of +/- 10%+): getting worse 8 4%Amber spotlight (change of +/- 5-9%+): getting better 29 16%Amber spotlight (change of +/- 5-9%+): getting worse 8 4%Little change identified 137 75%
EXECUTIVE SUMMARY

EXECUTIVE SUMMARY
Regional comparisons of key indicators - 2019
The map displays the WEMWBS scores and the percentages for mental health issues, current levels of stress and thoughts on leaving the education sector.
_UK overall
44.7 WEMWBS score
34% Experienced mental health issues in the past academic year †
72%Current level of stress education staff feel from working †
57%Considered leaving the education sector in the past two years due to pressures on their health and wellbeing †
18 † Base = all education professionals
_North East
_scotland
_northern ireland
_wales
_North west
_Yorkshire and the Humber
_East Midlands
_south east
_south west
_london
_west Midlands

EXECUTIVE SUMMARY
_Scotland44.0 WEMWBS score
36% Experienced mental health issues in the past academic year †
70%Current level of stress education staff feel from working †
57%Considered leaving the education sector in the past two years due to pressures on their health and wellbeing †
_WALES46.4 WEMWBS score
27% Experienced mental health issues in the past academic year †
64%Current level of stress education staff feel from working †
56%Considered leaving the education sector in the past two years due to pressures on their health and wellbeing †
_NORTHERN IRELAND44.6 WEMWBS score
39% Experienced mental health issues in the past academic year †
74%Current level of stress education staff feel from working †
50%Considered leaving the education sector in the past two years due to pressures on their health and wellbeing †
_East Midlands44.0 WEMWBS score
36% Experienced mental health issues in the past academic year †
75%Current level of stress education staff feel from working †
58%Considered leaving the education sector in the past two years due to pressures on their health and wellbeing †
_LONDON45.0 WEMWBS score
34% Experienced mental health issues in the past academic year †
68%Current level of stress education staff feel from working †
58%Considered leaving the education sector in the past two years due to pressures on their health and wellbeing †
_South West45.4 WEMWBS score
28% Experienced mental health issues in the past academic year †
70%Current level of stress education staff feel from working †
54%Considered leaving the education sector in the past two years due to pressures on their health and wellbeing †
_West Midlands43.6 WEMWBS score
37% Experienced mental health issues in the past academic year †
77%Current level of stress education staff feel from working †
61%Considered leaving the education sector in the past two years due to pressures on their health and wellbeing †
_North West43.4 WEMWBS score
33% Experienced mental health issues in the past academic year †
75%Current level of stress education staff feel from working †
57%Considered leaving the education sector in the past two years due to pressures on their health and wellbeing †
_North East44.3 WEMWBS score
40% Experienced mental health issues in the past academic year †
70%Current level of stress education staff feel from working †
60%Considered leaving the education sector in the past two years due to pressures on their health and wellbeing †
_East of England45.6 WEMWBS score
35% Experienced mental health issues in the past academic year †
74%Current level of stress education staff feel from working †
57%Considered leaving the education sector in the past two years due to pressures on their health and wellbeing †
_Yorkshire and the Humber44.3 WEMWBS score
37% Experienced mental health issues in the past academic year †
71%Current level of stress education staff feel from working †
57%Considered leaving the education sector in the past two years due to pressures on their health and wellbeing †
_South East45.8 WEMWBS score
31% Experienced mental health issues in the past academic year †
73%Current level of stress education staff feel from working †
58%Considered leaving the education sector in the past two years due to pressures on their health and wellbeing †
_east of england
19

20
About the report
This report explores the mental health and wellbeing of education professionals working across the education sector The underpinning research had three aims:
1) To provide a description of the mental health and wellbeing of teachers and education staff using the most recent data
2) Analyse trends over time
3) Identify differences in the teacher and education staff populations as appropriate
The research was conducted using an online survey of education professionals drawn from YouGov’s panel. The total sample size was 3,019 education professionals and the survey was conducted during the period 25 June to 29 July 2019. The sample included all job roles within the education profession from senior leaders through to support staff working in the Early Years, Primary, Secondary, Further, Adult, and Vocational Education sectors. Appendix A gives a detailed breakdown of the responses received by sector and region, and also by gender, age and time spent working in education.
This is the third large-scale survey which Education Support has conducted. In 2018 the survey was published as “Teacher Wellbeing Index 2018” and previously as “Health Survey 2017 - The mental health and wellbeing of education professionals in the UK”. Both of these publications are available on its website. Comparisons with the findings in the previous two years have been made throughout this
2019 Index in order to identify trends over time. All findings have been shown in percentages2.
This Index has been structured around five main themes:
_Section 1 Understanding why people choose to work in the education sector to build a picture of what it means to work in education.
_Section 2 Identifying aspects of the mental health and wellbeing of education professionals, with a focus on individual employees.
_Section 3Detailing how the impact of an individual employee’s mental health and wellbeing affects their students and others working in education.
_Section 4 Describing the mental health and wellbeing guidance available to staff in the education sector.
_Section 5 Using the Warwick-Edinburgh Mental Wellbeing Scale to measure the mental wellbeing of education professionals.
2 As a result of GDPR legislation, all YouGov respondents in the 2018 research onwards were given the option to opt-out of questions which gathered sensitive personal data, including questions which captured information about their health. In the analysis these were coded as “refused”, in addition to respondents who selected the “prefer not to say” option. Where Index comparisons with 2018/2017 have been made, the figures are based on those who responded to the question (ie excluding “refused” and “prefer not to say”).

SECTION 1: WORKING IN THE EDUCATION SECTOR
Building a picture of staffing
22
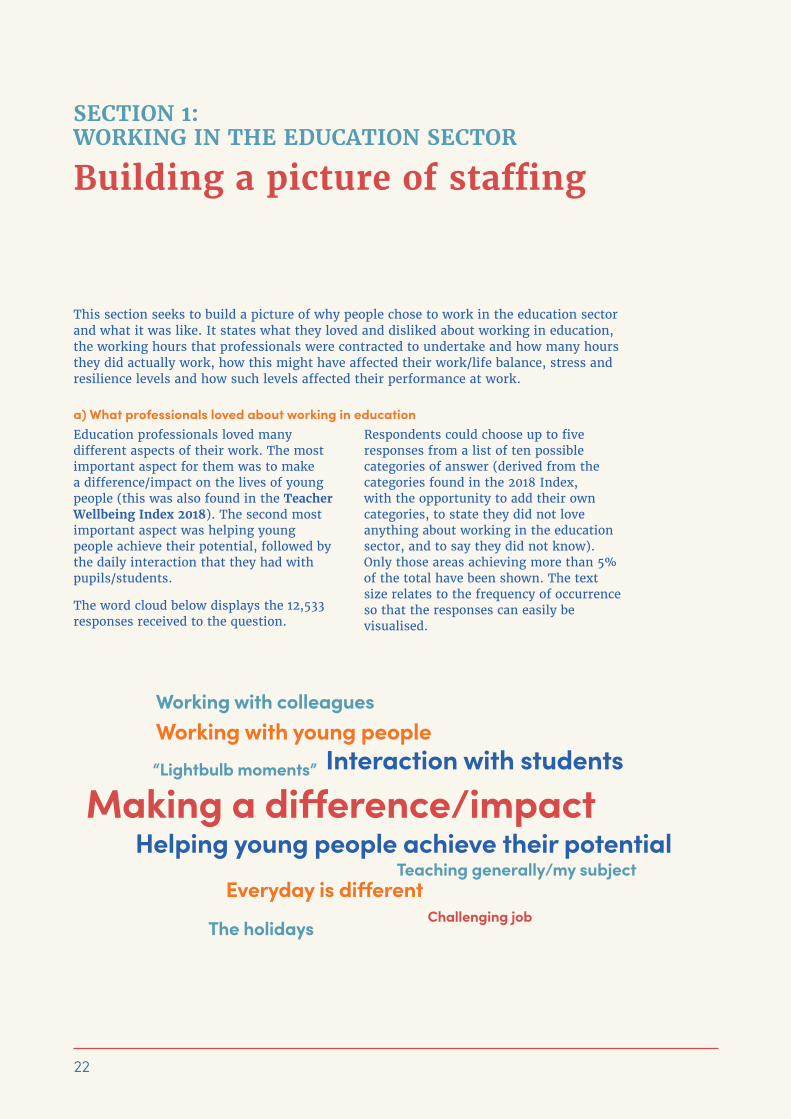
a) What professionals loved about working in educationEducation professionals loved many different aspects of their work. The most important aspect for them was to make a difference/impact on the lives of young people (this was also found in the Teacher Wellbeing Index 2018). The second most important aspect was helping young people achieve their potential, followed by the daily interaction that they had with pupils/students.
The word cloud below displays the 12,533 responses received to the question.
Respondents could choose up to five responses from a list of ten possible categories of answer (derived from the categories found in the 2018 Index, with the opportunity to add their own categories, to state they did not love anything about working in the education sector, and to say they did not know). Only those areas achieving more than 5% of the total have been shown. The text size relates to the frequency of occurrence so that the responses can easily be visualised.
SECTION 1: WORKING IN THE EDUCATION SECTOR
Building a picture of staffing
This section seeks to build a picture of why people chose to work in the education sector and what it was like. It states what they loved and disliked about working in education, the working hours that professionals were contracted to undertake and how many hours they did actually work, how this might have affected their work/life balance, stress and resilience levels and how such levels affected their performance at work.

23
b) What professionals disliked about working in educationUsing the same approach as asking education professionals what they loved about working in education, they were also asked about what they disliked about working in education. Workload was found to be the major aspect of their job which was disliked (the same finding as in the Teacher Wellbeing Index 2018), followed by dealing with unnecessary paperwork and receiving poor/low pay.
The word cloud below displays the 11,583 responses received to the question.
Respondents could choose up to five responses from a list of ten possible categories of answer (derived from the categories found in the 2018 Index, with the opportunity to add their own categories, to state they did not love anything about working in the education sector, and to say they did not know). Only those areas achieving more than 5% of the total have been shown. The text size relates to the frequency of occurrence so that the responses can easily be visualised.
SECTION 1 WORKING IN THE EDUCATION SECTOR

24
c) Working hours – contracted and workedLong working hours continued to be a reality in the education profession across all job roles, with many education professionals working for many more hours than they were contracted to. To capture more accurately the upper levels of hours worked, three new options were introduced in the 2019 survey, replacing 60+ hours with 61-70 hours and 71-80 and 81+ hours.
• In 2019, 33% of all education professionals worked for more than 51 hours a week on average – compared to 32% in 2018 and 35% in 2017.
• Senior leaders worked much longer hours than they were contracted to do – only 3% were contracted to work 51+ hours per week and yet 68% did so. This was a large increase on 2018, when 5% were contracted to work 51+ hours per week and yet 59% did so.
• The 2019 survey captured that 28% of senior leaders worked more than 61 hours per week, with 11% working more than 70 hours per week.
• School teachers worked longer hours than they were contracted to do as well – only 2% were contracted to work 51+ hours per week and yet 33% did so. This was an increase on 2018, when 2% were contracted to work 51+ hours per week and yet 29% did so.
• In 2019, 1% of staff working in other roles were contracted to work more than 40 hours per week and yet 28% did so.
The above results can be seen in the context of three other research studies from England which have recently looked into the working hours of teachers. The first, is the TALIS report for the OECD which found that full-time teachers in England in 2018 worked an average of 49.3 hours per week (quoted in EPI, 2019). The second is Teacher Workload Survey (TWS) 2019 which found that working hours had reduced for teachers to 49.5 hours in 2019 hours from 54.4 hours in 2016, and for senior leaders to 55.1 hours in 2019 from 60.5 hours in 2016 (DfE, 2019). The third is the research report by Allen et al (2019) which found “a quarter of teachers work more than 60 hours per week during term time”.
Other staff roles - Contracted hours versus hours typically worked per week in 2019
School Teachers - Contracted hours versus hours typically worked per week in 2019
2019 Base: Senior leaders (n = 545), School Teachers (n = 1,842), other staff roles (n = 474)
SECTION 1 WORKING IN THE EDUCATION SECTOR
Senior Leaders - Contracted hours versus hours typically worked per week in 2019
Senior Leaders(Contracted to work)
Senior Leaders(Typically work)
0%10%20%30%40%50%60%70%80%
Hours < 20 21-30 61-707 1-808 1+31-40 41-50 51-60 61+
Hours < 20 21-30 61-707 1-80 81+31-40 41-50 51-60 61+
School Teachers(Contracted to work)
School Teachers(Typically work)
0%10%20%30%40%50%60%70%80%
Hours < 20 21-30 61-707 1-80 81+31-40 41-50 51-60 61+
10%20%30%40%50%60%70%80%

25
d) Work/life balanceWorking long hours, it can be difficult to achieve the right balance between home and work lives. Two recent publications have highlighted this. Firstly, Ofsted reported that “levels of satisfaction with life are higher among the general public than among staff in schools and FES providers (Ofsted, 2019). Secondly, according to Worth et al, “teachers have a lower level of satisfaction with their amount of leisure time than nurses and a similar level to police officers. There is no significant difference in satisfaction with their amount of leisure time between primary and secondary school teachers” (Worth et al, 2019).
• When asked about the extent to which various factors contributed to a negative work/life balance in this study, education professionals most commonly indicated the inability to switch off and relax was the most important factor (74%), which was exactly the same as in 2018.
• Other issues which negatively affected the balance were working long hours
on weekdays (66%), not finding time to be with family/friends (61%), working during the holidays (57%) and working over weekends (55%). All these issues showed a small percentage decrease in 2019 when compared with 2018.
• Conversely, 26% stated that family commitments were a factor in preventing them from doing a good job at work, which was exactly the same as in 2018.
• In all six factors noted below, senior leaders expressed these areas more negatively influenced their work/life balance compared to school teachers or those working in others roles (this was the same in 2018).
• Overall, in the period 2018 to 2019 the percentage responses to all factors decreased, notably working over weekends (which decreased by 7% to 55% in 2019) and working long hours on weekends (which decreased by 5% to 66% in 2019).
Factors that contributed a great deal or somewhat to a negative work-life balance for education professionals
2019 Base: All education professionals (n = 3,019)2018 Base: All education professionals (n = 1,187)2017 Base: All education professionals (n = 987)
SECTION 1 WORKING IN THE EDUCATION SECTOR
201720182019
74%
77%74%
Working long hours on weekdays66%
72%71%
61%
67%65%
Working during holidays57%
63%60%
Working over weekends55%
67%62%
Family commitments preventing mefrom doing a good job
26%
25%26%

26
e) Levels of stress working in the education sectorEducation professionals were asked to describe their current level of stress experienced from working.
• In 2019, 72% of education professionals described themselves as stressed, compared with 27% who said they were not stressed.
• Stress levels (72%) have risen noticeably when compared to both 2018 (67%) and 2017 (66%).
• When looking at job roles, 84% of senior leaders were stressed (up from 80% in 2018 and 75% in 2017). Rises in the stress levels of school teachers have also taken place, with 73% reporting being stressed in 2019, compared with 64% in 2018 and 67% in 2017. The stress levels for staff working in other roles remained constant, at 61% in 2019 and 62% in 2018.
• Working long hours and the feeling of stress appear to be closely linked. The highest levels of stress came from education professionals working 61+ hours per week (89%), compared to those working 41-60 hours per week (83%) and those working under 40 hours per week (57%). In 2019 this can be clearly seen in relation to the number of hours worked per week, as this was extended up to 81+, from the maximum previous level of 60+.
SECTION 1 WORKING IN THE EDUCATION SECTOR
Work-related stress, depression or anxiety accounts for 44% of work-related ill health and 57% of working days lost in 2017/18
(HSE, 2018)

27
2019 Base: All education professionals (n = 3,019)2018 Base: All education professionals (n = 1,187)2017 Base: All education professionals (n = 987) NB small dataset for staff in other roles, so not included
2019 Base: All education professionals (n = 3,019)
SECTION 1 WORKING IN THE EDUCATION SECTOR
How education professionals described their current level of stress at work
Comparison of levels of stress felt from working with typical number of hours worked per week - 2019
Senior Leaders
2019
2018
2017
2019
2018
2017
2019
2018
School Teachers Other Roles
84%
16%
61%
37%
62%
38%
73%
27%
64%
35%
67%
32%
80%
20%
75%
24%Stressed
Not stressed
28
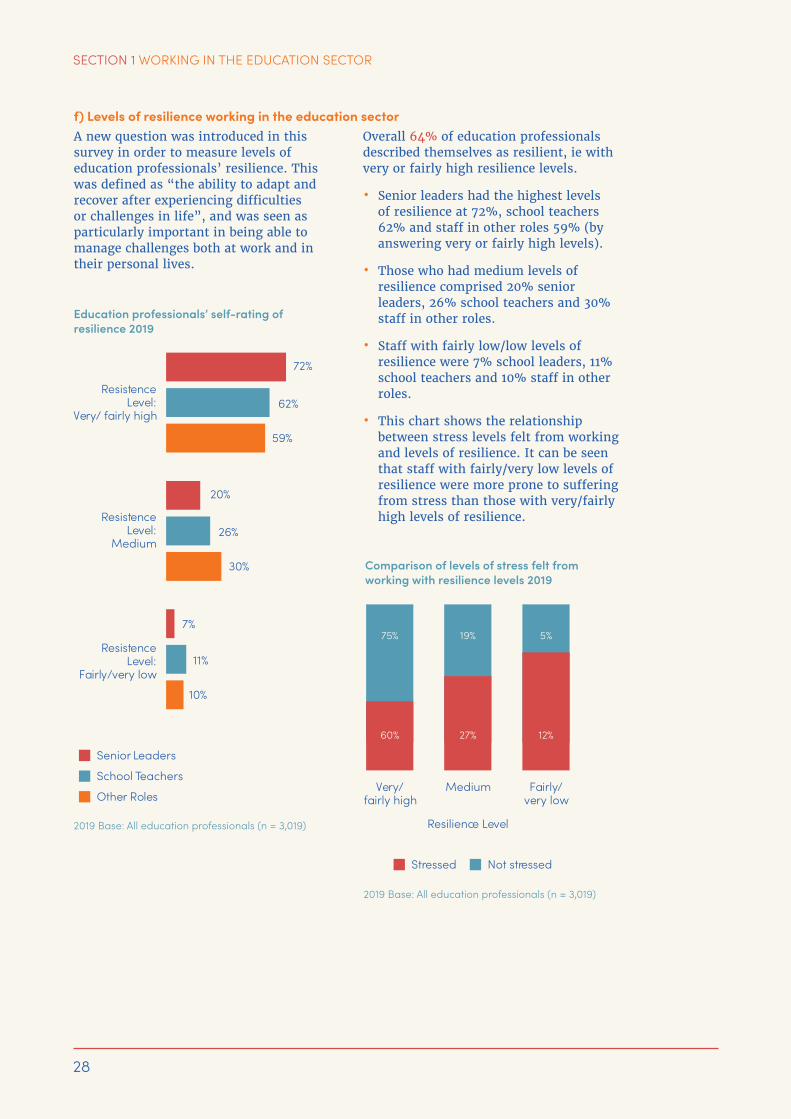
f) Levels of resilience working in the education sectorA new question was introduced in this survey in order to measure levels of education professionals’ resilience. This was defined as “the ability to adapt and recover after experiencing difficulties or challenges in life”, and was seen as particularly important in being able to manage challenges both at work and in their personal lives.
Overall 64% of education professionals described themselves as resilient, ie with very or fairly high resilience levels.
• Senior leaders had the highest levels of resilience at 72%, school teachers 62% and staff in other roles 59% (by answering very or fairly high levels).
• Those who had medium levels of resilience comprised 20% senior leaders, 26% school teachers and 30% staff in other roles.
• Staff with fairly low/low levels of resilience were 7% school leaders, 11% school teachers and 10% staff in other roles.
• This chart shows the relationship between stress levels felt from working and levels of resilience. It can be seen that staff with fairly/very low levels of resilience were more prone to suffering from stress than those with very/fairly high levels of resilience.
2019 Base: All education professionals (n = 3,019)
2019 Base: All education professionals (n = 3,019)
SECTION 1 WORKING IN THE EDUCATION SECTOR
Education professionals’ self-rating of resilience 2019
Comparison of levels of stress felt from working with resilience levels 2019
Senior Leaders
School Teachers
Other Roles
ResistenceLevel:
Very/ fairly high
72%
62%
59%
ResistenceLevel:
Fairly/very low
7%
10%
11%
ResistenceLevel:
Medium
20%
26%
30%
Stressed Not stressed
Very/fairly high
Fairly/very low
Medium
75%
60%
19%
27%
5%
12%
Resilience Level

29
g) How education professionals dealt with stress/anxiety and its effect on their performance at workAs noted below, there was a marked increase in the number of education professionals describing themselves as suffering from work-related stress. The ways in which they coped with such stress in 2019 were by eating food (51%, representing a small increase on the 47% reported in 2018), drinking alcohol (31%), and undertaking unnecessary spending (23%). Other ways were the use of drugs (4%), gambling (2%) and other methods (3%). However, 31% of respondents did not use any of these methods.
There are some differences in the use of these coping mechanisms by job role:
• More senior leaders and school teachers turned to food/eating to cope compared with those working in other roles (53%, 53% and 41% respectively).
• Senior leaders and school teachers were more likely to cope by undertaking unnecessary spending compared to staff working in other roles (27%, 23% and 17% respectively) and have also used alcohol (35%, 30% and 25% respectively).
• Staff working in other roles were more likely to have used none of these mechanisms (42% compared to 27% for senior leaders and 31% for school teachers)
SECTION 1 WORKING IN THE EDUCATION SECTOR
2019 Base: All education professionals (n = 3,019)2018 Base: All education professionals (n = 1,187)Note – Question not asked in 2017
How education professionals coped with workplace stress or anxiety 2018-2019
20182019
Food/eating
None of these
Alcohol
Unnecessary spending
Drugs
Other
Gambling
51%
3%3%
2%3%
4%
5%
23%
22%
31%
31%
32%
35%
47%

30
These five substances, or behaviours, which education professionals may have used to cope with workplace stress or anxiety could also have positively or negatively affected a number of aspects in schools.
The largest aspect in which work performance was affected was the ability to plan lessons and mark students’ work, where it was considered to be negatively affected by 24% (this has reduced from 30% in 2018), with a small positive effect of 6% (same in 2018). It also negatively affected the ability of professionals to manage poor classroom behaviour by 18% (reduced from 21% in 2018), with a positive effect of 7% (8% in 2018), and also negatively impacted on their relationships with colleagues by 18% (21% in 2018), with a positive effect of 11% (same in 2018). Student learning was also considered to be negatively impacted by 13% (15% in 2018), with a positive effect of 8% (9% in 2018).
–The next section will explore the impact of mental health and wellbeing on the individual.
SECTION 1 WORKING IN THE EDUCATION SECTOR
How education professionals in different job roles coped with workplace stress or anxiety in 2019
2019 Base: All education professionals (n = 3,019)
2019 Base: All education professionals (n = 1,884)
How elements of work performance had been affected by the use of substances or behaviours to cope with workplace stress or anxiety
53%
4%4%4%
3%4%
2%
2%2%
1%
3%2%2%
17%
42%
27%
27%23%
31%
35%30%
25%
53%41%
Food/eating
None of these
Alcohol
Unnecessary spending
Drugs
Other
Gambling
Don’t know/can’t remember
Senior Leaders
School Teachers
Other Roles

SECTION 2:
The mental health and wellbeing of education professionals – the individual

32
a) The symptoms experienced and the signsEducation professionals reported experiencing a variety of symptoms tied to their mental health and wellbeing which could be assumed to have the potential to impact on their working lives. They were asked a question about their symptoms both relating to this year and also asking them to reflect back to the previous year at the same time.
• In the last year there had been a large increase in people suffering from many and varied symptoms. This included a 15% increase in tearfulness (29% to 44%), a 15% increase in difficulty concentrating (27% to 42%) and a 14% increase in insomnia/difficulty sleeping (38% to 52%).
• Other areas where there was an increase included a 13% increase in irritability/mood swings (35% to 48%), a 12% increase in dizziness (13% to 25%) and a 10% increase in over-eating (33% to 43%).
• Smaller increases were also found, including an 8% increase in muscle tension (28% to 36%), 8% increase in changes to appetite (17% to 25%) and a 6% increase in recurring headaches/migraines (29% to 35%).
• There was a decrease in professionals reporting the category ‘none of these’ (18% to 13%).
• Insomnia/difficulty sleeping was experienced by 52% of education professionals in the last year. This is considerably higher than the 28% of workers nationally reported last year suffering from sleep problems due to work or where work was a contributing factor (CIPD, 2019). Likewise panic attacks were experienced by 21% (consistent across 2019 and 2018), whereas the national figure reported was 6% (CIPD, 2019).
SECTION 2:
The mental health and wellbeing of education professionals – the individual
This section seeks to build a picture of the mental health and wellbeing of education professionals as individuals (Section 3 details the impact on other people). This includes what symptoms they may have experienced, and their signs. It also includes data relating to the number of professionals experiencing mental health issues in the last year, including those related to work, and how these, and personal issues, were alleviated. The association between organisational culture and mental health and wellbeing is detailed, followed by reasons why some staff might have wanted to leave the profession during the last two years due to mental health and wellbeing issues.

33
SECTION 2 THE MENTAL HEALTH AND WELLBEING OF EDUCATION PROFESSIONALS
When looking at the data by job role in 2019, a number of differences were found.
• School teachers experienced the highest levels of insomnia (54%) compared to senior leaders (51%) and staff in other roles (46%). They also experienced the highest levels of irritability (49%, compared with 46% and 44%) and recurring headaches/migraines (36%, compared with staff in other roles at 33% and senior leaders at 31%).
• Senior leaders experienced the highest levels of muscle tension (42%, compared with school teachers at 35% and staff in other roles at 32%) and difficulty concentrating (43%, compared with 42% and 40%).
• Staff working more than 60 hours per week experienced more symptoms than those working less than 60 hours per week (with the exception of muscle tension).
• Staff working for 0-5 years experienced more symptoms related to panic attacks, staff working for 0-2 years experienced more under-eating symptoms and staff working 31+ years experienced more symptoms related to high blood pressure.
2019 Base: All education professionals, in the last year (n = 2,731) in the last two years (n = 2,154)Note: A reflective question, asking respondents in 2019 for their perceptions relating to both 2019 and 2018
Symptoms experienced by education professionals in the last 1-2 years
In the last year In the last two years
Irritability, mood swings
Tearfulness
Over-eating
Forgetfulness
Muscle tension
Recurring headaches/migraines
Dizziness
Changes to appetite
Panic attacks
Under-eating
None of these
High blood pressure
52%
12%12%
43%
42%
38%
36%
35%
25%13%
17%
18%
14%
13%11%
25%
21%21%
33%
27%
25%
28%
29%
48%
44%29%
38%
35%

34
Many education professionals felt, or it was suggested to them, that such symptoms could be signs of a mental health issue.
• In 2019, the most common signs that such symptoms could be attributed to were anxiety (46%), depression (35%), exhaustion (29%) and acute stress (25%). These figures were considerably higher than those nationally reported, namely 25% suffering from anxiety and 14% from depression due to work or where work was a contributing factor (CIPD, 2019).
2019 Base: Senior leaders (n = 491), School Teachers (n = 1,666), other staff roles (n = 433)
Symptoms experienced by education professionals in the last year, by job role
SECTION 2 THE MENTAL HEALTH AND WELLBEING OF EDUCATION PROFESSIONALS

35
SECTION 2 THE MENTAL HEALTH AND WELLBEING OF EDUCATION PROFESSIONALS
When looking at all the signs across job roles
• Signs of anxiety in school teachers rose to 48% in 2019 from 42% in 2018. A similar picture was found for staff working in other roles, where it rose to 40% in 2019 from 33% in 2018. However, anxiety levels decreased in senior leaders to 41% in 2019 compared with 48% in 2019 and 49% in 2017.
• Signs of depression decreased in senior leaders to similar levels seen in 2017 (28% in 2019, 40% in 2018 and 25% in 2017) and signs of anxiety generally to 41% in 2019 from 48% in 2018.
• Staff working in other roles also showed increases in two other signs – acute stress levels increased to 24% from 16% in 2018, and depression to 34% from 29%. Signs of exhaustion, however, reduced to 19% from 27% in 2018.
2019 Base: All education professionals who experienced symptoms (n = 1,725)2018 Base: All education professionals who experienced symptoms (n = 661)2017 Base: All education professionals who experienced symptoms (n = 878)
Symptoms experienced by education professionals linked to possible signs of mental health issues
Anxiety
None of these
Depression
Exhaustion
Acute stress
Post-traumaticstress disorder (PTSD)
Obsessive compulsivedisorder (OCD)
Other
Eating disorder(including Anorexia, Bulimia,
Binge Eating Disorder)
Personality disorder
Bipolar disorder
Schizophrenia/psychosis0%0%0%
46%43%
45%
29%30%
32%
32%
27%27%
0%
25%27%
5%
4%6%
4%4%
2%
6%7%
3%
2%3%3%
1%1%
2%
1%1%
2% 2019
2018
2017
35%32%
37%

36
Many of those who exhibited signs went to see their General Practitioner (GP), or doctor, for a diagnosis.
• Of those who did, in 2019 57% were found to be formally diagnosed with depression (a 4% increase on 2018 levels), 52% with anxiety (a 2% increase), 28% with acute stress (a 5% increase) and 11% with exhaustion (a reduction of 3% on 2018 levels).
• When looking at job roles of education staff who had received a diagnosis, staff working in other roles represented the largest group for depression (at 61%, compared with 58% for school teachers and 50% for senior leaders); all roles were broadly similar for anxiety (53% for those in other roles and 51% for both senior leaders and school teachers); school teachers were the largest group for exhaustion (11%, compared to 7% for both senior leaders and those in other roles) and school teachers for acute stress (at 30%, compared with 26% for staff in other roles and 18% for senior leaders).
Bases: Actual numbers in graphNote: These categories are not mutually exclusive, so educational professionals could have presented with more than one sign or have been diagnosed with more than one sign of mental ill-health by their GP.
2019 Base: All education professionals (n = 3,019)
b) Mental health issues experienced in the last year• In 2019, one-third (34%) of education
professionals (35% of school teachers, 33% of school leaders, and 31% of staff working in other roles) stated they had experienced mental health issues in the past academic year, 62% have not, and 4% preferred not to answer the question. This was a small increase on 2018, when 31% stated they had experienced such issues.
• Of those who reported they had experienced a mental health issue, 31% attributed this to work (which was higher among senior leaders), 51% to both work and home issues and 15% to their personal life.
• Newly-Qualified Teachers reported the most mental health issues (43%), compared to teachers generally (35%), senior leaders (33%) and those staff working in other roles (31%).
• Staff who had worked for between 3-10 years in their role at the time of the survey reported the most mental health issues (38-39%), compared to staff working 0-2 years (32%), 11-20 years (32%), 21-30 years (29%) and 31+ years (22%).
• Those staff who rated their resilience level as low were more likely to have experienced mental health issues – of those who did, 65% had rated their resilience level as low, 44% as medium and 25% as high.
Formal diagnosis by a General Practitioner (GP) following mental health signs displayed (2019)
Education professionals who experienced mental health issues in the last year (2019)
2019 (Total signs) 2019 (Diagnosed)
Acutestress
429
119
Anxiety
765
394
Depression
579
329
Exhaustion
480
54
62%34%
SECTION 2 THE MENTAL HEALTH AND WELLBEING OF EDUCATION PROFESSIONALS

37
SECTION 2 THE MENTAL HEALTH AND WELLBEING OF EDUCATION PROFESSIONALS
2019 Base: All education professionals (n = 2,929)2018 Base: All education professionals (n = 1,163)2017 Base: All education professionals (n = 987)
c) Mental health symptoms experienced by education professionals due to workMany education professionals disclosed that they experienced physical and mental health symptoms which they attributed to work or where work was a contributing factor.
• In 2019, 78% of all educational professionals reported they had experienced at least one behavioural, physical or psychological symptom related to work (76% in 2018 and 75% in 2017).
• Just over half (57%) said they had experienced behavioural changes, half (52%) physical symptoms and just under half (49%) psychological symptoms related to work (NB respondents could have more than one symptom).
• Senior leaders experienced more behavioural, physical and psychological symptoms compared with school teachers and staff working in other roles.
• Staff who were stressed experienced all three symptoms more than those who were not stressed (87% compared to 52%).
• Staff working more than 40 hours per week experienced all symptoms more than those working less than 40 hours per week. In 2018 this was also reported, but related to working 60 hours per week.
Symptoms experienced by education professionals due to work or where work was a contributing factor
Net: any symptom
Behavioural symptoms(e.g. changes to appetite, irritability,
procrastination, mood swings)
Physical symptom(e.g. raised blood pressure,
muscle tension, sweating, dizziness,headaches or migraines)
Psychological symptoms(e.g. depression, anxiety,
panic attacks)
None of the above
2019
2018
2017
78%
22%
22%24%
52%
49%47%
52%50%
50%
57%
57%58%
76%75%

38
For those educational professionals who had experienced symptoms where work was a contributing factor:
• Work/life balance emerged as the top issue at work for 69% of education professionals in 2019, with a 1% increase on 2018 figures. Senior leaders felt this more strongly than school teachers or staff working in other roles, as did all those working more than 41 hours per week.
• Excessive workload was a very close second to work/life balance, with 68% of education professionals citing this (a 1% decrease on 2018 levels although this was found to be 79% in 2017). Like work/life balance above, this was felt more strongly by senior leaders than by school teachers or those working in other roles, and by staff working more than 41 hours per week.
• Difficulty with managing poor pupil/student behaviour remained as the third most important issue, although this decreased overall by 1% to 42%. This impacted much more on school teachers (51%), than senior leaders (36%) or those working in other roles (20%).
• There was an increase in the feeling of a lack of trust being experienced from managers from 28% in 2018 to 34% in 2019. School teachers stated this higher (36%) than senior leaders (31%) and staff in other roles (28%).
• There was an 8% decrease in the importance placed on a low income being a work issue that symptoms were related to, which dropped from 41% in 2018 to 33% in 2019. Those working in other roles marked this higher (39%), compared to school teachers (35%) and senior leaders (18%).
• Redundancy/restructure was more of an issue for staff working in other roles (29%), than for teachers (12%) or for senior leaders (12%).
• Bullying was more of an issue for staff working in other roles (24%), compared to teachers (19%) and senior members of staff (16%).
In 2018-2019 Education Support managed 9,615 calls to its free and confidential emotional support helpline, run by trained and accredited counsellors. This number of calls managed is the highest in its history, and 28.1% more than 2017
(Education Support, 2019)
SECTION 2 THE MENTAL HEALTH AND WELLBEING OF EDUCATION PROFESSIONALS

39
SECTION 2 THE MENTAL HEALTH AND WELLBEING OF EDUCATION PROFESSIONALS
2019 Base: All education professionals (n = 815)2018 Base: All education professionals (n = 314)2017 Base: All education professionals (n = 124)
Work issues that symptoms are related to for education professionals
73%
79%
2019
2018
2017
Work/life balance
Excessive workload
Pupils'/students' behaviour
Unreasonable demandsfrom manager
Lack of trust from managers
Low income
Inspections
Rapid pace of change(eg National Curriculum)
Problems with pupils'/students' parents
Bullying by colleagues
Redundancy/restructure
Lack of opportunities towork independently
Other
Discrimination
Retirement
69%
42%
34%
33%
24%
24%
26%
26%20%
20%
20%21%
19%
17%
16%
7%
4%
5%
1%
3%1%
8%5%
6%
14%
50%
27%28%
29%
41%43%
28%0%
0%
0%
38%41%
49%
34%43%
68%69%
68%

40
d) Symptoms experienced by education professionals due to personal reasons Education professionals could also experience symptoms due to personal reasons or a combination of problems at work and in their home lives:
• The main three personal issues were family issues (experienced by 51% in 2019, compared to 48% in 2018); financial worries (experienced by 43%, a small decrease on 45% in 2018) and health concerns (experienced by 29%, another small decrease on 32% in 2018).
• Staff members who worked in other roles reported higher levels of financial worries and health concerns than senior leaders or school teachers.
• Staff who worked for more than 61 hours per week reported more issues related to housing.
• There was a 5% reduction in the number of staff who answered ‘none of these’.
Symptoms and their relationship to personal issues experienced by education professionals
Last year there was a 24% increase in applications to the Education Support’s financial grants’ programme. The most prevalent issue was housing
2019 Base: All education professionals (n = 644)2018 Base: All education professionals (n = 314)2017 Base: All education professionals (n = 124)
2019
2018
2017
51%
29%
19%
19%
16%
14%
14%
12%
12%
10%
9%
13%
13%
8%
5%
5%
7%4%
19%18%
32%40%
53%
55%48%
43%45%
Family issues
Financial worries
Health concerns
Bereavement
Trauma
Other
Housing problems
None of these
Problems with neighbours
SECTION 2 THE MENTAL HEALTH AND WELLBEING OF EDUCATION PROFESSIONALS
41
SECTION 2 THE MENTAL HEALTH AND WELLBEING OF EDUCATION PROFESSIONALS
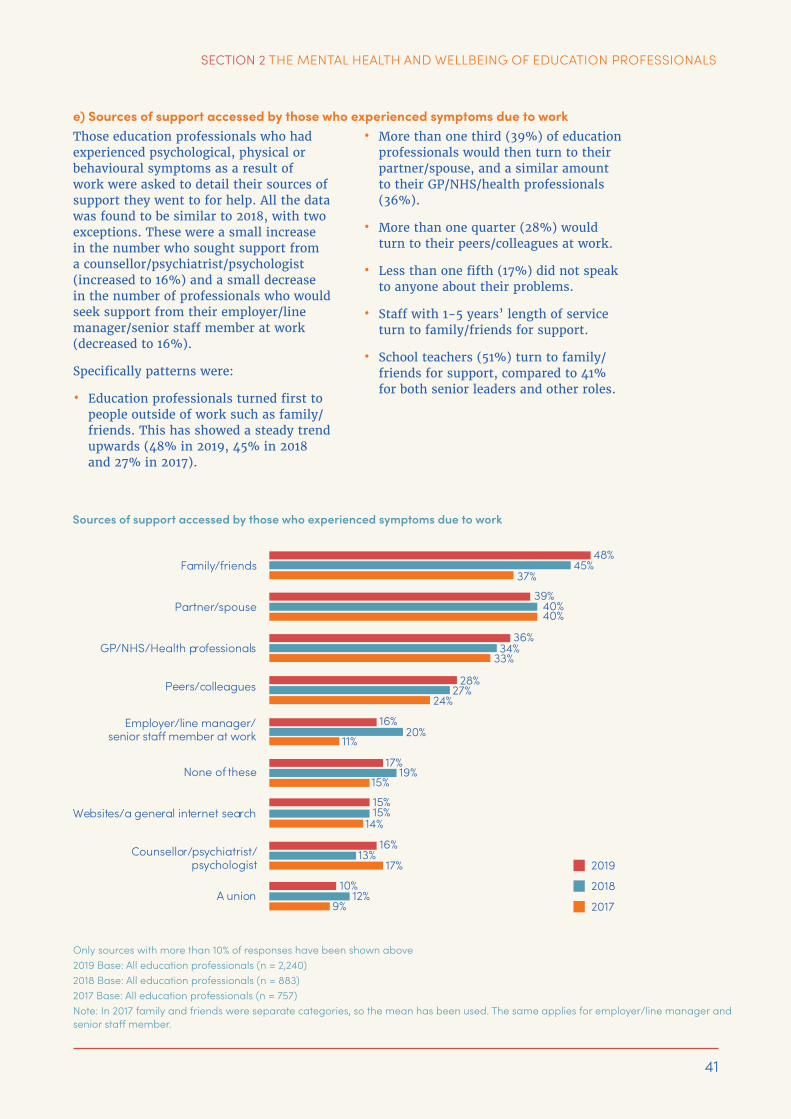
e) Sources of support accessed by those who experienced symptoms due to work Those education professionals who had experienced psychological, physical or behavioural symptoms as a result of work were asked to detail their sources of support they went to for help. All the data was found to be similar to 2018, with two exceptions. These were a small increase in the number who sought support from a counsellor/psychiatrist/psychologist (increased to 16%) and a small decrease in the number of professionals who would seek support from their employer/line manager/senior staff member at work (decreased to 16%).
Specifically patterns were:
• Education professionals turned first to people outside of work such as family/friends. This has showed a steady trend upwards (48% in 2019, 45% in 2018 and 27% in 2017).
• More than one third (39%) of education professionals would then turn to their partner/spouse, and a similar amount to their GP/NHS/health professionals (36%).
• More than one quarter (28%) would turn to their peers/colleagues at work.
• Less than one fifth (17%) did not speak to anyone about their problems.
• Staff with 1-5 years’ length of service turn to family/friends for support.
• School teachers (51%) turn to family/friends for support, compared to 41% for both senior leaders and other roles.
Only sources with more than 10% of responses have been shown above2019 Base: All education professionals (n = 2,240)2018 Base: All education professionals (n = 883)2017 Base: All education professionals (n = 757)Note: In 2017 family and friends were separate categories, so the mean has been used. The same applies for employer/line manager and senior staff member.
Sources of support accessed by those who experienced symptoms due to work
2019
2018
2017
48%
17%19%
15%15%
16%13%
17%
10%12%
9%
15%14%
39%40%40%
36%34%
33%
28%
16%20%
11%
27%24%
45%37%
Family/friends
Partner/spouse
GP/NHS/Health professionals
Peers/colleagues
None of these
Websites/a general internet search
Counsellor/psychiatrist/psychologist
A union

42
SECTION 2 THE MENTAL HEALTH AND WELLBEING OF EDUCATION PROFESSIONALS
f) Ways in which symptoms experienced at work were alleviated Those education professionals who had experienced psychological, physical or behavioural problems as a result of work were asked to detail their ways of coping.
• The most popular way of coping was by undertaking physical exercise, which increased by 1% on 2018 levels. The second most popular way was by employing meditation/mindfulness techniques, which increased by 2% on 2018 levels.
• All the other categories were found to be similar to 2018 and 2017 levels.
• Therapy/counselling increased to 25% from 22% in 2018 (this can be contrasted with the 16% of education professionals who were supported by a counsellor/psychiatrist/psychologist for psychological, physical or behavioural issues in the previous section) and is interpreted as staff receiving therapy/counselling which might not necessarily be of a psychological or emotional nature.
2019 Base: All education professionals (n =2,224)2018 Base: All education professionals (n = 883)2017 Base: All education professionals (n = 757)
How education professionals alleviated/solved their symptoms experienced at work
2019
2018
2017
42%
19%18%18%
18%16%
13%
23%
22%
24%
24%
25%
27%
32%
8%
9%9%9%
10%10%
30%31%
46%41%Physical exercise
Meditation/mindfulness
Alcohol
Therapy/counselling
I didn't try to alleviate/solve them
Self-medication(e.g. over the counter drugs,
vitamins, etc.)
Other
Drugs

43
SECTION 2 THE MENTAL HEALTH AND WELLBEING OF EDUCATION PROFESSIONALS
When comparing by job role, it was found that:
• School leaders and school teachers preferred to use physical exercise (43% and 44% respectively) compared to staff in other roles (32%).
• School teachers preferred to try to self-medicate by using over the counter vitamins (21%), compared to school leaders (18%) or staff in other roles (13%).
• Staff working in other roles did not try to alleviate them (25%) compared to senior leaders (22%) or school teachers (17%).
2019 Base: Senior leaders (n = 457), school teachers (n = 1,359); other staff (n = 295)
How education professionals alleviated/solved their symptoms experienced at work in 2019 - by job role
43%
18%
17%
13%
21%
21%
21%
23%
22%
26%
25%
25%
24%
28%
32%
8%
8%
8%
6%9%
9%
33%31%
44%Physical exercise
Meditation/mindfulness
Therapy
Alcohol
Self-medication(e.g. over the counter drugs,
vitamins, etc.)
I didn't try to alleviate/solve them
Other
Drugs
Senior Leaders
School Teachers
Other Roles

44
SECTION 2 THE MENTAL HEALTH AND WELLBEING OF EDUCATION PROFESSIONALS
g) How organisational culture related to education professionals’ mental health and wellbeingThis was a new question for 2019. It arose from comments made by education professionals in the 2018 Index where many described their wellbeing in relation to the organisation they worked for. It was found that:
• Nearly half (49%) of staff considered their organisational culture had a negative effect on their wellbeing.
• Just under a quarter (23%) considered it had a positive effect on their wellbeing.
• More than a tenth (12%) considered it had no effect, and 16% did not know.
• More than half of senior leaders (55%) considered the culture of their organisation negatively affected staff wellbeing, compared to school teachers (49%) or those in other roles (42%).
• More than a quarter of staff in other roles (27%) considered the culture positively affected wellbeing, compared to senior leaders (24%) or school teachers (22%).
• Staff with high levels of resilience (28%) felt the culture of the organisation had a more positive effect than those with a medium level of resilience (18%) or a low level (10%), whereas staff with a low level of resilience felt the culture of the organisation had a more negative effect (66%) than those with a medium level (51%) or high level (46%).
• Staff who worked less than 40 hours per week felt the culture of their organisation had a positive effect on wellbeing, whereas those working more than 40 hours per week felt it negatively affected their wellbeing.
2019 Base: All education professionals (n = 3,019)
How organisational culture related to education professionals’ mental health and wellbeing
49%
11%
16%
23%
Don’t know

45
SECTION 2 THE MENTAL HEALTH AND WELLBEING OF EDUCATION PROFESSIONALS
h) Education professionals who had considered leaving the profession due to health and wellbeing issues in the last two years• As a result of health pressures, more
than half of all education professionals (57%) in 2019 had considered leaving the profession in the last two years (exactly the same as in 2018).
• Senior leaders were more likely than those in teaching or other roles to have considered leaving – 66%, compared with 61% and 42% respectively.
• Of those who had considered leaving, stress was an issue (68% stressed compared to 29% who were not stressed), as it was for those staff working 41+ hours per week.
2019 Base: All education professionals (n = 3,019)
Educational professionals who had considered leaving the profession in the past 2 years due to pressures on their health and wellbeing

46
SECTION 2 THE MENTAL HEALTH AND WELLBEING OF EDUCATION PROFESSIONALS
Retaining school teachers and other staff working in education continues to be of high importance in order to ensure educational institutions are well and appropriately staffed. As with previous years, education professionals were asked to indicate their reasons for wanting to leave the profession. In this survey, four new categories of answer were included (these have been incorporated from the open response answers to the same question in 2018).
2019 Base: All education professionals (n = 1,724)2018 Base: All education professionals (n = 675)2017 Base: All education professionals (n = 549)
Reasons given for considering leaving the education profession in the last two years by staff who have experienced pressures on their health and wellbeing
Volume of workload
Not feeling valued
Seeking better work/life balance
Unnecessary paperwork/data gathering
Target-driven culture
Unreasonable demandsfrom managers
Pupil/student behaviour
Mental health concerns
Seeking higher pay
Rapid pace oforganisational change
Physical health concerns
Other
Retiring fromprofession/sector
Don't know
71%
59%
58%
53%
55%
53%
50%
42%40%
41%
35%
35%
31%
30%
27%
27%
24%
25%
21%
4%
5%
1%
0%2%
5%
6%7%
7%
23%
38%
33%
65%
68%77%
64%
78%72%
2019
2018
2017
47
SECTION 2 THE MENTAL HEALTH AND WELLBEING OF EDUCATION PROFESSIONALS
• Volume of workload was the major reason given for considering leaving the profession, with 71% of education professionals citing this (72% in 2018). Workload was also the main reason given in the recent Teacher Omnibus Survey which indicated they were considering leaving the profession in the next 12 months (DfE, 2019b).
• The second most important reason for considering leaving the profession was not feeling valued (by 65%, a new category for 2019).
• Seeking a better work/life balance was also considered important at 64%, although this was a small reduction on 2018 levels (from 68%).
• The other three new categories added for 2019 scored highly, namely dealing with unnecessary paperwork/data gathering (59%), working in a target-driven culture (53%) and a lack of staff and general resources (53%).
• Dealing with pupil/student behaviour showed a small increase, from 40% in 2018 to 42% in 2019.
• The responses to all other reasons reduced in 2019 compared to 2018 – notably citing unreasonable demands from managers (from 55% in 2018 to 50% in 2019), mental health concerns (from 38% to 35%), seeking higher pay (from 31% to 27% in 2019) and the rapid pace of organisational change (from 30% to 25% in 2019).
When a comparison is made between job roles for the 2019 data only:
• Volume of workload was a higher factor for senior leaders (82%), compared to school teachers (70%) and those working in other roles (56%).
• Seeking a better work/life balance was more important for senior leaders (73%), compared to school teachers (65%) and other staff (48%).
• Not feeling valued was a major consideration for those working in other roles (70%), compared to school teachers (66%) and senior leaders (57%) as was the lack of staff/general resources (57% compared to 51% and 49% respectively).
• Dealing with unnecessary paperwork/data gathering was a more important factor for senior leaders (63%) and school teachers (61%) than for staff working in other roles (40%).
• Working in a target-driven culture was more important for senior leaders (61%) leaving the education profession, rather than school teachers (55%) or in other roles (29%).
• Dealing with poor pupil/student behaviour was a bigger factor for school teachers (51%), compared to senior leaders (33%) and those working in other roles (24%).
• Those working in other roles considered leaving to find higher pay (37%), compared to school teachers (25%) and senior leaders (23%).

48
SECTION 2 THE MENTAL HEALTH AND WELLBEING OF EDUCATION PROFESSIONALS
When a comparison of the differences between the 2018 and 2019 is made by job roles:
• As noted above, dealing with pupil/student behavioural issues had become a bigger factor for school teachers. However, when the data for the last three years was examined, it was found that there had been a steady rise in school teachers citing poor pupil/student behaviour (37% in 2017, 44% in 2018 to 51% in 2019), an even larger rise in staff working in other roles citing this (10% in 2017, 12% in 2018 and 24% in 2019), compared to senior leaders (31% in 2017, 38% in 2018 and 33% in 2019).
• Staff working in other roles also showed a number of changes. Seeking a better work/life balance increased by 8% (from 40% in 2018 to 48% in 2019), seeking higher pay increased by 8% (from 29% to 37% in 2019), volume of workload by 6% (50% to 56% in 2019), and mental health concerns by 5% (27% to 32% in 2019). Whereas physical health concerns decreased by 7% (23% to 16% in 2019) and unreasonable demands from managers decreased by 5% (56% to 51% in 2019)
• For senior leaders and school teachers all other the percentage differences decreased from 2018 to 2019.
–The next section will explore the impact of mental health and wellbeing on learners studying and colleagues working in the education sector, the issue of presenteeism and other impacts found.
Reasons given for considering leaving the education profession in the last two years by staff who had experienced pressures on their health and wellbeing - by job role
2019 Base: All education professionals (n = 1,724)2018 Base: All education professionals (n = 675)2017 Base: All education professionals (n = 549)
Volume of workload
Not feeling valued
Seeking better work/life balance
Unnecessary paperwork/data gathering
Target-driven culture
Unreasonable demandsfrom managers
Pupil/student behaviour
Mental health concerns
Seeking higher pay
Rapid pace oforganisational change
Physical health concerns
Other
Retiring fromprofession/sector
Don't know
82%
63%
49%
33%
32%34%
26%
25%
22%
23%
16%
24%
28%
24%
4%
4%
1%
1%1%
5%
3%6%
5%
20%
37%
37%
57%
65%48%
73%
56% 70%
70%66%
61%
61%
40%
51% 57%
55%29%49%
50%51%
51%
Senior Leaders
School Teachers
Other Roles
SECTION 3:
The impact of an individual’s mental health and wellbeing on others studying and working in the education sector

50
a) Time taken off workTaking time off work due to medical symptoms is an important issue for both the individual and their employer. The impact on a school/college would then usually mean that teaching cover would need to be arranged or work assigned to other members of staff. In this way it could be seen as having both a medical health issue for the individual and a cost element for the employer.3
Of those education professionals who suffered from psychological, physical or behavioural problems as a result of work and had to take time off work in 2019:
• Half (50%) were away for a month or more over the academic year (24% for more than a month in total, 19% for up to six months and 7% for over six months).
• There was a decrease in the number of staff taking a day off here and there, from 26% in 2018 to 22% in 2019.
• In 2019, staff working in other roles took the greatest number of single days off work, and senior leaders took the greatest number of days which were more than a week in total over an academic year.
• A large increase has been noted in the number of staff working in other roles being signed-off work for up to six months from 6% in 2018 to 19% in 2019. (NB for clarity this relates only to those who took time off work).
SECTION 3:
The impact of an individual’s mental health and wellbeing on others studying and working in the education sector
This section seeks to build a picture of how the mental health and wellbeing of education professionals impacted on others. It details the time taken off work due to medical symptoms, and how this affected learners studying, and colleagues working, and others outside of education (Section 2 details the impact on individuals themselves). The issue of presenteeism is also addressed.
3 https://www.libdems.org.uk/3750-teachers-england-on-long-term-stress-leave

51
SECTION 3 THE IMPACT OF AN INDIVIDUAL’S MENTAL HEALTH AND WELLBEING ON OTHERS STUDYING AND WORKING IN THE EDUCATION SECTOR
2019 Base: All education professionals (n = 612); senior leaders (n = 100), school teachers (n = 391); other staff (n = 80) 2018 Base: All education professionals (n = 250); senior leaders (n = 52), school teachers (n = 147); other staff (n = 13) 2017 Base: All education professionals (n = 214); senior leaders (n = 38), school teachers (n = 118); other staff (n = 2)
Education professionals who took time off work due to medical symptoms - 2017-2019
In 2017, 3,750 teachers were ‘signed-off’ work on long-term sick leave due to anxiety and mental illness caused by work. This equates to one in every 83 teachers
(Liberal Democrats Freedom of Information Request, 2018)
201720182019
More than a month in total overthe academic year
24%
24%
2%1%1%
7%5%
19%18%
19%
22%
21%
24%26%
26%
More than a week in total overthe academic year
26%25%
A day here and there
Other
9%

52
SECTION 3 THE IMPACT OF AN INDIVIDUAL’S MENTAL HEALTH AND WELLBEING ON OTHERS STUDYING AND WORKING IN THE EDUCATION SECTOR
b) Impact on pupils/studentsIn 2019, all those education professionals who experienced mental health symptoms due to work, and who also taught, considered the impact on pupils/students of them taking time off work due to mental health symptoms was 33% negatively on their studies, 14% negatively on their results, 8% negatively on education professionals own mental health and 43% judged there was no impact. The picture is broadly similar across the years 2017-2019. However, differences were found in perception by job role in 2019:
~ Senior leaders considered such absence would have a negative effect on students’ studies (41%), more than school teachers (35%) or colleagues working in other roles (6%).
~ Senior leaders and school teachers considered it would have a negative effect on results (18% and 16%) compared to staff in other roles (2%).
~ Senior leaders and school teachers considered it might have a negative impact on their own mental health (10% each), compared to staff working in other roles (3%).
~ Staff working in other roles considered any absence would have no impact (63%), compared to school teachers (39%) and senior leaders (38%).
~ Staff working under 40 hours per week, and those working for 0-2 years, were more likely to answer that it would not have an impact on pupils/students.
• There was also a large category of education professionals who did not know if it had an impact on students (16%).
2019 Base: All education professionals (n = 2,266)2018 Base: All education professionals (n = 885)2017 Base: All education professionals (n = 757)Note: only sources with more than 3% of the responses are shown (ie educational professionals were given the opportunity to say it could have had a positive impact, but these were all 3% or less)
2019 Base: All education professionals (n = 2,266); senior leaders (n = 461), school teachers (n = 1,389), other staff (n = 301)Note: only sources with more than 3% of the responses are shown (ie educational professionals were given the opportunity to say it could have had a positive impact, but these were all 3% or less)
The impact on pupils/students of education professionals who took time off due to mental health symptoms - 2017-2019
The impact on students of education professionals who took time off due to mental health symptoms - by job role (2019)
2019 - All
2018 - All
2017 - All
No impact43%
0%
8%9%
14%15%15%
33%36%
39%
41%46%
Negative impacton their studies
Negative impacton their results
Negative impacton their own
mental healthSenior leaders
School Teachers
Other roles
No impact
10%10%
3%
Negative impacton their studies
Negative impacton their results
Negative impacton their own
mental health
38%
2%
18%16%
6%35%
41%
63%39%

53
SECTION 3 THE IMPACT OF AN INDIVIDUAL’S MENTAL HEALTH AND WELLBEING ON OTHERS STUDYING AND WORKING IN THE EDUCATION SECTOR
c) Impact on colleaguesWhen a staff member had time off work, there was an impact on colleagues too as often cover for lessons had to be provided which was often by senior leaders and school teachers. Schools could also arrange for a supply teacher to be employed, especially if it related to a longer period of absence:
• As with the expected impact on pupils/students above, taking time off work for mental health issues was generally seen to have either no impact by 35% of staff who had experienced mental health problems due to work and who taught.
• Under a third (30%) considered it would have a negative impact on working relationships.
• There was a significant rise in the number of staff thinking it would have a negative impact on team morale (from 15% in 2018 to 32% in 2019) – more senior leaders cited this (40%), than school teachers (30%) or staff working in other roles (28%).
2019 Base: All education professionals (n = 2,273)Note: only sources with more than 3% of the responses are shown (ie educational professionals were given the opportunity to say it could have had a positive impact, but these were all 3% or less)
2019 Base: All education professionals (n = 2,266)Note: only sources with more than 3% of the responses are shown (ie educational professionals were given the opportunity to say it could have had a positive impact, but these were all 3% or less)
The impact on colleagues of education professionals who took time off work due to mental health symptoms
The impact on colleagues of educational professionals who took time off work due to mental health symptoms - 2019

54
d) Impact of presenteeismPresenteeism is a term used to describe people coming into work even when they are ill. A question about presenteeism was included in this Index to find ascertain the levels of staff presenteeism in schools, as this has both an impact on the individual who is unwell but also on colleagues (allied to both of the previous sections in this Index).
• It was found that 49% of education professionals felt compelled to come to work all of the time even if they were unwell, and 93% would come into work all, most or some of the time.
• Senior leaders were the members of staff who felt the most compelled to always come to work (59%), compared to school teachers (50%) and staff in other roles (39%).
• A small percentage of staff working in other roles (7%) would never come into work if ill, compared to senior leaders (4%) and school teachers (3%) .
• Staff who worked for more than 60 hours per week felt they always had to come into work when ill.
There appeared to be a link between presenteeism and stress. Section 1e) found that nearly three-quarters of education professionals considered themselves to be stressed.
• Of those who were stressed, more than half (56%) would always turn up for work when ill, and more than three-quarters (86%) would turn up as much as possible (‘most’ or ‘all’ of the time).
• Of those who were not stressed, more than a quarter (29%) would always turn up for work when ill, and more than half (62%) would turn up as much as possible (‘most’ or ‘all’ of the time).
It has been suggested that the estimated cost to UK employers of mental health related presenteeism is between £16.8-£26.4bn (Deloitte MCS Ltd, 2017).
2019 Base: All education professionals (n = 2,984) 2019 Base: All education professionals (n = 2,984)
The impact of presenteeism - 2019 Comparison of the levels of stress felt from working with presenteeism - 2019
Yes, always59%
7%
27%
28%31%
50%39%
4%3%
8%13%
20%
Yes, most ofthe time
Yes, some ofthe time
No, never
4%
1%2%
Not applicable -I never really
feel unwellSenior leaders
School Teachers
Other roles
Yes, always
Yes, most ofthe time
Yes, some ofthe time
No, never
Not applicable -I never really
feel unwell
Not stressedStressed
32%30%
21%11%
2% 10%
Don’t know 0%
1%
1%
6%
29%56%
SECTION 3 THE IMPACT OF AN INDIVIDUAL’S MENTAL HEALTH AND WELLBEING ON OTHERS STUDYING AND WORKING IN THE EDUCATION SECTOR

55
SECTION 3 THE IMPACT OF AN INDIVIDUAL’S MENTAL HEALTH AND WELLBEING ON OTHERS STUDYING AND WORKING IN THE EDUCATION SECTOR
e) Other impactSection 2c) noted that in 2019 78% of educational professionals experienced at least one symptom due to work where work was a contributing factor. In 2019, at work, this caused their work performance to suffer, (51%), their work relationships to suffer (29%), led to taking time off work (28%), leaving their job (14%) or feeling suicidal (11%).
When education professionals experienced mental health issues at work, this could have an impact on both their work and work environment, but also on others outside of work.
Examples include the people they have personal relationships with which could cause these relationships to suffer (46%) or to break down (8%).
2019 Base: All education professionals (n = 2,239)2018 Base: All education professionals (n = 883)2017 Base: All education professionals (n = 757)
The impact of educational professionals experiencing psychological, physical or behavioural problems as a result of work
201720182019
51%
3%4%
3%
8%8%
11%
19%
14%
11%11%
14%13%
13%
18%20%
29%
28%28%28%
27%25%
48%
46%
46%
49%
49%
None of these
I had to leave my job
I felt suicidal
My personal relationshipsbroke down
Other

56
–The next section will explore the mental health and wellbeing support and guidance available to staff working in the education sector.
When looking at this by job role:
• More than half (51%) of senior leaders stated that both their work performance and their personal relationships suffered.
• Half of school teachers (50%) stated their work performance suffered, with just under half (47%) stating their personal relationships suffered.
• Nearly half (49%) of staff working in other role stated their work performance suffered, but fewer (35%) that their personal relationships suffered.
• There was a large difference between feeling this would lead to them leaving their job, where 17% of teachers thought this compared to 9% of senior leaders and 9% of staff working in other roles.
• Staff working more than 41 hours per week suffered from more problems with their personal relationships than those working 40 hours per week or less.
• Although fewer staff working in other roles stated they felt suicidal (6%) when compared to senior leaders or school teachers (both 12%), this has increased from 0% in 2017 and 1% in 2018.
2019 Base: All education professionals (n = 2,239); senior leaders (n = 460), school teachers (n = 1,371); other staff (n = 294)
The impact of educational professionals experiencing psychological, physical or behavioural problems as a result of work - 2019
In the period 1 April 2018 to 31 March 2019 there were 561 callers to Education Support’s free helpline clinically assessed as being at risk of suicide. This is a 57% increase on the previous year
(Education Support, 2019)
201720182019
51%
0%1%2%
9%
8%8%
4%3%
2%4%
9%
20%22%
18%
17%
12%12%
6%
22%30%
30%30%
27%
25%
51%50%
49%
47%35%
I felt suicidal
None of these
I had to leave my job
My personal relationshipsbroke down
Other
Refused
SECTION 3 THE IMPACT OF AN INDIVIDUAL’S MENTAL HEALTH AND WELLBEING ON OTHERS STUDYING AND WORKING IN THE EDUCATION SECTOR

SECTION 4:
The mental health and wellbeing support and guidance available to staff working in the education sector

58
a) Who education professionals spoke to first at work about mental health issues• In 2019, a third of education
professionals (32%) would turn to somebody outside of work first if they experienced mental health issues at work, which is the same as found in 2018. Thereafter they would speak to a colleague (25%) or their line manager (10%). However, more than a quarter (27%) of respondents would not speak to anybody about it.
• The data is broadly consistent across the years 2017-2019.
• Differences in who staff would approach first were found by job role. School teachers (34%) and senior leaders (33%) would turn first to somebody outside of work compared to staff working in other roles (25%) who would turn first to their line manager for advice (15%), compared to senior leaders (10%) or school teachers (8%).
SECTION 4:
The mental health and wellbeing support and guidance available to staff working in the education sector
This section focuses on what support education professionals who had experienced mental health issues accessed and their perceptions of the wider support on offer. Areas covered are who staff talked to first about any issues, how confident they felt in sharing their concerns at work, the guidance/help which was available, the levels of support received and how it could be improved. The availability of health and wellbeing policies is detailed, together with how staff wellbeing was monitored and if the support available was affected by their perception of available education budgets.
2019 Base: All education professionals (n = 2,266)2018 Base: All education professionals (n = 885)2017 Base: All education professionals (n = 757)
Who education professionals who experienced mental health issues at work spoke to first
201720182019
Somebody outside of work32%
2%
2%
1%
1%
1%1%
3%3%3%
10%12%
8%
25%25%
27%
27%
26%24%
32%36%
I did not speak to anybody about it
Colleague
Line Manager
Other
Employee A ssistance Programme

59
SECTION 4 THE MENTAL HEALTH AND WELLBEING SUPPORT AND GUIDANCE AVAILABLE TO STAFF WORKING IN THE EDUCATION SECTOR
2019 Base: All education professionals (n = 608)2018 Base: All education professionals (n = 48)2017 Base: All education professionals (n = 49
As noted above, 27% of education professionals in 2019 would not speak to anyone at work about mental health issues.
• More than a third felt it would negatively affect people’s perception of that person (39%). This was a small increase on the 2018 data (37%).
• Other reasons were that they preferred to seek support from people outside of work (30%, a 7% increase on the 2018 data), or that it would be seen as a sign of weakness (29%, a 7% decrease on the 2018 data).
• A new category was added for 2019, namely that there was a perceived stigma (eg a feeling of shame) which
stops the member of staff from talking to anyone at work. This was found to be the case for 26% of staff. Senior leaders (31%) and school teachers (26%) were found to experience this more than staff working in other roles (23%).
• There was also the feeling that others would not be supportive (19%, a 5% decrease on the 2018 data), or that people at work have been the cause of their difficulties in the past (19%, a 4% increase on the 2018 data).
• Senior leaders (38%) and school teachers (30%) were more concerned about it being perceived as a sign of weakness than staff working in other roles (19%).
Education professionals who said they did not speak to anyone at work - why that was

60
b) Confidence in sharing unmanageable stress/mental health issues at work• Confidence in disclosing unmanageable
stress or mental health issues appeared to have increased a little. In 2019, one third (34%) of education professionals felt confident to do this, compared to 31% in both 2018 and 2017.
• The increases in confidence were found to be by senior leaders (6% increase) and school teachers (4% increase), whereas staff working in other roles showed a decrease (2% decrease).
• However, there was still a large percentage of education professionals (60%) who would not feel confident in such disclosure, although this has reduced by 5% from both 2018 and 2017.
• For those educational professionals who did share their stress or mental health issue at work (either to someone at work or someone out of work), the greatest benefit felt was that it gave the person a perspective and helped them to realise they were not alone (55%, which is a 7% increase on the 2018 data).
• Other benefits included restoring the person’s confidence in their abilities (31%), equipping them with practical advice (25%), enabling them to seek professional support (18%), or gaining permission to seek help/removed the stigma (10%).
• More than one tenth (12%) of education professionals said it did not help.
SECTION 4 THE MENTAL HEALTH AND WELLBEING SUPPORT AND GUIDANCE AVAILABLE TO STAFF WORKING IN THE EDUCATION SECTOR
2019 Base: All education professionals (n =1,658)2018 Base: All education professionals (n = 657)2017 Base: All education professionals (n = 572)
2019 Base: All education professionals (n = 3,019)2018 Base: All education professionals (n = 1,187)2017 Base: All education professionals (n = 987)
How confident education professionals were in disclosing unmanageable stress or mental health to their employer
Education professionals who spoke to someone at work or outside work and how this helped
Don’t know
2017
66%
31%
4%
2018
66%
31%
5%
2019
60%
34%
6%
201720182019
It gave me perspectiveand helped me realise
I am not alone
55%54%
48%
31%30%30%
25%22%25%
18%19%
17%
12%11%13%
10%9%11%
It equipped me withpractical advice
It enabled me to seekprofessional support
I don’t think it helped
I gained permissionto seek help/it
removed the stigma

61
c) Mental health and wellbeing guidance available at work• The ability to feel confident in sharing
mental health and wellbeing issues at work could be related to the guidance which is available to staff.
• Less than one-third (31%) of education professionals felt that they had sufficient guidance about their mental health and wellbeing at work. However, the situation has improved by 5% from 2018 when 26% felt they had sufficient guidance.
• There was a corresponding 5% decrease on the number who responded that they did not receive sufficient guidance (from 74% in 2018 to 69% in 2019).
• Education professionals working in other roles (40%) were more likely to feel they had sufficient guidance compared to senior leaders (32%) or teachers (28%), as did those working less than 40 hours per week.
• Staff members who considered themselves to be stressed were more likely to feel they did not have sufficient guidance compared to those who were not stressed.
SECTION 4 THE MENTAL HEALTH AND WELLBEING SUPPORT AND GUIDANCE AVAILABLE TO STAFF WORKING IN THE EDUCATION SECTOR
2019 Base: All education professionals (n = 1,669)2018 Base: All education professionals (n = 657)2017 Base: All education professionals (n = 572)
Did education professionals feel they had received sufficient guidance about their health and wellbeing at work? 2017-2019
2019
Yes
No
2018 2017
69%
31%Yes
No74%
26%Yes
No75%
25%

62
d) Levels of support received at work• Less than half (41%) of education
professionals felt that their organisations supported staff who had mental health problems well. However, this has increased by 7% increase from 34% in 2018.
• There was a corresponding decrease in the number of staff who felt their organisations did not support them well, from 53% in 2018 to 43% in 2019, with an increase of 3% of staff replying they did not know.
• More staff working in other roles considered their organisation supported staff well with mental health problems (49%), compared to senior leaders (45%) or school teachers (38%).
• Staff who considered themselves to be stressed were less likely to say their organisations supported them well.
• Staff who worked less than 40 hours per week were more likely to say their organisations supported them well.
2019 Base: All education professionals (n = 3,019)2018 Base: All education professionals (n = 1,187)2017 Base: All education professionals (n = 987)
How well edication professionals felt their organisation supported employees who experienced mental health and wellbeing problems
From 1 April 2018 to 31 March 2019 our Employee Assistance Programme dealt with 3,974 cases from education staff - a 41% increase on the previous year
(Education Support, 2019)
Well Not very well Don’t know
2018 53%34%
2017 46%36%
2019 43%41%
13%
18%
16%
SECTION 4 THE MENTAL HEALTH AND WELLBEING SUPPORT AND GUIDANCE AVAILABLE TO STAFF WORKING IN THE EDUCATION SECTOR

63
e) The help available at work• Access to all the possible areas of
support identified increased in 2019 compared to 2018, with an 8% reduction in those answering they had none available.
• The two most popular forms of support were access to Employee Assistance Counselling Services (which increased by 6% from 21% in 2018 to 27% in 2019), and union people who could be talked to (which increased from 25% in 2018 to 27% in 2019).
• Other notable increases were the feeling of encouragement to speak up when struggling which increased by 5% from 18% in 2018 to 23% in 2019, having HR people who could be talked to which increased by 2% from 17% in 2018 to
19% in 2019, and access to exercise classes, groups or programmes which increased by 5% from 9% in 2018 to 14% in 2019.
• Putting on exercise classes, groups or programmes also increased from 9% in 2018 to 14% in 2019, and mindfulness classes or programmes from 9% in 2018 to 12% in 2019.
• Access to Mental First Aid Training increased by 6% from 6% in 2018 to 12% in 2019.
• In most cases, school teachers rated the availability of help at work lower than senior leaders or staff working in other roles.
SECTION 4 THE MENTAL HEALTH AND WELLBEING SUPPORT AND GUIDANCE AVAILABLE TO STAFF WORKING IN THE EDUCATION SECTOR
2019 Base: All education professionals (n = 3,019)2018 Base: All education professionals (n = 1,187)2017 Base: All education professionals (n = 987)
Different kinds of mental health support that education professionals reported were available to them at work
201720182019
None of these28%
14%
12%
12%
11%
10%8%8%
9%
9%
9%
6%
6%
6%
6%
6%5%
4%4%4%
3%
3%
5%
23%18%
17%18%
27%25%25%
27%21%
21%
19%
19%
36%36%
12%9%
8%
4%2%
Union people we can talk to
Employee assistance counselling services
Encouragement to speak up when we’re struggling
Exercise classes, groups or programmes
Mindfulness classes or programmes
Mentoring/co-worker support schemes
Mental Health First Aid training
Training on common mental health conditions
Reslilience, energy or stress management classes or programmes
Other
Massage or relaxation classes or programmes

64
f) How educational institutions could improve the mental health and wellbeing of their workforce• When asked how the mental health
and wellbeing of the workforce could be improved, the issue of managers working with their staff to reduce workload was highlighted by more than half of education professionals (53%). This was consistent with findings in previous years (53% in 2019 and 54% in 2017). NB Section 1b) also found that workload continued to be the major aspect of working in education which professionals disliked.
• Workload issues affected senior managers and school teachers (62% and 54%), compared to staff in other roles (39%).
• The second and third categories were both related to management issues. The first improvement suggested was that any changes could be better communicated by managers to staff (35% in both 2019 and 2018, and 31% in 2017) and the second suggested that the leadership team should be more approachable (30% in 2019, 29% in 2018 and 32% in 2017).
• The need for employers to implement a structured health and wellbeing programme rose slightly from 27% in 2017, to 28% in 2018 and 29% in 2019.
• Employers offering flexible working hours to fit in with other commitments also became a little more important (rising from 25% in 2017, to 26% in 2018 and 28% in 2019).
• Staff wanting employers to have a well-implemented pupil/student behaviour policy was important to 27% of professionals, with a slight reduction from 2017 and 2018 levels (at 29%.
• The same number, 27%, would like their employers to have to meet high standards of health and wellbeing provision for staff, regulated by an independent body, which increased slightly from 2018 (25%).
• The category of answer which had the largest increase from 2018 related to the need for colleagues to be more understanding and accommodating of each other’s needs and feelings. This rose from 21% in 2018 to 25% in 2019.
SECTION 4 THE MENTAL HEALTH AND WELLBEING SUPPORT AND GUIDANCE AVAILABLE TO STAFF WORKING IN THE EDUCATION SECTOR
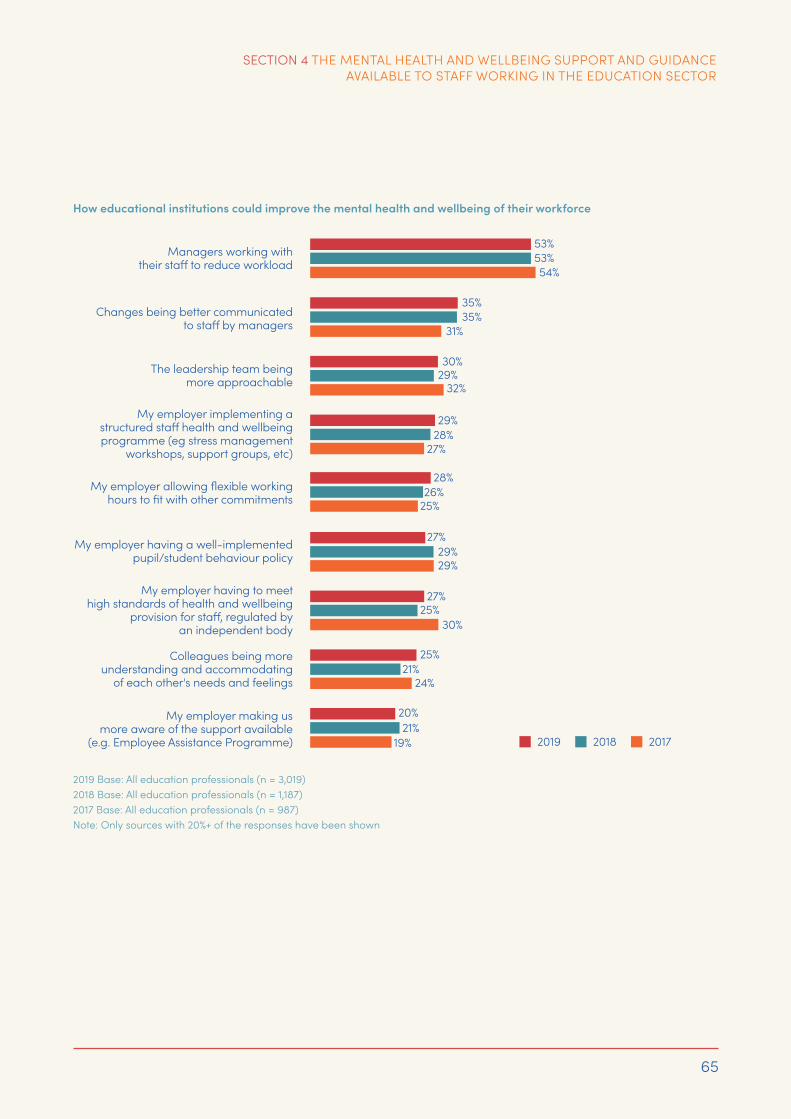
65
SECTION 4 THE MENTAL HEALTH AND WELLBEING SUPPORT AND GUIDANCE AVAILABLE TO STAFF WORKING IN THE EDUCATION SECTOR
2019 Base: All education professionals (n = 3,019)2018 Base: All education professionals (n = 1,187)2017 Base: All education professionals (n = 987)Note: Only sources with 20%+ of the responses have been shown
How educational institutions could improve the mental health and wellbeing of their workforce

66
g) Mental health and wellbeing policies and their implementation• Having a mental health and wellbeing
policy for staff was often seen as the first step to its implementation in the education sector. In 2019, 44% had a policy, which is an 8% increase on 2018 levels (36%). The number without a policy was 13% in 2019, a 3% decrease on 2018 levels. Those who did not know if they had a policy or not decreased by 5%, from 48% in 2018 to 43% in 2019.
• Staff members working in other roles were more likely to know their organisation had a policy (53%), compared to senior leaders (44%) and school teachers (40%).
• Those staff with a tenure of 31+ years were more likely to know their organisation had such a policy, compared to those of less tenure.
2019 Base: All education professionals (n = 3,019)2018 Base: All education professionals (n = 1,187)2017 Base: All education professionals (n = 987)
Education professionals’awareness that their organisation had a current/recent staff health and wellbeing policy
2019
Yes
Don’tknow
No
44%
13%
43%Don’tknow
2017
No
15% Yes38%
47%
2018
Yes
Don’tknow
No
36%
16%
48%
SECTION 4 THE MENTAL HEALTH AND WELLBEING SUPPORT AND GUIDANCE AVAILABLE TO STAFF WORKING IN THE EDUCATION SECTOR

67
• Of those education professionals who said their organisations had a staff health and wellbeing policy, 70% considered it was properly implemented always, most or some of the time in 2019 (compared to 65% in 2018). However, of the 70%, only 9% considered it was always properly implemented (compared to 6% in 2018).
• Less than a fifth (17%) said it was never implemented (a reduction of 5% from 2017), and 13% did not know.
SECTION 4 THE MENTAL HEALTH AND WELLBEING SUPPORT AND GUIDANCE AVAILABLE TO STAFF WORKING IN THE EDUCATION SECTOR
2019 Base: All education professionals who had a policy (n = 1,253)2018 Base: All education professionals who had a policy (n = 426)Note: 2017 data excluded as the category ‘some of the time’ category was not available
The extent to which education professionals felt that staff health and wellbeing policies were properly implemented

68
–The next section uses a measure (the Warwick-Edinburgh Mental Wellbeing Scale) to gauge the mental health of education professionals.
h) How educational institutions monitored staff mental health and wellbeing• In 2019, one third (33%) of education
professionals reported that their education institutions regularly surveyed their staff to establish levels of employee wellbeing. This is a rise of 9% on 2018 levels (24%). There was a corresponding 9% decrease in those who did not survey their staff from 63% in 2018 to 54% in 2019.
• Those organisations which had a wellbeing policy were more likely to monitor levels of employee wellbeing than those which did not have a policy.
i) The perceived financial resources available to help staff mental health and wellbeingEducation professionals were asked if their education institutions had the budgets/resources which could be used for staff wellbeing. It was found that only one-fifth (20%) did, but this represents a 4% increase on 2018 data. There was a similar response across both years for the negative answer, but a 3% decrease in those who said they did not know.
2019 Base: All education professionals (n = 3,019)2018 Base: All education professionals (n = 1,187)
2019 Base: All education professionals (n = 3,019)2018 Base: All education professionals (n = 1,187)
Education professionals' perception of whether their institution regularly surveyed staff to establish levels of employee wellbeing
Education institutions having budgets/resources which could be used for staff wellbeing
Yes No Don’t know
2019
33%
13%
54%
2018
24%
12%
63%
Yes No Don’t know
2019
20%
45%
35%
2018
16%
49%
36%
SECTION 4 THE MENTAL HEALTH AND WELLBEING SUPPORT AND GUIDANCE AVAILABLE TO STAFF WORKING IN THE EDUCATION SECTOR

SECTION 5:
Using the Warwick-Edinburgh Mental Wellbeing Scale to measure mental wellbeing in the education sector

70
Recent national studies include5:
SECTION 5:
Using the Warwick-Edinburgh Mental Wellbeing Scale to measure mental wellbeing in the education sector
The Warwick-Edinburgh Mental Wellbeing Scale4 (WEMWBS) is a measure used by many different organisations, including Governments, to gauge the mental wellbeing of a population and, for the first time, it has been included as part of this Index.
Project Organisation Research focus
HEALTH SURVEY FOR ENGLAND – WELLBEING AND MENTAL HEALTH (2016)
NHS Digital The overall prevalence of wellbeing and probable mental ill health, with comparisons by sex, age, region, household income and deprivation, as well as lifestyle factors, physical activity and Body Mass Index (BMI).
NATIONAL SURVEY FOR WALES (2016-2017)
Welsh Government Covers a range of topics such as wellbeing and people’s views on public services
SCOTTISH HEALTH SURVEY (2017)
Scottish Government To monitor progress towards the National Indicators of healthy life expectancy, mental wellbeing, healthy weight, health risk behaviours, physical activity, child wellbeing and food insecurity

71
SECTION 5 USING THE WARWICK-EDINBURGH MENTAL WELLBEING SCALE TO MEASURE WELLBEING IN THE EDUCATION SECTOR
The 14 items covering the feeling and functioning aspects of mental wellbeing are:
WEMWBS is a self-administered questionnaire where respondents are asked to read the 14 items (shown below) and select an answer from a 5-point Likert scale which best reflects their experience of each over the preceding two weeks. The options for selection are ‘none of the time’, ‘rarely’, ‘some of the time’, ‘often’ and ‘all of the time’.
The answers are then summed to provide a single score ranging from 14-70 and aggregated to form the score. The greater the score the higher the indication of their mental wellbeing.
5 Warwick-Edinburgh Mental Wellbeing Scale (WEMWBS) © NHS Health Scotland,University of Warwick and University of Edinburgh, 2006, all rights reserved.6Links to the studies can be found in the references section at the back of this report
_1
I’ve been feeling optimistic about the future
_2 I’ve been feeling useful
_3 I’ve been feeling relaxed
_4 I’ve been feeling interested in other people
_5 I’ve had energy to spare
_6 I’ve been dealing with problems well
_7 I’ve been thinking clearly
_8 I’ve been feeling good about myself
_9 I’ve been feeling close to other people
_10 I’ve been feeling confident
_11 I’ve been able to make up my own mind about things
_12 I’ve been feeling loved
_13 I’ve been interested in new things
_14 I’ve been feeling cheerful

72
SECTION 5 USING THE WARWICK-EDINBURGH MENTAL WELLBEING SCALE TO MEASURE WELLBEING IN THE EDUCATION SECTOR
Teacher Wellbeing Index (2019) WEMWBS score compared to the national picture
Teacher Wellbeing Index (2019) WEMWBS score compared to other wellbeing studies in education
Teacher Wellbeing Index 2019 – WEMWBS score observations
• The overall WEMWBS score for education professionals in the Teacher Wellbeing Index was 44.7.
• When the Teacher Wellbeing Index score of 44.7 is compared to the published national indicators for the general population, the mental wellbeing of professionals working in education was found to be considerably lower. The general population scores were:
~ England 49.856 (NHS Digital, 2017)
~ Scotland 49.80 (Scottish Government, 2017)
~ Wales 50.9 (Welsh Government, 2019).
• Two recent academic studies have also examined wellbeing in education using WEMWBS scores. These studies have also both found the scores to be lower than the general population. The scores were:
~ 46.81 in the Wellbeing in Secondary Education (WISE)7 project, which involved 1,182 secondary school teachers in England and Wales (Harding et al, 2019)
~ 47.2 in a different study, which involved 555 secondary teachers in England (Kidger et al, 2016).
The chart below details the answers given to each question for the total population. It can be seen that education professionals rated:
• Two items with the highest score relating to their wellbeing, namely ‘being able to make up their own minds about things’ and ‘feeling loved’
• Two items with the lowest score relating to their wellbeing, namely ‘having energy to spare’ and ‘feeling relaxed’
6Calculated by taking the mean of the data relating to men (50.1) and women (49.6)7https://www.bristol.ac.uk/population-health-sciences/projects/wise/
These observations are based on education professionals selecting either ‘all of the time’ option, or when ‘all of the time’ and the ‘often’ options are combined.

73
SECTION 5 USING THE WARWICK-EDINBURGH MENTAL WELLBEING SCALE TO MEASURE WELLBEING IN THE EDUCATION SECTOR
2019 Base: All education professionals (n = 3,019)
The Warwick-Edinburgh Mental Health Scale – Total Population Scores

74
SECTION 5 USING THE WARWICK-EDINBURGH MENTAL WELLBEING SCALE TO MEASURE WELLBEING IN THE EDUCATION SECTOR
–As noted above, the data is reasonably consistent across all demographic groups. The only possible exception relates to education staff aged 50+ being the most positive (at roughly twice the standard deviation).
Teacher Wellbeing Index (2019) WEMWBS scores – analysis by demographic group The Sample Profile in Appendix A lists the WEMWBS scores for each of the demographic groups in this Index. As will be seen, the scores are reasonably consistent across all demographic groups. However, when analysed further some differences can be found, as follows:
JOB ROLE The highest score was 45.70 for those working in Other Roles. School Teachers and Senior Leaders both scored the same at 44.4. The weighted average across all job roles was 44.67, with a standard deviation of 0.53.
- Some indication that those working in Other Roles were the most positive
PHASE OF EDUCATION The highest score was 46.3 for those working in Early Years, and the lowest was 44.0 for those working in Sixth Form Colleges. The weighted average across all phases was 44.68, with a standard deviation of 0.33.
- Those working in Early Years were the most positive, and those working in Sixth Form Colleges and Other Sectors were the most negative
REGION If all the regions are taken together (including Scotland, Wales and Northern Ireland), the highest score was 46.40 for Wales, and the lowest was 43.40 for North West England. The weighted average across all regions was 44.67, with a standard deviation of 0.92.
– Those working in Wales, South East England and the East of England were the most positive, and those working in North West England and the West Midlands were the most negative. NB: See also the regional comparisons of key indicators diagram at the front of this report.
GENDER Females had a score of 45.0 and males 43.9. The weighted average was 44.68, with a standard deviation of 0.50.
– Males were the most negative.
AGE The highest score was 45.90 for age 50+ and the lowest was 44.10 for age 18-34. The weighted average across all ages was 44.69, with a standard deviation of 0.66.
– Those aged 50+ were the most positive.
LENGTH OF TIME WORKING IN EDUCATION
The highest score was 45.90 for those working 31+ years, and the lowest was 44.10 for those working 6-10 years. The weighted average across time worked was 44.67, with a standard deviation of 0.48.
– Those working for 31+ and 0-2 years were the most positive.

Conclusions and recommendations

76
Conclusions and recommendationsEducation Support is committed to supporting the mental health and wellbeing of all professionals working in the education sector. This Index has been produced over the past three years, in partnership with YouGov, to provide a robust and comprehensive contribution to the growing evidence base in this area, which affords the ability to analyse trends over time.
There were six key observations taken from this year’s report:
a) Stress levels have increased for a third consecutive year Nearly three-quarters (72%) of education professionals described themselves as stressed, which can often be linked to undertaking long working hours and dealing with challenging classroom behaviour. Stress levels have risen noticeably when compared to both 2018 and 2017, with senior leaders experiencing the highest stress levels (p 26).
b) Workload remains the most important work-related factor determining wellbeingWorkload remained the major aspect of working in education which professionals disliked and, if changed, would most improve employee wellbeing and their work/life balance. Despite this, there was a noticeable reduction in staff working long hours on weekdays and over weekends (p 25).
c) The wellbeing of education professionals is lower than the general populationCompared to the published national indicators for the general population, the WEMWBS score for education professionals was found to be noticeably lower (p 72).
d) Disclosing mental health issues requires improvementEducation professionals who worked for between 3-10 years reported the most mental health issues. One third (34%) of education professionals felt confident in disclosing unmanageable stress or mental health issues to their employers, compared to 31% in both 2018 and 2017. However, there was still a large percentage of education professionals (60%) who would not feel confident in such disclosure, and 6% who don’t know (p 60).
e) Support levels have improved, although are still not commonplaceLess than half (41%) of education professionals felt that their organisations supported staff who had mental health problems well. However, this had increased by 7% from 34% in 2018. Access to external support services, such as Employee Assistance Counselling Services improved (which increased by 6% from 21% in 2018 to 27% in 2019).
f) Staff retention and stress appear to be closely linkedMore than half (57%) of all staff had considered leaving the sector in the past two years because of health pressures. Senior leaders were more likely than those in teaching or other roles to have considered leaving and, of those who had considered leaving, stress was an issue, as it was for those staff working 41+ hours per week (p 45).
CONCLUSIONS AND RECOMMENDATIONS

77
RecommendationsA strong education system depends on the wellbeing of those who work in it.
The findings of this report highlight the need for action at a policy, organisational and individual level. We offer six key recommendations.
_1 Educational reforms should promote increased levels of trust and autonomy for educators, demonstrating that staff are valued. This will improve self-esteem and wellbeing across the sector, with a positive impact on recruitment, retention and pupil outcomes.
_2 Accountability systems need to continue to evolve in a way that builds teacher efficacy and development, as opposed to unproductive tension and anxiety.
_3 Overwork has become normalised across education. Healthy working practices and boundaries need to become the new, celebrated norm. With improved levels of health, teachers will be more physically and emotionally present to learners.
_4 School and college leaders must be funded (and assisted) to shape supportive, relational workplaces. Positive workplaces support better wellbeing.
_5 All senior leaders should have access to personal and peer support. Tackling the level of chronic stress reported among this group should be made a priority.
_6 Every member of staff should have access to professional and confidential emotional support, through an Employee Assistance Programme (or equivalent service). This can help resolve issues and effectively support education professionals to manage their mental health and wellbeing.
AcknowledgementsThis report has been written by Dr Carol Savill-Smith.
We would like to thank colleagues at Education Support for all their help and assistance with this report. Particular thanks also goes to Elaine Odlin for the design of this report. And finally, we would like to thank Ian Neale and Laura Piggott from YouGov.
CONCLUSIONS AND RECOMMENDATIONS

78
References
Allen, R et al (2019). “New evidence on teachers’ working hours in England - An empirical analysis of four datasets”. September 2019. https://johnjerrim.files.wordpress.com/2019/09/working_paper_teacher_hours.pdf
BITC (2018). “Mental Health at Work 2018 Report”. 8 October 2018. https://wellbeing.bitc.org.uk/all-resources/research-articles/mental-health-work-report-2018
CIPD (2019). “UK Working Lives – The CIPD Job Quality Index”. June 2019. https://www.cipd.co.uk/knowledge/work/trends/uk-working-lives
Deloitte MCS Ltd (2017). "Monitor Deloitte - Mental Health and Employers: The case for investment". Supporting study for the Independent Review. October 2017. https://www2.deloitte.com/content/dam/Deloitte/uk/Documents/public-sector/deloitte-uk-mental-health-employers-monitor-deloitte-oct-2017.pdf
DfE (2019a). "Teacher Workload Survey 2019". Walker, M, Worth, J, Van den Brande (authors), National Foundation for Educational Research. DfE reference RR951. http://www.gov.uk/government/publications
DfE (2019b). "NFER Teacher Voice Omnibus Survey - STRB Sponsored Questions". https://assets.publishing.service.gov.uk/government/uploads/system/uploads/attachment_data/file/838862/NFER_Teacher_Voice_survey_2019_Summary.pdf
Education Support (2019). “Helpline Annual Report 2018-2019”. https://www.educationsupportpartnership.org.uk/resources/research-reports/helpline-annual-report-201819
EPI (2019). “What the latest TALIS results mean for England’s teacher recruitment crisis”. 19 June 2019. https://epi.org.uk/publications-and-research/talis-teacher-recruitment/
Harding et al (2019). “Is teachers’ mental health and wellbeing associated with students’ mental health and wellbeing?” 242, 180-187. https://www.sciencedirect.com/science/article/pii/S0165032718301733.
HSE (2018). Health & Safety Executive - Work related stress depression or anxiety statistics in Great Britain, 2018. 31 October 2018. http://www.hse.gov.uk/statistics/causdis/stress.pdf
Kidger, J et al (2016). “Teachers’ wellbeing and depressive symptoms, and associated risk factors: A large cross-sectional study in English secondary schools”. Journal of Affective Disorders, 192: 76-82.
NHS Digital (2017). Health Survey for England – Wellbeing and Mental Health (2016). 13 December 2017. http://healthsurvey.hscic.gov.uk/media/63763/HSE2016-Adult-wel-bei.pdf.
Ofsted (2019). Teacher well-being at work in schools and further education providers. July 2019. Reference number 190034. https://assets.publishing.service.gov.uk/government/uploads/system/uploads/attachment_data/file/819314/Teacher_well-being_report_110719F.pdf
Sainsbury Centre for Mental Health (2007). “Mental Health at Work: Developing the Business Case”. Policy Paper 8. December 2007. https://www.centreformentalhealth.org.uk/sites/default/files/2018-09/mental_health_at_work.pdf
Scottish Government (2018). “The Scottish Health Survey, 2017”. September 2018. Volume 1, Main Report. https://www.gov.scot/publications/scottish-health-survey-2017-volume-1-main-report/
Welsh Government (2019). “National Survey for Wales”. StatsWales. 28 June 2019. https://gov.wales/national-survey-wales.
Worth, J et al (2019). “Teacher Workforce Dynamics in England – Nurturing, Supporting and Valuing Teachers”. October 2018. National Foundation for Educational Research. https://www.nfer.ac.uk/media/3111/teacher_workforce_dynamics_in_england_final_report.pdf

Appendix A

80
Sample profile
A total of 3019 responses were received to the overall survey. All respondents were drawn from the YouGov panel of people that have signed up to undertake research with YouGov. The data has been weighted to be representative of the wider education population by phase, institution, type and respondent age to ensure generalisations can be made to the wider education population. The table below provides a summary of the achieved sample profile by key demographics and mean WEMWBS scores.
APPENDIX A
ROLE NUMBER PROPORTION WEMWBS SCORE (MEAN)
Senior leaders 514 17% 44.4
Teachers/lecturers 1937 64% 44.4
Other roles 568 19% 45.7
PHASE NUMBER PROPORTION WEMWBS SCORE (MEAN)
Early years 60 2% 46.3
Primary 973 32% 44.7
Secondary 997 33% 44.8
Sixth Form College 188 6% 44.0
Further 557 18% 44.5
Adult 115 4% 45.1
Vocational 17 1% 45.1
Other 112 4% 44.2
REGION NUMBER PROPORTION WEMWBS SCORE (MEAN)
North East 146 5% 44.3
North West 380 13% 43.4
Yorkshire and the Humber 289 10% 44.3
East of England 240 8% 45.6
West Midlands 283 9% 43.6
East Midlands 226 7% 44.0
London 313 10% 45.0
South East 433 14% 45.8
South West 297 10% 45.4
Wales 140 5% 46.4
Scotland 239 8% 44.0
Northern Ireland 33 1% 44.6
GENDER NUMBER PROPORTION WEMWBS SCORE (MEAN)
Male 879 29% 43.9
Female 2140 71% 45.0
AGE NUMBER PROPORTION WEMWBS SCORE (MEAN)
18-34 847 28% 44.1
35-49 1523 50% 44.5
50+ 649 21% 45.9
LENGTH OF TIME WORKING IN EDUCATION NUMBER PROPORTION WEMWBS SCORE (MEAN)
0-2 years 232 8% 45.5
3-5 years 486 16% 44.7
6-10 years 664 22% 44.1
11-20 years 1095 36% 44.9
21-30 years 437 14% 44.2
31+ years 105 3% 45.9

Page Index
82
Page Index
PAGE INDEX
Achieve potential.............................................................. 22Acute stress ................................................................ 34, 36Alcohol .............................................................29, 30, 42, 43Anxiety ..........................................29, 30, 34, 35, 36, 37, 77Appetite, changes to .......................................... 32, 33, 37,
Behaviour – pupil/student ................................................. ..........................................23, 30, 38, 39, 46, 47, 48, 64, 76Bereavement.....................................................................40Bipolar disorder ................................................................35Budget/resources for staff wellbeing ..........................68Bullying/harassment ................................................ 38, 39
Challenging job ................................................................ 22Colleagues ...................................30, 39, 41, 52, 53, 54, 64Combination of problems ..............................................40Counselling ...............................................38, 41, 42, 63, 76Culture, organisational/target-driven .... 44, 46, 47, 48Curriculum change ..........................................................39
Data gathering/paperwork ..............................46, 47, 48Dealing with problems well (WEMWBS) ................71, 73Depression ......................................................34, 35, 36, 37Difficulty concentrating ............................................32, 33Discrimination ...................................................................39Dizziness ................................................................32, 33, 37Drugs ...............................................................29, 30, 42, 43
Eating disorder .................................................................35Employee Assistance Programme (EAP) ........................ .................................................................... 58, 62, 63, 76, 77Employer ............................................41, 50, 54, 60, 64, 76Energy to spare (WEMWBS) .....................................71, 73Exercise classes ................................................................63Exhaustion ............................................................34, 35, 36
Family/friends .......................................................25, 40, 41Family commitments ....................................................... 25Family issues .....................................................................40Feeling cheerful (WEMWBS).....................................71, 73Feeling close to other people (WEMWBS) .............71, 73Feeling confident (WEMWBS) ..................................71, 73Feeling good about myself (WEMWBS) .................71, 73Feeling loved (WEMWBS) ..........................................71, 73Feeling optimistic about the future (WEMWBS) ...71, 73
Feeling relaxed (WEMWBS) ......................................71, 73Feeling useful (WEMWBS) .........................................71, 73Flexible working ...............................................................64Financial worries ..............................................................40Food/eating ................................................................ 29, 30Forgetfulness ..................................................................... 33
Gambling .................................................................... 29, 30General Practitioner (GP)......................................... 36, 41Government ..........................................................23, 70, 72Guidance ............................................................................61
Headaches/migraines (including recurring) .32, 33, 37Health concerns ........................................... 40, 46, 47, 48Helpline ..............................................................................38High blood pressure ........................................................ 33Holiday working ............................................................... 25Holidays .............................................................................. 22Housing problems ............................................................40Human Resources (HR) ...................................................63
Impact, pupils/students' results ....................................52Impact, pupils/students’ studies ...................................52Implementation of policies ..................................... 66, 67Independent work, lack of .............................................39Insomnia/difficulty sleeping ....................................32, 33Inspections .........................................................................39Interaction, pupil/student .............................................. 22Interested in new things (WEMWBS) ......................71, 73Interested in other people (WEMWBS) ..................71, 73Irritability/mood swings......................................32, 33, 37
Leadership .........................................................................64Leaving the education sector .45, 46, 47, 48, 55, 56, 76Lesson planning/marking ..............................................30“Lightbulb” moments ....................................................... 22Line Manager .............................................................41, 58Loss of job ................................................................... 55, 56
Make up my own mind about things (WEMWBS) 71, 73Making a difference ........................................................ 22Management (educational) ..........................................64Managers – unreasonable demands ..... 39, 46, 47, 48Massage/relaxation ........................................................63

83
PAGE INDEX
Meditation ...................................................................42, 43Mental Health First Aid training ....................................63Mentor/coach ...................................................................63Mindfulness ..........................................................42, 43, 63Mood swings .........................................................32, 33, 37Muscle tension ......................................................32, 33, 37
Neighbours, problems with ............................................40NHS ....................................................................41, 70, 71, 72
Obsessive-compulsive disorder (OCD) .......................35Organisational change ......................................46, 47, 48Over-eating .................................................................32, 33
Panic attacks .........................................................32, 33, 37Paperwork/data gathering ........................23, 46, 47, 48Parents, issues with....................................................23, 39Partner/spouse ..................................................................41Pay/income .......................................23, 38, 39, 46, 47, 48Peers/colleagues ..............................................................41Personal problems .................................................... 36, 40Personal relationships .............................................. 55, 56Personality disorder.........................................................35Physical exercise ........................................................42, 43Physical health ...........................................................46, 48Policies (mental health/wellbeing/behaviour) ............. ..........................................................................64, 66, 67, 68Post-traumatic stress disorder (PTSD) ........................35Presenteeism .....................................................................54Pressure (health) ..........................................45, 46, 48, 76Procrastination ................................................................. 37
Raised blood pressure .................................................... 37Rapid pace of change .....................................................39Redundancy/restructure ......................................... 38, 39Resilience ..............................................................28, 36, 44Resources, lack of.............................................................47Retirement .........................................................................39
Schizophrenia/psychosis................................................35School management ....................................................... 23Self-medication ..........................................................42, 43Stigma .........................................................................59, 60Stress.....26, 27, 28, 29, 30, 35, 36, 37, 45, 50, 54, 60, 62, 63, 76, 77
Stress, unmanageable ............................................. 60, 76Suicide ......................................................................... 55, 56Supportive ...................................................................59, 77Surveying staff wellbeing ...............................................68Sweating ............................................................................ 37Switch off, inability to ...................................................... 25
Teaching ............................................................................. 22Team morale .....................................................................53Tearfulness ..................................................................32, 33Therapy ........................................................................42, 43Thinking clearly (WEMWBS) .....................................71, 73Time off work ...........................................50, 51, 52, 53, 55Trauma ...............................................................................40Trust issues ...................................................................39, 77
Under-eating .................................................................... 33Unions ........................................................................... 41, 63Unnecessary spending ............................................ 29, 30Unnecessary paperwork ................................................ 23
Valued, not feeling ........................................46, 47, 48, 77
Warwick-Edinburgh Mental Wellbeing Scale ................ ............................................................................ 71, 72, 73, 74Weakness, sign of .............................................................59 Websites ..............................................................................41Weekend working ......................................................25, 76Workload ............................................................................ 23Work/life balance ..................... 25, 38, 39, 46, 47, 48, 76Work performance ..............................................30, 55, 56Work relationships ...........................................................55Working hours ......................................................24, 64, 76
Young people, working with .......................................... 22

The charity for everyone working in educationEducation Support 40A Drayton ParkLondon N5 1EW+44 (0) 20 7697 2750
educationsupport.org.uk
Registered Charity No. 1161436© 2019 Education Support
YouGov is an international full-service market research agency. Our core offering of opinion data is derived from our highly participative panel of 4 million people worldwide. We combine this continuous stream of data with our deep research expertise and broad industry experience into a systematic research and marketing platform. The YouGov public services team, who led this research, are experienced in delivering robust and actionable insights for clients across the education sector. Our data is trusted and the results we deliver valued by clients in the work they deliver.