capacity collaboration in semiconductor supply chain with
TRANSCRIPT
8
Capacity Collaboration in Semiconductor Supply Chain with Failure Risk and Long-term Profit
Guanghua Han1, Shuyu Sun2and Ming Dong3 1Shanghai Jiao Tong University
2King Abdullah University of Science and Technology 3Shanghai Jiao Tong University
1,3China 2Kingdom of Saudi Arabia
1. Introduction
A large proportion of the product mix of the semiconductor manufacturer is of relatively
short life cycle (one or two years, typically), and a semiconductor chip may loses 60 percent
of value within the first half year of its life cycle (Mallik, 2007). The increasingly
challengeable environment of a semiconductor can be characterized by randomly periodic
demand, high manufacturing lead time, the expensive set-up costs, and the rapid change of
technology, all of which mean significant capital and big risk. The effective capacity scheme
of the semiconductor supply chain is of one major measure in order for less capital waste
and lower failure risk.
Silicon is the initial and most critical raw material of the semiconductor industry. Today,
most semiconductor chips and transistors are created with silicon. The first step in the
production of semiconductor silicon device is the drawing of ingots of silicon. These ingots
are sliced into wafers. After several layers of semiconductor material are placed on the
wafers, they are cut into individual chips. Depending on the complexity of the circuits
involved, each wafer may yield between 10 and 100,000 chips. The individual chips can then
be measured against one or more dimensions of electrical performance and classified as
different products. Then, the final products are finished after dozens of manufacturing
processes. A more detailed description of the production process can be found in several
references (Kothari, 1984; Bitran & Tirupati, 1988).
Capacity management and planning is always central to the competitiveness of a semiconductor manufacturer. Unlike other high capital requirement industries, the semiconductor industry is competing in the environment of short product life cycles, near-continuous technological innovation and the changing customer demands. A semiconductor supply chain must produce a variety of products in a number of different production facilities as they endeavour to meet the requirements of the customers and capture market share. Because the low flexibility of the equipments, one critical puzzle turns up: how should the existing capacity be configured in order to meet customer demand? This problem
www.intechopen.com

Supply Chain Management
186
Fig. 1. Semiconductor manufacturing processes (SEMATECH Inc.1)
of capacity planning becomes especially challenging during the recent economic crisis. However, effective capacity management tools are not applied in semiconductor industry, many intensive investments have been done by an Indian research institute (see figure 2).
Fig. 2. Capacity management in semiconductor firms (Tata consultancy2)
According to their researches, most of the semiconductor manufacturers have best-of-breed advance planning systems to aggregate an optimized plan for capacity management. 40 percent respondents agreed to incorporation of manual overrides in capacity planning. Now, capacity model in capacity planning solution has been relaxed to adapt the current downturn depending on the solution used and the capability of the solution to model manufacturers’ capacity. This paper considers a simple and typical semiconductor integrated manufacturing and allocating system, which consists of one silicon material suppler, multiple manufacture manufacturers and multi-demand (see figure 1). The raw material (silicon) supplier offer silicon to the manufacturers, then several classes of products are made. We attempt to
1 SEMATECH settled at Texas, traces its history back to 1986, she focuses on improving the industry infrastructure, particularly by working with domestic equipment suppliers to improve their capabilities. 2 Tata Consultancy Services (TCS) (BSE: 532540) is a Software services consulting company headquartered in Mumbai, India. TCS is the largest provider of information technology and business process outsourcing services in Asia.
www.intechopen.com

Capacity Collaboration in Semiconductor Supply Chain with Failure Risk and Long-term Profit
187
determine the optimal quantity of the material input of the material supplier and the capacity of each manufacturer.
Fig. 3. The semiconductor supply chain
The contributions of this paper are threefold. First, it extends the previous research to a multi-products, random demands semiconductor manufacture and allocation system with downward substitution. Second, we settle an integrated model of the capacity decision problem, and find its several characters. Third, an effective method is designed to solve the proposed stochastic programming model. The rest of the paper is organized as follows. Section 2 gives an exhaustive literature review, summarizes the exiting researches in the field. Section 3 describes the basic model, which is a stochastic programming model. In section 4, we prove several characters of the model and show that the single-step substitution policy is not necessarily be the optimal rule for allocating products among different demand classes. In section 5, an effective solution method is designed to solve the proposed programming model. Section 6 concludes the paper.
2. Literature review
Some literatures have focused on capacity coordination problem of a manufacture and distribution integrated system with the view of information asymmetry or symmetry, for example, designing an incentive mechanism by a manufacturer to encourage all retailers provide their private information to the manufacturer (Cachon & Lariviere, 1999). The decision of capacity allocation is based on supply and demand in the market, however, the information from production department and marketing department may be opposite, that is the production department aims to meet the demand of orders while the sales manager aims to carry out the sales targets. Then, some researchers study the incentive mechanism for the production department and the marketing department by information screening method to make the optimal decision of capacity allocation (Mallik, 2007). Meanwhile, capacity allocation problem of two-echelon supply chain under information symmetry is studied by some researchers. For example, a few references present a similar problem of capacity allocation decision with the change rate of the linear price under the capacity reservation contract (Erkoc & Wu, 2005), or make the capacity reservation contract according to the changing demands to maximize the total profit (Brown & Lee, 1998). In addition to the literatures above, some researchers have focused on the capacity coordination problem with the perspective of supply chain structure. By means of the
www.intechopen.com
Supply Chain Management
188
theoretical analysis and model deduction, some references discuss the benefits of supply chain capacity coordination and give some suggestions on the management (Corbett & Rajaram 2006). There are also some literatures study the issue of semiconductor wafer manufacturer’s capacity allocation decision problems and establish the network flow model of capacity allocation through a heuristic algorithm ( oktay & Uzsoy, 1998). Then, other researches extend a mathematical model to compute the number of retailers for the supply chain profit maximization and several examples prove the validity of the model (Netessine & Rudi, 2003). However, their objective is only to maximize the profit of manufacturer, the supply chain profit may not be optimal. In order to optimize the supply chain performance, a few literatures study a specific capacity allocation problem with the deterministic supply chain capacity (Rupp & Ristic, 2000), and then analysis capacity coordination problems among semiconductor wafer plants under the deterministic capacity with discrete event simulation approach (Gan et al., 2007). They show that the capacity coordination among plants can reduce the supply chain response time. Thus, the CRPS system (Capacity Requirements Planning System) is established towards the problem to decrease the computation burden (Chen et al., 2008). Generally, mathematical programming method is one of normal methods in settling the capacity coordination problems (Wu et al., 2009). A comparative study on semiconductor plants capacity coordination models shows that the capacity coordination among plants on the same supply chain stage can increase total production capacity ability for more than 3% (Chen & Chien, 2010). In general, most of the researches consider the supply chain coordination mechanisms (e.g. contract mechanism) and their decision variables are mostly the supply chain output rather than capacity. Some other literatures focus on the capacity allocation problem of a manufacturer and the corresponding solving methods always be the situational theory and intelligent algorithms. Most of researches about capacity coordination problem of the supply chain recently mainly focus on the parallel coordination issues, and the common solving method is mathematical reasoning and intelligent simulation approach (Chien & Hsu, 2006; Chien et al., 2007). In this work, we study the coordination of the whole semiconductor supply chain. Actually, substitution problems with random demand are common in the semiconductor industries. Because the nature performance of a product is highly sensitive to the production equipment and the manufacturing line is less of flexibility, the nature performance of the products made by different manufacturers is probably different. The products can be classified and indexed by the metrical performance, and then be allocated to the corresponding demands. The demands for one certain type of product can be upgraded when its corresponding product has been depleted. The manufacture processes are very complex and the nature performance is sensitive to the production conditions, so the products that are original planed to supply to the customer may be failed. The monopolistic material supplier controls the critical material of silicon, so she can control the yield of each manufacturer, in other words, she is able to control the supply of whole supply chain network.
3. Modelling
3.1 System dynamics simulations
Many management efforts are to enhance the specific manufacturing processes through statistical and experimental analysis, but they fail to manage the yields of overall manufacturing processes. Some researches on yield management mainly based on the price-
www.intechopen.com
Capacity Collaboration in Semiconductor Supply Chain with Failure Risk and Long-term Profit
189
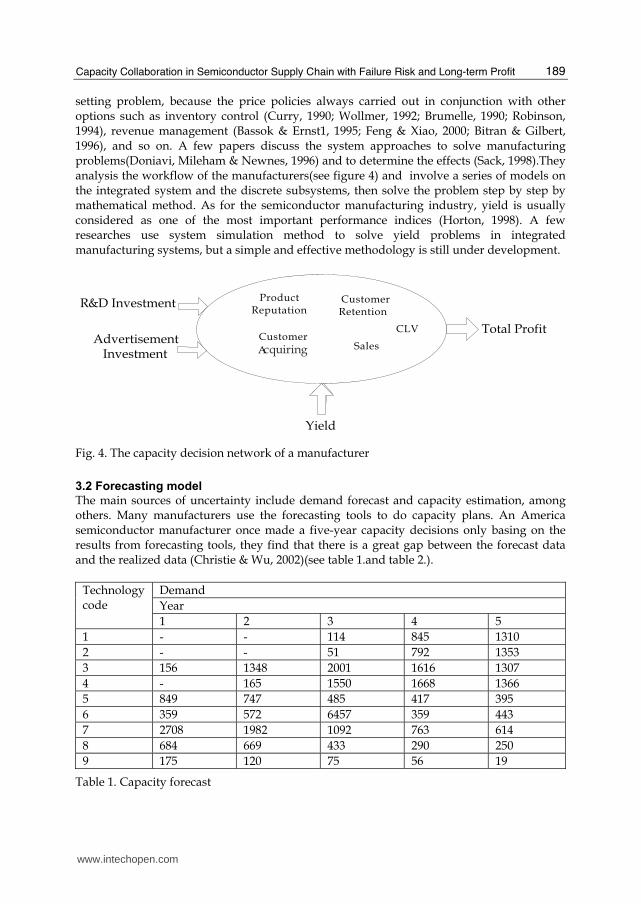
setting problem, because the price policies always carried out in conjunction with other options such as inventory control (Curry, 1990; Wollmer, 1992; Brumelle, 1990; Robinson, 1994), revenue management (Bassok & Ernst1, 1995; Feng & Xiao, 2000; Bitran & Gilbert, 1996), and so on. A few papers discuss the system approaches to solve manufacturing problems(Doniavi, Mileham & Newnes, 1996) and to determine the effects (Sack, 1998).They analysis the workflow of the manufacturers(see figure 4) and involve a series of models on the integrated system and the discrete subsystems, then solve the problem step by step by mathematical method. As for the semiconductor manufacturing industry, yield is usually considered as one of the most important performance indices (Horton, 1998). A few researches use system simulation method to solve yield problems in integrated manufacturing systems, but a simple and effective methodology is still under development.
Fig. 4. The capacity decision network of a manufacturer
3.2 Forecasting model
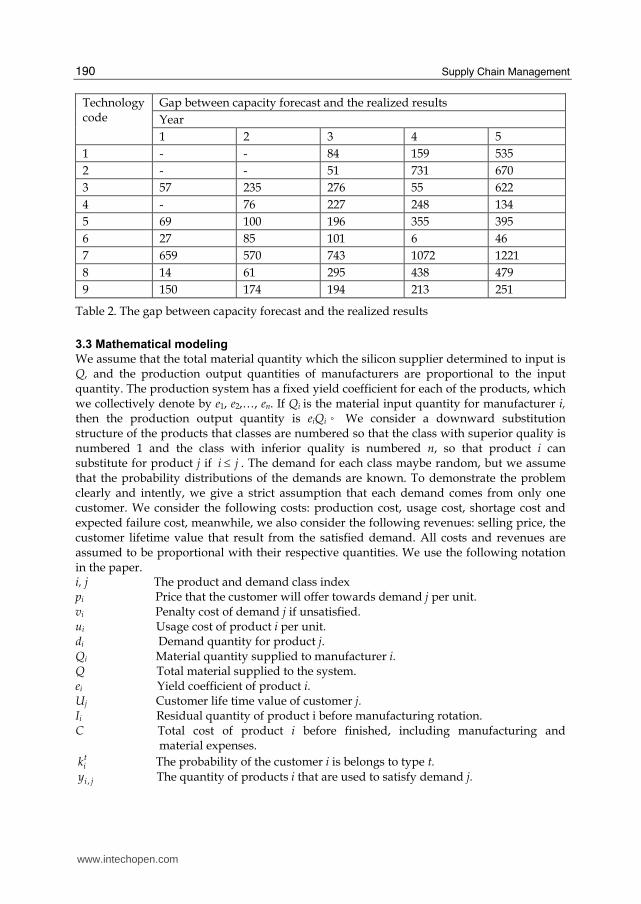
The main sources of uncertainty include demand forecast and capacity estimation, among others. Many manufacturers use the forecasting tools to do capacity plans. An America semiconductor manufacturer once made a five-year capacity decisions only basing on the results from forecasting tools, they find that there is a great gap between the forecast data and the realized data (Christie & Wu, 2002)(see table 1.and table 2.).
Demand
Year
Technology code
1 2 3 4 5
1 - - 114 845 1310
2 - - 51 792 1353
3 156 1348 2001 1616 1307
4 - 165 1550 1668 1366
5 849 747 485 417 395
6 359 572 6457 359 443
7 2708 1982 1092 763 614
8 684 669 433 290 250
9 175 120 75 56 19
Table 1. Capacity forecast
www.intechopen.com
Supply Chain Management
190
Gap between capacity forecast and the realized results
Year
Technology code
1 2 3 4 5
1 - - 84 159 535
2 - - 51 731 670
3 57 235 276 55 622
4 - 76 227 248 134
5 69 100 196 355 395
6 27 85 101 6 46
7 659 570 743 1072 1221
8 14 61 295 438 479
9 150 174 194 213 251
Table 2. The gap between capacity forecast and the realized results
3.3 Mathematical modeling
We assume that the total material quantity which the silicon supplier determined to input is Q, and the production output quantities of manufacturers are proportional to the input quantity. The production system has a fixed yield coefficient for each of the products, which we collectively denote by e1, e2,…, en. If Qi is the material input quantity for manufacturer i, then the production output quantity is eiQi。 We consider a downward substitution structure of the products that classes are numbered so that the class with superior quality is numbered 1 and the class with inferior quality is numbered n, so that product i can substitute for product j if i j≤ . The demand for each class maybe random, but we assume that the probability distributions of the demands are known. To demonstrate the problem clearly and intently, we give a strict assumption that each demand comes from only one customer. We consider the following costs: production cost, usage cost, shortage cost and expected failure cost, meanwhile, we also consider the following revenues: selling price, the customer lifetime value that result from the satisfied demand. All costs and revenues are assumed to be proportional with their respective quantities. We use the following notation in the paper. i, j The product and demand class index pi Price that the customer will offer towards demand j per unit. vi Penalty cost of demand j if unsatisfied. ui Usage cost of product i per unit. di Demand quantity for product j. Qi Material quantity supplied to manufacturer i. Q Total material supplied to the system. ei Yield coefficient of product i. Uj Customer life time value of customer j. Ii Residual quantity of product i before manufacturing rotation. C Total cost of product i before finished, including manufacturing and material expenses.
tik The probability of the customer i is belongs to type t.
,i jy The quantity of products i that are used to satisfy demand j.
www.intechopen.com
Capacity Collaboration in Semiconductor Supply Chain with Failure Risk and Long-term Profit
191
,i jf The failure risk that use product i to satisfy demand j.
,i jα Contribution margin for satisfying a demand of class j with product i. t The customer type, t=1,2,or3.
( )tj jf r Customer lifetime value of customer j type t.
rj The quantity of the realized demand class j. hi The holding cost of product i per unit.
( )QΠ The total profit of the integrated supply chain. a1, b1, a, b, a2, b2 The constants in CLV function
3.3.1 The customer lifetime value
In marketing, customer lifetime value (CLV) is the present value of the future cash flows
attributed to the customer relationship. Use of customer lifetime value as a marketing metric
tends to place greater emphasis on long-term customer satisfaction, rather than on
maximizing short-term sales. CLV is directly influenced by customer satisfaction, which is
positively related to the fulfil rate of the demand. The customer satisfaction is an inside
feeling, so it may be different among individuals. We assume that Uj=fj (rj) based on utility
curves theory (Becker et al. 1964), where rj denotes fulfil rate of demand j. The CLV curve is
depicted in the following figure.
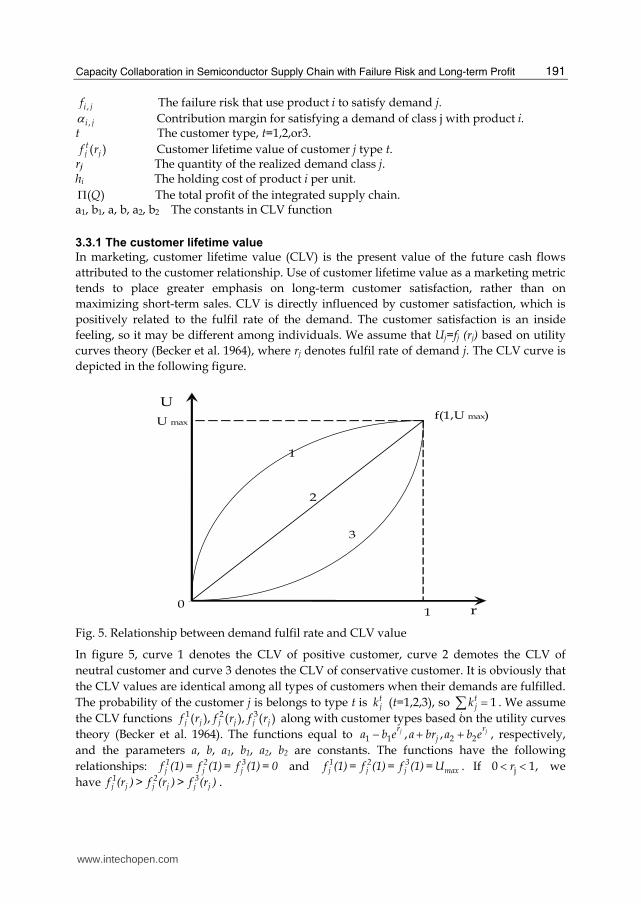
Fig. 5. Relationship between demand fulfil rate and CLV value
In figure 5, curve 1 denotes the CLV of positive customer, curve 2 demotes the CLV of
neutral customer and curve 3 denotes the CLV of conservative customer. It is obviously that
the CLV values are identical among all types of customers when their demands are fulfilled.
The probability of the customer j is belongs to type t is tjk (t=1,2,3), so 1t
ji
k =∑ . We assume
the CLV functions 1 2 3( ), ( ), ( )j j j j j jf r f r f r along with customer types based on the utility curves
theory (Becker et al. 1964). The functions equal to 1 1 2 2, ,j jr rja b e a br a b e− + + , respectively,
and the parameters a, b, a1, b1, a2, b2 are constants. The functions have the following
relationships: 1 2 3j j jf (1) = f (1) = f (1) = 0 and 1 2 3
j j j maxf (1) = f (1) = f (1) = U . If j0 1,r< < we
have 1 2 3j j j j j jf (r ) > f (r ) > f (r ) .
www.intechopen.com

Supply Chain Management
192
j
j
r1 1
j j j
r2 2
a - b e (neutral customer ,t = 1)
f (r ) = a + br (positive customer ,t = 2)
a + b e (conservative customer,t = 3)
⎧⎪⎪⎨⎪⎪⎩
3.3.2 The failure risk cost
System failure risk is often happened in the semiconductor supply chains, and they always result to great capital losses. Failure risks of the stochastic manufacture system mainly come from the equipment failure, the shipping failure in transport, or the high technology demands. In the system, there is always a probability that each piece of ordered product will not be supplied to the customer. In this chapter, we use fij to describe the probability of the failure of one unit of product shipment: use product i to satisfy the demand class j. If we planed to use product i to satisfy the demand j for q piece, the expect failure cost of the supplement is qfij.
3.3.3 Other costs and revenues
In the manufacture and allocation system, the material supplier must buy the materials from the outside of the system. Then, the manufacturing process starts, the manufacturers spent the consumables to conduct manufactures. If the products are not fully sold, it will be hold in stock and allocate in the next selling period. The fulfilled demand will increase the customer life time value, because the fulfilled customer may suggest others to purchase or will maintain the bought products. When the demands are not fulfilled, the retailer should pay the shortage cost to the customers. So, on the view of the integrated system, the other costs are the material cost, holding cost, shortage cost. At the same time, the system gains the revenue from products’ selling.
3.3.4 Model constraints
The system faces some constraints. For example, the demand constraint: the supplied
quantity to a certain demand should not exceed the need, that is, ,i j ii
y d≤∑ . At the same
time, all the realized demand fulfilled by the one type of product should not exceed the total
quantity in inventory, that is, ,i j i i ii
y e Q I≤ +∑ .
3.3.5 Model construction
Generally, higher classes of products have higher revenue and usage costs, so it is reasonable that the revenue (pj+vj) and usage cost uj decrease with the index j . Then we have:
j j i ip v p v+ > + , j iu u> for j i< (1)
, ,/i j j j i j i ji
p v u U yα = + − + ∑ , (2)
Let ( )QΠ be the profit function of the supply chain in the whole manufacturing and selling
rotation. In the production stage the supplier determines the optimal material quantity that
will be input in the manufacturing system, then, varieties products are manufactured and
www.intechopen.com
Capacity Collaboration in Semiconductor Supply Chain with Failure Risk and Long-term Profit
193
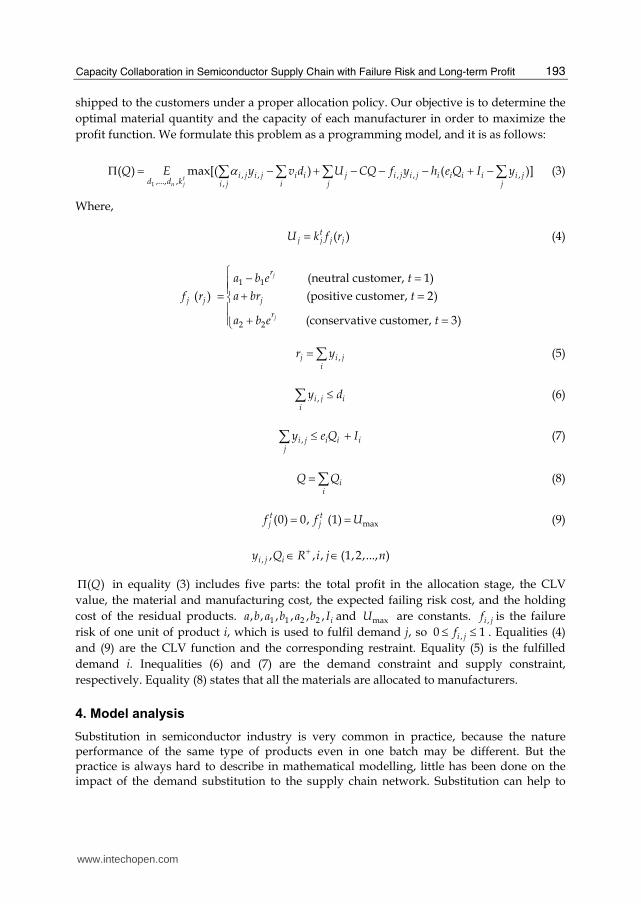
shipped to the customers under a proper allocation policy. Our objective is to determine the
optimal material quantity and the capacity of each manufacturer in order to maximize the
profit function. We formulate this problem as a programming model, and it is as follows:
1
, , , , ,,..., , ,
( ) max[( ) ( )]t
n j
i j i j i i j i j i j i i i i i jd d k i j i j j
Q E y v d U CQ f y h e Q I yαΠ = − + − − − + −∑ ∑ ∑ ∑ (3)
Where,
( ) tj j j jU k f r= (4)
1 1
2 2
(neutral customer, 1)
( ) (positive customer, 2)
(conservative customer, 3)
j
j
r
j j j
r
a b e t
f r a br t
a b e t
⎧ − =⎪⎪= + =⎨⎪ + =⎪⎩
,j i ji
r y=∑ (5)
,i j ii
y d≤∑ (6)
,i j i i ij
y e Q I≤ +∑ (7)
ii
Q Q=∑ (8)
max(0) 0, (1)t tj jf f U= = (9)
, , , , (1,2,..., )i j iy Q R i j n+∈ ∈
( )QΠ in equality (3) includes five parts: the total profit in the allocation stage, the CLV
value, the material and manufacturing cost, the expected failing risk cost, and the holding
cost of the residual products. 1 1 2 2, , , , , , ia b a b a b I and maxU are constants. ,i jf is the failure
risk of one unit of product i, which is used to fulfil demand j, so ,0 1i jf≤ ≤ . Equalities (4)
and (9) are the CLV function and the corresponding restraint. Equality (5) is the fulfilled
demand i. Inequalities (6) and (7) are the demand constraint and supply constraint,
respectively. Equality (8) states that all the materials are allocated to manufacturers.
4. Model analysis
Substitution in semiconductor industry is very common in practice, because the nature performance of the same type of products even in one batch may be different. But the practice is always hard to describe in mathematical modelling, little has been done on the impact of the demand substitution to the supply chain network. Substitution can help to
www.intechopen.com

Supply Chain Management
194
remit the bullwhip effect and gives the supply chain with flexibility. A number of papers have studies substitution policy in a product allocation system (Chen & Plambeck, 2008; Shumsky & Zhang, 2009). The dissertation applies and studies the impact of the demand substitution to a semiconductor supply chain network. In this manufacture and allocation system, the whole rotation can be divided into two stages: the production stage and the allocation stage (see figure 1). At the production stage, the supplier determines the optimal materials input, while at allocation stage the manufacturers allocate the products. The allocation policy determines not only the revenue of the allocation stage, but also the materials inputs at the production stage. Let N be the difference between the actual demand and available product, then we have:
1 2 1 1 1 1 2 2 2 2( , ,..., ) (( ),( ),...,( ))n n n n nN N N N e Q I d e Q I d e Q I d= = + − + − + −
Obviously, ( 1,..., )iN i n= can be positive, negative, or zero. For 1,...,i n= , if 0tiN > and
0tjN < , then ,i jy units of product i can be offered for upgrading. The realized upgraded
quantity is non-negative and does not exceed the quantity that product i can provide. That is,
,0 min( , )i j j iy N N≤ ≤
Single-step upgrade can deliver most of benefit of more complex substitution schemes (Jordanand 1995) and some literatures consider the single-step upgrade as the optimal allocation policy (Shumsky & Zhang, 2009). The single-step upgrade allocation policy states that the substitution can be allowed between two neighbour product classes where the high class products are in stock (see figure 6.).
Fig. 6. Single step upgrade substitution
Proposition 1. Traditional substitution policy is not the optimal allocation policy of the integrated system. In our paper, we take customer life time value in to account as one evaluation indicator when make allocation decisions. When 0, 0t t
i jN N> < , i<j, and 1 0,tjN + < we may choose the
residual quantity product i to satisfy the demand class of j or demand class j+1 or even both the demands, but the puzzle is that which is the optimal choice of the three substitution policies. Based on equation (2), the difference between contribution margin ,i jα and contribution margin , 1i jα + are,
www.intechopen.com

Capacity Collaboration in Semiconductor Supply Chain with Failure Risk and Long-term Profit
195
, , 1
, 1 1 1 , 1
1 1 , 1 , 1
( / ) ( / )
( ) ( / / )
i j i j
i i j j i j i i j j i ji i
i i i i j i j j i ji i
p v u U y p v u U y
p p v v U y U y
α α α +
+ + + +
+ + + +
Δ = −= + − + − + − += − + − + −
∑ ∑∑ ∑
(10)
In equality (10), αΔ consists of two part, the first part 1 1i i i ip p v v+ +− + − is obviously
positive because of equality (1). The values of ,/j i ji
U y∑ and 1 , 1/j i ji
U y+ +∑ are depend on
the customer type and the realized quantity of demand, so we can not estimate the size of
the second part of the right-hand-side of equality (10) until the allocation decisions are
made. Thus, αΔ is not necessarily positive or negative. It means that the traditional single-
step upgrade allocation policy is not the optimal in this integrated system.
Lemma 1. ( )QΠ is concave in Q . Proof. The programming model can be simplified and transformed as,
1
i,..., ,
( ) ( )t
n jd d kQ E QΠ = Π
i , , , , , ,,
( ) max[( ) ( ) ( )]t ti j i j i i j j i j i i j i j i i i i i j
i j i j i i j
Q y v d k f y C Q f y h e Q I yαΠ = − + − − − + −∑ ∑ ∑ ∑ ∑ ∑
s.t.
,i j ii
y d≤∑ (11)
,i j i i ij
y e Q I≤ +∑ (12)
, , , , (1,2,..., )i j iy Q R i j n+∈ ∈
( )iQΠ is a linear program model of Qi (i=1,…,n) with the constraints of inequalities (11) and
(12). Obviously, ( )iQΠ is concave in Qi because a linear program is concave in variables that
determine the right-hand-side of its constraints. Van Slyke and Wets (1966) prove that
concavity is preserved over the expectation operator, so ( )QΠ is concave in Qi. Because
is a positive linear function in iQ , so ( )QΠ , as the function of iQ , is also concave in Q
(Rockafeller,1970).
5. Solution method and numerical experiment
5.1 Solution method
The decision model is a stochastic programming model, the demand distributions for the products are modelled not by their analytic functions but rather by a finite number of randomly generated demand scenarios that are statistically identical to the joint probability distribution of the demands. It should be noted that a finite number of scenarios can model only an approximation of continuous distributions, but that a model with a sufficiently large
www.intechopen.com
Supply Chain Management
196
number of scenarios can approach the actual distributions. Let M denote the number of scenarios and superscript each of the following parameters and variables by the scenario index m: m
id and tmjk . Monte Carlo sampling is often used in stochastic linear program to
maximize the expected profit over the scenarios. Each scenario may be given a probability weight wm. We now have the following formulation for the problem that models m
id and tmjk
distributions using the M scenarios:
, , ,,
, , ,
( ) max[ ( ) ( ( ))
( )]
m tm tmi j i j m i i m j i i j
i j m i m j i
i i j i j i i i i i ji j
Q y w v d w k f y
C Q f y h e Q I y
α′Π = − +− − − + −∑ ∑ ∑ ∑ ∑ ∑∑ ∑
s.t.
,i j ji
y d≤∑ (13)
,i j i i ij
y e Q I≤ +∑ (14)
, , ,i j iy Q R+∈ 0 m M< ≤
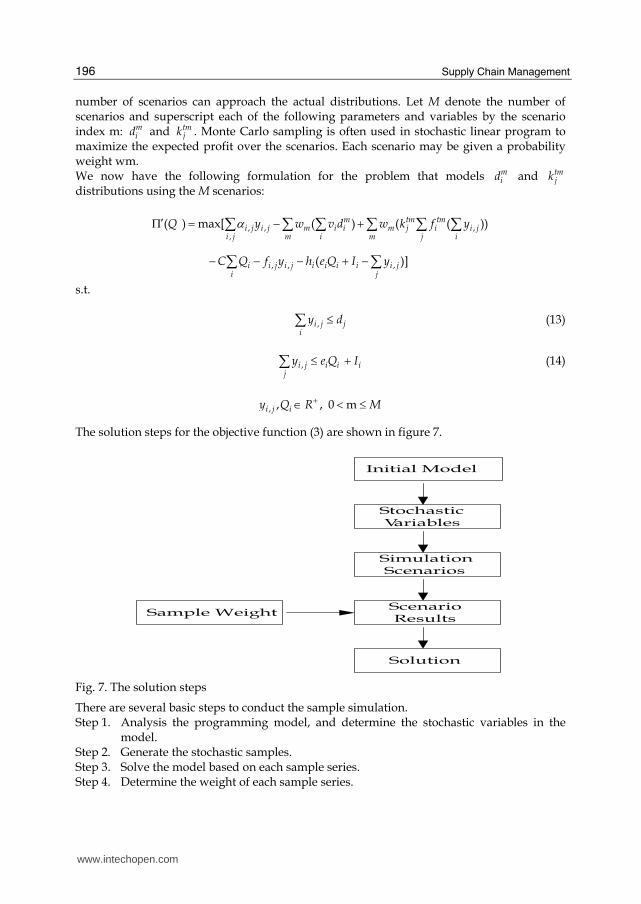
The solution steps for the objective function (3) are shown in figure 7.
Fig. 7. The solution steps
There are several basic steps to conduct the sample simulation. Step 1. Analysis the programming model, and determine the stochastic variables in the
model. Step 2. Generate the stochastic samples. Step 3. Solve the model based on each sample series. Step 4. Determine the weight of each sample series.
www.intechopen.com
Capacity Collaboration in Semiconductor Supply Chain with Failure Risk and Long-term Profit
197
Step 5. Calculate the optimal value of the decision variables. In the simulation, the choice of the number of scenarios M is important when the scenarios in the model can only approximate the demand distributions. As the value of scenarios M increase, there is a trade-off between the increased computing time and the improved accuracy as a result of a better approximation of the model.
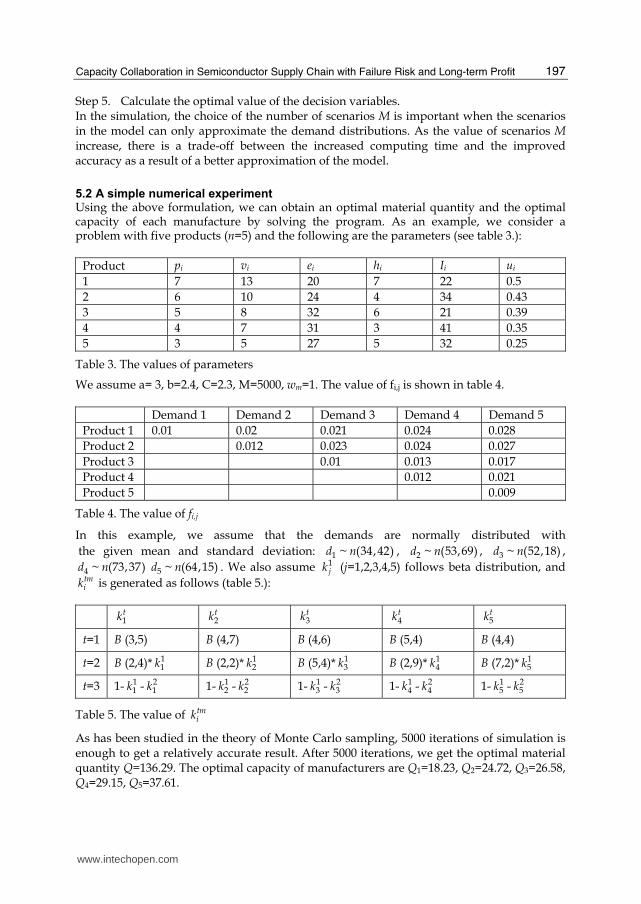
5.2 A simple numerical experiment Using the above formulation, we can obtain an optimal material quantity and the optimal capacity of each manufacture by solving the program. As an example, we consider a problem with five products (n=5) and the following are the parameters (see table 3.):
Product pi vi ei hi Ii ui
1 7 13 20 7 22 0.5
2 6 10 24 4 34 0.43
3 5 8 32 6 21 0.39
4 4 7 31 3 41 0.35
5 3 5 27 5 32 0.25
Table 3. The values of parameters
We assume a= 3, b=2.4, C=2.3, M=5000, wm=1. The value of fi,j is shown in table 4.
Demand 1 Demand 2 Demand 3 Demand 4 Demand 5
Product 1 0.01 0.02 0.021 0.024 0.028
Product 2 0.012 0.023 0.024 0.027
Product 3 0.01 0.013 0.017
Product 4 0.012 0.021
Product 5 0.009
Table 4. The value of fi,j
In this example, we assume that the demands are normally distributed with
the given mean and standard deviation: 1 ~ (34,42)d n , 2 ~ (53,69)d n , 3 ~ (52,18)d n ,
4 ~ (73,37)d n 5 ~ (64,15)d n . We also assume 1jk (j=1,2,3,4,5) follows beta distribution, and
tmik is generated as follows (table 5.):
1tk 2
tk 3tk 4
tk 5tk
t=1 B (3,5) B (4,7) B (4,6) B (5,4) B (4,4)
t=2 B (2,4)* 11k B (2,2)* 1
2k B (5,4)* 13k B (2,9)* 1
4k B (7,2)* 15k
t=3 1- 11k - 2
1k 1- 12k - 2
2k 1- 13k - 2
3k 1- 14k - 2
4k 1- 15k - 2
5k
Table 5. The value of tmik
As has been studied in the theory of Monte Carlo sampling, 5000 iterations of simulation is enough to get a relatively accurate result. After 5000 iterations, we get the optimal material quantity Q=136.29. The optimal capacity of manufacturers are Q1=18.23, Q2=24.72, Q3=26.58, Q4=29.15, Q5=37.61.
www.intechopen.com

Supply Chain Management
198
6. Conclusion
In this work we study a capacity determination problem of the manufacture and allocation integrated supply chain in semiconductor industry. The material supplier invests in materials (e.g. silicon) before the actual demands are known. All the manufacturers produce one type of output, but the nature performances of the outputs produced by different manufacturer are distinctive because of the different technical and equipment conditions. The outputs are classified to different products by the nature performances and then allocated to customers. Customers can be divided into three types (the positive customers, neutral customers and the conservative customers), and their long-term profit functions are different. The demands can be upgraded when a particular type of the product has been depleted. We show that the traditional one-step substitution policy is not the optimal in our system, and we prove that the objective function of the stochastic model is concave in material quantity and the manufacturer’s capacity. A solution method of the model is proposed and tested by numerical experiment.
7. References
Bassok, Y. & Ernst, R.(1995). Dynamic allocations for multi-product distri- bution Transportation Science, Vol.29, No.3, pp. 256-266. ISSN 0041-1655
Becker, G.M. & DeGroot MH., Marschak J.(1964). Measuring utility by a single-response sequential method. Behavioral Science, Vol.9, No.3, pp. 226-232. ISSN 0021-8863
Bitran, G.R. & Tirupati, D.(1988). Planning and scheduling for epitaxial wafer production facilities. Operational Research, Vol.36, No.1, pp. 34-49. ISSN 0030-364X
Bitran, G.R. & Gilbert, S.M.(1996). Managing hotel reservations with uncertain arrivals. Operations Research Vol.44, No.1, pp.35-49. ISSN 0030-364X
Brown, A. & Lee, H.(1998). Optimal “pay to delay” capacity reservation with application to the semiconductor industry. Working paper, Stanford University, Stanford, CA.
Brumelle, S.L. & McGill, J.I., Oum T.H., Sawaki K. Tretheway M.W.(1990). Allocation of airline seats between stochastically dependent demands. Transportation Science, Vol.24, No.3, pp. 183-192. ISSN 0041-1655
Cachon, G.P. & Lariviere, M.A.(1999). Capacity Allocation Using Past Sales: When to Turn-and-Earn. Management Science, Vol.45, No.5, pp.685-703. ISSN 0025-1909
Charles, J.C., Rajaram, K.(2006). A Generalization of the Inventory Pooling Effect to Non-normal Dependent Demand. MANUFACTURING & SERVICE OPERATIONS MANAGEMENT, Vol.8, No.4, pp. 351-358. ISSN 1523-4614
Chen, W.C. & Chien, C.F.(2010). Evaluating capacity pooling strategy in semiconductor manufacturing: a productivity perspective study. International Journal of Production Research, Vol.28, No.4, pp.566-588. ISSN 0020-7543
Chen, J.C., Fan, Y.C. & Chen, C.W.(2008). Capacity requirements planning for twin fabs of wafer fabrication. International Journal of Production Research. Vol. 41, No. 16, pp. 3921-3941. ISSN 0020-7543
Chen, L. & Plambeck, E. L.(2006). Dynamic Inventory Management with Learning About the Demand Distribution and Substitution Probability. Manufacturing & Service Operations Management, Vol.10, No.2, pp.236-256. ISSN 1523-4614
Chien, C.F. & Hsu, C.(2006). A novel method for determining machine subgroups and backups with an empirical study for semiconductor manufacturing. Journal of Intelligent Manufacturing, Vol.17, No.4, pp.429–440. ISSN 0956-5515
www.intechopen.com

Capacity Collaboration in Semiconductor Supply Chain with Failure Risk and Long-term Profit
199
Chien, C.F. & Hsu, C.(2007). Construct the OGE for promoting tool group productivity in semiconductor manufacturing. International Journal of Production Research, Vol.45, No.3, pp.509–524.. ISSN 0020-7543
Christie, R.M.E & Wu, S.D.(2002).Semiconductor capacity planning: stochastic modeling and computational studies.(Statistical Data Included). IIE Transactions. February 1
Corbett, C.J. & Rajaram, K.(2006). A generalization of the inventory pooling effect to nonnormal dependent demand. Manufacturing and Service Operations Management, Vol.84, No.4, pp. 351–358. ISSN 1523-4614
Curry, R.E.1990. Optimal airline seat allocation with fare classes nested by origins and destinations. Transportation Science, Vol.24, No.3, pp.193-204. ISSN 0041-1655
Doniavi, A. Mileham, A.R. & Newnes, L.B.(1996). 12th National Conference on Manufacturing Research, pp. 111-115, ISBN 185790031, Bath,UK, September.
Erkoc, M. & Wu, D.(2005). Managing high-tech capacity expansion via reservation contracts. Production, Operation & Management, Vol.14, No.2, pp.232–251. ISSN 0144-3577
Feng, Y.Y. & Xiao, B.C.(2000). Optimal policies of yield management with multiple predetermined prices. Operations Research, Vol.48, No.2, pp.332-343. ISSN 0030-364X
Gan, B.P.(2007). Analysis of a borderless fab using interoperating AutoSched AP models. International Journal of Production Research, Vol.45, No.3, pp. 675–697. ISSN 0020-7543
Horton, D.(1998). A CMOS-compatible Process for Fabricating Electrical Through-vias in Silicon. Solid State Technology, Vol.41, No.1, pp.109-119. ISSN 0038111X.
Jordan, W.C. & Graves, S.C.(1995). Principles on the benefits of manufacturing process flexibility. Management Science, Vol.41, No.4, pp.577-598. ISSN 0025-1909
Kothari, V.(1984). Silicon wafer manufacture. Unpublished thesis, Sloan school of management, MIT, Cambridge, Mass.
Mallik, S.(2007). Contracting over multiple parameters: Inventory allocation in semiconductor manufacturing. European Journal of Operational Research, Vol.182, No.1, pp. 174-193. ISSN 0377-2217
Netessine, S. & Rudi N.(2003). Centralized and competitive inventory models with demand substitution. Operations Research. Vol.51, No.2, pp.329-335. ISSN 0030-364X
Robinson, L.W.(1994). Optimal and Approximate Control Policies for Airline Booking with Sequential Non-monotonic Fare Classes. Operations Research, Vol.45, No.2, pp.252-263. ISSN 0030-364X
Rockafellar, R.T. (1970). Convex Analysis. Princeton University Press, Princeton, New Jersey.
Rupp, T. M. & Ristic, M..(2000). Fine Planning for Supply Chains in Semiconductor Manufacture, Journal of Materials processing Technology, Vol.107, pp.390-397. ISSN 0924-0136
Sack, E.A.(1998). Method and apparatus for characterizing a semiconductor device. Solid State Technology, Vol.41, No.1, pp.81-85. ISSN 0038111X
Shumsky, R.A. & Zhang, F.Q.(2009). Dynamic Inventory Management with Substitution. Operational Research, Vol.57, No.3, pp. 671-684. ISSN 0030-364X
Smith, S.A. & Agrawal, N.(2000). Management of multi-item retail inventory systems with demand substitution. Operations Research, Vol.48, No.1, pp. 50-64. ISSN 0030-364X
www.intechopen.com

Supply Chain Management
200
Toktay, L.B. & Uzsoy, R..(1998). A Capacity Allocation Problem with Integer Side Constraints. European Journal of Operational Research, Vol..109, No.1, pp.170-182. ISSN 0020-7543
Van, Slyke R. & Wets, R..(1966). Programming under uncertainty and stochastic optimal control. SIAM Journal on Control, Vol.4, No.1, pp. 179-193. ISSN 0363-0129
Wollmer, R.D.(1992). An airline seat management model for a single leg route when lower fare classes book first. Operations Research, Vol.40, No.1, pp.26-37. ISSN 0030-364X
Wu, M.C., Chen, C.F. & Shih, C.F., (2009). Route planning for two wafer fabs with capacity sharing mechanisms. International Journal of Production Research, Vol.47, No.16, pp.5843–5856. ISSN 0020-7543
www.intechopen.com
Supply Chain ManagementEdited by Dr. pengzhong Li
ISBN 978-953-307-184-8Hard cover, 590 pagesPublisher InTechPublished online 26, April, 2011Published in print edition April, 2011
InTech EuropeUniversity Campus STeP Ri Slavka Krautzeka 83/A 51000 Rijeka, Croatia Phone: +385 (51) 770 447 Fax: +385 (51) 686 166www.intechopen.com
InTech ChinaUnit 405, Office Block, Hotel Equatorial Shanghai No.65, Yan An Road (West), Shanghai, 200040, China
Phone: +86-21-62489820 Fax: +86-21-62489821
The purpose of supply chain management is to make production system manage production process, improvecustomer satisfaction and reduce total work cost. With indubitable significance, supply chain managementattracts extensive attention from businesses and academic scholars. Many important research findings andresults had been achieved. Research work of supply chain management involves all activities and processesincluding planning, coordination, operation, control and optimization of the whole supply chain system. Thisbook presents a collection of recent contributions of new methods and innovative ideas from the worldwideresearchers. It is aimed at providing a helpful reference of new ideas, original results and practical experiencesregarding this highly up-to-date field for researchers, scientists, engineers and students interested in supplychain management.
How to referenceIn order to correctly reference this scholarly work, feel free to copy and paste the following:
Guanghua Han, Shuyu Sun and Ming Dong (2011). Capacity Collaboration in Semiconductor Supply Chainwith Failure Risk and Long-term Profit, Supply Chain Management, Dr. pengzhong Li (Ed.), ISBN: 978-953-307-184-8, InTech, Available from: http://www.intechopen.com/books/supply-chain-management/capacity-collaboration-in-semiconductor-supply-chain-with-failure-risk-and-long-term-profit

© 2011 The Author(s). Licensee IntechOpen. This chapter is distributedunder the terms of the Creative Commons Attribution-NonCommercial-ShareAlike-3.0 License, which permits use, distribution and reproduction fornon-commercial purposes, provided the original is properly cited andderivative works building on this content are distributed under the samelicense.