capacity of normal and turbo- roundabouts: comparative ... · the current paper presents a method...
TRANSCRIPT

Proceedings of the Institution of Civil Engineers
http://dx.doi.org/10.1680/tran.12.00003
Paper 1200003
Received 23/12/2011 Accepted 17/07/2012
Keywords: infrastructure planning, traffic engineering, transport planning
ICE Publishing: All rights reserved
Transport
Capacity of normal and turbo-roundabouts:comparative analysisVasconcelos, Silva and Seco
Capacity of normal and turbo-roundabouts: comparativeanalysisj1 Antonio Luıs Pimentel Vasconcelos MSc
Assistant Professor, Civil Engineering Department, PolytechnicInstitute of Viseu, Viseu, Portugal
j2 Ana Bastos Silva PhDAssistant Professor, Civil Engineering Department, University ofCoimbra, Coimbra, Portugal
j3 Alvaro Jorge da Maia Seco PhDAssociate Professor, Civil Engineering Department, University ofCoimbra, Coimbra, Portugal
j1 j2 j3
While researchers agree as to the safety benefits of turbo-roundabouts, their improvements in terms of capacity and
delay remain open to discussion. This is mostly because previous research is based on capacity models that do not
fully describe the complex interactions between traffic streams on multi-lane roundabouts. This paper proposes a
procedure to calculate capacity based on gap-acceptance theory. It addresses the limitations mentioned by
accounting for usually disregarded effects such as the dynamic choice of the entry lane and unequal allocation of
traffic in the circulatory lanes. Capacities were calculated for a wide range of demand scenarios and it has been
shown that only under demand scenarios that are very specific and uncommon in real-world networks, associated
with very high percentages of right-turning entry traffic, can a standard turbo-roundabout be expected to provide
more capacity than the equivalent two-lane roundabout. It has also been shown that two-lane roundabouts can
normally be expected to provide capacities of 20–30% above those of comparable turbo-roundabouts.
NotationCk capacity of entry lane k
Ik set of priority streams for entry lane k
pI proportion of through traffic using the inside entry lane
(normal roundabouts) or proportion of right-turning
traffic using the inside entry lane (turbo-roundabouts)
qcf , i opposing traffic at approach lane i
qx demand flow at approach leg x
qxy demand flow (from x to y)
tc critical headway
tf follow-up time
xi saturation ratio of entry lane i
˜i intra-platoon headway in stream i
ºi scale parameter of Cowan’s M3 distribution in stream i
�i proportion of free headways in stream i
1. IntroductionMany studies have shown that roundabouts are safe and efficient
solutions, especially when single-lane roundabouts are compared
with conventional priority junctions (Elvik, 2003; Rodegerdts et
al., 2010). However, single-lane roundabouts often provide
insufficient capacity and roundabouts with two or three circula-
tory lanes are required. Selecting the correct entry and circulatory
lane on multi-lane roundabouts is not always trivial. Driver
indecision and difficulties in interpreting the roundabouts’ driving
rules can lead to weaving conflicts and accidents in the circula-
tory carriageway. Although these accidents are usually not
serious, they are common and often affect the normal flow of
traffic. Multiple circulatory lanes also require wider carriageways
with the extra width often being used by drivers to cut the
trajectory curvature and negotiate the roundabout at higher
speeds, disregarding lane markings.
In a study of standard two-lane roundabouts conducted in
Portugal (Silva and Seco, 2005; Silva et al., 2006) it was found
that more than 40% of drivers in free-flow conditions that entered
the roundabouts using the outside lane (right, near the sidewalk)
followed straight line trajectories, with the consequent invasion of
the left circulatory lane (in this paper right-hand driving is
assumed). A similar thing happened in the inside lane (left, near
the splitter island) trajectories: more than 20% of drivers opted to
leave the roundabout using the right circulatory lane, disregarding
the road marking indications. This behaviour was found to be
1

highly related with roundabout geometry and, specifically, with
the level of deflection: the inexistence of physical elements that
impose swift trajectory changes results in greater acceptance by
drivers in maintaining their circulation lane but also results in
behaviour patterns characterised by high entry speeds and by
behavioural heterogeneities that tend to persist along the crossing
and exit zones. On the other hand, the usage of high deflection
levels tends to impose high levels of discomfort that induce
drivers to invade adjacent lanes searching for more direct and
comfortable trajectories.
Geometrical parameters have, consequently, a direct bearing on
roundabout safety. Montella (2011) showed that the deflection
radius and the entry angle are the two most important geometrical
factors that contribute to crash frequency. These problems have
led countries such as Germany (Brilon, 2011), France (Setra,
1998) and Switzerland (Bovy et al., 1991; Lindenmann, 2006) to
use multi-lane roundabouts only under exceptional conditions.
In order to address these problems, the turbo-roundabout concept
was developed and introduced in Holland in 1996 (Fortuijn,
2009a). A turbo-roundabout has spiral road markings and raised
lane dividers, forcing a spiralling flow of traffic. This geometry
completely eliminates weaving and cut-in conflicts by guiding
drivers continuously from entry to exit (see Figure 1). This
principle is conceptually essentially the same as spiral round-
abouts, used in the UK, which use spiral lane markings in the
circulatory carriageway to direct drivers (DfT, 1997). The main
difference consists in the use of raised lane dividers that prevent
drivers from using the full carriageway width to reduce curvature,
thus contributing to lower speeds. Researchers agree that the
combined effect of these measures makes turbo-roundabouts safer
than multi-lane roundabouts: in Holland, a before-and-after study
showed that, although offering significantly higher capacities, ‘the
measured effect of turbo-roundabouts on safety is comparable
with that of single-lane roundabouts’ (Fortuijn, 2009a). Mauro
and Cattani (2010) studied the safety of normal and turbo-
roundabouts using a model based on the concept of potential
conflict and concluded that turbo-roundabouts reduce the total
number of potential accidents by between 40% and 50%, and cut
the number of potential accidents with injuries by between 20%
and 30%. Tollazzi et al. (2011) note that, although no formal
evaluation of safety had been undertaken, ‘turbo-roundabouts in
Slovenia have met the expectation as concerns the large capacity
and particularly the high levels of traffic safety’. Giuffre et al.
(2011) described the conversion of three roundabouts in Palermo,
Italy, into turbo-roundabouts. A functional analysis concluded
that the conversion resulted in benefits both for operational
conditions (good channelling for traffic flows and sometimes an
increase of capacity) and safety (reduction of conflict points and
moderate speeds).
While the safety benefits are widely recognised, improved
capacity and delay are not. This is essentially because researchers
have been using methods that do not fully describe the complex
interactions between the different traffic streams of multi-lane
roundabouts. For example, besides the results reported by Giuffre
et al. (2011), Yperman and Immers (2003) also reported global
capacity gains of 12–20%. Their analysis was supported by a
Paramics micro-simulation model calibrated upon the Swiss
roundabout capacity model (Bovy et al., 1991). However, it can
be argued that the Swiss model is regression-based and thus
••
Two entry lanesTwo exit lanes
B
Major legs
Two entry lanesTwo exit lanes
••
Minor legs
• Two entry lanesOne exit lanes•
B
B–D secondary direction
A–C main direction
D
A C A C
D
Figure 1. Analysed layouts: (a) normal roundabout and
(b) turbo-roundabout
2
Transport Capacity of normal and turbo-roundabouts: comparative analysisVasconcelos, Silva and Seco
Offprint provided courtesy of www.icevirtuallibrary.comAuthor copy for personal use, not for distribution

unable to guarantee accurate capacity predictions when the
geometric and operational conditions are outside its calibration
domain. Engelsman and Uken (2007), meanwhile, used the
‘quick-scan’ model, which is a strategic macro-model developed
by the province of South Holland, and estimated capacity gains
for turbo-roundabouts to be between 25% and 35%.
Mauro and Branco (2010) recently developed a robust analysis
based on gap-acceptance theory. In their study, capacity calcula-
tions are lane-based, according to a formula developed by Wu
(2001). Several demand scenarios were studied and it was
concluded that, in most of the cases analysed, a turbo-roundabout
has advantages over a conventional one in terms of performance
levels. It was also concluded that the capacity benefits are very
different for the main and the secondary direction entries. Despite
the fact that this methodology represents a breakthrough in relation
to previous ones, it still leaves room for important improvements.
j Wu’s (2001) generic capacity model is used with the same
simplifications that were assumed for its integration in
HBS 2001 (FGSV, 2001) (the German equivalent of the US
Highway Capacity Manual). These simplifications consist of
making the model insensitive to the traffic flow allocation to
the different circulatory lanes in front of each entry (thus
depending only of the total opposing flow) and using a simple
linear bunching expression to describe the headway
distribution in the opposing flow.
j The proportion of traffic that selects a given entry lane when
alternatives are available (through movements on normal
roundabouts; right-turn movements on turbo-roundabouts)
was assumed to be fixed. In the real world, however, drivers
have various strategies to select the entry lane depending on
how aware and aggressive they are, which tends to result in
different operational conditions in different sites and
entrances.
j The capacities were compared taking as reference a double-
lane conventional roundabout with only one lane per exit, in
one direction (compact roundabout). With this layout,
circulating drivers are forced to weave into the outer lane,
leading to low usage of the inner entry lane. Although this is
not an unusual layout, in many countries – including
Portugal – the number of lanes in the circle and at the exits
is the same, even if only for a limited length of road, which
allows drivers to leave the roundabout without changing lane.
The current paper presents a method that addresses these limit-
ations and provides a more generic and accurate estimation and
comparison of capacity at both normal and turbo-roundabouts.
2. Capacity modelThe capacity model used in this paper is based on Hagring’s
generic capacity formula for a minor stream crossing or merging
independent major streams, each having a Cowan’s M3 headway
distribution (Hagring, 1998)
Ck ¼
exp �Xi2 I k
ºi(tc,i � ˜i)
!Xi2 I k
ºi
1� exp �Xi2 I k
tf , i ºi
! Yi2 I k
�i
�i þ ºi˜i
1:
where k is the minor stream index, Ik is the set of major streams i
conflicting with the minor stream k, �i, ˜i and ºi are the
parameters of the headway distribution for each of the opposing
lanes, and tc, i and tf , i are, respectively, the critical headway and
the follow-up headway for each opposing lane i at entry lane k.
The particular cases for one and two opposing lanes are given by
Equations 2 and 3 respectively
C ¼ q� exp [�º(tc � ˜)]
1� exp (�ºtf )2:
C ¼ exp f�[º1(tc,1 � ˜1)þ º2(tc,2 � ˜2)]g(º1 þ º2)
1� exp [�(tf ,1º1 þ tf ,2º2)]
3�1�2
(�1 þ º1˜1)(�2 þ º2˜2)3:
A first relation between the three Cowan M3 parameters (�, ºand ˜) stems from the method of moments (Equation 4), which
ensures that the mean of the estimated distribution is equal to the
flow q
º ¼ �q
1� ˜q4:
A second relation is required to solve the indetermination. This
relation, also known as a ‘bunching model’, indicates the
proportion of free vehicles in the traffic stream (not driving in
platoons) and can take different shapes such as linear, bilinear or
exponential (Akcelik, 2007; Calıskanelli et al., 2009; Tanyel et
al., 2007). A bilinear relation calibrated for the Portuguese
roundabouts was used for this analysis (Vasconcelos et al.,
2012b)
� ¼1 if q , 0:178
1:553(1� 2q) if 0:178 , q < 0:50 otherwise
8<:
5:
The above bunching relation was calibrated assuming an intra-
platoon headway parameter ˜ ¼ 2 s. Therefore, the model pre-
dicts null capacity when one or more opposing lanes have flows
above 1/˜ (0.5 vehicles/s or 1800 vehicles/h).
3
Transport Capacity of normal and turbo-roundabouts: comparative analysisVasconcelos, Silva and Seco
Offprint provided courtesy of www.icevirtuallibrary.comAuthor copy for personal use, not for distribution

3. Assessment framework
3.1 Scenario definition
The main goal of this analysis was to compare the capacity
performance of a conventional roundabout (four double-lane
entrances and four double-lane exits) with a turbo-roundabout
with similar space requirements (four double-lane entrances, two
double-lane exits and two single-lane exits) (see Figure 1). The
turbo-roundabout was orientated assuming that most through
traffic follows the direction AC. According to the geometric
differences, entries A and C were named ‘major’ while entries B
and D were named ‘minor’.
The main differences in the layouts that affect the capacity
estimations are as follows.
j On a normal roundabout, the outer circulatory lane at the
major entries (A and C) is used by part of the through
movements (DB and BD); on a turbo-roundabout, the
opposing traffic is concentrated in a single lane, which leads
to a fall in capacity.
j On a normal roundabout, drivers in the outer lane of the
minor entries are affected by all circulating vehicles, even if
the trajectories do not actually intersect (Hagring et al., 2003;
Rodegerdts et al., 2007). On a turbo-roundabout, the outer
lane is used only to turn to the right and the opposing traffic
is reduced since part of the through traffic (AC or CA) is
physically separated at the exit.
j While right-turning traffic must use the outer entry lane on
the normal roundabout, both inner and outer lanes can be
used at the minor entries of a turbo-roundabout.
Two main demand scenarios were considered. In both scenarios,
three constant demand levels in the major direction were
assumed: qA ¼ qC ¼ 500, 1000 and 1500 vehicles/h with a
symmetrical split (left, 25%; through, 50%; right, 25%). In the
minor direction, starting from zero, the demand was progressively
increased in 10 vehicles/h steps until one of the roundabout entry
lanes, either minor or major, reached saturation (demand/capacity
ratio x > 1). The following distributions were considered.
j Scenario 1 – symmetrical demand at minor entries:
qBD ¼ qDB, qBC ¼ qDA and qBA ¼ qDC:
j Scenario 2 – anti-symmetrical demand at minor entries:
qBD ¼ qDB, qBC ¼ qDC and qBA ¼ qDA.
The first scenario is typical of a general intersection between a
minor and a major road (common on European ring roads) where
both directions of the major road attract similar levels of traffic.
The second scenario typifies situations where most vehicles from
the two minor entries take the same direction on the major road
– to get to a shopping mall, for example. The capacity was
calculated for each of these two scenarios and demand levels, for
every possible combination of traffic splits (left, through and right
proportions) in 2% steps, resulting in 3978 combinations.
3.2 Entry and opposing flows
As the capacity calculations are lane-based, a lane allocation
procedure of traffic is required. This procedure is based on the
assumption that when drivers have a choice of two lanes to reach
a given destination they will select the one with the lowest degree
of saturation and thus the lowest delay (Fisk, 1991). This behav-
iour can be expected on urban and suburban roundabouts at peak
hours when the majority of drivers know the intersection, are
aware of traffic conditions and are actively looking for shorter
routes. Therefore, in an equilibrium state, the lanes have equal
levels of saturation and the proportion of through traffic using the
inner lane is given by
pI ¼CI(q2 þ q3)� COq1
q2(CI þ CO), pI 2 [0, 1]
6:
where CI and CO are the inside-lane and outside-lane capacities
and q1, q2 and q3 are the demand flows for the left, through and
right movements respectively (for the sake of simplicity, U-turns
were disregarded) (see Figure 2). Similarly, the proportion of
right-turning traffic using the inside lane at a minor entry of a
turbo-roundabout with the layout shown in Figure 1 is given by
pI ¼CIq3 � CO(q1 þ q2)
q3(CI þ CO), pI 2 [0, 1]
7:
It should be noted that this allocation method implies an iterative
traffic assignment process: initial pI values have to be set at each
entry to allow the calculation of entry and opposing flows at each
entry (q, qcf ); then, at each iteration, the new opposing flows are
used to update the capacities, resulting in new lane usage factors
pI: In most cases, this process converges rapidly: as a rule of
thumb, no more than three iterations are required for pI to change
less than 1%.
3.3 Critical and follow-up headways
The gap-acceptance parameters for normal roundabouts used in
this study were estimated from a vast set of field observations at
one-lane and two-lane roundabouts in Portugal, using the
Siegloch, Raff, maximum likelihood, Logit and Wu methods
(Vasconcelos et al., 2012a). It was found that those methods have
important specificities that significantly affect the results and
therefore the capacity estimates. Parameters from the Siegloch
method have been used here since this keeps the closest relation
to the capacity formulas (Brilon et al., 1999). The average values
are presented in Table 1.
Hagring’s generic capacity formula caters for the assumption that
each entry lane may have its own gap-acceptance parameters and
these may also vary for each of the opposing circulatory lanes.
These differences were investigated by Hagring et al. (2003)
using a generalised version of the maximum likelihood method
(Hagring, 2000) based on non-superimposed arrival data. It was
4
Transport Capacity of normal and turbo-roundabouts: comparative analysisVasconcelos, Silva and Seco
Offprint provided courtesy of www.icevirtuallibrary.comAuthor copy for personal use, not for distribution

found that traffic in the inner approach lane was affected equally
by traffic in both circulating lanes, whereas there were significant
differences in the outer lane. When compared with the super-
imposed case, the critical headway was approximately 10%
smaller for the far lane (closest to the central island) and 10%
higher for the near lane (closest to the entry). These conversion
factors were applied to the double-lane data from Table 1,
resulting in the non-superimposed parameters shown in Table 2
for two-lane roundabouts at the near and far lanes.
The value of critical headways for the far lane at the outer entry
may seem unrealistic. However, it reflects the fact that many
right-turning drivers disregard the corresponding opposing traffic,
particularly when they realise that those drivers will continue
circulating to take a different exit.
In the absence of local data for turbo-roundabouts, the parameters
at the different entry lanes were based on the average figures
found for Dutch turbo-roundabouts (Fortuijn, 2009b). The figures
listed in that study for two-lane roundabouts, where only inner
entry data were available (tc ¼ 2.9–3.2 s), are remarkably similar
to those listed in Table 2 and so the average parameters from
Dutch turbo-roundabouts were used (see Table 3).
3.4 Capacity curves
Replacing the gap-acceptance parameters in Equation 1, the
capacity curves (Figures 3 and 4) for the different entry lanes of
normal and turbo-roundabouts are obtained. It becomes clear that
the differences in the critical headway and follow-up times have a
very low impact on capacity (e.g. compare Figures 3(a) and 3(b))
compared with the often-disregarded traffic allocation in the
circulatory lanes. This agrees with the results of a sensitivity
analysis (Hagring, 1998), which revealed that the allocation of
the major flow in different circulatory lanes has a considerable
effect on the capacity for an entering minor stream (up to 20% of
the geometric capacity), resulting in maximum capacity when the
major flow is equally distributed to the circulatory lanes and
minimum capacity when all opposing vehicles circulate in the
lane with the highest critical and follow-up headways.
4. Results
4.1 Scenario 1: symmetrical demand
For major entry flows of 1000 vehicles/h (Figure 5(d)), a maxi-
mum entry flow of 2100 vehicles/h at each minor entry was
reached (which should be added to the entry flow at the major
entries: 1000 vehicles/h per entry, totalling 6200 vehicles/h for
the whole roundabout capacity). As might be expected, this
capacity was obtained for the case when there are no left turns
and the vehicles are more or less equally split between right-
veering and through traffic. The minimum capacity is found when
qcf A
qcf B,L far
qcf B,L near � qcf B,R
qBA
qB,I qB,O
qBC,I
qcf A,far
AqA,IqA,O
qAD
qAC,I
qAB
qAC,O
B
qcf A, near
A
qBD
qA,IqA,O
qAD
qAC,I
qAB
qAC,O
B
qBC,O
Figure 2. Notation for entry and opposing flows
Single-lane
roundabout
Double-lane roundabout
Inside entry lane Outside entry lane
tc: s tf: s tc: s tf: s tc: s tf: s
3.57 2.19 3.06 2.22 2.83 2.26
Table 1. Gap-acceptance parameters estimated from field data
Opposing lane Inside entry lane Outside entry lane
tc: s tf: s tc: s tf: s
Far 3.06 2.22 2.55 2.26
Near 3.06 2.22 3.11 2.26
Table 2. Gap-acceptance parameters assigned to normal
double-lane roundabouts
5
Transport Capacity of normal and turbo-roundabouts: comparative analysisVasconcelos, Silva and Seco
Offprint provided courtesy of www.icevirtuallibrary.comAuthor copy for personal use, not for distribution

all minor entry vehicles turn left (570 vehicles/h per minor
entry).
At the turbo-roundabout, for major entry flows of 1000 vehicles/h
(Figure 5(e)), the maximum flow at the minor roads is slightly
higher (2310 vehicles/h when 68% of the entry traffic turns right
and the other 32% go through). Again, the minimum flow leading
to saturation (580 vehicles/h) occurs when all entry vehicles turn
left.
Finally, the comparison between the two layouts (Figure 5(f))
reveals that the turbo-roundabout has a better relative perform-
ance when the proportion of right turners is very high (above
60%), with gains of up to 114% in the maximum flow at the
minor entries, in relation to that presented by the normal round-
about, for the extreme case when all minor entry drivers turn
right. The worst relative performance of the turbo-roundabout
happens for the opposite demand distribution (34% left and 66%
through), in which case there is a relative reduction of 43% in the
maximum flow at the minor entries.
In order to identify the role of the major flow levels in these
results, the calculations were repeated for two more demand
levels at each of the major entries: low (500 vehicles/h) and high
(1500 vehicles/h) (see Figures 5(a)–5(c) and 5(g)–5(i)). As
expected, lower maximum entry flows at the minor entries were
obtained for the latter case. More interesting, it can be seen that
the higher the existing major flow levels, the higher the propor-
tion of right-turning manoeuvres there will have to be for turbo-
roundabouts to provide higher capacities than normal round-
abouts.
4.2 Scenario 2: anti-symmetrical demand
The maximum capacity of the normal roundabout under anti-
symmetrical demand in the minor entries is obtained when the
proportion of left and right traffic at each entry is the same,
regardless of the proportion of through traffic (see Figure 6(d)).
The optimal split for minor entries is: left, 18%; through, 64%;
right, 18% (1650 vehicles/h at each of the minor entries). The
minimum capacity (650 vehicles/h at each minor entry) is
obtained when through traffic is null and all minor entry vehicles
take the same direction on the major road.
The maximum capacity on the turbo-roundabout (Figure 6(e)) is
lower than a normal roundabout, and is also obtained for equal
proportions of left and right traffic but for a null proportion of
through traffic (1150 vehicles/h).
Opposing lane Minor direction Major direction
Inside lane Outside lane Inside lane Outer lane
tc: s tf: s tc: s tf: s tc: s tf: s tc: s tf: s
Far lane 3.2 2.2 3.9 2.1 3.6 2.2 3.9 2.1
Near lane 3.2 2.2 3.9 2.1 3.6 2.2 3.9 2.1
Table 3. Gap-acceptance parameters assigned to
turbo-roundabouts (average figures from Holland)
Proportion of traffic in the near/far lanes100/075/2550/50
0
200
400
600
800
1000
1200
1400
1600
1800
0 500 1000 1500 2000 2500 3000 3500 4000
Cap
acity
: veh
icle
s/h
Total opposing flow: vehicles/h(a)
0
200
400
600
800
1000
1200
1400
1600
1800
0 500 1000 1500 2000 2500 3000 3500 4000
Cap
acity
: veh
icle
s/h
Total opposing flow: vehicles/h(b)
Figure 3. Normal roundabout: capacity against circulatory traffic
for different allocations of vehicles in the circulatory lanes
(near/far). Major and minor directions: (a) inner lane; (b) outer
lane
6
Transport Capacity of normal and turbo-roundabouts: comparative analysisVasconcelos, Silva and Seco
Offprint provided courtesy of www.icevirtuallibrary.comAuthor copy for personal use, not for distribution

The comparison of capacities under the two layouts (Figure 6(f))
reveals that the turbo-roundabout performs slightly better than the
normal one when the proportion of through traffic is very low,
with gains below 20% in the secondary direction. The worst
relative performance of the turbo-roundabout is obtained when all
minor entry drivers go through, in which case there is a 42%
reduction in relation to the normal roundabout.
The impact of major flow levels on the minor entry capacity is
similar to the symmetrical demand case (Figures 5(a)–5(c) and
5(g)–5(i)): higher flows in the major direction lead to higher
optimal proportions of right- or left-turning traffic, and to a
general lower relative performance of turbo-roundabouts. In fact,
for very high demand levels in the main direction (above
2000 vehicles/h), the normal roundabout offers higher capacity
than the turbo, regardless of the directional split at the minor
entries.
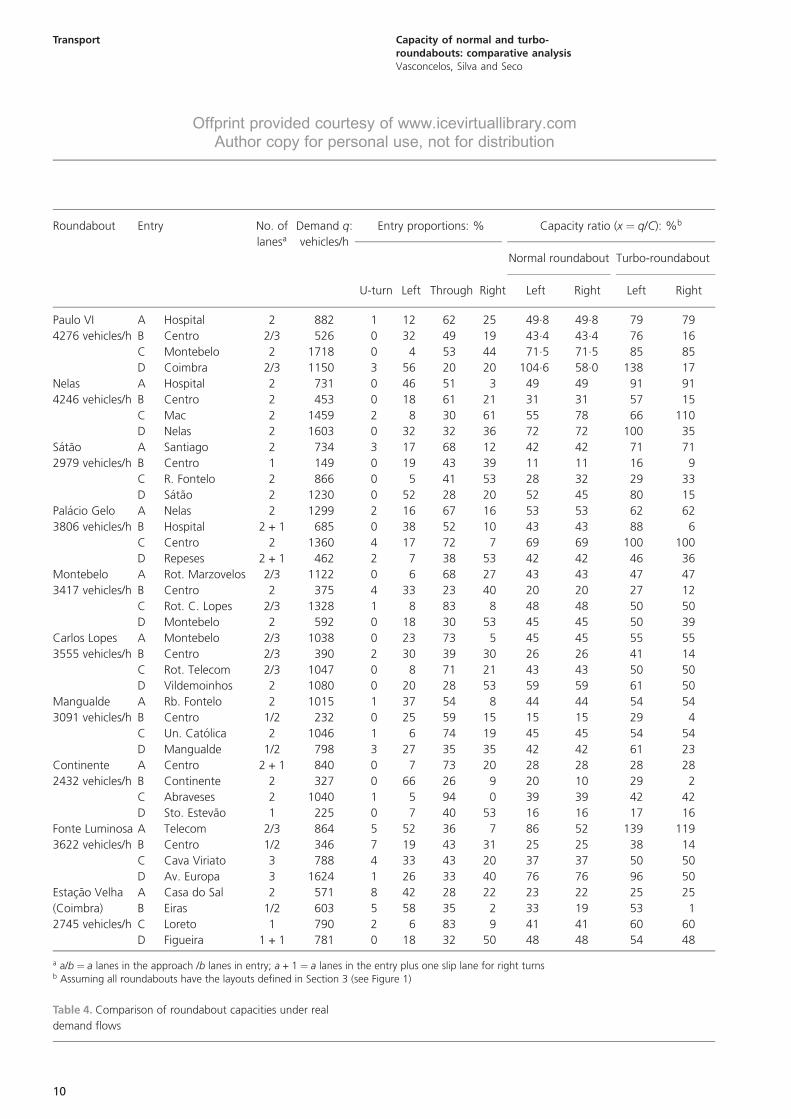
4.3 Expected results in real roundabouts
In order to assess the operational differences under real, common,
split-demand situations, data were collected at ten roundabouts,
mostly in the city of Viseu, Portugal, during the morning rush
hour (8.00–9.00 a.m.) (see Table 4). The volumes were obtained
from manual counts and the proportions were obtained by visual
tracking of random vehicles at each entry (approximately 150
vehicles per entry). Most of these roundabouts are on an urban
ring road and are optimised for capacity with flared entries or slip
lanes.
Analysis of the entry proportions indicates that these roundabouts
are operating under typical conditions, as follows.
j Unequal distribution of traffic among entries, with a clear
distinction between major and minor directions (identified in
Table 4 as A or C and B or D entries respectively).
j In the major direction, the through movement is usually much
more important than in the minor direction (average
respective proportions of 62% and 34% of the corresponding
total entry flow).
j Usually, demand for the right turn and for the left and
U-turns combined is similar.
j U-turn movements are of little significance.
For comparison purposes, the capacities were calculated assum-
ing the reference layouts defined earlier. Taking the Paulo VI
roundabout as an example, at major entry A (hospital), the
concentration of opposing traffic in a single lane raises the
saturation ratio from 49.8% to 79%. At minor entry B
(Centro), the proportion of right turners is very low (19%),
which leads to wasted capacity at the right lane and unequal
saturation ratios at the left and right entry lanes (76% and
16%). The normal roundabout allows distribution of the
through traffic, resulting in equal (and lower) saturation ratios
(43.4% for both lanes).
The results clearly show that the turbo-roundabout layout, under
typical traffic distributions and for the reasons already stated in
Section 3, is no match for the normal roundabout from the
capacity point of view. The capacity of the major entries is
always higher on the normal roundabouts, with differences of up
to 67% (roundabout Fonte Luminosa, entry A). Regarding the
minor entries, while at most normal roundabouts the capacity
ratios are equal for both lanes of a given entry, the turbo-
0
200
400
600
800
1000
1200
1400
1600
1800
0 500 1000 1500 2000
Cap
acity
: veh
icle
s/h
Opposing flow: vehicles/h(a)
0
200
400
600
800
1000
1200
1400
1600
1800
0 500 1000 1500 2000Opposing flow: vehicles/h
(b)
0
200
400
600
800
1000
1200
1400
1600
1800
0 500 1000 1500 2000 2500 3000 3500 4000Total opposing flow: vehicles/h
(c)
Proportion of traffic in the near/far lanes100/075/2550/50
Figure 4. Turbo-roundabout: capacity against circulatory traffic
for different allocations of vehicles in the circulatory lanes
(near/far). (a) Major direction; inner lane. (b) Major and minor
directions; outer lane. (c) Minor direction; inner lane
7
Transport Capacity of normal and turbo-roundabouts: comparative analysisVasconcelos, Silva and Seco
Offprint provided courtesy of www.icevirtuallibrary.comAuthor copy for personal use, not for distribution

roundabout layout leads to unequal saturation levels, with
differences that can be up to 82% (roundabout Palacio Gelo,
entry B).
5. ConclusionThe iterative capacity calculation procedure presented in this
paper, based on gap-acceptance theory, allows accurate capacity
estimations of normal and turbo-roundabouts. The capacity of
these two layouts was compared for a wide range of demand
scenarios, using synthetic data, leading to the following conclu-
sions.
j Capacities at the major entries of a turbo-roundabout are
always lower than for normal roundabouts because opposing
500
Proportion of right-turning traffic: %(g)
Proportion of right-turning traffic: %(h)
800
1·2
800
1100
1400
1700
2000
2300
800
1100
1400
1700
2000
2300
2600
0
20
40
60
80
100
0 20 40 60 80 100
Prop
ortio
n of
left
-tur
ning
tra
ffic
: %
�0·3
0·0
0·3
0·6
0·92300
2600
2600
800
1100
1400
1700
2000
2300
0
20
40
60
80
100
0 20 40 60 80 100
�0·30·0
0·30·6
0
20
40
60
80
100
0 20 40 60 80 100
800
1100
1400
500
800
1100
1400
1700
0
20
40
60
80
100
0 20 40 60 80 100
Prop
ortio
n of
left
-tur
ning
tra
ffic
: %
�0·3
0·0
0·3
0·6
0·9
500
11001400
17000
20
40
60
80
100
0 20 40 60 80 100
�0·3
0·0
0·3
0
20
40
60
80
100
0 20 40 60 80 100
500
800
1100
1400
1700
(a) (b) (c)
Proportion of right-turning traffic: %(i)
800
1100
1400
1700
2000
500
800
1100
1400
1700
2000
2300
0
20
40
60
80
100
0 20 40 60 80 100
Prop
ortio
n of
left
-tur
ning
tra
ffic
: % �0·3
0·0
0·3
0·6
0·9800
1100
1400
1700
2000
23000
20
40
60
80
100
0 20 40 60 80 100
�0·3
0·0
0·3
0
20
40
60
80
100
0 20 40 60 80 100
500
800
1100
1400
1700
2000
2300
(d) (e) (f)
800
1100
1400
1700
2000
2900 1·2
1·2
Figure 5. Maximum demand flow at minor entries under
symmetrical demand. Left-hand plots, normal roundabout;
centre, turbo-roundabout; right, relative difference
((Cturbo � Cnormal)/Cnormal). (a)–(c), qA ¼ qC ¼ 500 vehicles/h;
(d)–(f), qA ¼ qC ¼ 1000 vehicles/h; (g)–(i),
qA ¼ qC ¼ 1500 vehicles/h
8
Transport Capacity of normal and turbo-roundabouts: comparative analysisVasconcelos, Silva and Seco
Offprint provided courtesy of www.icevirtuallibrary.comAuthor copy for personal use, not for distribution

traffic is concentrated in a single lane (the effect is more
significant when traffic is evenly distributed in the major
lanes of a normal roundabout).
j The relative performance of the turbo-roundabout worsens
with increasing demand levels in the major direction.
j At the minor entries, the turbo-roundabout performs better
only under very specific demand scenarios, specifically when
the proportion of right-turning traffic is very high. That
proportion depends on the demand levels in the major
direction and is usually above 60%.
800
1000
1200
1400
1600
1800
2000
2200
1000
1200
1400
1600
1800
20002200
0
20
40
60
80
100
0 20 40 60 80 100
Prop
ortio
n of
left
-tur
ning
tra
ffic
: %
0
20
40
60
80
100
0 20 40 60 80 1000
20
40
60
80
100
0 20 40 60 80 100
800
1000
1200
1400
1600
1800
2000
2200
1200
1400
�0·4
�0·3
�0·2
�0·1
0·0
0·1
0·2
�0·4
�0·3
�0·2
�0·1
0·0
0·1
0·1
0·0
(a) (b) (c)
800
1000
1200
600
800
1000
0
20
40
60
80
100
0 20 40 60 80 100
Prop
ortio
n of
left
-tur
ning
tra
ffic
: %
0
20
40
60
80
100
0 20 40 60 80 1000
20
40
60
80
100
0 20 40 60 80 100
600
800
1000
1200600
700
�0·4
�0·3
�0·2
�0·1
0·0
0·1
0·2
�0·4
�0·3
�0·2
Proportion of right-turning traffic: %(i)
600600
400
500
Proportion of right-turning traffic: %(g)
Proportion of right-turning traffic: %(h)
400
800
1000
1200
1400
1600
1800
1000
1200
1400
1600
800
0
20
40
60
80
100
0 20 40 60 80 100
Prop
ortio
n of
left
-tur
ning
tra
ffic
: %
0
20
40
60
80
100
0 20 40 60 80 1000
20
40
60
80
100
0 20 40 60 80 100
800
1000
1200
1400
1600
1800
1000
1100
�0·4
�0·3
�0·2
�0·1
0·0
0·1
0·2
�0·4
�0·3
�0·2
�0·1
0·0
0·2
0·1
0·0
(d) (e) (f)
600600
900
0·1
0·2
Figure 6. Maximum demand flow at minor entries under
anti-symmetrical demand. Left-hand plots, normal roundabout;
centre, turbo-roundabout; right, relative difference
((Cturbo � Cnormal)/Cnormal). (a)–(c), qA ¼ qC ¼ 500 vehicles/h;
(d)–(f), qA ¼ qC ¼ 1000 vehicles/h; (g)–(i),
qA ¼ qC ¼ 1500 vehicles/h
9
Transport Capacity of normal and turbo-roundabouts: comparative analysisVasconcelos, Silva and Seco
Offprint provided courtesy of www.icevirtuallibrary.comAuthor copy for personal use, not for distribution
Roundabout Entry No. of
lanesa
Demand q:
vehicles/h
Entry proportions: % Capacity ratio (x ¼ q/C): %b
Normal roundabout Turbo-roundabout
U-turn Left Through Right Left Right Left Right
Paulo VI A Hospital 2 882 1 12 62 25 49.8 49.8 79 79
4276 vehicles/h B Centro 2/3 526 0 32 49 19 43.4 43.4 76 16
C Montebelo 2 1718 0 4 53 44 71.5 71.5 85 85
D Coimbra 2/3 1150 3 56 20 20 104.6 58.0 138 17
Nelas A Hospital 2 731 0 46 51 3 49 49 91 91
4246 vehicles/h B Centro 2 453 0 18 61 21 31 31 57 15
C Mac 2 1459 2 8 30 61 55 78 66 110
D Nelas 2 1603 0 32 32 36 72 72 100 35
Satao A Santiago 2 734 3 17 68 12 42 42 71 71
2979 vehicles/h B Centro 1 149 0 19 43 39 11 11 16 9
C R. Fontelo 2 866 0 5 41 53 28 32 29 33
D Satao 2 1230 0 52 28 20 52 45 80 15
Palacio Gelo A Nelas 2 1299 2 16 67 16 53 53 62 62
3806 vehicles/h B Hospital 2 + 1 685 0 38 52 10 43 43 88 6
C Centro 2 1360 4 17 72 7 69 69 100 100
D Repeses 2 + 1 462 2 7 38 53 42 42 46 36
Montebelo A Rot. Marzovelos 2/3 1122 0 6 68 27 43 43 47 47
3417 vehicles/h B Centro 2 375 4 33 23 40 20 20 27 12
C Rot. C. Lopes 2/3 1328 1 8 83 8 48 48 50 50
D Montebelo 2 592 0 18 30 53 45 45 50 39
Carlos Lopes A Montebelo 2/3 1038 0 23 73 5 45 45 55 55
3555 vehicles/h B Centro 2/3 390 2 30 39 30 26 26 41 14
C Rot. Telecom 2/3 1047 0 8 71 21 43 43 50 50
D Vildemoinhos 2 1080 0 20 28 53 59 59 61 50
Mangualde A Rb. Fontelo 2 1015 1 37 54 8 44 44 54 54
3091 vehicles/h B Centro 1/2 232 0 25 59 15 15 15 29 4
C Un. Catolica 2 1046 1 6 74 19 45 45 54 54
D Mangualde 1/2 798 3 27 35 35 42 42 61 23
Continente A Centro 2 + 1 840 0 7 73 20 28 28 28 28
2432 vehicles/h B Continente 2 327 0 66 26 9 20 10 29 2
C Abraveses 2 1040 1 5 94 0 39 39 42 42
D Sto. Estevao 1 225 0 7 40 53 16 16 17 16
Fonte Luminosa A Telecom 2/3 864 5 52 36 7 86 52 139 119
3622 vehicles/h B Centro 1/2 346 7 19 43 31 25 25 38 14
C Cava Viriato 3 788 4 33 43 20 37 37 50 50
D Av. Europa 3 1624 1 26 33 40 76 76 96 50
Estacao Velha A Casa do Sal 2 571 8 42 28 22 23 22 25 25
(Coimbra) B Eiras 1/2 603 5 58 35 2 33 19 53 1
2745 vehicles/h C Loreto 1 790 2 6 83 9 41 41 60 60
D Figueira 1 + 1 781 0 18 32 50 48 48 54 48
a a/b ¼ a lanes in the approach /b lanes in entry; a + 1 ¼ a lanes in the entry plus one slip lane for right turnsb Assuming all roundabouts have the layouts defined in Section 3 (see Figure 1)
Table 4. Comparison of roundabout capacities under real
demand flows
10
Transport Capacity of normal and turbo-roundabouts: comparative analysisVasconcelos, Silva and Seco
Offprint provided courtesy of www.icevirtuallibrary.comAuthor copy for personal use, not for distribution

j The traffic data collected at Portuguese roundabouts suggest
that the abovementioned demand scenarios are relatively
uncommon in real-world applications.
In brief, under most demand scenarios, a two-lane roundabout
provides more capacity than the equivalent turbo-roundabout.
However, this does not diminish the usefulness of turbo-round-
abouts. Most conventional roundabouts currently operate far
below capacity and most would still do so if they were converted.
In addition, their improved operational safety is widely recog-
nised, which makes them a true alternative to other unsignalled
intersections.
AcknowledgementThis work was supported by FCT (Portugal) in the scope of the
R&D project PTDC/SEN-TRA/122114/2010 (AROUND – Novos
Instrumentos de Avaliacao Operacional e Ambiental de Rotun-
das).
REFERENCES
Akcelik R (2007) A review of gap-acceptance capacity models.
Proceedings of 29th Conference of Australian Institute of
Transport Research (CAITR 2007), Adelaide, Australia.
Bovy H, Dietrich K and Harmann A (1991) Guide Suisse des
Giratoires. Xxxxxxxxxxxxxxx, Lausanne, Switzerland.
Brilon W (2011) Studies on roundabouts in Germany: lessons
learned. Proceedings of International Roundabout
Conference, Carmel, IN, USA.
Brilon W, Koenig R and Troutbeck RJ (1999) Useful estimation
procedures for critical gaps. Transportation Research Part A:
Policy and Practice 33(3–4): 161–186.
Calıskanelli P, Ozuysal M, Tanyel S and Yayla N (2009)
Comparison of different capacity models for traffic circles.
Transport 24(4): 257–264.
DfT (Department for Transport) (1997) Section 2: Design of road
markings at roundabouts. Design Manual for Roads and
Bridges Volume 6. Department for Transport, London, UK.
Elvik R (2003) Effects on road safety of converting intersections
to roundabouts: review of evidence from non-U.S. studies.
Transportation Research Record 1847: 1–10.
Engelsman JC and Uken M (2007) Turbo roundabouts as an
alternative to two lane roundabouts. Proceedings of 26th
Annual Southern African Transport Conference,
Pietermaritzburg, KwaZulu-Natal, South Africa.
FGSV (Forschungsgesellschaft fur Strassen und Verkehrwesch)
(2001) Handbuch fur Bemessung von Strassen. FGSV,
Cologne, Germany (in German).
Fisk CS (1991) Traffic performance analysis at roundabouts.
Transportation Research 25B(2–3): 89–102.
Fortuijn L (2009a) Turbo roundabouts – design principles and
safety performance. Transportation Research Record 2096:
16–24.
Fortuijn L (2009b) Turbo roundabouts – estimation of capacity.
Transportation Research Record 2130: 83–92.
Giuffre O, Guerrieri M and Grana A (2011) Turbo-roundabout
general design criteria and functional principles: case studies
from real world. Proceedings of 4th International Symposium
on Highway Geometric Design, Valencia, Spain.
Transportation Research Board, Valencia, Spain.
Hagring O (1998) A further generalization of Tanner’s formula.
Transportation Research Part B: Methodological 32(6): 423–
429.
Hagring O (2000) Estimation of critical gaps in two major
streams. Transportation Research Part B: Methodological
34(4): 293–313.
Hagring O, Rouphail NM and Sørensen HA (2003) Comparison
of capacity models for two-lane roundabouts. Transportation
Research Record 1852: 114–123.
Lindenmann H (2006) Capacity of small roundabouts with two-
lane entries. Transportation Research Record 1988: 119–126.
Mauro R and Branco F (2010) Comparative analysis of compact
multilane roundabouts and turbo-roundabouts. Journal of
Transportation Engineering 136(4): 316–322.
Mauro R and Cattani M (2010) Potential accident rate of turbo-
roundabouts. Proceedings of 4th International Symposium on
Highway Geometric Design, Valencia, Spain. Transportation
Research Board, Valencia, Spain.
Montella A (2011) Identifying crash contributory factors at urban
roundabouts and using association rules to explore their
relationships to different crash types. Accident Analysis &
Prevention 43(4): 1451–1463.
Rodegerdts L, Blogg M, Wemple E et al. (2007) Roundabouts in
the United States. Transportation Research Board,
Washington, DC, USA, NCHRP report 572.
Rodegerdts L, Bansen J, Tiesler C et al. (2010) Roundabouts: An
Informational Guide, 2nd edn. Transportation Research
Board, Washington, DC, USA, NCHRP report 672.
Setra (Service d’Etudes Techniques des Routes et Autoroutes)
(1998) Amenagement des Carrefours Interurbains sur les
Routes Principales – Carrefours Plans – Guide Technique.
Service d’Etudes Techniques des Routes et Autoroutes,
Bagneux, France.
Silva AB and Seco AJM (2005) Trajectory deflection influence on
the performance of roundabouts. Proceedings of European
Transport Conference 2005, Strasbourg, France.
Silva AB, Seco AJM and Silva JPC (2006) Characterization of
trajectories adopted at roundabout crossings. Proceedings of
European Transport Conference (ETC), Strasbourg, France.
Association for European Transport, Strasbourg, France.
Tanyel S, Baran T and Ozuysal M (2007) Applicability of various
capacity models for single-lane roundabouts in Izmir,
Turkey. Journal of Transportation Engineering 133(12):
647–653.
Tollazzi T, Rencelj M and Turnsek S (2011) Slovenian experiences
with alternative types of roundabouts – ‘turbo’ and ‘flower’
roundabouts. Proceedings of 8th International Conference on
Environmental Engineering, Vilnius, Lithuania. Vilnius
Gediminas Technical University Press, Vilnius, Lithuania.
Vasconcelos ALP, Seco AJM and Silva AB (2012a) Estimation of
critical and follow-up headways at roundabouts. Proceedings
11
Transport Capacity of normal and turbo-roundabouts: comparative analysisVasconcelos, Silva and Seco
Offprint provided courtesy of www.icevirtuallibrary.comAuthor copy for personal use, not for distribution

of the 91st Annual Meeting of the Transportation Research
Board. Transportation Research Board, Washington, DC, USA.
Vasconcelos ALP, Silva AB, Seco AJM and Silva JP (2012b)
Estimating the parameters of Cowan’s M3 headway
distribution for roundabout capacity analyses. Baltic Journal
of Road and Bridge Engineering VII(4).
Wu N (2001) A universal procedure for capacity determination at
unsignalized (priority-controlled) intersections. Transportation
Research Part B: Methodological 35(6): 593–623.
Yperman I and Immers LH (2003) Capacity of a turbo-roundabout
determined by micro-simulation. Proceedings of 10th World
Congress on ITS, Madrid, Spain.
WHAT DO YOU THINK?
To discuss this paper, please email up to 500 words to the
editor at [email protected]. Your contribution will be
forwarded to the author(s) for a reply and, if considered
appropriate by the editorial panel, will be published as a
discussion in a future issue of the journal.
Proceedings journals rely entirely on contributions sent in
by civil engineering professionals, academics and students.
Papers should be 2000–5000 words long (briefing papers
should be 1000–2000 words long), with adequate illustra-
tions and references. You can submit your paper online via
www.icevirtuallibrary.com/content/journals, where you
will also find detailed author guidelines.
12
Transport Capacity of normal and turbo-roundabouts: comparative analysisVasconcelos, Silva and Seco
Offprint provided courtesy of www.icevirtuallibrary.comAuthor copy for personal use, not for distribution