capital markets day 2017 - randstad/media/files/r/randstad-ir-v2/results... · london | capital...
TRANSCRIPT

capital markets day
2017
human forward.
london.

jacques van den broek, CEO
group strategy & vision
london | capital markets day | november 21 2017

|
agenda
our new brand positioning 6
strategic roadmap 7
ABFS 2018 9
tech as a differentiator 10
a structural growth industry 11
topline growth accelerating versus peers 12
14
conclusion 16
© Randstad 3
tech & touch initiatives by Randstad

| |
traditional authority via legacy.
personal. helpful. caring. relationship-focused.
innovative authority via change through data.
generic players
professional players tech players
more tech, algorithm driven.
our brand positioning tech-driven but human
© Randstad 4

| |
strategic roadmap best people, strong concepts, excellent execution & superior brands
© Randstad 5
our ultimate goal by 2030, we will touch the work life of 500 million people worldwide
grow to 5-6% ebita profitable growth improve margin increase productivity

| |
strategic roadmap best people, strong concepts, excellent execution & superior brands
© Randstad 6
• productivity (GP/FTE) up 3% YTD • prior cost savings programs on track • new cost savings of €90-100M
• inhouse growth 18% YTD 2017 • professionals growth 4% YTD 2017 • perm growth 9% YTD 2017 • SME growth 10% YTD 2017
• TTA -> enterprise clients • growth in MSP (+11%) & RPO (+30%) YTD 2017
• HR Tech opco initiatives
our ultimate goal by 2030, we will touch the work life of 500 million people worldwide
grow to 5-6% ebita profitable growth improve margin increase productivity

| |
ABFS 2018 integrated tech approach is crucial
© Randstad 7

| |
tech as a differentiator: higher barriers to entry, favouring big players in a fragmented market where scale and proximity matter
© Randstad 8
contingent w
ork
forc
e
perm
integrated talent management
talent engagement digital platforms
self-service platforms
tech touch tech touch
tech touch tech touch
SME clients large

| |
0,0%
0,3%
0,5%
0,8%
1,0%
1,3%
1,5%
1,8%
2,0%
2,3%
2,5%
2,8%
3,0%
3,3%
Belgium France Germany Netherlands Spain Japan US Italy
2007 2015
a structural growth industry staffing penetration rates rise over time
9 |
trends and growth drivers
globalization
technology
demographics
variety of work forms
governance of work
© Randstad
source: CIETT

| |
topline growth accelerating vs. peers powered by integrated tech
© Randstad 10
0%
5%
10%
15%
Randstad Peer 1 Peer 2
15%
20%
25%
30%
Randstad Peer 1 Peer 2
5%
10%
15%
Randstad Peer 1 Peer 2
-8%
-6%
-4%
-2%
0%
2%
4%
6%
8%
10%
2012 2013 2014 2015 2016 2017
Randstad Peer 1 Peer 2
organic revenue pwd growth by quarter, 2012-2017
france
italy
iberia
organic revenue pwd growth, 2017 YTD

| |
inhouse: strong growth continuing future powered by tech
© Randstad 11
1,5 1,9 1,9
1,3 2,0
2,6 3,1 3,2
3,6 4,2
4,6 9,1% 11,1% 11,0% 10,6%
14,1% 15,0%
17,9% 19,5%
21,0% 21,9%
22,4%
0%
5%
10%
15%
20%
25%
2006 2007 2008 2009 2010 2011 2012 2013 2014 2015 2016
--
500
1.000
1.500
2.000
2.500
3.000
3.500
4.000
4.500
Inhouse Rev (€ B) share of total revenuewhat is inhouse services? • high volume clients • high productivity • high customer intimacy (98% retention
rate, often 100% market share) • Average organic sales growth rate
2006-2016: c. 10%
18%
-2%
-29%
25% 21%
15%
9% 12% 11% 10%
18%
12%
-2%
-27%
13% 9%
-3%
-1% 4%
6% 5%
8%
2007 2008 2009 2010 2011 2012 2013 2014 2015 2016 2017 YTD
-30%
-20%
-10%
0%
10%
20%
30%
Inhouse organic growth group organic growth|
| 12
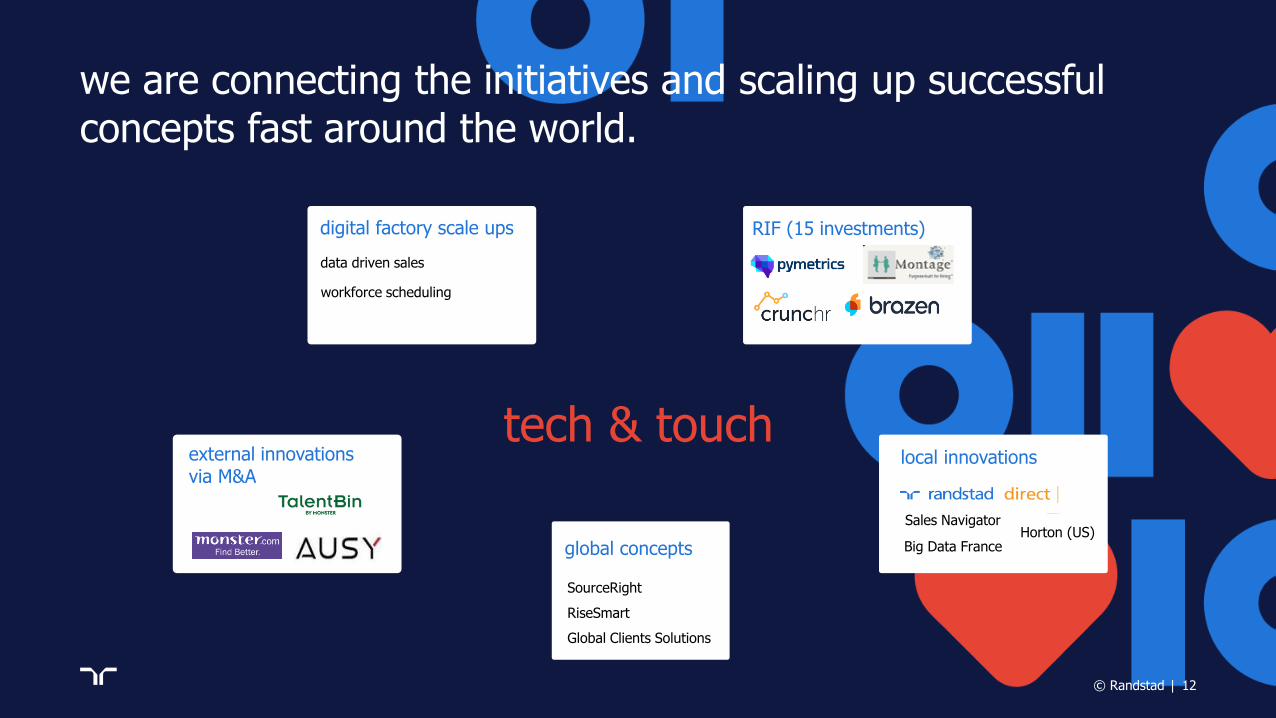
we are connecting the initiatives and scaling up successful concepts fast around the world.
|
tech & touch
RIF (15 investments) digital factory scale ups
data driven sales
workforce scheduling
external innovations via M&A
Capabilities (eg. SEO)
local innovations
Sales Navigator
Big Data France Ploy global concepts
SourceRight
RiseSmart
Global Clients Solutions
Horton (US)
© Randstad

| © Randstad 13
experiment, focus, proof, scale up validate business cases on hard data & leading KPIs
problem/solution fit product/market fit scale
pilot MVP roll-out
addressable market achievements so far growth potential
gro
up P
&L im
pact
tools

| © Randstad 14
conclusion
• integrated tech approach is crucial
• higher barriers to entry, in favour of big players
• riding the learning curve: experiment, focus, proof, scale up
• large addressable market size identified
ambition
gain further market share driven by our
differentiating tech & touch strategy

|
agenda
10.30 – 11.00 financial strategy & trading update
Robert Jan van de Kraats
11.00 – 11.30 Q&A
11.30 – 11.45 coffee break
11.45 – 12.15 US staffing/professionals & Monster
Linda Galipeau/Chris Kibarian
12.15 – 12.30 Q&A
12.30 – 13.30 buffet lunch
13.30 – 14.00 digital strategy: deep dive Jacques van
den Broek
© Randstad 15
14.00 – 15.00 data driven sales NL & France
Dominique Hermans & Sébastien Hélaine
15.00 – 15.15 coffee break
15.15 – 16.00 workforce scheduling François Béharel
16.00 – 16.30 enterprise clients Rebecca Henderson
16.30 – 16.45 wrap up
16.45 – 17.30 drinks and canapes


robert jan van de kraats, CFO
financial strategy & trading update
london | capital markets day | november 21 2017

|
agenda
current trading & outlook 21
revenue growth accelerating versus peers 22
perm: a major opportunity 24
cost savings update: consistent benchmarking 26
EBITA margin progression & outlook 27
M&A update & outlook 29
FCF stability through the cycle 31
capital allocation priorities 33
© Randstad 18
conclusion 34

| |
current trading
• revenue growth in October in line with
Q3 (+9%)
• volume trend in November so far appears
to be in line with October
• robust growth in Europe continued,
North America slightly improving
© Randstad 19
outlook
• there will be an adverse 2.4%
comparison in Q4
• gross margin in Q4 is expected to be
stable sequentially
• for Q4, operating expenses are expected
to be stable sequentially
• there will be an adverse 0.5 working day
impact in Q4 2017
|

| |
topline growth accelerating vs. peers driven by improving macro in europe and integrated tech
organic revenue growth by quarter, 2012-2017
© Randstad 20
-8%
-6%
-4%
-2%
0%
2%
4%
6%
8%
10%
2012 2013 2014 2015 2016 2017
Randstad Peer 1 Peer 2
• france still c.15% below 2007 peak • penetration rate in iberia (0.6%) and italy (1.2%)
markedly below european average • u.s. above peak and still growing
| |
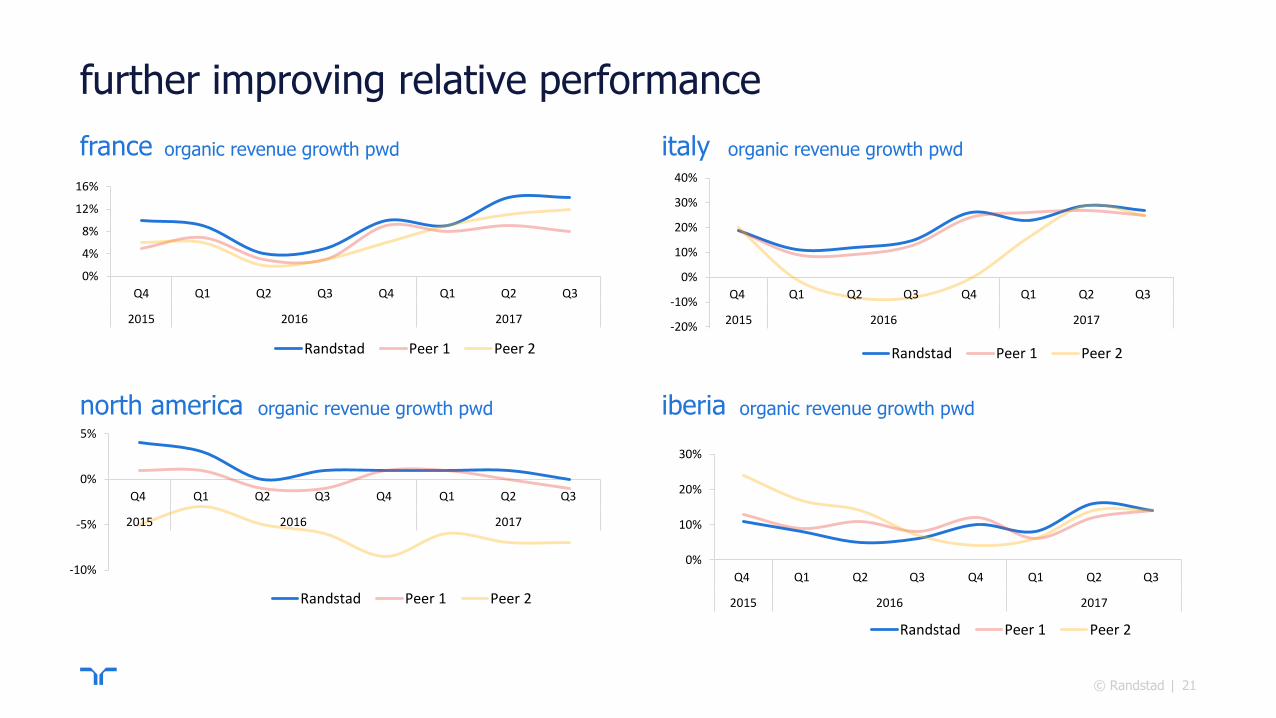
further improving relative performance
france italy
0%
4%
8%
12%
16%
Q4 Q1 Q2 Q3 Q4 Q1 Q2 Q3
2015 2016 2017
Randstad Peer 1 Peer 2
-20%
-10%
0%
10%
20%
30%
40%
Q4 Q1 Q2 Q3 Q4 Q1 Q2 Q3
2015 2016 2017
Randstad Peer 1 Peer 2
-10%
-5%
0%
5%
Q4 Q1 Q2 Q3 Q4 Q1 Q2 Q3
2015 2016 2017
Randstad Peer 1 Peer 2
0%
10%
20%
30%
Q4 Q1 Q2 Q3 Q4 Q1 Q2 Q3
2015 2016 2017
Randstad Peer 1 Peer 2
north america iberia
© Randstad 21
organic revenue growth pwd organic revenue growth pwd
organic revenue growth pwd organic revenue growth pwd

| |
perm: a major opportunity
© Randstad 22
Chin
a
UK
AU
S
gro
up
0%
10%
20%
30%
40%
50%
60%
70%
80%
90%
FR
IT
NL
BE
ES
NAM
DE
IB
7%
9%
• In 2017 YTD perm made up 10% of
group GP (~12% in 2007)
• We have the potential to double in
established markets
• Strategic focus paying off as we outgrow
our peer group average
perm as % of GP, FY 2016
1 Competitors; Page group, Hays, Adecco, Manpower
& Robert Half
avg. growth competitors 1
2
2 Organic growth, excluding RPO
2017 YTD perm growth
previous group peak: 12%
|
| |
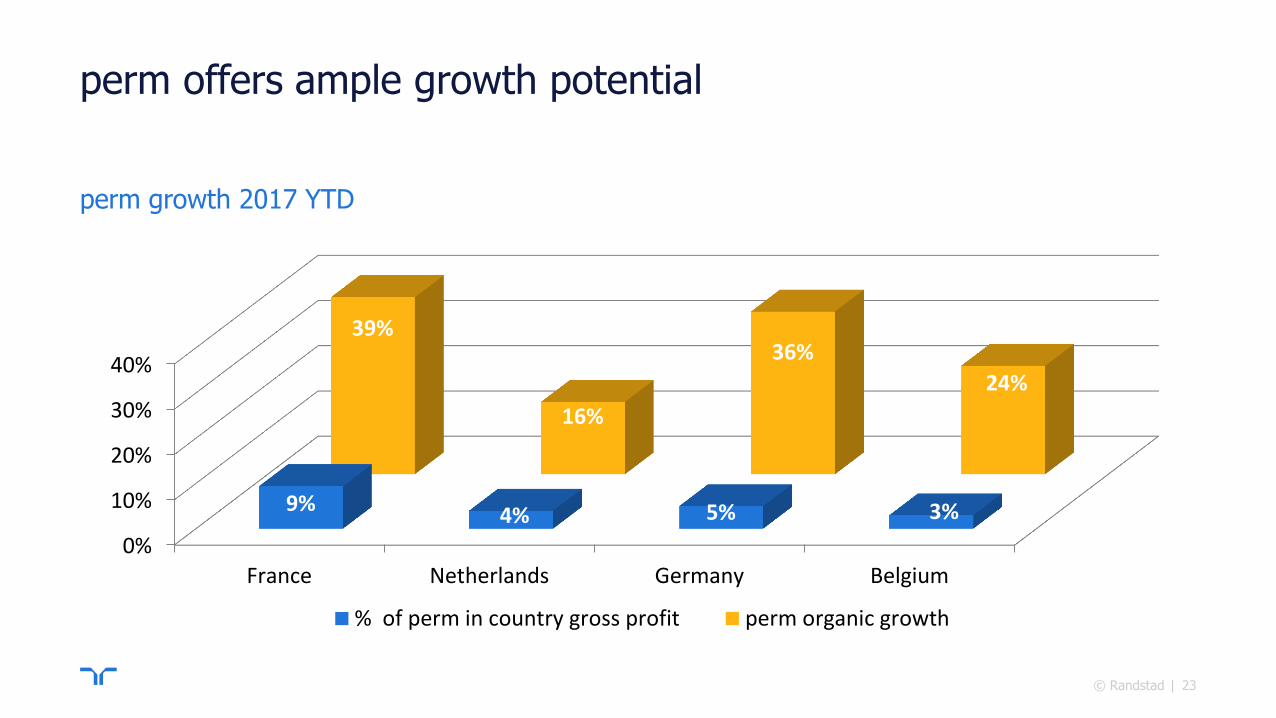
perm offers ample growth potential
perm growth 2017 YTD
© Randstad 23
0%
10%
20%
30%
40%
France Netherlands Germany Belgium
9% 4% 5% 3%
39%
16%
36%
24%
% of perm in country gross profit perm organic growth
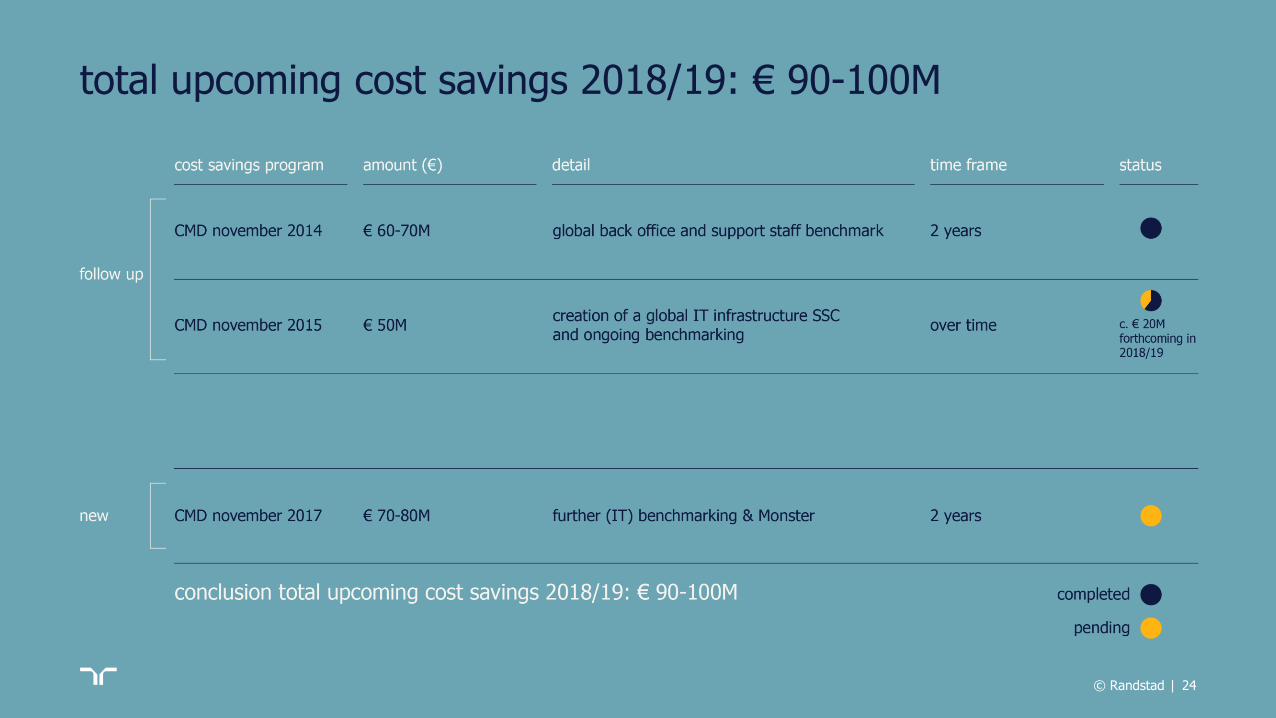
| © Randstad 24
total upcoming cost savings 2018/19: € 90-100M

| |
adjusted EBITA margin progression in 2017: a balancing act adjusted for digital investments & working day effect
© Randstad 25
3,6% 3,8% 3,8%
4,7% 4,5%
5,0% 5,1% 4,9%
5,4%
3%
4%
5%
6%
Q1 2016 Q1 2017(reported)
Q1 2017(adjusted)
Q2 2016 Q2 2017(reported)
Q2 2017(adjusted)
Q3 2016 Q3 2017(reported)
Q3 2017(adjusted)

|
topline growth
business mix
digital opex
© Randstad 26
ebita margin outlook 2017/18
topline growth • consensus + 4.5%
sales growth 2018 • expected market
outperformance
business mix • focus on perm/profs/inhouse/SME;
pricing
digital • ongoing investments • early signs of additional
sales growth
opex • € 90-100M annual
savings by 2019
consensus FY 2017 EBITA margin: 4.6%
outlook 2018: further progression towards 5-6% EBITA margin

| |
acquired companies well on track
© randstad 27
aim to be top 3 in local Staffing
market
strengthen Professionals business
progress towards EVA after 3 years
accelerate digital strategy
in line
ahead
underway
ahead
underway
ahead

| © Randstad 28
M&A outlook 2018 and beyond
tech & touch strategy
• mainly organic through
digital factory
• repair Monster & global
roll-out
professionals
• acceleration through Ausy
(organic & bolt-on M&A)
• over time: small to mid-
sized M&A
staffing
• top position in most relevant
markets, ex-Japan, UK &
Australia
• no priority
• focus on value creation on the basis of current footprint
• no large transformational M&A going forward
• limited M&A in 2018
| |
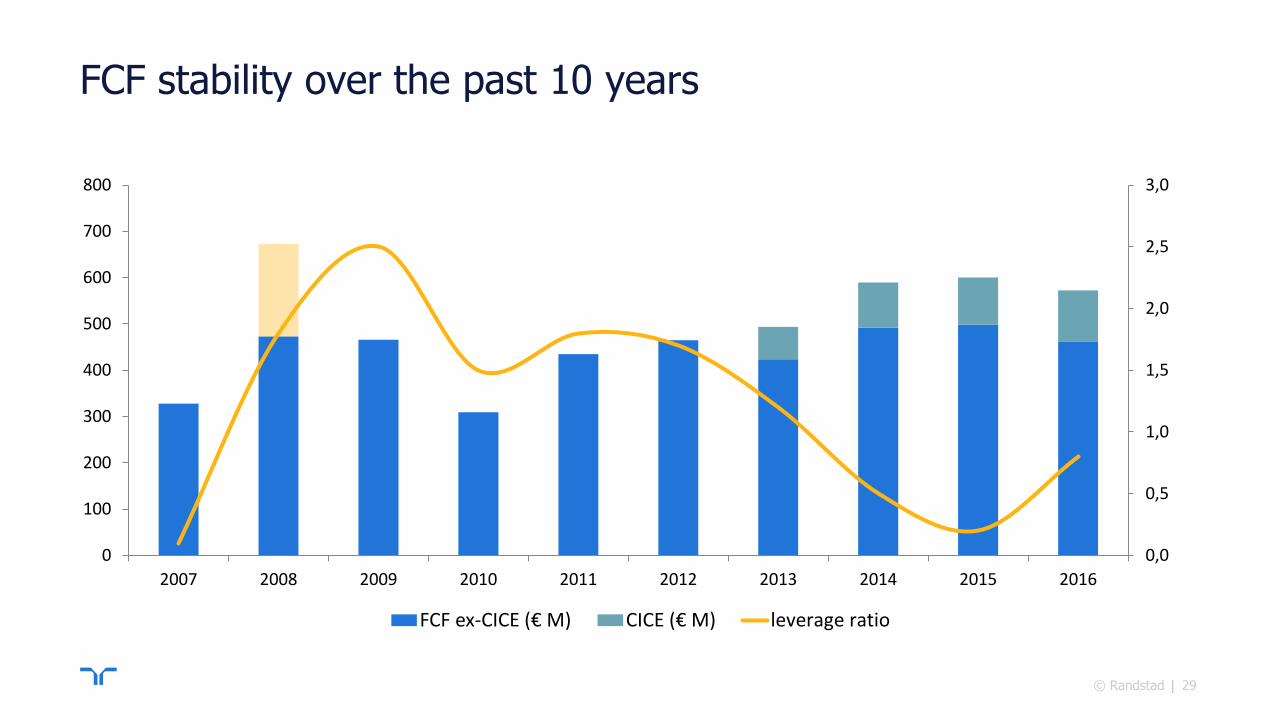
FCF stability over the past 10 years
© Randstad 29
0,0
0,5
1,0
1,5
2,0
2,5
3,0
0
100
200
300
400
500
600
700
800
2007 2008 2009 2010 2011 2012 2013 2014 2015 2016
FCF ex-CICE (€ M) CICE (€ M) leverage ratio

| © Randstad 30
FCF outlook is consistent in various macro scenarios working capital movement is counter cyclical
-
500
1.000
1.500
2.000
2.500
3.000
FCF cumulative 2017to 2020
FCF outlook 2017 – 2020 tested against 6 macro scenarios: bandwidth is only 20%
FCF scenarios accumulated 2017-2020
1 2 3 4 5 6
for
illust
rative p
urp
ose
s, g
raph n
ot
to s
cale

| |
capital allocation priorities & dividend policy
© Randstad 31
investments in organic growth
including digital
maintain cash dividend policy with payout 40 – 50%
selective M&A
when leverage ratio < 1.0 ->
optional additional cash returns
to shareholders
sound FCF outlook
more details H1 2018
old new 1. investments in organic growth
2. M&A activity
3. dividend
4. share buybacks*
5. special dividend*
|

| © Randstad 32
long term value creation through tech & touch strategy optimizing EVA by steering on key levers

questions
& answers