carbon budget in a. crassicarpa pulpwood plantations in peatland
TRANSCRIPT

Workshop Enhancing Sustainability of Forestry Practices on Peatlands June 27, 2012, IICC Bogor
Basuki Sumawinata, G. Djajakirana, Suwardi, Darmawan
Carbon Budgetin Acacia crassicarpa pulpwood plantation in Peatlands

∆ABG - ∑E = ?
ABG : above and below ground
E : emission

BG ?below ground ≈ peat mass
peat mass:
• depth ~ surface level variation
• bulk density vs depth
• depth vs subsidence

900
1100
Re
lati
ves
He
igh
t (c
m)
10 m
BBHA Plot R0742
900
1100
Re
lati
ves
He
igh
t (c
m)
10 m
BBHA Plot R0743
900
1100
Re
lati
ves
He
igh
t (c
m)
10 m
BBHA Plot R0744
900
1100
Re
lati
ves
He
igh
t (c
m)
10 m
BBHA Plot R3701
900
1100
Re
lati
ves
He
igh
t (c
m)
10 m
BBHA Plot R3702
900
1100
Re
lati
ves
He
igh
t (c
m)
10 m
BBHA Plot R3703
Microrelief of plots on Acacia Plantation in Bukit Batu, Riau
surface level variation

900
1100
Re
lati
ves
He
igh
t (c
m)
10 m
WKS Plot J131
900
1100
Re
lati
ves
He
igh
t (c
m)
10 m
SBA Plot P21
900
1100
Re
lati
ves
He
igh
t (c
m)
10 m
SBA Plot P22
900
1100
Re
lati
ves
He
igh
t (c
m)
10 m
SBA Plot P23
surface level variation
Microrelief of plots on Acacia Plantation in Sei Tapah, Jambi and Sei
Baung, South Sumatra

Height
Differences
(cm)
BBHA/R074 BBHA/R370 WKS/J13 SBA/P2
1 2 3 4 1 2 3 1 1 2 3
0-10 24 24 17 30 19 41 36 38 19 37 29
10-20 32 18 22 30 32 31 26 38 35 18 25
20-30 19 14 18 18 26 18 16 15 13 15 19
30-40 8 9 10 10 12 9 9 7 6 5 3
40-50 5 12 9 3 6 2 5 1 1 1 1
50-60 3 6 6 0 3 0 2 0 0 0 1
60-70 0 0 0 0 2 0 2 0 0 1 0
Variation of height difference of peatland surface in
measurements plots in Riau, Jambi, and South Sumatra
surface level variation

bulk density vs depth
0.00
0.02
0.04
0.06
0.08
0.10
0.12
0.14
0%
10%
20%
30%
40%
50%
60%
70%
80%
90%
100%
0-10 10-2020-3030-4040-5050-6060-80
g/cm
3
Fra
ctio
n
Depth (cm)
9 years A. crassicarpa Plantation on Deep Peat
Plot #1
<106 µ
1000-106 µ
2000-1000 µ
5000-2000 µ
> 5000µ
BD
(b)
0.000.020.040.060.080.100.120.140.160.180.20
0%10%20%30%40%50%60%70%80%90%
100%
g/c
m3
Fra
ctio
n
Depth (cm)
Pristine Forest
<106 µ
1000-106 µ
2000-1000 µ
5000-2000 µ
> 5000µ
BD
(a)
0.00
0.02
0.04
0.06
0.08
0.10
0.12
0%10%20%30%40%50%60%70%80%90%
100%
g/cm
3
Fra
cion
Depth (cm)
9 years A. Crassicarpa Plantation on Deep Peat Plot
#2
<106 µ
1000-106 µ
2000-1000 µ
5000-2000 µ
> 5000µ
BD
BD of upper layer of the pristine forest
is comparable and even slightly higher
than of the plantation area
Within the depth of only the upper 1
m, variations can be easily measured. It
is much more difficult to get data at this
detail for the lower depth.
Riau, deep peat

0.00
0.02
0.04
0.06
0.08
0.10
0.12
0.14
0%10%20%30%40%50%60%70%80%90%
100%
g/c
m3
Fra
ctio
n
Depth (cm)
A.Crassicarpa Plantation on Moderate Peat
(ex overlogged area)
<106µ
1000-106µ
2000-1000µ
5000-2000µ
>5cmµ
BD
(a)
-
0.05
0.10
0.15
0.20
0.25
0%
10%
20%
30%
40%
50%
60%
70%
80%
90%
100%
g/c
m3
Fra
ctio
n
Depth (cm)
A.Crassicarpa Plantation on Shallow Peat
(ex over drained and burn area)
<100µ
1000-100µ
2000-1000µ
5000-2000µ
>5000µ
BD
(b)
The value of the upper layer BD
in South Sumatra (shallow peat)
is higher than the locations with
deeper peat but the dominance
of coarse fraction is still high.
This is maybe an indication of
the compaction of the entire
depth.
South Sumatra (shallow peat) and Jambi (moderate peat)
bulk density vs depth

0
50
100
150
200
250
300
-20-18-16-14-12-10
-8-6-4-2024
0 1 2 3 4 5 6 7 8 9 10 11 12
Rain
fall (m
m/w
eek)
WT
(cm)
SM
(%)
Su
bsi
den
ce (
cm)
Month
9 years A. crassicarpa Plantation on Deep Peat
Rainfall A. Crassicarpa plot 1 A. Crassicarpa plot 2
A. Crassicarpa plot 3 A. Crassicarpa plot 4 Water Table
Soil Moisture
0
50
100
150
200
250
300
-20-18-16-14-12-10
-8-6-4-2024
0 1 2 3 4 5 6 7 8 9 10 11 12
Rain
fall (mm
/we
ek)
WT (cm
)SM
(%)
Su
bsi
den
ce (
cm)
Month
6 years A. crassicarpa Plantation on Deep Peat
Rainfall A. crassicarpa plot 1 and 2 A. crassicarpa plot 3
Water Table Soil Moisture
Riau, deep peat
0
100
200
300
400
500
600
700
800
-20
-18
-16
-14
-12
-10
-8
-6
-4
-2
0
2
4
0 1 2 3 4 5 6 7 8 9 10 11 12
Rain
fall (m
m/w
eek)
WT
(cm)
SM
(%)
Su
bsi
den
ce (
cm)
Month
Pristine Forest (MTH)
Rainfall Pristine ForestWater Table Soil Moisture
Subsidence: compaction, depth, BD

-150
50
250
450
650
-12
-7
-2 0 1 2 3 4 5 6 7 8 9 10 11 12 13
Rain
fall (m
m/w
eek)
WT
(cm)
Sm
%
Su
bsi
den
ce (
cm)
A. crassicarpa Plantation on Moderate Peat (ex logged-over area)
Rainfall Pipe A Pipe B
Water table Soil Moisture
Month
(a)
-50
50
150
250
350
450
550
650
-12
-10
-8
-6
-4
-2
0
2
0 1 2 3 4 5 6 7 8 9 10 11 12 13
Rain
fall (m
m/w
eek)
WT
(cm)
SM
(%)
Su
bsi
den
ce (
cm)
Month
Secondary Forest
Rainfall Pipe A
Water Table Soil Moisture (b)
Jambi, moderate peat Subsidence over varied between plots even in the
same peatland characteristic and management
0
50
100
150
200
250
300
350
-12
-10
-8
-6
-4
-2
0
2
4
0 1 2 3 4 5 6 7 8 9 10 11 12 13R
ain
fall (m
m/m
ing
gu
)
WT
(cm)
SM
( %)
Su
bsi
den
ce
(cm
)
Month
1 year A. crassicarpa on shallow peat(ex- over drain and burnt area)
Rainfall Plot 1 Plot 2
Water Table Soil Moisture
0
50
100
150
200
250
300
350
-12
-10
-8
-6
-4
-2
0
2
4
0 2 4 6 8
Rain
fall (m
m/m
ing
gu
)
WT
( cm)
SM
( %)
Su
bsi
den
ce (
cm)
Month
4 years A. crassicarpa on shallow peat(ex- over drain and burnt area)
Rainfall Plot 1 Plot 2
Soil Moisture Wate Table
Subsidence: compaction, depth, BD
South Sumatra, shallowpeat

AG ?above ground ≈ biomass
• living trees
• dead wood
• litter

0
50
100
150
200
250
300
350
4000
5
10
15
20
25
30
35
40
45
50
1 3 5 7 9 11 13 15 17 19 21 23 25 27 29 31 33 35 37 39 41 43 45 47
Rain
fall (mm
/we
ek)
Wate
r Table
(cm)
g C
-CO
2/m
2 /d
ay
WeekRainfall A.crassicarpa 3yr A. crassicarpa 1 yr
Pristine Forest Water Table A. crassicarpa 3 yr Water Table A. crassicarpa 1 yr
Water Table Pristine Forest
CO2 fluxes in 3-year old are greater than in 1-year old A. crassicarpa
The highest CO2 fluxes are recorded in week 7 while the lowest water table
measurement recorded in week 30. This indicates no direct correlation between CO2
fluxes and water level.
In a non stagnated condition, CO2 fluxes from pristine forest is quite high
CO2 Fluxes in Riau site
Emission: measurement data
-50
0
50
100
150
200
250
300
350
4000
5
10
15
20
25
30
35
40
45
50
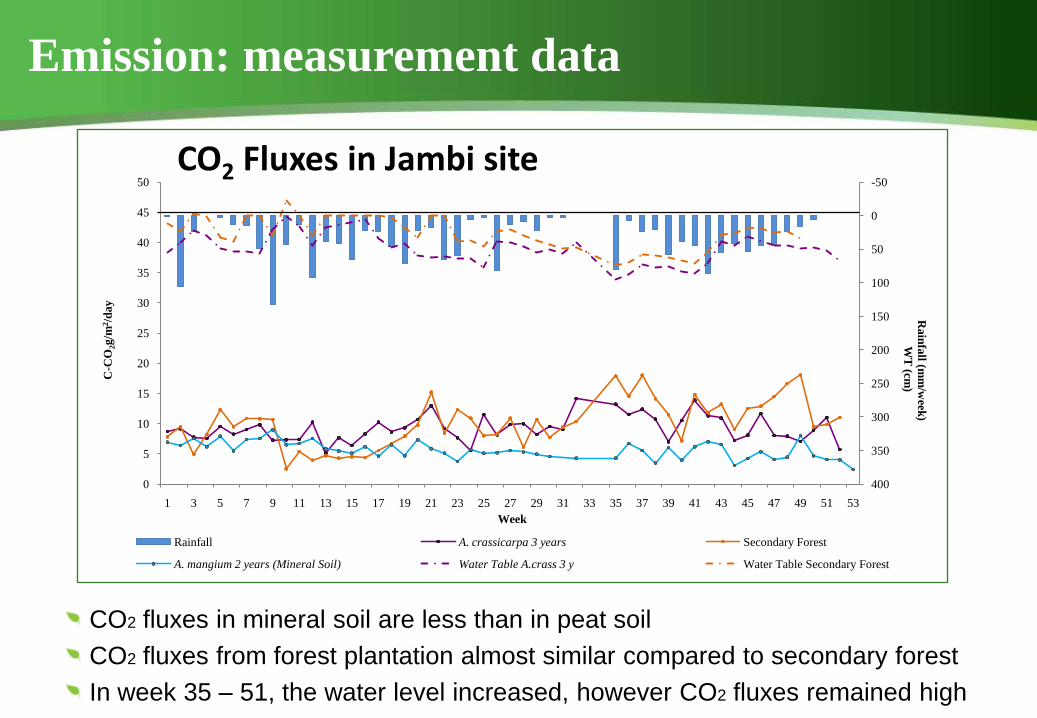
1 3 5 7 9 11 13 15 17 19 21 23 25 27 29 31 33 35 37 39 41 43 45 47 49 51 53
Week
Rain
fall (m
m/w
eek)
WT
(cm)
C-C
O2g
/m2/d
ay
Rainfall A. crassicarpa 3 years Secondary Forest
A. mangium 2 years (Mineral Soil) Water Table A.crass 3 y Water Table Secondary Forest
CO2 fluxes in mineral soil are less than in peat soil
CO2 fluxes from forest plantation almost similar compared to secondary forest
In week 35 – 51, the water level increased, however CO2 fluxes remained high
CO2 Fluxes in Jambi site
Emission: measurement data

0
50
100
150
200
250
300
350
4000
5
10
15
20
25
30
35
40
45
50
1 3 5 7 9 11 13 15 17 19 21 23 25 27 29 31 33 35 37 39 41 43 45 47 49 51 53
Rain
fall (mm
/we
ek)
Wate
r table
(cm)C
-CO
2g/
m2
/day
weekRainfall A. crassicarpa 4 yr A. crassicarpa 4 yr (-R-L)
A. crassicarpa 1 yr Abandoned Paddy Field (Mineral Soil) Water Table A. crassicarpa 4 yr
Water Table A. crassicarpa 1 yr Water Table Abandoned Paddy Field
CO2 fluxes in 4-yr old Acacia (with litter & fine roots) are > 4-yr old Acacia
(without litter and fine roots) > 1-yr old Acacia > abandoned paddy field
In 1-yr old Acacia, the highest water level recorded in week 39 – 41, however the
CO2 fluxes are at the lowest level
CO2 Fluxes, South Sumatra site
Emission: measurement data

0
100
200
300
400
500
6000
10
20
30
40
50
60
1 3 5 7 9 11 13 15 17 19 21 23 25 27 29 31 33 35 37 39 41 43 45 47
Wate
r Table
(cm)
Soil M
ostu
ire (%
)g C
-CO
2/m
2 /d
ay
Week
Water Table A. crassicarpa 3 years A.crassicarpa 3yr A.crassicarpa 3 yr -R-L Soil Moisture
Comparison of CO2 Fluxes in 3-yr old A. crassicarpaWith and Without Litter and Fine Roots
Highest CO2 fluxes were observed when Soil Moisture is between Field Capacity and Wilting Point.And CO2 fluxes were observed at the lowest level when Soil Moisture is lower than Wilting Point, during week 19-30 when the water level is at minimum level. The difference between CO2 fluxes from Accacia plants with and without litter and roots reflected the difference of respiration speed and root ‘s exudate.
Emission: measurement data

0
50
100
150
200
250
300
350
400
450
500
550
6000
5
10
15
20
25
30
35
40
45
50
55
60
1 3 5 7 9 11 13 15 17 19 21 23 25 27 29 31 33 35 37 39 41 43 45 47 49 51 53
g C
-CO
2/m
2/d
ay
Week
Comparison between A. Crassicarpa 3 year and without root & litter in Jambi site
Water table A.crassicarpa 3 yr
A.crassicarpa 3 yr (-R-L) Soil Mostuire A.crassicarpa 3 yr
Soil Mostuire A.crassicarpa 3 yr (-R-L)
Wate
r Table
(cm)
Soil M
ostu
ire (%
)
Emission: measurement data

0
50
100
150
200
250
300
350
400
450
500-60
-50
-40
-30
-20
-10
0
10
20
30
40
50
60
1 3 5 7 9 11 13 15 17 19 21 23 25 27 29 31 33 35 37 39 41 43 45 47
Rain
fall (mm
/we
ek)
Wate
r Table
(cm)m
gC /
m2 /
day
Week
Rainfall A. crassicarpa 3 years A. crassicarpa 3 years -R-L
A. crassicarpa 1 year Pristine Forest Water Table Pristine Forest
Water Table A. crassicarpa
CH4 Fluxes in Riau site
There is no correlation between CH4 fluxes with water table level
Emission: measurement data

-50
0
50
100
150
200
250
300
350
400-20
-10
0
10
20
30
40
50
60
70
1 3 5 7 9 11 13 15 17 19 21 23 25 27 29 31 33 35 37 39 41 43 45 47 49 51 53
CH
(mm
/wee
k)
WT
(cm)
mg
C-C
H4
/m2/d
ay
Week
CH4 Fluxes in Jambi site
Rainfall A. crassicarpa 3 yearsSecondary Forest A. mangium 2 years (mineral soil)Water Table A. crassicarpa 3 yr Water Table Secondary Forest
Emission: measurement data

0
50
100
150
200
250
300
350
400-10
-5
0
5
10
15
20
25
30
35
40
45
50
0 2 4 6 8 10 12 14 16 18 20 22 24 26 28 30 32 34 36 38 40 42 44 46 48 50 52 54 56
Rain
fall (mm
/we
ek)
Wate
r Table
(cm)
C-C
H4
mg/
m2
/day
Week
CH4 Fluxes South Sumatra site
Rainfall A.crassicarpa 4 yr
A.crassicarpa 4 yr (-R-L) A. crassicarpa 1 yr
Abandoned Paddy Field Water Table A. crassicarpa 4 yr
Water Table A. crassicarpa 1 yr Water Table Abandone Paddy Field
Emission: measurement data

Land Characteristics Landuse (age)CO2 Fluxes
(ton C-CO2 ha-1y-1)
CH4 Fluxes
(kg C-
CH4ha-1y-1)
Mineral soil Acacia mangium, 2y 20.23 -2.12
Mineral soil Acacia mangium, 2y –R-L 11.58 -9.25
Mineral soil Eucalyptus, sp 2y 18.10 -4.94
Mineral soil Abandoned paddy field 15.97 1.31
Peat soil, deep Acacia crassicarpa 1y 35.77 -7.33
Peat soil, deep Acacia crassicarpa 3y 52.43 3.86
Peat soil, deep Acacia crassicarpa 3y –R-L 26.04 7.62
Peat soil, deep Pristine forest 33.04 5.42
Peat soil, deep Pristine forest –R-L 20.31 5.15
Peat soil, deep Open area (no vegetation) 11.06 -6.67
Peat soil, moderate Acacia crassicarpa 3y 34.31 12.94
Peat soil, moderate Acacia crassicarpa 3y –R-L 27.16 8.30
Peat soil, moderate Secondary (logged-over) forest 36.52 8.30
Peat soil, shallow Acacia crassicarpa 4y 37.59 -9.25
Peat soil, shallow Acacia crassicarpa 4y–R-L 26.38 14.83
Note: -R-L: without fine root and litter
Year-round Fluxes of CO2 & CH4 in A. crassicarpa and MHW forest in Peatland

Biomass Study
• Litter Fall
• Biomass Data
• Development DBH-Biomass Model
• Characteristic of Plant Biomass
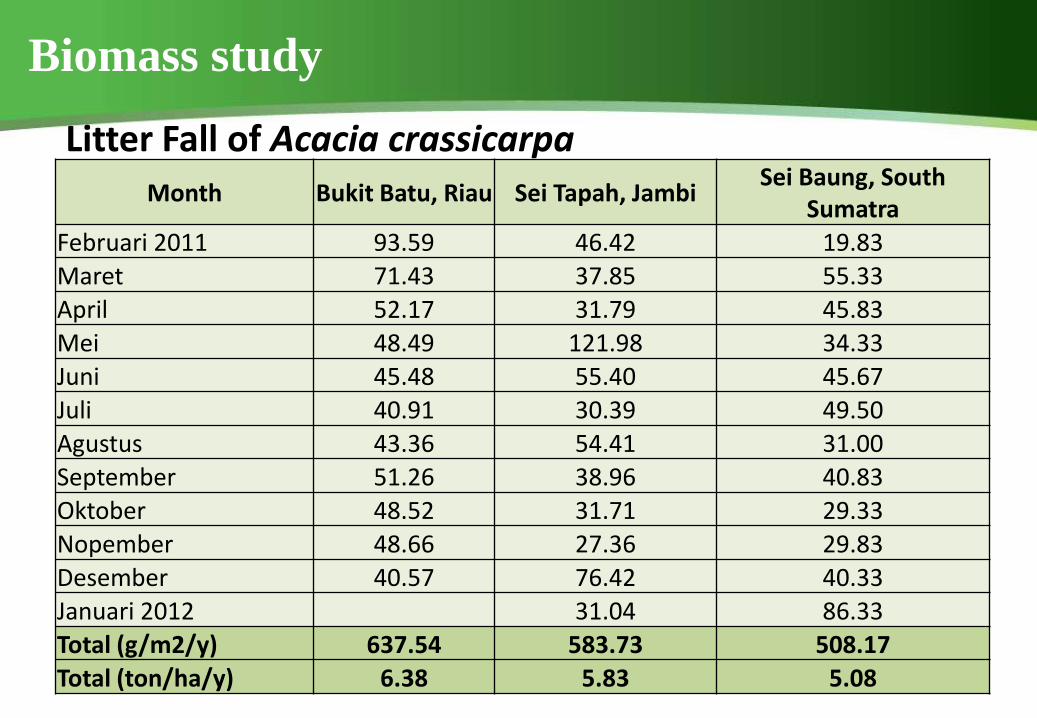
Litter Fall of Acacia crassicarpa
Month Bukit Batu, Riau Sei Tapah, JambiSei Baung, South
Sumatra
Februari 2011 93.59 46.42 19.83
Maret 71.43 37.85 55.33
April 52.17 31.79 45.83
Mei 48.49 121.98 34.33
Juni 45.48 55.40 45.67
Juli 40.91 30.39 49.50
Agustus 43.36 54.41 31.00
September 51.26 38.96 40.83
Oktober 48.52 31.71 29.33
Nopember 48.66 27.36 29.83
Desember 40.57 76.42 40.33
Januari 2012 31.04 86.33
Total (g/m2/y) 637.54 583.73 508.17
Total (ton/ha/y) 6.38 5.83 5.08
Biomass study

Biomass study
0
10
20
30
40
50
60
70
80
90
100
0 1 2 3 4 5 6 7 8 9 10 11
Bio
ma
ss (
%)
Month
Litter Decomposition Rate of A. crassicarpa
on the Top Layer at Riau, Jambi, and South
Sumatra sites
BBHA WKS SBARiau Jambi South Sumatra
35% remains

Relationship Between DBH with Height and Age A. Crassicarpa in Riau site
Biomass study

Biomass Equation for Riau site :
a= 192.196 b= 0.763 r2= 0.972
WT= a(D^2*H)^b
WT : Total Weight Wr : Root Weight Wk : Knot Weight
Ws : Stem Weight Wb : Branch Weight Wl : Leaves Weight
Biomass study

Biomass Equation for WKS :
WT= a(D^2*H)^b
WT : Total Weight Wr : Root Weight Wk : Knot Weight
Ws : Stem Weight Wb : Branch Weight Wl : Leaves Weight
0%
10%
20%
30%
40%
50%
60%
70%
80%
0
20
40
60
80
100
120
140
0 1 1 2 2 3 3 4 4 5 5
% W
Tota
l wei
ght
Age
WT' (kg) Wr' (%) Wk' (%) Ws' (%) Wb' (%) Wl' (%)
a=142.471b= 0.544
r2= 0.494error= 7.674
Biomass study

y = -14361x2 + 13528x - 95212R² = 0.999
y = -14008x2 + 10451x - 51986R² = 0.969
y = -18648x2 + 14015x - 80660R² = 0.962
-
50,000
100,000
150,000
200,000
250,000
0 1 2 3 4 5 6
BBHA
WKS
SBA

Age
(Years)
Riau Prov. Jambi Prov. South Sumatra Prov.
Popula-
tion
Biomass/
tree (kg)
Total
Biomass
(ton)
Popula-
tion
Biomass/
tree (kg)
Total
Biomass
(ton)
Popula-
tion
Biomass/
tree (kg)
Total
Biomass
(ton)
1 1,933 12.78 24.7 1,767 20.67 36.5 1,800 22.33 40.2
2 2,267 53.04 120.2 1,800 56.95 102.5 1,600 75.95 121.5
3 1,967 91.72 180.4 1,700 84.12 143.0 1,533 121.66 186.5
4 1,700 126.53 215.1 1,233 105.79 130.4 1,033 160.46 165.8
5 1,411 157.94 222.9 1,010 123.66 124.9 821 194.17 159.4
Biomass study

Carbon Budget

Description (kg C/ha) Year I Year II Year III Year IV Year VDeadwood stock from last year - 11,006 22,319 litter stock from last year 140 749 1,312 1,711
litter fall this year 400 1,999 3,000 3,577 3,706 deadwood this year 13,758 16,892 22,822 E0 11,000 11,000 11,000 11,000 11,000
Decomposition of litter 260 1,391 2,437 3,178 3,521 Decomposition of deadwood 2,752 5,580 9,028
260 1,391 5,188 8,757 12,549
Total C decomposition 11260 12,391 16,188 19,757 23,549 litter stock 140 749 1,312 1,711 1,896 Deadwood stock - 11,006 22,319 36,113 Total stock 140 749 12,318 24,030 38,009 HarvestPlant remain 44,571 Root remain 2,500 Reject wood/plant 11,143 shrub 1,000
budget 96,222 55,000
Total C lost (kg/ha/5 y= 83,085 Sequestra-
tion 41,222

Tahun I Tahun II Tahun III Tahun IV Tahun V
deadwood stock from last year - 3,365 22,453
litter stock from last year 268 847 1,346 1,429
litter fall this year 766 2,150 3,000 2,736 2,620
deadwood this year - 4,206 24,702 13,788 E0 11000 11,000 11000 11000 11000
Decomposition of litter 498 1,572 2,500 2,654 2,025
Decomposition of deadwood - - 841 5,613 7,248 498 1,572 3,341 8,267 9,273
Total C decomposition 11,498 12,572 14,341 19,267 20,273
litter stock 268 847 1,346 1,429 2,025
deadwood stock - - 3,365 22,453 28,993
Total C stock 268 847 4,711 23,882 31,018 Harvest
Plant remain Kg C/ha 24,979
Root remain 2,500
Reject wood/plant 6,245
Shrub 1,000
budget 65,742 55000
Total C loss: 77,952 kg C/ha/5y sequestration 10,742

• Calculation of carbon budget in peatland using the model of
∆ABG - ∑E = ? is facing uncertainty with respect to
below ground carbon stock measurement/estimation due to
great variation in land surface and BD.
• An alternative concept of carbon budget calculation is by
considering all possibility of C sequestration from produced
biomass and the emission of just from the peat material
decomposition.
Conclusion

• Calculation of Carbon budget of Acacia Crassicarpa
plantation on peatland using the alternative concept shows
that the carbon budget tends to be positive depending on the
plantation management, in that the highest the production
the highest the sequestration.
• With a constant emission from peat decomposition, then
high production as the reflection of best fit management is
the measure for reducing emission.
Conclusion