carbon fee and dividend - cpb-us-w2.wpmucdn.com · •eu cap and trade on brink of failure: too...
TRANSCRIPT

Carbon Fee and DividendA Solution for the Climate

Outline of Presentation• The Problem
• Climate change
• The Cause• Carbon pollution
• The Costs• Extreme weather
• Human health
• National security
• Policy Options
• The Solution• Carbon fee
• Dividend
• Border Tax
• The Results: REMI Report• Economic
• Climate
• Fiscal
• Electricity
• Demographic
• Policy Precedents• British Columbia
• Australia
• U.S. Support
• Audience • Ohio Congressional delegation and staff
December 4, 20142

“Severe, pervasive, and irreversible”
• Intergovernmental Panel on Climate Change• Assessment Synthesis Report 5
• Released November 2, 2014
• Starkest warnings yet about consequences of unchecked climate change
• Leading international body for the assessment of climate change• Established in 1988 to provide a clear scientific
view of climate change and its impacts
• Thousands of scientists from around the world
• Assessment Report 5• 2,000 scientists: authors, editors, reviewers
• Synthesized 30,000 pieces of research
• Peer review with 143,000 expert comments
December 4, 2014 Photo: Intergovernmental Panel on Climate Change, Plenary session #2. Credit: Benjamin Kriemann/IPCC3

The Problem: Climate Change• Agreed limit to warming: 2°C (3.6°F)
• Scientists say this limit is necessary to maintain a climate similar to the one in which human civilization evolved
• Policymakers signed onto this limit at Copenhagen climate conference 2009
• Warming since Industrial Revolution• Global temperature already warmed 0.8° C
• Another 0.8°C in the pipeline
• Leaves little room for margin of error
• Business as usual scenario (no policy intervention): RCP 8.5• On track for global average temperature
rise of 3.2°C to 5.4°C by 2100
• Double what scientists say is the upper limit for a stable climate
December 4, 2014 Graphic: Intergovernmental Panel on Climate Change, Fifth Assessment Report, Chapter 12, Long-term Climate Change: Projections, Commitments and Irreversibility, 2013.4

The Cause: Carbon Emissions
December 4, 2014Top: Global Climate Change Impacts in the United States, U.S. Global Change Research Program, 2009. Bottom: Leland McInnes, using publicly available ice core data.
5
• Carbon dioxide is a greenhouse gas• GHGs trap sun’s heat in Earth’s atmosphere
• CO2 responsible for 80% of greenhouse gas effect
• Some GHG effect good, but too much is destabilizing
• Temperature closely tracks CO2 in atmosphere• Pre-industrial CO2 at 280 ppm
• CO2 never above 300 ppm in last 800,000 years
• Current level CO2 about 400 ppm
• Without policy intervention• CO2 is likely to go above 1,000 ppm by 2100 • Hasn’t been that high since dinosaurs walked the
Earth

The Cause: Fossil Fuels• Humans are adding CO2 to atmosphere
• Primarily through burning fossil fuels
• Currently emitting ~10 GtC/yr (~36 GtCO2)
• Carbon budget• Cannot add more than 1,000 cumulative GtC
to stay under 2°C
• Reached 515 GtC in 2011; 485 GtC left
• Without policy intervention, likely to reach 1,000 cumulative GtC before 2050
• Fossil fuel reserves• If burned, known global oil, coal and gas
reserves would emit 2,795 GtCO2
• These reserves currently worth $27 trillion
• To avoid a climate catastrophe, most of these reserves must stay in the ground
December 4, 2014Graph: Mak Thorpe, using data from Marland, G., T.A. Boden, and R. J. Andres. 2007. Global, Regional, and National CO2 Emissions. Trends: A Compendium of Data on Global Change. Carbon Dioxide Information Analysis Center, Oak Ridge National Laboratory, U.S. Department of Energy.
6

The Costs of Climate Change
• Extreme weather • Superstorm Sandy: $65 billion
• Droughts/heatwave: $30 billion
• Western wildfires: $1 billion
• Human health• Pollution from burning fossil fuels leads to asthma,
strokes and heart attacks
• EPA Clean Power plan expected to save up to 6,600 lives and $93 billion in health care costs per year
• National security• Climate change acts as a “threat multiplier”
• DOD planning for new challenges, such as• Demand for disaster relief and humanitarian aid
• Need for air and sea capabilities in the Arctic
• Instability within and among other nations
• Vulnerability of our own military bases
December 4, 2014Top: Insurance & Reinsurance Report, New York Court Reaffirms Limitations on Policy Claims Arising Out of Superstorm Sandy. Bottom left: Department of Defense, 2014 Climate Change Adaptation Roadmap. Bottom right: Moms Clean Air Force, Air Pollution Sidelines Kids with Asthma.
7

Policy Options• In economic terms, climate change is an externality
• An “effect of a purchase or use decision by one set of parties on others who did not have a choice and whose interests were not taken into account.”
• Governments can deal with externalities in several ways• Learn to live with it
• Not an option as climate change unchecked will make the Earth uninhabitable
• Sell permits to pollute• EU cap and trade on brink of failure: Too many loopholes, free permits
• Cap and trade legislation defeated in Congress in 2009
• Regulate carbon emissions• Example is EPA Clean Power Plan mandating 30% reduction by 2030
• Modest goal, but Republicans have still vowed to stop it
• Subsidize renewable energy• 2013 - Worldwide subsidies to fossil fuels $550 billion, to renewables $120 billion
• 1950-2010 - U.S. subsidies to fossil fuels $594 billion, to renewables $164 billion
• Tax and dividend• Only free market revenue-neutral option being discussed
• Would make all the other policy options irrelevant
December 4, 2014 Photo: Thinkstock Images8

The Solution: Carbon Fee and Dividend• Place a steadily rising fee on the CO2 content of fossil fuels.
• Initial fee of $15/ton starting in 2016, escalating $10/ton/year
• Imposed at point of extraction and collected upon entry into the economy.
• Creates a level-playing field for all sources of energy
• Informs consumers of the true cost-comparison of various fuels
• Give all of the revenue from the carbon fee back to households.• 100% of the revenue returned directly to households as a monthly dividend
• Vast majority of households receive more than they pay for increased energy costs
• Inject billions into economy, protect family budgets, and build demand for low-carbon products
• Enact border adjustments to ensure fairness and competition.• Import tax on products from countries without a carbon fee
• Creates fair competitive environment for exporters
• Motivates other countries to adopt carbon pricing policies
• Firms trying to escape higher energy costs discouraged from moving to countries without price on carbon because their products would be subject to import fees
December 4, 20149

The Results: REMI Report• Regional Economic Models Inc.
• Started late 1970s at University of Massachusetts - Amherst
• Nonpartisan developer of economic forecasting and policy analysis
• Studied impacts of revenue-neutral carbon tax in five areas• Economic
• Climate
• Budgetary
• Power generation
• Demographic
• Examined impacts in nine regions of the United States• Ohio in East North Central (red above)
December 4, 2014 Map: Nystrom, Scott, and Patrick Luckow. 2014. The Economic, Climate, Fiscal, Power, and Demographic Impact of a National Fee-and-Dividend Carbon Tax, p. 710

Economic Results• National employment increases
• 2.1 million jobs after 10 years
• 2.8 million after 20 years
• Gross domestic product increases• $70-$85 billion from 2020 on
• Cumulative increase of $1.375 trillion
• Biggest employment gains in health care, retail, and other services• People have more money to spend, and
these industries are labor-intensive
December 4, 2014 Graphs: Nystrom, Scott, and Patrick Luckow. 2014. The Economic, Climate, Fiscal, Power, and Demographic Impact of a National Fee-and-Dividend Carbon Tax, pp. 20, 2511

Climate Results• Significant decline in CO2 emissions
• 33% after 10 years, and 52% after 20 years relative to baseline with no carbon fee
• Regional CO2 savings• East North Central region (red) does well
December 4, 2014 Graphs: Nystrom, Scott, and Patrick Luckow. 2014. The Economic, Climate, Fiscal, Power, and Demographic Impact of a National Fee-and-Dividend Carbon Tax, pp. 30, 3112

Fiscal Results• Carbon fee revenue significant and robust
• Up to $600 billion by 2030s
• From tax itself plus border adjustment
• Monthly dividend check for family of four• 2025: $288 a month, $3,456 a year
• 2035: $396 a month, $4,752 a year
December 4, 2014 Graphs: Nystrom, Scott, and Patrick Luckow. 2014. The Economic, Climate, Fiscal, Power, and Demographic Impact of a National Fee-and-Dividend Carbon Tax, p. 3213

Results: Electricity• Carbon intensive phased out
• Coal by 2025 (blues)
• Most gas without CCS by 2035 (solid orange)
• Replaced by• Solar (yellow)
• Wind (light green)
• Biofuels (dark green)
• Nuclear (red)
• Gas with CCS (orange striped)
• Improved air quality• Coal plants emit nitrogen oxides, sulfur oxides
• East North Central region sees most improvement
December 4, 2014 Graphs: Nystrom, Scott, and Patrick Luckow. 2014. The Economic, Climate, Fiscal, Power, and Demographic Impact of a National Fee-and-Dividend Carbon Tax, pp. 40, 4214
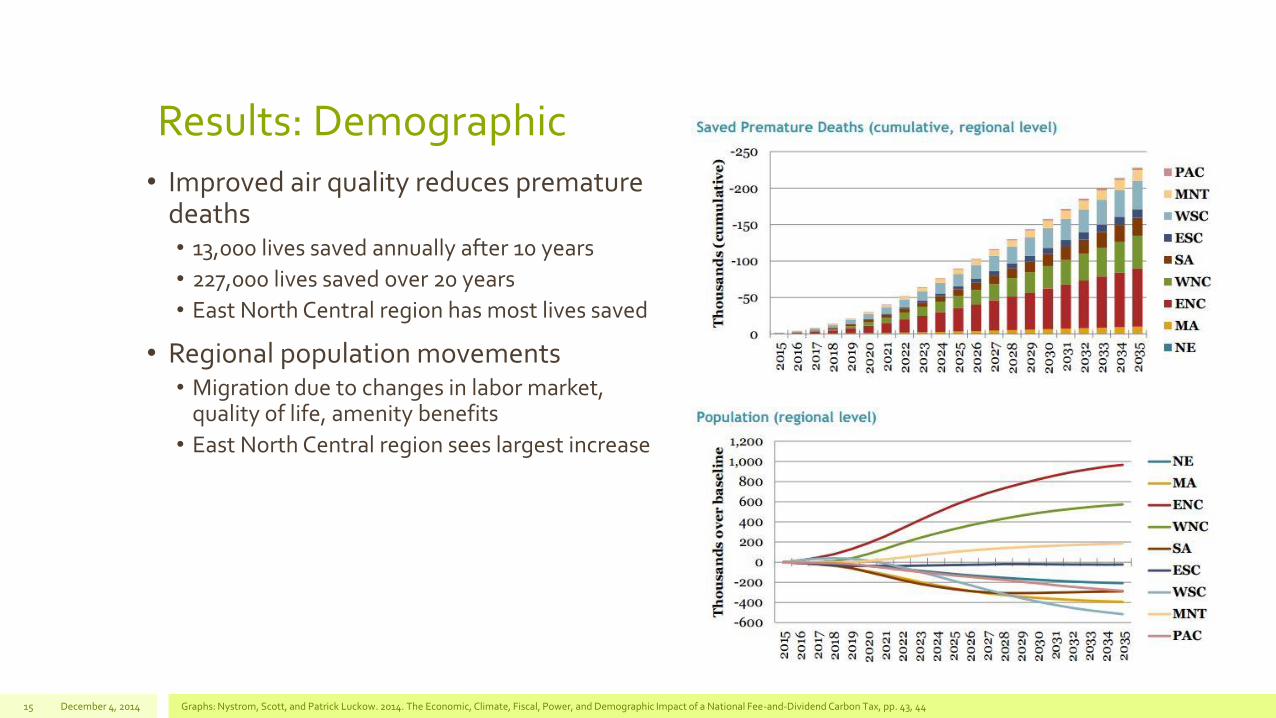
Results: Demographic• Improved air quality reduces premature
deaths• 13,000 lives saved annually after 10 years
• 227,000 lives saved over 20 years
• East North Central region has most lives saved
• Regional population movements• Migration due to changes in labor market,
quality of life, amenity benefits
• East North Central region sees largest increase
December 4, 2014 Graphs: Nystrom, Scott, and Patrick Luckow. 2014. The Economic, Climate, Fiscal, Power, and Demographic Impact of a National Fee-and-Dividend Carbon Tax, pp. 43, 4415
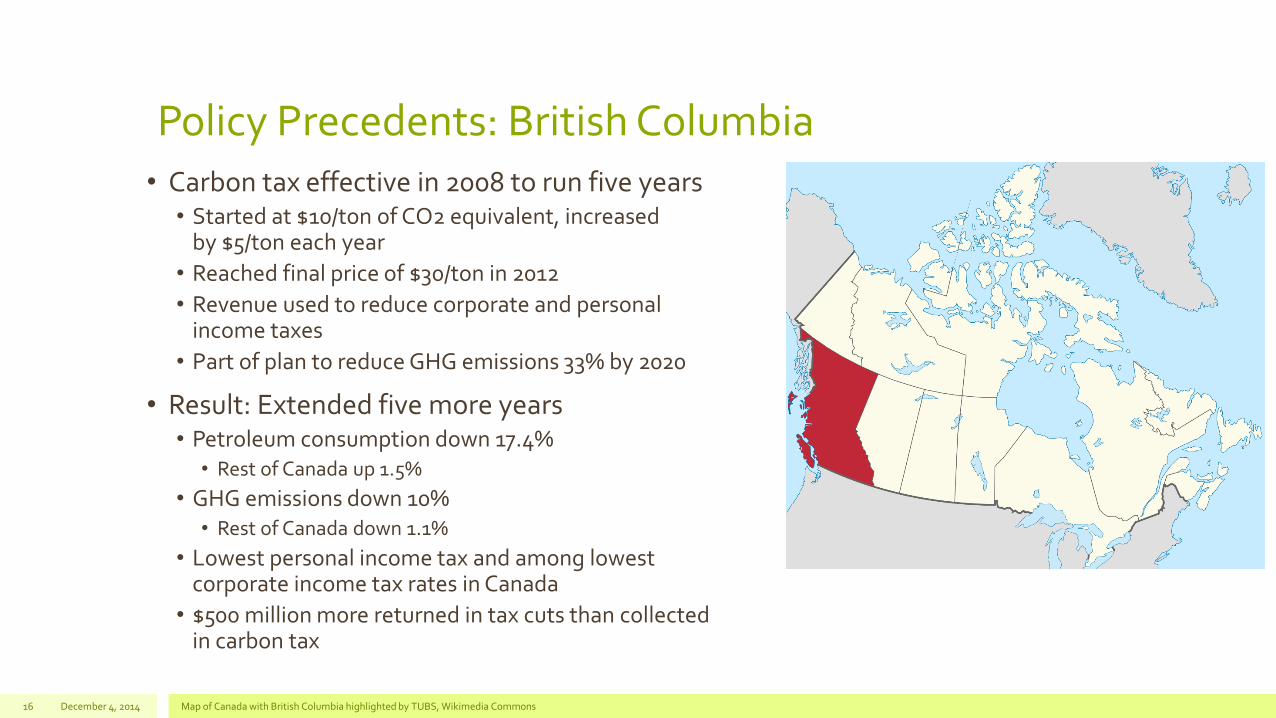
Policy Precedents: British Columbia• Carbon tax effective in 2008 to run five years
• Started at $10/ton of CO2 equivalent, increased by $5/ton each year
• Reached final price of $30/ton in 2012
• Revenue used to reduce corporate and personal income taxes
• Part of plan to reduce GHG emissions 33% by 2020
• Result: Extended five more years• Petroleum consumption down 17.4%
• Rest of Canada up 1.5%
• GHG emissions down 10% • Rest of Canada down 1.1%
• Lowest personal income tax and among lowest corporate income tax rates in Canada
• $500 million more returned in tax cuts than collected in carbon tax
December 4, 2014 Map of Canada with British Columbia highlighted by TUBS, Wikimedia Commons16

Policy Precedents: Australia• Carbon price effective 2012
• About 260 entities that emit over 25 tons CO2/year required to obtain permits
• Some permits sold at $23/ton; others issued free
• CO2 emissions down 6% in nine months
• Result: Repealed 2014• Transportation and agriculture sectors exempt
• Unclear where proceeds went• Tax cuts for low income earners
• Payments to low and middle class households
• Assistance to CO2-emitting industries
• No political champion• Labor Party first opposed it, then supported it as concession
to form coalition government with Greens
• Opposition Liberal Party first supported it, then opposed it when Labor Party elected in 2011
• Liberal Party campaigned on repeal in 2013 and won
December 4, 2014 Orthographic projection of Australia by Ssolbergj, Wikimedia Commons17
Political Support in United States• Carbon fee and dividend is supported by a wide range of policymakers,
scientists, economists and environmentalists.• Al Gore, former vice president and author of “An Inconvenient Truth”
• James Hansen, former directror of Goddard Institute for Space Studies
• Gregory Mankiw, former economic adviser to President Bush
• Bill McKibben, author of “The End of Nature” and founder of 350.org
• William Nordhaus, Sterling Professor of Economics at Yale University
• Robert Reich, former secretary of labor under President Clinton
• George Shultz, former secretary of state under President Reagan
• Joseph Stiglitz, former chief economist of the World Bank
• Nation’s largest corporations are planning future growth based on expectation that government will enact a carbon tax.• Includes five major oil companies: Exxon Mobil, ConocoPhillips, Chevron, BP and Shell
• Microsoft, General Electric, Walt Disney, ConAgra Foods, Wells Fargo, DuPont, Duke Energy, Google and Delta Air Lines
• Only Koch Industries opposed
December 4, 201418
There is no economic argument against carbon fee and dividend. It creates jobs, grows the economy, saves lives, and makes Americans richer.
December 4, 201419

ReferencesBaird, Julia. July 24, 2014. A Carbon Tax’s Ignoble End: Why Tony Abbott Axed Australia’s Carbon Tax. The New York Times. http://www.nytimes.com/2014/07/25/opinion/julia-baird-why-tony-abbott-axed-australias-carbon-tax.html?_r=0
Carbon Disclosure Project North America. 2013. Use of internal carbon price by companies as incentive and strategic planning tool. https://www.cdp.net/CDPResults/companies-carbon-pricing-2013.pdf
CNA Military Advisory Board. 2014. National Security and the Accelerating Risks of Climate Change. http://www.cna.org/reports/accelerating-risks
Collins, M., R. Knutti, J. Arblaster, J.-L. Dufresne, T. Fichefet, P. Friedlingstein, X. Gao, W.J. Gutowski, T. Johns, G. Krinner, M. Shongwe, C. Tebaldi, A.J. Weaver and M. Wehner, 2013: Long-term Climate Change: Projections, Commitments and Irreversibility. In: Climate Change 2013: The Physical Science Basis. Contribution of Working Group I to the Fifth Assessment Report of the Intergovernmental Panel on Climate Change [Stocker, T.F., D. Qin, G.-K. Plattner, M. Tignor, S.K. Allen, J. Boschung, A. Nauels, Y. Xia, V. Bex and P.M. Midgley (eds.)]. Cambridge University Press.
Davenport, Coral. December 5, 2013. Large Companies Prepared to Pay Price on Carbon. The New York Times. http://www.nytimes.com/2013/12/05/business/energy-environment/large-companies-prepared-to-pay-price-on-carbon.html?pagewanted=all&_r=0
Department of Defense. 2014 Climate Change Adaptation Roadmap. http://www.scribd.com/doc/242845848/Read-DoD-report-2014-Climate-Change-Adaptation-Roadmap
Elgie, Stewart, and Jessica McClay. 2013. BC’s Carbon Tax Shift After Five Years: An Environmental (and Economic) Success Story. http://www.sustainableprosperity.ca/article3685
Hansen, Katherine. 2010. Carbon Dioxide Controls Earth's Temperature. NASA. http://www.nasa.gov/topics/earth/features/co2-temperature.html
International Energy Agency. 2014. World Energy Outlook Executive Summary. http://www.iea.org/publications/freepublications/publication/WEO_2014_ES_English_WEB.pdf
Karl, Thomas R., Jerry M. Melillo, and Thomas C. Peterson, (eds.). 2009. Global Climate Change Impacts in the United States. Cambridge University Press.
December 4, 2014 Footer text here20
ReferencesLeaton, James. 2012. Unburnable Carbon: Are the world’s financial markets carrying a carbon bubble? Carbon Tracker Initiative.
Levin, Kelly. 2013. World’s Carbon Budget to Be Spent in Three Decades. World Resources Institute. http://www.wri.org/blog/2013/09/world%E2%80%99s-carbon-budget-be-spent-three-decades
Management Information Services Inc. 2011. 60 Years of Energy Incentives: Analysis of Federal Expenditures for Energy Development. http://www.misi-net.com/publications/NEI-1011.pdf
McKibben, Bill. 2012. Global Warming's Terrifying New Math. Rolling Stone. Accessed at http://www.rollingstone.com/politics/news/global-warmings-terrifying-new-math-20120719
Moyers, Bill. May 16, 2014. Ten Ideas For How We Can Save the Planet. Moyers and Company. http://billmoyers.com/2014/05/16/how-to-save-the-planet/
Nystrom, Scott, and Patrick Luckow. 2014. The Economic, Climate, Fiscal, Power, and Demographic Impact of a National Fee-and-Dividend Carbon Tax. http://citizensclimatelobby.org/remi-report/
Oil Change International. 2014. Cashing in on All of the Above: U.S. Fossil Fuel Production Subsidies under Obama. http://priceofoil.org/2014/07/09/cashing-in-on-all-of-the-above-u-s-fossil-fuel-production-subsidies-under-obama/
Pachauri, R.K., et al. 2014. Summary for Policymakers. In Climate Change 2014: Synthesis Report for the Fifth Assessment Report of the Intergovernmental Panel on Climate Change. http://www.ipcc.ch/report/ar5/syr/
Tyson, Laura D’Andrea. June 28, 2013. The Myriad Benefits of a Carbon Tax. The New York Times. http://economix.blogs.nytimes.com/2013/06/28/the-myriad-benefits-of-a-carbon-tax/
U.S. Environmental Protection Agency. Fact Sheet: Clean Power Plan. http://www2.epa.gov/carbon-pollution-standards/fact-sheet-clean-power-plan
U.S. Environmental Protection Agency. Global Greenhouse Gas Emissions Data. http://www.epa.gov/climatechange/ghgemissions/global.html
The White House. Climate Change and President Obama’s Action Plan. http://www.whitehouse.gov/climate-change
December 4, 2014 Footer text here21
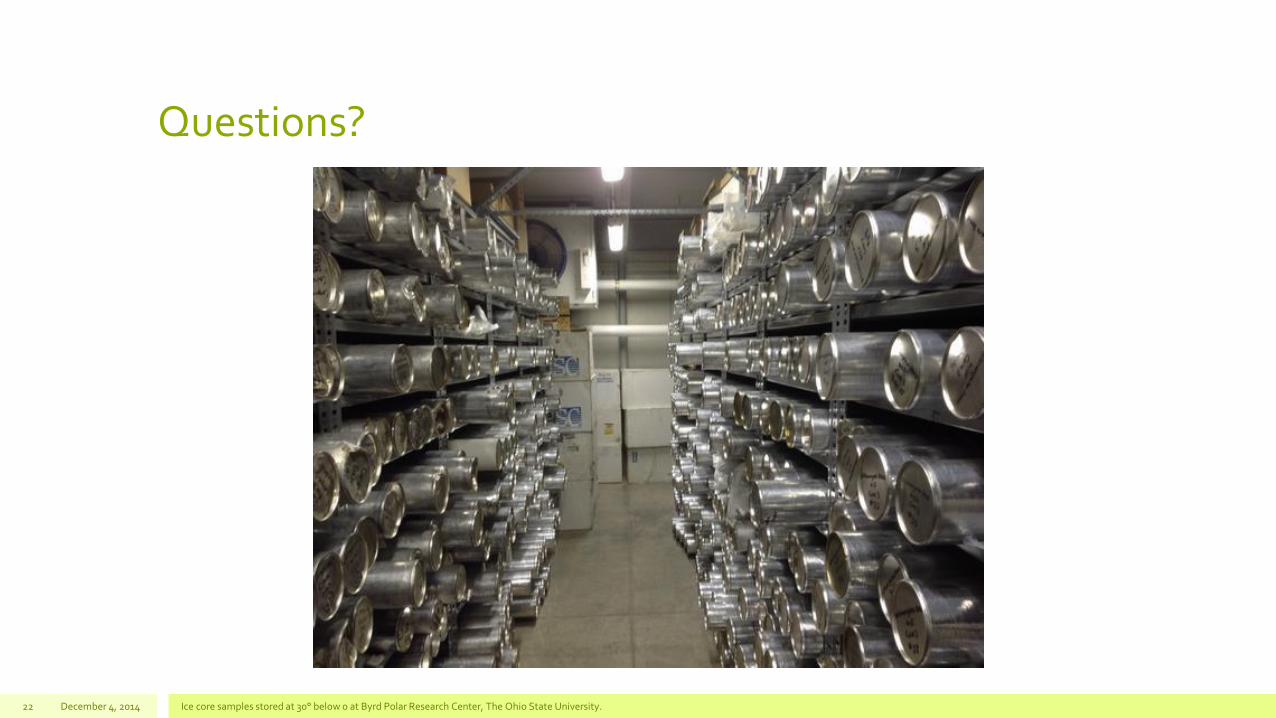
Questions?
December 4, 2014 Ice core samples stored at 30° below 0 at Byrd Polar Research Center, The Ohio State University. 22