cardiff university otter project
TRANSCRIPT
Cardiff University Otter Project
Dr E A Chadwick1
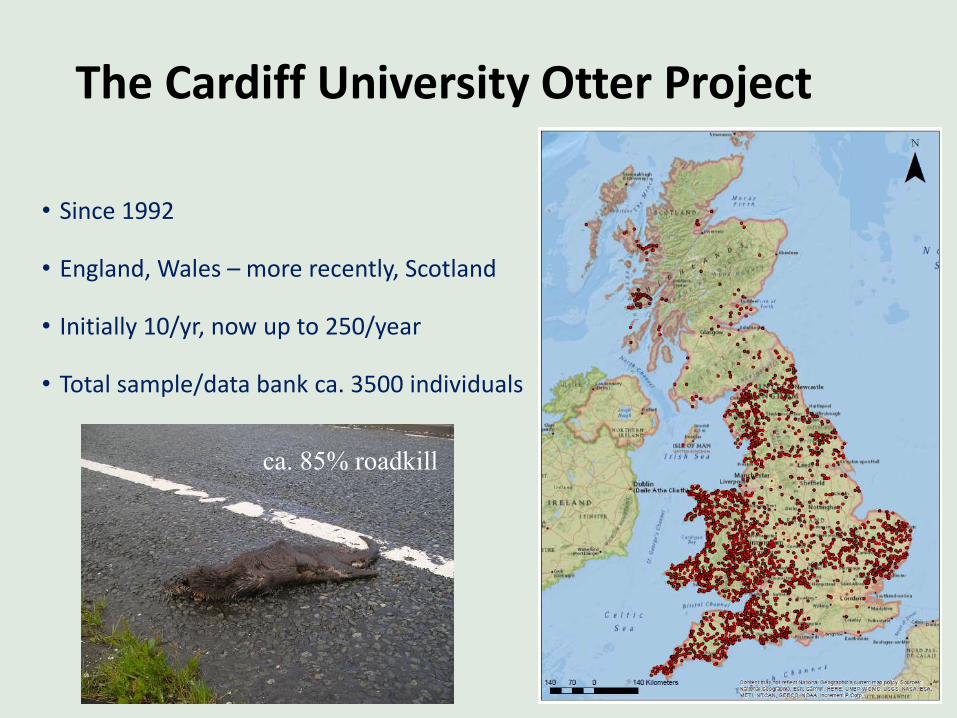
The Cardiff University Otter Project
• Since 1992
• England, Wales – more recently, Scotland
• Initially 10/yr, now up to 250/year
• Total sample/data bank ca. 3500 individuals
2
ca. 85% roadkill
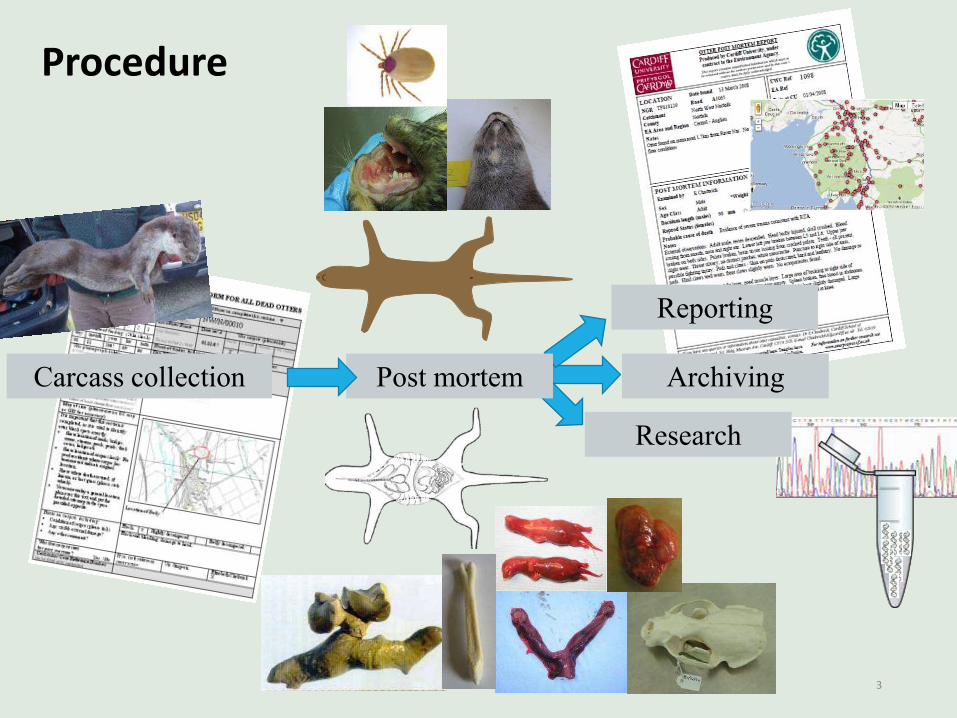
Procedure
3
Carcass collection Post mortem
Reporting
Archiving
Research

The archive
Archived samples – we can retrospectively analyse as:
• New questions arise e.g. AMR
• New methods are developed e.g. genomics
• New funding becomes available…
3.5
4
4.5
5
5.5
6
1970 1975 1980 1985 1990 1995 2000
ln(P
b in
ott
ers
)(u
g/k
g)
Year
(
0
10
20
30
40
50
60
0.5
1.5
2.5
3.5
4.5
5.5
6.5
7.5
8.5
9.5
10.5
11.5
Weight (kg)
Fre
qu
en
cy
Females
Males
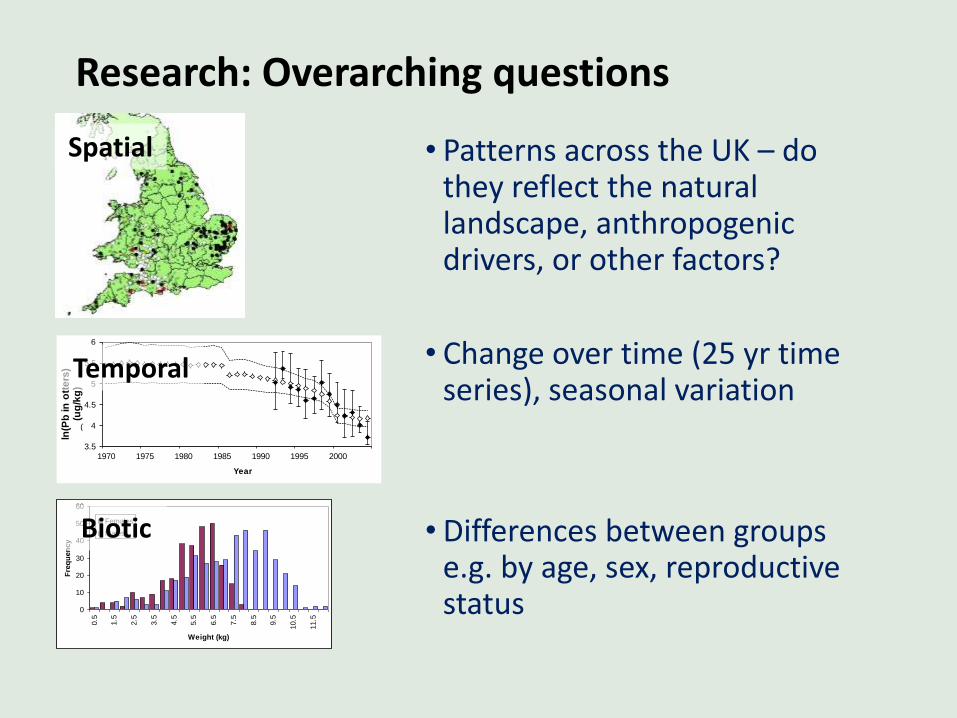
Research: Overarching questions
• Patterns across the UK – do they reflect the natural landscape, anthropogenic drivers, or other factors?
• Change over time (25 yr time series), seasonal variation
• Differences between groups e.g. by age, sex, reproductive status
Spatial
Temporal
Biotic
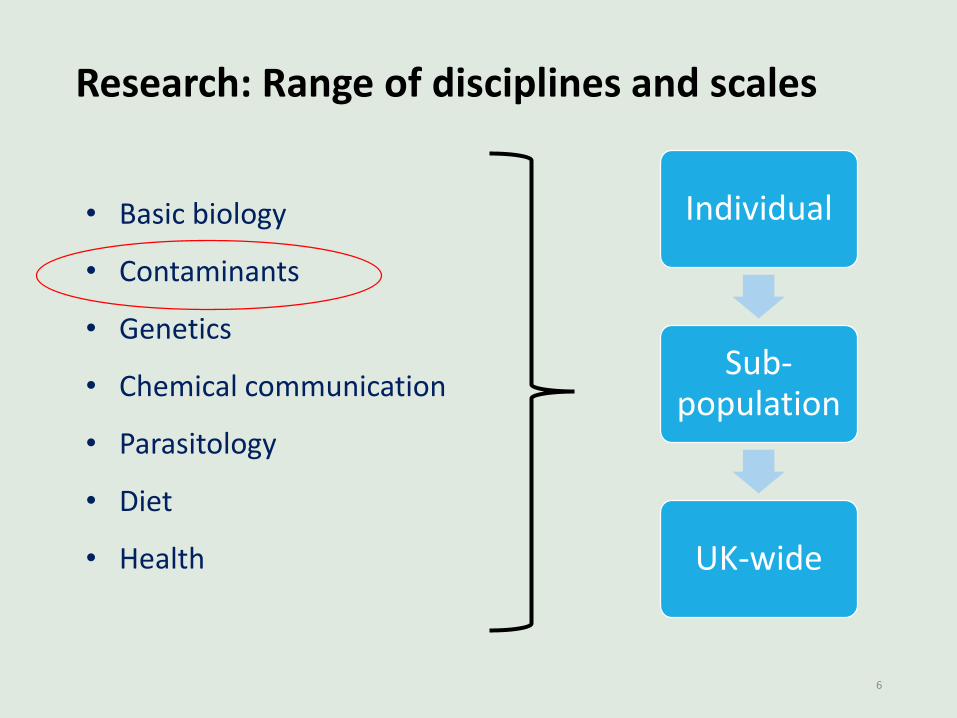
Research: Range of disciplines and scales
6
Individual
Sub-population
UK-wide
• Basic biology
• Contaminants
• Genetics
• Chemical communication
• Parasitology
• Diet
• Health

Relevant aspects for biomonitoring
Biological monitoring –chemical residues
• Top of the freshwater foodchain in UK
•Opportunistic predator, largely fish-based diet
•Non-migratory (home range few to tens km)
• Life-span <8 years; sampled otters mostly 1-3.
Biological effect monitoring – ‘health’
• Diverse PM data
• Body condition
• Relative organ / gland weights
• Reproductive indicators
• Cysts, parasite load, … etc
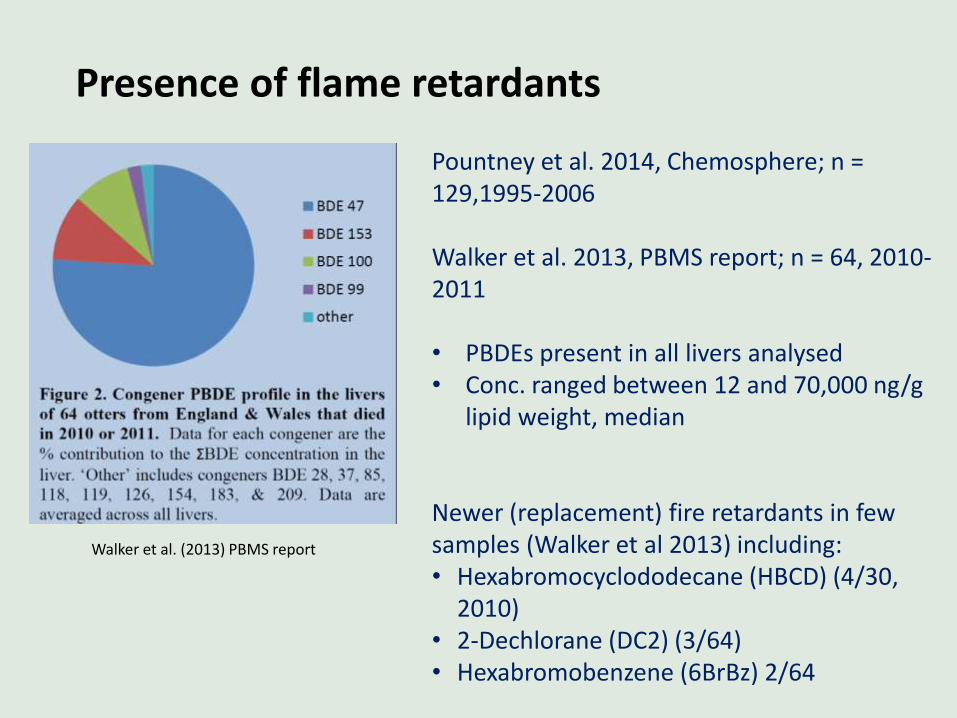
Presence of flame retardants
Walker et al. (2013) PBMS report
Pountney et al. 2014, Chemosphere; n = 129,1995-2006
Walker et al. 2013, PBMS report; n = 64, 2010-2011
• PBDEs present in all livers analysed • Conc. ranged between 12 and 70,000 ng/g
lipid weight, median
Newer (replacement) fire retardants in few samples (Walker et al 2013) including: • Hexabromocyclododecane (HBCD) (4/30,
2010) • 2-Dechlorane (DC2) (3/64)• Hexabromobenzene (6BrBz) 2/64
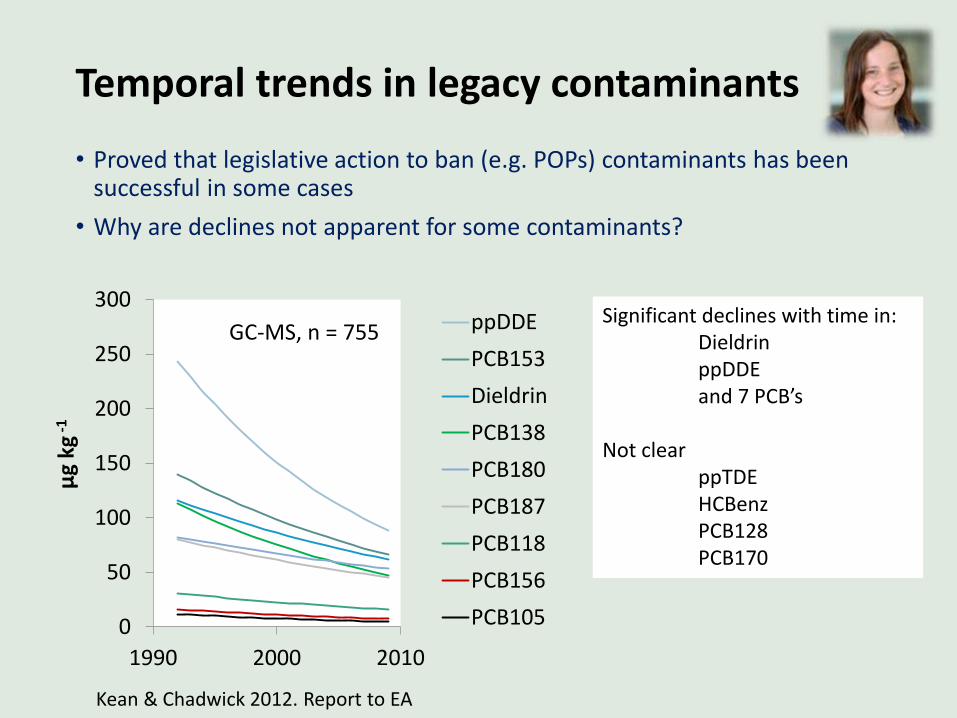
Temporal trends in legacy contaminants
• Proved that legislative action to ban (e.g. POPs) contaminants has been successful in some cases
• Why are declines not apparent for some contaminants?
Significant declines with time in: DieldrinppDDEand 7 PCB’s
Not clearppTDEHCBenzPCB128PCB170
Kean & Chadwick 2012. Report to EA
0
50
100
150
200
250
300
1990 2000 2010
μg
kg-1
ppDDE
PCB153
Dieldrin
PCB138
PCB180
PCB187
PCB118
PCB156
PCB105
GC-MS, n = 755
4
4.2
4.4
4.6
4.8
5
5.2
5.4
5.6
5.8
6
-6.2 -5.7 -5.2 -4.7 -4.2 -3.7 -3.2
Ln(Emissions) (kg/km2)
Pre
dic
ted
Ln
(bo
ne P
b)
(ug
/kg
)
Wind 10th %ile Wind 25th %ile
Wind 50th %ile Wind 75th %ile
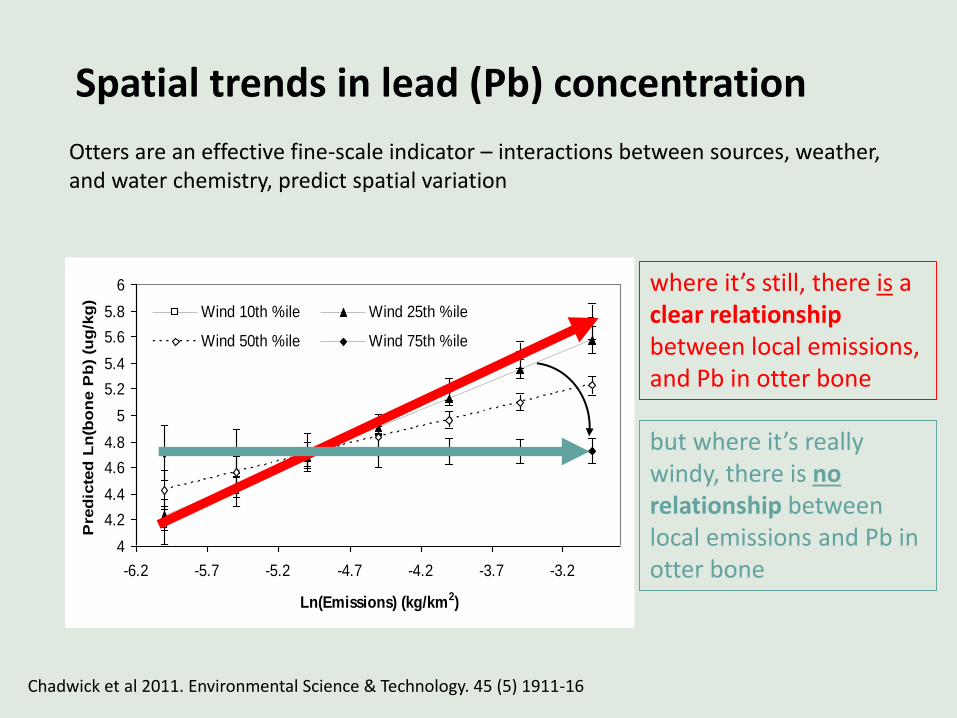
Chadwick et al 2011. Environmental Science & Technology. 45 (5) 1911-16
where it’s still, there is a clear relationship between local emissions, and Pb in otter bone
but where it’s really windy, there is norelationship between local emissions and Pb in otter bone
Spatial trends in lead (Pb) concentration
Otters are an effective fine-scale indicator – interactions between sources, weather, and water chemistry, predict spatial variation
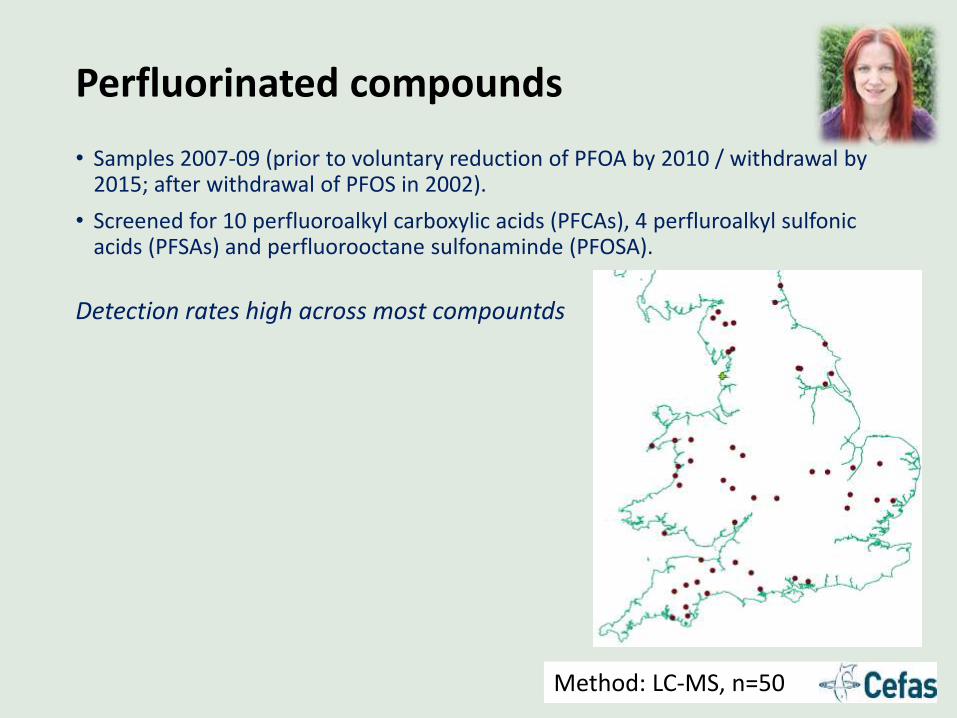
Perfluorinated compounds
• Samples 2007-09 (prior to voluntary reduction of PFOA by 2010 / withdrawal by 2015; after withdrawal of PFOS in 2002).
• Screened for 10 perfluoroalkyl carboxylic acids (PFCAs), 4 perfluroalkyl sulfonic acids (PFSAs) and perfluorooctane sulfonaminde (PFOSA).
Method: LC-MS, n=50
Detection rates high across most compountds

3.5
4
4.5
5
5.5
6
1970 1975 1980 1985 1990 1995 2000
ln(P
b in
ott
ers
)(u
g/k
g)
Year
(
0
10
20
30
40
50
60
0.5
1.5
2.5
3.5
4.5
5.5
6.5
7.5
8.5
9.5
10.5
11.5
Weight (kg)
Fre
qu
en
cy
Females
Males
What next?
Legacy contaminants not analysed since 2007. PFCs –baseline established, what now?
Spatial
Temporal
Biotic
Greater sampling density needed to accurately model spatial drivers e.g. include wind direction e.g. for PFCs
Current work exploring dietary variation using molecular methods –helps inform contaminant exposure. Genomics – understanding health.
Conclusions
Incredible resource!
- especially useful for bioaccumulative contaminants
- So far research into PCBs, OCs, heavy metals, flame retardants, PFCs, plastics
- integration of information – concentration data, biotic data, ecological understanding, health endpoints
Communication?
- Information perhaps underutilised e.g. by agencies & policy makers? How can we communicate better?
- Otter as flagship – great for communication with the public
Acknowledgements
Members of the otter
team at Cardiff
Collaborators and funders

Contact / follow us
www.cardiff.ac.uk/otter-project
@otterprojectuk
[email protected] (the team) [email protected] (me)
@Otter_Project
02920 874046 (the team)02920 874948 (me)