carve-out financial statements of caverion group for the ... · caverion, carve-out financial...
TRANSCRIPT
Caverion, Carve-out financial statements, IFRS
Carve-out Financial Statements of Caverion Group for the years
ended December 31, 2012, 2011 and 2010 CONTENTS Combined income statement Combined statement of comprehensive income Combined balance sheet Combined cash flow statement Combined statement of changes in invested equity Notes to the carve-out financial statements 1 Accounting principles for the carve-out financial statements 2 Segment information 3 Acquisitions 4 Disposals 5 Long-term contracts 6 Other operating income 7 Other operating expenses 8 Depreciation, amortisation and impairments 9 Employee benefit expenses 10 Research and development expenses 11 Financial income and expenses 12 Income taxes 13 Tangible assets 14 Intangible assets 15 Investments in associated companies 16 Available for sale investments 17 Non-current receivables 18 Deferred tax receivables and liabilities 19 Inventories 20 Trade and other receivables 21 Cash and cash equivalents 22 Employee benefit obligations 23 Provisions 24 Borrowings 25 Trade and other payables 26 Derivative instruments 27 Financial assets and liabilities by category 28 Financial risk management 29 Operating leases 30 Commitments and contingent liabilities 31 Subsidiaries 32 Related party transactions 33 Assets held for sale and related liabilities 34 Subsequent events after the balance sheet date
Signatures
Caverion, Carve-out financial statements, IFRS
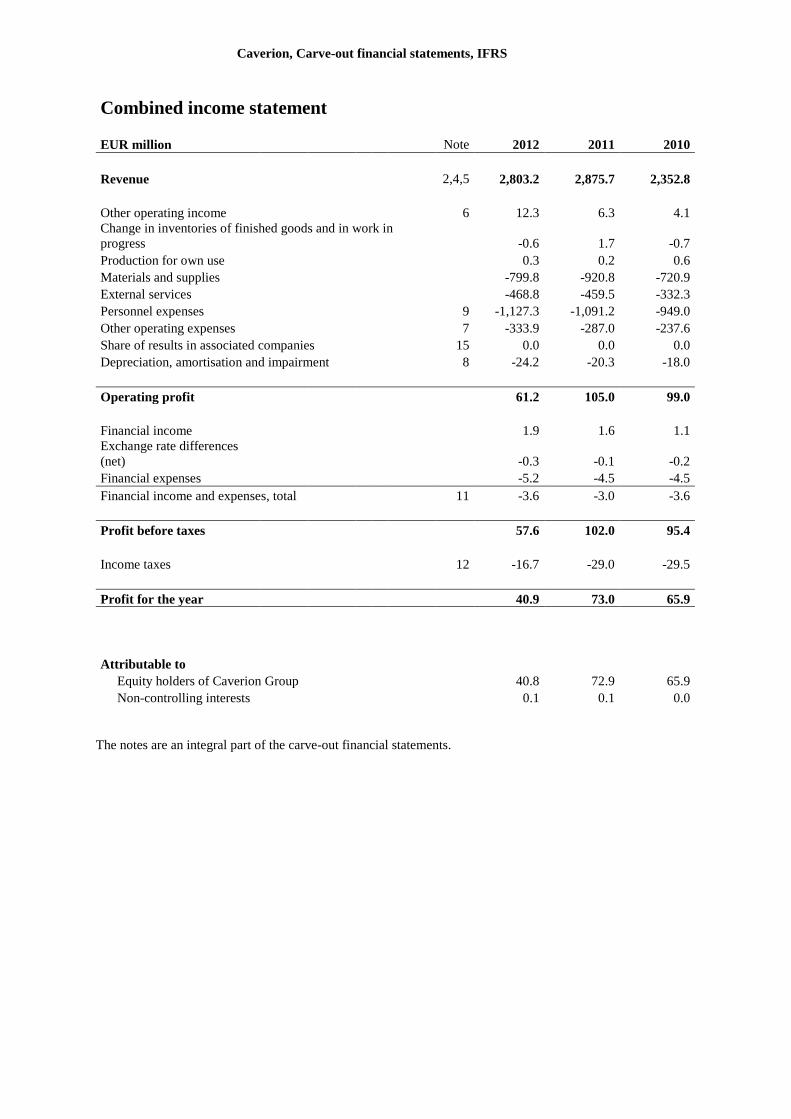
Combined income statement
EUR million Note 2012 2011 2010
Revenue 2,4,5 2,803.2 2,875.7 2,352.8
Other operating income 6 12.3 6.3 4.1
Change in inventories of finished goods and in work in
progress -0.6 1.7 -0.7
Production for own use 0.3 0.2 0.6
Materials and supplies -799.8 -920.8 -720.9
External services -468.8 -459.5 -332.3
Personnel expenses 9 -1,127.3 -1,091.2 -949.0
Other operating expenses 7 -333.9 -287.0 -237.6
Share of results in associated companies 15 0.0 0.0 0.0
Depreciation, amortisation and impairment 8 -24.2 -20.3 -18.0
Operating profit 61.2 105.0 99.0
Financial income 1.9 1.6 1.1
Exchange rate differences
(net) -0.3 -0.1 -0.2
Financial expenses -5.2 -4.5 -4.5
Financial income and expenses, total 11 -3.6 -3.0 -3.6
Profit before taxes 57.6 102.0 95.4
Income taxes 12 -16.7 -29.0 -29.5
Profit for the year 40.9 73.0 65.9
Attributable to
Equity holders of Caverion Group 40.8 72.9 65.9
Non-controlling interests 0.1 0.1 0.0
The notes are an integral part of the carve-out financial statements.
Caverion, Carve-out financial statements, IFRS
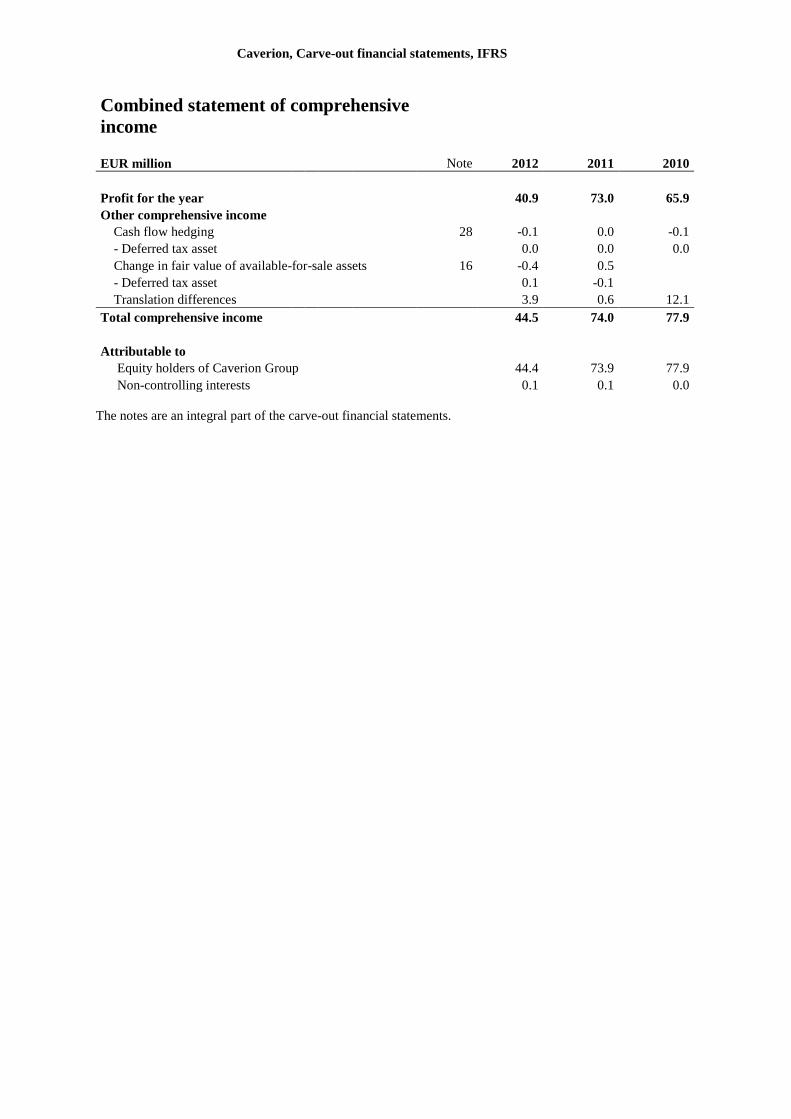
Combined statement of comprehensive
income
EUR million Note 2012 2011 2010
Profit for the year 40.9 73.0 65.9
Other comprehensive income
Cash flow hedging 28 -0.1 0.0 -0.1
- Deferred tax asset 0.0 0.0 0.0
Change in fair value of available-for-sale assets 16 -0.4 0.5
- Deferred tax asset 0.1 -0.1
Translation differences 3.9 0.6 12.1
Total comprehensive income 44.5 74.0 77.9
Attributable to
Equity holders of Caverion Group 44.4 73.9 77.9
Non-controlling interests 0.1 0.1 0.0
The notes are an integral part of the carve-out financial statements.
Caverion, Carve-out financial statements, IFRS
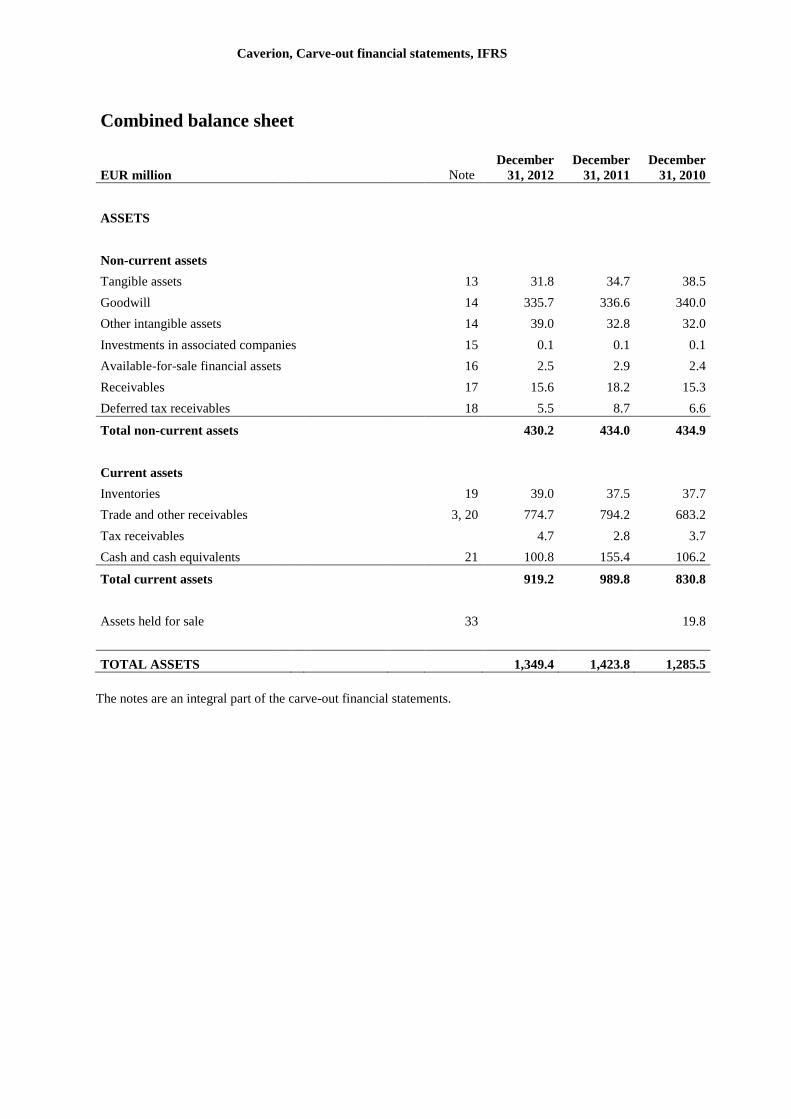
Combined balance sheet
EUR million Note December
31, 2012
December
31, 2011
December
31, 2010
ASSETS
Non-current assets
Tangible assets 13 31.8 34.7 38.5
Goodwill 14 335.7 336.6 340.0
Other intangible assets 14 39.0 32.8 32.0
Investments in associated companies 15 0.1 0.1 0.1
Available-for-sale financial assets 16 2.5 2.9 2.4
Receivables 17 15.6 18.2 15.3
Deferred tax receivables 18 5.5 8.7 6.6
Total non-current assets 430.2 434.0 434.9
Current assets
Inventories 19 39.0 37.5 37.7
Trade and other receivables 3, 20 774.7 794.2 683.2
Tax receivables 4.7 2.8 3.7
Cash and cash equivalents 21 100.8 155.4 106.2
Total current assets 919.2 989.8 830.8
Assets held for sale 33 19.8
TOTAL ASSETS 1,349.4 1,423.8 1,285.5
The notes are an integral part of the carve-out financial statements.
Caverion, Carve-out financial statements, IFRS
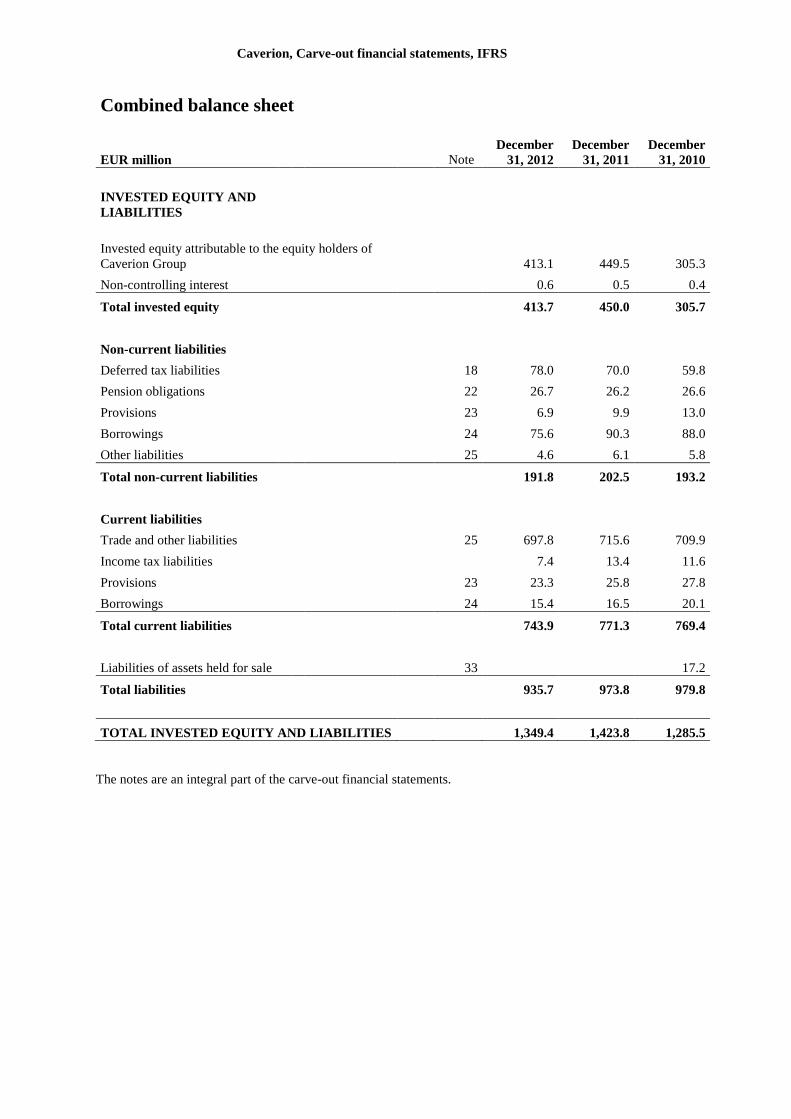
Combined balance sheet
EUR million Note December
31, 2012
December
31, 2011
December
31, 2010
INVESTED EQUITY AND
LIABILITIES
Invested equity attributable to the equity holders of
Caverion Group 413.1 449.5 305.3
Non-controlling interest 0.6 0.5 0.4
Total invested equity 413.7 450.0 305.7
Non-current liabilities
Deferred tax liabilities 18 78.0 70.0 59.8
Pension obligations 22 26.7 26.2 26.6
Provisions 23 6.9 9.9 13.0
Borrowings 24 75.6 90.3 88.0
Other liabilities 25 4.6 6.1 5.8
Total non-current liabilities 191.8 202.5 193.2
Current liabilities
Trade and other liabilities 25 697.8 715.6 709.9
Income tax liabilities 7.4 13.4 11.6
Provisions 23 23.3 25.8 27.8
Borrowings 24 15.4 16.5 20.1
Total current liabilities 743.9 771.3 769.4
Liabilities of assets held for sale 33 17.2
Total liabilities 935.7 973.8 979.8
TOTAL INVESTED EQUITY AND LIABILITIES 1,349.4 1,423.8 1,285.5
The notes are an integral part of the carve-out financial statements.

Caverion, Carve-out financial statements, IFRS
Combined cash flow statement
EUR million Note 2012 2011 2010
Cash flow from operating activities
Profit for the year 40.9 73.0 65.9
Adjustments for:
Depreciation, amortisation and impairment 24.2 20.3 18.0
Other adjustments for non-cash transactions -12.3 -5.3 -1.2
Financial income and expenses 3.6 3.0 3.6
Gains/losses on the sale of tangible and intangible assets -2.5 -5.5 0.0
Taxes 16.7 29.0 29.5
Total adjustments 29.7 41.5 49.9
Change in working capital:
Change in trade and other receivables 44.1 -103.1 -65.3
Change in inventories 0.4 0.4 -3.2
Change in trade and other payables -40.9 -1.7 -23.0
Total change in working capital 3.6 -104.4 -91.5
Interest paid -5.0 -5.0 -5.4
Other financial items, net -3.3 -0.9 -0.3
Interest received 1.3 0.9 0.6
Dividends received 0.0 0.1 0.1
Taxes paid -17.9 -20.0 -19.1
Net cash generated from (used in) operating
activities 49.3 -14.8 0.2
Cash flow from investing activities
Acquisition of subsidiaries and business operations, net of
cash 3 -7.3 -8.9 -35.2
Purchases of property, plant and equipment 13 -5.7 -5.3 -1.2
Purchases of intangible assets 14 -0.9 -0.8 -0.3
Disposals of subsidiaries and operations, net of cash 4 5.9
Proceeds from sale of tangible and intangible assets 4.4 0.5 4.0
Proceeds from sale of available-for-sale
financial assets 0.7 2.7 0.1
Net cash used in investing activities -8.8 -5.9 -32.6
Operating cash flow after investments 40.5 -20.7 -32.4
Cash flow from financing activities
Proceeds from borrowings 24 35.0
Repayment of borrowings 24 -15.0 -36.2 -19.4
Change in current liabilities, net 24 -1.4 -28.6
Payments of financial leasing debts -0.5 -0.9 -0.1
Equity financing with YIT Group, net -81.9 70.0 47.3
Net cash used in financing activities -97.4 66.5 -0.8
Net change in cash and cash
equivalents -56.9 45.8 -33.2
Cash and cash equivalents at the
beginning of the year 154.5 106.2 136.1
Foreign exchange rate effect on cash and cash
equivalents 3.1 2.5 3.3
Cash and cash equivalents at the
end of the year 21 100.8 154.5 106.2
The notes are an integral part of the carve-out financial statements.
Caverion, Carve-out financial statements, IFRS
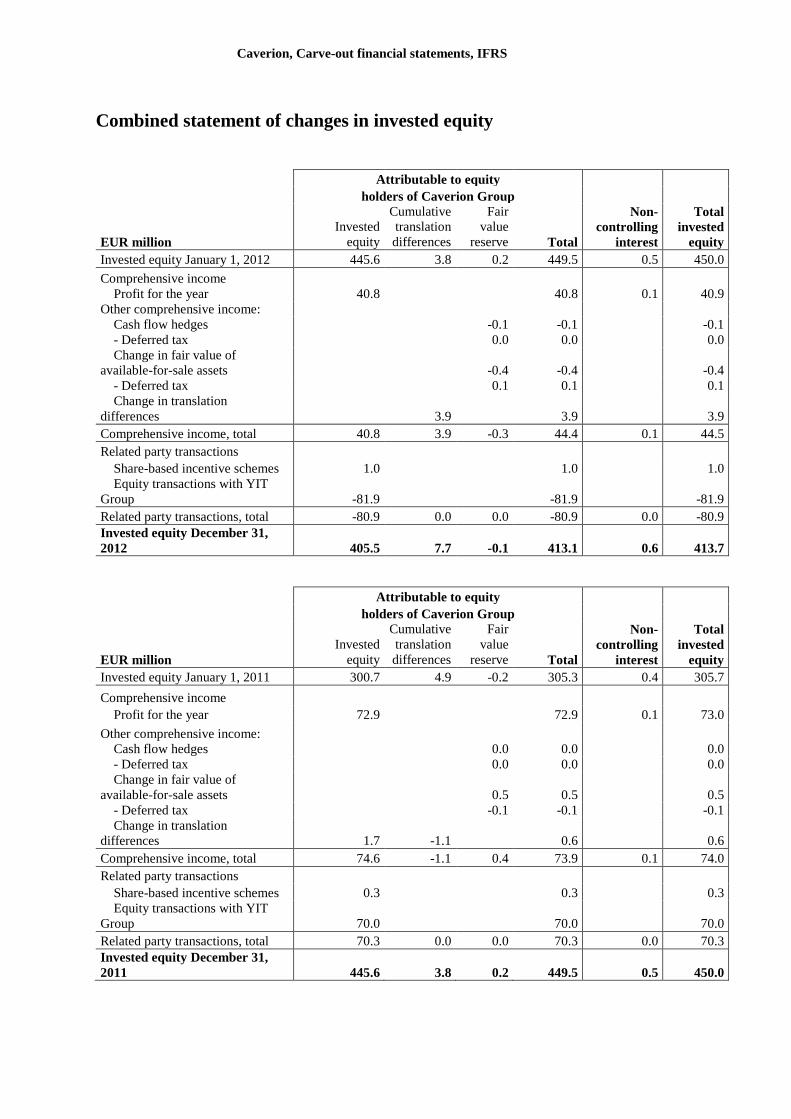
Combined statement of changes in invested equity
Attributable to equity
holders of Caverion Group
EUR million
Invested
equity
Cumulative
translation
differences
Fair
value
reserve Total
Non-
controlling
interest
Total
invested
equity
Invested equity January 1, 2012 445.6 3.8 0.2 449.5 0.5 450.0
Comprehensive income
Profit for the year 40.8 40.8 0.1 40.9
Other comprehensive income:
Cash flow hedges -0.1 -0.1 -0.1
- Deferred tax 0.0 0.0 0.0
Change in fair value of
available-for-sale assets -0.4 -0.4 -0.4
- Deferred tax 0.1 0.1 0.1
Change in translation
differences 3.9 3.9 3.9
Comprehensive income, total 40.8 3.9 -0.3 44.4 0.1 44.5
Related party transactions
Share-based incentive schemes 1.0 1.0 1.0
Equity transactions with YIT
Group -81.9 -81.9 -81.9
Related party transactions, total -80.9 0.0 0.0 -80.9 0.0 -80.9
Invested equity December 31,
2012 405.5 7.7 -0.1 413.1 0.6 413.7
Attributable to equity
holders of Caverion Group
EUR million
Invested
equity
Cumulative
translation
differences
Fair
value
reserve Total
Non-
controlling
interest
Total
invested
equity
Invested equity January 1, 2011 300.7 4.9 -0.2 305.3 0.4 305.7
Comprehensive income
Profit for the year 72.9 72.9 0.1 73.0
Other comprehensive income:
Cash flow hedges 0.0 0.0 0.0
- Deferred tax 0.0 0.0 0.0
Change in fair value of
available-for-sale assets 0.5 0.5 0.5
- Deferred tax -0.1 -0.1 -0.1
Change in translation
differences 1.7 -1.1 0.6 0.6
Comprehensive income, total 74.6 -1.1 0.4 73.9 0.1 74.0
Related party transactions
Share-based incentive schemes 0.3 0.3 0.3
Equity transactions with YIT
Group 70.0 70.0 70.0
Related party transactions, total 70.3 0.0 0.0 70.3 0.0 70.3
Invested equity December 31,
2011 445.6 3.8 0.2 449.5 0.5 450.0
Caverion, Carve-out financial statements, IFRS
Attributable to equity
holders of Caverion Group
EUR million
Invested
equity
Cumulative
translation
differences
Fair
value
reserve Total
Non-
controlling
interest
Total
invested
equity
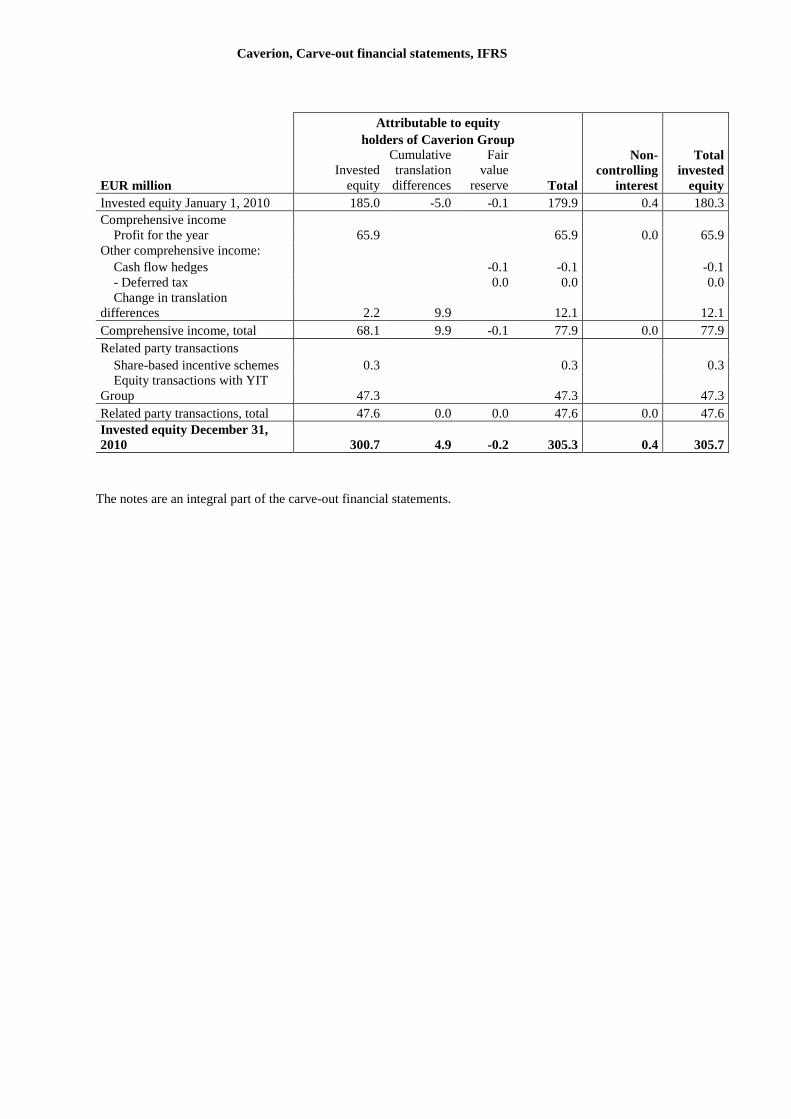
Invested equity January 1, 2010 185.0 -5.0 -0.1 179.9 0.4 180.3
Comprehensive income
Profit for the year 65.9 65.9 0.0 65.9
Other comprehensive income:
Cash flow hedges -0.1 -0.1 -0.1
- Deferred tax 0.0 0.0 0.0
Change in translation
differences 2.2 9.9 12.1 12.1
Comprehensive income, total 68.1 9.9 -0.1 77.9 0.0 77.9
Related party transactions
Share-based incentive schemes 0.3 0.3 0.3
Equity transactions with YIT
Group 47.3 47.3 47.3
Related party transactions, total 47.6 0.0 0.0 47.6 0.0 47.6
Invested equity December 31,
2010 300.7 4.9 -0.2 305.3 0.4 305.7
The notes are an integral part of the carve-out financial statements.
Caverion, Carve-out financial statements, IFRS
Notes to the carve-out financial statements
1. ACCOUNTING PRINCIPLES FOR THE CARVE-OUT FINANCIAL
STATEMENTS
Background
YIT Corporation (“YIT” or “YIT parent company”) with its subsidiaries (“YIT Group”) is a service company in
building systems, construction services and services for industry. YIT Group offers technical building systems
installations as well as service and maintenance of building systems for real estates and industry (“Building
Systems business”) and residential construction for households, construction of business premises and
infrastructure (“Constructions Services business”).
The Board of Directors of YIT has on February 21, 2013 approved the demerger plan concerning a partial
demerger. According to the demerger plan, YIT will demerge so that all of the assets and liabilities related to
YIT’s Building Systems business are transferred to a company to be established in the demerger named
Caverion Corporation (“Caverion” or “Caverion parent company”). YIT’s Construction Services business will
remain with YIT. The purpose of the demerger is to execute the division of YIT Group’s different businesses
into independent groups so that the Building Systems business, which primarily consist of Building Services
Northern Europe and Building Services Central Europe, shall be formed as one group of companies and the
Construction Services business, which mainly consists of Construction Services Finland and International
Construction Services, shall be formed as another group of companies. The planned registration date for the
demerger is June 30, 2013, after which the shares of Caverion will be admitted for public trading on NASDAQ
OMX Helsinki Oy. The trading with Caverion shares is intended to commence as soon as possible after the
implementation of the demerger. According to the demerger plan, YIT’s shareholders shall receive as demerger
consideration one share in Caverion for each share owned in YIT.
Caverion has not in the past formed a separate legal group. The carve-out financial statements presented herein
reflect income and expenses, assets and liabilities and cash flows of those entities that have historically formed
the Building Services business within YIT Group, which consists of YIT’s reportable segments Building
Services Northern Europe and Building Services Central Europe. The carve-out financial statements also
include those income and expenses, assets and liabilities and cash flows from YIT parent company and
Perusyhtymä Oy which can be allocated to Building Systems business. Collectively these entities and income
and expenses, assets and liabilities and cash flows will form a separate legal group after the YIT’s demerger and
are referred to as “Caverion Group” or “Group” in these carve-out financial statements.
The carve-out financial statements have been prepared in accordance with the basis of preparation and
accounting policies set out below. The carve-out financial statements of Caverion Group has been prepared for
the inclusion in the prospectus to be prepared by YIT for YIT’s EGM approving the partial demerger and for the
listing of Caverion shares on the NASDAQ OMX Helsinki Oy.
Basis of preparation
The carve-out financial statements of Caverion Group for the year ended December 31, 2012, 2011 and 2010
have been prepared on a carve-out basis from YIT’s consolidated financial statements using the historical
income and expenses, assets and liabilities and cash flows attributable to Building Services business. The carve-
out financial statements also include allocations of income, expenses, assets, liabilities and cash-flows from the
YIT parent company and Perusyhtymä Oy. These carve-out financial statements have been authorized for issue
by Board of Directors of YIT on June 3, 2013.
The carve-out financial statements may not be indicative of Caverion Group’s future performance and they do
not necessarily reflect what its combined results of operations, financial position and cash flows would have
been, had Caverion with its subsidiaries operated as an independent group and had it presented stand-alone
financial statements during the periods presented.
Caverion, Carve-out financial statements, IFRS
The carve-out financial statements have been prepared on a going concern basis and under the historical cost
convention, except for the available-for-sale -investments, financial assets and liabilities at fair value through
profit and loss and derivative instruments at fair value. Share-based payments are measured at fair value at the
time of granting.
The carve-out financial statements of Caverion Group have been prepared in accordance with International
Financial Reporting Standards (“IFRS”) as adopted by the European Union, under consideration of the
principles for determining which assets and liabilities, income and expenses as well as cash flows are to be
assigned to Caverion Group as described under “Basis of accounting” below. References to “IFRS” hereafter
should be construed as references to IFRS as adopted by EU. Hereafter by “IFRS” is referred to IFRS standards
endorsed by the EU.
IFRS does not provide guidance for the preparation of carve-out financial statements, and accordingly in
preparing the carve-out financial statements certain accounting conventions commonly used for the preparation
of historical financial statements for inclusion in Prospectuses have been applied. The application of these
conventions has been described under “Basis of accounting” below.
The carve-out financial statements are presented in millions of euro, except when otherwise indicated. Rounding
differences might occur.
The following section describes how the carve-out financial statements for Caverion Group have been prepared.
Basis of accounting
Structure of the carve-out financial statements
The following entities and financial statement items have been included in these carve-out financial statements:
YIT Building Systems Oy and its subsidiaries. which will be transferred to Caverion Corporation in the
demerger
YIT Industry Ltd and its subsidiaries, which will be transferred to Caverion Corporation in the
demerger.
Assets, liabilities, income and expenses from the demerging YIT Corporation and Perusyhtymä Oy that
relate to the Building Services business.
The Caverion Group carve-out financial statements include all those legal entities that have historically formed
YIT’s reportable segments Building Service Northern Europe and Building Service Central Europe. The
historical financial information of those entities included in the carve-out financial statements on the entities’
separate financial statements which have been used in preparing YIT’s consolidated financial statements.
The Caverion Group carve-out financial statements consist of assets, liabilities, results of operations and cash
flows of the acquired entities within the Building Systems business from the date of acquisition. The assets,
liabilities, results of operations and cash flows from the sold entities are included in the carve-out financial
statements until the entities have been sold.
Principles applied in preparing the carve-out financial statements
The following summarizes the accounting and other principles applied in preparing the carve-out financial
statements. YIT management considers that the allocations described below have been made on a reasonable
basis, but are not necessarily indicative of the costs that would have been incurred if Caverion had been a stand-
alone entity.
Intercompany transactions and transactions with related parties
Intercompany transactions and assets and liabilities between entities included in the carve-out financial
statements have been eliminated. The carve-out financial statements include the Caverion Group’s transactions
and balance sheet items. Intercompany transactions and balance sheet items with other YIT Group companies
previously considered as intercompany transactions in YIT reporting have been treated as transactions with
related parties.
Caverion, Carve-out financial statements, IFRS
In the carve-out financial statements, the intercompany receivables and liabilities of YIT parent company where
the counterparty has been a subsidiary belonging to the Caverion Group have been allocated to the Caverion
parent company, including the financial income and expenses relating to these receivables and liabilities.
Acquisition costs relating to Caverion subsidiaries owned by YIT parent company have been allocated to
Caverion parent company and the acquisition cost method has been used to eliminate the acquisition of
subsidiaries.
Invested equity
Caverion has not in past formed a separate legal group nor presented any stand-alone financial statements, and
accordingly it is not conceivable to present share capital or an analysis of equity reserves. The net assets of
Caverion group are represented by capital invested in Caverion Group and shown as “invested equity”.
Changes in net assets allocated to Caverion are presented separately in the combined statement of changes in
invested equity through line “Equity transactions with YIT Group” and in the cash flow statements through line
“Equity financing with YIT Group, net”, reflecting the internal financing between YIT Group and Caverion
Group during the periods presented. The amount of which is affected by the net assets allocated to the Caverion
parent company. The net assets allocated to Caverion parent company consists mainly of investments in group
companies, intercompany receivables and liabilities, financial liabilities, other receivables and liabilities and net
cash and cash equivalents.
These carve-out financial statements are presented in euro, which is Caverion parent company’s functional and
reporting currency. The Caverion Group entities have also other functional currencies. Translation differences
arising from translating the results for the period and equity are recognized in invested equity and their changes
are presented in other comprehensive income.
Cash management and financing
Cash management is centralized so that YIT manages Group’s cash needs mainly through cash pool
arrangement. Caverion Group’s cash and cash equivalents comprise of cash in the centralized cash pool of YIT
parent entity transferred to Caverion and cash held by Caverion entities. Caverion receives the proportion of
cash and cash equivalents of YIT Corporation that equals the portion of intra-group account liabilities allocated
to Caverion compared to the entire intra-group account liabilities to all YIT Group’s direct and indirect
subsidiaries. No interest income has been allocated related to these cash and cash equivalents allocated to
Caverion.
YIT Group’s external financing is centralized to the group’s parent entity. Subsidiaries’ working capital needs
have been funded in addition to cash pool arrangement mainly by intercompany loans.
The external debt financing of the demerging YIT parent entity that is directly attributable to the operations of
Caverion, and interest expenses relating to the financing, are included in the carve-out financial statements. In
addition, carve-out financial statements comprise debt financing of the Caverion entities to third parties and
interest expenses relating to these.
The partial demerger is subject to investors’ approval and renegotiation of financing. YIT has been negotiating
with the primary financers and been able to confirm adequate financing and credit and guarantee facilities for
the demerging businesses. In February 2013 new financing arrangements have been agreed with Nordic
financial institutions to Caverion, these comprise a EUR 140 million long-term loan facility, a EUR 60 million
long-term credit facility and up to EUR 67 million bridge financing. The carve-out financial statements have not
been adjusted to present the effects of the reorganization of financing.
Therefore the financing costs included in the carve-out financial statements may not necessarily represent what
the financing costs would have been, if Caverion had historically obtained financing on a stand-alone basis. It is
not representative of the cost of financing that will arise in the future.
Caverion, Carve-out financial statements, IFRS
Derivatives
External derivative contracts entered by YIT have been allocated to Caverion if those are directly connected
with Caverion. These are the interest rate swap related to the financing loan and the currency swaps relating to
the cash pool arrangement.
Income tax
During the periods presented in these carve-out financial statements, the legal entities in the Caverion group
have operated as separate taxpayers. For these entities the tax charges and the tax liabilities and –receivables in
the carve-out financial statements are based on actual taxation.
The taxes allocated to Caverion from the demerging YIT parent company have been calculated as Caverion had
been a separate taxpayer. Therefore, the income tax for the period of Caverion parent company is the amount of
tax payable or refundable based on the entity’s hypothetical tax returns, and it is presented as current tax
expense in the combined income statement. In the combined balance sheet these tax entries are presented as
transactions through invested equity, because any payable or refundable taxes will not arise to Caverion parent
company due to these hypothetical taxes. Deferred taxes on temporary differences are recognized where such
temporary differences exist.
The tax charges recorded in the combined carve-out income statement are not necessarily representative of the
tax charges that may arise in the future.
Pensions
Pensions and other post-employment benefit plans and their respective portion of the plan liabilities, plan assets,
interest and service costs have either been included or allocated to Caverion Group from YIT parent company
for the purpose of preparing these carve-out financial statements.
Centrally provided services
YIT Group has historically recharged centrally provided services from its subsidiaries, such as financing, IT,
HR and services related to the premises. Historically these recharged costs have been allocated to Caverion
Group entities, and they are included in the carve-out financial statements.
YIT parent company has also been responsible for the management and general administration of the YIT
Group. The income and expenses of YIT parent company have been allocated to the Caverion parent company
mainly based on the transferring employers and subsidiary allocations. The carve-out financial statements
include also employee cost allocations relating to Caverion parent company’s employees’ participation in the
YIT share-based compensation plan.
The need for such centralized services will remain after the legal separation of Caverion from YIT. However,
the costs may be different and thus will not be comparable to the amounts reflected in the carve-out financial
statements.
Leases
In the carve-out financial statements the non-cancellable operating leases allocated to Caverion Group include
lease agreements of Caverion subsidiaries with third parties and lease agreements for office facilities with YIT
Group. The minimum lease payments of the non-cancellable lease agreements made with YIT Group presented
in the carve-out financial statements are equivalent with the minimum lease payments of the corresponding
external lease agreements made by YIT Group.
The minimum lease payments of the non-cancellable lease agreements might change substantially after
Caverion has been demerged legally from YIT and therefore, they may not be representative of the future lease
obligations.
Caverion, Carve-out financial statements, IFRS
Earnings per share
As the financial statements have been prepared on a carve-out basis, it is not possible to measure earnings per
share. Caverion did not have any share capital during the periods presented nor could any shares been carved out
form the total amount of YIT’s outstanding shares. Additionally, the income statement information included in
the carve-out financial statements does not include interest expenses on the borrowings transferred to Caverion
in connection with the demerger. For these reasons, the management considers that presenting an earnings per
share ratio would not accurately reflect the historical earning per share. Accordingly, the requirement of IAS 33
“Earnings per share” to disclose earnings per share has not been complied with.
Accounting principles
Consolidation
The Caverion Group uses the acquisition method of accounting to account for business combinations. The total
consideration to be transferred for the acquisition of a subsidiary is the fair value of the assets transferred, the
liabilities incurred and the equity interests issued by the Caverion Group. The total consideration includes the
fair value of any asset or liability resulting from a contingent consideration arrangement. Acquisition-related
costs are expensed as incurred. Identifiable assets acquired and liabilities and contingent liabilities assumed in a
business combination are measured initially at their fair value at the acquisition date. On an acquisition-by-
acquisition basis, the Group recognises any non-controlling interest in the acquiree either at fair value or at the
non-controlling interest’s proportionate share of the acquiree’s assets.
Associated companies
The carve-out financial statements include associated companies in which the Caverion Group either holds
20%-50% of the voting rights or in which the Caverion Group has a significant influence otherwise but not a
controlling interest. Associated companies have been consolidated using the equity method. If the Caverion
Group’s share of associates’ losses exceeds the carrying amount, losses in excess of the carrying amount are not
consolidated unless the Caverion Group has committed itself to fulfilling the obligations of the associates.
Unrealised profits between the Caverion Group and associates have been eliminated in accordance with the
Caverion Group’s holding. An investment in an associate includes the goodwill arising from acquisition, which
has been tested for impairment.
Joint ventures
Joint ventures are companies in which Caverion Group exercises joint control with other parties. Caverion
Group’s holdings in joint ventures are consolidated using the equity method. The Caverion Group’s investments
in joint ventures are initially recognised at cost and the post-acquisition movements in net assets of the joint
venture are adjusted against the carrying value of the investment. The Caverion Group’s share of joint ventures
profits or losses is recognised in the income statement. Unrealised profits between the Caverion Group and joint
ventures have been eliminated in accordance with the Caverion Group’s holding
Transactions with non-controlling interests
The Caverion Group treats transactions with non-controlling interests as transactions with equity owners. When
the Group purchases from non-controlling interests, the difference between any consideration paid and the
relevant share acquired of the carrying value of net assets of the subsidiary is recorded in equity. Gains or losses
on disposals to non-controlling interests are also recorded in equity.
When the Group ceases to have control, any remaining interest in the entity is re-measured at fair value, with the
change in the carrying amount recognised through profit and loss. In addition, any amounts previously
recognised in other comprehensive income in respect of that entity are accounted for as realised and booked to
income statement. If the interest is reduced but control is retained, only a proportionate share of the amounts
previously recognised in other comprehensive income are booked to non-controlling interest in equity.
Caverion, Carve-out financial statements, IFRS
Foreign currency translation
Items included in the Caverion carve-out financial statements of each group’s entities are measured using the
currency of the primary economic environment in which the entity operates (the functional currency). These
carve-out financial statements are presented in euros.
Foreign currency transactions
Foreign currency transactions are translated into the functional currency using the exchange rates prevailing on
the date of transaction or valuation, where items are re-measured. Foreign exchange rate gains and losses
resulting from the settlement of such transactions and from the translation at year-end exchange rates of
monetary assets and liabilities denominated in foreign currencies are recognised in the income statement.
Foreign exchange gains and losses that relate to borrowings and cash and cash equivalents are presented in the
income statement within “Finance income and expemses”. All other foreign exchange gains and losses are
presented in the income statement above operating profit. Non-monetary items are mainly valued at the
transaction date’s foreign exchange rates.
Translation of foreign Group companies
The income statements of foreign Group companies have been translated to euro using the average exchange
rate quoted for the calendar months of the reporting period. The balance sheets have been translated using the
rates on the closing date. The translation of the result for the period using different exchange rates in the income
statement and balance sheet results in a translation difference, which is entered in equity and the changes are
entered in other comprehensive income.
Translation differences arising from the elimination of the acquisition cost of foreign subsidiaries are entered in
shareholders’ equity. When a foreign subsidiary is disposed or sold, exchange differences that were recorded in
equity are recognised in the income statement as part of the gain or loss on sale. Translation differences in the
carve-out financial statements January 1, 2010 are based on the transferring entities accrued translation
differences from the YIT Group financial statements December 31, 2009.
Both the goodwill arising from the acquisition of a foreign unit and the adjustments of acquired assets and
liabilities to their fair values have been treated as the assets and liabilities of the foreign unit in question and
translated at the rate on the closing date.
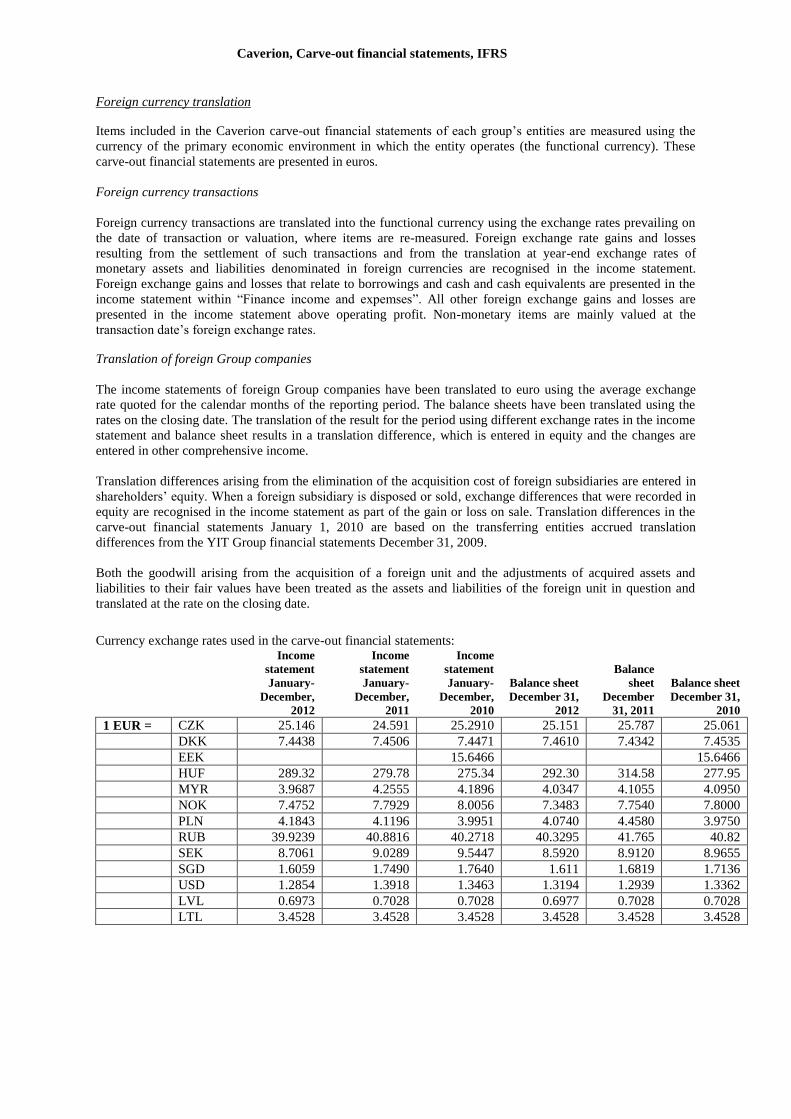
Currency exchange rates used in the carve-out financial statements:
Income
statement
January-
December,
2012
Income
statement
January-
December,
2011
Income
statement
January-
December,
2010
Balance sheet
December 31,
2012
Balance
sheet
December
31, 2011
Balance sheet
December 31,
2010
1 EUR = CZK 25.146 24.591 25.2910 25.151 25.787 25.061
DKK 7.4438 7.4506 7.4471 7.4610 7.4342 7.4535
EEK 15.6466 15.6466
HUF 289.32 279.78 275.34 292.30 314.58 277.95
MYR 3.9687 4.2555 4.1896 4.0347 4.1055 4.0950
NOK 7.4752 7.7929 8.0056 7.3483 7.7540 7.8000
PLN 4.1843 4.1196 3.9951 4.0740 4.4580 3.9750
RUB 39.9239 40.8816 40.2718 40.3295 41.765 40.82
SEK 8.7061 9.0289 9.5447 8.5920 8.9120 8.9655
SGD 1.6059 1.7490 1.7640 1.611 1.6819 1.7136
USD 1.2854 1.3918 1.3463 1.3194 1.2939 1.3362
LVL 0.6973 0.7028 0.7028 0.6977 0.7028 0.7028
LTL 3.4528 3.4528 3.4528 3.4528 3.4528 3.4528
Caverion, Carve-out financial statements, IFRS
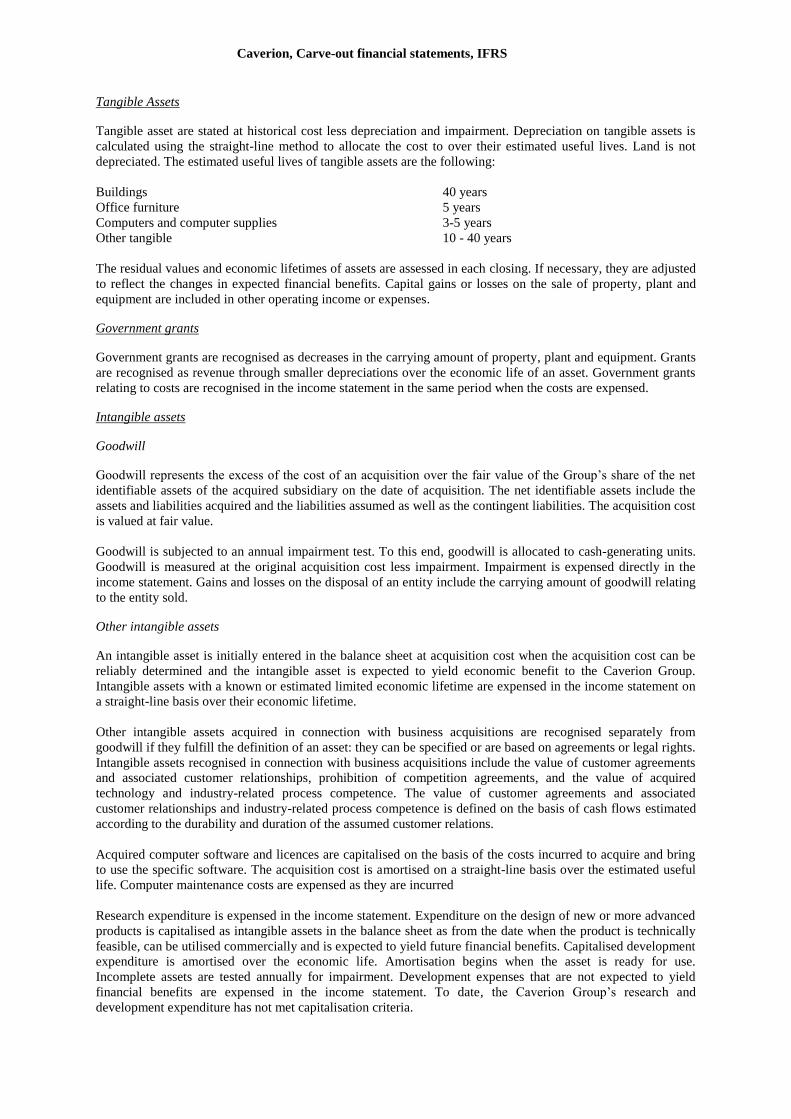
Tangible Assets
Tangible asset are stated at historical cost less depreciation and impairment. Depreciation on tangible assets is
calculated using the straight-line method to allocate the cost to over their estimated useful lives. Land is not
depreciated. The estimated useful lives of tangible assets are the following:
Buildings 40 years
Office furniture 5 years
Computers and computer supplies 3-5 years
Other tangible 10 - 40 years
The residual values and economic lifetimes of assets are assessed in each closing. If necessary, they are adjusted
to reflect the changes in expected financial benefits. Capital gains or losses on the sale of property, plant and
equipment are included in other operating income or expenses.
Government grants
Government grants are recognised as decreases in the carrying amount of property, plant and equipment. Grants
are recognised as revenue through smaller depreciations over the economic life of an asset. Government grants
relating to costs are recognised in the income statement in the same period when the costs are expensed.
Intangible assets
Goodwill
Goodwill represents the excess of the cost of an acquisition over the fair value of the Group’s share of the net
identifiable assets of the acquired subsidiary on the date of acquisition. The net identifiable assets include the
assets and liabilities acquired and the liabilities assumed as well as the contingent liabilities. The acquisition cost
is valued at fair value.
Goodwill is subjected to an annual impairment test. To this end, goodwill is allocated to cash-generating units.
Goodwill is measured at the original acquisition cost less impairment. Impairment is expensed directly in the
income statement. Gains and losses on the disposal of an entity include the carrying amount of goodwill relating
to the entity sold.
Other intangible assets
An intangible asset is initially entered in the balance sheet at acquisition cost when the acquisition cost can be
reliably determined and the intangible asset is expected to yield economic benefit to the Caverion Group.
Intangible assets with a known or estimated limited economic lifetime are expensed in the income statement on
a straight-line basis over their economic lifetime.
Other intangible assets acquired in connection with business acquisitions are recognised separately from
goodwill if they fulfill the definition of an asset: they can be specified or are based on agreements or legal rights.
Intangible assets recognised in connection with business acquisitions include the value of customer agreements
and associated customer relationships, prohibition of competition agreements, and the value of acquired
technology and industry-related process competence. The value of customer agreements and associated
customer relationships and industry-related process competence is defined on the basis of cash flows estimated
according to the durability and duration of the assumed customer relations.
Acquired computer software and licences are capitalised on the basis of the costs incurred to acquire and bring
to use the specific software. The acquisition cost is amortised on a straight-line basis over the estimated useful
life. Computer maintenance costs are expensed as they are incurred
Research expenditure is expensed in the income statement. Expenditure on the design of new or more advanced
products is capitalised as intangible assets in the balance sheet as from the date when the product is technically
feasible, can be utilised commercially and is expected to yield future financial benefits. Capitalised development
expenditure is amortised over the economic life. Amortisation begins when the asset is ready for use.
Incomplete assets are tested annually for impairment. Development expenses that are not expected to yield
financial benefits are expensed in the income statement. To date, the Caverion Group’s research and
development expenditure has not met capitalisation criteria.
Caverion, Carve-out financial statements, IFRS
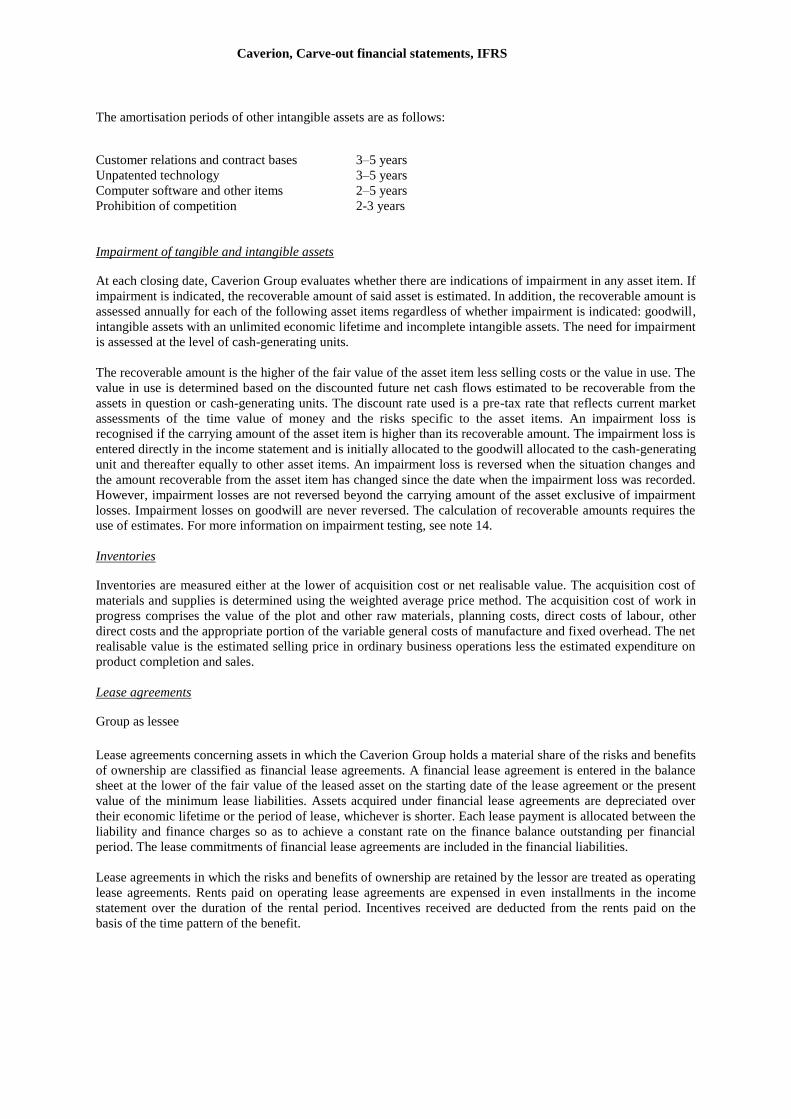
The amortisation periods of other intangible assets are as follows:
Customer relations and contract bases 3–5 years
Unpatented technology 3–5 years
Computer software and other items 2–5 years
Prohibition of competition 2-3 years
Impairment of tangible and intangible assets
At each closing date, Caverion Group evaluates whether there are indications of impairment in any asset item. If
impairment is indicated, the recoverable amount of said asset is estimated. In addition, the recoverable amount is
assessed annually for each of the following asset items regardless of whether impairment is indicated: goodwill,
intangible assets with an unlimited economic lifetime and incomplete intangible assets. The need for impairment
is assessed at the level of cash-generating units.
The recoverable amount is the higher of the fair value of the asset item less selling costs or the value in use. The
value in use is determined based on the discounted future net cash flows estimated to be recoverable from the
assets in question or cash-generating units. The discount rate used is a pre-tax rate that reflects current market
assessments of the time value of money and the risks specific to the asset items. An impairment loss is
recognised if the carrying amount of the asset item is higher than its recoverable amount. The impairment loss is
entered directly in the income statement and is initially allocated to the goodwill allocated to the cash-generating
unit and thereafter equally to other asset items. An impairment loss is reversed when the situation changes and
the amount recoverable from the asset item has changed since the date when the impairment loss was recorded.
However, impairment losses are not reversed beyond the carrying amount of the asset exclusive of impairment
losses. Impairment losses on goodwill are never reversed. The calculation of recoverable amounts requires the
use of estimates. For more information on impairment testing, see note 14.
Inventories
Inventories are measured either at the lower of acquisition cost or net realisable value. The acquisition cost of
materials and supplies is determined using the weighted average price method. The acquisition cost of work in
progress comprises the value of the plot and other raw materials, planning costs, direct costs of labour, other
direct costs and the appropriate portion of the variable general costs of manufacture and fixed overhead. The net
realisable value is the estimated selling price in ordinary business operations less the estimated expenditure on
product completion and sales.
Lease agreements
Group as lessee
Lease agreements concerning assets in which the Caverion Group holds a material share of the risks and benefits
of ownership are classified as financial lease agreements. A financial lease agreement is entered in the balance
sheet at the lower of the fair value of the leased asset on the starting date of the lease agreement or the present
value of the minimum lease liabilities. Assets acquired under financial lease agreements are depreciated over
their economic lifetime or the period of lease, whichever is shorter. Each lease payment is allocated between the
liability and finance charges so as to achieve a constant rate on the finance balance outstanding per financial
period. The lease commitments of financial lease agreements are included in the financial liabilities.
Lease agreements in which the risks and benefits of ownership are retained by the lessor are treated as operating
lease agreements. Rents paid on operating lease agreements are expensed in even installments in the income
statement over the duration of the rental period. Incentives received are deducted from the rents paid on the
basis of the time pattern of the benefit.
Caverion, Carve-out financial statements, IFRS
Non-current assets held for sale
Non-current assets or assets related to discontinued operations are classified as assets held for sale when their
carrying amount is to be recovered principally through a sale or disposal transfer transaction. An asset is to be
classified as held for sale when the sale or disposal is highly probable, the asset is available for sale in its present
condition and on customary terms, the management is committed to sell the asset and the sale is expected to be
completed within one year from the date of classification. Assets held for sale are valued at the lower of their
carrying amount or fair value less costs to sell.
Employee benefits
Pension liabilities
The Caverion Group has different defined contribution and defined benefit pension plans in its various operating
areas. The local regulations and practices of the countries in question are applied in these plans. Contributions to
defined contribution pension plans are entered in the income statement in the financial period during which the
charge applies.
The Caverion Group has defined benefit pension plans in Norway, Austria and Germany. Obligations connected
with the Group's defined benefit plans are calculated by independent actuaries. The discount rate used in
calculating the present value of the pension liability is the market rate of high-quality corporate bonds. In 2011
the market rate of corporate bonds in Norway could not be calculated reliable and the interest rate of treasury
notes was used instead. The maturity of the reference rate substantially corresponds to the maturity of the
calculated pension liability. In defined benefit plans, the pension liability presented is the current value of future
pension payments at the closing date less the fair value of the plan assets at the closing date together with
adjustments for actuarial gains or losses and past service costs. Pension expenditure is expensed in the income
statement. periodising the costs over the time in employment of the employees. Actuarial gains and losses in
excess of a certain range of variation are entered through profit and loss for the average remaining time in
employment of the employees. Occupational pensions in Sweden have been insured under a pension scheme
shared with numerous employers. It has not been possible to acquire sufficient information about these pension
liabilities to divide liabilities and assets by employer. Occupational pensions in Sweden have been treated on a
defined contribution basis. Supplementary pension insurance liabilities in Finland are recorded on a defined
benefit basis.
Share-based payments
YIT has a share-based incentive plan for its key personnel. Possible rewards will be paid as a combination of
YIT corporation shares and cash settlement based on achieved financial target levels. The cost effect of equity-
settled share is recognised as personnel expenses and equity reserve. The cost is based on the market price of the
YIT Corporation share at the grant date and it will be expensed over the vesting period. The cash-settled reward
is based on the market value of YIT’s share at the balance sheet date and it is expensed to personnel expenses
and current liabilities until the settlement date.
On April 25, 2013 the Board of Directors of the YIT Corporation has made a decision about removing the
restriction of transfer and obligation to return the shares from the YIT shares that are owned or received on the
basis of the share-based incentive plan by employees transferring to Caverion Group. Respectively, in the
demerger, a restriction of transfer and obligation to return the shares to Caverion Corporation in accordance with
the original terms will be added to the shares of Caverion Corporation to be given to the employees. In the
carve-out financial statements of Caverion Group, expenses relating to the share-based incentive plan have been
presented as historically realised at the YIT Group.
Termination benefits
Termination benefits are payable when employment is terminated by the Caverion Group before normal
retirement. The Caverion Group recognises termination benefits when it is committed to terminating the
employment of current employees according to a detailed formal plan without possibility of withdrawal. In
addition, benefits that the Caverion Group has offered in connection with terminations to encourage voluntary
redundancy are expensed. Benefits falling due more than 12 months after the balance sheet date are discounted
to present value. Other possible liabilities arising from the termination of employees in different legislations are
assessed at the closing date and recognised as an expense and liability.
Caverion, Carve-out financial statements, IFRS
Provisions
Provisions are recorded when the Group has a legal or constructive obligation on the basis of a prior event, the
materialisation of the payment obligation is probable and the size of the obligation can be reliably estimated.
Provisions are valued at the present value of the costs required to cover the obligation. If compensation for a
share of the obligation can be received from a third party, the compensation is recorded as a separate asset item,
but only when it is practically certain that said compensation will be received. Provisions are booked for
onerous contracts when the obligatory expenditure required to meet obligations exceeds the benefits yielded by
the contract. The amount of the guarantee reserve is set on the basis of experience of the materialisation of these
commitments. Provisions for restructuring are recognised when the Caverion Group has made a detailed
restructuring plan and initiated the implementation of the plan or has communicated about it. Provisions are not
recognised for the continuing operations of the Caverion Group. A contingent liability is an obligation that has
possibly arisen as a result of past events and whose existence is confirmed only when the uncertain event that is
beyond the Caverion Group's control is realised. In addition, an existing obligation that probably does not
require the fulfilment of debt or whose amount cannot be reliably assessed is considered a contingent liability.
Contingent liabilities are presented in the notes.
Income taxes
Tax expenses in the income statement comprise taxes on the taxable income for the financial period and the
change in deferred taxes. Taxes are entered in the income statement except when they are associated with items
recognised under shareholders' equity. Taxes on the taxable income for the financial period are calculated on the
taxable income on the basis of the tax rate stipulated for each country by the balance sheet date. Taxes are
adjusted for the taxes of previous financial periods, if applicable. The management evaluates positions taken in
tax returns with respect to situations in which applicable tax regulation is subject to interpretation. The tax
provisions entered in such situations are based on evaluations by the management.
Deferred taxes are calculated on all temporary differences between the carrying amount and taxable value. No
deferred taxes are calculated on goodwill impairment that is not deductible in taxation and no deferred taxes are
recognised on the undistributed profits of subsidiaries to the extent that the difference is unlikely to be
discharged in the foreseeable future. Deferred taxes have been calculated using the statutory tax rates or the tax
rates whose confirmed content has been announced by the closing date. Deferred tax assets have been
recognised to the extent that it is probable that taxable income against which the temporary difference can be
applied will materialise in the future. The most significant temporary differences arise from differences of the
partial debiting and taxable income of long-term projects, depreciation differences of property, plant and
equipment, defined benefit pension plans, provisions deductible at a later date, measurement at fair value in
connection with business combinations and unused tax losses.
Deferred tax assets and liabilities are offset when there is a legally enforceable right to offset current tax assets
against current tax liabilities and when the deferred income tax assets and liabilities relate to income taxes levied
by the same taxation authority on either the same taxable entity or different taxable entities where there is an
intention to settle the balances on a net basis.
Financial assets and liabilities
Classification and entry of financial assets
The Group recognises financial assets at the settlement day. Financial assets are derecognised from the balance
sheet when the right to cash flows from an item included in financial assets ends or when control over said cash
flows has been assigned outside the Caverion Group with the related risks and revenue.
The fair values of the financial assets are market rates if one has been reliably available, or otherwise discounted
values. The discount rate used is the rate at which the Caverion Group could possibly sell a corresponding batch
on the closing date.
The financial assets are classified at initial recognition into the following categories on the basis of the purpose
for which they have been acquired:
Caverion, Carve-out financial statements, IFRS
Financial assets originally measured at fair value through profit and loss
Financial assets measured at fair value through profit and loss are financial assets or derivatives held for trading
that do not meet the criteria for hedge accounting. Currency swaps that do not meet the criteria of hedge
accounting are classified in this category. Derivatives are originally measured at fair value when the Caverion
Group becomes a contractual party to an agreement and are subsequently measured at fair value. Currency
forward contracts are used for hedging against the currency exposure of exchange rates and resulting changes in
fair value are entered in financial income and expenses in the financial period in which they were incurred.
Derivatives are non-current assets (Receivables) when their maturity is more than 12 months and current assets
(Trade and other receivables) when the remaining maturity is less than 12 months. Derivatives may also be
liabilities; their accounting principles are specified below under "Financial liabilities."
Loans and receivables
Loans and receivables consist of loan receivables, trade receivables and certain other receivables.
Loan receivables are current if the maturity date is within 12 months after the closing date, otherwise they are
non-current. They are initially measured at fair value and subsequently valued at the amortised cost using the
effective interest rate method less any impairment. The changes are recognised in the income statement under
financial income or expenses.
Trade and other receivables are classified as current if the maturity date is within 12 months after the closing
date, otherwise they are classified as non-current. They are initially measured at fair value and subsequently at
amortised cost using the effective interest rate method less any impairment. The changes are recognised in the
income statement under other operating income or expenses.
Available-for-sale financial assets
Available-for-sale financial assets not falling into the categories presented above. They are non-current financial
assets that the Group will not actively dispose of in the short-term. Available-for-sale financial assets primarily
comprise of investments relating to pension schemes. They are not primarily quoted in well-functioning markets
and they are measured at acquisition cost less any impairment. Quoted shares are measured at fair value. When
fair value can be evaluated reliably, the changes in fair value are recognised in the other comprehensive income
and are presented in the fair value reserves in shareholders' equity, taking the tax impact into consideration.
Changes in fair value are transferred from the fair value reserve to financing income or expenses when the
Group disposes of an available-for-sale financial asset or its value has declined such that an impairment loss
must be recognised on it. Impairment of an equity investment classified as an available-for-sale financial asset is
not derecognised through profit and loss.
Cash and cash equivalents
Cash and cash equivalents include cash, bank deposits withdraw able on demand and liquid short-term
investments whose original maturity is no more than three months. They are recognised in the balance sheet at
the original acquisition cost and the yield under financing income. The available overdraft facilities are included
in current liabilities in the balance sheet and netted as the Caverion Group has a contractual offsetting right to
execute the net amount to the creditor.
Impairment of financial assets
Assessment as to whether there is objective evidence of an impairment of an item included in the financial
assets occurs on the closing date. An impairment loss is recognised if the carrying amount of the asset item is
higher than its recoverable amount. The fair value of available-for-sale financial assets is considered decreased
when their value has decreased significantly over a longer term. In this case, changes to the fair value are
entered from shareholders' equity to the income statement. Impairment losses to equity investments classified as
available-for-sale financial assets are not derecognised through profit and loss.
The value of loan and trade receivables in other receivables is considered to have decreased when it is apparent
that the Group will not be able to collect the receivable in accordance with the original terms and conditions.
The Group recognises the impairment loss concerning trade receivables immediately when there is objective
evidence that the receivable cannot be collected in full. In addition, delay or default on a payment by the debtor
or known financial difficulties of the debtor are considered additional factors indicative of an impairment of
trade receivables. According to the Group’s principle concerning the valuation of trade receivables. 50% of
Caverion, Carve-out financial statements, IFRS
unsecured and uncertain receivables overdue more than 180 days and 100% of those overdue more than 360
days is recognised as an expense. Due to the application of the percentage of completion method, part of the
items considered write-downs is included in the project cost estimate and taken into consideration as weakened
margin forecast. Write-downs on loss-making projects are included in the provisions for losses.
Financial liabilities
Financial liabilities are recorded in the balance sheet at the settlement day and derecognised from the balance
sheet when the related obligations expire or transfer outside the Group in accordance with the agreements.
The Group has classified its financial liabilities into the following categories:
Financial liabilities at amortised cost using the effective interest rate method
These are originally measured at fair value. Transaction costs arising in connection with taking out the loan have
been included in the original carrying amount. Financial liabilities may be current or non-current. Financial
liabilities are subsequently measured at amortised cost using the effective interest rate method. Other borrowing
costs are expensed in the period during which they emerged. Fees paid on the establishment of loan facilities are
recognised as expenses over the period of the facility to which it relates.
The fair values of the financial liabilities are market rates if one has been reliably available, or otherwise
discounted values or accounting values if this is reasonably close to the fair value. The discount rate used is the
rate at which the Caverion Group could possibly buy a corresponding item on the closing date.
Financial liabilities measured at fair value
Currency forward contracts and interest rate swaps associated with business operations and financing to which
hedge accounting is not applied have been classified into this category. Derivatives are originally measured at
fair value when the Caverion Group becomes party to an agreement and is subsequently measured at fair value.
Currency forward contracts are used for hedging against the currency exposure of exchange rates and resulting
changes in fair value are entered in financial income and expenses in the financial period in which they were
incurred. Derivatives are non-current liabilities when their maturity is more than 12 months (Other liabilities)
and current liabilities when the remaining maturity is less than 12 months (Trade and other payables).
Fair value of derivative instruments and hedge accounting
The fair value of derivative instruments equals the value the Group would receive or pay if the derivative
contract would be terminated. The fair value of exchange rate forward agreements has been assessed by using
the market prices at the closing day. The fair value of interest rate forward agreements are based on the
counterparts’ quoted prices. These quoted prices for interest rate swap agreements are derived from the
discounted future cash flows, and the quoted prices for other agreements are based on general market conditions
and common pricing models.
Derivative instruments used in hedge accounting that meet the hedge accounting criteria under IAS 39 are
entered in the balance sheet at fair value on the day that the Caverion Group becomes counterpart to the
agreement. The Caverion Group has applied hedge accounting for hedging against the reference rate of floating
rate loans (cash flow hedging). The Caverion Group documents the relationship between the target and the
hedging instruments and assesses the effectiveness of the hedging ratio. The effectiveness of hedging is
evaluated in connection with the preparation of each financial statement, at minimum. Changes in the fair value
of the effective part of derivative instruments meeting the criteria for cash flow hedging are recognised in other
comprehensive income and entered in the fair value reserves in shareholders' equity, taking the tax impact into
consideration. Gains and losses recognised in shareholders' equity are transferred to financial income or
expenses within the same financial periods as the items of the hedging target. When a hedging instrument
acquired to hedge cash flow matures or is sold, or when the criteria of hedging accounting are no longer
satisfied, the profit or loss accrued from the hedging instrument remains in equity until the forecasted
transaction is realised. Nevertheless, if the forecasted hedged transaction is no longer expected to be
implemented, the profit or loss accrued in equity is recognised immediately in the income statement.
Caverion, Carve-out financial statements, IFRS
Revenue recognition
Income from product and service sales is recorded as revenue at fair value with the indirect taxes and discounts.
Goods and services sold
Caverion Group offers building services and industrial services and maintenance. Income from sales of products
is recorded when the significant risks, benefits and control associated with the ownership of the goods have
transferred to the buyer. Income from short-term services is recorded when the service has been performed.
Long-term agreements
Long-term service agreements and building service projects are recorded as revenue on the basis of the degree
of completion when the end result of the project can be estimated reliably. The degree of completion of long-
term service agreements is calculated on the basis of the share of the estimated total cost of a contract
represented by the costs realised at the time of assessment. Costs in excess of the degree of completion are
capitalised in work in progress included in advances received from long-term projects. Invoicing, which exceeds
the degree of completion is periodised in related accrued income. Advances are deducted from the accrued
income on the basis of completion.
If it is probable that the total expenditure required to complete a contract will exceed the total income from the
project, the expected loss is expensed immediately in all circumstances. Revenue recognition on the basis of the
degree of completion related to long-term service agreements are based on estimates. If the estimates of the end
result of a contract change, the sales and profits recognized are adjusted in the reporting period when the change
first becomes known and can be evaluated. The duration of the building service projects vary by country from
one month to two years.
The Group can also carry out an agreed single project or a long-term service agreement through a construction
consortium. The construction consortium is not a separate legal entity. The participating companies have usually
a joint responsibility. Projects and long-term service agreements performed by the consortium are included in
the reporting of the group company concerned and are entered as profit by the degree of completion according
to the group company’s effort.
Interest and dividends
Interest income is recognised using the effective yield method and dividend income when the right to dividend
has materialised.
Critical accounting estimates and judgements
When financial statements are prepared in accordance with IFRS, the Group management must make estimates
and exercise judgement in the application of the accounting policies. Estimates and assumptions have an effect
on the amounts of income, expenses, assets, liabilities and contingent liabilities in the balance sheet of the
financial statements and the final actual results may differ from the estimates. The following presents the critical
accounting estimates and judgements included in the financial statements:
Estimated impairment of goodwill
Goodwill is tested for any impairment annually in accordance with the accounting policy stated in note 14. The
recoverable amounts of cash-generating units have been determined based on value-in-use calculations. The
cash flows in the value-in-use calculations are based on the management's best estimate of market development
for the subsequent years. The discount rate has been increased with a branch specific risk factor.
The amount of impairments has been assessed in proportion to different time periods and the sensitivity has
been analysed in the changes of the discount rate, profitability and in the increase of the residual value. In 2012,
the goodwill testing caused an impairment amounting EUR 0.9 million regarding the goodwill of Poland.
Otherwise these analyses and estimations have not given an indication for impairment. As at December 31,
2012, 2011 and 2010 the goodwill of Caverion Group amounted to EUR 335.7 million, EUR 336.6 million and
EUR 340.0 million, respectively.
Caverion, Carve-out financial statements, IFRS
Percentage of completion revenue recognition of long-term projects
Due to estimates included in the revenue recognition of long-term service agreement and building service
projects, revenue and profit presented by financial period only rarely correspond to the equal distribution of the
total profit over the duration of the project. When revenue recognition from long-term projects is based on the
percentage of completion method, the final result of the projects is regularly and reliably estimated. Calculation
of the total income of projects includes estimates on the total expenditure required to complete the project as
well as the development of sales prices. If the estimates of the end result of a contract change, the sales and
profits recognised are adjusted in the reporting period when the change first becomes known and can be
evaluated. If it is probable that the total expenditure required to complete a contract will exceed the total income
from the project, the expected loss is expensed immediately. For the years ended 31 December 2012, 2011 and
2010 the revenue from long-term service agreement and building service projects amounted to EUR 2,006.4
million, EUR 2,087.9 million and EUR 1,653.5 million, respectively and they were 72%. 73% and 70% of the
Caverion Group total revenue (Note 5)
Income taxes
The Group is subject to income taxes in several countries. Evaluating the total amount of income taxes at the
Group level requires significant consideration, so the amount of total tax includes uncertainty. As at December
31, 2012, 2011 and 2010 the deferred taxes amounted to EUR 5.5 million, EUR 8.7 million and EUR 6.6
million.
Provisions
The recognition of provisions is associated with estimates concerning probability and quantity. Provisions are
booked for onerous contracts when the obligatory expenditure required to meet obligations exceeds the benefits
yielded by the contract. The amount of the guarantee is set on the basis of experience of the materialisation of
these commitments. As at December 31, 2012, 2011 and 2010 the provisions amounted to EUR 30.2 million,
EUR 35.7 million and EUR 40.8 million.
Pension benefits
The present value of pension obligations depends on various actuarial factors and the discount rate used.
Changes in the assumptions and discount rate have an effect on the carrying amount of pension liabilities. The
discount rate used is the market rate of high-quality corporate bonds or the interest rate of treasury notes for the
currency in which the benefits will be realised. The maturity of the reference rate used corresponds substantially
to the maturity of the calculated pension liability. Other assumptions are based on actuarial statistics and
prevailing market conditions. As at December 31, 2012, 2011 and 2010 the pension liabilities amounted to EUR
26.7 million, EUR 26.2 million and EUR 26.6 million
Trade receivables
The Group books write-offs or provision on receivables when it is evident that no payment can be expected.
Caverion Group adopts its policy of valuing trade receivables and the bookings include estimates and critical
judgements. The estimates are based on experience on realised write-offs in previous years, empirical
knowledge of debt collecting, analysis made by clients and general market situation at the time. As at December
31, 2012, 2011 and 2010 trade receivables amounted to EUR 444.8 million, EUR 445.9 million and EUR 388.7
million.
Carve-out adjustments
Carve-out financial statements include the allocations of income, expense, assets, liabilities and cash flows that
are described in note 2, which are based on management judgment, assumptions and estimates. The areas in the
carve-out adjustments that involve higher degree of judgment, assumptions and estimates in these carve-out
financial statements is related to financial liabilities and interests, group administration costs, taxes and invested
equity.
Caverion, Carve-out financial statements, IFRS
New and amended standards adopted as of January 1, 2012
Impact of the new standards adopted as of January 1, 2012 to the carve-out financial statements:
- IFRS 7 (amendment) Financial instruments: Disclosures on transfers on financial assets. The amendments
promote transparency in the reporting of transfer transactions and improve users’ understanding of the risk
exposures relating to transfers of financial assets and the effect of those risks on an entity’s financial
position, particularly those involving securitization of financial assets. The amendment does not have any
impact on the carve-out financial statements.
Evaluation of the future impact of new standards and interpretations
IASB has published the following new or amended standards and interpretations, which Caverion group has not
applied for or EU commission has not approved yet. Caverion group will adopt them in the financial statements
for the year 2013 or later.
- IFRS 13 Fair value measurement: Standard provides a precise definition of fair value and a single source of
fair value measurement and disclosure requirements for use across IFRSs. The Group will adopt the
standard in its 2013 financial statements. The Group management is assessing the impact of the standard on
the financial statements of the Group.
- IAS 1 (amendment) Presentation of statements of changes in equity: The amendment clarifies that an entity
shall present an analysis of other comprehensive income for each component of equity, either in the
statement of changes in equity or in the notes to the financial statements. The Group will adopt the standard
in its 2013 financial statements.
- IAS19 (revised) Employee benefit: Revised standard includes changes to accounting principles of defined
benefit plans. The Caverion Group will adopt the standard in its 2013 financial statements. The corridor
approach was eliminated and all actuarial gains and losses are to be recognised to OCI. The net asset or
liability as a whole is to be booked to balance sheet. The expected return on fund assets is to be calculated
using the same interest rate when discounting the net present value of pension liability. The adoption the 1
January 2013 will increase the pension obligations in the balance sheet by approximately EUR 25 million,
decrease the other non-current assets by approximately EUR 10 million, decrease the deferred tax liabilities
by approximately EUR 9 million and decrease the equity through OCI by approximately EUR 26 million.
The change in fair value of employee benefit will be booked to OCI, when those previously were amortized
through the income statement expense.
- IFRIC 20 Stripping costs in the production phase of a surface mine: The interpretation does not have an
impact on the group reporting.
- IFRS 7 (amendment) Financial instruments: Disclosures - Offsetting Financial Assets and Financial
Liabilities: The amended disclosures require more extensive disclosures than are currency required on
offset financial asset and liabilities. The disclosures focus on quantitative information about recognized
financial instruments that are offset in the statement of financial position, as well as those recognized
financial instruments that are subject to master netting or similar arrangements irrespective of whether they
are offset in the balance sheet. The Group will adopt the standard in its 2013 financial statements. The
Group management is assessing the impact of the standard on the financial statements of the Group.
- Annual improvements 2011. Small and less important improvements to different standards, address six
issues in the 2009-2011 reporting cycle. It includes changes to five different standards and the impacts vary
by standard. The Group will adopt the standard in its 2013 financial statements.
- IFRS 9: Financial instruments: IFRS 9 is the first standard issued as part of a wider project to replace IAS
39. IFRS 9 retains but simplifies the mixed measurement model and establishes two primary measurement
categories for financial assets: amortised cost and fair value. The basis of classification depends on the
entity's business model and the contractual cash flow characteristics of the financial asset. The guidance in
IAS 39 on impairment of financial assets and hedge accounting continues to apply. IFRS 9 covers new
requirements of classification and measurement, which will most likely to affect the classification and
measurement of financial assets in the Group. The Group will adopt the standard earliest in its 2015
financial statements. The Group management is assessing the impact of the standard on the financial
statements of the Group.
Caverion, Carve-out financial statements, IFRS
- IFRS 10 Consolidated financial statements and IAS 27 (amendment) separate financial statements. The
new standard set out how to apply the principle of control to identify whether an investor. Controls an
investee and may affect the fact whether an entity or special purpose vehicle must be consolidated or not.
The change requires additional considerations by the management and disclosures. The Group will adopt
the standard in its 2014 financial statements. The Group management is assessing the impact of the standard
on the financial statements of the Group.
- IFRS 11 Joint arrangements and IAS 28 Associates and joint ventures (revised): Include guidelines how to
consolidate joint arrangements. The treatment is focusing on the rights and obligations of the arrangement
rather than its legal form. There are two types of joint arrangement: joint operations and joint ventures.
Joint operations arise where a joint operator has rights to the assets and obligations relating to the
arrangement and hence accounts for its interest in assets. Liabilities, revenue and expenses. Joint ventures
arise where the joint operator has rights to the net assets of the arrangement and hence equity accounts for
its interest. Proportional consolidation of joint ventures is no longer allowed. The Group will adopt the
standard in its 2014 financial statements. The Group management is assessing the impact of the standard on
the financial statements of the Group.
- IFRS 12 Disclosures of interests in other entities: includes the disclosure requirements for all forms of
interests in other entities. It increases disclosures requirements of companies with non-controlling interests
or where assessment of control is used in consideration or which have been established for a specific
purpose. The Group will adopt the standard in its 2014 financial statements. The Group management is
assessing the impact of the standard on the financial statements of the Group.
.
- IAS 32 (amendment) Offsetting Financial Assets and Financial Liabilities: The amendments address
inconsistencies in current practice when applying the offsetting criteria in IAS 32. The amendments clarify
that the right of set-off must be available today – that is. it is not contingent on a future event. It also must
be legally enforceable for all counterparties in the normal course of business, as well as in the event of
default, insolvency or bankruptcy. The amendments also clarify that certain gross settlement mechanisms
are effectively equivalent to net settlement and would therefore satisfy the IAS 32 criterion in these
instances. The Group will adopt the amendments in its 2014 financial statements.
- Amendment to IFRSs 10, 11 and 12 on transition guidance. These amendments provide additional transition
relief to IFRSs 10, 11 and 12, limiting the requirement to provide adjusted comparative information to only
the preceding comparative period. For disclosures related to unconsolidated structured entities, the
amendments will remove the requirement to present comparative information for periods before IFRS 12 is
first applied. The Group will adopt the standard in its 2014 financial statements.
Caverion, Carve-out financial statements, IFRS
2 SEGMENT INFORMATION
Caverion's reportable segments are based on the internal reports regularly reviewed by the Management Board
of YIT. The Management Board is the chief operating decision-maker, which reviews the Group's internal
reporting in order to assess performance and allocate resources to the segments.
Caverion’s business and reportable segments are Building Services Northern Europe and Building Services
Central Europe.
Segments' operating activities are organised as follows:
Building Services Northern Europe
- Servicing, repairs, renovation and modernisation works required in homes and in properties.
- Servicing and maintenance of the HEPAC, electrical and automation systems and individual contracted
maintenance and servicing works.
- Maintenance of industrial plants, industrial processes, installations and repairing services. Industrial
investments in electrical, automation and ventilation systems, piping and tanks.
Building Services Central Europe
- Servicing, repairs, renovation and modernisation works required in homes and in properties.
- Servicing and maintenance of the HEPAC, electrical and automation systems and individual contracted
maintenance and servicing works.
- Maintenance of industrial plants, industrial processes, installations and repairing services. Industrial
investments in electrical, automation and ventilation systems, piping and tanks.
Other items
Other items include Group level unallocated costs.
Accounting principles in segment reporting
Building Services Northern Europe and Building Services Central Europe segments' reporting is based on
accounting principles described in the carve out financial statements, which correspond to the previous
accounting principles used in the YIT Group.
The segments’ operative invested capital and return on operative invested capital (%) are monitored and
reported regularly on the segment level.
Operative invested capital is determined as follows:
+ Tangible and intangible assets
+ Goodwill
+ Investments in associates
+ Inventories
+ Trade receivables and other non-interest-bearing receivables (excl. items related to taxes. interests and
distribution of assets)
= Segment’s assets
- Provisions
- Trade payables
- Advances received
- Other non-interest-bearing liabilities (excl. items related to taxes. interests and distribution of assets)
= Segment’s liabilities
Segment's assets - Segment's liabilities = Operative invested capital
Return on operative invested capital, % = Segment's operating profit
Operative invested capital on average *100
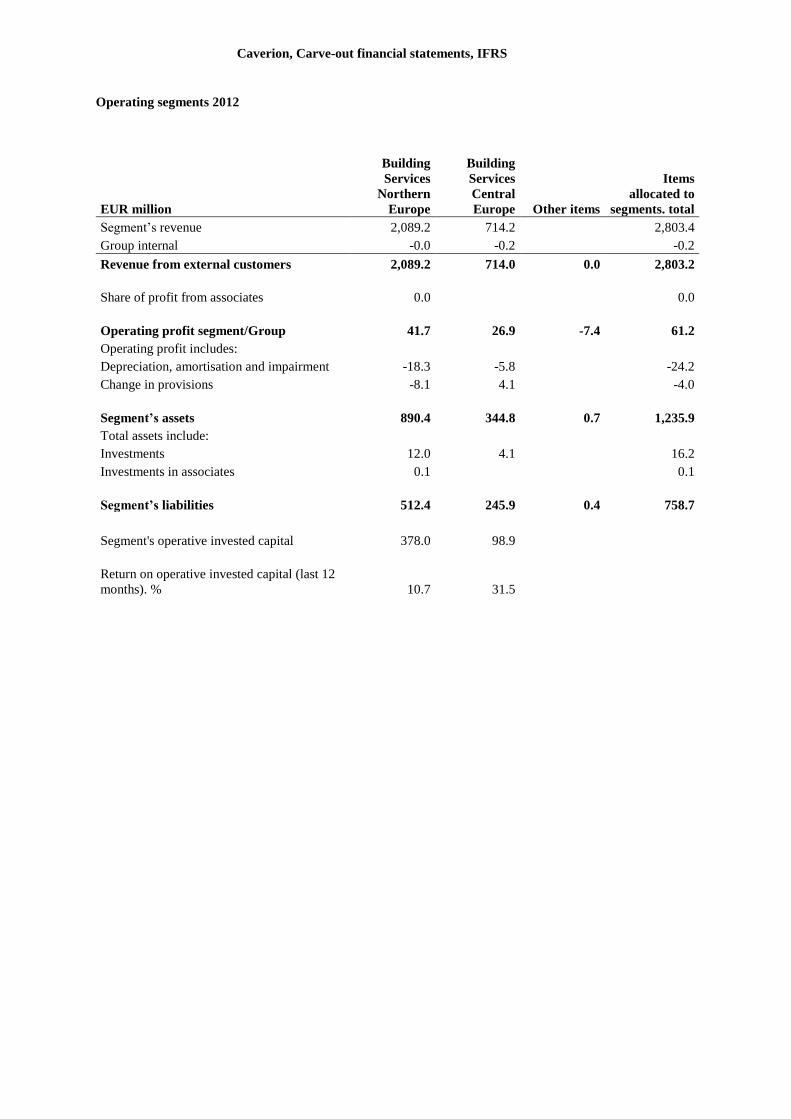
Caverion, Carve-out financial statements, IFRS
Operating segments 2012
EUR million
Building
Services Northern
Europe
Building
Services
Central
Europe Other items
Items
allocated to
segments. total
Segment’s revenue 2,089.2 714.2 2,803.4
Group internal -0.0 -0.2 -0.2
Revenue from external customers 2,089.2 714.0 0.0 2,803.2
Share of profit from associates 0.0 0.0
Operating profit segment/Group 41.7 26.9 -7.4 61.2
Operating profit includes:
Depreciation, amortisation and impairment -18.3 -5.8 -24.2
Change in provisions -8.1 4.1 -4.0
Segment’s assets 890.4 344.8 0.7 1,235.9
Total assets include:
Investments 12.0 4.1 16.2
Investments in associates 0.1 0.1
Segment’s liabilities 512.4 245.9 0.4 758.7
Segment's operative invested capital 378.0 98.9
Return on operative invested capital (last 12
months). % 10.7 31.5
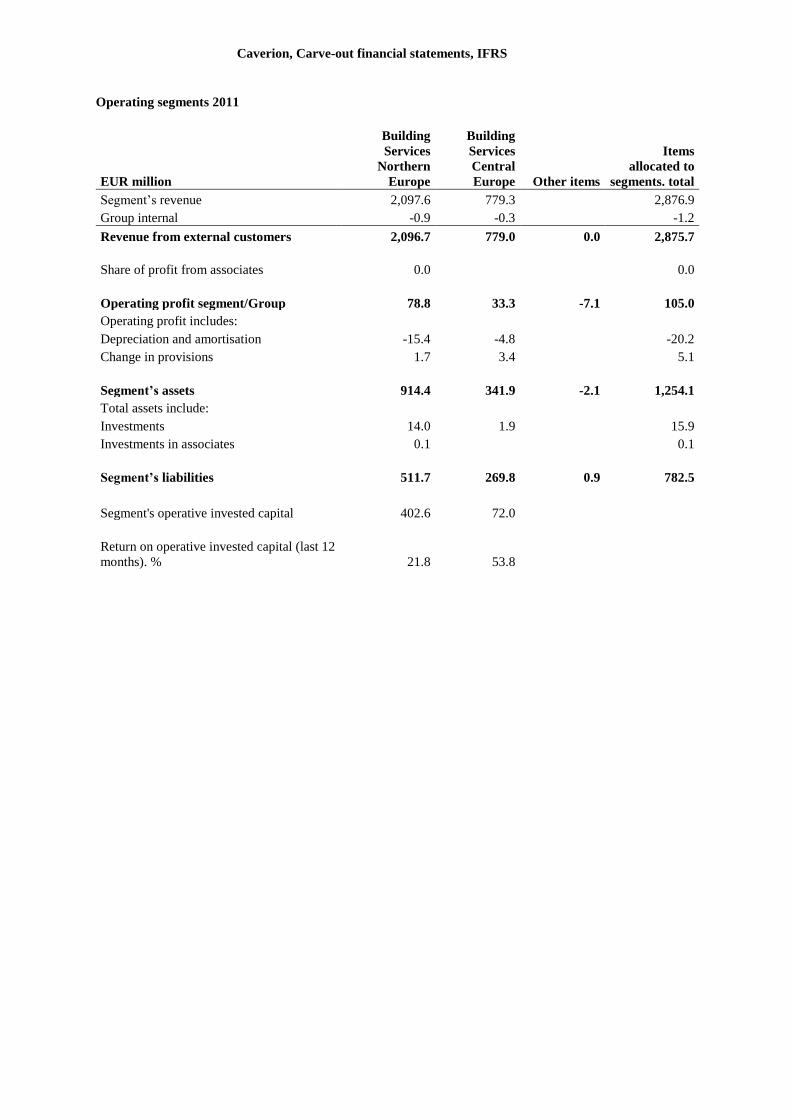
Caverion, Carve-out financial statements, IFRS
Operating segments 2011
EUR million
Building
Services Northern
Europe
Building
Services
Central
Europe Other items
Items
allocated to
segments. total
Segment’s revenue 2,097.6 779.3 2,876.9
Group internal -0.9 -0.3 -1.2
Revenue from external customers 2,096.7 779.0 0.0 2,875.7
Share of profit from associates 0.0 0.0
Operating profit segment/Group 78.8 33.3 -7.1 105.0
Operating profit includes:
Depreciation and amortisation -15.4 -4.8 -20.2
Change in provisions 1.7 3.4 5.1
Segment’s assets 914.4 341.9 -2.1 1,254.1
Total assets include:
Investments 14.0 1.9 15.9
Investments in associates 0.1 0.1
Segment’s liabilities 511.7 269.8 0.9 782.5
Segment's operative invested capital 402.6 72.0
Return on operative invested capital (last 12
months). % 21.8 53.8
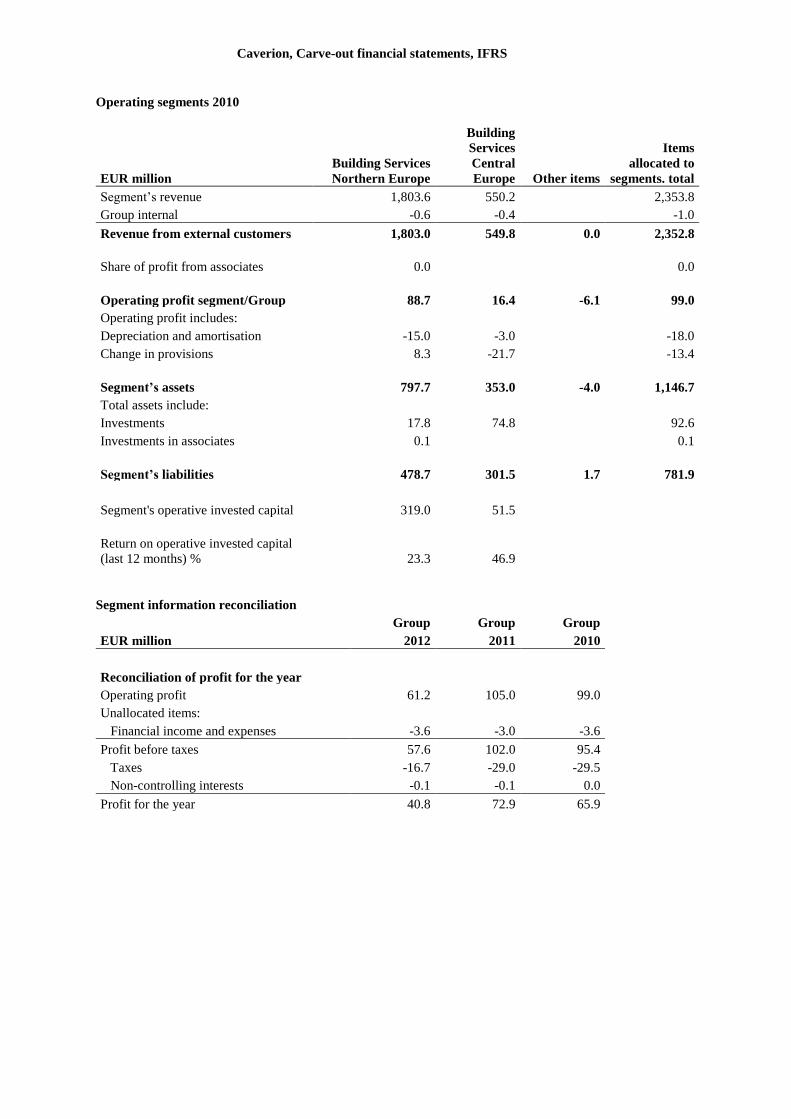
Caverion, Carve-out financial statements, IFRS
Operating segments 2010
EUR million
Building Services Northern Europe
Building
Services
Central
Europe Other items
Items
allocated to
segments. total
Segment’s revenue 1,803.6 550.2 2,353.8
Group internal -0.6 -0.4 -1.0
Revenue from external customers 1,803.0 549.8 0.0 2,352.8
Share of profit from associates 0.0 0.0
Operating profit segment/Group 88.7 16.4 -6.1 99.0
Operating profit includes:
Depreciation and amortisation -15.0 -3.0 -18.0
Change in provisions 8.3 -21.7 -13.4
Segment’s assets 797.7 353.0 -4.0 1,146.7
Total assets include:
Investments 17.8 74.8 92.6
Investments in associates 0.1 0.1
Segment’s liabilities 478.7 301.5 1.7 781.9
Segment's operative invested capital 319.0 51.5
Return on operative invested capital
(last 12 months) % 23.3 46.9
Segment information reconciliation
Group Group Group
EUR million 2012 2011 2010
Reconciliation of profit for the year
Operating profit 61.2 105.0 99.0
Unallocated items:
Financial income and expenses -3.6 -3.0 -3.6
Profit before taxes 57.6 102.0 95.4
Taxes -16.7 -29.0 -29.5
Non-controlling interests -0.1 -0.1 0.0
Profit for the year 40.8 72.9 65.9
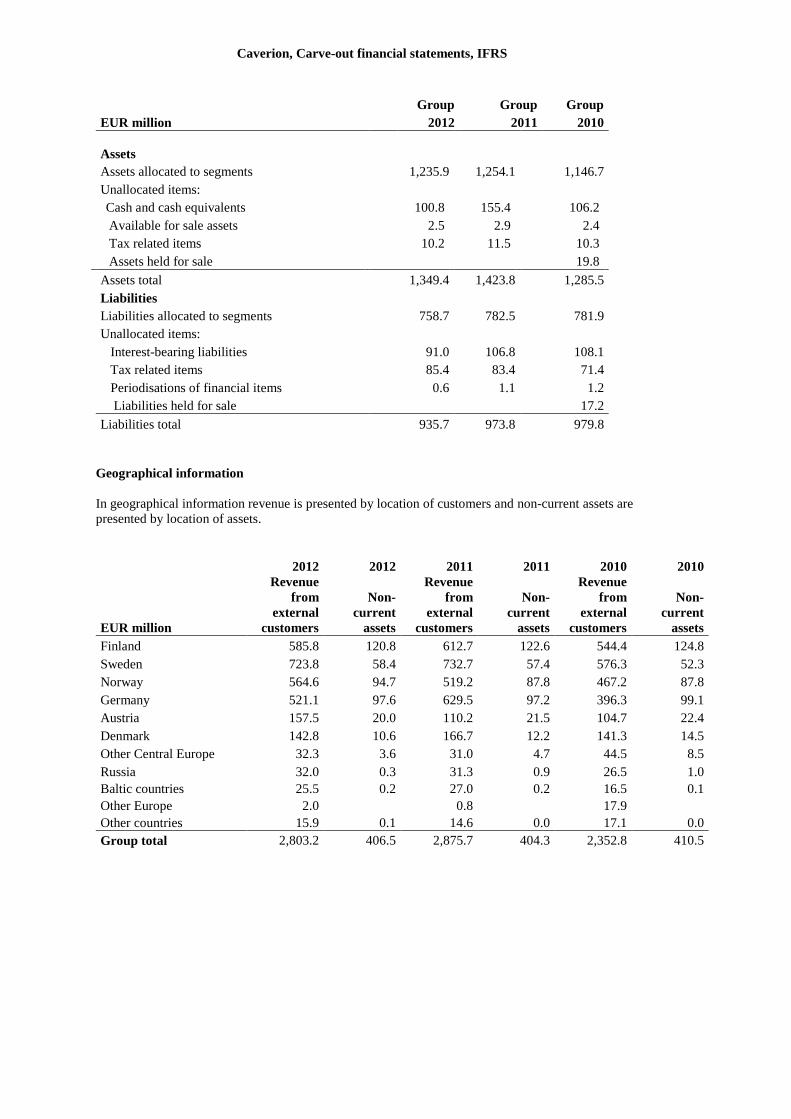
Caverion, Carve-out financial statements, IFRS
Group Group Group
EUR million 2012 2011 2010
Assets
Assets allocated to segments 1,235.9 1,254.1 1,146.7
Unallocated items:
Cash and cash equivalents 100.8 155.4 106.2
Available for sale assets 2.5 2.9 2.4
Tax related items 10.2 11.5 10.3
Assets held for sale 19.8
Assets total 1,349.4 1,423.8 1,285.5
Liabilities
Liabilities allocated to segments 758.7 782.5 781.9
Unallocated items:
Interest-bearing liabilities 91.0 106.8 108.1
Tax related items 85.4 83.4 71.4
Periodisations of financial items 0.6 1.1 1.2
Liabilities held for sale 17.2
Liabilities total 935.7 973.8 979.8
Geographical information
In geographical information revenue is presented by location of customers and non-current assets are
presented by location of assets.
2012 2012 2011 2011 2010 2010
EUR million
Revenue
from
external
customers
Non-
current
assets
Revenue
from external
customers
Non-
current
assets
Revenue
from external
customers
Non-
current
assets
Finland 585.8 120.8 612.7 122.6 544.4 124.8
Sweden 723.8 58.4 732.7 57.4 576.3 52.3
Norway 564.6 94.7 519.2 87.8 467.2 87.8
Germany 521.1 97.6 629.5 97.2 396.3 99.1
Austria 157.5 20.0 110.2 21.5 104.7 22.4
Denmark 142.8 10.6 166.7 12.2 141.3 14.5
Other Central Europe 32.3 3.6 31.0 4.7 44.5 8.5
Russia 32.0 0.3 31.3 0.9 26.5 1.0
Baltic countries 25.5 0.2 27.0 0.2 16.5 0.1
Other Europe 2.0 0.8 17.9
Other countries 15.9 0.1 14.6 0.0 17.1 0.0
Group total 2,803.2 406.5 2,875.7 404.3 2,352.8 410.5
Caverion, Carve-out financial statements, IFRS
3 ACQUISITIONS
Acquisitions in 2012
In Sweden, Building Services Northern European segment acquired the share capital of Elektriska Installationer
i Finspång AB. a company specialising in electricity, telecommunications, data, alarm and low voltage
installations, and its sister company Kraftmontage i Finspång AB. specialising in electrical installations in
February. In Norway, the share capital of electrical installations specialist Madla Elektro AS in March was
acquired. In Sweden, the security business operations of Level5 security was acquired in April and the share
capital of electrical installations company Dala Elmontage Lindkvist & Bodin Ab was acquired in May.
During the first half of the year 2012, two aqcuistions were made in the Building Services Central Europe
segment. In Austria, the Group acquired the share capital of P&P Kältenangebau GmbH. a cooling solutions and
service provider, and the share capital of WM Haustechnik GmbH. an HVAC solution provider.
The total acquisition price amounted to EUR 9.5 million. The acquisitions did not result in goodwill.
Acquisitions in 2011
Building services Northern European segment acquired in Sweden Pharmaplan AB in January. Orab i Sydost
Ab specializing in industrial pipe works in April, and Johnson Control’s Commercial Refridgeraation –
businesses. Frisk Ventilation AB a supplier of ventilation – related services in May. MISAB Sprinkler & VVS
AB and Sakari Timonen business operations in July and Mercur VVS group in September.
Total acquisition price amounted to EUR 9.4 million. With these local acquisitions, the market share was
strengthened and the acquisition price over the net assets acquired was allocated to customer base.
Acquisitions in 2010 –other than caverion GmbH and its subsidiaries
The Northern Europe Building services segment implemented many small business acquisitions. The companies
acquired were Eltjänst Br Björk Installation AB. Ekonomisk Luftbehandling AB. Fristads Rör-El AV. G:sson
Teleteknik AB. Ferm VVS and Jansson & Erikosson Ekonomisk Luftbehandling AB in Sweden. Ugelvik Nesset
AS, Haug og Ruud AS and Energiprosjekt in Norway and Brdr. Petersesn Eftf A/S and Carl Christensen & Co.
A/S in Denmark.
The following table describes the final acquisition values, which also include adjustments made to preliminary
values, which have not had material effect on the financial period result.
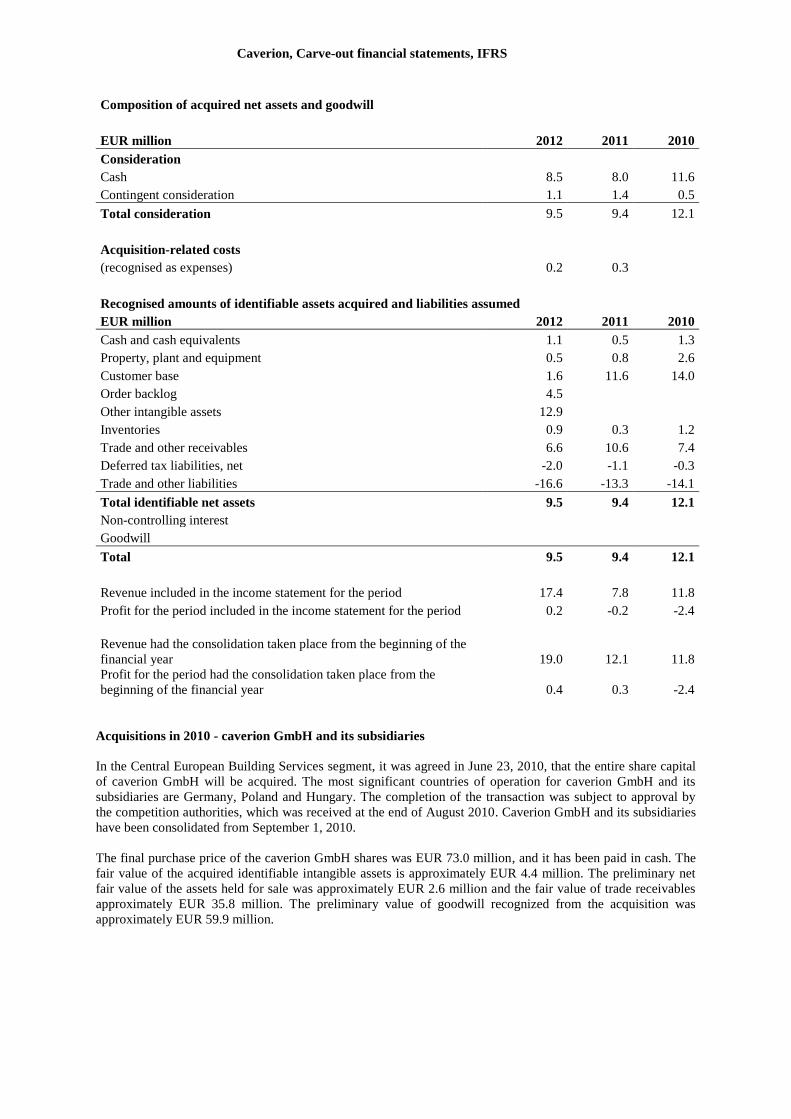
Caverion, Carve-out financial statements, IFRS
Composition of acquired net assets and goodwill
EUR million 2012 2011 2010
Consideration
Cash 8.5 8.0 11.6
Contingent consideration 1.1 1.4 0.5
Total consideration 9.5 9.4 12.1
Acquisition-related costs
(recognised as expenses) 0.2 0.3
Recognised amounts of identifiable assets acquired and liabilities assumed
EUR million 2012 2011 2010
Cash and cash equivalents 1.1 0.5 1.3
Property, plant and equipment 0.5 0.8 2.6
Customer base 1.6 11.6 14.0
Order backlog 4.5
Other intangible assets 12.9
Inventories 0.9 0.3 1.2
Trade and other receivables 6.6 10.6 7.4
Deferred tax liabilities, net -2.0 -1.1 -0.3
Trade and other liabilities -16.6 -13.3 -14.1
Total identifiable net assets 9.5 9.4 12.1
Non-controlling interest
Goodwill
Total 9.5 9.4 12.1
Revenue included in the income statement for the period 17.4 7.8 11.8
Profit for the period included in the income statement for the period 0.2 -0.2 -2.4
Revenue had the consolidation taken place from the beginning of the
financial year 19.0 12.1 11.8
Profit for the period had the consolidation taken place from the
beginning of the financial year 0.4 0.3 -2.4
Acquisitions in 2010 - caverion GmbH and its subsidiaries
In the Central European Building Services segment, it was agreed in June 23, 2010, that the entire share capital
of caverion GmbH will be acquired. The most significant countries of operation for caverion GmbH and its
subsidiaries are Germany, Poland and Hungary. The completion of the transaction was subject to approval by
the competition authorities, which was received at the end of August 2010. Caverion GmbH and its subsidiaries
have been consolidated from September 1, 2010.
The final purchase price of the caverion GmbH shares was EUR 73.0 million, and it has been paid in cash. The
fair value of the acquired identifiable intangible assets is approximately EUR 4.4 million. The preliminary net
fair value of the assets held for sale was approximately EUR 2.6 million and the fair value of trade receivables
approximately EUR 35.8 million. The preliminary value of goodwill recognized from the acquisition was
approximately EUR 59.9 million.
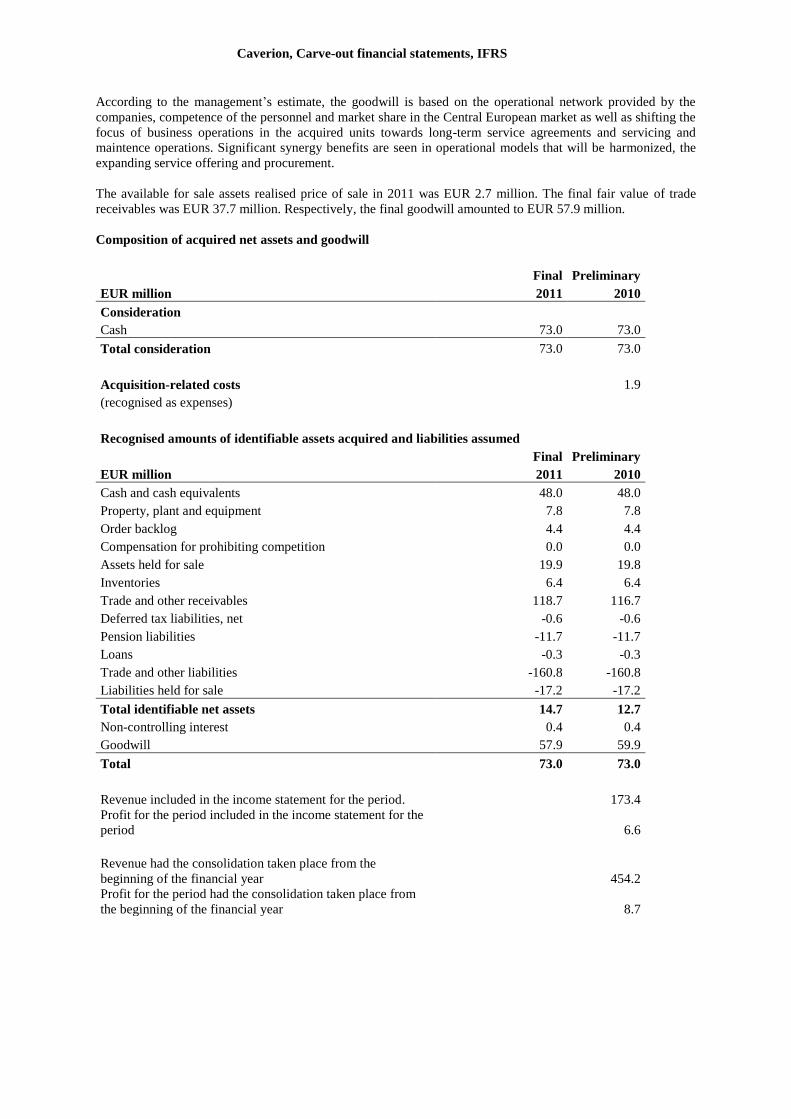
Caverion, Carve-out financial statements, IFRS
According to the management’s estimate, the goodwill is based on the operational network provided by the
companies, competence of the personnel and market share in the Central European market as well as shifting the
focus of business operations in the acquired units towards long-term service agreements and servicing and
maintence operations. Significant synergy benefits are seen in operational models that will be harmonized, the
expanding service offering and procurement.
The available for sale assets realised price of sale in 2011 was EUR 2.7 million. The final fair value of trade
receivables was EUR 37.7 million. Respectively, the final goodwill amounted to EUR 57.9 million.
Composition of acquired net assets and goodwill
Final Preliminary
EUR million 2011 2010
Consideration
Cash 73.0 73.0
Total consideration 73.0 73.0
Acquisition-related costs
1.9
(recognised as expenses)
Recognised amounts of identifiable assets acquired and liabilities assumed
Final Preliminary
EUR million 2011 2010
Cash and cash equivalents 48.0 48.0
Property, plant and equipment 7.8 7.8
Order backlog 4.4 4.4
Compensation for prohibiting competition 0.0 0.0
Assets held for sale 19.9 19.8
Inventories 6.4 6.4
Trade and other receivables 118.7 116.7
Deferred tax liabilities, net -0.6 -0.6
Pension liabilities -11.7 -11.7
Loans -0.3 -0.3
Trade and other liabilities -160.8 -160.8
Liabilities held for sale -17.2 -17.2
Total identifiable net assets 14.7 12.7
Non-controlling interest 0.4 0.4
Goodwill 57.9 59.9
Total 73.0 73.0
Revenue included in the income statement for the period.
173.4
Profit for the period included in the income statement for the
period
6.6
Revenue had the consolidation taken place from the
beginning of the financial year
454.2
Profit for the period had the consolidation taken place from
the beginning of the financial year
8.7
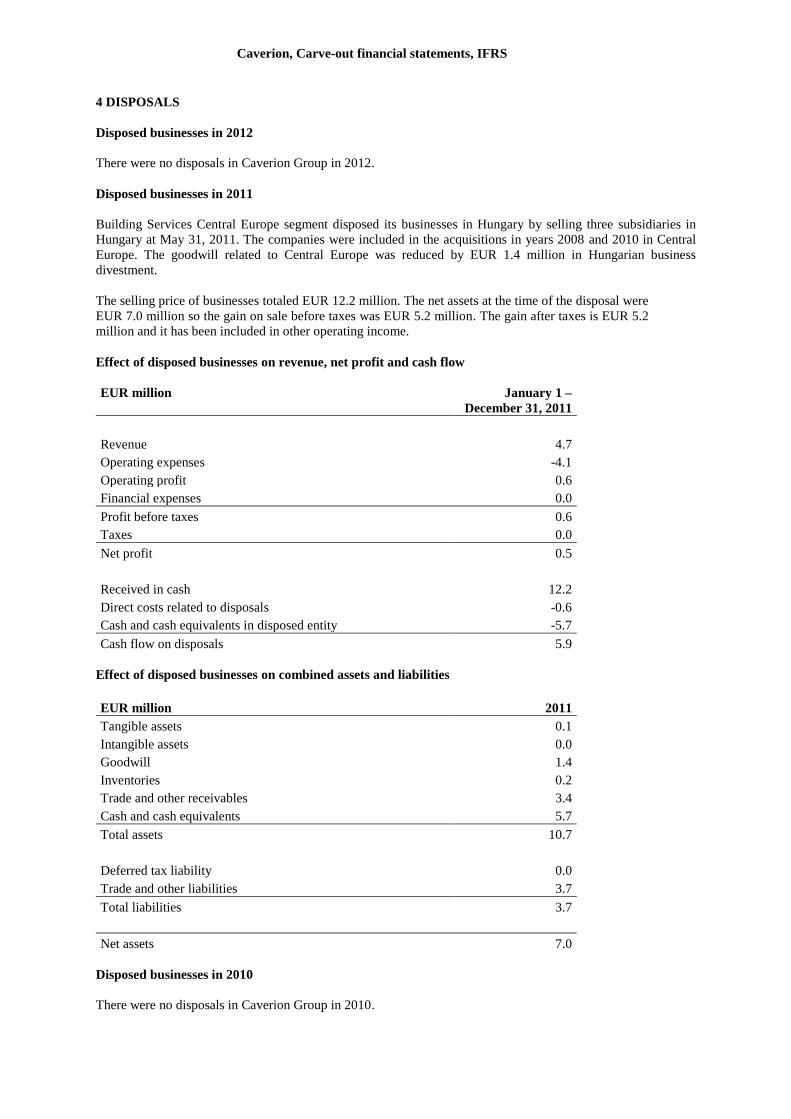
Caverion, Carve-out financial statements, IFRS
4 DISPOSALS
Disposed businesses in 2012
There were no disposals in Caverion Group in 2012.
Disposed businesses in 2011
Building Services Central Europe segment disposed its businesses in Hungary by selling three subsidiaries in
Hungary at May 31, 2011. The companies were included in the acquisitions in years 2008 and 2010 in Central
Europe. The goodwill related to Central Europe was reduced by EUR 1.4 million in Hungarian business
divestment.
The selling price of businesses totaled EUR 12.2 million. The net assets at the time of the disposal were
EUR 7.0 million so the gain on sale before taxes was EUR 5.2 million. The gain after taxes is EUR 5.2
million and it has been included in other operating income.
Effect of disposed businesses on revenue, net profit and cash flow
EUR million January 1 –
December 31, 2011
Revenue 4.7
Operating expenses -4.1
Operating profit 0.6
Financial expenses 0.0
Profit before taxes 0.6
Taxes 0.0
Net profit 0.5
Received in cash 12.2
Direct costs related to disposals -0.6
Cash and cash equivalents in disposed entity -5.7
Cash flow on disposals 5.9
Effect of disposed businesses on combined assets and liabilities
EUR million 2011
Tangible assets 0.1
Intangible assets 0.0
Goodwill 1.4
Inventories 0.2
Trade and other receivables 3.4
Cash and cash equivalents 5.7
Total assets 10.7
Deferred tax liability 0.0
Trade and other liabilities 3.7
Total liabilities 3.7
Net assets 7.0
Disposed businesses in 2010
There were no disposals in Caverion Group in 2010.
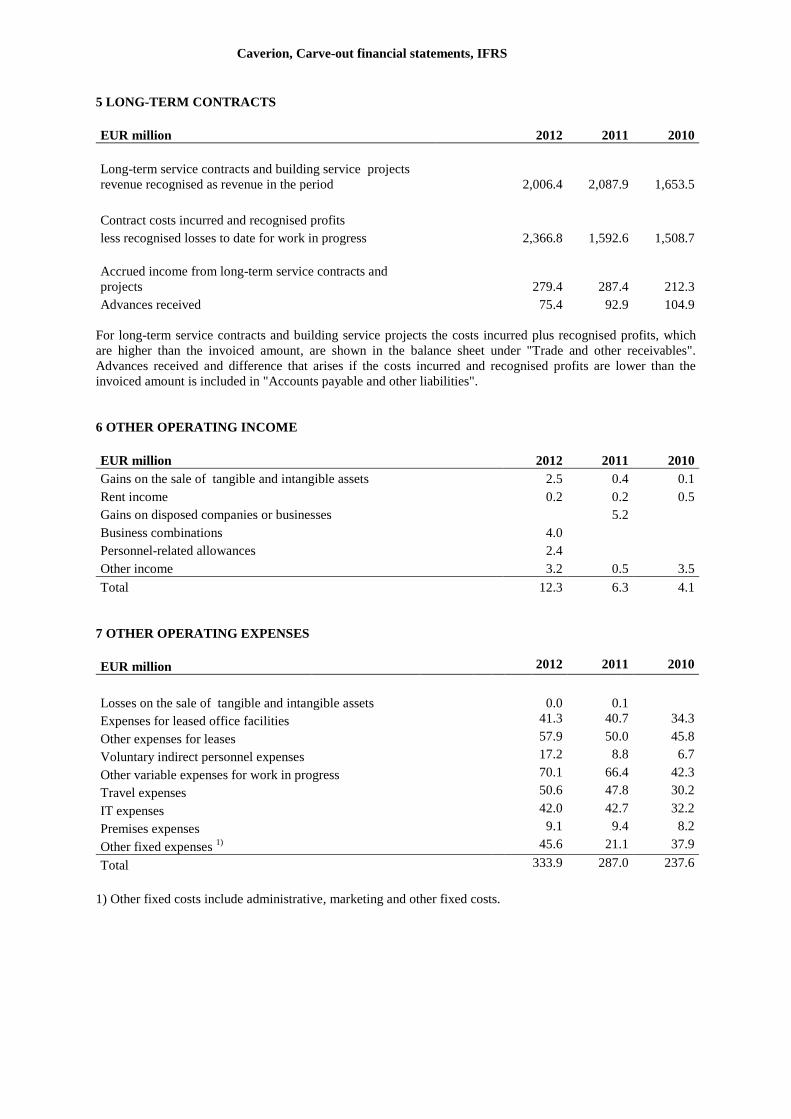
Caverion, Carve-out financial statements, IFRS
5 LONG-TERM CONTRACTS
EUR million 2012 2011 2010
Long-term service contracts and building service projects
revenue recognised as revenue in the period 2,006.4 2,087.9 1,653.5
Contract costs incurred and recognised profits
less recognised losses to date for work in progress 2,366.8 1,592.6 1,508.7
Accrued income from long-term service contracts and
projects 279.4 287.4 212.3
Advances received 75.4 92.9 104.9
For long-term service contracts and building service projects the costs incurred plus recognised profits, which
are higher than the invoiced amount, are shown in the balance sheet under "Trade and other receivables".
Advances received and difference that arises if the costs incurred and recognised profits are lower than the
invoiced amount is included in "Accounts payable and other liabilities".
6 OTHER OPERATING INCOME
EUR million 2012 2011 2010
Gains on the sale of tangible and intangible assets 2.5 0.4 0.1
Rent income 0.2 0.2 0.5
Gains on disposed companies or businesses 5.2
Business combinations 4.0
Personnel-related allowances 2.4
Other income 3.2 0.5 3.5
Total 12.3 6.3 4.1
7 OTHER OPERATING EXPENSES
EUR million 2012 2011 2010
Losses on the sale of tangible and intangible assets 0.0 0.1
Expenses for leased office facilities 41.3 40.7 34.3
Other expenses for leases 57.9 50.0 45.8
Voluntary indirect personnel expenses 17.2 8.8 6.7
Other variable expenses for work in progress 70.1 66.4 42.3
Travel expenses 50.6 47.8 30.2
IT expenses 42.0 42.7 32.2
Premises expenses 9.1 9.4 8.2
Other fixed expenses 1)
45.6 21.1 37.9
Total 333.9 287.0 237.6
1) Other fixed costs include administrative, marketing and other fixed costs.
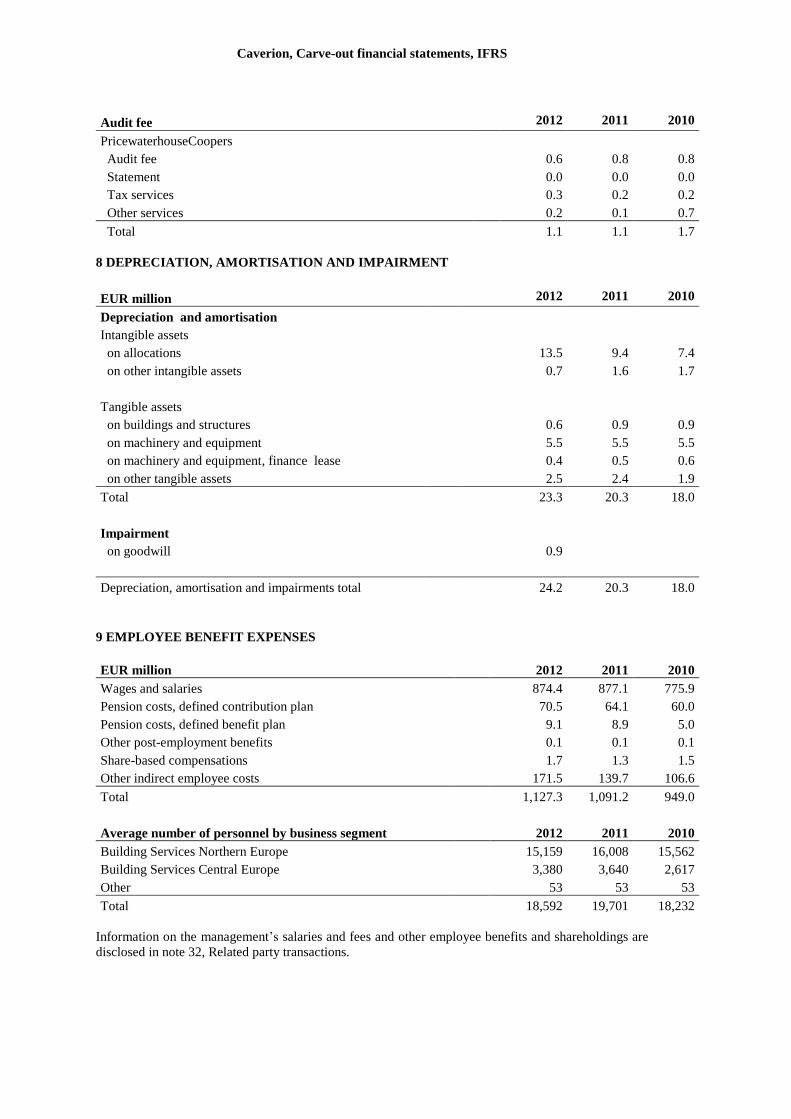
Caverion, Carve-out financial statements, IFRS
Audit fee 2012 2011 2010
PricewaterhouseCoopers
Audit fee 0.6 0.8 0.8
Statement 0.0 0.0 0.0
Tax services 0.3 0.2 0.2
Other services 0.2 0.1 0.7
Total 1.1 1.1 1.7
8 DEPRECIATION, AMORTISATION AND IMPAIRMENT
EUR million 2012 2011 2010
Depreciation and amortisation
Intangible assets
on allocations 13.5 9.4 7.4
on other intangible assets 0.7 1.6 1.7
Tangible assets
on buildings and structures 0.6 0.9 0.9
on machinery and equipment 5.5 5.5 5.5
on machinery and equipment, finance lease 0.4 0.5 0.6
on other tangible assets 2.5 2.4 1.9
Total 23.3 20.3 18.0
Impairment
on goodwill 0.9
Depreciation, amortisation and impairments total 24.2 20.3 18.0
9 EMPLOYEE BENEFIT EXPENSES
EUR million 2012 2011 2010
Wages and salaries 874.4 877.1 775.9
Pension costs, defined contribution plan 70.5 64.1 60.0
Pension costs, defined benefit plan 9.1 8.9 5.0
Other post-employment benefits 0.1 0.1 0.1
Share-based compensations 1.7 1.3 1.5
Other indirect employee costs 171.5 139.7 106.6
Total 1,127.3 1,091.2 949.0
Average number of personnel by business segment 2012 2011 2010
Building Services Northern Europe 15,159 16,008 15,562
Building Services Central Europe 3,380 3,640 2,617
Other 53 53 53
Total 18,592 19,701 18,232
Information on the management’s salaries and fees and other employee benefits and shareholdings are
disclosed in note 32, Related party transactions.
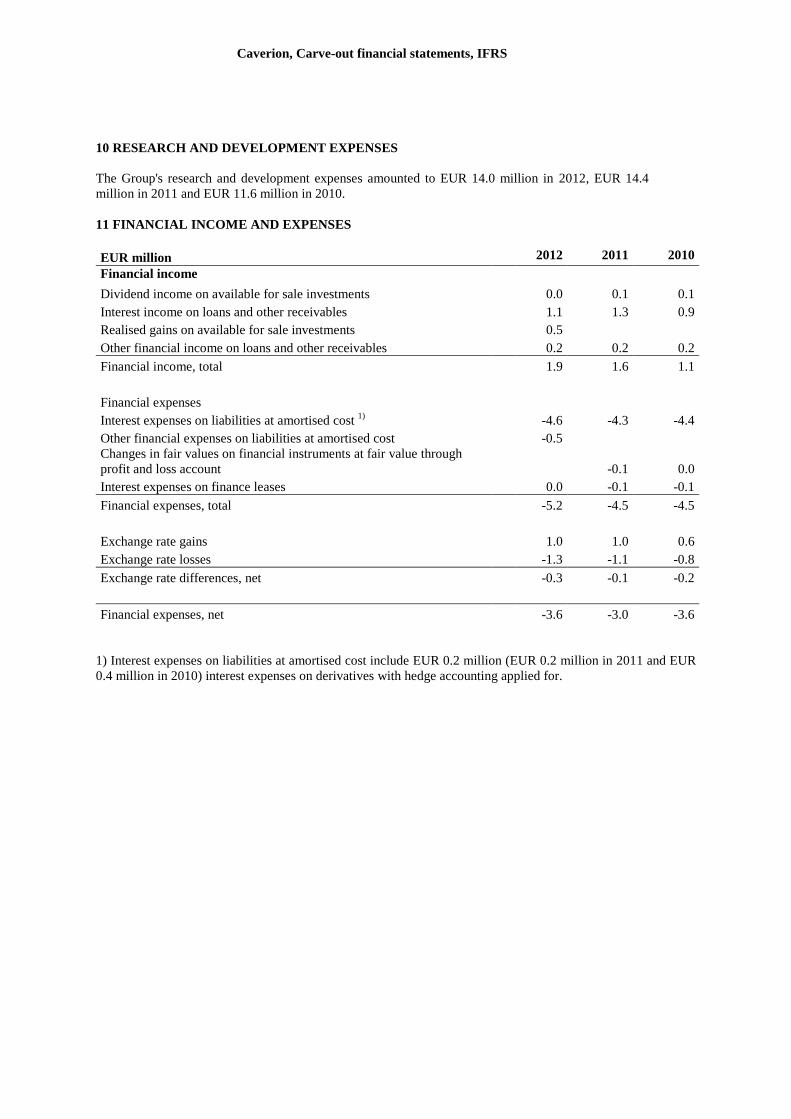
Caverion, Carve-out financial statements, IFRS
10 RESEARCH AND DEVELOPMENT EXPENSES
The Group's research and development expenses amounted to EUR 14.0 million in 2012, EUR 14.4
million in 2011 and EUR 11.6 million in 2010.
11 FINANCIAL INCOME AND EXPENSES
EUR million 2012 2011 2010
Financial income
Dividend income on available for sale investments 0.0 0.1 0.1
Interest income on loans and other receivables 1.1 1.3 0.9
Realised gains on available for sale investments 0.5
Other financial income on loans and other receivables 0.2 0.2 0.2
Financial income, total 1.9 1.6 1.1
Financial expenses
Interest expenses on liabilities at amortised cost 1)
-4.6 -4.3 -4.4
Other financial expenses on liabilities at amortised cost -0.5
Changes in fair values on financial instruments at fair value through
profit and loss account -0.1 0.0
Interest expenses on finance leases 0.0 -0.1 -0.1
Financial expenses, total -5.2 -4.5 -4.5
Exchange rate gains 1.0 1.0 0.6
Exchange rate losses -1.3 -1.1 -0.8
Exchange rate differences, net -0.3 -0.1 -0.2
Financial expenses, net -3.6 -3.0 -3.6
1) Interest expenses on liabilities at amortised cost include EUR 0.2 million (EUR 0.2 million in 2011 and EUR
0.4 million in 2010) interest expenses on derivatives with hedge accounting applied for.
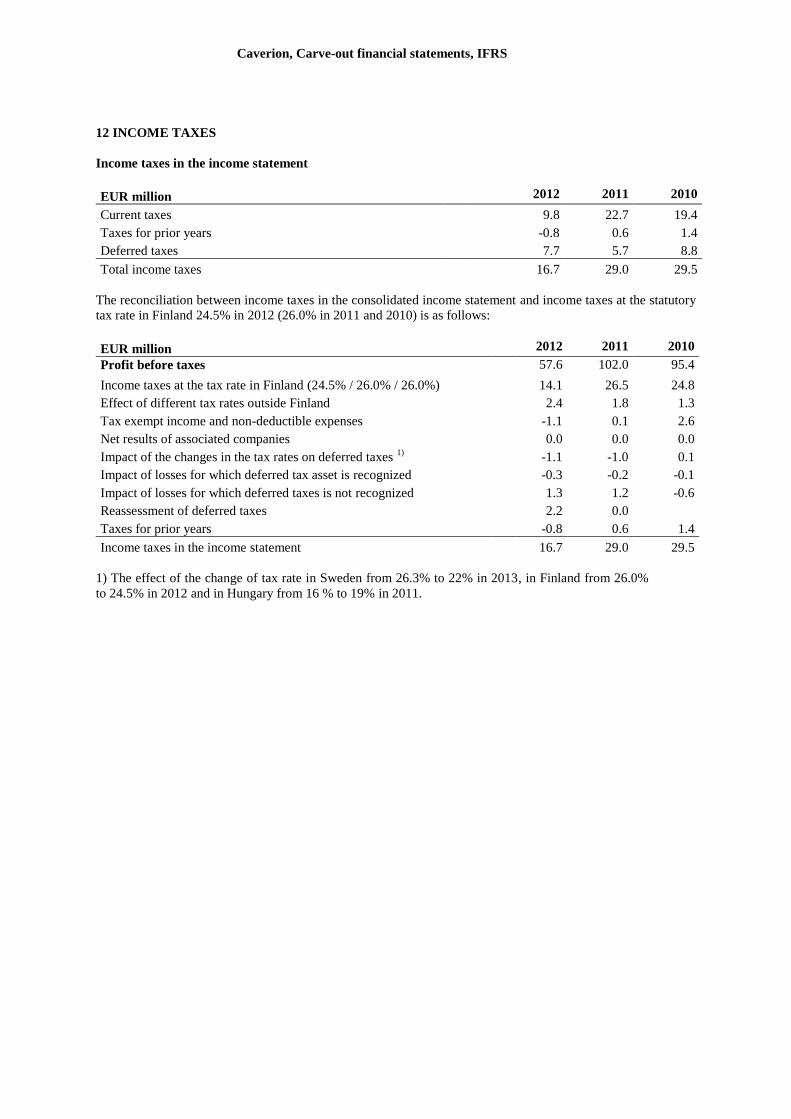
Caverion, Carve-out financial statements, IFRS
12 INCOME TAXES
Income taxes in the income statement
EUR million 2012 2011 2010
Current taxes 9.8 22.7 19.4
Taxes for prior years -0.8 0.6 1.4
Deferred taxes 7.7 5.7 8.8
Total income taxes 16.7 29.0 29.5
The reconciliation between income taxes in the consolidated income statement and income taxes at the statutory
tax rate in Finland 24.5% in 2012 (26.0% in 2011 and 2010) is as follows:
EUR million 2012 2011 2010
Profit before taxes 57.6 102.0 95.4
Income taxes at the tax rate in Finland (24.5% / 26.0% / 26.0%) 14.1 26.5 24.8
Effect of different tax rates outside Finland 2.4 1.8 1.3
Tax exempt income and non-deductible expenses -1.1 0.1 2.6
Net results of associated companies 0.0 0.0 0.0
Impact of the changes in the tax rates on deferred taxes 1)
-1.1 -1.0 0.1
Impact of losses for which deferred tax asset is recognized -0.3 -0.2 -0.1
Impact of losses for which deferred taxes is not recognized 1.3 1.2 -0.6
Reassessment of deferred taxes 2.2 0.0
Taxes for prior years -0.8 0.6 1.4
Income taxes in the income statement 16.7 29.0 29.5
1) The effect of the change of tax rate in Sweden from 26.3% to 22% in 2013, in Finland from 26.0%
to 24.5% in 2012 and in Hungary from 16 % to 19% in 2011.
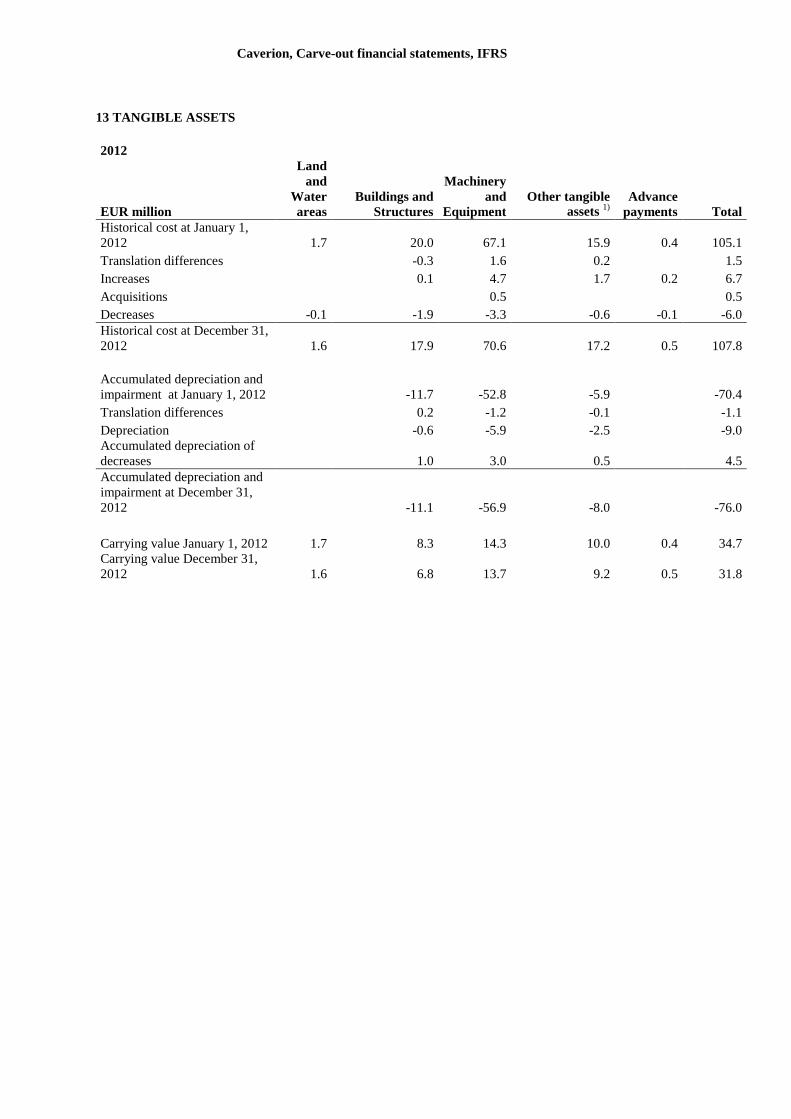
Caverion, Carve-out financial statements, IFRS
13 TANGIBLE ASSETS
2012
EUR million
Land
and
Water
areas
Buildings and
Structures
Machinery
and
Equipment
Other tangible
assets 1)
Advance
payments Total
Historical cost at January 1,
2012 1.7 20.0 67.1 15.9 0.4 105.1
Translation differences -0.3 1.6 0.2 1.5
Increases 0.1 4.7 1.7 0.2 6.7
Acquisitions 0.5 0.5
Decreases -0.1 -1.9 -3.3 -0.6 -0.1 -6.0
Historical cost at December 31,
2012 1.6 17.9 70.6 17.2 0.5 107.8
Accumulated depreciation and
impairment at January 1, 2012 -11.7 -52.8 -5.9 -70.4
Translation differences 0.2 -1.2 -0.1 -1.1
Depreciation -0.6 -5.9 -2.5 -9.0
Accumulated depreciation of
decreases 1.0 3.0 0.5 4.5
Accumulated depreciation and
impairment at December 31,
2012 -11.1 -56.9 -8.0 -76.0
Carrying value January 1, 2012 1.7 8.3 14.3 10.0 0.4 34.7
Carrying value December 31,
2012 1.6 6.8 13.7 9.2 0.5 31.8
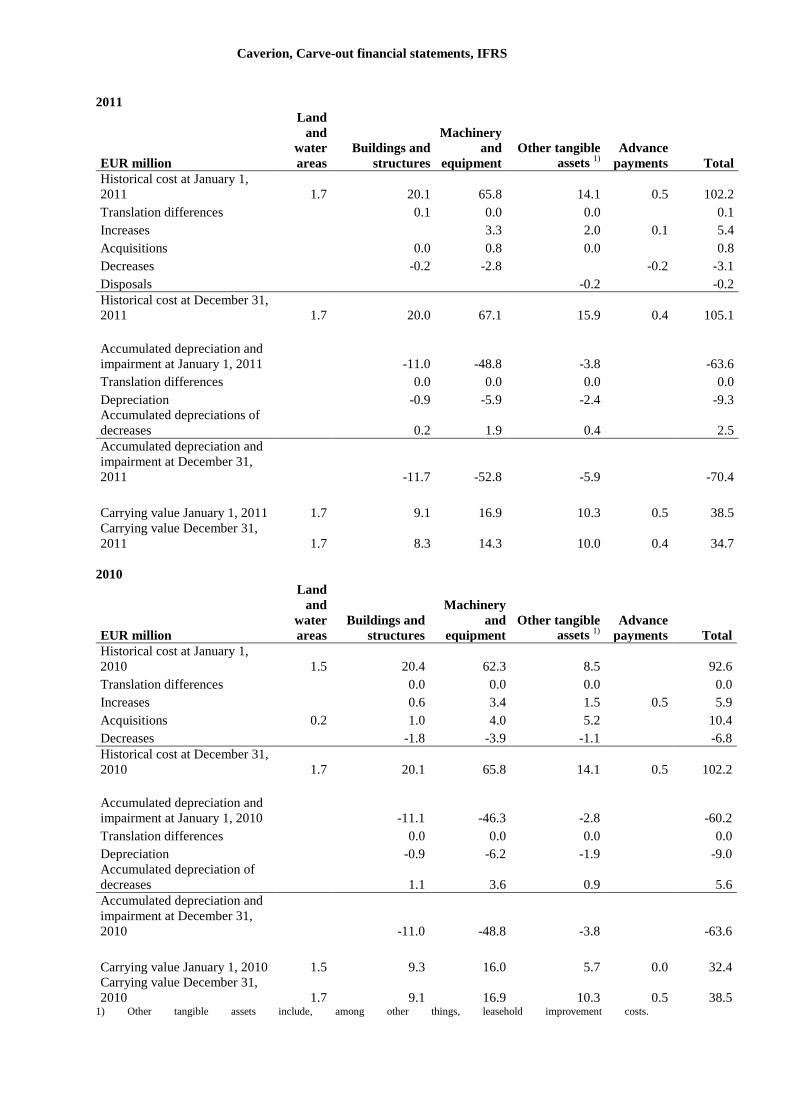
Caverion, Carve-out financial statements, IFRS
2011
EUR million
Land
and
water
areas
Buildings and
structures
Machinery
and
equipment
Other tangible
assets 1)
Advance
payments Total
Historical cost at January 1,
2011 1.7 20.1 65.8 14.1 0.5 102.2
Translation differences 0.1 0.0 0.0 0.1
Increases 3.3 2.0 0.1 5.4
Acquisitions 0.0 0.8 0.0 0.8
Decreases -0.2 -2.8 -0.2 -3.1
Disposals -0.2 -0.2
Historical cost at December 31,
2011 1.7 20.0 67.1 15.9 0.4 105.1
Accumulated depreciation and
impairment at January 1, 2011 -11.0 -48.8 -3.8 -63.6
Translation differences 0.0 0.0 0.0 0.0
Depreciation -0.9 -5.9 -2.4 -9.3
Accumulated depreciations of
decreases 0.2 1.9 0.4 2.5
Accumulated depreciation and
impairment at December 31,
2011 -11.7 -52.8 -5.9 -70.4
Carrying value January 1, 2011 1.7 9.1 16.9 10.3 0.5 38.5
Carrying value December 31,
2011 1.7 8.3 14.3 10.0 0.4 34.7
2010
EUR million
Land
and
water
areas
Buildings and
structures
Machinery
and
equipment
Other tangible
assets 1)
Advance
payments Total
Historical cost at January 1,
2010 1.5 20.4 62.3 8.5 92.6
Translation differences 0.0 0.0 0.0 0.0
Increases 0.6 3.4 1.5 0.5 5.9
Acquisitions 0.2 1.0 4.0 5.2 10.4
Decreases -1.8 -3.9 -1.1 -6.8
Historical cost at December 31,
2010 1.7 20.1 65.8 14.1 0.5 102.2
Accumulated depreciation and
impairment at January 1, 2010 -11.1 -46.3 -2.8 -60.2
Translation differences 0.0 0.0 0.0 0.0
Depreciation -0.9 -6.2 -1.9 -9.0
Accumulated depreciation of
decreases 1.1 3.6 0.9 5.6
Accumulated depreciation and
impairment at December 31,
2010 -11.0 -48.8 -3.8 -63.6
Carrying value January 1, 2010 1.5 9.3 16.0 5.7 0.0 32.4
Carrying value December 31,
2010 1.7 9.1 16.9 10.3 0.5 38.5 1) Other tangible assets include, among other things, leasehold improvement costs.
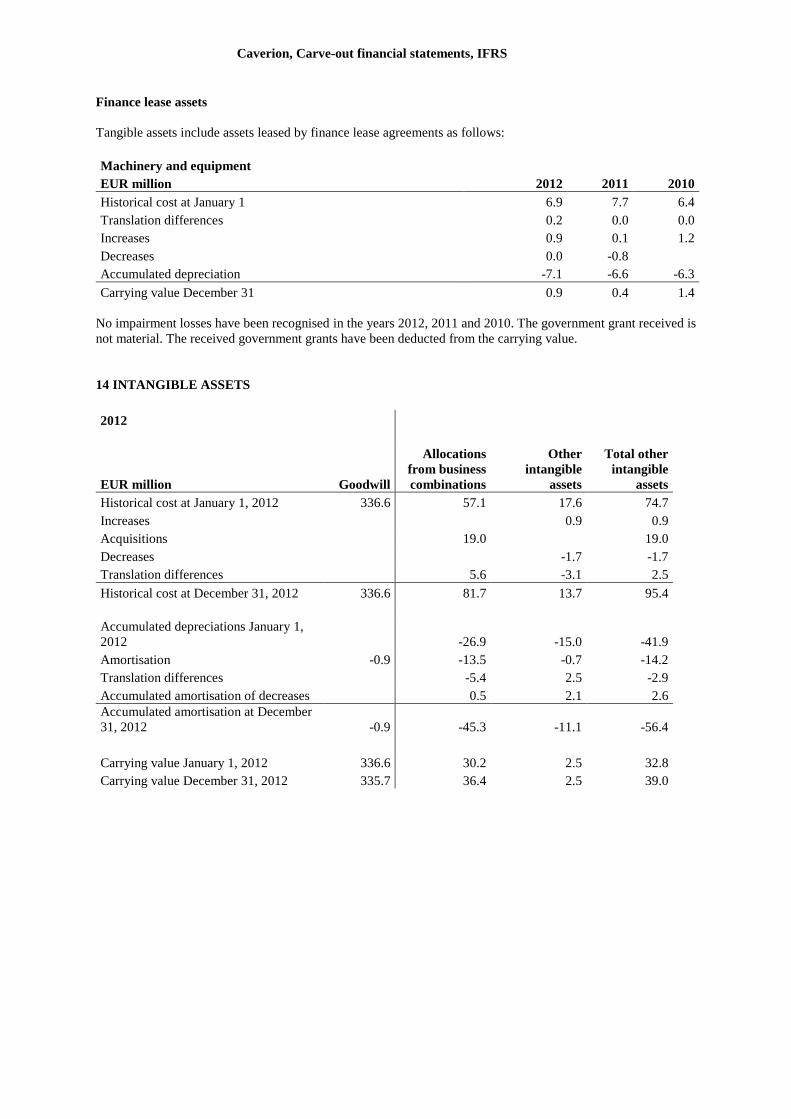
Caverion, Carve-out financial statements, IFRS
Finance lease assets
Tangible assets include assets leased by finance lease agreements as follows:
Machinery and equipment
EUR million 2012 2011 2010
Historical cost at January 1 6.9 7.7 6.4
Translation differences 0.2 0.0 0.0
Increases 0.9 0.1 1.2
Decreases 0.0 -0.8
Accumulated depreciation -7.1 -6.6 -6.3
Carrying value December 31 0.9 0.4 1.4
No impairment losses have been recognised in the years 2012, 2011 and 2010. The government grant received is
not material. The received government grants have been deducted from the carrying value.
14 INTANGIBLE ASSETS
2012
EUR million Goodwill
Allocations
from business
combinations
Other
intangible
assets
Total other
intangible
assets
Historical cost at January 1, 2012 336.6 57.1 17.6 74.7
Increases 0.9 0.9
Acquisitions 19.0 19.0
Decreases -1.7 -1.7
Translation differences 5.6 -3.1 2.5
Historical cost at December 31, 2012 336.6 81.7 13.7 95.4
Accumulated depreciations January 1,
2012 -26.9 -15.0 -41.9
Amortisation -0.9 -13.5 -0.7 -14.2
Translation differences -5.4 2.5 -2.9
Accumulated amortisation of decreases 0.5 2.1 2.6
Accumulated amortisation at December
31, 2012 -0.9 -45.3 -11.1 -56.4
Carrying value January 1, 2012 336.6 30.2 2.5 32.8
Carrying value December 31, 2012 335.7 36.4 2.5 39.0
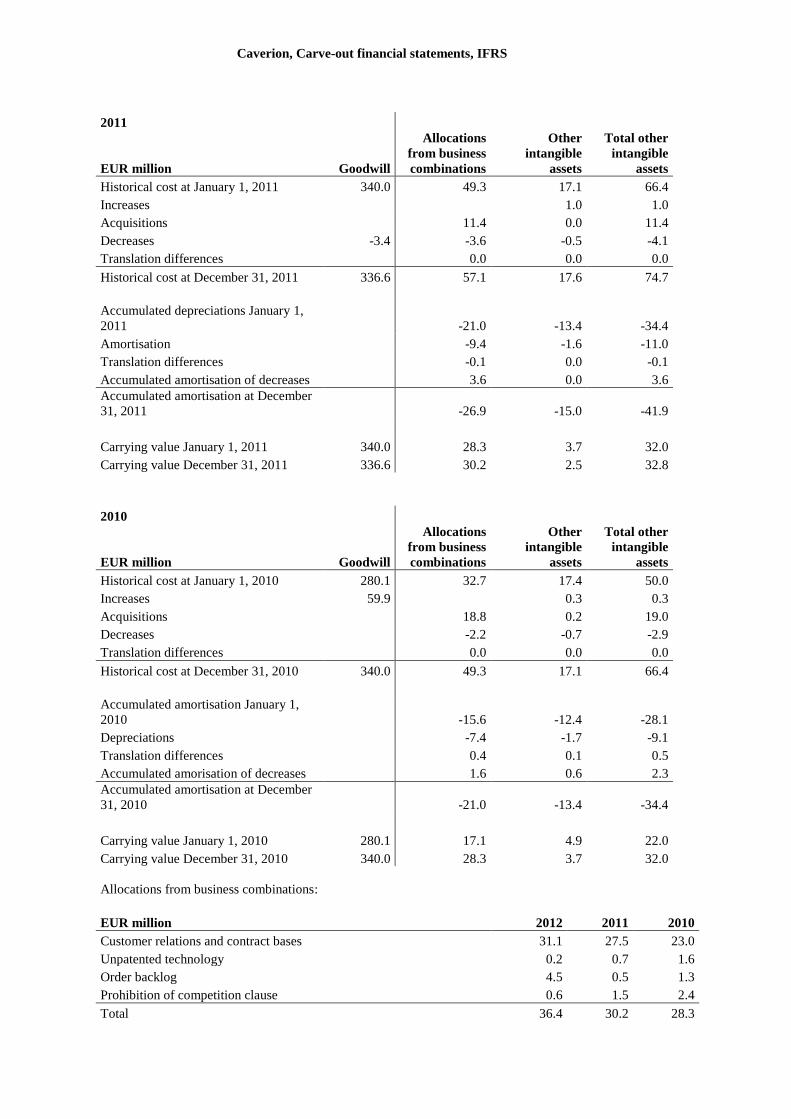
Caverion, Carve-out financial statements, IFRS
2011
EUR million Goodwill
Allocations
from business
combinations
Other
intangible
assets
Total other
intangible
assets
Historical cost at January 1, 2011 340.0 49.3 17.1 66.4
Increases 1.0 1.0
Acquisitions 11.4 0.0 11.4
Decreases -3.4 -3.6 -0.5 -4.1
Translation differences 0.0 0.0 0.0
Historical cost at December 31, 2011 336.6 57.1 17.6 74.7
Accumulated depreciations January 1,
2011 -21.0 -13.4 -34.4
Amortisation -9.4 -1.6 -11.0
Translation differences -0.1 0.0 -0.1
Accumulated amortisation of decreases 3.6 0.0 3.6
Accumulated amortisation at December
31, 2011 -26.9 -15.0 -41.9
Carrying value January 1, 2011 340.0 28.3 3.7 32.0
Carrying value December 31, 2011 336.6 30.2 2.5 32.8
2010
EUR million Goodwill
Allocations
from business
combinations
Other
intangible
assets
Total other
intangible
assets
Historical cost at January 1, 2010 280.1 32.7 17.4 50.0
Increases 59.9 0.3 0.3
Acquisitions 18.8 0.2 19.0
Decreases -2.2 -0.7 -2.9
Translation differences 0.0 0.0 0.0
Historical cost at December 31, 2010 340.0 49.3 17.1 66.4
Accumulated amortisation January 1,
2010 -15.6 -12.4 -28.1
Depreciations -7.4 -1.7 -9.1
Translation differences 0.4 0.1 0.5
Accumulated amorisation of decreases 1.6 0.6 2.3
Accumulated amortisation at December
31, 2010 -21.0 -13.4 -34.4
Carrying value January 1, 2010 280.1 17.1 4.9 22.0
Carrying value December 31, 2010 340.0 28.3 3.7 32.0
Allocations from business combinations:
EUR million 2012 2011 2010
Customer relations and contract bases 31.1 27.5 23.0
Unpatented technology 0.2 0.7 1.6
Order backlog 4.5 0.5 1.3
Prohibition of competition clause 0.6 1.5 2.4
Total 36.4 30.2 28.3
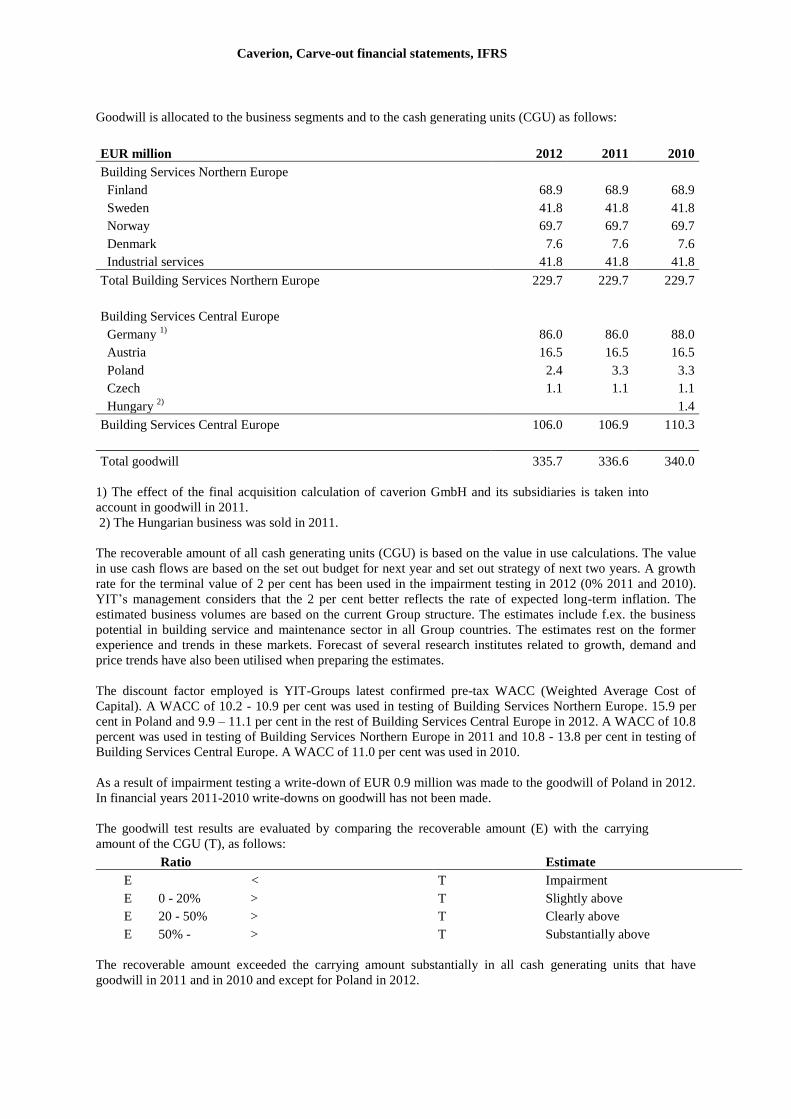
Caverion, Carve-out financial statements, IFRS
Goodwill is allocated to the business segments and to the cash generating units (CGU) as follows:
EUR million 2012 2011 2010
Building Services Northern Europe
Finland 68.9 68.9 68.9
Sweden 41.8 41.8 41.8
Norway 69.7 69.7 69.7
Denmark 7.6 7.6 7.6
Industrial services 41.8 41.8 41.8
Total Building Services Northern Europe 229.7 229.7 229.7
Building Services Central Europe
Germany 1)
86.0 86.0 88.0
Austria 16.5 16.5 16.5
Poland 2.4 3.3 3.3
Czech 1.1 1.1 1.1
Hungary 2)
1.4
Building Services Central Europe 106.0 106.9 110.3
Total goodwill 335.7 336.6 340.0
1) The effect of the final acquisition calculation of caverion GmbH and its subsidiaries is taken into
account in goodwill in 2011.
2) The Hungarian business was sold in 2011.
The recoverable amount of all cash generating units (CGU) is based on the value in use calculations. The value
in use cash flows are based on the set out budget for next year and set out strategy of next two years. A growth
rate for the terminal value of 2 per cent has been used in the impairment testing in 2012 (0% 2011 and 2010).
YIT’s management considers that the 2 per cent better reflects the rate of expected long-term inflation. The
estimated business volumes are based on the current Group structure. The estimates include f.ex. the business
potential in building service and maintenance sector in all Group countries. The estimates rest on the former
experience and trends in these markets. Forecast of several research institutes related to growth, demand and
price trends have also been utilised when preparing the estimates.
The discount factor employed is YIT-Groups latest confirmed pre-tax WACC (Weighted Average Cost of
Capital). A WACC of 10.2 - 10.9 per cent was used in testing of Building Services Northern Europe. 15.9 per
cent in Poland and 9.9 – 11.1 per cent in the rest of Building Services Central Europe in 2012. A WACC of 10.8
percent was used in testing of Building Services Northern Europe in 2011 and 10.8 - 13.8 per cent in testing of
Building Services Central Europe. A WACC of 11.0 per cent was used in 2010.
As a result of impairment testing a write-down of EUR 0.9 million was made to the goodwill of Poland in 2012.
In financial years 2011-2010 write-downs on goodwill has not been made.
The goodwill test results are evaluated by comparing the recoverable amount (E) with the carrying
amount of the CGU (T), as follows:
Ratio Estimate
E < T Impairment
E 0 - 20% > T Slightly above
E 20 - 50% > T Clearly above
E 50% - > T Substantially above
The recoverable amount exceeded the carrying amount substantially in all cash generating units that have
goodwill in 2011 and in 2010 and except for Poland in 2012.
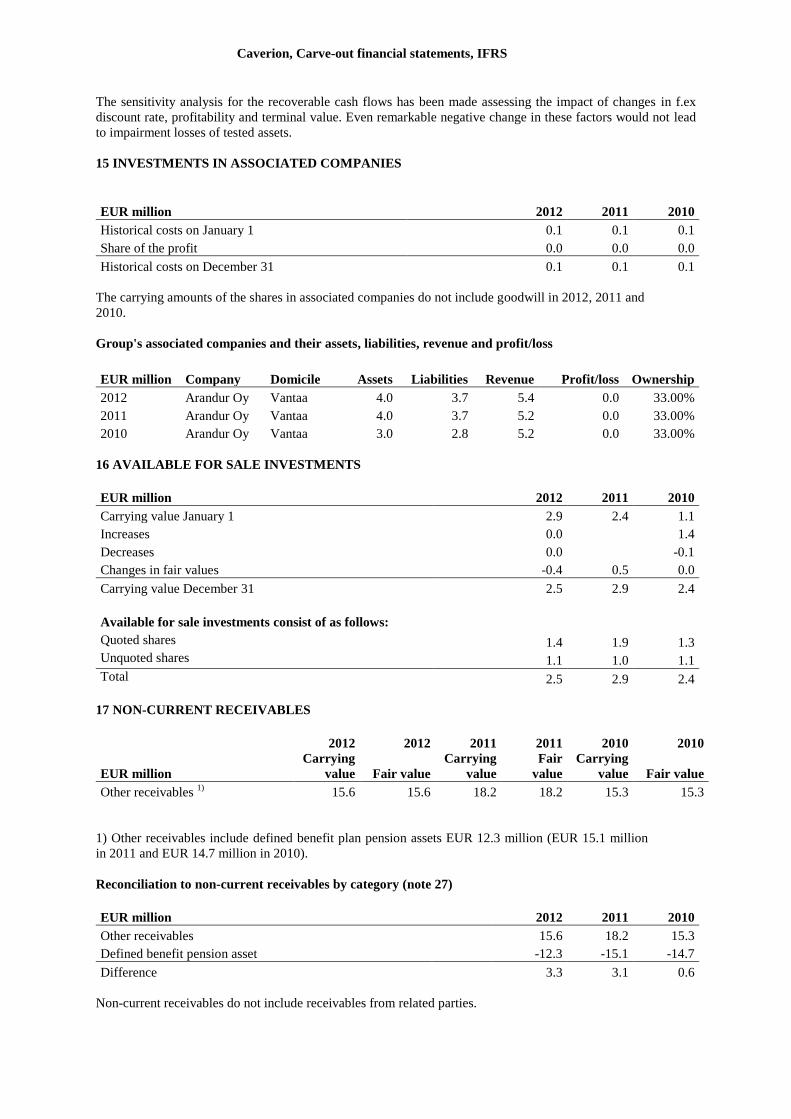
Caverion, Carve-out financial statements, IFRS
The sensitivity analysis for the recoverable cash flows has been made assessing the impact of changes in f.ex
discount rate, profitability and terminal value. Even remarkable negative change in these factors would not lead
to impairment losses of tested assets.
15 INVESTMENTS IN ASSOCIATED COMPANIES
EUR million 2012 2011 2010
Historical costs on January 1 0.1 0.1 0.1
Share of the profit 0.0 0.0 0.0
Historical costs on December 31 0.1 0.1 0.1
The carrying amounts of the shares in associated companies do not include goodwill in 2012, 2011 and
2010.
Group's associated companies and their assets, liabilities, revenue and profit/loss
EUR million Company Domicile Assets Liabilities Revenue Profit/loss Ownership
2012 Arandur Oy Vantaa 4.0 3.7 5.4 0.0 33.00%
2011 Arandur Oy Vantaa 4.0 3.7 5.2 0.0 33.00%
2010 Arandur Oy Vantaa 3.0 2.8 5.2 0.0 33.00%
16 AVAILABLE FOR SALE INVESTMENTS
EUR million 2012 2011 2010
Carrying value January 1 2.9 2.4 1.1
Increases 0.0 1.4
Decreases 0.0 -0.1
Changes in fair values -0.4 0.5 0.0
Carrying value December 31 2.5 2.9 2.4
Available for sale investments consist of as follows:
Quoted shares 1.4 1.9 1.3
Unquoted shares 1.1 1.0 1.1
Total 2.5 2.9 2.4
17 NON-CURRENT RECEIVABLES
2012 2012 2011 2011 2010 2010
EUR million
Carrying
value Fair value
Carrying
value
Fair
value
Carrying
value Fair value
Other receivables 1)
15.6 15.6 18.2 18.2 15.3 15.3
1) Other receivables include defined benefit plan pension assets EUR 12.3 million (EUR 15.1 million
in 2011 and EUR 14.7 million in 2010).
Reconciliation to non-current receivables by category (note 27)
EUR million 2012 2011 2010
Other receivables 15.6 18.2 15.3
Defined benefit pension asset -12.3 -15.1 -14.7
Difference 3.3 3.1 0.6
Non-current receivables do not include receivables from related parties.
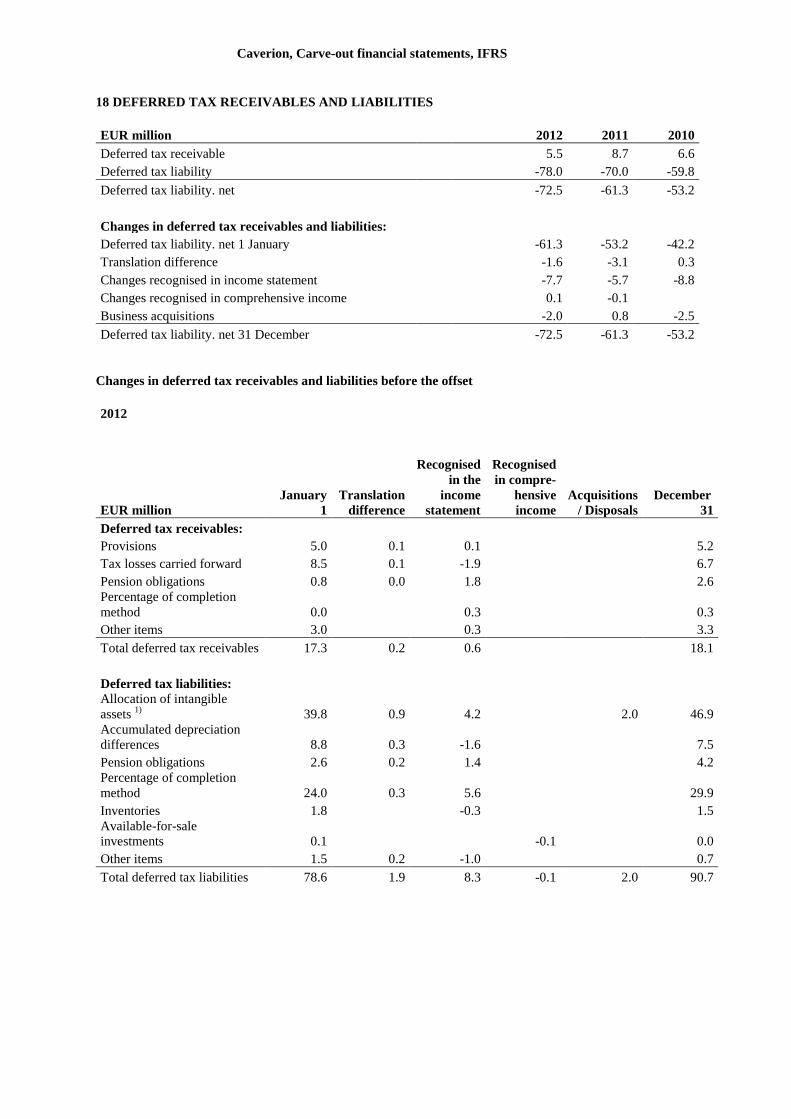
Caverion, Carve-out financial statements, IFRS
18 DEFERRED TAX RECEIVABLES AND LIABILITIES
EUR million 2012 2011 2010
Deferred tax receivable 5.5 8.7 6.6
Deferred tax liability -78.0 -70.0 -59.8
Deferred tax liability. net -72.5 -61.3 -53.2
Changes in deferred tax receivables and liabilities:
Deferred tax liability. net 1 January -61.3 -53.2 -42.2
Translation difference -1.6 -3.1 0.3
Changes recognised in income statement -7.7 -5.7 -8.8
Changes recognised in comprehensive income 0.1 -0.1
Business acquisitions -2.0 0.8 -2.5
Deferred tax liability. net 31 December -72.5 -61.3 -53.2
Changes in deferred tax receivables and liabilities before the offset
2012
EUR million
January
1
Translation
difference
Recognised
in the
income
statement
Recognised
in compre-
hensive
income
Acquisitions
/ Disposals
December
31
Deferred tax receivables:
Provisions 5.0 0.1 0.1 5.2
Tax losses carried forward 8.5 0.1 -1.9 6.7
Pension obligations 0.8 0.0 1.8 2.6
Percentage of completion
method 0.0 0.3 0.3
Other items 3.0 0.3 3.3
Total deferred tax receivables 17.3 0.2 0.6 18.1
Deferred tax liabilities:
Allocation of intangible
assets 1)
39.8 0.9 4.2 2.0 46.9
Accumulated depreciation
differences 8.8 0.3 -1.6 7.5
Pension obligations 2.6 0.2 1.4 4.2
Percentage of completion
method 24.0 0.3 5.6 29.9
Inventories 1.8 -0.3 1.5
Available-for-sale
investments 0.1 -0.1 0.0
Other items 1.5 0.2 -1.0 0.7
Total deferred tax liabilities 78.6 1.9 8.3 -0.1 2.0 90.7
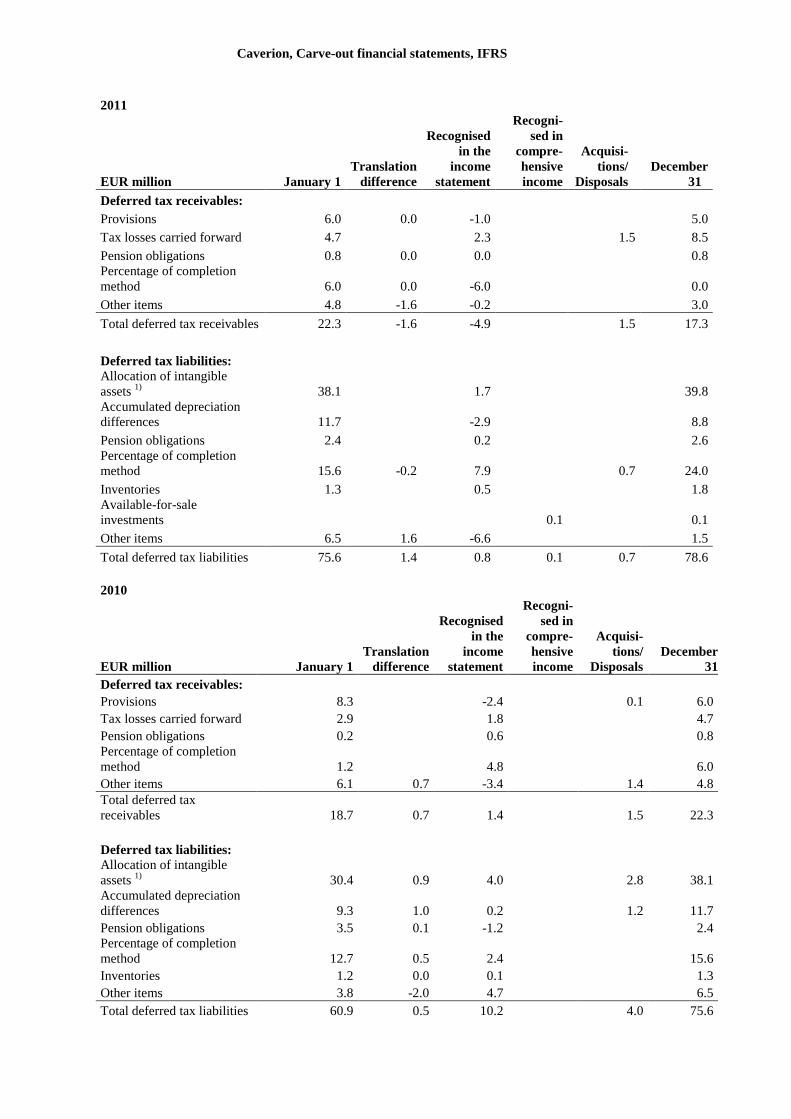
Caverion, Carve-out financial statements, IFRS
2011
EUR million January 1
Translation
difference
Recognised
in the
income
statement
Recogni-
sed in
compre-
hensive
income
Acquisi-
tions/
Disposals
December
31
Deferred tax receivables:
Provisions 6.0 0.0 -1.0 5.0
Tax losses carried forward 4.7 2.3 1.5 8.5
Pension obligations 0.8 0.0 0.0 0.8
Percentage of completion
method 6.0 0.0 -6.0 0.0
Other items 4.8 -1.6 -0.2 3.0
Total deferred tax receivables 22.3 -1.6 -4.9 1.5 17.3
Deferred tax liabilities:
Allocation of intangible
assets 1)
38.1 1.7 39.8
Accumulated depreciation
differences 11.7 -2.9 8.8
Pension obligations 2.4 0.2 2.6
Percentage of completion
method 15.6 -0.2 7.9 0.7 24.0
Inventories 1.3 0.5 1.8
Available-for-sale
investments 0.1 0.1
Other items 6.5 1.6 -6.6 1.5
Total deferred tax liabilities 75.6 1.4 0.8 0.1 0.7 78.6
2010
EUR million January 1
Translation
difference
Recognised
in the
income
statement
Recogni-
sed in
compre-
hensive
income
Acquisi-
tions/
Disposals
December
31
Deferred tax receivables:
Provisions 8.3 -2.4 0.1 6.0
Tax losses carried forward 2.9 1.8 4.7
Pension obligations 0.2 0.6 0.8
Percentage of completion
method 1.2 4.8 6.0
Other items 6.1 0.7 -3.4 1.4 4.8
Total deferred tax
receivables 18.7 0.7 1.4 1.5 22.3
Deferred tax liabilities:
Allocation of intangible
assets 1)
30.4 0.9 4.0 2.8 38.1
Accumulated depreciation
differences 9.3 1.0 0.2 1.2 11.7
Pension obligations 3.5 0.1 -1.2 2.4
Percentage of completion
method 12.7 0.5 2.4 15.6
Inventories 1.2 0.0 0.1 1.3
Other items 3.8 -2.0 4.7 6.5
Total deferred tax liabilities 60.9 0.5 10.2 4.0 75.6
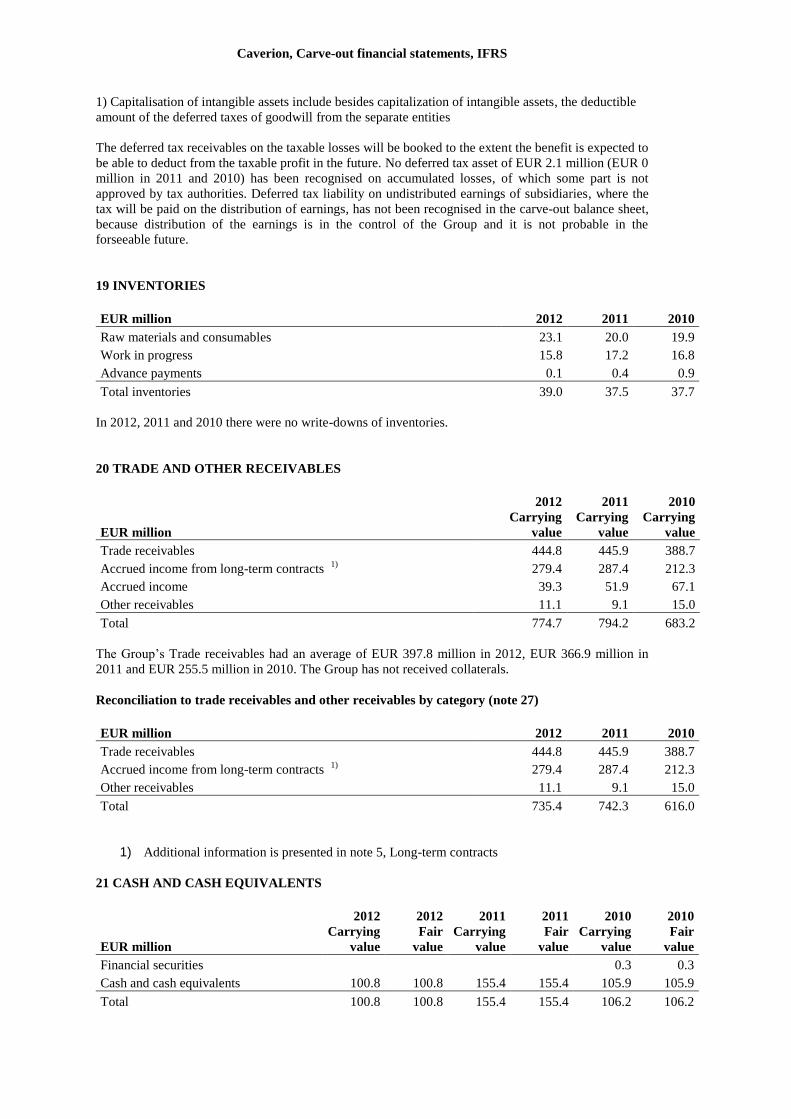
Caverion, Carve-out financial statements, IFRS
1) Capitalisation of intangible assets include besides capitalization of intangible assets, the deductible
amount of the deferred taxes of goodwill from the separate entities
The deferred tax receivables on the taxable losses will be booked to the extent the benefit is expected to
be able to deduct from the taxable profit in the future. No deferred tax asset of EUR 2.1 million (EUR 0
million in 2011 and 2010) has been recognised on accumulated losses, of which some part is not
approved by tax authorities. Deferred tax liability on undistributed earnings of subsidiaries, where the
tax will be paid on the distribution of earnings, has not been recognised in the carve-out balance sheet,
because distribution of the earnings is in the control of the Group and it is not probable in the
forseeable future.
19 INVENTORIES
EUR million 2012 2011 2010
Raw materials and consumables 23.1 20.0 19.9
Work in progress 15.8 17.2 16.8
Advance payments 0.1 0.4 0.9
Total inventories 39.0 37.5 37.7
In 2012, 2011 and 2010 there were no write-downs of inventories.
20 TRADE AND OTHER RECEIVABLES
2012 2011 2010
EUR million
Carrying
value
Carrying
value
Carrying
value
Trade receivables 444.8 445.9 388.7
Accrued income from long-term contracts 1)
279.4 287.4 212.3
Accrued income 39.3 51.9 67.1
Other receivables 11.1 9.1 15.0
Total 774.7 794.2 683.2
The Group’s Trade receivables had an average of EUR 397.8 million in 2012, EUR 366.9 million in
2011 and EUR 255.5 million in 2010. The Group has not received collaterals.
Reconciliation to trade receivables and other receivables by category (note 27)
EUR million 2012 2011 2010
Trade receivables 444.8 445.9 388.7
Accrued income from long-term contracts 1)
279.4 287.4 212.3
Other receivables 11.1 9.1 15.0
Total 735.4 742.3 616.0
1) Additional information is presented in note 5, Long-term contracts
21 CASH AND CASH EQUIVALENTS
2012 2012 2011 2011 2010 2010
EUR million
Carrying
value
Fair
value
Carrying
value
Fair
value
Carrying
value
Fair
value
Financial securities 0.3 0.3
Cash and cash equivalents 100.8 100.8 155.4 155.4 105.9 105.9
Total 100.8 100.8 155.4 155.4 106.2 106.2
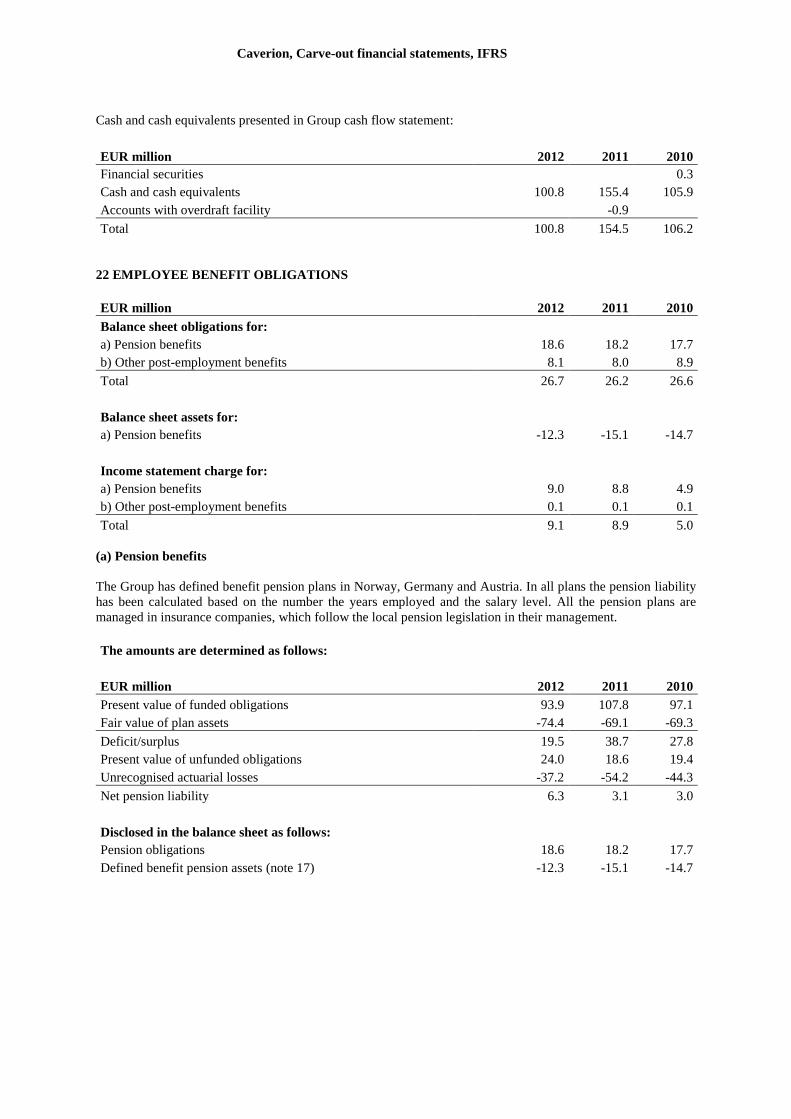
Caverion, Carve-out financial statements, IFRS
Cash and cash equivalents presented in Group cash flow statement:
EUR million 2012 2011 2010
Financial securities 0.3
Cash and cash equivalents 100.8 155.4 105.9
Accounts with overdraft facility -0.9
Total 100.8 154.5 106.2
22 EMPLOYEE BENEFIT OBLIGATIONS
EUR million 2012 2011 2010
Balance sheet obligations for:
a) Pension benefits 18.6 18.2 17.7
b) Other post-employment benefits 8.1 8.0 8.9
Total 26.7 26.2 26.6
Balance sheet assets for:
a) Pension benefits -12.3 -15.1 -14.7
Income statement charge for:
a) Pension benefits 9.0 8.8 4.9
b) Other post-employment benefits 0.1 0.1 0.1
Total 9.1 8.9 5.0
(a) Pension benefits
The Group has defined benefit pension plans in Norway, Germany and Austria. In all plans the pension liability
has been calculated based on the number the years employed and the salary level. All the pension plans are
managed in insurance companies, which follow the local pension legislation in their management.
The amounts are determined as follows:
EUR million 2012 2011 2010
Present value of funded obligations 93.9 107.8 97.1
Fair value of plan assets -74.4 -69.1 -69.3
Deficit/surplus 19.5 38.7 27.8
Present value of unfunded obligations 24.0 18.6 19.4
Unrecognised actuarial losses -37.2 -54.2 -44.3
Net pension liability 6.3 3.1 3.0
Disclosed in the balance sheet as follows:
Pension obligations 18.6 18.2 17.7
Defined benefit pension assets (note 17) -12.3 -15.1 -14.7
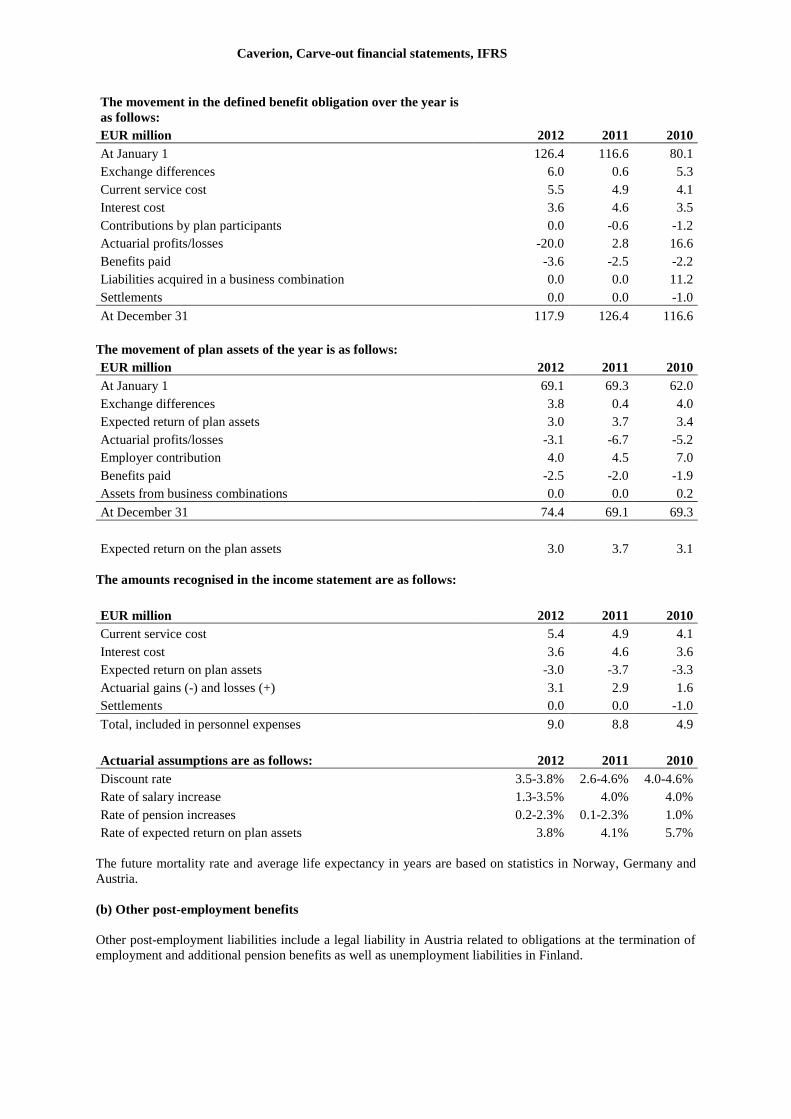
Caverion, Carve-out financial statements, IFRS
The movement in the defined benefit obligation over the year is
as follows:
EUR million 2012 2011 2010
At January 1 126.4 116.6 80.1
Exchange differences 6.0 0.6 5.3
Current service cost 5.5 4.9 4.1
Interest cost 3.6 4.6 3.5
Contributions by plan participants 0.0 -0.6 -1.2
Actuarial profits/losses -20.0 2.8 16.6
Benefits paid -3.6 -2.5 -2.2
Liabilities acquired in a business combination 0.0 0.0 11.2
Settlements 0.0 0.0 -1.0
At December 31 117.9 126.4 116.6
The movement of plan assets of the year is as follows: EUR million 2012 2011 2010
At January 1 69.1 69.3 62.0
Exchange differences 3.8 0.4 4.0
Expected return of plan assets 3.0 3.7 3.4
Actuarial profits/losses -3.1 -6.7 -5.2
Employer contribution 4.0 4.5 7.0
Benefits paid -2.5 -2.0 -1.9
Assets from business combinations 0.0 0.0 0.2
At December 31 74.4 69.1 69.3
Expected return on the plan assets 3.0 3.7 3.1
The amounts recognised in the income statement are as follows:
EUR million 2012 2011 2010
Current service cost 5.4 4.9 4.1
Interest cost 3.6 4.6 3.6
Expected return on plan assets -3.0 -3.7 -3.3
Actuarial gains (-) and losses (+) 3.1 2.9 1.6
Settlements 0.0 0.0 -1.0
Total, included in personnel expenses 9.0 8.8 4.9
Actuarial assumptions are as follows: 2012 2011 2010
Discount rate 3.5-3.8% 2.6-4.6% 4.0-4.6%
Rate of salary increase 1.3-3.5% 4.0% 4.0%
Rate of pension increases 0.2-2.3% 0.1-2.3% 1.0%
Rate of expected return on plan assets 3.8% 4.1% 5.7%
The future mortality rate and average life expectancy in years are based on statistics in Norway, Germany and
Austria.
(b) Other post-employment benefits
Other post-employment liabilities include a legal liability in Austria related to obligations at the termination of
employment and additional pension benefits as well as unemployment liabilities in Finland.
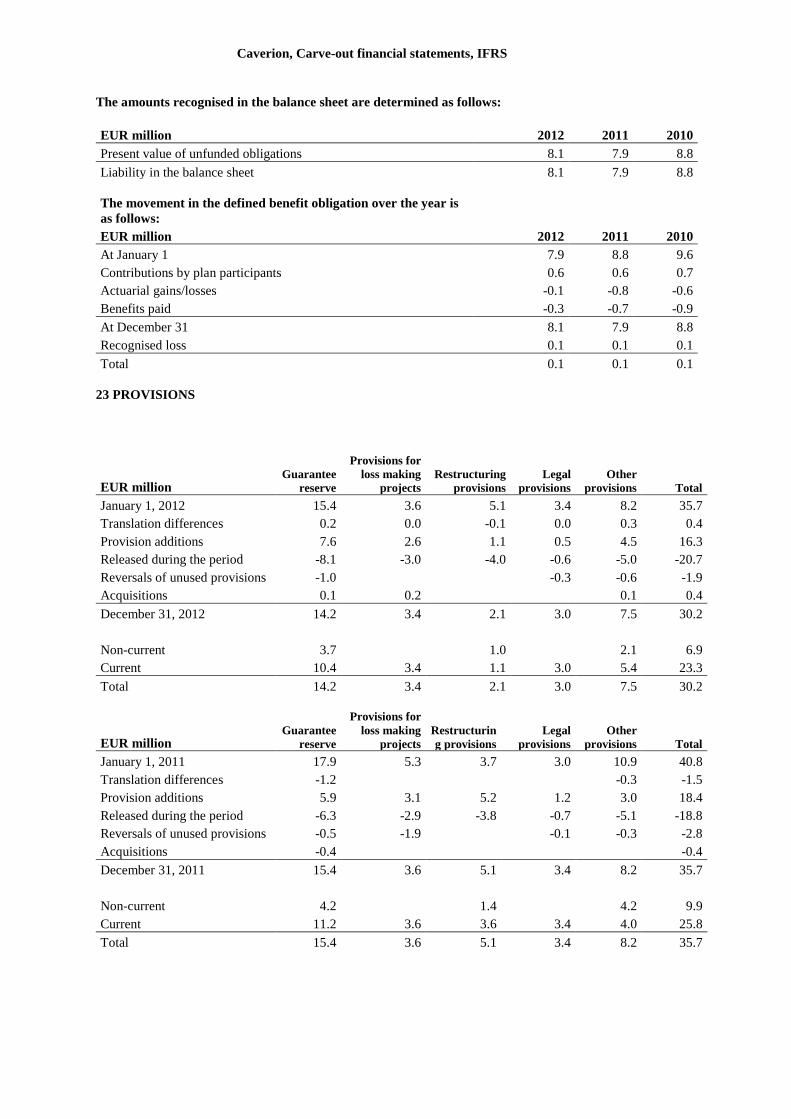
Caverion, Carve-out financial statements, IFRS
The amounts recognised in the balance sheet are determined as follows:
EUR million 2012 2011 2010
Present value of unfunded obligations 8.1 7.9 8.8
Liability in the balance sheet 8.1 7.9 8.8
The movement in the defined benefit obligation over the year is
as follows:
EUR million 2012 2011 2010
At January 1 7.9 8.8 9.6
Contributions by plan participants 0.6 0.6 0.7
Actuarial gains/losses -0.1 -0.8 -0.6
Benefits paid -0.3 -0.7 -0.9
At December 31 8.1 7.9 8.8
Recognised loss 0.1 0.1 0.1
Total 0.1 0.1 0.1
23 PROVISIONS
EUR million Guarantee
reserve
Provisions for
loss making
projects
Restructuring
provisions
Legal
provisions
Other
provisions Total
January 1, 2012 15.4 3.6 5.1 3.4 8.2 35.7
Translation differences 0.2 0.0 -0.1 0.0 0.3 0.4
Provision additions 7.6 2.6 1.1 0.5 4.5 16.3
Released during the period -8.1 -3.0 -4.0 -0.6 -5.0 -20.7
Reversals of unused provisions -1.0 -0.3 -0.6 -1.9
Acquisitions 0.1 0.2 0.1 0.4
December 31, 2012 14.2 3.4 2.1 3.0 7.5 30.2
Non-current 3.7 1.0 2.1 6.9
Current 10.4 3.4 1.1 3.0 5.4 23.3
Total 14.2 3.4 2.1 3.0 7.5 30.2
EUR million Guarantee
reserve
Provisions for
loss making
projects
Restructurin
g provisions
Legal
provisions
Other
provisions Total
January 1, 2011 17.9 5.3 3.7 3.0 10.9 40.8
Translation differences -1.2 -0.3 -1.5
Provision additions 5.9 3.1 5.2 1.2 3.0 18.4
Released during the period -6.3 -2.9 -3.8 -0.7 -5.1 -18.8
Reversals of unused provisions -0.5 -1.9 -0.1 -0.3 -2.8
Acquisitions -0.4 -0.4
December 31, 2011 15.4 3.6 5.1 3.4 8.2 35.7
Non-current 4.2 1.4 4.2 9.9
Current 11.2 3.6 3.6 3.4 4.0 25.8
Total 15.4 3.6 5.1 3.4 8.2 35.7
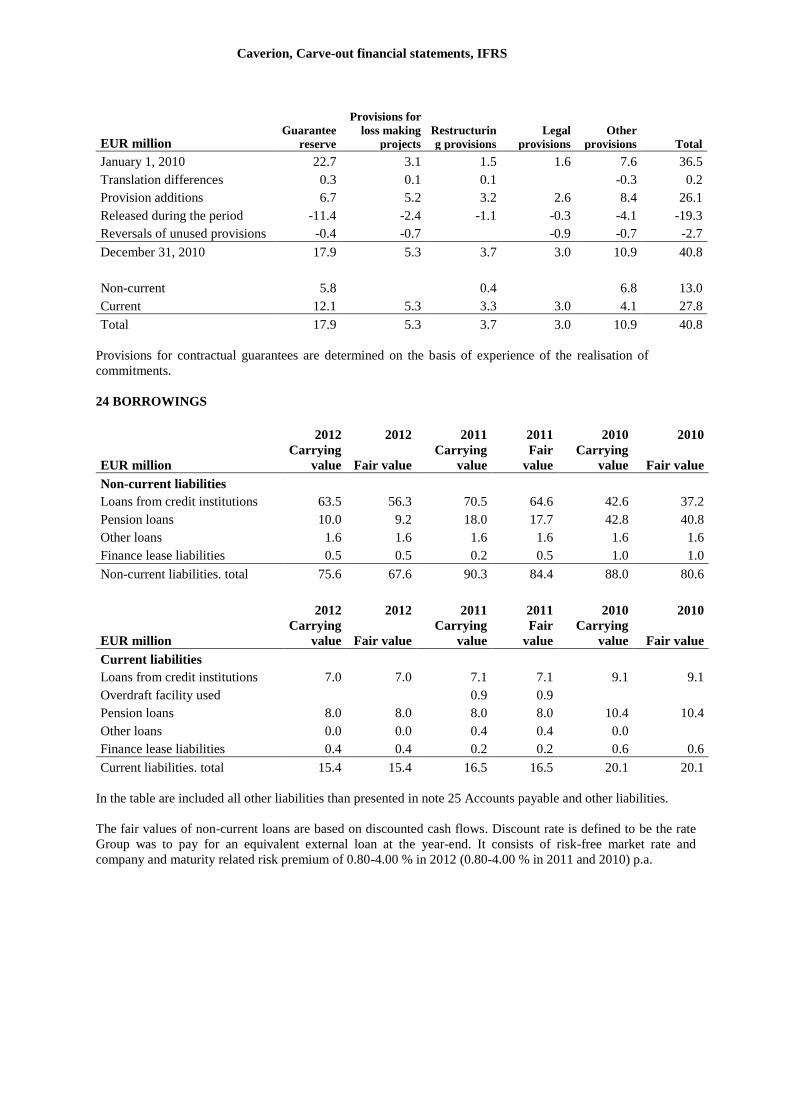
Caverion, Carve-out financial statements, IFRS
EUR million Guarantee
reserve
Provisions for
loss making
projects
Restructurin
g provisions
Legal
provisions
Other
provisions Total
January 1, 2010 22.7 3.1 1.5 1.6 7.6 36.5
Translation differences 0.3 0.1 0.1 -0.3 0.2
Provision additions 6.7 5.2 3.2 2.6 8.4 26.1
Released during the period -11.4 -2.4 -1.1 -0.3 -4.1 -19.3
Reversals of unused provisions -0.4 -0.7 -0.9 -0.7 -2.7
December 31, 2010 17.9 5.3 3.7 3.0 10.9 40.8
Non-current 5.8 0.4 6.8 13.0
Current 12.1 5.3 3.3 3.0 4.1 27.8
Total 17.9 5.3 3.7 3.0 10.9 40.8
Provisions for contractual guarantees are determined on the basis of experience of the realisation of
commitments.
24 BORROWINGS
2012 2012 2011 2011 2010 2010
EUR million
Carrying
value Fair value
Carrying
value
Fair
value
Carrying
value Fair value
Non-current liabilities
Loans from credit institutions 63.5 56.3 70.5 64.6 42.6 37.2
Pension loans 10.0 9.2 18.0 17.7 42.8 40.8
Other loans 1.6 1.6 1.6 1.6 1.6 1.6
Finance lease liabilities 0.5 0.5 0.2 0.5 1.0 1.0
Non-current liabilities. total 75.6 67.6 90.3 84.4 88.0 80.6
2012 2012 2011 2011 2010 2010
EUR million
Carrying
value Fair value
Carrying
value
Fair
value
Carrying
value Fair value
Current liabilities
Loans from credit institutions 7.0 7.0 7.1 7.1 9.1 9.1
Overdraft facility used 0.9 0.9
Pension loans 8.0 8.0 8.0 8.0 10.4 10.4
Other loans 0.0 0.0 0.4 0.4 0.0
Finance lease liabilities 0.4 0.4 0.2 0.2 0.6 0.6
Current liabilities. total 15.4 15.4 16.5 16.5 20.1 20.1
In the table are included all other liabilities than presented in note 25 Accounts payable and other liabilities.
The fair values of non-current loans are based on discounted cash flows. Discount rate is defined to be the rate
Group was to pay for an equivalent external loan at the year-end. It consists of risk-free market rate and
company and maturity related risk premium of 0.80-4.00 % in 2012 (0.80-4.00 % in 2011 and 2010) p.a.
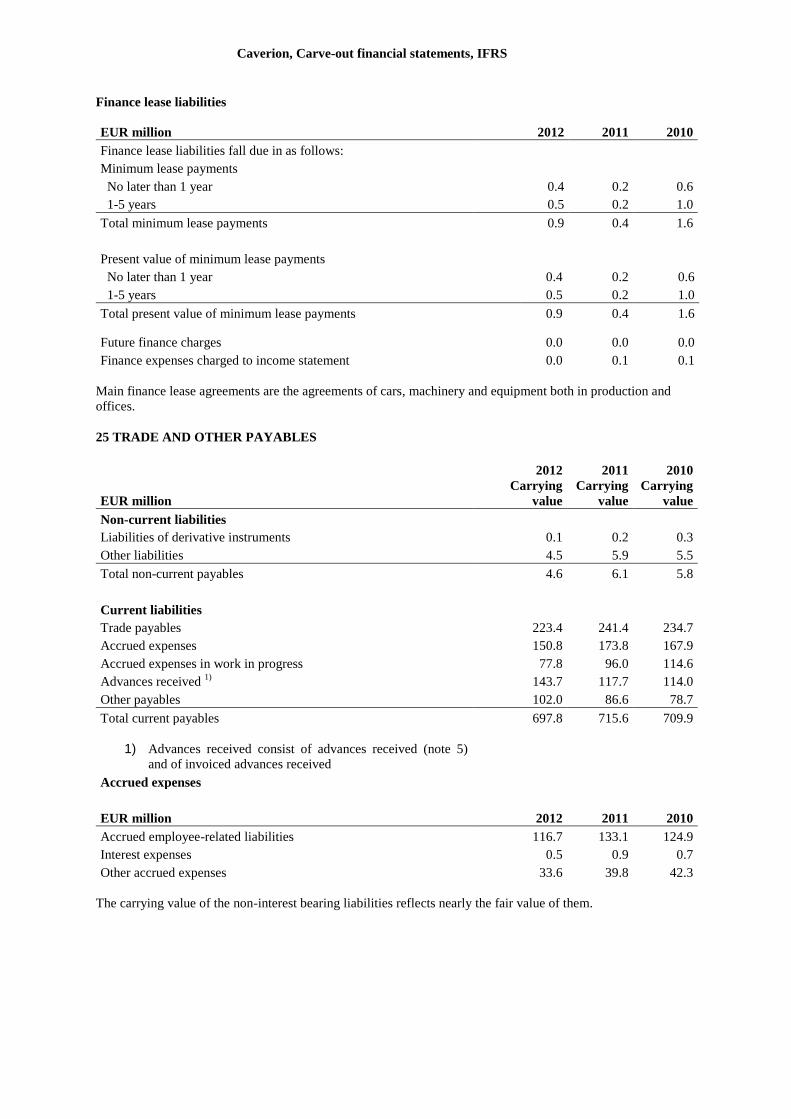
Caverion, Carve-out financial statements, IFRS
Finance lease liabilities
EUR million 2012 2011 2010
Finance lease liabilities fall due in as follows:
Minimum lease payments
No later than 1 year 0.4 0.2 0.6
1-5 years 0.5 0.2 1.0
Total minimum lease payments 0.9 0.4 1.6
Present value of minimum lease payments
No later than 1 year 0.4 0.2 0.6
1-5 years 0.5 0.2 1.0
Total present value of minimum lease payments 0.9 0.4 1.6
Future finance charges 0.0 0.0 0.0
Finance expenses charged to income statement 0.0 0.1 0.1
Main finance lease agreements are the agreements of cars, machinery and equipment both in production and
offices.
25 TRADE AND OTHER PAYABLES
2012 2011 2010
EUR million
Carrying
value
Carrying
value
Carrying
value
Non-current liabilities
Liabilities of derivative instruments 0.1 0.2 0.3
Other liabilities 4.5 5.9 5.5
Total non-current payables 4.6 6.1 5.8
Current liabilities
Trade payables 223.4 241.4 234.7
Accrued expenses 150.8 173.8 167.9
Accrued expenses in work in progress 77.8 96.0 114.6
Advances received 1)
143.7 117.7 114.0
Other payables 102.0 86.6 78.7
Total current payables 697.8 715.6 709.9
1) Advances received consist of advances received (note 5)
and of invoiced advances received
Accrued expenses
EUR million 2012 2011 2010
Accrued employee-related liabilities 116.7 133.1 124.9
Interest expenses 0.5 0.9 0.7
Other accrued expenses 33.6 39.8 42.3
The carrying value of the non-interest bearing liabilities reflects nearly the fair value of them.
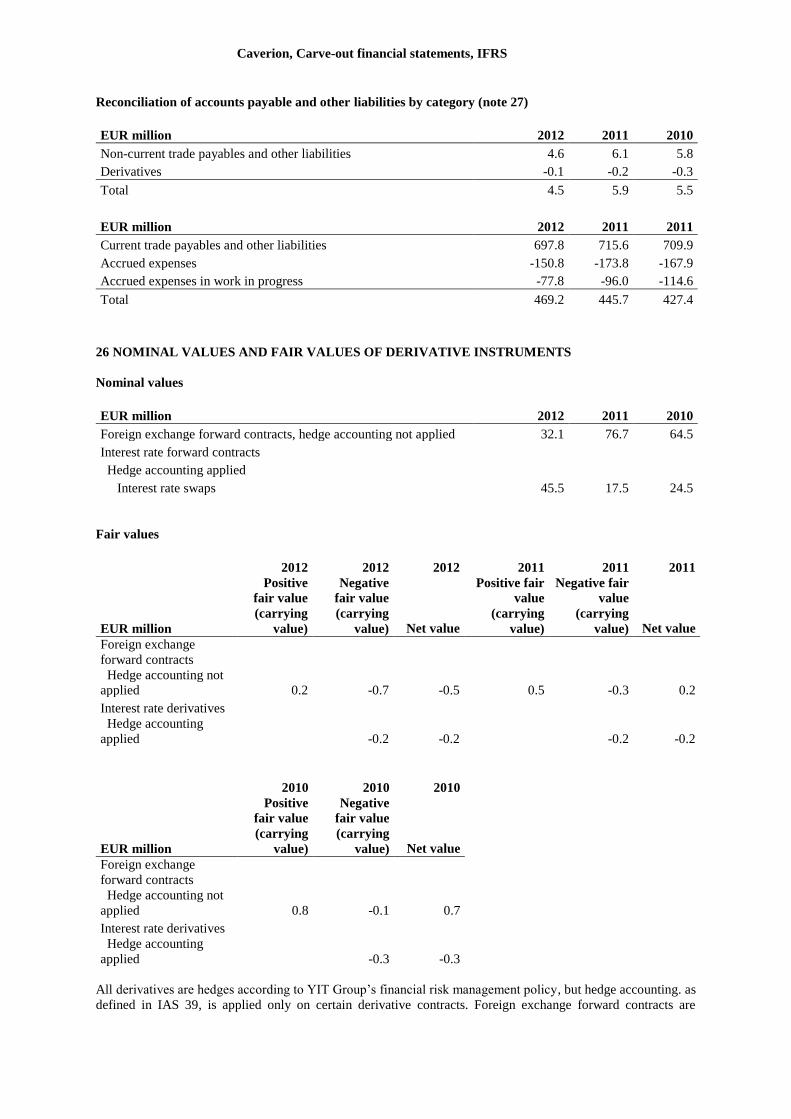
Caverion, Carve-out financial statements, IFRS
Reconciliation of accounts payable and other liabilities by category (note 27)
EUR million 2012 2011 2010
Non-current trade payables and other liabilities 4.6 6.1 5.8
Derivatives -0.1 -0.2 -0.3
Total 4.5 5.9 5.5
EUR million 2012 2011 2011
Current trade payables and other liabilities 697.8 715.6 709.9
Accrued expenses -150.8 -173.8 -167.9
Accrued expenses in work in progress -77.8 -96.0 -114.6
Total 469.2 445.7 427.4
26 NOMINAL VALUES AND FAIR VALUES OF DERIVATIVE INSTRUMENTS
Nominal values
EUR million 2012 2011 2010
Foreign exchange forward contracts, hedge accounting not applied 32.1 76.7 64.5
Interest rate forward contracts
Hedge accounting applied
Interest rate swaps 45.5 17.5 24.5
Fair values
2012 2012 2012 2011 2011 2011
EUR million
Positive
fair value
(carrying
value)
Negative
fair value
(carrying
value) Net value
Positive fair
value
(carrying
value)
Negative fair
value
(carrying
value) Net value
Foreign exchange
forward contracts
Hedge accounting not
applied 0.2 -0.7 -0.5 0.5 -0.3 0.2
Interest rate derivatives
Hedge accounting
applied -0.2 -0.2 -0.2 -0.2
2010 2010 2010
EUR million
Positive
fair value
(carrying
value)
Negative
fair value
(carrying
value) Net value
Foreign exchange
forward contracts
Hedge accounting not
applied 0.8 -0.1 0.7
Interest rate derivatives
Hedge accounting
applied -0.3 -0.3
All derivatives are hedges according to YIT Group’s financial risk management policy, but hedge accounting. as
defined in IAS 39, is applied only on certain derivative contracts. Foreign exchange forward contracts are
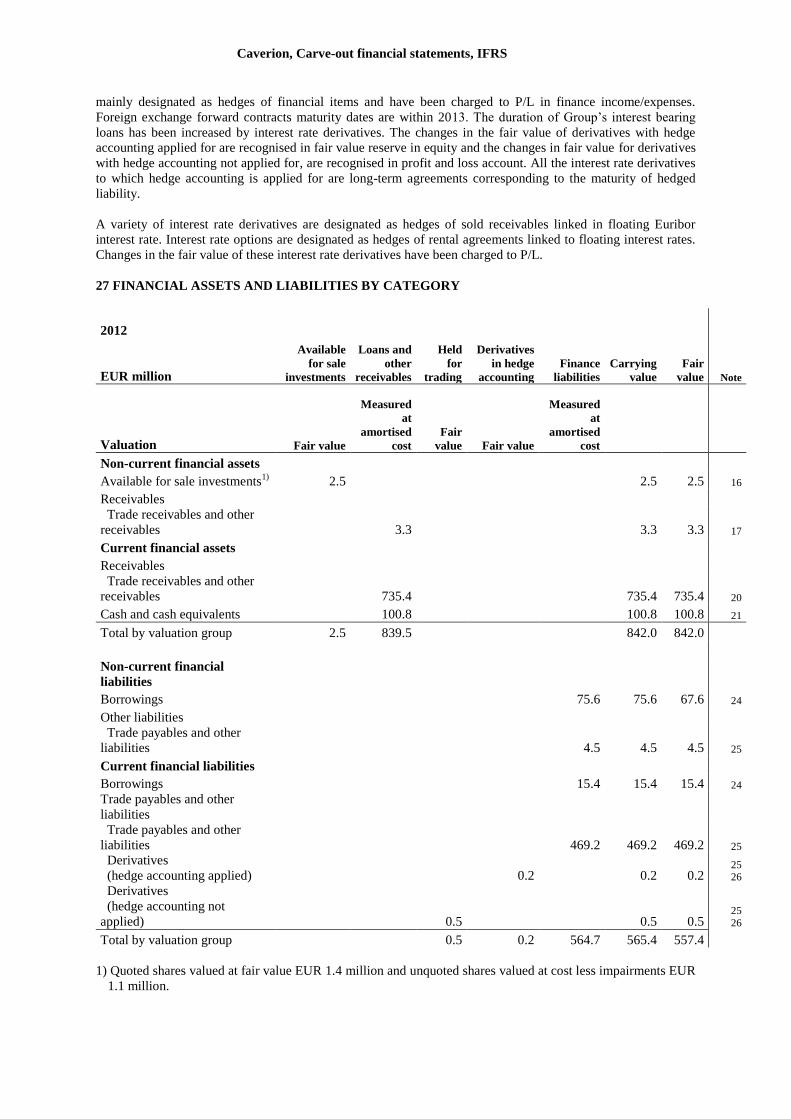
Caverion, Carve-out financial statements, IFRS
mainly designated as hedges of financial items and have been charged to P/L in finance income/expenses.
Foreign exchange forward contracts maturity dates are within 2013. The duration of Group’s interest bearing
loans has been increased by interest rate derivatives. The changes in the fair value of derivatives with hedge
accounting applied for are recognised in fair value reserve in equity and the changes in fair value for derivatives
with hedge accounting not applied for, are recognised in profit and loss account. All the interest rate derivatives
to which hedge accounting is applied for are long-term agreements corresponding to the maturity of hedged
liability.
A variety of interest rate derivatives are designated as hedges of sold receivables linked in floating Euribor
interest rate. Interest rate options are designated as hedges of rental agreements linked to floating interest rates.
Changes in the fair value of these interest rate derivatives have been charged to P/L.
27 FINANCIAL ASSETS AND LIABILITIES BY CATEGORY
2012
EUR million
Available
for sale
investments
Loans and
other
receivables
Held
for
trading
Derivatives
in hedge
accounting
Finance
liabilities
Carrying
value
Fair
value Note
Valuation Fair value
Measured
at
amortised
cost
Fair
value Fair value
Measured
at
amortised
cost
Non-current financial assets
Available for sale investments1)
2.5 2.5 2.5 16
Receivables
Trade receivables and other
receivables 3.3 3.3 3.3 17
Current financial assets
Receivables
Trade receivables and other
receivables 735.4 735.4 735.4 20
Cash and cash equivalents 100.8 100.8 100.8 21
Total by valuation group 2.5 839.5 842.0 842.0
Non-current financial
liabilities
Borrowings 75.6 75.6 67.6 24
Other liabilities
Trade payables and other
liabilities 4.5 4.5 4.5 25
Current financial liabilities
Borrowings 15.4 15.4 15.4 24
Trade payables and other
liabilities
Trade payables and other
liabilities 469.2 469.2 469.2 25
Derivatives
(hedge accounting applied) 0.2 0.2 0.2 25 26
Derivatives
(hedge accounting not
applied) 0.5 0.5 0.5 25
26
Total by valuation group 0.5 0.2 564.7 565.4 557.4
1) Quoted shares valued at fair value EUR 1.4 million and unquoted shares valued at cost less impairments EUR
1.1 million.
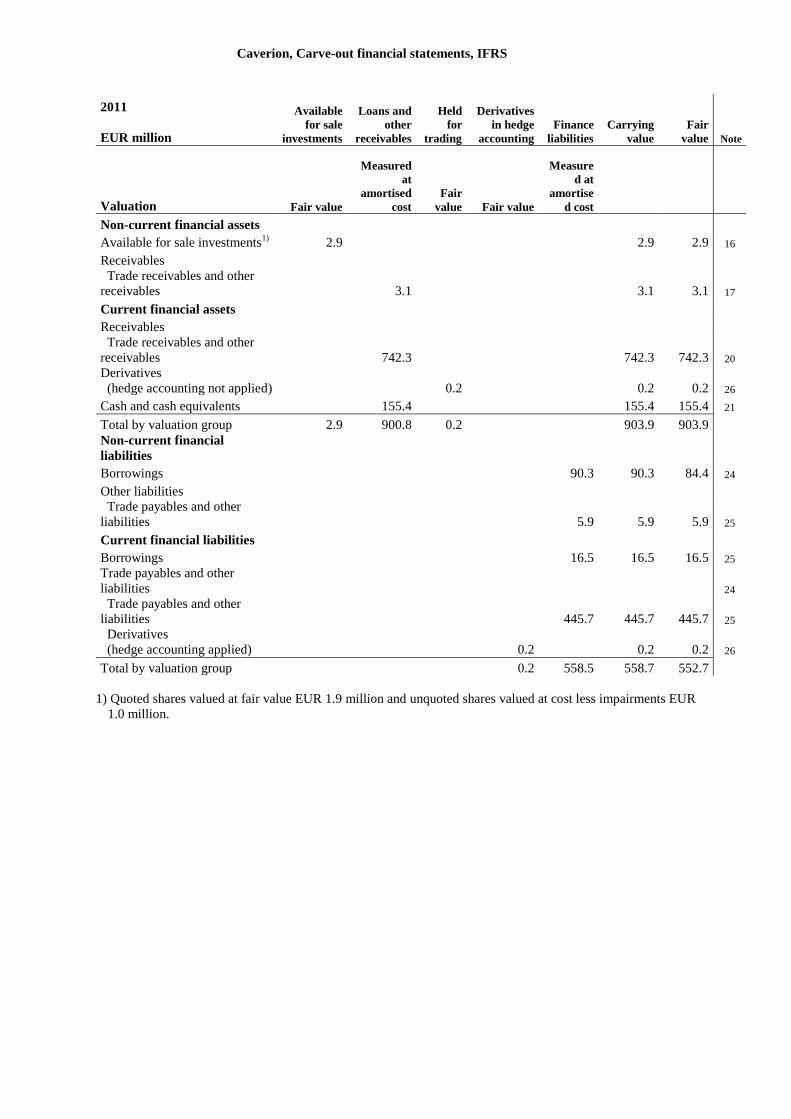
Caverion, Carve-out financial statements, IFRS
2011
EUR million
Available
for sale
investments
Loans and
other
receivables
Held
for
trading
Derivatives
in hedge
accounting
Finance
liabilities
Carrying
value
Fair
value Note
Valuation Fair value
Measured
at
amortised
cost
Fair
value Fair value
Measure
d at
amortise
d cost
Non-current financial assets
Available for sale investments1)
2.9 2.9 2.9 16
Receivables
Trade receivables and other
receivables 3.1 3.1 3.1 17
Current financial assets
Receivables
Trade receivables and other
receivables 742.3 742.3 742.3 20
Derivatives
(hedge accounting not applied) 0.2 0.2 0.2 26
Cash and cash equivalents 155.4 155.4 155.4 21
Total by valuation group 2.9 900.8 0.2 903.9 903.9
Non-current financial
liabilities
Borrowings 90.3 90.3 84.4 24
Other liabilities
Trade payables and other
liabilities 5.9 5.9 5.9 25
Current financial liabilities
Borrowings 16.5 16.5 16.5 25
Trade payables and other
liabilities 24
Trade payables and other
liabilities 445.7 445.7 445.7 25
Derivatives
(hedge accounting applied) 0.2 0.2 0.2 26
Total by valuation group 0.2 558.5 558.7 552.7
1) Quoted shares valued at fair value EUR 1.9 million and unquoted shares valued at cost less impairments EUR
1.0 million.
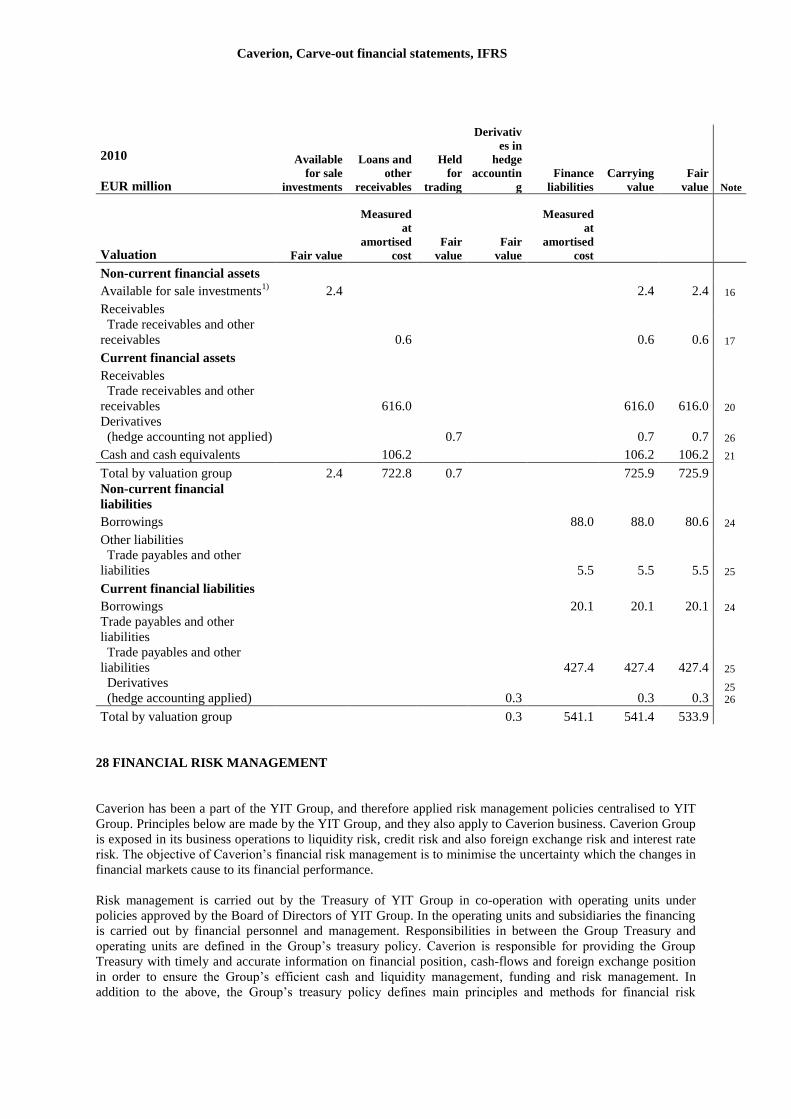
Caverion, Carve-out financial statements, IFRS
2010
EUR million
Available
for sale
investments
Loans and
other
receivables
Held
for
trading
Derivativ
es in
hedge
accountin
g
Finance
liabilities
Carrying
value
Fair
value Note
Valuation Fair value
Measured
at
amortised
cost
Fair
value
Fair
value
Measured
at
amortised
cost
Non-current financial assets
Available for sale investments1)
2.4 2.4 2.4 16
Receivables
Trade receivables and other
receivables 0.6 0.6 0.6 17
Current financial assets
Receivables
Trade receivables and other
receivables 616.0 616.0 616.0 20
Derivatives
(hedge accounting not applied) 0.7 0.7 0.7 26
Cash and cash equivalents 106.2 106.2 106.2 21
Total by valuation group 2.4 722.8 0.7 725.9 725.9
Non-current financial
liabilities
Borrowings 88.0 88.0 80.6 24
Other liabilities
Trade payables and other
liabilities 5.5 5.5 5.5 25
Current financial liabilities
Borrowings 20.1 20.1 20.1 24
Trade payables and other
liabilities
Trade payables and other
liabilities 427.4 427.4 427.4 25
Derivatives
(hedge accounting applied) 0.3 0.3 0.3 25 26
Total by valuation group 0.3 541.1 541.4 533.9
28 FINANCIAL RISK MANAGEMENT
Caverion has been a part of the YIT Group, and therefore applied risk management policies centralised to YIT
Group. Principles below are made by the YIT Group, and they also apply to Caverion business. Caverion Group
is exposed in its business operations to liquidity risk, credit risk and also foreign exchange risk and interest rate
risk. The objective of Caverion’s financial risk management is to minimise the uncertainty which the changes in
financial markets cause to its financial performance.
Risk management is carried out by the Treasury of YIT Group in co-operation with operating units under
policies approved by the Board of Directors of YIT Group. In the operating units and subsidiaries the financing
is carried out by financial personnel and management. Responsibilities in between the Group Treasury and
operating units are defined in the Group’s treasury policy. Caverion is responsible for providing the Group
Treasury with timely and accurate information on financial position, cash-flows and foreign exchange position
in order to ensure the Group’s efficient cash and liquidity management, funding and risk management. In
addition to the above, the Group’s treasury policy defines main principles and methods for financial risk
Caverion, Carve-out financial statements, IFRS
management, cash management and specific financing-related areas e.g. commercial guarantees, relationships
with financiers and customer financing.
Interest rate risk
Caverion’s financial liabilities EUR 91.0 million (EUR 106.8 million in 2011 and EUR 108.1 million in 2010)
consisted mainly of pension loans and liabilities of the YIT Group allocated to Caverion.
Caverion has interest bearing receivables in its cash and cash equivalents but otherwise its revenues and cash
flows from operating activities are mostly independent of changes in market interest rates.
Caverion’s exposure to cash flow interest rate risk arises mainly from current and non-current loans, receivables
sold to banks and financial institutions and related interest rate derivatives. A loan issued at floating interest
rates expose Caverion to cash flow interest rate risk, which is hedged by interest rate swaps. To manage the
interest rate risk, the Board of Directors of the YIT Group has defined a duration target of two years to non-
current loans and to related interest rate derivative hedges. The duration may deviate +/- 1.5 years at the
decision of Vice President, Group Treasurer of the YIT Group. In order to meet the duration target, part of the
loans at floating rates are converted to fixed rate using interest rate swaps.
Interest rate swaps are used to hedge the re-pricing risk of EUR 45.5 million (EUR 17.5 million in 2011 and
EUR 24.5 million in 2010) loan based on 6 month Euribor. Hedged cash flows will realise within three
subsequent years and hedge accounting is applied to cash flow interest rate risk (notes 26 and 27). Hedges have
been effective at the reporting date and changes in fair value of derivative are recognised in the hedging reserve
in OCI according to accounting policies.
Weighted average effective interest rate of the fixed rate loans was 1.938% in 2012 (3.259% in 2011 and
2.452% in 2010). The weighted average effective interest rate of the whole loan portfolio was 2.559% in 2012
(3.246% in 2011 and 3.166% in 2010). These numbers include the effect of interest rate derivatives. Interest rate
derivatives increase the average effective interest rate of the loan portfolio by 0.03 percentage points in 2012
(0.10 percentage points increase in 2011 and 0.27 percentage points increase in 2010).
In addition to meet the duration target the YIT Group management monitors the effect of the possible change in
interest rate level on the YIT Group’s financial result on quarterly basis. The target of the monitoring is the
effect of one percentage point change in interest rate level on yearly net interest expenses. The effect on
Caverion’s yearly net interest expenses would have been EUR 0.8 million in 2012 (EUR 1.1 million in 2011 and
EUR 1.1 million in 2010) net of tax.
In addition to interest bearing net debt, the foreign exchange forward contracts associated with the intra-group
loans expose the Group’s result to interest rate risk. Caverion’s external loans are mainly dominated in euro, but
the subsidiaries are financed in their functional currency. Caverion is exposed to the interest rate risk of the
different functional currencies in the Group when it hedges the foreign exchange risk arising from the foreign
currency denominated loans granted to subsidiaries using foreign exchange forward contracts. The most
significant currency of the intra-group loans of Caverion Group is Swedish Crown. By hedging the receivables
denominated in foreign currencies, the parent company has to pay the interest rate difference between foreign
currencies and euro.
A change of one percentage point in interest rates at the balance sheet date would have affected the consolidated
balance sheet by EUR 0.6 million in 2012 (EUR 0.4 million in 2011 and EUR 0.7 million in 2010) net of tax.
The effect would have changed the fair values of the interest rate derivatives in hedge accounting, in the fair
value reserve in equity.
Credit and counterparty risk
Caverion’s credit risk is related to clients with open balances or with long term agreements and to the
counterparties to investment products and derivative agreements. The Group Treasury of YIT has been
responsible for the counterparty risk of the derivative instruments and investment products. Operating units are
responsible for the credit risk related to operating items, such as trade receivables. Customers and the nature of
the agreements differ in between Caverion’s segments hence customer specific credit risk management is
performed in finance departments of each segments in cooperation with the operating units.
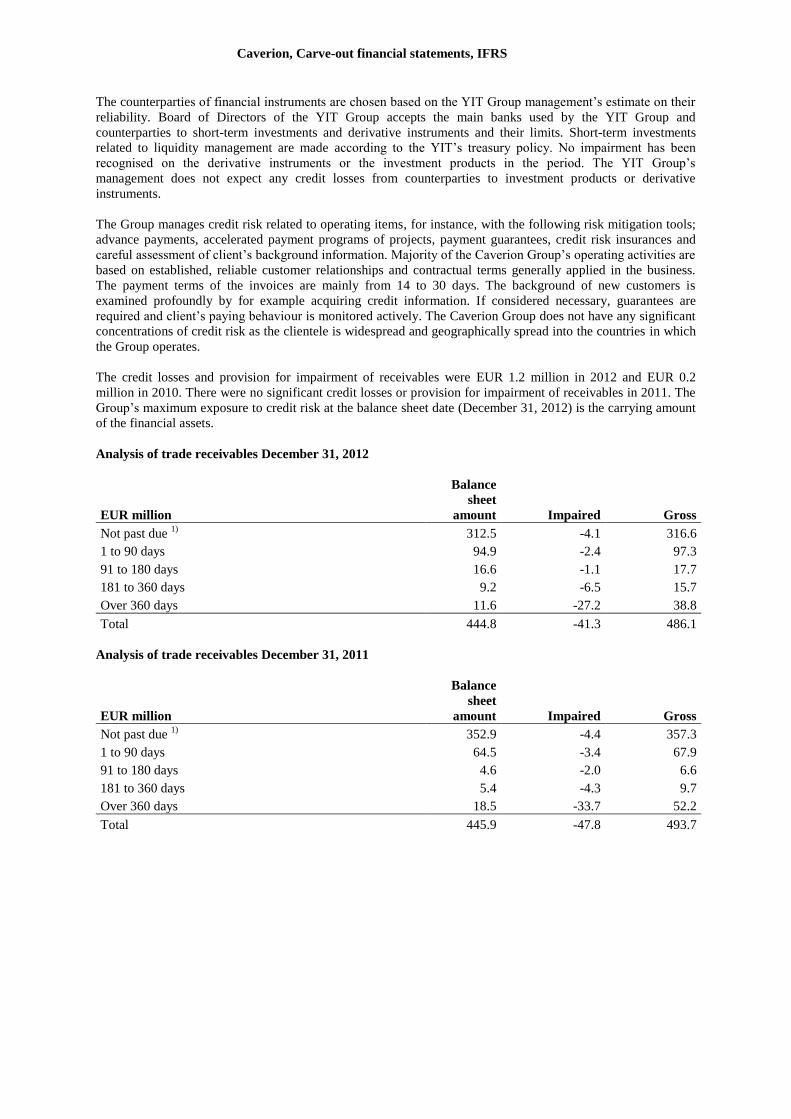
Caverion, Carve-out financial statements, IFRS
The counterparties of financial instruments are chosen based on the YIT Group management’s estimate on their
reliability. Board of Directors of the YIT Group accepts the main banks used by the YIT Group and
counterparties to short-term investments and derivative instruments and their limits. Short-term investments
related to liquidity management are made according to the YIT’s treasury policy. No impairment has been
recognised on the derivative instruments or the investment products in the period. The YIT Group’s
management does not expect any credit losses from counterparties to investment products or derivative
instruments.
The Group manages credit risk related to operating items, for instance, with the following risk mitigation tools;
advance payments, accelerated payment programs of projects, payment guarantees, credit risk insurances and
careful assessment of client’s background information. Majority of the Caverion Group’s operating activities are
based on established, reliable customer relationships and contractual terms generally applied in the business.
The payment terms of the invoices are mainly from 14 to 30 days. The background of new customers is
examined profoundly by for example acquiring credit information. If considered necessary, guarantees are
required and client’s paying behaviour is monitored actively. The Caverion Group does not have any significant
concentrations of credit risk as the clientele is widespread and geographically spread into the countries in which
the Group operates.
The credit losses and provision for impairment of receivables were EUR 1.2 million in 2012 and EUR 0.2
million in 2010. There were no significant credit losses or provision for impairment of receivables in 2011. The
Group’s maximum exposure to credit risk at the balance sheet date (December 31, 2012) is the carrying amount
of the financial assets.
Analysis of trade receivables December 31, 2012
EUR million
Balance
sheet
amount Impaired Gross
Not past due 1)
312.5 -4.1 316.6
1 to 90 days 94.9 -2.4 97.3
91 to 180 days 16.6 -1.1 17.7
181 to 360 days 9.2 -6.5 15.7
Over 360 days 11.6 -27.2 38.8
Total 444.8 -41.3 486.1
Analysis of trade receivables December 31, 2011
EUR million
Balance
sheet
amount Impaired Gross
Not past due 1)
352.9 -4.4 357.3
1 to 90 days 64.5 -3.4 67.9
91 to 180 days 4.6 -2.0 6.6
181 to 360 days 5.4 -4.3 9.7
Over 360 days 18.5 -33.7 52.2
Total 445.9 -47.8 493.7
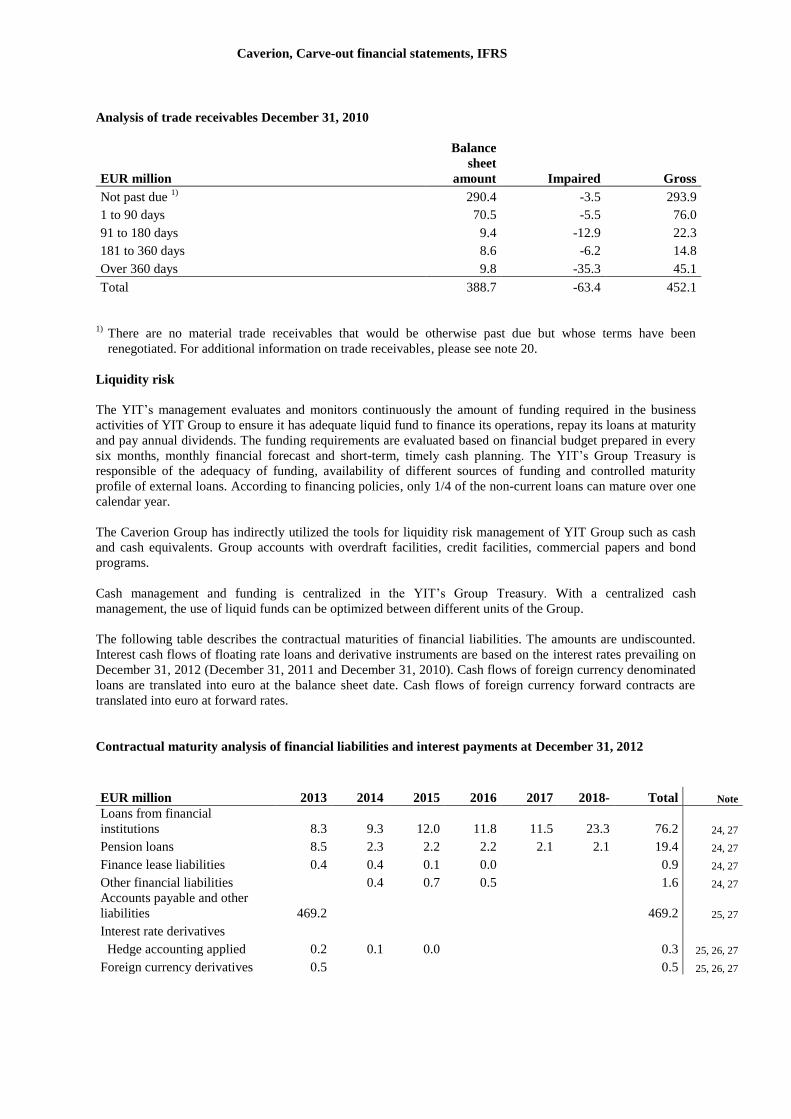
Caverion, Carve-out financial statements, IFRS
Analysis of trade receivables December 31, 2010
EUR million
Balance
sheet
amount Impaired Gross
Not past due 1)
290.4 -3.5 293.9
1 to 90 days 70.5 -5.5 76.0
91 to 180 days 9.4 -12.9 22.3
181 to 360 days 8.6 -6.2 14.8
Over 360 days 9.8 -35.3 45.1
Total 388.7 -63.4 452.1
1)
There are no material trade receivables that would be otherwise past due but whose terms have been
renegotiated. For additional information on trade receivables, please see note 20.
Liquidity risk
The YIT’s management evaluates and monitors continuously the amount of funding required in the business
activities of YIT Group to ensure it has adequate liquid fund to finance its operations, repay its loans at maturity
and pay annual dividends. The funding requirements are evaluated based on financial budget prepared in every
six months, monthly financial forecast and short-term, timely cash planning. The YIT’s Group Treasury is
responsible of the adequacy of funding, availability of different sources of funding and controlled maturity
profile of external loans. According to financing policies, only 1/4 of the non-current loans can mature over one
calendar year.
The Caverion Group has indirectly utilized the tools for liquidity risk management of YIT Group such as cash
and cash equivalents. Group accounts with overdraft facilities, credit facilities, commercial papers and bond
programs.
Cash management and funding is centralized in the YIT’s Group Treasury. With a centralized cash
management, the use of liquid funds can be optimized between different units of the Group.
The following table describes the contractual maturities of financial liabilities. The amounts are undiscounted.
Interest cash flows of floating rate loans and derivative instruments are based on the interest rates prevailing on
December 31, 2012 (December 31, 2011 and December 31, 2010). Cash flows of foreign currency denominated
loans are translated into euro at the balance sheet date. Cash flows of foreign currency forward contracts are
translated into euro at forward rates.
Contractual maturity analysis of financial liabilities and interest payments at December 31, 2012
EUR million 2013 2014 2015 2016 2017 2018- Total Note
Loans from financial
institutions 8.3 9.3 12.0 11.8 11.5 23.3 76.2 24, 27
Pension loans 8.5 2.3 2.2 2.2 2.1 2.1 19.4 24, 27
Finance lease liabilities 0.4 0.4 0.1 0.0 0.9 24, 27
Other financial liabilities 0.4 0.7 0.5 1.6 24, 27
Accounts payable and other
liabilities 469.2 469.2 25, 27
Interest rate derivatives
Hedge accounting applied 0.2 0.1 0.0 0.3 25, 26, 27
Foreign currency derivatives 0.5 0.5 25, 26, 27
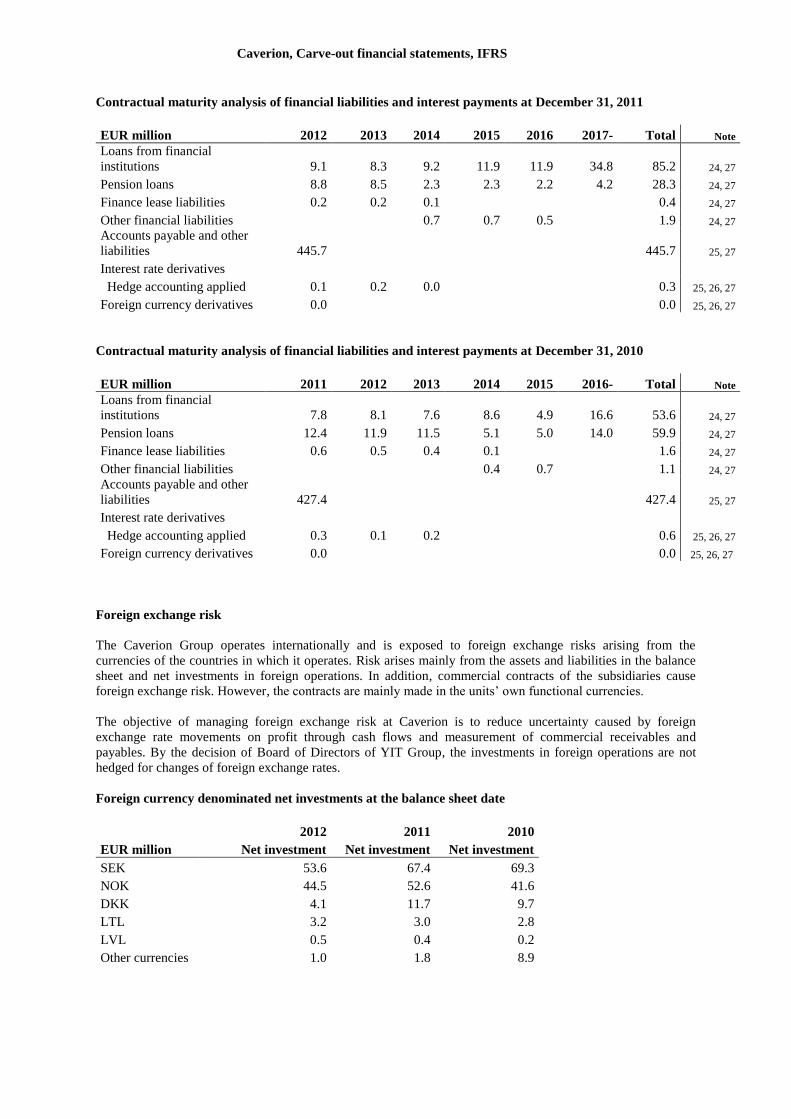
Caverion, Carve-out financial statements, IFRS
Contractual maturity analysis of financial liabilities and interest payments at December 31, 2011
EUR million 2012 2013 2014 2015 2016 2017- Total Note
Loans from financial
institutions 9.1 8.3 9.2 11.9 11.9 34.8 85.2 24, 27
Pension loans 8.8 8.5 2.3 2.3 2.2 4.2 28.3 24, 27
Finance lease liabilities 0.2 0.2 0.1 0.4 24, 27
Other financial liabilities 0.7 0.7 0.5 1.9 24, 27
Accounts payable and other
liabilities 445.7 445.7 25, 27
Interest rate derivatives
Hedge accounting applied 0.1 0.2 0.0 0.3 25, 26, 27
Foreign currency derivatives 0.0 0.0 25, 26, 27
Contractual maturity analysis of financial liabilities and interest payments at December 31, 2010
EUR million 2011 2012 2013 2014 2015 2016- Total Note
Loans from financial
institutions 7.8 8.1 7.6 8.6 4.9 16.6 53.6 24, 27
Pension loans 12.4 11.9 11.5 5.1 5.0 14.0 59.9 24, 27
Finance lease liabilities 0.6 0.5 0.4 0.1 1.6 24, 27
Other financial liabilities 0.4 0.7 1.1 24, 27
Accounts payable and other
liabilities 427.4 427.4 25, 27
Interest rate derivatives
Hedge accounting applied 0.3 0.1 0.2 0.6 25, 26, 27
Foreign currency derivatives 0.0 0.0 25, 26, 27
Foreign exchange risk
The Caverion Group operates internationally and is exposed to foreign exchange risks arising from the
currencies of the countries in which it operates. Risk arises mainly from the assets and liabilities in the balance
sheet and net investments in foreign operations. In addition, commercial contracts of the subsidiaries cause
foreign exchange risk. However, the contracts are mainly made in the units’ own functional currencies.
The objective of managing foreign exchange risk at Caverion is to reduce uncertainty caused by foreign
exchange rate movements on profit through cash flows and measurement of commercial receivables and
payables. By the decision of Board of Directors of YIT Group, the investments in foreign operations are not
hedged for changes of foreign exchange rates.
Foreign currency denominated net investments at the balance sheet date
2012 2011 2010
EUR million Net investment Net investment Net investment
SEK 53.6 67.4 69.3
NOK 44.5 52.6 41.6
DKK 4.1 11.7 9.7
LTL 3.2 3.0 2.8
LVL 0.5 0.4 0.2
Other currencies 1.0 1.8 8.9
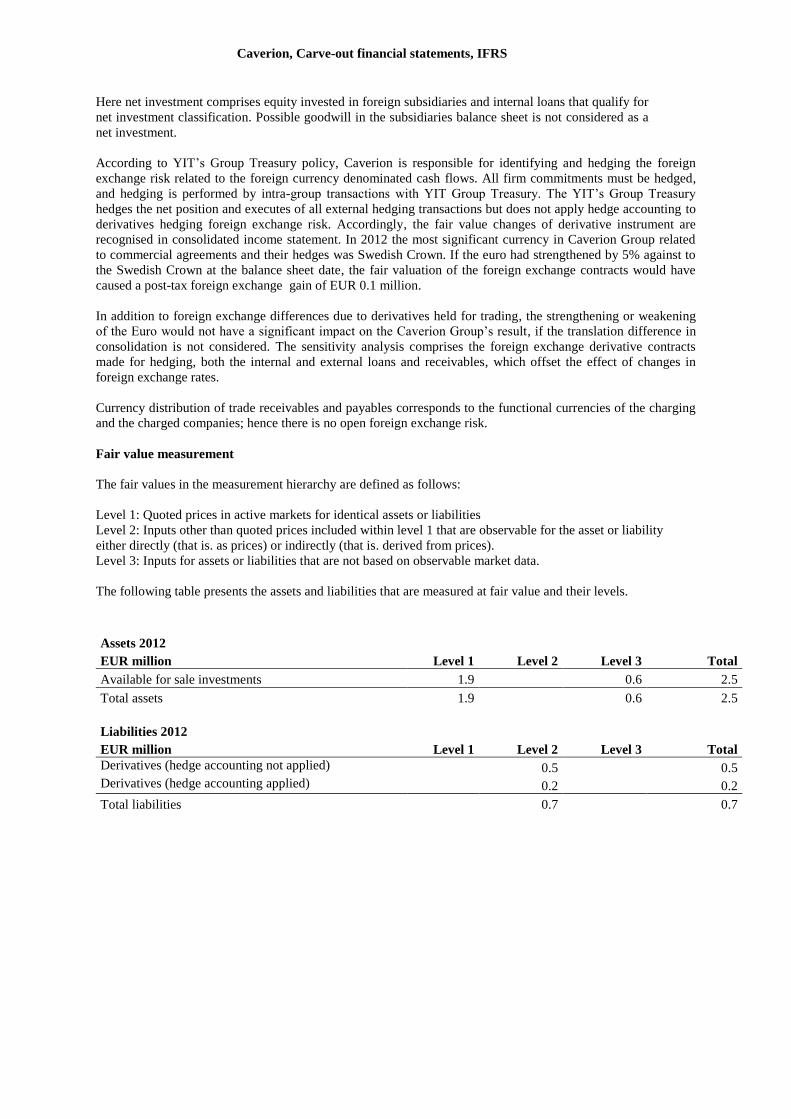
Caverion, Carve-out financial statements, IFRS
Here net investment comprises equity invested in foreign subsidiaries and internal loans that qualify for
net investment classification. Possible goodwill in the subsidiaries balance sheet is not considered as a
net investment.
According to YIT’s Group Treasury policy, Caverion is responsible for identifying and hedging the foreign
exchange risk related to the foreign currency denominated cash flows. All firm commitments must be hedged,
and hedging is performed by intra-group transactions with YIT Group Treasury. The YIT’s Group Treasury
hedges the net position and executes of all external hedging transactions but does not apply hedge accounting to
derivatives hedging foreign exchange risk. Accordingly, the fair value changes of derivative instrument are
recognised in consolidated income statement. In 2012 the most significant currency in Caverion Group related
to commercial agreements and their hedges was Swedish Crown. If the euro had strengthened by 5% against to
the Swedish Crown at the balance sheet date, the fair valuation of the foreign exchange contracts would have
caused a post-tax foreign exchange gain of EUR 0.1 million.
In addition to foreign exchange differences due to derivatives held for trading, the strengthening or weakening
of the Euro would not have a significant impact on the Caverion Group’s result, if the translation difference in
consolidation is not considered. The sensitivity analysis comprises the foreign exchange derivative contracts
made for hedging, both the internal and external loans and receivables, which offset the effect of changes in
foreign exchange rates.
Currency distribution of trade receivables and payables corresponds to the functional currencies of the charging
and the charged companies; hence there is no open foreign exchange risk.
Fair value measurement
The fair values in the measurement hierarchy are defined as follows:
Level 1: Quoted prices in active markets for identical assets or liabilities
Level 2: Inputs other than quoted prices included within level 1 that are observable for the asset or liability
either directly (that is. as prices) or indirectly (that is. derived from prices).
Level 3: Inputs for assets or liabilities that are not based on observable market data.
The following table presents the assets and liabilities that are measured at fair value and their levels.
Assets 2012
EUR million Level 1 Level 2 Level 3 Total
Available for sale investments 1.9 0.6 2.5
Total assets 1.9 0.6 2.5
Liabilities 2012
EUR million Level 1 Level 2 Level 3 Total
Derivatives (hedge accounting not applied) 0.5 0.5
Derivatives (hedge accounting applied) 0.2 0.2
Total liabilities 0.7 0.7
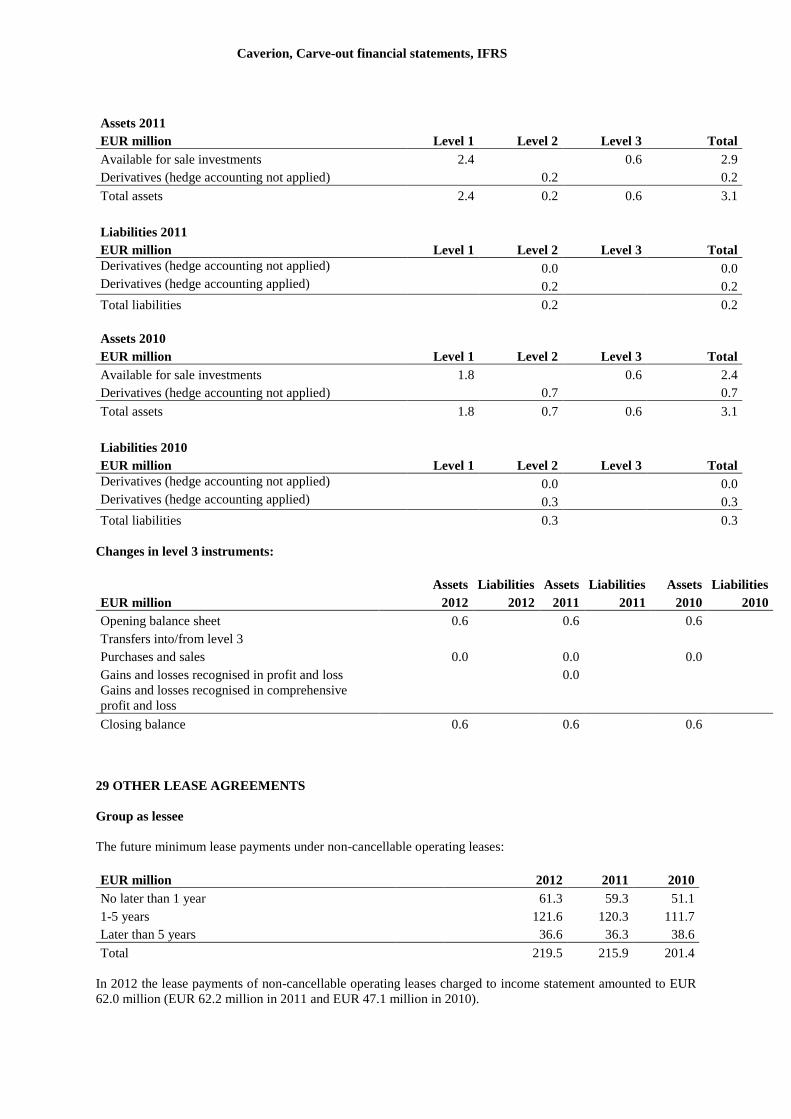
Caverion, Carve-out financial statements, IFRS
Assets 2011
EUR million Level 1 Level 2 Level 3 Total
Available for sale investments 2.4 0.6 2.9
Derivatives (hedge accounting not applied) 0.2 0.2
Total assets 2.4 0.2 0.6 3.1
Liabilities 2011
EUR million Level 1 Level 2 Level 3 Total
Derivatives (hedge accounting not applied) 0.0 0.0
Derivatives (hedge accounting applied) 0.2 0.2
Total liabilities 0.2 0.2
Assets 2010
EUR million Level 1 Level 2 Level 3 Total
Available for sale investments 1.8 0.6 2.4
Derivatives (hedge accounting not applied) 0.7 0.7
Total assets 1.8 0.7 0.6 3.1
Liabilities 2010
EUR million Level 1 Level 2 Level 3 Total
Derivatives (hedge accounting not applied) 0.0 0.0
Derivatives (hedge accounting applied) 0.3 0.3
Total liabilities 0.3 0.3
Changes in level 3 instruments:
Assets Liabilities Assets Liabilities Assets Liabilities
EUR million 2012 2012 2011 2011 2010 2010
Opening balance sheet 0.6 0.6 0.6
Transfers into/from level 3
Purchases and sales 0.0 0.0 0.0
Gains and losses recognised in profit and loss 0.0
Gains and losses recognised in comprehensive
profit and loss
Closing balance 0.6 0.6 0.6
29 OTHER LEASE AGREEMENTS
Group as lessee
The future minimum lease payments under non-cancellable operating leases:
EUR million 2012 2011 2010
No later than 1 year 61.3 59.3 51.1
1-5 years 121.6 120.3 111.7
Later than 5 years 36.6 36.3 38.6
Total 219.5 215.9 201.4
In 2012 the lease payments of non-cancellable operating leases charged to income statement amounted to EUR
62.0 million (EUR 62.2 million in 2011 and EUR 47.1 million in 2010).
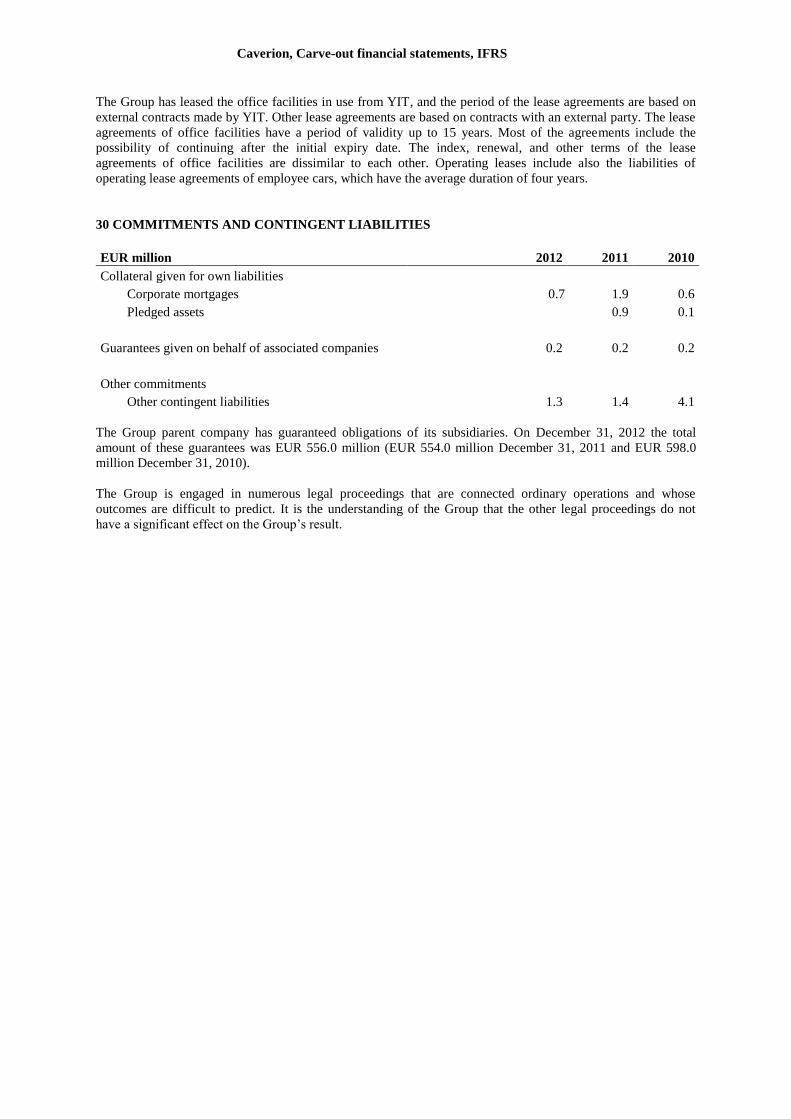
Caverion, Carve-out financial statements, IFRS
The Group has leased the office facilities in use from YIT, and the period of the lease agreements are based on
external contracts made by YIT. Other lease agreements are based on contracts with an external party. The lease
agreements of office facilities have a period of validity up to 15 years. Most of the agreements include the
possibility of continuing after the initial expiry date. The index, renewal, and other terms of the lease
agreements of office facilities are dissimilar to each other. Operating leases include also the liabilities of
operating lease agreements of employee cars, which have the average duration of four years.
30 COMMITMENTS AND CONTINGENT LIABILITIES
EUR million 2012 2011 2010
Collateral given for own liabilities
Corporate mortgages 0.7 1.9 0.6
Pledged assets 0.9 0.1
Guarantees given on behalf of associated companies 0.2 0.2 0.2
Other commitments
Other contingent liabilities 1.3 1.4 4.1
The Group parent company has guaranteed obligations of its subsidiaries. On December 31, 2012 the total
amount of these guarantees was EUR 556.0 million (EUR 554.0 million December 31, 2011 and EUR 598.0
million December 31, 2010).
The Group is engaged in numerous legal proceedings that are connected ordinary operations and whose
outcomes are difficult to predict. It is the understanding of the Group that the other legal proceedings do not
have a significant effect on the Group’s result.
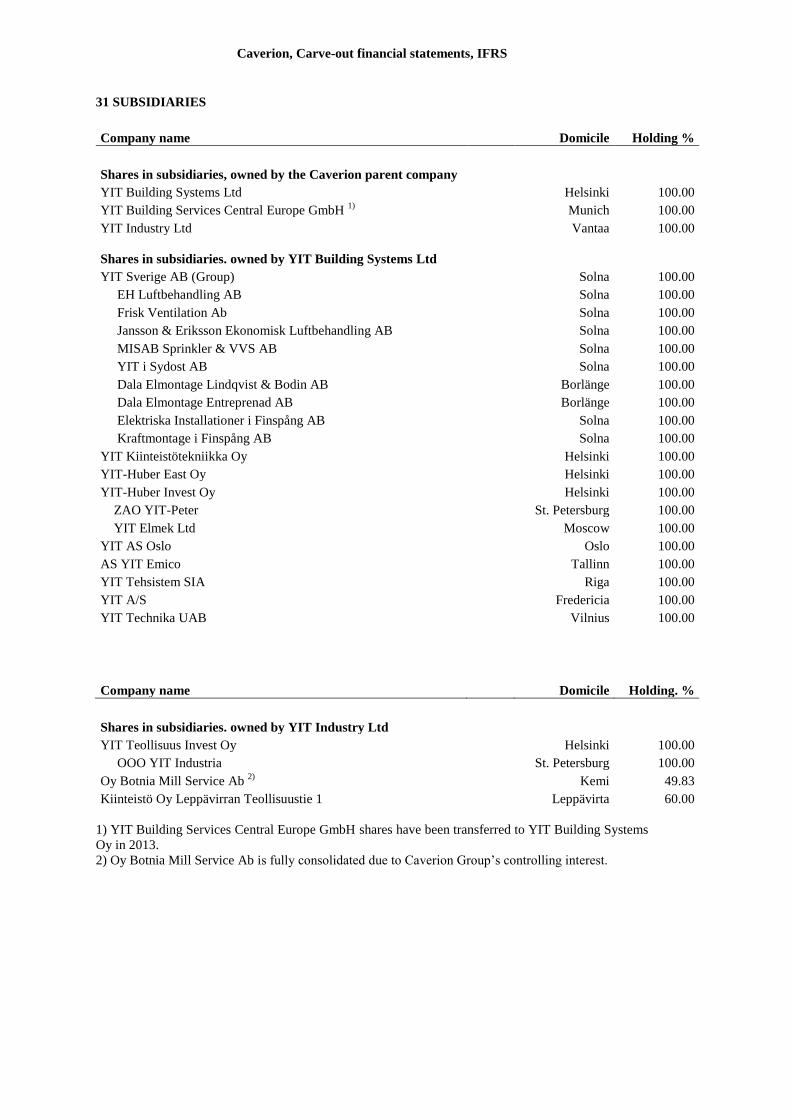
Caverion, Carve-out financial statements, IFRS
31 SUBSIDIARIES
Company name Domicile Holding %
Shares in subsidiaries, owned by the Caverion parent company
YIT Building Systems Ltd Helsinki 100.00
YIT Building Services Central Europe GmbH 1)
Munich 100.00
YIT Industry Ltd Vantaa 100.00
Shares in subsidiaries. owned by YIT Building Systems Ltd
YIT Sverige AB (Group) Solna 100.00
EH Luftbehandling AB Solna 100.00
Frisk Ventilation Ab Solna 100.00
Jansson & Eriksson Ekonomisk Luftbehandling AB Solna 100.00
MISAB Sprinkler & VVS AB Solna 100.00
YIT i Sydost AB Solna 100.00
Dala Elmontage Lindqvist & Bodin AB Borlänge 100.00
Dala Elmontage Entreprenad AB Borlänge 100.00
Elektriska Installationer i Finspång AB Solna 100.00
Kraftmontage i Finspång AB Solna 100.00
YIT Kiinteistötekniikka Oy Helsinki 100.00
YIT-Huber East Oy Helsinki 100.00
YIT-Huber Invest Oy Helsinki 100.00
ZAO YIT-Peter St. Petersburg 100.00
YIT Elmek Ltd Moscow 100.00
YIT AS Oslo Oslo 100.00
AS YIT Emico Tallinn 100.00
YIT Tehsistem SIA Riga 100.00
YIT A/S Fredericia 100.00
YIT Technika UAB Vilnius 100.00
Company name Domicile Holding. %
Shares in subsidiaries. owned by YIT Industry Ltd
YIT Teollisuus Invest Oy Helsinki 100.00
OOO YIT Industria St. Petersburg 100.00
Oy Botnia Mill Service Ab 2)
Kemi 49.83
Kiinteistö Oy Leppävirran Teollisuustie 1 Leppävirta 60.00
1) YIT Building Services Central Europe GmbH shares have been transferred to YIT Building Systems
Oy in 2013.
2) Oy Botnia Mill Service Ab is fully consolidated due to Caverion Group’s controlling interest.
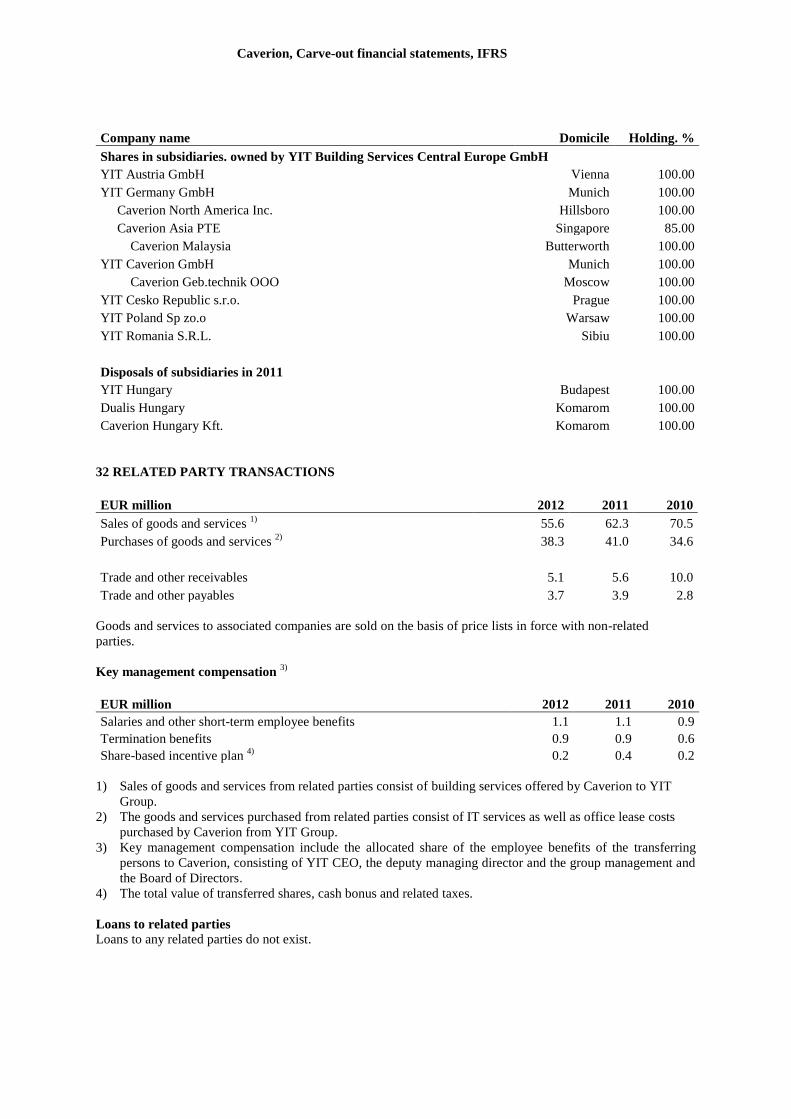
Caverion, Carve-out financial statements, IFRS
Company name Domicile Holding. %
Shares in subsidiaries. owned by YIT Building Services Central Europe GmbH
YIT Austria GmbH Vienna 100.00
YIT Germany GmbH Munich 100.00
Caverion North America Inc. Hillsboro 100.00
Caverion Asia PTE Singapore 85.00
Caverion Malaysia Butterworth 100.00
YIT Caverion GmbH Munich 100.00
Caverion Geb.technik OOO Moscow 100.00
YIT Cesko Republic s.r.o. Prague 100.00
YIT Poland Sp zo.o Warsaw 100.00
YIT Romania S.R.L. Sibiu 100.00
Disposals of subsidiaries in 2011
YIT Hungary Budapest 100.00
Dualis Hungary Komarom 100.00
Caverion Hungary Kft. Komarom 100.00
32 RELATED PARTY TRANSACTIONS
EUR million 2012 2011 2010
Sales of goods and services 1)
55.6 62.3 70.5
Purchases of goods and services 2)
38.3 41.0 34.6
Trade and other receivables 5.1 5.6 10.0
Trade and other payables 3.7 3.9 2.8
Goods and services to associated companies are sold on the basis of price lists in force with non-related
parties.
Key management compensation 3)
EUR million 2012 2011 2010
Salaries and other short-term employee benefits 1.1 1.1 0.9
Termination benefits 0.9 0.9 0.6
Share-based incentive plan 4)
0.2 0.4 0.2
1) Sales of goods and services from related parties consist of building services offered by Caverion to YIT
Group.
2) The goods and services purchased from related parties consist of IT services as well as office lease costs
purchased by Caverion from YIT Group.
3) Key management compensation include the allocated share of the employee benefits of the transferring
persons to Caverion, consisting of YIT CEO, the deputy managing director and the group management and
the Board of Directors. 4) The total value of transferred shares, cash bonus and related taxes.
Loans to related parties
Loans to any related parties do not exist.
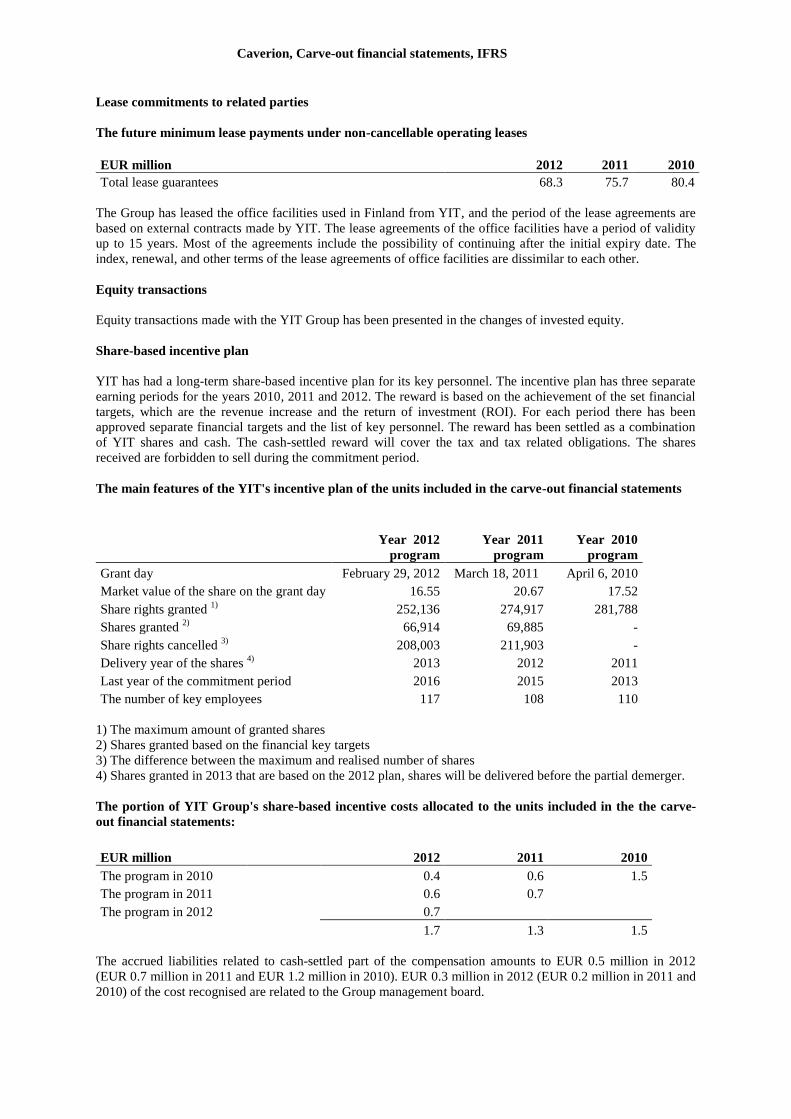
Caverion, Carve-out financial statements, IFRS
Lease commitments to related parties
The future minimum lease payments under non-cancellable operating leases
EUR million 2012 2011 2010
Total lease guarantees 68.3 75.7 80.4
The Group has leased the office facilities used in Finland from YIT, and the period of the lease agreements are
based on external contracts made by YIT. The lease agreements of the office facilities have a period of validity
up to 15 years. Most of the agreements include the possibility of continuing after the initial expiry date. The
index, renewal, and other terms of the lease agreements of office facilities are dissimilar to each other.
Equity transactions
Equity transactions made with the YIT Group has been presented in the changes of invested equity.
Share-based incentive plan
YIT has had a long-term share-based incentive plan for its key personnel. The incentive plan has three separate
earning periods for the years 2010, 2011 and 2012. The reward is based on the achievement of the set financial
targets, which are the revenue increase and the return of investment (ROI). For each period there has been
approved separate financial targets and the list of key personnel. The reward has been settled as a combination
of YIT shares and cash. The cash-settled reward will cover the tax and tax related obligations. The shares
received are forbidden to sell during the commitment period.
The main features of the YIT's incentive plan of the units included in the carve-out financial statements
Year 2012
program
Year 2011
program
Year 2010
program
Grant day February 29, 2012 March 18, 2011 April 6, 2010
Market value of the share on the grant day 16.55 20.67 17.52
Share rights granted 1)
252,136 274,917 281,788
Shares granted 2)
66,914 69,885 -
Share rights cancelled 3)
208,003 211,903 -
Delivery year of the shares 4)
2013 2012 2011
Last year of the commitment period 2016 2015 2013
The number of key employees 117 108 110
1) The maximum amount of granted shares
2) Shares granted based on the financial key targets
3) The difference between the maximum and realised number of shares
4) Shares granted in 2013 that are based on the 2012 plan, shares will be delivered before the partial demerger.
The portion of YIT Group's share-based incentive costs allocated to the units included in the the carve-
out financial statements:
EUR million
2012 2011 2010
The program in 2010
0.4 0.6 1.5
The program in 2011
0.6 0.7
The program in 2012
0.7
1.7 1.3 1.5
The accrued liabilities related to cash-settled part of the compensation amounts to EUR 0.5 million in 2012
(EUR 0.7 million in 2011 and EUR 1.2 million in 2010). EUR 0.3 million in 2012 (EUR 0.2 million in 2011 and
2010) of the cost recognised are related to the Group management board.
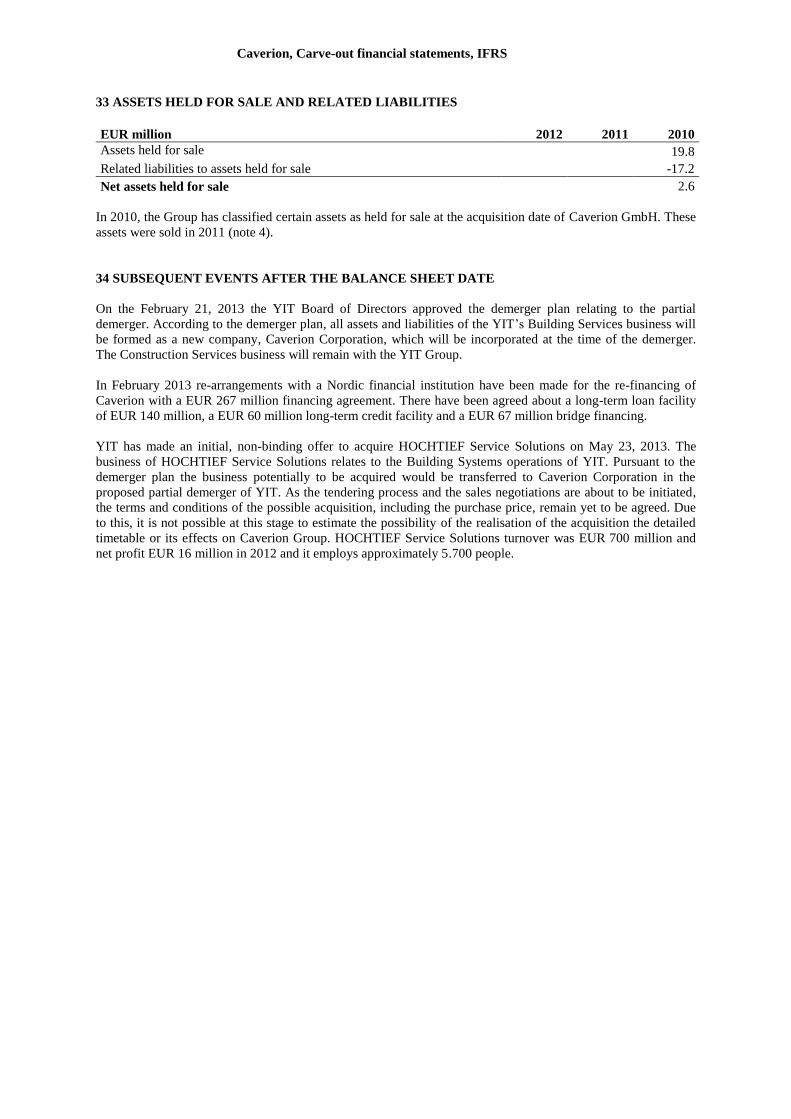
Caverion, Carve-out financial statements, IFRS
33 ASSETS HELD FOR SALE AND RELATED LIABILITIES
EUR million 2012 2011 2010
Assets held for sale
19.8
Related liabilities to assets held for sale
-17.2
Net assets held for sale 2.6
In 2010, the Group has classified certain assets as held for sale at the acquisition date of Caverion GmbH. These
assets were sold in 2011 (note 4).
34 SUBSEQUENT EVENTS AFTER THE BALANCE SHEET DATE
On the February 21, 2013 the YIT Board of Directors approved the demerger plan relating to the partial
demerger. According to the demerger plan, all assets and liabilities of the YIT’s Building Services business will
be formed as a new company, Caverion Corporation, which will be incorporated at the time of the demerger.
The Construction Services business will remain with the YIT Group.
In February 2013 re-arrangements with a Nordic financial institution have been made for the re-financing of
Caverion with a EUR 267 million financing agreement. There have been agreed about a long-term loan facility
of EUR 140 million, a EUR 60 million long-term credit facility and a EUR 67 million bridge financing.
YIT has made an initial, non-binding offer to acquire HOCHTIEF Service Solutions on May 23, 2013. The
business of HOCHTIEF Service Solutions relates to the Building Systems operations of YIT. Pursuant to the
demerger plan the business potentially to be acquired would be transferred to Caverion Corporation in the
proposed partial demerger of YIT. As the tendering process and the sales negotiations are about to be initiated,
the terms and conditions of the possible acquisition, including the purchase price, remain yet to be agreed. Due
to this, it is not possible at this stage to estimate the possibility of the realisation of the acquisition the detailed
timetable or its effects on Caverion Group. HOCHTIEF Service Solutions turnover was EUR 700 million and
net profit EUR 16 million in 2012 and it employs approximately 5.700 people.
Caverion, Carve-out financial statements, IFRS
Signatures of the Caverion Group carve-out Financial Statements for the
year ended December 31, 2012, 2011 and 2010
Helsinki June 3, 2013
Henrik Ehrnrooth Reino Hanhinen
Chairman Vice chairman
Kim Gran Satu Huber
Erkki Järvinen Ari Lehtoranta
Michael Rosenlew
Juhani Pitkäkoski
President and CEO