case-based study on biomass combustion power generation in...
TRANSCRIPT

Case-based study on Biomass combustion power generation in China Master Thesis, Industrial Ecology Master Program
LIU FEI
Department of Energy and Environment Division of Energy Technology CHALMERS UNIVERSITY OF TECHNOLOGY Göteborg, Sweden, 2012 Report No. T2012-377

REPORT NO. T2012-377
Case-based study on Biomass combustion power generation in China
Master‘s Thesis within the Industrial Ecology master programme
LIU FEI
Supervisor & Examiner
Erik Ahlgren
Department of Energy and Environment Division of Energy Technology
CHALMERS UNIVERSITY OF TECHNOLOGY Göteborg, Sweden 2012

Case-based study on Biomass combustion power generation in China
Master‘s Thesis within the Industrial Ecology programme
LIU FEI © LIU FEI 2012 Technical report no T2012-377 Department of Energy and Environment Division of Energy Technology Chalmers University of Technology SE-412 96 Göteborg Sweden Telephone: + 46 (0)31-772 1000 Printed by Chalmers Reproservice Göteborg, Sweden 2013

I
Case-based study on Biomass combustion power generation in China LIU FEI Department of Energy and Environment Chalmers University of Technology
Abstract
China is regarded as world's biggest energy consumer. The continuously increased energy demand and use of fossil fuels has resulted in many environmental consequences, especially air pollutions and CO2 emission, which is key factor of global concern about climate change. China has always make efforts on promoting the development of renewable energy to take up the challenge of CO2 emission reduction. At the same time, China, as a large agricultural country as well, is abundant in biomass resources. As a renewable energy, biomass power generation has a rapid growth in past a few years in China. Many articles and reports study on the general situation of renewable energy or biomass utilization. Some conclusions are susceptible, since some arguments are conflicting with each other. A further investigation is necessary to know this industry at closer range. The aim of this project work is to investigate current situation of biomass direct combustion power generation in China. The study is case-based studies, which are often called bottom-up studies. The main results and conclusions come from comparison of projects visited during field study. Besides, general knowledge and analysis about biomass power industry used data from multiple sources including statistical reports, literature, regulations and policies. Most data is first-hand and untreated to make sure the reliability of result and conclusion. Through the analysis of the plant parameters, economy, system and related policies, currently the main obstacle for efficient application of biomass power generation is fuel source. To control fuel source is significant to run successful business. Policies provide the strong incentives to invest biomass power generation projects. The findings not only help to understand the current status of the industry, but also provide valuable experience to achieve a better future development Key words: Biomass power, Boiler, China, Renewable energy, Field study

II
Table of content
Abstract I Abbreviation IV List of tables IV List of figures V Preface VI 1 Introduction 1
1.1 Aim 2 1.2 Delimitations 2 1.3 Limitations 3
2 Background 4 2.1 Biomass 4
2.1.1 Biomass resource in China 4 2.1.2 Utilization of biomass in energy sector 6 2.1.3 Combustion property of biomass 7
2.2 Power production process 9 2.2.1 Boilers 10 2.2.2 Steam turbine 10
2.3 National Policies 13 2.4 Clean development mechanism 14
3 Method 15 3.1 Structure of methods 15 3.2 Data collection 15 3.3 Field study 15 3.4 Analytical methods 16
3.3.1 Economic analysis 17 3.3.2 Input data 17
4 Result and analysis 19 4.1 China’s biomass power industry 19
4.1.1 Specific investment cost 20 4.1.2 Development of CDM 22
4.2 Field study 23 4.2.1 Location of power plants 23 4.2.2 Basic information of power plants 24
4.3 Factor Analysis 26 4.3.1 Boiler technology 26 4.3.2 Fuel source 29 4.3.3 Installed capacity 32 4.3.4 Waste disposal 33
4.4 System analysis 35 4.2.1 Improvement of system 36
4.5 Policy and economic analysis 37

III
4.5.1 National policy Analysis 38 4.3.2 Economic analysis 40
5 Discussions 43 6 Conclusion 46 7 References 48 8 Appendices 48

IV
Abbreviation
GDP Gross Domestic Product IEA International Energy Agency Mton Million tons NDRC National Development and Reform Commission CDM Clean Development Mechanism kW kilowatt kWh kilowatt hours MWh Megawatt hours O&M Operation and maintenance cost CHP Combined Heat and Power CRF Capital recovery factor CO2 Carbon dioxide BWE Burmeister & Wain Energy SPRC State Power Regulatory Commission SAT State Administration of Taxation MOF Ministry of Finance VAT Value added tax UNFCCC United Nations Framework Convention on
Climate Change NGOs non-governmental
organizations IPCC Intergovernmental Panel on Climate Change
List of tables
Table 2.1the estimated quantity of agricultural residues in regions of China in 2008 Table 2.2 Compositions and heating values for selected fuels Table 4.1 the growth of installed capacity of biomass power generation 2006-2010. Table 4.2 the number of CDM registered projects from 2007- 2012 Table 4.3 the basic information of 6 plants visited Table 4.4 the technology applied in each plant Table 4.5 production information of plants Table 4.6 fuel information of plants Table 4.7 the preferential policy mentioned in the field study Table 4.8 the amount of each policy refund Table 4.9 the calculation information of life cost of power production Table A1 Policy related to biomass power generation review

V
List of figures
Figure 1.1 Energy structure in China from 2000 to 2009 Figure 2.1 the current utilization of crop residues Figure 2.2 Utilization of biomass in energy sector Figure 2.3 schematic drawing for processing steps of biomass power generation Figure 2.4 working processing of boiler and steam turbine Figure 2.5 Extraction steam turbines Figure 2.6 Non condensing steam cycle Figure 2.7 policy system framework of biomass power generation Figure 4.1 the distribution of installed capacity Figure 4.2 total installed capacity and specific investment cost Figure 4.3 the trend of total installed capacity and specific investment cost Figure 4.4 newly built projects in China and the projects registered in CDM Figure 4.5 the location of 6 plants interviewed Figure 4.6 the relationship between companies Figure 4.7 the distribution of biomass power plants in the south of Hebei Province Figure 4.8 different types of fuel Figure 4.9 unloading straw with a lot of dust Figure 4.10 the packaged ash waste Figure 4.11 the diagram of project system Figure 4.12 a possible optimized system Figure 4.13 the share of each policy refund Figure 4.14 the sensitivity analysis of specific investment cost with different discount rate Figure 4.15 the sensitivity analysis of specific investment cost with different discount rate

VI
Preface
The whole thesis work has been supervised by Erik Ahlgren at the Energy Technology division of Energy and Environment department in Chalmers University of Technology. I would like to express my sincere gratefulness to his generous support to my field study as well. The field study is carried out in China for two months and supported by Shi Lei at Environment department in Tsinghua University. It should be noted that this master thesis could never have been conducted without the support and cooperation from project managers interviewed. Their great patience and co-operating willingness are very helpful for data collection of this thesis work during my visits at their factories. I also would like to thanks to my thesis opponent Liu Bo who has given me valuable idea of presentation modification. Last but not least, I will express great appreciate to my boyfriend who supports me all the time during my whole master study. Göteborg September 2012 Liu Fei

1
1 Introduction
China, with 1.3 billion people, is the world's most populous nation and the world's second largest economy. From 2000 to 2009, China has maintained an extravagant economic development, with an average growth of GDP at 9.73% per year. In parallel to this impressive economy growth, total primary energy consumption increased from 1394 million tons (Mton) of equivalent standard coal in 2000 to 2920 Mton in 2009, reflecting an average annual growth rate in 7.7%. At present, China has become the world second energy consumer [1] (Based on IEA data, China has surpassed the U.S. to become the world's biggest energy consumer [2]). From figure 1.1, it shows obviously that coal is still the dominant source of energy supply (Figure 1.1), representing roughly 74% of the supply [3].
Figure 1.1 Energy structure in China from 2000 to 2009
(Source: China Energy Statistics Yearbook 2010) The continuously increased energy demand and the use of fossil fuels has also resulted in many environmental consequences, especially air pollutions and CO2 emission, which is key factor of global concern about climate change. China has always make efforts on promoting the development of renewable energy. In the “Mid- and Long-Term Development Planning for Renewable Energy” issued by the National Development and Reform Commission (NDRC), China set an ambitious target for renewable energy in next fifteen years. The overall objective is l Increasing the proportion of renewable energy in total energy consumption; l Solving problems of electricity supply and fuel shortages in remote and rural
areas;
0
500
1000
1500
2000
2500
3000
3500
2000 2001 2002 2003 2004 2005 2006 2007 2008 2009
Mto
n
Year
Hydro,Nuclear and others
Natural gas
Petroleum
Coal

2
l The Implementing utilization of organic waste as energy source; l Promoting technology development of renewable energy. The concrete target is by the end of 2010, the renewable energy consumption reach to 10% of total energy consumption. By 2020, it will account for 15% of primary energy consumption [4] China is a large agricultural country as well, which is abundant in biomass resources. According to statistics, in China, more than 600 million tons of straw are produced annually, in which about 400 million tons can be used as energy source [5]. The efficient use of biomass resources will make more rational allocation of resources and avoid pollution from direct burning of straw waste. Direct straw-based combustion has developed rapidly in recent years, since the technology applied is not quite complicated. In line with this development, the biomass power industry faces some obstacles as well as challenges to move on.
1.1 Aim
The aim of this project work is to investigate current situation of biomass direct combustion power generation in China. The study will also take the policy analysis into account, in order to see how policy, including clean development mechanism can support (CDM), support the development of this industry. The aim will be succeed more specifically by exploring the following research question. 1. What is the general situation of development of biomass power generation in China? 2. What are the important factors contributing to efficient application of biomass power generation in China? 3. What kind of role do the policies (include CDM) play in biomass power generation? The aim is mainly achieved by literature review, field visiting and interview. The expected outcome of this paper is to find improvements or experiences in biomass power industry.
1.2 Delimitations
l The biomass power generation in this study doesn’t include the garbage power and biogas power generation
l Only biomass direct combustion technology is included in this study. l No environmental analysis is done. l Specific technical analysis is not included in the study. l Some economic analysis is applicable to support the argument.

3
l The field study is to obtain the first hand information rather than to collect data for a quantitative statistical analysis.
1.3 Limitations
The study is carried out with limited time schedule. It is impossible to collect enough and proper samples for univariate analysis. This has influence on the accuracy of the conclusion. Since the scale of biomass power plant is small, there is less information presented on the website. Hence, the statistical analysis is not completed.

4
2 Background
In this chapter, theoretical background information is presented for the thesis work. It starts with general introduction of biomass and biomass utilization. It is followed by section 2, which discuss the technologies and production processes applied in the biomass power industry. At the end of this chapter, it brings up a short introduction of clean development mechanism (CDM).
2.1 Biomass
Biomass refers to a variety of organisms through photosynthesis in nature. Biomass is abundant in content and a wide range of materials, mainly including wood cellulose, starch and sugar and other form [6]. Bioenergy is originally from the sun, so that biomass is a form of solar energy. Biomass is the most important absorber of solar and storage, biomass through photosynthesis, solar energy can be enriched and stored in organic matter which is a source of energy for human development. The biomass can be converted to conventional solid, liquid and gaseous fuels or burned directly. Compared to fossil fuels, the vital difference is one of time scale. Biomass takes carbon out of the atmosphere while it is produced, and returns it as it is burned [7]. In this perspective, biomass is the only current sustainable source of organic carbon.
2.1.1 Biomass resource in China
At present, biomass energy source has two categories. One category is from human planted biomass sources such as energy crops, energy forest. The other category comes from ‘waste’, such as crop residues, forest residues, municipal solid waste, and industrial organic waste [8]. Crop residues and forestry waste are currently the primary source for biomass combustion power generation in China [8].
2.1.1.1 Crop residues
Agricultural biomass resources in China are mainly crop straws as well as rice husks, corn cores, and bagasse from food processing. The straw can take up to 50% of the crops. [9] According to agriculture production, crop straw uses, and residues form agricultural product processing, it is estimated that in 2008, there were about 816 million tons of crop biomass resources producing in China [8]. The primary use and estimated amount of crop straw can be seen from the following pie chart (fig 2.1). [8]

5
Figure 2.1 The current utilization of crop residues
Since the geology and climate vary a good deal from region to region in China, the distribution of agricultural resource is different in different provinces. Table 2.1presents the estimated quantity of agricultural residues in different regions of China in 2008. [49] Table 2.1the estimated quantity of agricultural residues in regions of China in 2008
Region Total area /million ha
residues /million ton Region
Total area /million ha
residues /million ton
Beijing 1.6 2.3 Henan 16.6 92.4 Tianjin 1.2 2.8 Hubei 18.6 27.7 Hebei 18.8 53.0 Hunan 21.2 23.6 Shanxi 15.7 19.0 Guangdong 18 11.6 Inner Mongolia 114.5 38.6 Guangxi 23.8 21.0 Liaoning 14.8 29.7 Hainan 3.5 1.9 Jilin 19.1 49.5 Chongqing 8.2 12.2 Heilongjiang 45.3 67.5 Sichuan 48.4 38.6 Shanghai 0.8 1.0 Guizhou 17.6 14.8 Jiangsu 10.7 35.4 Yunnan 38.3 22.2 Zhejiang 10.5 6.7 Tibet 120.2 0.6 Anhui 14 40.0 Shanxi 20.6 18.7 Fujian 12.4 5.1 Gansu 40.4 12.6 Jiangxi 16.7 15.1 Qinghai 71.8 1.8 Shandong 15.7 78.3 Ningxia 5.2 4.9
Sinkiang 166.5 25.2
(source: Assessment of sustainable biomass resource for energy use in China, biomass and bioenergy 35 (2011) 1-11)
133
102
211 129
16 15
210 Stubble left in field
Fertilizers
Feedstuff
Fuel
Industrial material
Other uses
Left unused
Unit: Million ton

6
From table 2.1, it could be concluded that The geographic distribution of straw resources is significantly regionalized. Due to different natural climatic, socio-economic and customary traditions, the planting structure between regions is vastly different. The most agricultural product yields are in Central south and East of China, accounting for 35.5%, and 22.1%, respectively of the national yield. [49] Especially, some big agricultural provinces such as Henan, Hebei, Shandong, invest many biomass power generation projects. [50]
2.1.1.2 Forestry waste
Forest residues mainly include harvesting and wood processing residues, forest management cuttings, small branches as well as municipal green forest cuttings. The forestry biomass resources and availability in 2008 are estimated about 368 million tons. [8] The residues can be used in rural household and paper mill. The energy potential of the two main kinds of sustainable biomass resources can be evaluated by comparing them to China’s energy consumption in 2009. Lower heat value of standard coal is used for 35 MJ/kg, while the heat value of agricultural and forest biomass (dry basis) is 20 MJ/kg (seen from table 2.2). Coal combustion system efficiency is increasing. The standard coal consumption of generating 1 kWh of electricity in China is 339 g during 2009 [49]. The biomass consumption of generating 1 kWh of electricity in China is about 1000 g (see table 4.5). The available agricultural and forest biomass can replace 123 000 000 tons standard coal, which take up 4% of China total energy consumption in 2009.
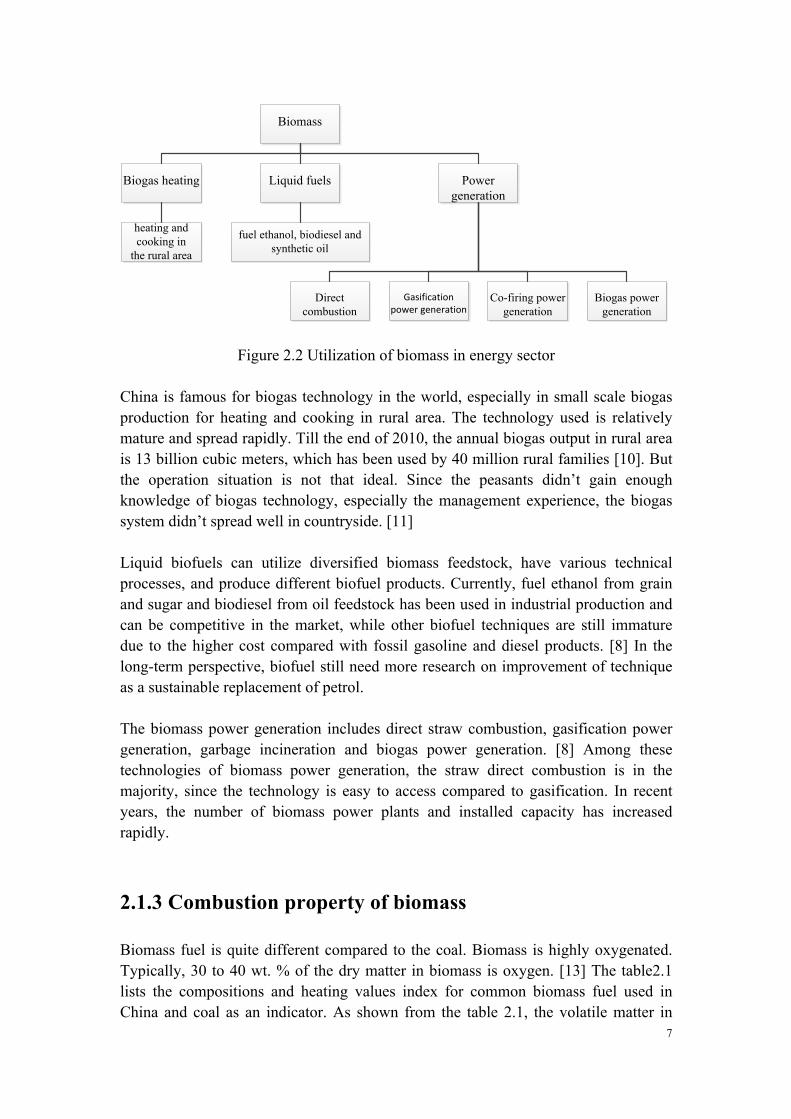
2.1.2 Utilization of biomass in energy sector
There are several technological options available to make use of biomass as a source of renewable energy. It may convert to other form energy carrier, such as liquid biofuel or combustible biogas, through both thermochemical and biochemical conversion technologies. It may release the energy directly, in the form of heat or electricity as well. In general, at present, the utilization of biomass as a source of energy in China includes biogas heating, liquid fuels and biomass power generation as follows (figure 2.2) [5].
7
Biomass
Liquid fuels
Power generation
Biogas heating
heating and cooking in
the rural area
fuel ethanol, biodiesel andsynthetic oil
Co-firing power generation
Direct combustion
Biogas power generation
Gasification power generation
Figure 2.2 Utilization of biomass in energy sector China is famous for biogas technology in the world, especially in small scale biogas production for heating and cooking in rural area. The technology used is relatively mature and spread rapidly. Till the end of 2010, the annual biogas output in rural area is 13 billion cubic meters, which has been used by 40 million rural families [10]. But the operation situation is not that ideal. Since the peasants didn’t gain enough knowledge of biogas technology, especially the management experience, the biogas system didn’t spread well in countryside. [11] Liquid biofuels can utilize diversified biomass feedstock, have various technical processes, and produce different biofuel products. Currently, fuel ethanol from grain and sugar and biodiesel from oil feedstock has been used in industrial production and can be competitive in the market, while other biofuel techniques are still immature due to the higher cost compared with fossil gasoline and diesel products. [8] In the long-term perspective, biofuel still need more research on improvement of technique as a sustainable replacement of petrol. The biomass power generation includes direct straw combustion, gasification power generation, garbage incineration and biogas power generation. [8] Among these technologies of biomass power generation, the straw direct combustion is in the majority, since the technology is easy to access compared to gasification. In recent years, the number of biomass power plants and installed capacity has increased rapidly.
2.1.3 Combustion property of biomass
Biomass fuel is quite different compared to the coal. Biomass is highly oxygenated. Typically, 30 to 40 wt. % of the dry matter in biomass is oxygen. [13] The table2.1 lists the compositions and heating values index for common biomass fuel used in China and coal as an indicator. As shown from the table 2.1, the volatile matter in

8
biomass is 3 or 4 times higher than that in coal, while the fixed carbon is lower, which is only 14%-22% in weight of biomass compared to 77% in coal. Another important character is element sulfur, which is very low content in biomass. Hence, biomass is believed less harmful to the environment. However, it is a fact that the heating value of biomass is much lower than that of coal. The heat value, or amount of heat available in a fuel (kJ/kg), is one of the most important characteristics of a fuel because it indicates the total amount of energy that is available in the fuel. The heat value can be expressed in one of two ways: the higher heating value (HHV) or the lower heating value (LHV). The higher heating value (HHV) is the total amount of heat energy that is available in the fuel, including the energy contained in the water vapor in the exhaust gases. The lower heating value (LHV) does not include the energy embodied in the water vapor. The heat content of different species can vary significantly depending on the climate and soil in which the fuel is grown, as well as other conditions. [12] Table 2.2 Compositions and heating values for selected fuels
Species
Rice straw
Rice hulls
Corn stalk
Cotton stalk
Wheat straw
peanut shell
cotton wood
willow wood
coalb
(dry)
component
analysis%
moisture content
3.61 5.62 6.1 6.78 4.39 7.88 6.7 3.5
Ash 12.2 17.82 4.7 3.97 8.9 1.6 1.5 1.6 4.51 Volatile matter
67.8 62.61 76 68.54 67.36 68.1 80.3 78 18.5
Fixed carbon
16.39 13.95 13.2 20.71 19.32 22.42 11.5 16.9 77
element
analysis%
H 5.3 6.2 6 5.7 6.2 6.7 6 5.9 4.26 C 48.3 49.4 49.3 49.8 49.6 54.9 51.6 49.5 87.5 S 0.09 0.4 0.11 0.22 0.07 0.1 0.02 0.04 0.75 N 0.81 0.3 0.7 0.69 0.61 1.37 0.6 0.42 1.25 P 0.15 - 2.6 -2.1 0.33
K2O 9.93 0.60-1.60
13.8 24.7 20.4
LHV MJ/Kg 17.64 16.02 17.8 18.09 18.53 21.42 17.93 18.63 35c (Source a. http://www.mxswz.com/news/2011121361.html the heating value is measured by oxygen bomb calorimeter. Source b Reference [13] Combustion properties of biomass c: here refer to the higher heating value of coal) There are three stages during combustion of biomass. First, the moisture content in the biomass evaporated to water vapor at temperatures up to 100°C, using heat from other particles that release their heat value. Second, as the dried particle heats up, volatile matter contain in biomass is released as gases such as hydrocarbons, CO,
9
CH4. In a combustion process, these gases contribute about 70% of the heating value of the biomass. Finally, the residual coke was burned and ash remains [14].
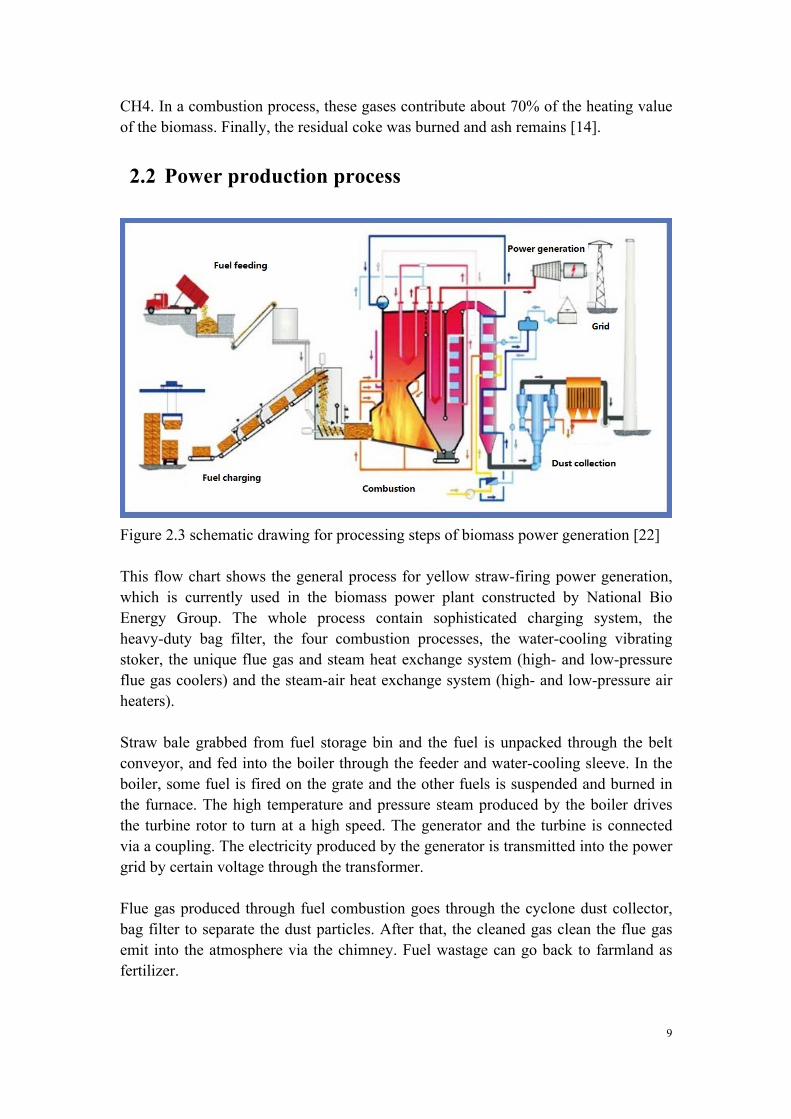
2.2 Power production process
Figure 2.3 schematic drawing for processing steps of biomass power generation [22] This flow chart shows the general process for yellow straw-firing power generation, which is currently used in the biomass power plant constructed by National Bio Energy Group. The whole process contain sophisticated charging system, the heavy-duty bag filter, the four combustion processes, the water-cooling vibrating stoker, the unique flue gas and steam heat exchange system (high- and low-pressure flue gas coolers) and the steam-air heat exchange system (high- and low-pressure air heaters). Straw bale grabbed from fuel storage bin and the fuel is unpacked through the belt conveyor, and fed into the boiler through the feeder and water-cooling sleeve. In the boiler, some fuel is fired on the grate and the other fuels is suspended and burned in the furnace. The high temperature and pressure steam produced by the boiler drives the turbine rotor to turn at a high speed. The generator and the turbine is connected via a coupling. The electricity produced by the generator is transmitted into the power grid by certain voltage through the transformer. Flue gas produced through fuel combustion goes through the cyclone dust collector, bag filter to separate the dust particles. After that, the cleaned gas clean the flue gas emit into the atmosphere via the chimney. Fuel wastage can go back to farmland as fertilizer.

10
2.2.1 Boilers
Generally, there are two types of combustion technique applied in biomass power industry in China, grate combustion and fluidized bed combustion.[19]
2.2.1.1 Grate combustion
Grate combustion is a traditional technology and well developed technology for burning solid fuels. [15] Grate is the effective burning parts in the boiler. Usually, the entire grate contains two parts, frame and grate segment. Grate segment normally is made of cast iron. There is necessary ventilation gap between the pieces of segment to ensure the mix of fuel and air. Crushed stalks and other biomass fuels are transported to grate boiler from the feeder. The fuel was rapidly dried by hot wind and ignited. The burning fuel was sent into the grate and burn out. Grate has various types, such as fixed, reciprocating, and vibrating, etc. [19] Grates are less tolerant for fuel quality variation than fluidized bed boiler. It required relatively stable combustion property of fuel [15]. Due to the existence of high temperature zone,fused ash will condense and cover on the heat surface. Besides, the fused ash cannot be fertilizer [16].
2.2.1.2 Fluidized bed combustion
Fluidized bed combustion technologies have been developed since the late 60’s. It has better adaptability for almost all kinds of fuel source [15]. A fluidized bed is formed when a quantity of a solid particulate substance (usually present in a holding vessel) is placed under appropriate conditions to cause the solid/fluid mixture to behave as a fluid. [20] The technology uses low-temperature combustion characteristics of fluidization inhibit alkali metal problem in straw combustion, which is better suited for biomass fuel quality variation in China [16].
2.2.2 Steam turbine
A steam turbine is a mechanical device that extracts thermal energy from pressurized steam, and converts it into rotary motion [17]. It runs off of steam produced by a boiler, so it can support many different types of fuels.

11
Fuel
Boiler
Pump Process or Condenser
Heat out
Turbine
Power out
Steam
Figure 2.4 working processing of boiler and steam turbine [18] The basic process behind steam power generation is the “Rankine Cycle”, which is a cycle that converts heat into work [21]. This cycle generates about 90% of all electric power used throughout the world [21]. Water is heated to a saturated liquid and then compressed into steam. The steam is transferred to a turbine where the pressure of the steam is reduced by expansion over the turbine blades. This process produces electricity. The low pressure steam is condensed back to a liquid. The return water mixed with new water is pumped back to the boiler as “feedwater” [18]. There are three types of steam turbines: condensing, non-condensing, and extraction. In an extracting type turbine, steam is extracted from various stages of the turbine. This steam can be used to meet the facilities steam need or sent to boiler feedwater heaters to improve overall cycle efficiency [18].

12
High-pressure steam
Turbine Power out
CondenserMedium/Low
pressure steam to process
Figure 2.5 Extraction steam turbines Condensing turbines exhaust steam in a partially condensed state. The steam’s pressure is so low which is no longer available for providing power [18]. Non condensing turbines, referred to back pressure turbines as well, are most widely used for process steam applications. Steam is expanded over a turbine and the exhaust steam’s pressure is controlled by a regulating valve to meet a facilities steam needs [18]
High-pressure steam
Low-pressure steam
To process
Turbine Power out
Figure 2.6 Non condensing steam cycle

13
2.3 National Policies
To achieve the target, China made a series of policies to support the renewable energy. Table A1 reviews the significant policies related to biomass power generation. Table A1 shows the main legislation and regulations of renewable energy in China. From table, some facts can be figured out. The utilization history in China was not that long, since the first specialized law has been issued in 2005 and revised once in 2009. This Renewable energy law [26] [27] guaranteed the purchasing of electricity generated by using renewable energy resources in full amount. What’s more, this law provides the legal substratum of other regulations. In 2006, ‘Trial Measures for Pricing and Cost Sharing Management for Renewable Energy Power’ [28] refer explicitly to the standard for the RE power subsidy price, which is 0.25 Yuan per kilowatt-hour. Besides, From January of 2007 to June of 2010, in ‘Renewable Energy Electricity Price Subsidies and Quota Trading Program’, [29] [30] [31] [32] [33] [34] Straw-fired power generation projects were granted a temporary on-grid electricity price subsidy of RMB 0.1 Yuan/kWh. Till July of 2010, the notice of ‘Perfect the Pricing Policy for Agricultural Biomass and Forest Biomass Power Generation’ [35] uniformly apply the benchmark on-grid biomass power price, which is RMB 0.75 Yuan/kWh. As for taxation, China doesn’t have uniform taxation policy for renewable energy. Relevant regulations are dispersed in laws of different kinds of taxes. Table A1 only lists the most important two, value- added tax and income tax. [36]
Renewable Energy Law of the People's Republic of China (2005, 2009 Amended)
Industrial GuidanceArt.10
Popularization and Application
Art.14
Development PlansArt.7,8
Fee compensationArts.20,24
ManagementArt. 5, etc.
IncentivesSubsidies, Taxes
Arts.24,25,26
Administrative Provisions on Renewable Energy
Power Generation (NDRC, effective,
2006.01)
Mid- and Long-Term Development Planning for Renewable Energy
(NDRC, 2007)
China’s 12th Five-Year Plan
(NDRC, 2012)
Catalogue for the Guidance of the Industrial
Development of Renewable Energy(NDRC, effective,
2005.11)
Regulatory Measures for Grid Enterprises' Full
Purchase of Renewable Energy Electricity(SPRC, effective,
2007.07)
Trial Measures for Pricing and Cost Sharing Management for
Renewable Energy Power (NDRC, effective
2006.01)
Interim Measure on Management of the regenerable energy development fund(NMF, effective,
2006.05)
Notice on the Management of Biomass Power Generation Project
Construction(NDRC, effective,
2010.09)
Interim Measures for Allocation of Income from Surcharges on
Renewable Energy Power Prices
(NDRC, effective2007.01)
Perfect the Pricing Policy for Agricultural Biomass
and Forest Biomass Power Generation (NDRC, effective
2010.07)
Renewable Energy Electricity Price Subsidies
and Quota Trading Program
(NDRC,SPRC, From 2007 to June 2010)
Taxes refund

14
Figure 2.7 policy system framework of biomass power generation
2.4 Clean development mechanism
The Clean Development Mechanism (CDM) is one of three flexible mechanism of Kyoto Protocol, which is designed for the Annex I countries to reach their CO2 reduction commitments by investing in greenhouse gas (GHG) emission reduction projects in developing countries. Developing countries receive financial and technological transfer. This mechanism intended to contribute to both cost-effective global GHG emission reductions and sustainable development in industrializing and developing countries. China has large amount of energy consumption, but relatively lower energy efficiency than international advanced level, which means large potential for emission reduction and attract a lot of CDM investment. All this time, CDM is considered as useful mechanism for developing countries to gain benefits, improve technology and achieve sustainable development. This is not only reflected by the increasing number of registered CDM projects, but also some research on environmental co-benefits in developing country like China.[37] [38] However, there is criticism of the effectiveness and impacts of CDM projects and uncertainty about future of CDM. Technology transfer from developed countries within CDM projects is always regarded as a visible benefit for developing countries. The Intergovernmental Panel on Climate Change (IPCC) defines technology transfer “as a broad set of processes covering the flows of know-how, experience and equipment for mitigating and adapting to climate change amongst different stakeholders.”[39] But in fact, based on study from UNFCCC (United Nations Framework Convention on Climate Change) [53], the procedures set for the CDM do not define ‘technology transfer’, so it might be not clear when projects claim to involve technology transfer. Stephen Seres et al analyzed numbers of CDM projects and concluded that technology transfer is very heterogeneous across project types and usually involves both knowledge and equipment. [54] On the contrary, another research made by Chinese mention that the contents of technology transfer now in China only include staff training, without concerning the equipment research and design. It is doubtful that this kind of technology transfer can promote the spread of advanced technology in China. [39]

15
3 Method
In this chapter, the methods used for carrying out this thesis work are described. First, the structure of the methods is explained to give an overview on how the different parts of analysis are connected throughout the work. Following this, the highlighted part of the chapter, is constituted the description of the field study, including interviews and data collections
3.1 Structure of methods
The type of system analysis and the limitation of time make it hard to apply classically statistical analysis with enough samples. The study can be regarded as project-oriented studies, which are often called bottom-up studies. The result of study is descriptive semi qualitative. The core part of this paper is to use the cases investigation to get the entire view of biomass power industry in China. The thesis work was carried out in three steps. First background knowledge was gained by a literature review. Besides, the stage includes elementary data collection and clarifies the research boundary that is the focus of research questions. Then a statistical analysis is taken to summary the general knowledge about the biomass power generation. After that, a field study was taken during two months stay in China.
3.2 Data collection
The data for this report is collected in three ways, literature review, pieces of news or notification from website, interviews from field study. A literature review was made at the beginning of the project, to gain basic knowledge about the situation of biomass power industry in China. This information is mainly based on scientific articles. Some critical aspects formulated the aim and research questions of the study. The information from website is more complicated. The news reports sometimes are contradictory. The data is distributed and hard to be collected. The interview and field study are the most significant source for analysis and results. This part is to gain fist hand information and get deep knowledge about the current situation of this industry. The data from interview is not enough to do statistical analysis. It was only used for qualitative comparison.
3.3 Field study
The study visit aims to gain firsthand information to support the entire study. Because

16
there are many fault about the information online. Some of them are hard to get useful information since the biomass power plants are quite small compared to the coal-fired plant. Some news and report might be inconsistent with the facts and full of contradictions. Messes of information on the website make the field study necessary to carry out. An interview plan was developed after an extensive study of biomass power industry and the current situation in China. Considered the aims of this study and statistics result, six biomass power plants were selected to go on field visit. The choices of these nine plants are meant to be typical and representative of the most plants in China in terms of scale, age, technology and background. These were based on the earlier period of study, which showed the most common plants parameter concerning on the scale and technology. These selection criteria can make these parameters comparable. The interview is a semi-structured interview, a method of research used in the social sciences. [51] Semi-structured interviewing starts with more general questions or topics. The majority of questions are created during the interview, allowing both the interviewer and the person being interviewed the flexibility to probe for details or discuss issues. In this study, a list of questions is prepared to be asked at interviews. Since the questions would be completed by interviewee and interviewer together, there were some subjective items. All the questions are related to the aims and adjusted with the proceeding of interview. Some questions could not be answered clearly during the interviews owing to the limited knowledge of the interviewees or some activities not executive at the plants.
3.4 Analytical methods
The analysis contains three parts. Firstly, the general analysis is based on the online information about many projects. The character of data statistic is demanding a great deal of data. Since the projects were searched one by one online. It is unavoidable that some projects are missing. These data would be presented in graph to show the development of the industry. The factor analysis and system analysis is based the results from field study and interview. This is Inductive analysis, which is common method for analyzing qualitative data. This kind of analysis is analogous with univariate analysis which is stricter. Too many factors are contributing the efficient application of biomass power generation. This comparison of each factor is based on field study and interview. Since it is not quantitative analysis, the result cannot show the weight of each factor, but it will show the order of importance of each factor. The economic analysis is only used to assess the generation cost, which is used to compare with the subsidiary. The life cost calculation can present the cost of power
17
production. The basis of the economic analysis is formed by a cash flow model in Excel. Since this analysis is only regarded as an indicator to assess the policy, the heat production is ignored to simplify the calculation.
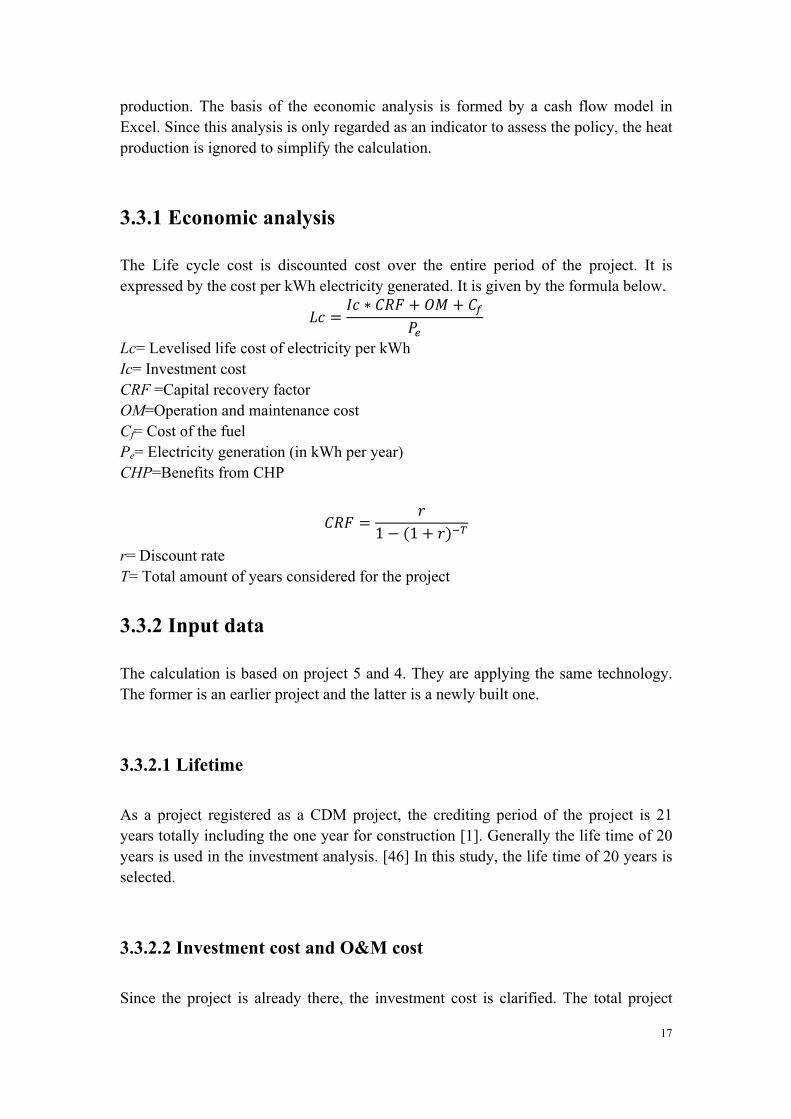
3.3.1 Economic analysis
The Life cycle cost is discounted cost over the entire period of the project. It is expressed by the cost per kWh electricity generated. It is given by the formula below.
𝐿𝑐 =𝐼𝑐 ∗ 𝐶𝑅𝐹 + 𝑂𝑀 + 𝐶!
𝑃!
Lc= Levelised life cost of electricity per kWh Ic= Investment cost CRF =Capital recovery factor OM=Operation and maintenance cost Cf= Cost of the fuel Pe= Electricity generation (in kWh per year) CHP=Benefits from CHP
𝐶𝑅𝐹 =𝑟
1− (1+ 𝑟)!!
r= Discount rate T= Total amount of years considered for the project
3.3.2 Input data
The calculation is based on project 5 and 4. They are applying the same technology. The former is an earlier project and the latter is a newly built one.
3.3.2.1 Lifetime
As a project registered as a CDM project, the crediting period of the project is 21 years totally including the one year for construction [1]. Generally the life time of 20 years is used in the investment analysis. [46] In this study, the life time of 20 years is selected.
3.3.2.2 Investment cost and O&M cost
Since the project is already there, the investment cost is clarified. The total project

18
investment cost includes construction cost and minimum circulating fund. Construction cost consists of equipment procurement and installation costs as well as construction loan interest. Calculation is just to get a reasonable and typical result. The average specific investment cost of these two projects is selected, which is tested to be close to the average specific investment cost of projects invested in 2011 and 2012. The O&M cost is uncertain. The annual O&M costs include material expenses, wages and welfare, repair cost, insurance premium and miscellaneous cost. In other similar study [46], it is estimated as 5% of investment cost. Generally, it contain two parts, staff cost and maintenance cost. There are about 100 staffs in this kind of plant. The average salary per year is 30000 Yuan per person. Every two or three months, they will shut down and examine and fix the devices. Hence, 5% is reasonable assumption for the project estimated.
3.3.2.3 Discount rate
Based on “Interim Rules on Economic Assessment of Electrical Engineering Retrofit Projects” [1], the social discount rate is measured by the state and now is 12%. Other data used in the analysis are directly from the result of field study. The project 5 is selected, since the plant parameters are common with most other projects. They will be listed in the result.

19
4 Result and analysis
In this chapter, the results are presented. First, the general information of the industry is introduced which involved the expansion of the industry. Second, the results of case study are presented. Finally, factor analysis, system analysis and economic analysis did in this report are supporting the final conclusion.
4.1 China’s biomass power industry
The first biomass power generation project was installed in Shandong Shanxian by National Bioenergy Group and completed in December 2006. The project applied Danish BWE technology manufactured in China. With total investment of 340 million Yuan, the installed capacity (rated power of steam turbine, similarly hereinafter) of the project is 30MW. [23] After this, the biomass power industry began to develop rapidly. By the end of 2007, a total number of 16 straw direct firing projects have been completed with total installed capacity up to 367MW. 29 biomass direct firing projects were completed in the year 2008 with total installed capacity of 618MW. These biomass projects were mostly developed in China’s Shandong, Jiangsu, Henan, and Hebei, which are important agricultural provinces. [8] By 2009, 32 new projected were constructed, while the total installed capacity was doubled again up to 1253 MW. [24] After June 2010, since the policy changed, no complete statistic is available on official website. Based on 11th five years plan for renewable energy [48], the total installed capacity of biomass power generation should reach to 4000 MW by the end of 2010. From the table 4.1, obviously the development of biomass power generation did not reach the target. Table 4.1 the growth of installed capacity of biomass power generation (2006-2010) Year Number of projects Total installed capacity (MW) Growth rate
2007[8] 16 367 2008[8] 29 618 68%
2009[24] 61 1253 103% 2010[25] 83a 1700 36%
a. this figure estimated value, which is calculated by the average installed capacity per project, that is 1253/61=20.54 MW per project. The statistical analysis contains the operated projects before the first half year of 2010, which the list is available on official website [34] (the policy for supporting the renewable energy listed all projects). Other projects’ information is from the company website and registered CDM projects. Totally there are 125 projects investigated, including the projects in table 4.1 (4 of them have no information online) and other projects’ information from National Bioenergy Group and Kaidi Electric Power Co., Ltd. The fig displays the installed capacity of these projects. A very obvious fact is 24,

20
25 and 30 MW are common project scale in China. The reason to put 24 MW and 30 MW together is some projects declaim the installed capacity is 24 MW while actually it is 30MW. The might influence the result of specific investment cost. Besides, the larger installed capacity is not that universal. This will be discussed in detail in the section of field study
Figure 4.1 the distribution of installed capacity
4.1.1 Specific investment cost
Another important indicator is specific investment cost. It is common sense that the cost barrier is the main obstacle to apply a new technology on the market. The data of total investment cost is collected. Specific investment cost is calculated by investment cost divided by installed capacity. The result is showed in the figure. Four of them are lack of information about investment. Therefore, till 2011, 110 projects are taken into account and formulate the Figure 4.2. Figure shows the specific investment cost of these projects, which is presented as the dots and the expansion of biomass power production, which is displayed by bar chart.
0 10 20 30 40 50 60 70 80 90
100
Num
ber
of p
roje
cts
Capacity (MW)
Installed capacity
installed capacity

21
Figure 4.2 total installed capacity and specific investment cost The increase of total installed capacity is obvious without doubt. As for the specific investment cost, there are 6 points far less than others. The reason is that these projects are modified from coal fired power plants. Some infrastructures were already there. The main cost is replacement of equipment. If not taking these 6 projects into account, the trend of specific cost given by Excel is slightly go down during these years, shown in fig.4.3.
Figure 4.3 the trend of total installed capacity and specific investment cost
0 2000 4000 6000 8000 10000 12000 14000 16000 18000
0 200 400 600 800
1000 1200 1400 1600 1800
2006 2007 2008 2009 2010 2011
Cos
t (Yu
an/k
W)
Cap
acity
(MW
)
Year
Total installed capacity Specific investment cost

22
4.1.2 Development of CDM
Among 69 projects operated before June of 2010, there are 38 projects registered as CDM projects. Even one of them was succeed registered in 2012. There are totally 55 biomass power production projects registered in CDM official website till the end of 2011. (The search keywords are biomass and straw). Two of them produce heat only, so they are neglected. And one of them is not constructed for unknown reason, which is neglected as well. From figure 4.4, the number of projects increased from the beginning. The figure in 2007 is higher than 2008, which might own to some the projects constructed in 2006. The peak is in 2009, the go down in 2010. The statistics is not that precise, since the construction of one project is usually one year or even more. While as for number of registered CDM projects, the peak point is in 2009. It is not hard to understand. More projects constructed and more people know about CDM. Table 4.2 the number of CDM registered projects from 2007- 2011 Registered 2007 2008 2009 2010 2011 total number of projects 7 3 5 15 22 52
Figure 4.4 newly built projects in China and the projects registered in CDM To sum up, the whole industry is developed rapidly. But the expansion did not reach the target set by National Development and Reform Commission. Based on 11th five years plan, the total installed capacity of biomass power generation should reach to 4000 MW by the end of 2010. Early projects before 2010 are mostly registered as a CDM projects. From current situation, especially the preference policy supported, it is estimated that more biomass power plant will be constructed in next few years. In a latest article [5], the authors used SWOT analysis method to assess the factors of
0
5
10
15
20
25
30
35
2007 2008 2009 2010 2011
No.
of p
roje
cts
Year
Registered CDM
Newly constructed projects in that year in China

23
strengths, weaknesses, opportunities, and threats of biomass power generation industry of China. The results of this paper are in accord with most new reports in China. They found that major strengths of the industry include: bettering the energy composition, huge biomass resources, favorable to environment protection and sustainable development, progress in R&D and large investment by various enterprises. Whereas the major weaknesses are: high cost of biomass power generation, high construction cost of plant, fewer financing channels, lack of core technology and too close distance between plants.
4.2 Field study
The field study was carried out in the selected destination in China during March and April of 2012. Usually these projects are owned by groups. It is necessary to inform the contact persons in the group in order to get permission for visits. They can arrange the manager in charge of the project functioned as representative. Specific employees were interviewed to answer the question in their areas. The criteria for selection of power projects have been explained in the chapter 3. The background information are presented in the table.
4.2.1 Location of power plants
The locations of the projects selected are presented in the map. China has vast territory, which make univariate statistic impossible, since the climate and policy in each province are different. All these plants located in rural area. Most of time of visiting was waste on the way to the destinations.

24
Figure 4.5 the location of 6 plants interviewed
4.2.2 Basic information of power plants
Since the analysis below is quite dependent on the field study, the basic information of power plants visited is listed in the table. Table 4.3 the basic information of 6 plants visited
1 2 3 4 5 6
Name Nangong Chengan Guantao Honghu Suqian Jinjia Location Hebei Hebei Hebei Hubei Jiangsu Jiangxi start data 2009.10 2006.06 2007.08 2010.10 2006.05 2009.02
Launch date 2011.01 2007.04 2011.03 first unit 2012.04 2007.04 2010.04
Scale(output) 30MW 30MW 2*24MW 20MW 2*12MW 6MW
Boiler Denmark BWE
Denmark BWE
Domestic technology
Domestic technology
Domestic technology
Belgium VYNCKE
Turbine China China China China China China CDM support N Y Y N Y Y
CHP N N Designed as CHP N
Under construction Y
1. NBE Nangong Biomass power generation

25
The project is designed as a biomass boiler of 130 t/h as well as a high temperature and pressure of a 30MW turbine generator. Static total investment of this project is 260 million. Annual power generation is up to 2 billion kWh, consuming agricultural and forestry wastes 300,000 tons, saving 100,000 tons of standard coal and reduce greenhouse gas emissions by 20 tons per year. They are applying to be a CDM project, but it takes time. During the visiting, they were suffering frequent shut down. 2. NBE Chengan Biomass power generation Co., Ltd The project is designed as a biomass boiler of 130 t/h as well as a high temperature and pressure of a 30MW turbine generator. The core technology of boiler is from Denmark BWE Company. It consumes agricultural and forestry waste 280 000 tons per year, replaces standard coal 100 000 ton and produces 200 GWh electricity per year. This project is registered in UNFCCC as CDM project. But they haven’t get money from CDM. This is the second biomass power plant in China. The operation situation is excellent. This project and project 1 are very common among all projects constructed by National Bioenergy Group 3. Handan Biomass Power generation Project The installed capacity of this project is 2*24MW (actually 2*30MW). Currently only one unit is under operation. It is the worst one interviewed. Last year, the runtime was no more than 4000 hours. It is said that it is because the quality of fuel. It is designed as a CHP plant, but it is impossible to provide heat to resident. One reason is lacking of heat transport network, another one is the high cost of heat production without policy support. 4. Hubei Honghu Li’ang Biomass power generation Co., Ltd The installed capacity is 20 MW. It is a newly built plant. It was not being operated during visiting. The boiler is the same type with that used in project 5. It is owned by a relatively small and local company. The investment cost is 7000 RMB/kW, lower than old ones. 5. Zhongjieneng Suqian 2*12MW Biomass Direct Burning Power Plant Project The installed capacity of this project is 2*12MW. The project utilizes the domestic innovation biomass boiler technology co-developed by Zhongjieneng (China Energy Conservation Investment Corporation) and Zhejiang University. This project is located in northern part of Jiangsu Province, which might be the most intensive area of biomass power generation plants. The local government has some tendentious policy to support these straw utilization projects. The project has been operated for couple of years and turned out to be well through several technical reforms. The boiler developer, Zhejiang University, provide instant technical support. Now, they plan to add a new boiler and provide heat to near plants to make it more profitable. 6. Jiangxi Jinjia Biomass Generation Project

26
A registered CDM project has a smallest capacity, 6MW, compared with other projects. This is the only one which applies Belgium technology among all 58 registered biomass power generation projects. The proposed project is constructed and operated by Jiangxi Jinjia Cereal Co., Ltd. The project has special system, which will be analyzed in detail in section 4.3.
4.3 Factor Analysis
The analysis aims to response the second research question mentioned in chapter 1. Five factors are selected to analysis in detail, which are boiler technology, fuel source, installed capacity and waste disposal.
4.3.1 Boiler technology
The interviewed information related to technology is presented in the table Table 4.4 the technology applied in each plant
1 2 3 4 5 6
start data 2009.10 2006.06 2007.08 2010.10 2006.05 2009.02 Scale 30MW 30MW 2*30MW 20MW 2*12MW 6MW Boiler technology
Denmark BWE
Denmark BWE
Domestic technology
Domestic technology
Domestic technology
Belgium VYNCKE
Boiler type
High temperature and high pressure reciprocating vibration grate
High temperature and high pressure reciprocating vibration grate
High temperature and high pressure circulating fluidized bed
Medium temperature and medium pressure circulating fluidized bed
Medium temperature and medium pressure circulating fluidized bed
reciprocating vibration grate
Boiler manufacturer
Ji'nan Boiler Factory
Ji'nan Boiler Factory
Changsha Boiler Factory& Anshan Boiler Factory
Jiangsu Nantong Wanda boiler factory
Jiangsu Nantong Wanda boiler factory imported
Turbine
Extraction condensing steam turbine
Condensing steam turbine
Extraction condensing steam turbine
Condensing steam turbine
one is condensing steam turbine,one is Extraction condensing
Extraction condensing steam turbine
27
steam turbine Turbine manufacturer
- Qingdao Jieneng Nanjing
Qingdao
Qingdao Jieneng
Price of boiler(Million Yuan)
- 65 40 9.9 8 for each -
Price of turbine(Million Yuan)
- 7.1 30 10 6 for each -
total investment(Million Yuan)
260 286 442.7 140 241.34 60
Specific investment cost (Yuan/kW)
8667 9533 7378 7000 10056 10000
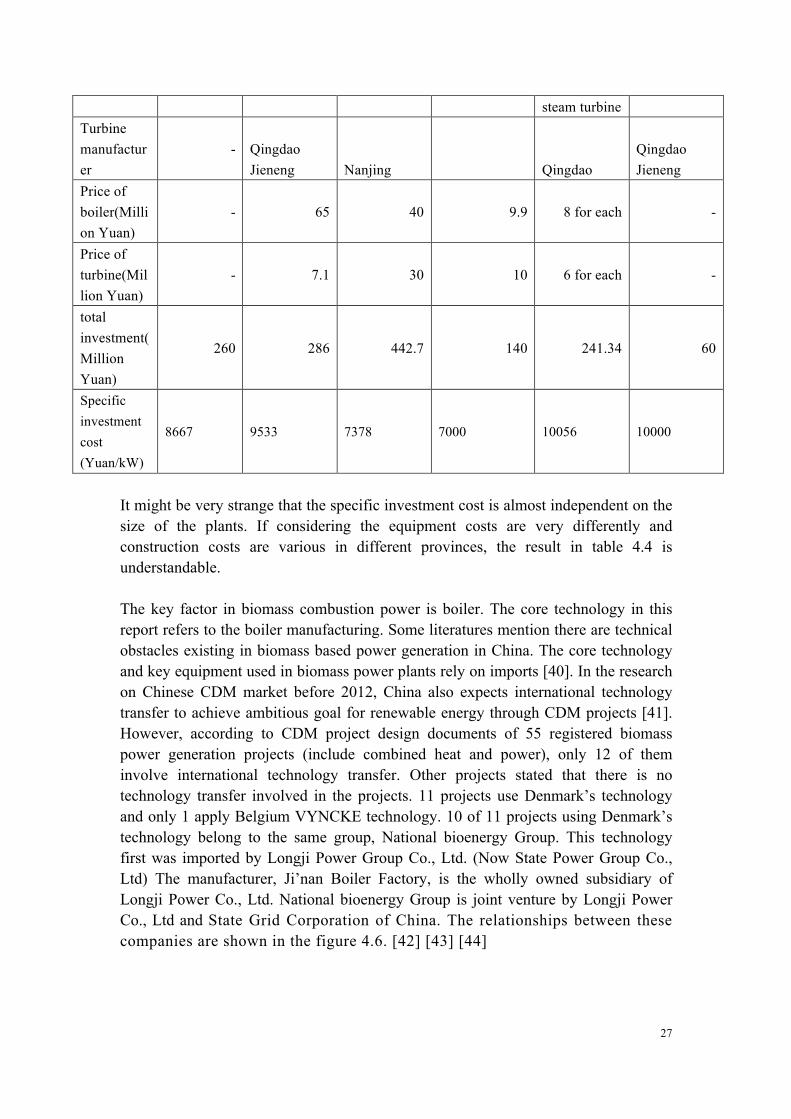
It might be very strange that the specific investment cost is almost independent on the size of the plants. If considering the equipment costs are very differently and construction costs are various in different provinces, the result in table 4.4 is understandable. The key factor in biomass combustion power is boiler. The core technology in this report refers to the boiler manufacturing. Some literatures mention there are technical obstacles existing in biomass based power generation in China. The core technology and key equipment used in biomass power plants rely on imports [40]. In the research on Chinese CDM market before 2012, China also expects international technology transfer to achieve ambitious goal for renewable energy through CDM projects [41]. However, according to CDM project design documents of 55 registered biomass power generation projects (include combined heat and power), only 12 of them involve international technology transfer. Other projects stated that there is no technology transfer involved in the projects. 11 projects use Denmark’s technology and only 1 apply Belgium VYNCKE technology. 10 of 11 projects using Denmark’s technology belong to the same group, National bioenergy Group. This technology first was imported by Longji Power Group Co., Ltd. (Now State Power Group Co., Ltd) The manufacturer, Ji’nan Boiler Factory, is the wholly owned subsidiary of Longji Power Co., Ltd. National bioenergy Group is joint venture by Longji Power Co., Ltd and State Grid Corporation of China. The relationships between these companies are shown in the figure 4.6. [42] [43] [44]

28
Longji Power Group Co., Ltd. (Now State Power
Group Co., Ltd)
Ji’nan Boiler Factory
(Manufacturer)
wholly own
Denmark BWE
Invest on
Import technology
from
National bioenergy
Group
Invest on
Invest 75% on
State Grid Corporation
of China
Figure 4.6 the relationship between companies From figure 4.6, it can conclude that State Power Group is professional in biomass power generation. They control the whole supply chain, from the technique supplier to manufacturer. Table 4.5 production information of plants Plant 1 2 3 5 6 operation hours/yr - 7500 4000 7375 6500 Consumption(ton) 16000a 280000 60000 280000 46000 Production(MWh) 18200a 210000 80000 177000 29.7 Unit comsumption(kg/MWh) 879 1333 750 1582 2000 tons steam
a. It is a monthly data b. Plant 4 is just constructed and hasn’t connect to the Grid during visiting. Judging from the current situation of the technologies and utilization of new energy in China, biomass combustion is relatively mature compared with that of other renewable energy utilization, such as gasification. Direct combustion technology has fewer obstacles, since it is similar to coal combustion. Biomass gasification is still in research level. Few projects are under construction. Right now, the key equipment in biomass combustion power generation project is boiler. Plant 2 and 5 are using 2 different technologies, which are typical and widely used in China right now. Both of them have been operated for several years. As mentioned before, the Plant 2 uses the foreign technology which is import from Denmark BWE Company but produced in China. Plant 5 utilizes the local innovation co-developed by China Energy Conservation Investment Corporation (CECIC) and Zhejiang University. From the table, there is no distinct difference in the operation hours and input-output ratio between project 2 and project 5. There is no exact knowledge on the quality of the fuel, it is impossible to assess the efficiency of these two technologies. Another

29
obvious difference between these two plants is that plant 2 uses high pressure and high temperature boiler while plant 5 uses medium pressure and medium temperature boiler. Based on literature, direct firing boilers with high temperature and high pressure are 2-3% higher in heat efficiency and 10% or less generation efficiency than boiler with mid temperature and mid pressure. [8] It is convincing that the main difference might come from the pressure and temperature in the boiler. But it is difficult to evaluate this difference, since the quality of fuel source cannot be clarified. Currently, there are some research on increase the temperature and pressure of circulating fluidized bed, for instance, the boiler used in project 3. However, the operation status of plant 3 was not ideal last year. The total operation time is no more than 4000 hours during the whole year. They stressed it is owing to the poor quality of fuel. It is not excluded that the new technology is not mature. Another focus might be the cost for equipment. From the figure of equipment cost of plant 2 and 5 in table 4.4, It is obvious that foreign technology is more expensive that domestic one. It is understandable to import the exist technology from other technology at the beginning of the industry. Now, they seem to lock the path of expansion, since they are groups with related interests presented in the figure 4.6. Project 4 was constructed with the guidance of project 5. Project 4 applied the same type of boiler to that of project 5, while the specific investment cost was much lower. It can be regard as a good example to prove the trend of specific investment cost is decreasing, since these two projects applied the same technology.
4.3.2 Fuel source
Through field study and interview, the information of fuel source status is collected, which is shown in table 4.6. Table 4.6 fuel information of plants Plant fuel collection Quality control Pretreatment difficulty
1
4 collection stations in the villages; broker collect straw from peasants and sell to plant
first do quality testing then settle up the bill
No competition for straws
2
broker collect straw from peasants and sell to plant
combine weight and volume measurements to avoid mixing with water and dust
lay out to dry increasing straw price

30
3
set up 70-80 collection stations in each village; middleman collect straw from peasants and sell to plant
self-processing to control quality
simple pretreatment in collection station, such as cut down; two soil screening machine, but capacity is limited, cannot meet the demand
competition for straws, sometime purchase straw from the area in the distance of 400km; high water content in harvest season
4
broker collect straw from peasants and sell to plant
set contract; first do quality testing then settle up the bill
crashing machine; lay out to dry
close to another biomass power plant, cannot promise the quantity and quality of straw
5
broker collect straw from peasants and sell to plant
first do quality testing then settle up the bill
crashing machine; lay out to dry
several biomass power in local area; fuel collection is seller's market
6 90% self-sufficiency
self-processing rice hull, low water content
self-processing
increasing rice hull price because of some newly built biomass power plant
Currently, the quantity and quality of fuel are the biggest concern of most biomass power plants. By reason of policy guidance and increasing coal price, many new power plants were constructed in recent years. The direct result of projects construction is the space distribution of biomass power plants is too intensive. The regulation of “one biomass power plant in one county” cannot make sure the distance between two plants is far enough. Based on incomplete statistics and field study, there are 8 biomass power plant just in south area of Hebei Province (shown in the figure 4.7), not to mention the surrounding plants in near-by province.

31
Figure 4.7 the distribution of biomass power plants in the south of Hebei Province The necessary outcome of such a dense space distribution is competition for raw materials. The price of cotton straw has gone up from 200 RMB/ton to 280 RMB/ton. This is an obvious seller’s market. Hence, the quality of fuel becomes the chief problem of most biomass power plants. The ash and water contrived by fuel seller lower the heating value of fuel. Thereby, each plant came up some method to control this, such as using volume measurement instead of mass measurement or cutting the price by detecting the ash and water content of fuel. Although these methods could monitor the cost, they couldn’t improve the quality of fuel. To sustain the production, they have to purchase some materials below the standards, such as the fuel source shown in the picture 1 of figure 4.8 below. This kind of branch need to be crushed before it is put into the feeding system, which need extra power and extra cost. By contrast, the wood chip showed in picture 2 of figure 4.8 is very suitable to burn. While the biomass solid fuel in picture 3 of figure 4.8 is not popular now. It is a considerable solution for power plant.

32
1. Wood waste need crushed 2. Wood chips best to burn
3. Sample of biomass solid fuel
Figure 4.8 different types of fuel However, all of these are still not the key issue. The point is the unwanted or unforeseen halt is unavoidable caused by poor quality of fuel source, which obsess most plants. The duration of shutdown is generally 2 to 3 days. At the same time, the poor quality of fuel has great impact on grate. If grate gets a lot of wear and tear and will soon need replacing, it might cost hundreds of thousands of money to buy a new one. Moreover, the reduction of production can result in direct loss of income.
4.3.3 Installed capacity
It is true that most biomass power plants in China have relatively small installed capacity. As conclude in section one, there are only a few project with installed capacity of more than 30MW. At the same time, the installed capacity less than 10 MW is not that much as well. It is summarized in figure 4.1 The maximum capacity of single unit is only 30MW among all running projects before. Now it is reported that a new biomass fired power plant including two steam turbines with each rated capacity of 50MW is established in Guangdong Province,

33
which is reported the largest capacity of biomass power generation unit in the world [52]. Project 3 is one of few projects with two 30 MW units. Based on the practical situation during the field study, it is not hard to believe that large installed capacity is not rational. According to project design document of many projects, a 30MW project is design to collect the fuel from the area with the radius of 50 km. In fact, on one hand, power plants set some collection stations. On the other hand, middlemen purchase the straw from famers and send them to the power plants. Such a situation exists. The farmers close to the plant just let the corn straw rotten in the farmland if no one buys it from them. Therefore, a 30MW project collects the fuel from the area with the radius of 100 km or even more in reality. Plant 3 has bought the straw from other province, although they haven’t begun to operate their second units. The distance of transportation can reach to 400 km. Larger capacity is more or less like a stunt because of fuel constrain. As matter of fact, two or three small units are more flexible in China. What is more, another important indicator, specific investment cost, should be considered carefully when selecting the installed capacity. From dots in the figure of specific investment cost, ‘scale effect’ is not superior in biomass power industry. Although the entire trend of specific cost is going down with total installed capacity of whole market. For the individual investment, this kind of scale effect is not that prominent.
4.3.4 Waste disposal
Many reports and articles [12][13] mentioned that the ashes after burning the biomass could be good fertilizer because of high content of potassium element containing in stalks. As a matter of fact, too much dirt in the fuel also adds to the dirt content in ash disposal, which make it not suitable to be fertilizer. The picture below shows the real situation of unloading the straw. The truck raised quite a lot of dust.

34
Figure 4.9 unloading straw with a lot of dust However, plant 6 is quite different from others. Since they only use one kind of biomass, rice hull, which directly come from their own rice processing plant, the ash disposal is very pure. They package the ash and sell to iron and steel enterprise as heat insulator at price of 500 RMB/ton, shown in the picture below.
35
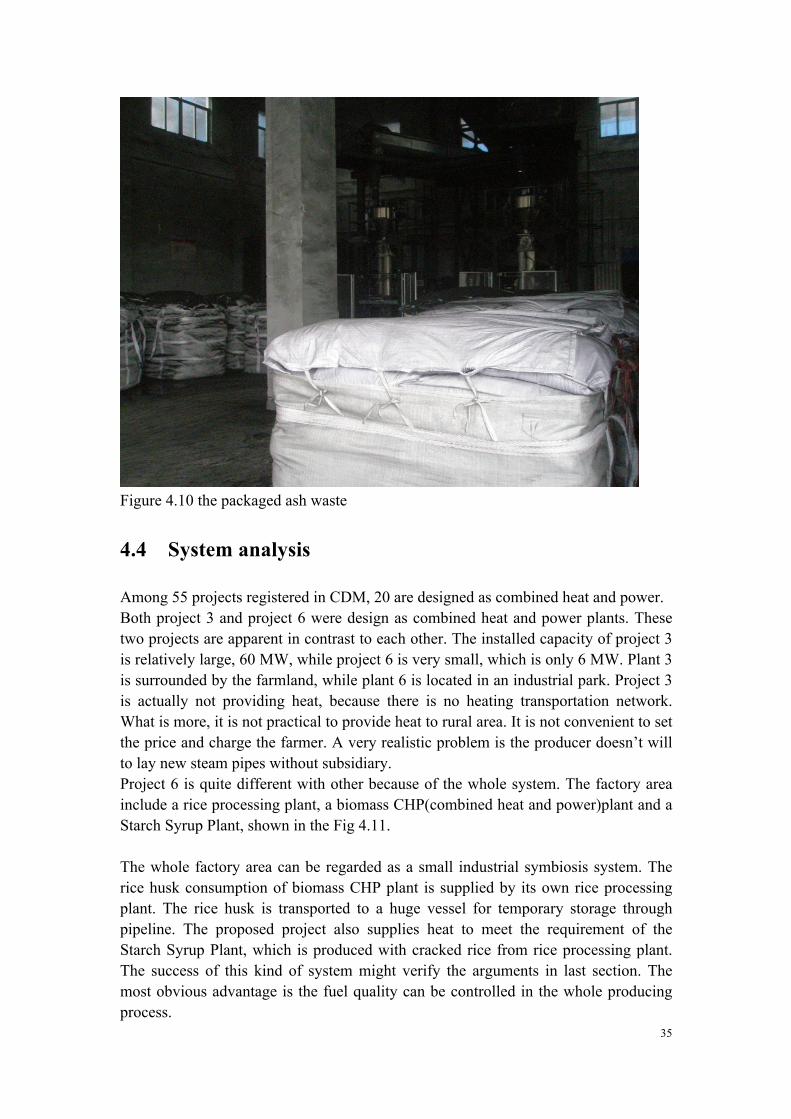
Figure 4.10 the packaged ash waste
4.4 System analysis
Among 55 projects registered in CDM, 20 are designed as combined heat and power. Both project 3 and project 6 were design as combined heat and power plants. These two projects are apparent in contrast to each other. The installed capacity of project 3 is relatively large, 60 MW, while project 6 is very small, which is only 6 MW. Plant 3 is surrounded by the farmland, while plant 6 is located in an industrial park. Project 3 is actually not providing heat, because there is no heating transportation network. What is more, it is not practical to provide heat to rural area. It is not convenient to set the price and charge the farmer. A very realistic problem is the producer doesn’t will to lay new steam pipes without subsidiary. Project 6 is quite different with other because of the whole system. The factory area include a rice processing plant, a biomass CHP(combined heat and power)plant and a Starch Syrup Plant, shown in the Fig 4.11. The whole factory area can be regarded as a small industrial symbiosis system. The rice husk consumption of biomass CHP plant is supplied by its own rice processing plant. The rice husk is transported to a huge vessel for temporary storage through pipeline. The proposed project also supplies heat to meet the requirement of the Starch Syrup Plant, which is produced with cracked rice from rice processing plant. The success of this kind of system might verify the arguments in last section. The most obvious advantage is the fuel quality can be controlled in the whole producing process.

36
Rice processing plant
Rice husk storage Biomass boiler Extraction
steam turbine Generator
Starch Syrup Plant
Heat&electricityHeat&electricity
Grid
electricity
Rice husk
Cracked rice
Sell Rice Sell starch syrup
steel mill
Sell ash
Biomass CHP
Figure 4.11 the diagram of project system Another benefit is saving the cost for storage. Other plants visited usually own a large area for storing the fuel to make sure the sustained power production in one or two months. It is essential to pretend the fuel to be fired. Definitely, it will increase the operation cost. The application of combined heat and power increase the total conversion efficiency of biomass. As mentioned before another advantage is the waste which is more pure because of the good quality of fuel. The installed capacity totally fit the production of rice processing. 90% of the fuel source comes from the self-production. When the price of rice husk is not that high, they would purchase some to make up the consumption of more operation hours. This project has practical significance to future development of biomass direct combustion.
4.2.1 Improvement of system
From practical production experience, it is possible to provide heat to other plants if there are some plants near the power generation plant, such as industrial park. But the problem is how to make sure the sustaining heat supplement because of the constraint of contract. As mentioned before, to reduce the capacity of single unit might be a method. It is more flexible to build 2 or 3 small units. As mentioned before, the shut-down occurred quite often in biomass power plants. In order to produce sustained heat and meet demand of other plants, keep one unit running can promise the heat supply. Another measurement might improve the quality of fuel. A possible trend is to build technical fuel processing company. The biomass power industry has developed rapidly, but the relevant industry hasn’t developed at the same pace, especially the fuel processing. In fact, in 2005, the government published ‘Guidance of the

37
Industrial Development of Renewable Energy’, [45] which propose investment focus supported by the government. In the file, biomass solid fuel is included. At present, each plant deals with the fuel material by them. Plant 3 bought a soil screening machine. But efficiency is low, because it can process limited amount of fuel which is not match the consumption amount.
Biomass processing plant
Biomass storage
Biomass boiler Extraction steam turbine Generator
Plants which demand heat
Heat
Grid
electricity
Biomass solid fuel
Waste heat
Sell ash
Biomass CHP
Biomass boiler Extraction steam turbine Generator
Figure 4.12 a possible optimized system A possible optimized system could be like the figure 4.12 showed. A biomass processing plant can deal with the fuel uniformly. Two or three sets of unit are essential as well. Hence, it would be preferable to provide heat to some plants which need heat. And the waste heat from these plants can be collected for drying fuel in biomass processing plant.
4.5 Policy and economic analysis
In the 12th Five-Year Plan (2011-2015), China reiterated its target and effort to renewable energy. China will change the power generation structure in which new and renewable energy resources figure prominently. According to the Plan, non–fossil fuel generation should account for 11.4% of total primary energy consumption by 2015, and renewable energy resources should be 20% by 2020. [25] National policies and CDM provide the incentives to develop the renewable energy.

38
4.5.1 National policy Analysis
The policy information was mentioned during the field study and sorted in the table below. A premise should be mentioned before the discussion. Interviewees are ambiguous about policy, especially taxes. VAT and income tax are of great significance and take up a large share of tax payment. The VAT refund is uniformly defined by Ministry of Finance. The income tax is more complicated. In some area, such industrial park, reduction of income tax is a method to attract investment, for instance, exemption from income taxation for first three years, reduction half for next two years. This part is not investigated in detailed. Table 4.7 the preferential policy mentioned in the field study Policy 1 2 3 4 5 6 Electricity price subsidiary
√ √ √ √ √ √
VAT refund
√ √ √ √
Energy saving reward
√ √
Reduction of tax
√ √ √ CDM
√ √
√ √
It is interesting to see the weight of each policy. If taking project 5 as an example, the amount of each policy refund is listed in following table 4.7 and figure 4.13. The calculation is based on one year. Table 4.8 the amount of each policy refund Scale MW 24
Sales income Million Yuan 118.5 Power to Grid MWh 158000 Benchmark price Yuan/MWh 445 Subsidy Yuan/MWh 305 Subsidy Million Yuan 48.19 VAT tariff % 17 VAT Million Yuan 20.14 Annual average CO2 reduction
ton 123055 CDM Million Yuan 9.13
CERs price Yuan/ton CO2 74.16 Exchange rate used in this report is average value during first half year of 2012 1 Euro (€) = 8.24 Chinese Yuan (CNY) Sources: http://app.finance.ifeng.com/hq/rmb/quote.php?symbol=EUR

39
Figure 4.13 the share of each policy refund Energy saving reward is a just-for-once reward provided by the government to award energy-saving enterprise. It is roughly hundreds of thousands of Yuan, which is approved by interviewees. It is only small amount and can be neglected compared to other policy. As seen from the table, electricity price subsidiary is the most important policy for biomass power production. The benchmark price is different in different, for example in Hubei province, it is 490 Yuan/MWh. The subsidy is lower but still takes up the most of income of plant. Then, the VAT refund is also a big share of income. The two primary policies for biomass power generation are electricity price subsidiary and Value added tax (VAT) refund. Electricity price subsidiary increase the price to 0.75 RMB/kWh that means benchmark price plus subsidiary price equal to 0.75 RMB/kWh. Besides these, different province might have some other supportive policy for biomass power generation, especially some soft policy, such as lower rental of land or energy saving reward. The interesting thing is that each project has different knowledge about the policies. Plant 6 even didn’t know the VAT refund, which they always thought VAT was a biggest problem they faced with. The VAT ratio of this kind of firm can run up to 17% in China. Another key issue about the policies might come from the uncertainty of policy implement. China has introduced many policies and targets on biomass power generation. The status of implement is not ideal. According to the regulation, the VAT should be levy and refund, which means instant tax return. But in practice, the government exist the low efficiency problem, which make the return cycle is a little long. As for electricity price subsidiary, the subsidiary part was paid by Power Grid Company previously. Nonetheless, now the subsidiary part might be settled up by
CDM 7%
other 39%
Subsidy 38%
VAT 16%
sales income 93%
the share of each policy refund
40
National Ministry of Finance at the end of year. To sum up, refund and subsidiary is not timely, which added pressure on fund chain of projects.
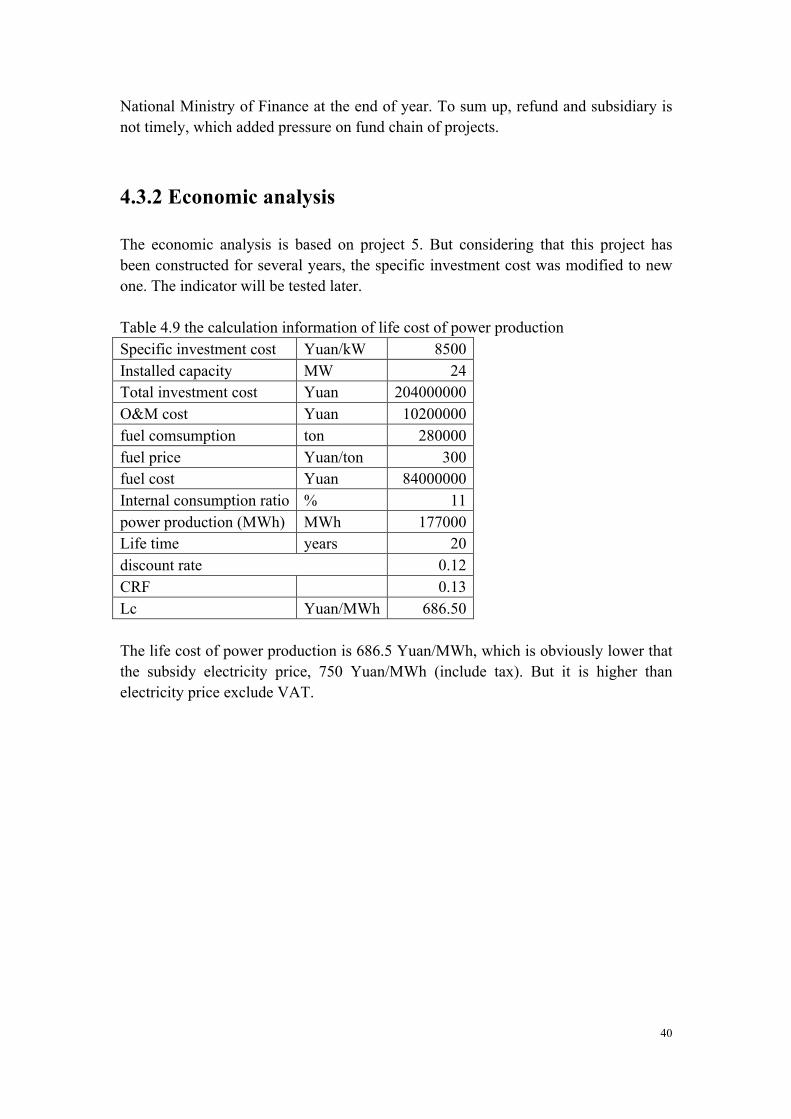
4.3.2 Economic analysis
The economic analysis is based on project 5. But considering that this project has been constructed for several years, the specific investment cost was modified to new one. The indicator will be tested later. Table 4.9 the calculation information of life cost of power production Specific investment cost Yuan/kW 8500 Installed capacity MW 24 Total investment cost Yuan 204000000 O&M cost Yuan 10200000 fuel comsumption ton 280000 fuel price Yuan/ton 300 fuel cost Yuan 84000000 Internal consumption ratio % 11 power production (MWh) MWh 177000 Life time years 20 discount rate 0.12 CRF
0.13
Lc Yuan/MWh 686.50 The life cost of power production is 686.5 Yuan/MWh, which is obviously lower that the subsidy electricity price, 750 Yuan/MWh (include tax). But it is higher than electricity price exclude VAT.
41
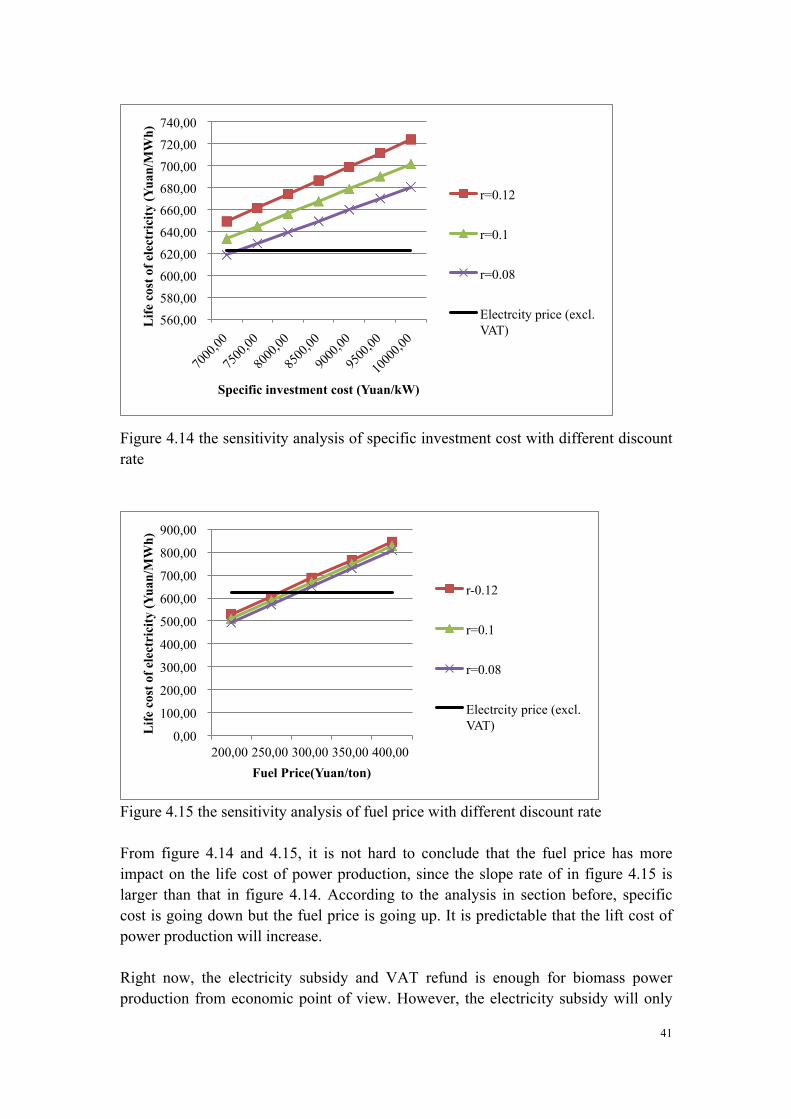
Figure 4.14 the sensitivity analysis of specific investment cost with different discount rate
Figure 4.15 the sensitivity analysis of fuel price with different discount rate From figure 4.14 and 4.15, it is not hard to conclude that the fuel price has more impact on the life cost of power production, since the slope rate of in figure 4.15 is larger than that in figure 4.14. According to the analysis in section before, specific cost is going down but the fuel price is going up. It is predictable that the lift cost of power production will increase. Right now, the electricity subsidy and VAT refund is enough for biomass power production from economic point of view. However, the electricity subsidy will only
560,00
580,00
600,00
620,00
640,00
660,00
680,00
700,00
720,00
740,00
Life
cos
t of e
lect
rici
ty (Y
uan/
MW
h)
Specific investment cost (Yuan/kW)
r=0.12
r=0.1
r=0.08
Electrcity price (excl. VAT)
0,00
100,00
200,00
300,00
400,00
500,00
600,00
700,00
800,00
900,00
200,00 250,00 300,00 350,00 400,00
Life
cos
t of e
lect
rici
ty (Y
uan/
MW
h)
Fuel Price(Yuan/ton)
r-0.12
r=0.1
r=0.08
Electrcity price (excl. VAT)

42
applicable for a project in first 15 years. And there is still uncertain for VAT refund. Since the fuel price is very important for control the cost, it is necessary to make new regulation on the standard and supervision of fuel market.

43
5 Discussions
There are many difficulties to do this kind of field study in China. The plants usually wouldn’t like to welcome others to visit, except for government officials. There is little information on the website about small biomass power plants. Some contact details online are not available, which brought inconvenience for contact. The whole field study was tough and quite time consuming. Except from time constraint, there are many unexpected situation as well, such as rejecting for visiting request, which makes the visit plan discounted. Nevertheless, the whole visiting trip still facilitated the overall understanding of the general outlook of this industry in China. The method used in this study is not precise. The factor analysis is to conclude the most interesting issues in the study boundary. The economic analysis is only regarded as support of argument. The analysis and results in this study are mostly dependent on the field study. As a rough guide, there are about 100 biomass combustion power plants under operation or construction. Only six of them are visited and investigated, which is not enough to get solid conclusion. Since the result is based on the information from the interviews, the credibility of interview must influence the accuracy of the result. Although not all information from the visit are believable. Especially, the quantity analysis is difficulty to carry out. Each plant seems unduly reticent on the subject of profit. However, all the managers interviewed reflected some similar problems. Hence, the conclusion is convincing in this study. The cost effective is a convincing indicator to compare the technology used. But lacking of detailed information about fuel quality and real operation parameters, this indicator is hard to evaluate. But it is true that some newly built plants, such as plant 4 visited, chose the fluidized bed boiler. This shows, from one aspect, foreign technology is not that superior compared to domestic technology. As the most interesting contemporary problem for biomass power project owners, the quantity and quality of fuel is not easy to handle. Although the biomass solid fuel can be a proper solution, it still takes time to achieve that, nevertheless the cost efficiency issue at the beginning. Currently, one way to deal with this issue is to find a proper fuel supplier and sign the contract to make sure the fuel supplement. Another way is to cooperate with other project owners to control the fuel market. But it is not easy since each plant only care about its own interest. It is said that to develop the biomass power production is increase the income of peasants. In practice, as mentioned in the background, unlike European ranch, the arable land per capita is much less. This infers that available straw source is highly fragmented and hard to be collected. This special condition results in occurrence of an
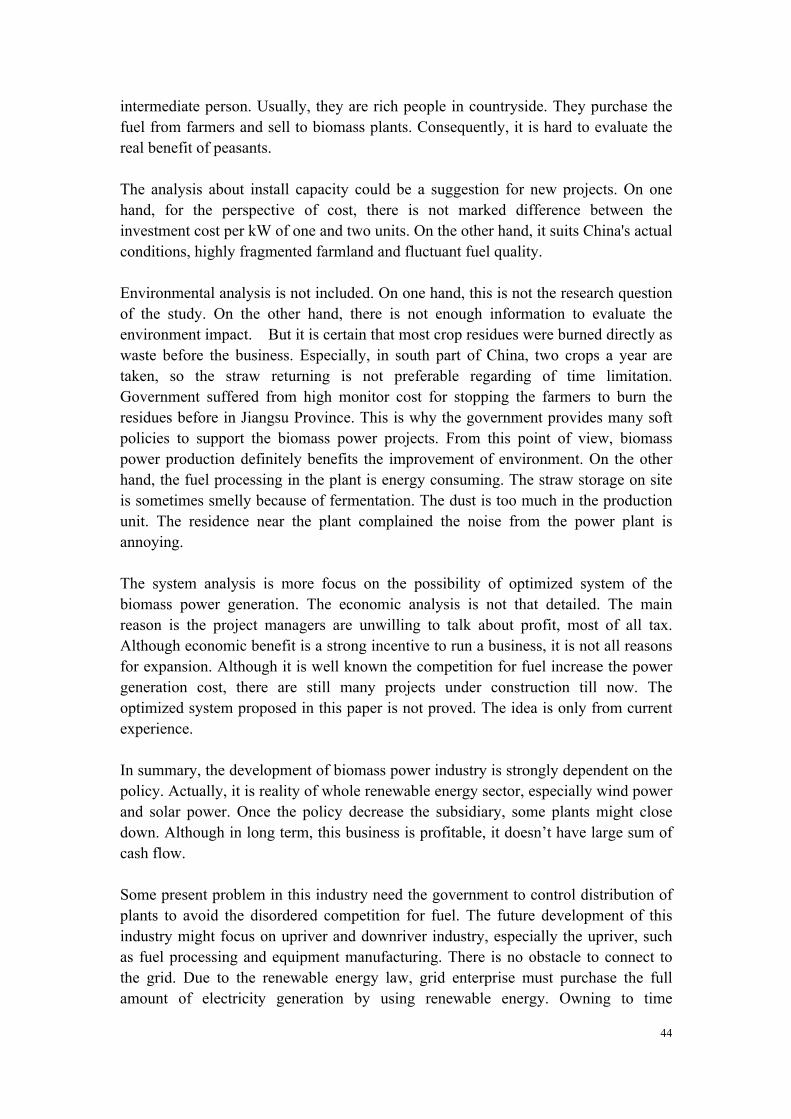
44
intermediate person. Usually, they are rich people in countryside. They purchase the fuel from farmers and sell to biomass plants. Consequently, it is hard to evaluate the real benefit of peasants. The analysis about install capacity could be a suggestion for new projects. On one hand, for the perspective of cost, there is not marked difference between the investment cost per kW of one and two units. On the other hand, it suits China's actual conditions, highly fragmented farmland and fluctuant fuel quality. Environmental analysis is not included. On one hand, this is not the research question of the study. On the other hand, there is not enough information to evaluate the environment impact. But it is certain that most crop residues were burned directly as waste before the business. Especially, in south part of China, two crops a year are taken, so the straw returning is not preferable regarding of time limitation. Government suffered from high monitor cost for stopping the farmers to burn the residues before in Jiangsu Province. This is why the government provides many soft policies to support the biomass power projects. From this point of view, biomass power production definitely benefits the improvement of environment. On the other hand, the fuel processing in the plant is energy consuming. The straw storage on site is sometimes smelly because of fermentation. The dust is too much in the production unit. The residence near the plant complained the noise from the power plant is annoying. The system analysis is more focus on the possibility of optimized system of the biomass power generation. The economic analysis is not that detailed. The main reason is the project managers are unwilling to talk about profit, most of all tax. Although economic benefit is a strong incentive to run a business, it is not all reasons for expansion. Although it is well known the competition for fuel increase the power generation cost, there are still many projects under construction till now. The optimized system proposed in this paper is not proved. The idea is only from current experience. In summary, the development of biomass power industry is strongly dependent on the policy. Actually, it is reality of whole renewable energy sector, especially wind power and solar power. Once the policy decrease the subsidiary, some plants might close down. Although in long term, this business is profitable, it doesn’t have large sum of cash flow. Some present problem in this industry need the government to control distribution of plants to avoid the disordered competition for fuel. The future development of this industry might focus on upriver and downriver industry, especially the upriver, such as fuel processing and equipment manufacturing. There is no obstacle to connect to the grid. Due to the renewable energy law, grid enterprise must purchase the full amount of electricity generation by using renewable energy. Owning to time

45
limitation, the study doesn’t contain the analysis of upriver industries. Although, technology is compared, the equipment manufacturer is not investigated deeply. As for biomass solid fuel, only online information shows that the production scale is limited. The annual production in one company is only 60000 tons, which can only feed a biomass power plant with installed capacity of 6 MW. The related corollary equipment is not on the market.
46
6 Conclusion
Biomass power generation industry has just developed for recent years. But it developed rapidly. Now, there are more than 100 biomass power generation project. Since the scale of this kind of biomass power plant is much smaller than that of conventional coal fired power plant, little information could be found online. There are both positive and negative news about this. And there is few scientific articles about this specific area as well. This report aimed to investigate this area by combining scientific articles, information online and case study. The case study is carried out by field study and interview. The questionnaire was well prepared to answer the specific questions in the beginning of this report. The collected answers from different projects are the main source of results in this report. From the case study, it can conclude that on the whole government policy is the key factor for the boom and development of biomass power generation in China. Generally, some projects are running well whereas some are not. Many new projects are under construction. The entire industry develops vigorously in recent years. Considering that the target of renewable energy set by NDRC, the expansion of this industry is predictable in next ten years. From perspective of current situation, the fuel source apparently is the most severe problem for almost all power plants. On one hand the fuel quality has the most impact of continuous production, on the other hand, the fuel price influence the profit directly. These are caused by two reasons. One is competition for the fuel source because of the close distance of power plants. Another reason is difficulty of collection caused by the distribution characteristics of agricultural planting. The former problem can be relieved by rational planning in one area. The latter is impossible to change. This is why large scale biomass power plant is hard to operate in China. Owning to the difficulty of fuel collection and bad fuel quality, it is more flexible to select equipment of smaller scale. Technology is another factor investigated in this report. In Zhen-yu Zhao’s article, [5] a recent article on assessment of the biomass power generation industry in China, the author concluded that ‘due to lack of core technologies, the operation and maintenance of China’s biomass power generation system will continue to rely on the Western manufacturers in the near future.’ However based on my study, technology is no more obstacle of development of biomass direct combustion power generation. Although there is no cost analysis for foreign technology and domestic technology, both of them can have good performance of continuous production. Two kind of technologies are both considerable when designing a new project. Therefore, a solution for current difficulties power plants face is to control the fuel source. Centralized fuel processing might be the direction of future development. For

47
the long term, the development of manufacturer and material suppliers as well as costumers is of great significance for the development of this industry. Renewable energy is strongly dependent on the preferential policy, especially the subsidy. Subsidy provides the economic incentive to do investment in biomass power generation. It is important to conclude that the current policies are enough to make this business profitable from perspective of economy without considering the uncontrollable straw price. As analyzed before, CDM makes up a small proportion in the whole revenue. But it is a beneficial complement for biomass power generation project. What should be done is that the implementation of policy and overall planning are still need more improvements. Especially, the fuel suppliers are usually a small private business, which lack of supervision. To be conclude, to promote the development of the whole industry chain should promote the healthy development of the biomass power generation industry.
48
7 References
[1] China reiterates it remains world's second largest energy user, Global Times, 2010.08 http://www.globaltimes.cn/business/china-economy/2010-08/562581.html [2] Swartz S., Oster S. The Wall Street Journal, 2010.06 http://online.wsj.com/article/SB10001424052748703720504575376712353150310.html [3] National Bureau of Statistics of China, China Energy Statistics Yearbook 2010. China Statistics Press, Beijing, 2010 [4] National Development and Reform Commission, Mid- and Long-Term Development Planning for Renewable Energy. 2007 [5] Zhao, Zhen-yu, and Hong Yan. "Assessment of the biomass power generation industry in China." Renewable Energy 37.1 (2012): 53-60. [6] Huber G. W., Iborra S., Corma A., Chem. Rev., 2006, 106: 4044-4098 [7] What is BIOMASS? Biomass energy center http://www.biomassenergycentre.org.uk/portal/page?_pageid=76,15049&_dad=portal [8] Study on China Biomass Energy Technology Development Roadmap, Energy Research Institute, National Development and Reform Commission, 2010, 22-26 [9] Wenge Li, et al., Study on Crop residue returning, Hunan Agricultural Sciences, 2006, (1): 46-48 [10] Output of rural biogas in China reaches 13 billion cubic meters, Xinhuanet, 2010.12 http://news.xinhuanet.com/2010-12/01/c_12836125.htm [11] Yanli, Zhang. "The current situation and development countermeasures of rural biogas in China." Renewable Energy 4 (2004): 5-8. [12] Characteristics of Biomass as a Heating Fuel, Penn State Biomass Energy Center, The Pennsylvania State University 2010 [13] Jenkins, B. M., L. L. Baxter, and T. R. Miles. "Combustion properties of
49
biomass." Fuel Processing Technology 54.1 (1998): 17-46 [14] Biomass Combustion and Co-firing: An Overview, IEA Bioenergy [15] Small-scale biomass CHP technologies Situation in Finland, Denmark and Sweden OPET Report 12, European Commission, 2004 [16] Wang Qinhui, Circulating fluidized bed biomass direct combustion power generation technology, Institute of Thermal Engineering, Zhejiang University [17] http://en.wikipedia.org/wiki/Steam_turbine [18] Steam turbines, Center for Advanced Energy Systems (CAES) http://njchp.rutgers.edu/files/Steam_Turbines.pdf [19] Van den Broek, Richard, André Faaij, and Ad van Wijk. "Biomass combustion for power generation." Biomass and Bioenergy 11.4 (1996): 271-281. [20] http://en.wikipedia.org/wiki/Fluidized_bed_combustion [21] http://en.wikipedia.org/wiki/Rankine_cycle [22]National bioenergy corporate website http://www.nbe.cn/HomePage/content_90.shtml [23] National bioenergy corporate website http://www.nbe.cn/HomePage/2011-03-04/page_55.shtml [24] Renewable Energy Electricity Price Subsidies and Quota Trading Program during 1st half of 2009, NDRC (2010) http://www.sdpc.gov.cn/zcfb/zcfbtz/2010tz/t20100906_369724.htm [25] Ming, Zeng, Xue Song, and Zhu Xiaoli. "China's 12th Five-year plan pushes power industry in new directions." Power 156.1 (2012): 50-55. [26] Renewable Energy Law of the People's Republic of China, Standing Committee of the National People's Congress (2005) http://www.china.com.cn/chinese/law/798072.htm [27] Amending the Renewable Energy Law of the People's Republic of China, Standing Committee of the National People's Congress (2009) http://www.gov.cn/flfg/2009-12/26/content_1497462.htm [28] Trial Measures for Pricing and Cost Sharing Management for Renewable Energy

50
Power, NDRC (2006) http://www.ndrc.gov.cn/jggl/zcfg/t20060120_57586.htm [29] Renewable Energy Electricity Price Subsidies and Quota Trading Program during Jan-Sept. 2007, NDRC (2008) http://www.ndrc.gov.cn/zcfb/zcfbtz/2008tongzhi/t20080407_202765.htm [30]Renewable Energy Electricity Price Subsidies and Quota Trading Program during Oct. 2007-Jun. 2008, NDRC (2008) http://www.ndrc.gov.cn/zcfb/zcfbtz/2008tongzhi/t20081201_249341.htm [31]Renewable Energy Electricity Price Subsidies and Quota Trading Program during 2st half of 2008, NDRC (2009) http://www.ndrc.gov.cn/zcfb/zcfbtz/2009tz/t20090701_289021.htm [32] Renewable Energy Electricity Price Subsidies and Quota Trading Program during 1st half of 2009, NDRC (2009) http://www.ndrc.gov.cn/zcfb/zcfbtz/2009tz/t20091225_321471.htm [33]Renewable Energy Electricity Price Subsidies and Quota Trading Program during 2nd half of 2009, NDRC (2010) http://www.sdpc.gov.cn/zcfb/zcfbtz/2010tz/t20100906_369724.htm [34] Renewable Energy Electricity Price Subsidies and Quota Trading Program during Jan-Sept. 2010, NDRC (2011) http://www.sdpc.gov.cn/zcfb/zcfbtz/2011tz/t20110215_394858.htm [35] Perfect the Pricing Policy for Agricultural Biomass and Forest Biomass Power Generation, NDRC (2010) http://www.sdpc.gov.cn/zcfb/zcfbtz/2010tz/t20100728_363362.htm [36] Policies regarding the Value Added Tax on Products Made through Comprehensive Utilization of Resources and Other Products, MOF (2008) http://www.chinaacc.com/new/63_67_/2008_12_15_wa2390254295121800215345.shtml [37] Vennemo, Haakon, et al. "Domestic environmental benefits of China's energy-related CDM potential." Climatic Change 75.1 (2006): 215-239. [38] Rive, Nathan, and Kristin Aunan. "Quantifying the air quality cobenefits of the clean development mechanism in China." Environmental Science & Technology44.11 (2010): 4368-4375.

51
[39] He, Xuewei, Ke Wang, and Ji Zou. "Evaluation of impact and effectiveness on China's sustainability of China's CDM projects." Remote Sensing, Environment and Transportation Engineering (RSETE), 2011 International Conference on. IEEE, 2011. [40] Qing-yue, Yan, and Qin Yang. "A study on electricity price subsidy mechanism of biomass based power generation of China." E-Business and E-Government (ICEE), 2011 International Conference on. IEEE, 2011 [41] China Clean Development Mechanism market policy environment and development before 2012, China - European Union clean development mechanism promotion project (2012) [42] Dragon Power Corporate website http://www.dragonpower.com/ [43] Jinan Ruitong boiler company website http://chenjunjie.boiler.com.cn/ [44] National bioenergy corporate website http://www.nbe.cn/HomePage/content_9.shtml [45] Catalogue for the Guidance of the Industrial Development of Renewable Energy, NDRC (2005) http://www.ndrc.gov.cn/zcfb/zcfbtz/zcfbtz2005/t20060206_58705.htm [46] Zhongjieneng Suqian 2*12MW Biomass Direct Burning Power Plant Project, UNFCCC (2007) http://cdm.unfccc.int/Projects/DB/TUEV-SUED1166630587.15/view [47] Interim Rules on Economic Assessment of Electrical Engineering Retrofit Projects. State Power Corporation of China, Beijing: China Electric Power Press, 2003 [48] China’s 11th Five-Year Plan for renewable energy, National Development and Reform Commission, 2008 [49] Zhou, Xinping, et al. "Assessment of sustainable biomass resource for energy use in China." Biomass and Bioenergy 35.1 (2011): 1-11. [50] Shen, Lei, et al. "Development potentials and policy options of biomass in China." Environmental management 46.4 (2010): 539-554. [51] Lindlof and B.C. Taylor, Qualitative Communication Research Methods (second ed), Sage Publications, Thousand Oaks, CA (2002), p. 195

52
[52] China launches world’s largest biomass power plant, 2012.01 http://www.greenprospectsasia.com/content/china-launches-world%E2%80%99s-largest-biomass-power-plant [53] The Contribution of the Clean Development Mechanism under the Kyoto Protocol to Technology Transfer, UNFCCC (United Nations Framework Convention on Climate Change), 2010 [54] Seres, Stephen, and Erik Haites. "Analysis of technology transfer in CDM projects." Prepared for the UNFCCC Registration & Issuance Unit CDM/SDM, December (2008).

53
Appendices
Table A1 Policy related to biomass power generation review
Date
Issued
Effect
ive
date
Title Issuing
authority
effectiven
ess relevant provision
Legislation
02-28-2
005
01-01-
2006
Renewable Energy
Law of the People's
Republic of China
Standing
Committe
e of the
National
People's
Congress
Revised
Article 13. The state shall encourage and
support grid synchronization of power
generated by using renewable energy;
Article 14 The relevant electricity grid
enterprise shall purchase the full amount
of the electricity generation by using
renewable energy;Chapter V gives the
regulation Price Control and Cost
Apportionment
12-26-2
009
04-01-
2010
Amending the
Renewable Energy
Law of the People's
Republic of China
Standing
Committe
e of the
National
People's
Congress
Effective
Article 14 shall be amended as: “The
state applies the system of guaranteeing
the purchasing of electricity generated
by using renewable energy resources in
full amount.Chapter V shall be amended
as “Price Control and Cost
Compensation
Regulations
11-29-2
005
Catalogue for the
Guidance of the
Industrial
Development of
Renewable Energy
NDRC
Give the direction of investment and
construction: 60.Biomass direct
combustion for power generation;
64.Biomass solid fuel
01-04-2
006
01-01-
2006
Trial Measures for
Pricing and Cost
Sharing Management
for Renewable Energy
Power
NDRC Effective
Article 7 The standard for the RE power
subsidy price is 0.25 Yuan per
kilowatt-hour. The RE power subsidy
price is enjoyed for the first 15 years of
operation. After 15 years of operation,
the RE power subsidy price will be
canceled.
Beginning in 2010, the RE power
subsidy price for new power projects
approved each year will be 2% less than
those approved in the previous year.
01-05-2
006
01-05-
2006
Administrative
Provisions on NDRC Effective
declare the regulation of project
management and power generation

54
Renewable Energy
Power Generation
enterprise responsibilities
05-30-2
006
05-30-
2006
Interim Measure on
Management of the
regenerable energy
development fund
MOF
the requirement and procedures of
application on the regenerable energy
development fund
01-11-2
007
01-11-
2007
Issuance of the
Interim Measures for
Allocation of Income
from Surcharges on
Renewable Energy
Power Prices
NDRC Effective
Power-grid enterprises, in accordance
with the time stipulated in the power
purchase agreement with power
generation enterprises, settle accounts
for electricity fees and the subsidies on a
monthly basis.
07-24-2
006
07-01-
2006
Trial Implementation
Measures on Tax
Refund
Administration for the
Purchase of
Home-made
Equipment for
Foreign-funded
Projects
STA;
NDRC Expired
12-25-2
008
01-01-
2009
Stopping the
Implementation of the
Policy of Refunding
Tax to
Foreign-funded
Enterprises for Their
Purchase of
Home-made
Equipment
MOF
STAC
Effective Stopping the Implementation of part of
articles
03-10-2
008
Renewable Energy
Electricity Price
Subsidies and Quota
Trading Program
during Jan-Sept. 2007
NDRC;
SPRC
Straw-fired power generation projects
are included within the scope of
subsidies from January to September
2007, and were granted a temporary
on-grid electricity price subsidy of RMB
0.1/kWh
11-11-2
008
Renewable Energy
Electricity Price
Subsidies and Quota
Trading Program
during Oct. 2007-Jun.
2008
NDRC;
SPRC
Straw-fired power generation projects
are included within the scope of
subsidies from October 2007 to June
2008, and were granted a temporary
on-grid electricity price subsidy of RMB
0.1/kWh
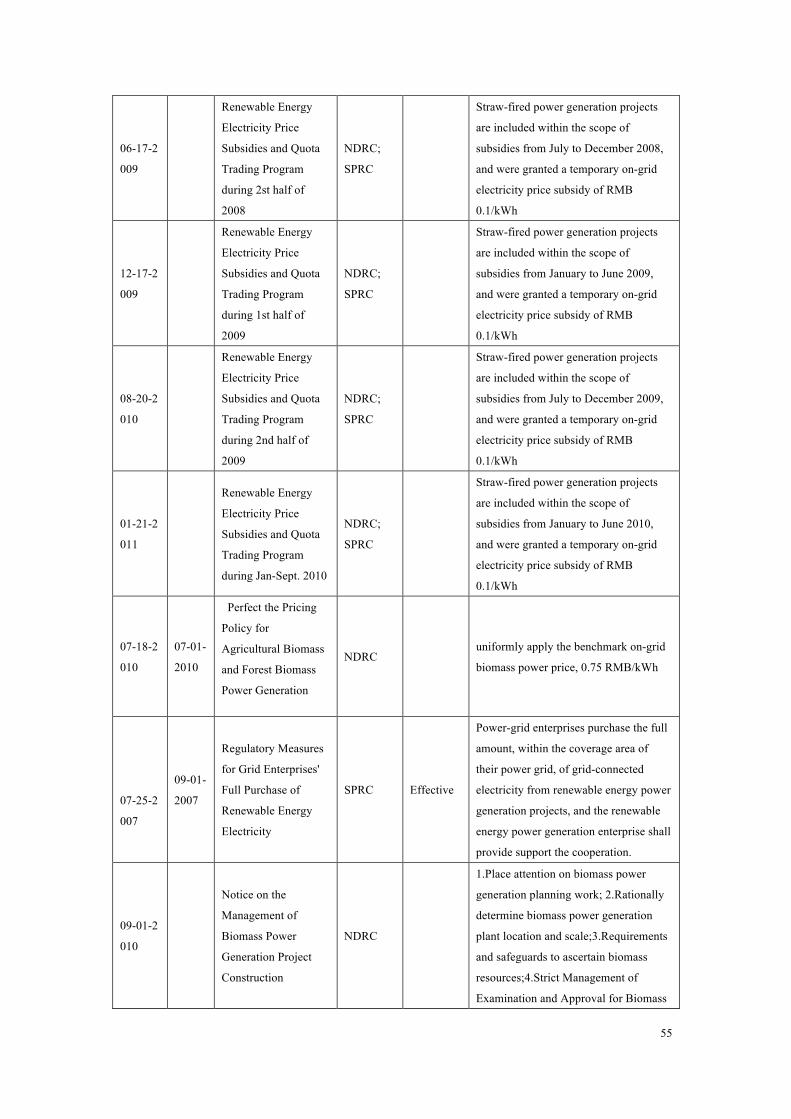
55
06-17-2
009
Renewable Energy
Electricity Price
Subsidies and Quota
Trading Program
during 2st half of
2008
NDRC;
SPRC
Straw-fired power generation projects
are included within the scope of
subsidies from July to December 2008,
and were granted a temporary on-grid
electricity price subsidy of RMB
0.1/kWh
12-17-2
009
Renewable Energy
Electricity Price
Subsidies and Quota
Trading Program
during 1st half of
2009
NDRC;
SPRC
Straw-fired power generation projects
are included within the scope of
subsidies from January to June 2009,
and were granted a temporary on-grid
electricity price subsidy of RMB
0.1/kWh
08-20-2
010
Renewable Energy
Electricity Price
Subsidies and Quota
Trading Program
during 2nd half of
2009
NDRC;
SPRC
Straw-fired power generation projects
are included within the scope of
subsidies from July to December 2009,
and were granted a temporary on-grid
electricity price subsidy of RMB
0.1/kWh
01-21-2
011
Renewable Energy
Electricity Price
Subsidies and Quota
Trading Program
during Jan-Sept. 2010
NDRC;
SPRC
Straw-fired power generation projects
are included within the scope of
subsidies from January to June 2010,
and were granted a temporary on-grid
electricity price subsidy of RMB
0.1/kWh
07-18-2
010
07-01-
2010
Perfect the Pricing
Policy for
Agricultural Biomass
and Forest Biomass
Power Generation
NDRC
uniformly apply the benchmark on-grid
biomass power price, 0.75 RMB/kWh
07-25-2
007
09-01-
2007
Regulatory Measures
for Grid Enterprises'
Full Purchase of
Renewable Energy
Electricity
SPRC Effective
Power-grid enterprises purchase the full
amount, within the coverage area of
their power grid, of grid-connected
electricity from renewable energy power
generation projects, and the renewable
energy power generation enterprise shall
provide support the cooperation.
09-01-2
010
Notice on the
Management of
Biomass Power
Generation Project
Construction
NDRC
1.Place attention on biomass power
generation planning work; 2.Rationally
determine biomass power generation
plant location and scale;3.Requirements
and safeguards to ascertain biomass
resources;4.Strict Management of
Examination and Approval for Biomass

56
Power Generation Projects
Taxation
12-09-2
008
07-01-
2008
Policies regarding the
Value Added Tax on
Products Made
through
Comprehensive
Utilization of
Resources and Other
Products
MOF
STA
Partially
Invalid
Article 3. Value-added Tax Policies for
power and heat prodeuced from waste
(include forest and agricultural
residues )is levy and refund.
08-20-2
008
01-01-
2008
Management Issues
concerning the
Income Tax
Preference for
Enterprises of
Comprehensive
Utilization of
Resources
MOF
STA
NDRC
effective
The income shall be calculated into the
total income of the enterprise in the year
at the reduced rate of 90%.
Appendix 2. Questionnaire designed in this report Question Basic information Location_______ Date__________interviewer________
1. When did the plant begin to build? 2. When did it connect to grid and begin to sell electricity?
Technology 3. What type of technology is used? Why choose this one? Cost for all these
equipment? 4. What is the installed capacity? 5. Is the equipment possible for multi-type of fuel? 6. How long does it need to clean up the boiler? 7. How long does it need to maintenance? Who takes responsibility of this? What
is the cost for maintenance?
Production 8. How many hours do the plant operated per year? 9. Can the equipment run at the full capacity? How long time? 10. What are the parameters for boiler and turbine? (the temperature and pressure
of turbine)

57
11. How much electricity (and heat) produced per year? How production changed during the year?
12. What is the price for electricity (heat)? How does it fluctuate during these years?
13. Are there any obstacles for connecting to the grid? 14. Is shutdown happened often? What is the reason for shutdown? 15. Do you get your staff well trained? How well do they handle the machine? Do
you need to hire professional institution to debug the instrument? 16. Is it easy to hire some professional staff?
Fuel source 17. What is your primary fuel source? Yearly comsuption? 18. How to collect the fuel source? What about the price? How to make sure the
quality of the source (moisture content)? 19. What do you do when non-harvest season? Do you have storage area? How
much is the storage capacity? How long can the storage feed the boiler? 20. How did collection change in one year? 21. How to pretreat the source? Need dry the source first or separate the impurities?
Do you have dry and separation equipment?
Energy consumed 22. How much electricity and water consumed per year. Is electricity from the
Grid or the inside generator? What is the price of electricity from the grid? 23. How do you recycle the water? 24. Do you experience the power cut often? 25. When burning the biomass, does it need to mix with coal or diesel? How much
fossil fuel consumed per year? What is the price for these?
Policies 26. Do you know national or local preferential policies for renewable energy?
How are they carried out? 27. What is the rate for VAT? 28. To what extent, do you know CDM? 29. If not CDM Have you ever heard about CDM? Do you plan to apply? If CDM Did you get money on time each year? If the emission reduction cannot reach the
target, what will be the result? Others
30. How many competitors do you have? How do you evaluate them? Biomass power plant:

58
Coal-fired power plant: 31. Why do (or not) you design the plant as a CHP plant? What is your
consideration? 32. What are the current problems that your plant faces? How do you plan to
solve? 33. Do you have the clear plan for next 5 years?
For fuel seller 1. How many acre of farmland do you have? 2. How much residues is produced in an acre of land? 3. What is the cost for transportation of these residues to the collection spot? 4. What is the price for selling these? Who decide it? 5. How did you deal with these residues before? 6. What do you think about the biomass plant? Do you think you get real benefit? 7. Do you think the new plant improve the environment?