case for climate action: policies produce major co-benefits
DESCRIPTION
Case for Climate Action: Policies Produce Major Co-Benefits. Ned Helme, Executive Director Center for Clean Air Policy * * * Phoenix, AZ April 29, 2004. Center for Clean Air Policy. - PowerPoint PPT PresentationTRANSCRIPT

Case for Climate Action: Policies Produce Major Co-Benefits
Ned Helme, Executive Director
Center for Clean Air Policy* * *
Phoenix, AZ
April 29, 2004

Center for Clean Air Policy Non-profit environmental think-tank, founded by governors in
1985, to work with governments to develop practical strategies to protect AQ and climate
Designed emission trading and climate policy measures for European Community and range of developing and Eastern European countries
Major issues currently include climate change, air quality, transportation/smart growth
Working with many states to take action on climate change (including CA, CT, MA, ME, NJ, NY, WA, WI)
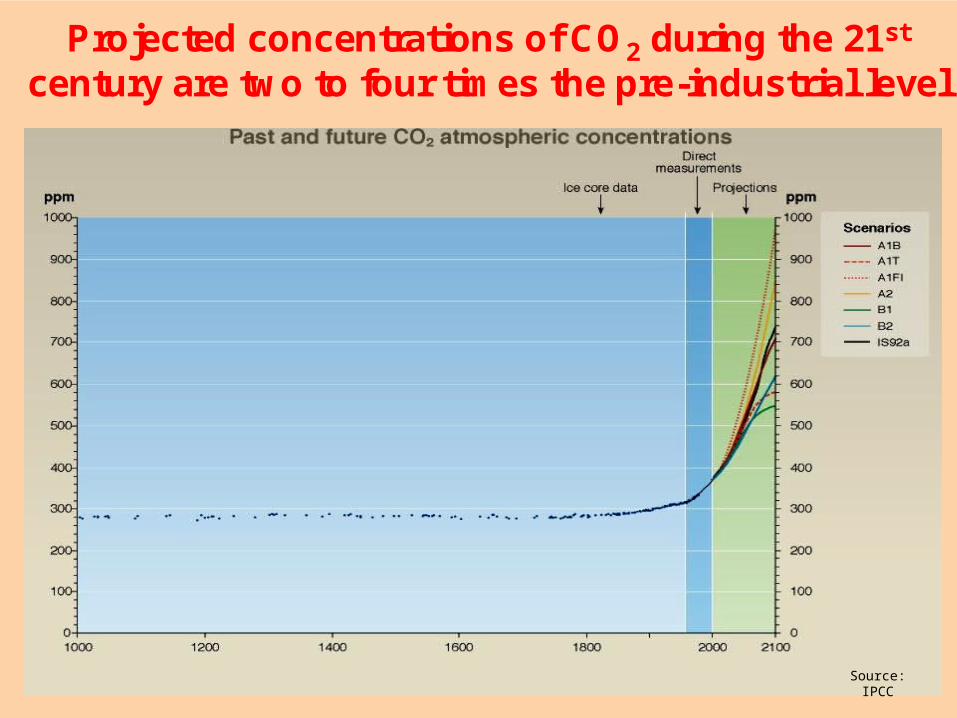
Projected concentrations of CO2 during the 21st
century are two to four times the pre-industrial level
Source: IPCC

Effects of Warming Climate
Melting glaciers and ice caps Rising sea level Adverse impacts on water supplies Heat waves & more severe storms Disruption of ecological systems, shift or loss
of species Invasive species and vector-borne illness Changes in crop productivity Bleaching of coral reefs Premature deaths, lung disease (black
carbon)

Observed Evidence of Climate Change
Global-average surface temperature increased by about 0.6 ºC over 20th century, 0.5 ºC since 1950
1990s warmest decade and 1998 warmest year in last 1000 years in Northern Hemisphere, 2003 3rd warmest year
Widespread retreat of mountain glaciers during 20th century Northern Hemisphere spring and summer sea-ice extent decreased
by 10-15% since 1950s Global-average sea level has increased by 10-20 cm during 20th
century 0.5-1% per decade increase in Northern Hemisphere mid-latitude
precipitation during 20th century 2-4% increase in frequency of heavy precipitation events in
Northern Hemisphere mid- and high-latitudes over latter half of 20th century
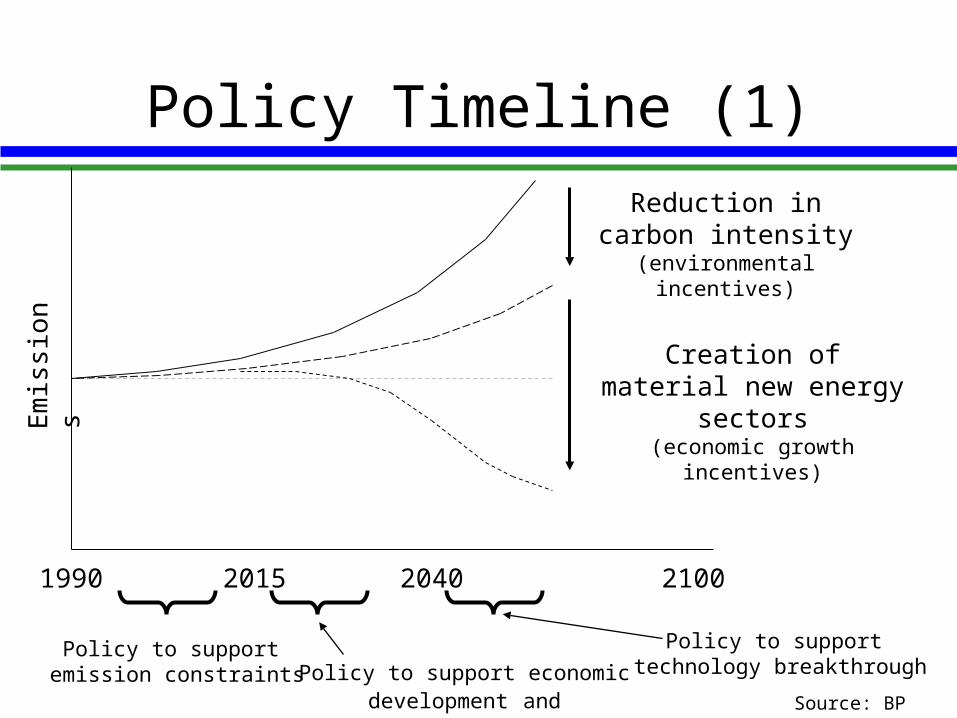
1990 2015 2040 2100
Reduction in carbon intensity
(environmental incentives)
Creation of material new energy sectors
(economic growth incentives)
Policy to support emission constraints
Em
issi
on
s
Policy to support technology breakthroughPolicy to support economic
development and competitiveness
Policy Timeline (1)
Source: BP

Policy Timeline (2)
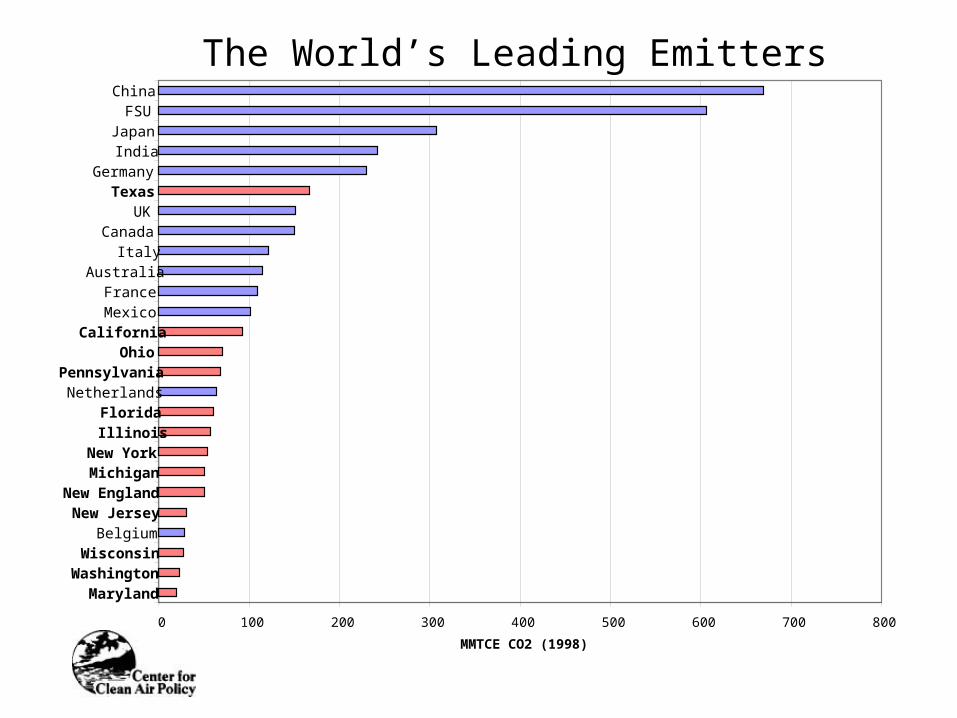
The World’s Leading Emitters of CO2
0 100 200 300 400 500 600 700 800
MarylandWashington
WisconsinBelgium
New JerseyNew England
MichiganNew York
IllinoisFlorida
NetherlandsPennsylvania
OhioCalifornia
MexicoFrance
AustraliaItaly
CanadaUK
TexasGermany
IndiaJapan
FSUChina
MMTCE CO2 (1998)

Co-benefits of What?
Difficult to talk about Co-benefits without identifying which policy is primary
Comm. Bob Shinn of New Jersey: CO2 reduction is the unifying theme for environmental/energy policy
If you reduce CO2, most other pollutants are swept up in the process

Climate Policy Touches All Sectors of the Economy
Smart Growth/infrastructure Vehicles Energy Efficiency Renewable Energy Energy Fuels Consumer Products Agriculture and Forestry Waste

Co-Benefits of Climate Policies
Health, Air Quality Energy Security Technological Innovation Enhanced Mobility Economic Competitiveness Infrastructure cost savings Economic Development/Jobs

Approaches to Reducing CO2 and Achieving Co-
Benefits
1. “Follow the Money” – Directing state budget outlays toward climate-friendly investments
2. Moving Markets - Using state financial leverage to move new product markets
3. Regulations or Incentives – push and pull policies to encourage reductions and technological innovation

Shifting Funding Towards Better Alternatives
New York: State Energy Plan - redirects State funding toward energy-efficient transportation alternatives – evaluates GHG impacts
New Jersey: Executive Order 4 - requires that state funding be consistent with smart growth principles
Massachusetts “fix-it-first” policy + targeting infrastructure monies to climate-friendly projects
Funding transit, biking, and walking facilities, and encouraging in-fill and transit-oriented development. –
50% difference in VMT in dense areas vs. suburban sprawl
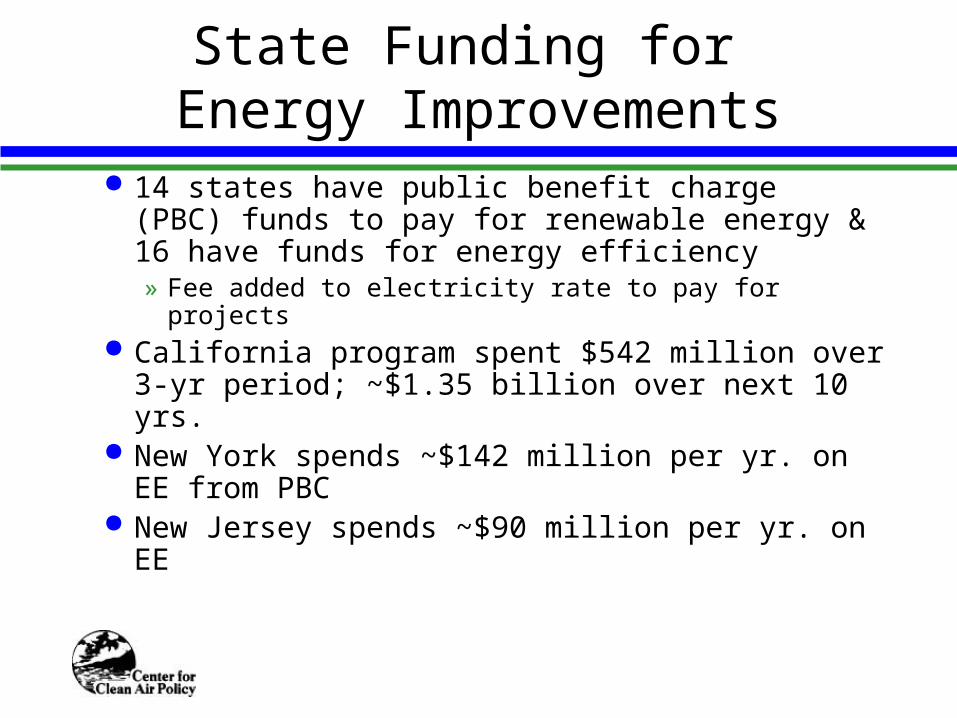
State Funding for Energy Improvements
14 states have public benefit charge (PBC) funds to pay for renewable energy & 16 have funds for energy efficiency» Fee added to electricity rate to pay for projects
California program spent $542 million over 3-yr period; ~$1.35 billion over next 10 yrs.
New York spends ~$142 million per yr. on EE from PBC
New Jersey spends ~$90 million per yr. on EE
Moving Markets (1)
State spending can spur markets through targeted procurement
Ct exec order requires state RE purchases of 20% by 2010, 100% by 2050
Many states set energy use efficiency goals Massachusetts – Replacement of state vehicles
with high-efficiency vehicles, disposal of non-essential SUVs, bar SUV purchase in future
New York – clean fuel bus purchase program

Moving Markets (2)
State tax and grant programs can encourage particular products:
Indiana – 30% of project costs for fuel cells & CHP Maryland – up to $2,000 excise tax exemption for
purchases of hybrid vehicles, sales tax exemption for energy star AC, heating & refrigerators
Georgia – up to $2500 tax credit for electric & biofuel vehicles
Arizona – 25% tax credit for home solar and wind New York – grants for energy efficient industrial
process improvements
Regulation vs. Incentives Regulations include appliance efficiency
standards, emission caps, portfolio standards Incentives include R&D programs, tax credits,
production credits, loan programs Tradeoff between policy based regulation or
market incentive» Regulation = less politically popular, less impact
on state budget, broader participation, more certainty of achieving goal
» Incentives = more politically popular, more impact on state budget, voluntary participation, less certainty

Regulations/Incentives to Encourage Renewables
Regulation:» CA Renewable Portfolio Standard (RPS) - 20% by 2017 -
equates to between 3,000 and 8,000 MW of additional RE» Tx RPS coupled w/ robust REC trading market – 2000 MW
by 2009 Incentive:
» MI NextEnergy program – 20-year state and local tax exemption for alternative energy producers and system designers
» MN Renewable Energy Production Incentive - generation incentive payments of $0.015 per kilowatt-hour (kWh) for qualifying renewable energy technologies

Renewable Energy Expected From State Standards*
0
2,000
4,000
6,000
8,000
10,000
12,000
14,000
16,000
18,000
20,000
2000 2001 2002 2003 2004 2005 2006 2007 2008 2009 2010 2011 2012
Me
ga
wat
ts
12,385 MW of New Renewable Energy7,540 MW of Existing Renewable Energy
Nevada
Texas
IA & WINJ & PAConnecticutMassachusettsMaine
Minnesota
AZ & NM
California
* Projected development assuming states achieve annual RPS targets.
Renewable Portfolio Standards
Source: Union of Concerned Scientists
Electricity Sector Regulations/Incentives
Regulation: Mass, NH cap CO2 emissions from power
plants, RGGI developing 9 state cap and trade strategy by April, 2005
WI/MN – standards for electric transformersIncentives:
» Texas – streamlined permitting for clean gen» Ohio – Third Frontier Project –fuel cells incentives » Illinois – R&D on geologic carbon sequestration

Curbing Automobile Emissions
13+ states implemented transport measures with climate benefits
California GHG standard for automobiles» Regulation to reduce emissions 20% by model year 2009,more by
2015
If States that have CA stds. for LEV (MA, NY, VT, NJ, CT and ME) and Canada follow this std.,29% of N. Amer. auto market would be included
Minnesota mandates 2% biodiesel by 2005, numerous ag states have ethanol requirements + sales tax redux

Strategies for Coal States: the Real Challenge
potential adverse economic impacts of reduced coal use block climate action
Key lies in new technologies to remove carbon from coal generation – IGCC w/CCS
State/fed action needed to commercialize the technology, reduce costs and improve performance
Coal States Strategy
States can provide incentives thru utility ratemaking, R&D programs
Fed loan guarantees can reduce financing costs and risk
Coupling emphasis on IGCC/CCS w/ RPS and EE efforts can reduce emissions w/ less impact on coal market

“Laboratories of Democracy”
Many environmental laws enacted by states have charted the way for later passage of major national legislation
State early action, in 1980’s, to address acid rain had major impact on passage of national legislation» Acid rain laws initially introduced in a number of
states California’s air quality laws laid groundwork for
national air quality law passed in early 1970

Conclusions
Range of cost-effective opportunities for climate policy
Many have significant economic and environmental co-benefits
States have many policy options that can be tailored to fit local conditions
State programs can be linked thru trading to EU, Canada and others

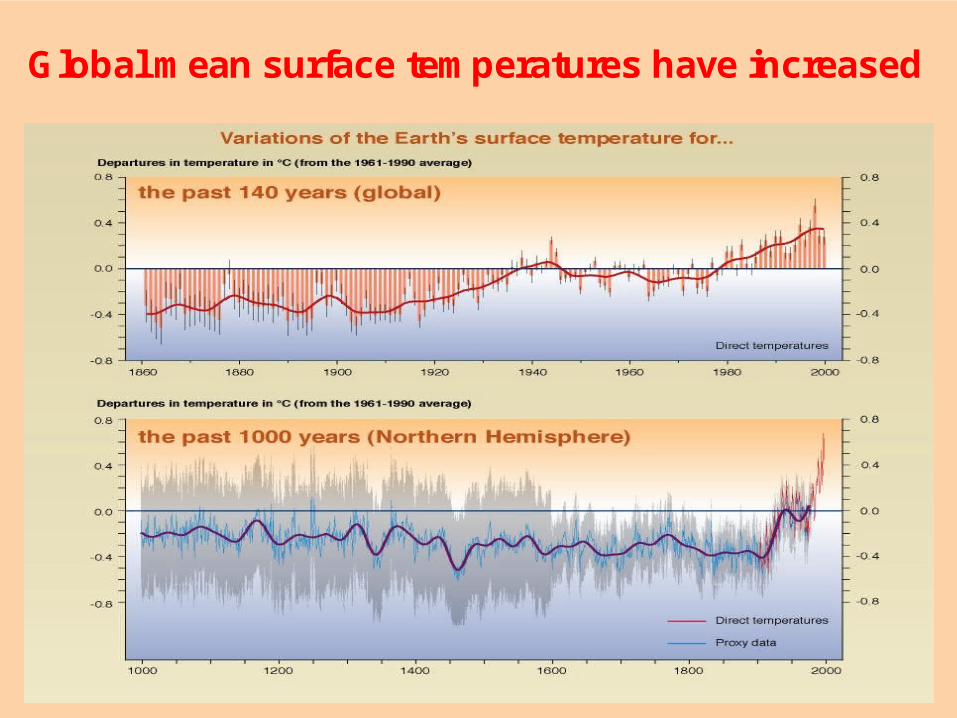
Global mean surface temperatures have increased