cassell testing, inc
TRANSCRIPT

CASSELL TESTING, INC.ENVIRONMENTAL SAMPLING AND TESTING22 WEST PADONIARD. SUITE C245, TIMPNITJM, MD 21093(3O1) 252-7742
Mr. Mark HardnerIT Corporation4790 Mosside BoulevardMonroeville, Pennsylvania 15146-2792
Report Date: January 21, 1991
Dear Mr. Hardner:
Listed below are results of analysis on a water samplecollected by IT Corp. personnell and delivered to CassellTesting, Inc. for analysis:
CTI Number: 91-0127
IT Corp. Sample #118788
Sample Location and Description: W. Barton-006-GWPF/FC
Received by Laboratory: 1/18/91 at 3:15 pm
Results:
Fecal Coliform = <3 MPN/100 mL
Sharon K. CassellPresident,Cassell Testing, Inc.
Please note: Cassell Testing, Inc. is not responsible for thecollection or transportation of the sample.
8830326!

Pages 3IT ANALYTICAL SERVICES
Coapaays IT COftPOKAXXOIl • AUSTIN, TXDates 03/13/91 (512)892-6684Client Work IDs FXXESXOMI 303484-009-04-00 Work Orders Bl-01-2
TEST NAME! 502.2 Purgeable Organic*
SAMPLE ID: 111789 HBAXXOV O07 ONPPSAMPLE DATES 01/25/91ANALYSIS DATE: 01/31/91 Detection
Result! in ug/L: LimitVinyl chloride ND 0.15
Comment•: 'ND' or '<' indicates that the compound is not detected at the specified limit.
AR303262 M2.1-89

Page: «IT ANALYTICAL SERVICES
Company: XX CORPORATION , AUSTIN, TXD*tet 03/13/91 (512)892-6684Client Work IDI FIRESTOMI 303484-009-04-00 Work Order: Bl-01-203
TEST NAME: 502.2 Purgaabl* Organic*
SAMPLE ID: 118792 HBAKXOK 007 ONBFSAMPLE DATE: 01/25/91ANALYSIS DATE: 01/31/91 Detection
Reault* in ug/L: LimitVinyl chloride ND 0.15
Comments: 'ND' or '<' indicate* that the compound ii not detected at the specified limit.
682-1-89

IT ANALYTICAL SERVICESCoapany: IT CORPORATION AUSTIN, TXData: 03/13/91 (512)892-6684Client Work ID: FXXSSXOm 30348C-009-04-00 Work Order: B1-0
TEST NAME: 502.2 Purgeable Organics
SAMPLE ID: 118793 WBARTOK 007 OWAFSAMPLE DATE: 01/25/91ANALYSIS DATE: 01/31/91 D«t«ction
R««ulti in ug/L: LimitVinyl chloride MD 0.15
Coratn«nt«: 'ND' or '<' indicate! that the compound is not detected at the specified limit.
882-1-89

CASSELL TESTING, INC.ENVIRONMENTAL SAMPLING AND TESTING22 WEST PADONIARD, SUITE C245, TIMONIUM, MD 21093<3O1) 252-7742
Mr. Mark HardnerIT Corporation2790 Mosside BoulevardMonroeville, Pennsylvania 15146-2792
Report Date: January 28, 1991
Dear Mr. Hardner:
Listed below are results of analysis on a vater samplecollected by IT Corp. personnel and delivered to CassellTesting, Inc. for analysis:
CTI Number: 91-0189
IT Corp. Sample #118791
Sample Location and Description: W. Barton-007-GWPF/FC
Received by Laboratory: 1/25/91 at 4:00 pm
Results:
Fecal Coliform = <3 MPN/100 mL
Sharon K. CassellPresident, -Cassell Testing, Inc.
Please note: Cassell Testing, Inc. is not responsible for thecollection or transportation of the sample.
&R303265
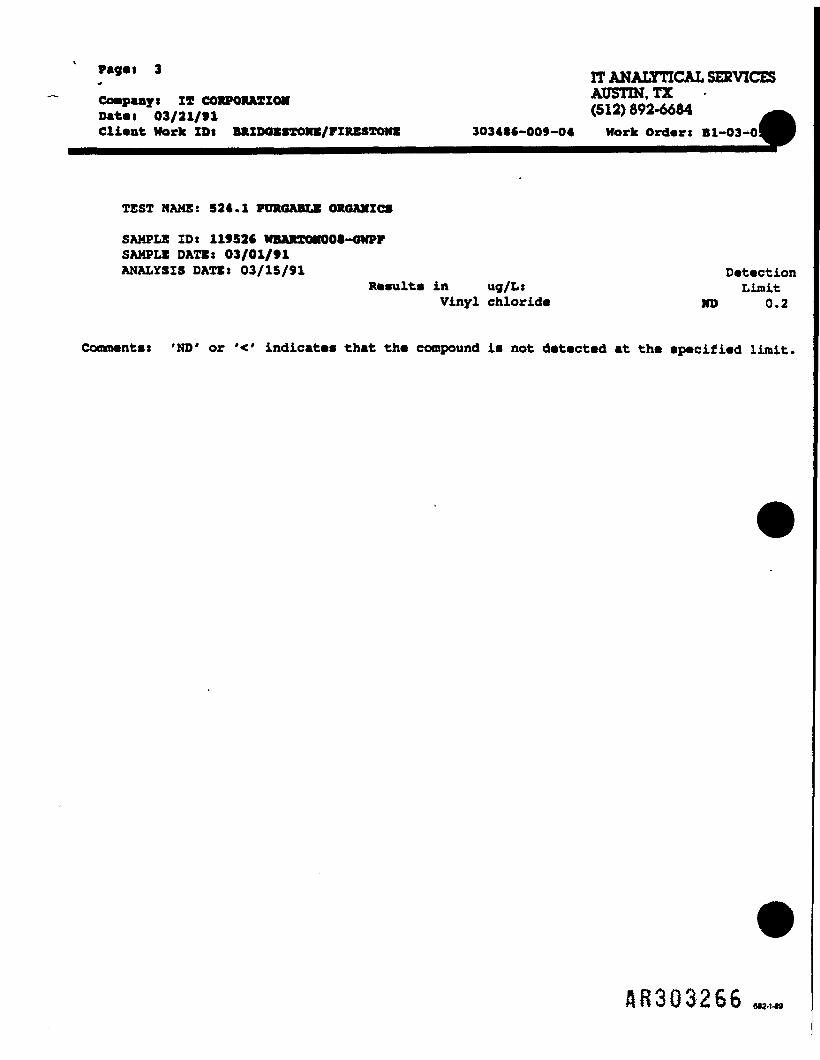
f*9*1 3 IT ANALYTICAL SERVICESCompany i IS COKFOXAZXOM a^DateT 03/21/91 <512> W2-6684Client Work ZOt BKXDOXSZOm/FXRESTOin 3034SC-009-04 Work Order i Bl-03-0
TEST NAME: 524.1 PURGABZJE OKGAMXCS
SAHPLX ID: 11952C WBMtZOHOOS-OMPrSAMPLE DATE: 03/01/91ANALYSIS DATE: 03/15/91 Detection
Results in ug/L: LimitVinyl ehlorid* MD 0.2
Coraro«nt»i 'ND' or '<' indicate* that th« compound Lm not detected at the specified limit.
AR303266 M2-149
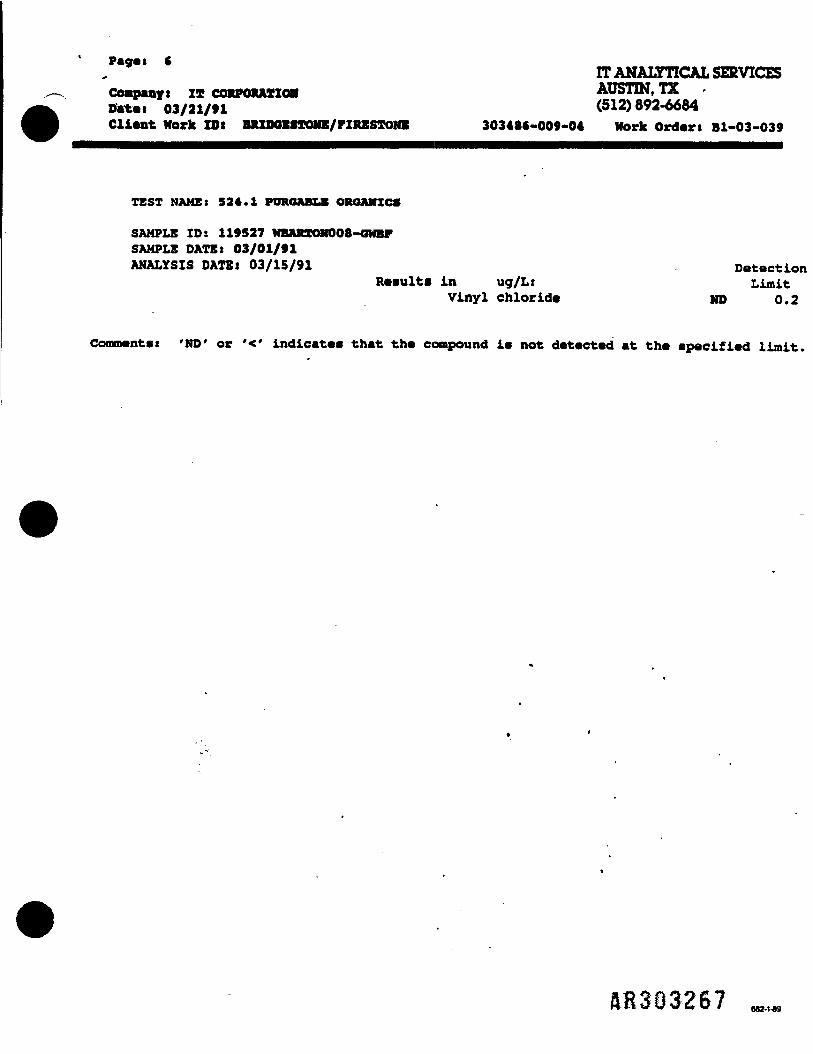
Pages C __ __, IT ANALYTICAL SERVICESCompanyi II COXPOKATION AUSTIN, TX0*tei 03/21/91 <512) 892-6684Client Work IDl BJtlDOISTONK/FIRESTONI 30348C-009-04 Work Ordert Bl-03-039
TEST NAME: 524.1 PUROABIJE OROAMXCS
SAMPLE IDS 119527 NBJUtaXUK)08-GWBPSAMPLE DATS: 03/01/flANALYSIS OATS: 03/15/91 Detection
Results in ug/Lt LimitVinyl chloride ND 0.2
Conraentss 'ND' or •<• indicates that the compound is not detected at the specified limit.
ftR303267 612-149

**9*' 7 IT ANALYTICAL SERVICESCo»p«nT» IT COWOKATIOK .-Date, 03/21/tl (512) 892-66o4Client Work IDt BJUDGEITOHB/FIRESTOinC 3034S6-009-04 Work Ordvrt H-03-0
TEST MAMB: 524.1 PURGABUE OROAVZCS
SAMPLE ID: 119329 WBAKTONOOS-OWAFSAMPLE DATEI 03/01/91ANALYSIS DATES 03/1S/91 D«taction
Results in ug/L: LimitVinyl chloride MD 0.2
Cotnrnents: 'MD' or '<' indicates that the compound is not detected at the specified limit.
AR303268 M2-1-M

COC5
584Qa
o HH
HsM
h
0 I g§
4)iHQ,r-4
!« ^N o(0 W ,, r- > CM O <v>Ol *-«w IB to \O> rt4) U 9 - i-H •.** 9 r C " ^(8 O ' N>i W C> 4J « \J n ^o «£ rg 4JIB TJ O 1 O «
fl) I ?V * tt)- M C ,V . 4J g0« O g ^ Stf <=
4) iHC "O iH
-^, - - - , O "•• 4)(04) no - r. M w H•O •• "NS * « Wa\ r-i M X\x: w tor- 18*0 * —X-wQ'U
CM C C 4J JI IB IB fO 6VO "V «W •-« C H OH O 4) O en O1ft C -1 \ H•-* w s -y ^ *^4J O .. Ok \ 2
t-4 rH M (0 •-* CO Oim 9> 9 M »4 U j;»H <T> (0 4) 0) UC «-l 4>Qi>t O W •• CO
•OlB W r - 4 < * > » > , VM > «. • (8 in O MCO ,-| •* 0) CL C f~ «T> O II> >t W W l B ^ H ' O . p« t o f m o * ^ £ n > S—I C U •• U w O ,» to M M
»j 3 C ^ M > , O < O O4) O ft) «0 4 ) O H i W < - 4 | | ) C x ) «-lC c O > O i S C « - < M * * f H O n j . H•OO • O 4 ) ^ « Q i - « t J r-lW ^ 4 ) * " w X J > » O S - W O(D JJ t3 41 4) 18 -Q C " fO 10 >, US f l - H r H - P a « O H » M o j O X J
U « rH IT) QJ TD 4) O r-|
S 0) -P X - n U C 3 M 4) > J-> 0)o > j i j a > ^ z o - " ^ ' - « ( i 4o M o M ^ -P o o. a) 3f f » c Q < 1 8 ^ w 1 - 1 S o wc~o «J « o a i E r t H re 5j a>CM s as a OH o »-< w « &
58303269

***** * IT ANALYTICAL SERVICESCompany t IT Corporation - O» SAN JOSE, CADate: 04/19/01Client Work IDt 3034S6 B/Fira«tone Work Order: Tl-04-08
TEST NAMES EPA 502
SAMPLE ID: W.BARXOtf 009OHPPSAMPLE DATE: 04/02/91LAB SAMPLE ID: X104084-OSSAMPLE MATRIX: aqueousRECEIPT CONDITION: CoolEXTRACTION DATE: M/AANALYSIS DATE: 04/16/91
RESULTS in MierograM p«r Liter:
DETECTIONPARAMETER LIMIT DKXICXED
Vinyl chloride 0.5 0.6
A8303270 M2-1-W

Pag* i 10 __ __IT ANALYTICAL SERVICES
Company* IT Corporation - BBS SAN JOSE, CADates 04/19/91Client Work ID« 303486 B/Fire«tone Work Orders Xl-04-084
TEST NAMEJ EP* 502
SAMPLE ID: W.BAXTO* 009OWBFSAMPLE DATEI 04/02/91LAB SAMPLE ID: 2104084-09SAMPLE MATRIX* aqueousRECEIPT CONDITION: CoolEXTRACTION DATE: M/AANALYSIS DATE: 04/16/91
RESULTS in Micrograas per Litert
DETECTIONPARAMETER LIMIT DETECTED
Vinyl chloride 0.5 Hone
&830327I M2-149

Pages 11IT ANALYTICAL SERVICES
Company: IX Corporation - BE! • SAN JOSE, CADates 04/19/91Client Work IDs 303486 B/Firestone Hork Orders Tl-04-08
TEST NAME: BPA 502
SAMPLE IDs W.BARTO* 009ONAFSAMPLE DATE: 04/02/91LAB SAMPLE IDs S104084-10SAMPLE MATRIXs aqueousRECEIPT CONDITIONS CoolEXTRACTION DATE: If/AANALYSIS DATE: 04/16/91
RESULTS in Microgrami per Liters
DETECTIONPARAMETER LIMIT
Vinyl chloride 0.5 None
SH303272 M3-1-W

Pag*i 2IT ANALYTICAL SERVICES
Co»p«nyt IT Corporation - EES • SAN JOSE, CADate: 08/02/91Client Work IDt 303486 B./Pirestone Work Order: Tl-05-128
TEST NAME: EPA 524.2 - Drinking Water--iV'-.-T3---— --- . -_ . . . - . _ _ _ _ _ _SAMPLE ID: WBarton-010-OWPFSAMPLE DATE: 05/10/91LAB SAMPLE ID: T105128-01SAMPLE MATRIX: aqueousRECEIPT CONDITION: coolEXTRACTION DATE: N/AANALYSIS DATE: 05/23/91
RESULTS in Micrograas per Liter:
DETECTION DETECTIONPARAMETER., LIMIT DETECTED PARAMETER LIMIT DETECTED
Vinyl C h l o r i d e 0 . 1 8 N o n e
SURROGATES LIMITS % REG
p-Bromofluorobenzene 105. 105.
18303273 682-1.89

Pag*: 3IT ANALYTICAL SERVICES
Company i XX Corporation - RES SAN JOSE, CADate: 08/02/91Client Work IDs 303486 B./Firectone Work Order: Tl-05-128
TEST NAME: EPA 524.2 - Drinking Water
SAMPLE 10: WBarton-010-OWBFSAMPLE DATE: 05/10/91LAB SAMPLE ID: X105128-02SAMPLE MATRIX: aqueousRECEIPT CONDITION: coolEXTRACTION DATE: H/AANALYSIS DATE: 05/23/91
RESULTS in Micrograas par Lit«r:
DETECTION DETECTIONPARAMETER LIMIT DETECTED PARAMETER LIMIT DETECTED
Vinyl Chloride 0.18 None
SURROGATES LIMITS i REG
p-Bromofluorobenzene 108. 108.
AR30327l> 632 139

Pag*: 4IT ANALYTICAL SERVICES
Company t IT Corporation - EES SAN JOSE, CADatei 08/02/91Client Work IDs 303486 B./Firectone Work Order: Tl-05-128
TEST NAME: EPA 524.2 - Drinking Water
~~ SAMPLE ID: WBarton-010-OWAFSAMPLE DATE: 05/10/91LAB SAMPLE ID: T105128-03SAMPLE MATRIX: aqueousRECEIPT CONDITION: coolEXTRACTION DATE: IT/AANALYSIS DATE: 05/23/91
RESULTS in Micrograias per Liter:
DETECTION DETECTIONPARAMETER LIMIT DETECTED PARAMETER LIMIT DETECTED
Vinyl Chloride 0.18 None
SURROGATES LIMITS % REC
p-Bromofluorobenzene 109. 109.
ft830327S

Pag*: SIT ANALYTICAL SERVICES
Company i XT Corporation - BBS SAN JOSE, CADate: 08/02/91Client Work ZDt 303486 B./Fire»tone Work Order: Xl-05-128
TEST NAME: KPA 524.2 - Drinking Water
SAMPLE ID: F12-004-GWSAMPLE DATE: 05/10/91LAB SAMPLE ID: X10S128-04SAMPLE MATRIX: aqueousRECEIPT CONDITION: coolEXTRACTION DATE: N/AANALYSIS DATE: 05/23/91
RESULTS in Micrograas par Liter:
DETECTION DETECTIONPARAMETER LIMIT DETECTED PARAMETER LIMIT DETECTED
Vinyl Chloride 0.18 0.4
SURROGATES LIMITS % REC
p-Bromofluorobenzene 112. 112.
HR303276 SB! 189

102
1830327?

***** §Ceopaoys 19 Corpor*tie« - Mi SANJOtt,C*D*t«i 04/l?/tlCii«ot Work XDt 30341* B./PirMtoD* Work Ortert Tl-0«*901
T13T NJUdi OA 124.2 - Drinkiaj M«t«r
1AMPLK XDt•AKFL1 DAT! t OS/31/tlZAB 5AHPU ID I T10i001-04•MtfLl MATRIX t *«u««««MC1IPT OONDZCZOMt Cool pi < 2BXTMCTZON DATIi M/AAJIALyCIfl DAttl 0«/U/»1
•MRILTt in MierogriM p«r Lit*rt
PAKMOCTfR
Vinyl Chlerid*
SUKMOATI8
o-Broaof luorob«nm«n«
DETECTIONLIMIT 1
0.11
LIMITS
MHCXM1)
MM*
% UG
74.

»•*•! •IT AMAUmCAL HIVIC8SAKJOII,CA
0«/17/flclient work ZOt 3034M B./Fir««ton» Work Ocdart Il-04-0«l
TIST KAMI! SPA 524.a - Drinking ttftttr
SAMPUC XOs WUUOH-011-•MIPLI DATS* 05/31/11LAB tAKPLI ZDt 910*001*05SAMPLE MATRIX « AquMuSRIC1IPT COMDZTZONi OO01 p« < 3BXTKACfXOM DATli M/A
DATtl Of/I)/**
UtUbSt ia Microgr*«t p«r Littrt
PARAMZTIR
Vinyl chloride
•UIWOOATI8
OITICTZONLIMIT 1
0.18
LIMITS
M'l'ICTAD
MOM
% UK
p-Brocnofluorob*nxftiM 7t.
HR303279

» corforatloe - n< SAHJOtt.CA.D*t«t 0«/lf/flClUat Work XDt 30S4M l./Fir«*tOn« Work Oftf**l
TIST it AMI» VA 324. J - oriakiag wat«rMMFLX ID i MMMOir-OU-•MtfLI DATlJ Ol/3i/»lLA* fMIPLB XOl X10«001-0<•MtFIB MATRIX t •ftt*0««MCTIPT OONOXTZONs COOl pM < 2BXTMCTXOM DATlt V/AANALYSIS DATlt 0«/l)/tl
MtfltAM ia Mleeegruii p«r Lit«rt
PMUtfCETZft
Vinyl Chlorid*
•U1WOOATM
OITBCTXONL2XIT flMlCTIB
O.li MOM
LIMITS % tJC
p-Srcaofluorob«ns«n« ti.
AR303280

IT ANALTTICAL SBKVICBSQaa»*ayi IT Corporation - EE8 SAM JOSE, CAfifttet Ot/17/flClient Work iDi 30348* B./fir«»ten« Work ortert
T1ST NAKBt VA 524.2 - Drinking W«t»r
•AMPLE ID I XXU-004-OM«AMPLI DAT!t 08/31/flLAB SAMPLE XDt StO«001-OiSAMPLE MATRIX! afttMtttMC1IPT OONDXtZOMt Cool pi < 2EXTRACTION DATEI M/AANALVSU DATE! 0«/il/fi
in Mierogr«a« p«r x.it«rt
PAItAMETER
Vinyl Chloride
SUMKOOATE8
p>Bromofluorob«nc«M
OETECTXOMLIMIT 1
0.18
LIMITS
MXECTBD
0.38
I EJtC
71.
£8303281

ANALYSIS DATA SHBE*"ERNATIONAL TECHNOLOGY CORPORATIONDate Received: 07/03/91
^T Analytical Service* - San Jose ' Date Collected: 07/02/91> Code: IXASSJ Matrix: aqueous
rreject Name: B_FIRBSTONE Sample Amount: 25mlProject Number: 303486 Level: LowProject Sample Number: HBarton-012-GWPF Househol % Moisture:Lab Sample ID: T107043-01 Column: PACK
Lab File AnalysisGAS No. Compound ID Date Units Value Q*
75-01-4 Vinyl chloride OTB4706 07/16/91 ug/L 0.18 U156-60-5 trans-l,2-Dichloroethene OTB4706 07/16/91 ug/L 0.5 U156-59-4 cis-l,2-Dichloroethene OTB4706 07/16/91 ug/L 0.5 U71-55-6 1,1,1-Trichloroethane OTB4706 07/16/91 ug/L 0.5 U56-23-5 Carbon Tetrachloride OTB4706 07/16/91 ug/L 0.5 U71-43-2 Benzene OTB4706 07/16/91 ug/L 0.5 U107-06-2 1,2-Dichloroethane OTB4706 07/16/91 ug/L 0.5 U79-01-6 Trichloroethene OTB4706 07/16/91 ug/L 0.5 U106-46-7 1,4-Dichlorobenzene OTB4706 07/16/91 ug/L 0.5 U460-00-4 4-Broraofluorobenzene OTB4706 07/16/91 % Recovery 82.
"Qualifier Key:U - none detectedJ - estimated value (less than the sample quantitation limit)B - analyte is found in the associated blank as well as in the sampleE - concentration exceeds calibration rangeQ - not analyzed (see Request for Analysis)D - compound identified at a secondary dilution factorR - resampling and reanalysis are necessary for verification
'blank' - positive result
Form 1 GCMS VGA 2
AR3G3282

ANALYSIS DATA SHEElNTERNATIONAL TECHNOLOGY CORPORATIONDate Received: 07/03/91
Analytical Services - San Jose Date Collected: 07/02/91>.b Code: ITASSJ Matrix: aquaou>^_reject Name: B_FIRBSTONE Sample Amount: 25»1reject Number: 303486 Level: LowProject Sample Number: WBarton-012-GWBF Dom. Wel % Moisture:Lab Sample ID: T107043-02 Column: PACK
Lab File AnalysisCAS No. Compound ID Date Units Value Q*
75-O1-4 Vinyl chloride OTB4707 07/16/91 ug/L 0.18 U156-60-5_ trans-l,2-Dichloroethene OTB4707 07/16/91 ug/L 0.5 U156-59-4 cis-l,2-Dichloroethene OTB4707 07/16/91 ug/L 0.5 U71-55-6 1,1,1-Trichloroethane OTB4707 07/16/91 ug/L 0.5 U56-23-5 Carbon Tetrachloride OTB4707 07/16/91 ug/L 0.5 U71-43-2 Benzene OTB4707 07/16/91 ug/L 0.5 U107-06-2 1,2-Dichloroethane OTB4707 07/16/91 ug/L 0.5 U79-01-6 Trichloroethene OTB4707 07/16/91 ug/L 0.5 U106-46-7 1,4-Dichlorobenzene OTB4707 07/16/91 ug/L 0.5 U460-00-4 4-Bromofluorobenzene OTB4707 07/16/91 % Recovery 85.
"Qualifier Key:U - none detectedJ - estimated value (less than the sample quantitation limit)B - analyte is found in the associated blank as well as in the sampleE - concentration exceeds calibration rangeQ - not analyzed (see Request for Analysis)D - compound identified at a secondary dilution factorR - resampling and reanalysis are necessary for verification
'blank' - positive result
Form 1 GCMS VGA 2
ftR3Q3283

ANALYSIS DATA SHEBOJNTERNATIONAL TECHNOLOGY CORPORATIONDate Received: 07/03/91
IT Analytical Services - San Jose • Date Collected: 07/02/91Code: ITASSJ Matrix: aqueous
jject Name: B_FIRESTONE Sample Amount: 25mleject Number: 303486 Level: Low
Project Sample Number: WBarton-012-GWAF Househol % Moisture:Lab Sample ID: T107043-03 Column: PACK
Lab File AnalysisCAS No. Compound ID Date Units Value Q*
75-01-4 Vinyl chloride OTB4708 07/16/91 ug/L 0.18 U156-60-5 trans-l,2-Dichloroethene OTB4708 07/16/91 ug/L 0.5 U156-59-4 cis-l,2-Dichloroethene OTB4708 07/16/91 ug/L 0.5 U71-55-6 1,1,1-Trichloroethane OTB4708 07/16/91 ug/L 0.5 U56-23-5 Carbon Tetrachloride OTB4708 07/16/91 ug/L 0.5 U71-43-2 Benzene OTB4708 07/16/91 ug/L 0.5 U107-06-2 1,2-Dichloroethane OTB4708 07/16/91 ug/L 0.5 U79-01-6 Trichloroethene OTB4708 07/16/91 ug/L 0.5 U106-46-7 1,4-Dichlorobenzene OTB4708 07/16/91 ug/L 0.5 U460-00-4 4-Bromofluorobenzene OTB4708 07/16/91 % Recovery 84.
"Qualifier Key:U - none detectedJ - estimated value (less than the sample quantitation limit)B - analyte is found in the associated blank as well as in the sampleE - concentration exceeds calibration rangeQ - not analyzed (see Request for Analysis)D - compound identified at a secondary dilution factorR - resampling and reanalysis are necessary for verification
'blank' - positive result
For* 1 GCMS VGA 2
ftR3Q328*»

ANALYSIS DATA SHEE* TERNATIONAL TECHNOLOGY CORPORATIONDate Received: 07/03/91
Analytical Services - San Jose Date Collected: 07/02/91b Code: ITASSJ Matrix: aqueous
t-roject Name: B FIRBSTONE Sample Amount: 25«1Project Number: 3034S6 Level: LowProject Sample Number: ITB6-005-OW % Moisture:Lab Sample ID: T107043-04 Column: PACK
Lab File AnalysisGAS No. Compound ID Date Units Value Q*
75-01-4 Vinyl chloride OTB4709 07/16/91 ug/L 0.18 U156-60-5 trans-l,2-Dichloroethene OTB4709 07/16/91 ug/L 0.5 U156-59-4 cis-l,2-Dichloroethene OTB4709 07/16/91 ug/L 0.5 U71-55-6 1,1,1-Trichloroethane OTB4709 07/16/91 ug/L 0.5 U56-23-5 Carbon Tetrachloride OTB4709 07/16/91 ug/L 0.5 U71-43-2 Benzene OTB4709 07/16/91 ug/L 0.5 U107-06-2 1,2-Dichloroethane OTB4709 07/16/91 ug/L 0.5 U79-01-6 Trichloroethene OTB4709 07/16/91 ug/L 0.5 U106-46-7 1,4-Dichlorobenzene OTB4709 07/16/91 ug/L 0.5 U460-00-4 4-Bromofluorobenzene OTB4709 07/16/91 % Recovery 82.
""Qualifier Key:U - none detectedJ - estimated value (less than the sample quantitation limit)B - analyte is found in the associated blank as well as in the sampleE - concentration exceeds calibration rangeQ - not analyzed (see Request for Analysis)D - compound identified at a secondary dilution factorR - resampling and reanalysis are necessary for verification
'blank' - positive result
For* 1 GCMS VOA 2
&R3Q3285

—"-v
•ANALYSIS DATA SHEB* TERNATIONAL TECHNOLOGY CORPORATION
Date Received: 07/03/91Analytical Services - San Jose Date Collected: 07/02/913 Code: ZTASSJ Matrix: aqueousoject Name: B_FIRESTONB Sample Amount: 25»1
'reject Number: 303486 Level: LowProject Sample Number: F12-005-OW % Moisture:Lab Sample ID: T107043-05 Column: PACK
Lab File AnalysisCAS No. Compound ID Date Units Value Q*
75-01-4 Vinyl chloride OTB4710 07/16/91 ug/L 0.18 U156-60-5 trans-l,2-Dichloroethene OTB4710 07/16/91 ug/L 0.5 U156-59-4 cis-l,2-Dichloroethene OTB4710 07/16/91 ug/L 0.5 U71-55-6 1,1,1-Trichloroethane OTB4710 07/16/91 ug/L 0.5 U56-23-5 Carbon Tetrachloride OTB4710 O7/16/91 ug/L 0.5 U71-43-2 Benzene OTB4710 07/16/91 ug/L 0.5 U107-06-2 1,2-Dichloroethane OTB4710 07/16/91 ug/L 0.5 U79-01-6 Trichloroethene OTB4710 07/16/91 ug/L 0.5 U106-46-7 1,4-Dichlorobenzene OTB4710 07/16/91 ug/L 0.5 U460-00-4 4-Bromofluorobenzene OTB4710 07/16/91 % Recovery 84.
"Qualifier Key:U - none detectedJ - estimated value (less than the sample quantitation limit)B - analyte is found in the associated blank as well as in the sampleE - concentration exceeds calibration rangeQ - not analyzed (see Request for Analysis)D - compound identified at a. secondary dilution factorR - resampling and reanalysis are necessary for verification
'blank' - positive result
Form 1 GCMS VGA 2
AR303286
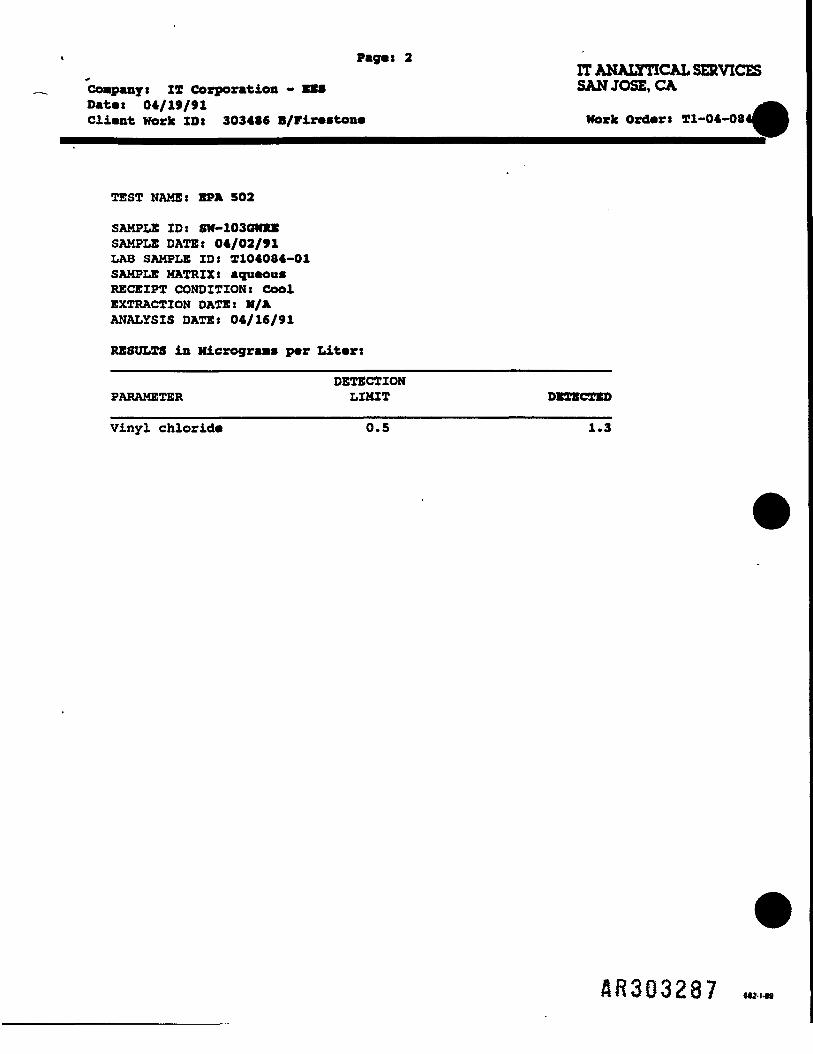
Pages 2 __IT ANALYTICAL SEE VICES
companyt IT Corporation - BSS SAN JOSE, CADates 04/19/91Client Work IDs 3034S6 B/Firestone Work Orders T1-04-OS
TEST NAME: BPA 502
SAMPLE ID: SW-103OMM6SAMPLE DATE: 04/02/91LAB SAMPLE ID: X104084-01SAMPLE MATRIX: aqueousRECEIPT CONDITION: CoolEXTRACTION DATE: H/AANALYSIS DATE: 04/16/91
RESULTS in Hierograas per Liters
DETECTIONPARAMETER LIMIT
Vinyl chloride 0.5 1.3
AH303287 M2-1-M

Pages 3IT ANALYTICAL SERVICES
Coapanyt IX Corporation - BBS SAN JOSE, CA -Date: 04/19/91Client Work IDt 303486 B/Firestone Work Order: Tl-04-084
TEST NAME: BPA 502
SAMPLE IDs F-11030WR*SAMPLE DATE: 04/02/91LAB SAMPLE IDJ T104084-02SAMPLE MATRIX: aqueousRECEIPT CONDITION: CoolEXTRACTION DATE: M/AANALYSIS DATE: 04/16/91
RESULTS in Micrograa* p«r Liter:
DETECTIONPARAMETER LIMIT DETECTED
Vinyl chloride 0.5 1.4
IB303288682-1-89

Page: 4IT ANALYTICAL SERVICES
Company: IT Corporation - VX9 SAN JOSE, CADate: 04/19/91Client Work ID: 3034S6 B/Firestone Work Order: Tl-04-
TEST NAME: BPA 502
SAMPLE ID: IXB4003GHXESAMPLE DATE: 04/02/91LAB SAMPLE ID: X1040S4-03SAMPLE MATRIX: aqueousRECEIPT CONDITION: CoolEXTRACTION DATS: If/AANALYSIS DATE: 04/16/91
RESULTS in Micrograas per Liter:
DETECTIONPARAMETER LIMIT DK
Vinyl chloride 0.5 None
8R3Q3289 M2-1-M
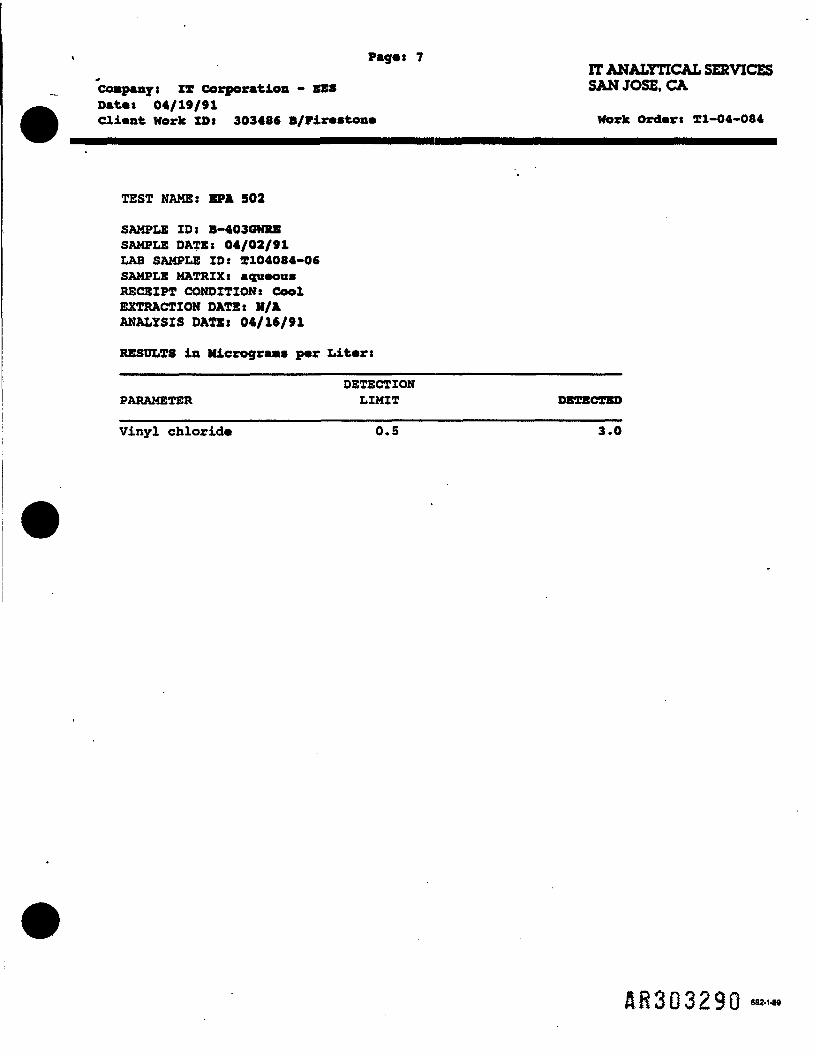
Pag*i 7IT ANALYTICAL SERVICES
'company i IX Corporation - BBS SAN JOSE, CAOat«s 04/19/91Client Work IDt 303486 B/Fir«ston* Work Ordert Tl-04-084
TEST NAME: EPA 502
SAMPLE IDl B-403GWRESAMPLE DATES 04/02/91LAB SAMPLE IDs T104084-06SAMPLE MATRIX: aqucouiRECEIPT CONDITION! CoolEXTRACTION DATE: M/AANALYSIS DATE: 04/16/91
RESULTS in MicrograM p«r Literi
PARAMETER LIMIT DETECTED
Vinyl chloride 0.5 3.0
AR30'3290 682-1-89

Pag*i 2IT ANALYTICAL SERVICES
ccwpanyj IX Corporation - EES ' SAN JOSE, CAD«t«i 05/02/91Cliaat Work IDs 3034SC.09.01.05 B/FirMtosM Work Ordars Xl-04-23
TBST NAME: BPA 502
SAMPLE ID: F3-03-QWSAHPUB DATE: O4/11/91LAB SAMPLE ID: X104234-01SAMPLE MATRIX: aqu*ousRECEIPT CONDITION: CoolEXTRACTION DATES M/AANALYSIS DATES 04/25/91
RESULTS in Micrograai p«r Liters
DETECTIONPARAMETER LIMIT DK
Vinyl chlorid* 0.5 7.0
AB30329I M2-I-M

Pag*! 3 __IT ANALYTICAL SERVICES
Cowpanys IT Corporation - BBS SAN JOSE, CADataI 05/02/91Client Work IDi 303486.09.01.05 B/Pirastone Work Orders Tl-04-234
TEST NAME: EPA 502
SAMPLE ID: B2-03-GWSAMPLE DATE: 04/11/91LAB SAMPLE IDs X1O4234-O3SAMPLE MATRIX: aqueousRECEIPT CONDITION: CoolEXTRACTION DATE: IT/AANALYSIS DATE: 04/25/91
RESULTS in MicrograM per Liter:
DETECTIONPARAMETER LIMIT DETECTED
Vinyl chloride 0.5 None
IR303292 682-1-89

Page: 4IT ANALYTICAL SERVICES
company: IT Corporation - BBS SAN JOSE, CADate: 05/02/91 ,Client Work IDs 3034SS.09.01.05 B/Pirestone Work Order: Tl-04-
TEST NAME: KPA 5O2
SAMPLE ID: XTB5-03-OHSAMPLE DATE: O4/11/91LAB SAMPLE ID: T104234-04SAMPLE MATRIX: aqueousRECEIPT CONDITION: CoolEXTRACTION DATE: W/AANALYSIS DATE: 04/25/91
RESULTS in Microgrus p«r Liter:
DETECTIONPARAMETER LIMIT DETECTED
Vinyl c h l o r i d e o T i T T e
/I8303293 M2-1-M

Pag*i 5IT ANALYTICAL SERVICES
Company« IX Corporation - BES ' SAN JOSE, CADat«s 05/02/91Cli«nt work IDs 303486.09.01.05 B/Fir««ton« Work Ord.rt Tl-04-234
TEST NAME: KPA 502
SAMPLE ZOt B6-O3-OWSAMPLE DATS: 04/11/91LAB SAMPLE ID: X104234-05SAMPLE MATRIX: agiMOU*RECEIPT CONDITIONS CoolEXTRACTION DATE: M/AANALYSIS DATEI 04/26/91
RESULTS in Micrograas p«r U.-b«rt
DETECTIONPARAMETER LIMIT DETECTED
Vinyl c h l o r i d e o T i I T ?
eaz-1-89

Pagai $IT ANALYTICAL!
Coapanys IT Corporation - BBS SAN JOSE, CADat«t 05/02/91Client Work IDs 3034SC.09.01.05 B/Fir««ton« Work Ord«ri Tl-04-23
TEST NAME: EP* 502
SAMPLE ID: OM2-O3-OMUSAMPLE DATE: 04/11/91LAB SAMPLE ID: X104234-06SAMPLE MATRIX: aqueousRECEIPT CONDITION! CoolEXTRACTION DATE: H/AANALYSIS DATE: 04/26/91
RESULTS in Micrograa* par Liters
DETECTION ___PARAMETER LIMIT DETECTED
Vinyl c h l o r i d a o T i T T s
A8303295 M2-1-M

Pag«s 9IT ANALYTICAL SERVICES
Company i IT Corporation - BBS SAN JOSE, CADates 05/02/91Cliant Work IDs 303486.09.01.05 B/Fir«cton« Work Orders Tl-04-234
TEST NAMES BPA 502
SAMPLE ID: F12-03-CWSAMPLE DATEI 04/11/91LAB SAMPLE IDs T104234-09SAMPLE MATRIXs aqpaoousRECEIPT CONDITIONS CoolEXTRACTION DATE: M/AANALYSIS DATEs 04/26/91
RESULTS in MicrograM p«r Lit*rs
DETECTIONPARAMETER LIMIT
Vinyl chlorid* 0.5 4.7
63M-89

INTERNATIONAL TECHNOLOGY CORPORATION
APPENDIX IAGENCY COMMENTS
A83G3297

UNITED STATES ENV1F ^MENTAL PROTECTION AGENCYREGION in
841 CHESTNUT BULDINGPHLADELPHM, PENNSYLVANIA 19107
July 18,1991
Mr. George B. MarkertSenior ConsultantEnvironmental AffairsBridgestone/Firestone, Inc.1200 Firestone ParkwayAkron, Ohio 44317
Re: Comments on the Phase III and Phase IV Reports, WoodlawnLandfill RI/FS, Cecil County, Maryland
Dear Mr. Markert:The attached comments reflect the concerns of EPA and the
Maryland Department of the Environment (MDE) regarding the PhaseIII and Phase IV Remedial Investigation Reports for the WoodlawnLandfill site. I have also enclosed analytical results of EPA'ssplit samples. The release of the validated split sample resultsis pending review of the data by EPA's Central Regional Laboratory(CRL). The data is considered preliminary until accepted by CRL.
Please feel free to contact me at 215/597-9238 if you have anyquestions or concerns regarding the attached materials.
Sincerely,
Debra RossiRemedial Project ManageDE/MD Section
cc: Barry BelfordJohn Fairbank (w/o enclosure)Kevin Gaynor (w/o enclosure)Mark Grummer (w/o enclosure)Alan Jacobs
ftB303298

ts OP the Phese III Report, flroundweter Bvaluationrand on the Pnese IV Report* Additional Field Werfc. where
IPage ES-1, Page 1-2: We have agreed (June 26, 1991 meeting;'July 9, 1991 fax from IT) that the text in the Phase III Reportwill be revised to reflect that the transfer station is situatedon the Woodlawn Landfill site "adjacent to the landfill1*, and not"adjacent to the Site". [This revision will also be made in thePhase IV Report (page ES-1 and page 1-3, section 1.2).]
?age ES-2, Chemical Analysis of Groundwater, second paragraph:'The analytical results and ground water modeling resultspresented in the Report are not sufficient to support the claim
—.that the site is not the source of vinyl chloride in the P-309/3)w«ll. pease revise the text. Additionally, it is stated thatv>— "Detections of other VOCs from on-Site monitoring wells were
similar (in concentrations and analytes detected) to Phase IIresults (Round 1, April 1990)." Please indicate and offerpossible explanations for the order of magnitude differences forseveral VOCs in onsite well ITP-2 between Round 1 and Round 2data (i.e., 2-hexanone, toluene, chlorobenzene, 2-butanone, 4-methy1-2-pentanone). Please indicate these differences insections 3.1.1 and 3.1.2, as well.
Page ES-3, first line: Onsite hydraulic conductivity (asdetermined by slug tests) presented in the Phase II Report rangesfrom 0.08 to 39.4 feet per day. The range of 0.1 to 0.6 feet isthe range used in constructing/calibrating the ground water flowmodel, and should be distinguished as such.
?age ES-3, first paragraph, fourth sentence: This statement'should be revised. The simulated present-day front of the vinylchloride plume does not extend to offsite monitoring well ITB-6.Results obtained for the sample collected from ITB-6 on May 10,1991 (and for samples collected from the P-309 well sinceNovember 8, 1990). preclude the conclusion presented here in theReport if a plausible explanation of an alternative source ofvinyl chloride in these wells can not be offered.
\Page ES-3, second paragraph: We have agreed (June 26, 1991,leeting; July 9, 1991, fax from IT) that the first sentence inthis paragraph will be modified to reflect that the modelpredicts that the vinyl chloride plume would reach some domesticwells within a 20 year period. This change will also be made inthe first bullet under "Model Application" on page 3-4 of thePhase III Report.
>age 2-2, Section 2.3.2.1, Sampling Procedures: We have agreed(June 26, 1991, meeting; July 9, 1991 fax from IT) that thesource of clean tap water used in decontamination will bedocumented in this section of the Phase III Report. [Thisinformation will also be added to section 2.4.2.2 of the Phase IV
SR303299
Report.]
)Page 2-3, third paragraph: Please note that although bothfiltered and unfiltered domestic well samples were collected foranalysis of metals, only the results of unfiltered domestic wellsamples should be considered in developing the quantitative riskassessment.
\Page 2-9, Section 2.5.1: The ground water data used in the risk'assessment is not to be limited to that data collected during thesecond round of ground water sampling.
2-12, Section 2.6.2, fourth paragraph: Please replace thefirst sentence in this paragraph with the following: "An earlyapplication of the SWIFT code was made by GeoTrans, Inc., andresulted in a modified version of the code which was named SWIFTII. The major modification was the extension of the capabilitiesof SWIFT to fractured media.."
" Section 2.6.2: We have agreed (June 26, 1991, meeting; July 9,'1991 fax from IT) that a statement will b« added to clarify thatthe model is two-dimensional.
?age 2-13, section 2.6.2, fourth paragraph, fifth sentence:''Please define' "successfully1*. Did IT make any predictions ofwater levels, velocities or contaminant concentrations that werelater matched by actual measurements?
?age 2-13, section 2.6.3, Conceptual Model: In general, this'section lacks specific details concerning the conceptual model.For example, there is no discussion about the existing supplywells in the vicinity of the site. Why were the existingresidential supply wells considered only after January 1991? Dothese wells draw a small enough volume of water from the localaquifer system to be neglected in the steady-state model?
)Page 2-13, Section 2.6.3.1, second paragraph: Please clarify thefollowing statement: "In most of the modeled area, thisfractured bedrock represents the regional aquifer in this area."
}We have agreed (June 26, 1991, meeting; July 9, 1991 fax from IT)that the relative accuracy of slug tests will be discussed inthis section.Section 2.5.3.1: The last paragraph of this section (page 2-14)'indicates that aquifer tests have been conducted in the vicinityof the site. Note that earlier activities indicated an east-westorientation of a photo-lineament. Do aquifer tests show anelongated cone of depression that may be indicative ofanisotropic conditions?age 2-14, Section 2.6.3.2, first paragraph: It is stated thatvinyl chloride data collected during Round 2 were used in themodel and supplemented with data from Rounds 1 and 3 whenever
48303300

data from Round 2 was found to be unacceptable. Have variationsin vinyl chloride concentration been examined at any givenmonitoring point to justify the mixing of data collected atdifferent times? Is there any evidence that the vinyl chlorideplume has not moved during the period between Round 1 and Round 3data collection?)Page 2-14, last sentence: Has any analysis of ground waterchemical data been conducted to support the hypothesis that vinylchloride detected in onsite monitoring wells may be abiodegradation product of other organic compounds?
I Page 2-15, Section 2.6.3.3: Please note that EPA did not approveof the selection of a retardation factor of 4 for vinyl chlorideon February 20, 1991. The value of the retardation factor wasnot discussed until the May 7, 1991, meeting amongrepresentatives from the State of Maryland, IT Corporation andEPA. It was stated during that meeting that EPA would base itsevaluation of the value assigned to this factor on review of thecalculation presented in Appendix C of the Phase III Report.
tote that dispersivity and diffusivity should be included on the'list of input parameters for the solute transport model, ratherthan the list % for the ground water flow model.
T)We have agreed (June 26, 1991 meeting; July 9, 1991 fax from IT)'that the values of model input parameters will be included in thelist of model input parameters, and in the text whereappropriate.
Section 2.6.4, Model Development and Calibration: Please discussrationale for modeling the fractured bedrock and saprolite as
a single equivalent porous medium (EPM) . Do site-specificfracture patterns and fracture density support modeling of thesystem as an EPM?) Sect ion 2.6.4.1, Groundwater Flow Modeling: We have agreed (June26, 1991, meeting; July 9, 1991 fax from IT) that the followinginformation will be included in this section: a statement toindicate that the flow model was calibrated to steady-stateconditions; an explanation of ground water behavior in responseto aquifer stress due to pumping (e.g. domestic well effects) ; anexplanation of the controlling factors in calculating groundwater discharge to the unnamed creek.
I Page 2-16, Model Development, first bullet: Include in thissection a brief explanation of why Round 3 ground water elevationdata was used for model development.
2-17, second bullet: A hydraulic conductivity of 39.4 feetper day was determined as a result of the slug test performed forITB-2. In addition, while purging the upper 60 feet ofmonitoring well ITB-6 at a rate of approximately 25 gpm, a smalldrawdown was noted prior to sustaining the yield. Please
&R3Q330I

describe the process and state the justification for assigninglow hydraulic conductivity values, rather than a moreconservative (higher) range of conductivities to the regionsdepicted in Figure 12 (including the area around monitoring wellITB-6) .
age 2-19 , Sensitivity Analysis: It is expected that simulatedsteady-state variables are not sensitive to porosity changessimply because steady-state conditions are independent ofporosity under the aquifer conditions in the vicinity of thesite. It is not clear why the steady-state flow model wassubjected to sensitivity analysis for this parameter.
In the fourth paragraph, the results of the sensitivity analysesare cited as evidence that the model developed for this effort isthe best possible. Sensitivity analyses provide a means toidentify the model inputs thai: have the most influence on modelpredictions over a given range. The objective of sensitivityanalysis is not to confirm the validity of the model.
)Page 2-20, section 2.6.4.2: We have agreed (June 26, 1991,meeting; July 9, 1991 fax from IT) that an explanation of thedevelopment of vinyl chloride loading rates will be included inthis section, ,as well as a demonstration of consistency betweenthe estimated loading rates and our knowledge of PVC sludge andother waste disposal practices at the site . In addition, pleaseprovide the total mass of vinyl chloride that was released basedon loading rates used in model simulations.
lird paragraph: The calculations of retardation factor in/Appendix C do not justify selection of a retardation factor of 4for the modeling effort. The value of the retardation factormust be adequately justified. (Has field verification of theretardation factor for vinyl chloride been considered?)
2-21, first sentence: It is stated that "Model results areaffected by mechanical retardation and dispersion and are notaffected by chemical or biochemical changes that may take placeduring transport." Does this mean that the effects of chemicaland biochemical processes on contaminant fate and transport werenot considered in development of the model, or that they wereconsidered and were found to have no effect on model results?Please clarify this statement.
"jSPage 2-21, Section 2.6.5, Modeling Results: Since porosity is"important in transient simulations please justify the choice ofthe selected porosity value. To what extent are the transientsimulations sensitive to variation of the porosity value?
?age 2-21, Section 2.6.5.1, Baseline Scenario: How do the'simulated ground water level elevations resulting from the 70years of discharge well operation differ from present dayelevations?
HR303302

3-1, Section 3.1, first paragraph: "Method 502.2 was alsoin the second round for additional analyses of vinyl
chloride with a LDL less than that provided by the CLP.1*
)Page 3-2, Section 3.1.2: We have agreed (June 26, 1991 meeting;'July 9, 1991 tax from IT) that the title of this section will bechanged to "Findings". [Elsewhere in the Phase III and Phase IVReports, the word "Conclusions" will be changed to "Findings", aswell.]
ird bullet: The data and simulations presented in the Reportdo not demonstrate that the site is not the source of the vinylchloride found in the P-309 domestic well; the associationbetween site-related vinyl chloride and the trace concentrationsof this compound observed in the P-309 domestic well requirescloser examination. Please revise the statement presented in theReport.
?age 3-3, Groundwater Flow, second and third bullets: It is'impossible to evaluate these conclusions without a figure ordescription of the calibrated recharge distribution.
Page 3-3, Vinyl Chloride Transport: In Figure 15, it appears'that the P-207 domestic well is located within the vinyl chlorideplume, near the simulated front.age 3-4, first bullet (Vinyl Chloride Transport): Sincesubmittal of the Phase III Report, vinyl chloride has beendetected in monitoring well ITB-6 (sampling date: May 10, 1991).Please modify this section to reflect the new information.
'age 3-4, Model Application, third bullet: Since the modelperformance has not been verified with field data obtained underrelevant aquifer stress conditions (e.g., pump test data), EPAdoes not consider the model to be a reliable tool forcomprehensively evaluating remedial alternatives for theFeasibility Study.
3-5, first paragraph: MCLs are Maximum Contaminant Levels;MCLGs are Maximum Contaminant Level Goals. Please make thiscorrection. ,Table 1: The. specific conductance measured during the firstsampling event (3/90-4/90) is reported in Us/cm2. However, thisfirst data set is not comparable to the measurements collected inNovember 90. Please explain the two to three orders of magnitudedifference between these data sets.
• Tables 2 through 4: With the exception of bedrock well*FSTA-002-GW, it is not clear which samples were filtered prior toanalysis for metals. Please clarify this point in the tables.
liable 11: Please define the "RN qualifier used in Table 10 in'this table of data qualifier definitions.
£8303303

Table 24: We have agreed (June 26, 1991, meeting; July 9, 1991fax from IT) that the designation "BFS" in footnote e will bereplaced with "Woodlawn Landfill".
Table 36: It appears that the columns of data for vinyl chlorideconcentrations projected after 50 years and after 70 years wereswitched.
Tables 35 and 36: Two P-530 wells are presented here. Please'distinguish these wells using the appropriate tax mapdesignations.able 37: Please note the proposed Maximum Contaminant Levels(MCLs), reported in ug/1, for the following contaminants andrevise this table accordingly:
di-ethyl phthalate 4di-n-butyl phthalate 4pyrene 0.2benz(a)anthracene 0.2benzo(b)fluoranthene 0.2benzo(k)fluoranthene 0.2chrysene, 0.21,4-dichlorobenzene 75
Please note the proposed Maximum Contaminant Level Goals (MCLGs),reported in ug/1, for the following contaminants and revise thistable accordingly:
trichloroethene 0benzene 0di-ethyl phthalate 0di-n-butyl phthalate 0pyrene 0benz(a)anthracene 0benzo(b)fluoranthene 0benzo(k)fluoranthene 0chrysene 01,4-dichlorobenzene 75
The To Be Considered (TBC) concentration presented for 1,1-aichloroethane (3500 ug/1) does not consider exposure to thisvolatile compound via the inhalation route during typicalhousehold water usage. This factor should be included indetermination of potential ARARs.
TBC concentration presented for 1,2-dichloroethene (350 ug/1)should be deleted since a non-zero MCLG is available for thiscompound.
TyThe TBC concentration presented for pyrene (1050 ug/1) should bedeleted since an MCL is available for this compound.
£830330^

TBC concentration presented for 1,4-dichlorobenzene (3150ug/1) should b« deleted since a non-zero MCLG is available forthis compound.
the calculations involving TBC ARARs, oral exposure to twoliters per day of contaminated ground water by a 70 kg adult overa 70 year duration was assuated. However, this approach, initself, is overly conservative and, therefore, nay beinappropriate for defining risk and potential ARARs at the site.Further, it is conservative in that it does not consider exposureto volatile contaminants via the inhalation route. It issuggested, therefore, that the following residential exposurescenarios (as delineated in the manual, "Risk Assessment Guidancefor Superfund: Human Health) be used when calculating TBCconcentrations for carcinogens possessing a Henry's Law constantthat is greater than 10~4:
(TR) (BW)(AT)(365)(1000)/EF/ED/[(VT)(Ira)(CF8i)+(IRw)(CPSo)
where: TR - Target Cancer Risk - 10~4 to 10~6BW * Body Weight - 70 kgAT - Averaging Time -70 yearsEF » Exposure Frequency - 338 day/yearED f Exposure Duration «• 30 yearsVF - Volatilization Factor -0.5 L/m3Ira - Air Breathed - 30 a3/dayCPSi « Inhalation Carcinogenic Potency Slope
(mg/kg/day)'1Irw - Drinking Water Ingestion « 2 L/dayCPSo - Oral Carcinogenic Potency Slope
(mg/kg/day)~fFor compounds with a Henry's Law constant less than 10~4,the volatilization term in the foregoing equation (highlighted inbold print) should be deleted. Applying this calculation yieldsthe following 10~4 to 10"6 cancer risk levels, in terms of ug/1,for the compounds in Table 37:
bis(2-ethylhexyl)phthalate: 580 - 5.8pyrene: 8.8 - 0.088 (per the Clement Method)alpha-BHC: 1.3 - 0.013methylene chloride: 520 - 5.2bens(a)anthracene: 4.9 - 0.049benzo(b)fluoranthene: 5.1 - 0.051benzo(k)fluoranthene: 11 - 0.11chrysene: 160 - 1.6
According to the April 30, 1991, issue of the Federal Register,the Action Level for lead in drinking water is 15 ug/1 when theresult is >supported by ten percent of the duplicate samples, or20 ug/1 for a solitary sample. These criteria replace the pre-existing enforceable guideline (MCL) of 50 ug/1 for lead inpublic potable supplies.
6R3Q33Q5

figure 2: The P-506 veil has been perhaps erroneously identifiedas a bedrock well, here.
igure 10: The potentiometric surface has been mislabeled.
igure 14: The title of this figure should include whether thisis a steady-state water table or not. Also indicate whether thisrepresents current water table conditions.
igure 15: Please replace the word "solute" with "vinyl chloride"in the figure title. It would be more useful to show themeasured vinyl chloride concentrations rather than the well name.This would permit the reader to make an immediate evaluation ofthe adequacy of the simulated concentrations.igures 17 through 21: We have agreed (June 26, 1991, meeting;July 9, 1991 fax from IT) that well identification numbers willbe reviewed, and revised where necessary; figures will berescaled (so that the scale is the same in each of these figures)where necessary.
igures 21 through 27: We have agreed (June 25, 1991, meeting;July 9, 1991, fax from IT) that RPD will be reported as positivevalues, only.f [This comment also applies to the following Tablesin the Phase IV Report: 25, 27, 32, 33, 34.]
Appendix C: Please provide a range of published values for theretardation factor for vinyl chloride for hydrogeologicalconditions similar to those prevalent at the site. We haveagreed (June 26, 1991, meeting; July 9, 1991 fax from IT) that asilt fraction of 0.4 (Reference Soil Survey, Cecil County, HD,USDA, SCS) will be used in calculating the retardation factor forvinyl chloride. Also, note that bulk density is usuallyexpressed as mass per unit volume. Why are units of cc/gdesignated? Finally, volatilization of vinyl chloride ismentioned in this appendix for the first time in the Report. Wasvolatilization included in the conceptual site model? Pleaseexplain how this transport mechanism was treated.
ntB on the Phase IV Report. Additional yield Work:
Page ES-2, Borings in Waste, third paragraph: It is stated that"BEHP is known to be present in the environment wherever there ishuman'habitation.1* The quotes from chemists submitted in theJuly 9, 1991, fax from IT generally state that sporadicoccurrence of BEHP and other phthalates in ground water is notuncommon, and that phthalates are present in plastic materials.The statements from the experts consulted do not verify that BEHPis present wherever there is human habitation. Further, sinceBEHP does not occur at concentrations of the magnitude reportedat the site wherever there is human habitation, the statementshould be deleted from this section and elsewhere in the Report.
SR303306

Pag* ES-3: Th« first sentence states, "Lead and mercury are notrestricted to or show marked differences...1* Is it meant that nomarked differences in lead and mercury concentrations wereevident in samples collected from cell areas and other areas ofthe landfill?
Page ES-3, last paragraph: This paragraph should be updated toreflect recent results (May 10, 1991, samples and onward) formonitoring well ITB-6 and, if available, other wells/piezometersnorth of the site. Please see the comment pertaining to pageES-2 of the Phase III Report, above.
?age ES-4: Eliminate the final sentence, "Site data for the RIare complete." A final determination on the completeness of theRI/FS data shall be made by EPA.
)Page 1-3, first paragraph: It is stated that PVC sludge wasdeposited in Cells A, B, C from 1979 to late 1980. However, thePhase III Report states that waste disposal in Cell A began in1978. Please review the historical information for the site, andcorrect the periods of PVC sludge disposal in the Cells A, B, andC as appropriate.
'Page 2-6, Section 2.4.1.3: Please include an analysis of thevertical extent of contamination and how it has been determined.
?age 2-6, Section 2.3.1.3, last paragraph: Please update theinformation here with data obtained from the May 10, 1991,sampling and any subsequent sampling of monitoring well ITB-6 andother wells.
Page 2-11, Section 2.4.2.2, Methodology: EPA does not recommendselection of soil samples from the saturated zone for chemicalanalysis since the degree of partitioning of the chemicalsbetween the particulate and aqueous phases will not be known.
>Section 2.5.3, page 2-15, first paragraph: Update thisinformation with the most recent data for domestic well P-309.
/!5/)Section 2.5.4, Source of Vinyl Chloride: Please includeinformation that reflects the analytical results of samplingconducted on and after May 10, 1991, including the detection ofvinyl chloride in monitoring well ITB-6.
data presented in the Phase III and Phase IV Reports does not'support the conclusion that the landfill is not the source of thevinyl chloride detected in the P-309 well, and thereforestatements to this effect should be removed from the Reports.Please consider the following in evaluating the available dataand drawing conclusions:
Although the ground water elevations at domestic wells P-501and P-487 are higher than the elevation at P-309, both theP-501 and P-487 wells have long open intervals in comparison
SB303307

to the P-309 well which aas a short open interval thatintersects; the saprolite. The longer open intervals of theP-501 and P-487 veils could mask any lov concentration ofvinyl chloride either by dilution (given the higher yieldsof soae bedrock wells) or as a result of volatilization(which may be enhanced by cascading water from fracturesinto the borehole).
It is possible that monitoring well ITB-6 does not intersectthe same fractures that are intersected by monitoring wellITB-1.
Sections 2.6: We have agreed (June 26, 1991, meeting; July 9,'1991, fax from IT) that the Data Evaluation section will berewritten and will address the four questions pertaining tosection 2.6.3 submitted to IT during the June 26, 1991, meeting.
>age 3-1, Section 3.1.1.2: We have agreed (June 26, 1991,'meeting; July 9, 1991 fax from IT) that the analytical results ofsurface water and sediment samples will be discussed in thecontext of parameters measured in the field, including hardness,Ph, total organic carbon, and grain size. The results will bepresented in the Baseline Risk Assessment in the RI Report. Aletter discussing the necessity, or lack thereof, for bioassayswill be submitted to EPA before submittal of the RI Report.
?age 3-3, Monitoring Well ITB-6, Piezometers ITZ-1, and ITZ-2,'and Domestic Well P-309 Samples: Please update this section withanalytical results obtained for recent sampling events.
age 3-4, Groundwater Samples, second bullet: Is there anycorrelation between BEHP levels, and water levels measured duringeach round that may account for the apparent trend in BEHPconcentrations?'able 3: Please explain why a portion of the samples were notanalyzed for semivolatiles. In addition, the protocols describedin the "Laboratory Data Validation Functional Guidelines for theEvaluation of Organic Analysis", USEPA Data Review Group, 2/88(modified for Region III 6/88) should be consulted in order toensure that the "B* qualifier has been properly used in flaggingresults of organic analysis of soil/waste samples.
Table 9: Please update this table with recently obtainedanalytical results and indicate sample dates.
Table 18: Please update this table with analytical data that hasbecome available since the April 21, 1991, sample data.
'able 40: See the comment pertaining to Table 37 of the PhaseIII Report.•
igure 4: The P-506 well is noted as a bedrock well. Is thisappropriate?
A.R303308

??)Appendix A, third page, sac d bullet: EPA and MDE agree that' 'trenching or test pits may be required during th« Feasibility
study or Remedial Design stage in order to determine the locationof the Cell A FVC sludge disposal area. Note that although nophysical evidence of PVC sludge was found in borings ITW-12 andITW-13 (perhaps because the FVC sludge may have been codisposedwith municipal, commercial, or other industrial wastes) elevatedheadspace readings were obtained for some intervals of theborings. (However, samples from these borings were not sent tothe laboratory in order to further evaluate this finding.) Inreference to the response to comment 23 in the July 9, 1991, faxfrom IT, please note that the selected remedial alternative forthe site will be presented in the Proposed Plan, after review ofthe alternatives presented in the Feasibility Study Report.Appendix B: We have agreed (June 26, 1991, meeting; July 9, 1991fax from IT) that the boring logs will be appended to indicatethe origin of powdery substances noted in the logs.
AR303309
due to reasons cited above.
2.3.2.2 Please detail the types of collection devices for stream sampling.
2.5.1 The MDL for vinyl chloride by method 502.2 is reported as being 0.15 inthe ITAS Austin, Texas results and 0.18 ug/L in this section. In addition,significantly higher detection limits were reported for specific samples. Forexample, 1.0 ug/L for SW1-03-GW, and 0.5 ug/L for W.Barton. Pleaseinclude a general discussion of the range of detection limits in use duringthis program.
2.5.4 Please indicate how the groundwater model showed that no vinyl chloridereached well P-309. Wasn't the current condition data used to constructthe initial model condition rather than to predict movement historically?
2.6.3 On I What is meant by the statement at the end of the page, "Overall precision' of the analytical method is within 86 percent control limits"?
What is meant by the statement on paragraph 1, page 2-18, "These samplesshowed out of control accuracy"? What correlation is there between anaverage ("overall") percentage of control and individual runs? Were allcontrol limits exceeded? Some? This discussion of results is inadequate.
Please cite the reference that indicates that RSD and RPD values cannot beinterchanged to evaluate measurement precision. Both are measures ofrelative comparison between or among duplicates.
At the top of page 2-19, the statement is made, "The accuracy data for thesamples ranged between 85 -127 percent as compared to QC criteria of 95to 96 percent therefore, all the data were accepted into the data base."Was the QC criterion for this method and compound really only onepercent? How does 85 - 127 all fall within 95 - 96 percent? Or was thisstatement made in reverse?
What does the phrase "96 to 100 percent usable" mean with regard toprecision and accuracy as stated in the third paragraph?
3.1.1.1 In the fifth paragraph, it is stated that "Metal analyses for the waste boringsamples generally showed that aluminum and iron exhibited the highestconcentrations." Why is this surprising in a soil weathered from a granitegneiss (i.e., that contains high concentrations of iron with clays that containhigh concentrations of aluminum)? In addition, why is it supposed thatenvironmental interest is correlated strictly with concentration? In additionto mercury, was lead or cadmium found in concentrations that could beconsidered in the baseline risk assessment i.e., that could be considered toexceed background or regional metals values?

URGENT FAX
DATE:.
TO:
LOCATION: |~T
TELECOPY NO: 4 W - 313
FROM:
PAGES: 3- (
SR3033II

07/22/1991 14:57 FROM SUPERFUND OFFICE iu
UNfTED STATES BMRONMENTAL PROTECTION AGENCYREGION W
841 CHESTNUT BLNLDMGPHILADELPHIA, PENNSYLVANIA 19107
JUly 22.1901
Mr. George B. Markert ( r Mfl\B(/T 0 -Senior Consultant \_ •<-'/"/ fc v /Environmental AffairsBridgestone/Pirestone, Inc.1200 Pirestone ParkwayAkronr Ohio 44317
Ret Phase III and Phase IV Reports, May 20, 1991, woodlavnLandfill RI/FS, Cocil County, MarylandDear Mr. Markert:
This is to supplement EPA's July 18, 1991, cosMnts on thesubject documents with our Central Regional Laboratory'sobservations pertaining to the quality control (QC) and datavalidation criteria employed in selecting data to be incorporatedinto the Woodlavn Landfill Remedial Investigation/Feasibility Studydata base.
The data in question was generated using Method 502.2. Table24 of the Phase ZIZ Report indicates that the QC limits forprecision and accuracy that were used in evaluating the Phase IIIdata were taken directly from "Methods for the Determination ofOrganic Compounds in Drinking water,1* U.S. EPA soo/4-88/039,December 1988. The specified limits are extremely narrow. It isimportant to recognise that precision and accuracy limits providedby analytical methods arm advisory. As such, the limits areindicators of the method proficiency under ideal circumstances(i.e., excellent laboratory operation conditions, "clean" samples,etc.). The laboratory should establish its own method precisionand accuracy limits by analyzing data generated within thelaboratory over a period of time. The method QC limits determinedin each laboratory are a more realistic indication of laboratorycapabilities. Therefore, the Phase III and Phase IV precision andaccuracy data should be evaluated against the QC limits developedin the laboratory in which the samples were analysed.
Although 50O series methods are not specifically addressed inthe "Laboratory Data Validation Puctional Guidelines for Evaluationof organic Analyses", U.S. BP* Data Review Group, 2/8» (modifiedfor Region III 6/88), the data obtained with these methods for theWoodlawn Landfill site should be validated according to theprocedures outlined in the Functional Guidelines. In general,•ample data arm not r«j«ctsd based solely upon precision and
ft-R3Q33l2

P.
accuracy data, if all othar •valuation criteria ar«(•.q.t holding tiaaa, inatruaant tuning, compound idantif ication)tha data should ba qualified according to tha Functional Guidalina(aoat likaly with tha "J" qualif iar) and aceaptad into tha databaaa.
Plaaaa call »• at 215/597-9238 if you hava any quaation»ragarding thia matter.
sincaraly/
Dabra RoaaiRaaadial Projact Managar01/MD saotion
co i Barry BalfordJohn FairbankAlan Jacoba

UNTTED STATES ENVIRONMENTAL PROTECTION AGENCYREGION in
841 CHESTNUT BUILDINGPHILADELPHIA. PENNSYLVANIA 19107
July 22,1991
Mr. George B. MarkertSenior ConsultantEnvironmental Affairs1200 Firestone ParkwayAkron, Ohio 44317
Re: Woodlawn Landfill RI/FS, Cecil County, Maryland
Dear Mr. Markert:In a telephone conversation today, Dr. Alan Jacobs and I
agreed that the Phase III and Phase IV Reports for the WoodlawnLandfill site will be supplemented with analytical results of site-related sampling conducted on and between May 10, 1991, and July 2,1991.
Sincerely,
Debra RossiRemedial Project ManagerDE/MD Section
cc: Alan Jacobs
A83Q33U

UNfTED STATES ENVIRONMENTAL PROTECTION AGENCYREGION Bl
841 CHESTNUT BUILDINGPHLADELPHIA, PENNSYLVANIA 19107
July 25.1991 "2
Mr. George B. MarkertSenior ConsultantEnvironmental AffairsBridgestone/Firestone, Inc.1200 Firestone ParkwayAkron, Ohio 44317
Re: Phase III and Phase IV Reports, Woodlawn Landfill RI/FS,Cecil County, Maryland
Dear Mr. Markert:
As indicated in EPA's July 18, 1991, comments on the Phase IVReport, a final determination on the completeness of the RemedialInvestigation/Feasibility Study data shall be made by EPA.Therefore, please eliminate the last sentence of the ExecutiveSummary of the Phase III Report (page ES-3) which states, "Sitedata for the RI are complete."
Sincerely,
Debra RossiRemedial Project ManagerDelaware/Maryland Section
cc: Alan Jacobs
/I83Q33I5

UNrTED STATES ENVIRONMENTAL PROTECTION AGENCYREGION III
841 CHESTNUT BUILDINGPHILADELPHIA, PENNSYLVANIA 19107
July 20,1991
IM; v i. :)
-2Mr. George B. Markert u *•—.«.-Senior ConsultantEnvironmental AffairsBridgestone/Firestone, Inc.1200 Firestone ParkwayAkron, Ohio 44317
Re: woodlawn Landfill RI/F3, Cecil County, Maryland
Dear Mr. Markert:This is in response to your letter dated July 10, 1991,
wherein you stated that the PRP group for the Woodlawn LandfillRI/FS does not feel that additional house well sampling isrequired or appropriate at this time.
You expressed concern regarding the accuracy and precisionof Methods 502.2 and 524.2 for chemical analysis of drinkingwater samples. I have discussed your concern with personnel atEFA's Central Regional Laboratory (CRL). CRL has advised thatseveral things must be considered when evaluating fieldduplicates. First, the data users must decide upon the purposeof collecting field duplicates. The intent should not be to testthe precision of the laboratory. The variability of fieldduplicate results are more often a consequence of the numerousvariables associated with the sampling and handling process.Also, when lower detection limits are being observed, it is notuncommon to find the compound of interest present in one sampleand absent from the duplicate.
Further, the inability of the laboratory to produce the sameresult for field duplicates is most likely not related to theproficiency of the 500 series methods. The methods in questionare legal EPA methods promulgated in the Federal Register. The500 series methods, which are recommended for organic analyses ofresidential wells at Superfund sites (EPA Region III QA DirectiveBulletin No. QAD012, "Drinking Water Analyses by EPA 500 SeriesMethods1*) have been validated by the Agency. CRL personnel haveinformed me that they have no knowledge of any situation in whichthe methods have not been successfully applied.
18303316

If further sampling in planned, the Region III PerformanceEvaluation Repository can supply your laboratory (ies) with aperformance evaluation (PE) sample to be analyzed with sitesamples. The PE sample results Bay offer some credence toresults obtained for site samples in the event insufficientquality control data are available.
In your letter you also presented the following argumentsregarding the Phase III ground water model:
1. The ground water solute transport model has been calibratedas required in the work plan and verified by statistical andsensitivity analyses)
2. EPA agreed during the model planning stage that highlyfractured bedrock may be modeled as a porous medium t
3. EPA approved of the use of slug test results fordetermination of hydraulic conductivities; fewer than 20percent of the hydraulic conductivities determined by slugtests are inconsistent with the literature values used inmodel calibration.I would like to clarify EPA's position regarding the utility
and inherent limitations of the ground water model. EPA agreesthat computer modeling can be a useful method for predicting thefuture behavior of the contaminant plume at the site. However,the statistical and sensitivity analyses conduoted by yourcontractor, XT, as part of the Phase III modeling effort are notsufficient to assure the accuracy (or validity) of the modelpredictions .
As stated in the May 1991 report, "Phas« III - Ground WaterEvaluation, Remedial Investigation/Feasibility Study, WoodlawnLandfill, Cecil County, Maryland, " IT developed and calibratedthe model using "input parameters. . .based on geologic andhydrogeologic data collected from the site during previousinvestigations (site historical data and Phase I and XIinvestigations) and during current investigations (Phase XXX andXV) .... During the processes of model calibration, ground water•levations were compared against the flow model output. ...Toverify the model calibration, statistical testing [of] thegoodness-of-fit of the simulated levels to the observed waterlevels was performed.1* However, the National Research Council's1990 volume, firaund Wat«g Models. Scientific and ReaulatorvApplications, states the following:
"The accuracy of a particular model applicationmeasured by the magnitude of the prediction errors, i.e., bysome measure of the difference between the response of thereal world and the response of the simulated systea tomanagement actions."
It further states,
AR3Q3317
"Traditional methods of accuracy assessment focus oncomparisons of prediction* to historical measurements,evaluating goodness-of-fit aftsr the fact. Althoughimportant indicators of model performance, such methods donot truly measure prediction errors.1*
That is, good calibration and success in matching model output tofield conditions may not lead to predictive accuracy.
There are several things that can be done to furthervalidate the 'model and elevate the level of confidence in modelpredictions. Rigorous model validation may include fieldverification of input parameters, and the testing of modelperformance under transient conditions using a second set of datadifferent from that used in calibrating the steady-state model.One way to accomplish this would be to conduct an aquifer pumptest, which will be required in any event in order to evaluateand design ground water and leachate collection and treatmentsystems for the site. Therefore, EPA strongly recommends thatthe pump test(s) be performed before the conclusion of the RX/FS,and not be deferred to the Remedial Design stage*
Regarding the second item- above, EPA has agreed that thefractured bedrock underlying the Woodlawn Landfill site may beapproximated by an equivalent porous medium for the purposes ofconstructing the ground water flow model. However, the model maynot account for all the processes affecting ground water flow andtransport of contaminants, around water flow and contaminantmigration in some portions of the modeled area (e.g., flow andtransport through any relatively conductive fractured zones) maydeviate from the simulated results. As William C. Walton statesin Practical J\ff?fp£« of ground Water Modeling (third edition,1988): "...an important aspect of modeling is the properacknowledgement of the approximate nature of modeling through theclear description of model assumptions and limitations. Adequatedocumentation and appreciation of assumptions greatly assists themodeler and model user in keeping model result expectationswithin a realistic perspective."
In response to the third item above, you have informed methat, based on the limited information ab.out site conditionsavailable at the time, EPA agreed to the use of slug tests (inlieu of an aquifer pump test) during Phase II of the RemedialInvestigation/Feasibility Study (RZ/F3), in an effort to preventthe potential for cross-contamination of the soil and bedrockaquifers. Although the hydraulic conductivity derived from aslug test result for a single well is generally notrepresentative of the average local hydraulic conductivity,hydraulic conductivity values derived from slug test results formultiple wells may provide a useful estimate of local conditions.The range of hydraulic conductivities determined by slug testsconducted for onsite monitoring wells at the Woodlawn Landfillsite (2.7 X 10*8 to 1.4 X 10'2 cm/sec) is suggestive of localsubsurface heterogeneities which may influence ground water flow
W3033I8

and solute transport in a manner not accounted for by the nodal.In conclusion, SPA agrees that computer modeling of ground
water flow and solute transport may b« useful in predicting thefuture behavior of the contaminant plune at the site, developinghypotheses, and identifying future data needs. However,prediction errors may arise as a result of natural subsurfaceheterogeneity that cannot be completely described by a limitednumber of field samples, structural differences between the real-world system and the model used to describe it, and measurementerrors. It is essential, therefore, that model limitations arerecognized when drawing conclusions and/or making decisions basedon the model predictions. Until the predictive accuracy of themodel has been further validated (e.g., with pump test data), themodel will have limited utility as a tool for evaluating remedialalternatives. Therefore, it is recommended that a pump test beconducted to further validate the model.
Sincerely,
bra RossiRemedial Project ManagerDE/MD Section
cc: Barry Bel fordJohn FairbankKevin GaynorMark GrumnerPat HilsingerAlan Jacobs
SR3033I9
L
RESPONSE TO AGENCY COMMENTS ANDREVISIONS TO PHASE m AND PHASE IV REPORTS
IR38332Q

REPORT - PHASE ffl - GROUNDWATER EVALUATIONREMEDIAL INVESTIGATION/FEASIBELITY STUDY
WOODLAWN LANDFILL, CECIL COUNTY, MARYLAND
Response to Comments on the Phase ffl Report. Groundwater Evaluation fand on thePhase IV Reoort, Additional Field Work, where noted!:
CommentNo. '
Agreed Revise the text in the Phase ffl and Phase IV reports to reflect thatthe Transfer Station is not a separate site from the Woodlawn Landfill site.Change the phrase "adjacent to the site" to "adjacent to the landfill" insentences as indicated below:
Phase ffl Report-Executive Summary, p. ES-1, Paragraph (P) 3,Scntcncc(S) 1, and Section 1.2 (Site Background), p. 1-2, P4, SI.
Phase IV Report-Executive Summary, ES-1, P3, SI, and Section 1.2(Site Background), p. 1-3, P4, SI.
Agreed. Revise the text on page ES-2, Chemical Analysis of Groundwater,P2, S3 by ending the sentence after the word "(MDLs)."
Revise the last sentence of P2 on page ES-2, Chemical Analysis ofGroundwater and add text to this Section and to Sections 3.1.1 and 3.1.2 toexplain the difference in concentration of volatile organic compounds (VOCs)between Round 1 and Round 2 sampling events in on-sile monitoring wellITS-2 as follows:
"Detections of other VOCs from on-site wells that monitor the groundwaterwere similar (in concentrations and analytes detected) to Phase n results(Round 1, April 1990). Wells designed to sample perched water aremonitoring leachate and show greater variability in chemical concentrationwith time (e.g., ITP-2). Several possible explanations for this occurrenceexist, i.e., characteristics of the waste, contaminant response to purging, etc.but would require a lengthy treatment. One possible explanation for greatervariability in chemical concentration over time in the perched water zoneinvolves the response of the zone to varying precipitation input. When thewater level rises in the perched zone in response to precipitation input VOCs(and other constituents) are carried to soil layers above where they mayadsorb to soil particles. When the perched water level lowers, VOCsbecome exposed to the air and then volatilize. The net effect of this process
* The comment numbers shown here correspond to the hand-drawn, encircled numbersplaced on the agency's comment letter.PT/S-91/WP/»J486_CoounenH_Ph.je_ni
AR30332I
Comment_No.
3 across the perched water zone is a change of chemical concentration of the(cont'd) VOCs."
4 The hydraulic conductivity range of 0.1 to 0.6 feet per day represents thevalues for the calibrated flow model (as shown in Figure 12 of the Phase mReport). The hydraulic conductivity results of Phase n (from slug tests) forwells in and around the landfill area represent the initial hydraulicconductivity input values for the flow model. These input values wereadjusted during calibration of the flow model to produce a match betweenmodel-calculated hydraulic heads and observed heads. Revise the followingsentence of the Executive Summary:
"Hydraulic conductivities of the calibrated flow model (Figure 12) range onsite from 0.1 to 0.6 feet per day (ft/day), whereas off-site hydraulicconductivities of the calibrated flow model are as high as 45 feet per day."(p. ES-2, Groundwater Modeling, PI, SS)
5 Analytical results for Monitoring Well ITB-6 obtained after the originalsubmittal date (May 20, 1991) of this report have shown detections of vinylchloride in this well. The solute transport model and its conclusions wereformulated on the basis of the existing data and without this newinformation. Because the new information is anomalous to the modelingresults and conclusions as presented, the conclusion that the front of theplume does not extend to ITB-6 and Domestic Well P-309 will be removedfrom the report However, the source of the vinyl chloride in the area ofthese wells is still unknown at the time of the Phase IH Report revision.
Replace the last two sentences of the second paragraph under GroundwaterModeling in the Executive Summary, p. ES-3, with the following text:
"Furthermore, significance of the 0.15 ug/L plume front (shown as a dottedline in the figures) is in question because of the lack of reproducibility ofgroundwater analytical data below the 2 pg/L level. Modeling results andconclusions were formulated using the set of data originally approved by theU.S. EPA. Figure 15 depicts the simulated vinyl chloride concentrations forthe current condition (prior to pumping scenarios) based on these data.However, after the original submittal of mis report, vinyl chloride has beendetected in Monitoring Well ITB-6 (reported in Table 9 of the revisedPhase IV Report). The source of vinyl chloride for the areas of Wells ITB-6and P-309 has not been determined at the time of the Phase HI andPhase IV report revisions."
/J83G3322
CommentNo.
6 Agreed. Change the following sentences as indicated below to reflect thatthe model predicts that the vinyl chloride plume would reach some domesticwells within a 20-year period:
"Based on the data in the report and according to the model... would reachsome domestic wells north of the site within a 20-year period." (ExecutiveSummary, p. ES-3, P2, SI)
• "The baseline scenarios indicate that the vinyl chloride plume wouldreach some domestic wells near the site (Figure 18) within the 20-yearperiod." (Section 3.2, p. 3-4, Model Applications, Bullet (B) 1, lastsentence)
7 Agreed. Revise the following sentences of the Phase m and IV Reports toindicate where the clean tap water was obtained for use duringdecontamination procedures:
"The decontamination procedure... of clean tap water (obtained from ITCorporation, Bellmawr, NJ, field office) through the pump... with clean tapwater." (Phase DDE Report, Section 2.3.2.1, Sampling Procedures, P3, S2)
"The decontamination procedure... of clean tap water (obtained from ITCorporation, Crofton, MD, field office) through the pump... with clean tapwater." (Phase IV Report, Section 2.4.2.2, Methodology, P3, S2)
8 Acknowledged. Add the following text to the end of the third paragraph onpage 2-3 (Section 2.3.2.1, Sampling Procedures):
"Although both filtered and unfiltered domestic well samples were collectedfor analysis of metals, according to U.S. EPA Region m policy onlyunfiltered domestic well samples will be considered in developing thequantitative risk assessment. And although ingestion of particulates in thedrinking water will be considered according to the U.S. EPA Region HIpolicy, current literature (Hawley, 1985) indicates that less than 100 percentof the metals in paniculate form will be absorbed into the body afteringestion.
9 Acknowledged. Add the following sentence to the Objective (Section 2.5.1)of the Data Evaluation, p. 2-9 (Phase DDE Report):
"All validated chemical data collected during the phased data collectionprogram of the RI for the site will be used for the risk assessment."
PT/8-91/WP/303486_CommniiiJTioc_ni
IR303323

CommentNo.
9 In addition, add this statement to the Objective (Section 2.6.1) of the Data(cont'd) Evaluation, p. 2-16 of the Phase IV Report.
10 Replace the first sentence of paragraph four on p. 2-12 (Section 2.6.2, ModelCode) with the following text:
"An early application of the SWIFT code was made by Geo Trans, Inc., andresulted in a modified version of the code which was named SWIFT n. Themajor modification was the extension of the capabilities of SWIFT tofractured media. The model as presented here treats fractured metamorphicbedrock as a porous medium. This is justified because the upper SO feet ofthe bedrock is fractured (per Phase n and Phase IV drilling, Phase nborehole television, and Phase IV packer sampling) such that water flows inthese fractures similar to pore spaces in porous rock."
11 Agreed Add the following text where indicated below to clarify that themodel is two-dimensional:
"The code (as it is applied here) simulates one hydrogeologic unit which hasno vertical leakage or inflow into or from the simulated layers. Therefore,the code is two-dimensional with the third dimension (vertical direction) as aconstant. This is appropriate for this site because the soil and bedrockbehave as one unit that is hydraulically connected." (Section 2.6.2, ModelCode, P. 2-12, P2, add after SI)
12 The term "successfully" as it is applied in this sentence (Section 2.6.2,p. 2-13, fourth paragraph, fifth sentence) means that predictions made ofwater levels and contaminant concentrations were later matched to areasonable, acceptable degree by actual measurements. The actualmeasurements consisted of a round of groundwater elevations for existingwells (during a period of low rainfall input) and a check of analytical datafrom any wells sampled that were placed within the projected plumeboundary. Results of the groundwater elevations and sampling were within areasonable, expected value.
13 The discussion of the existing supply wells in the vicinity of the site is givenin Section 2.6.S.1 (Baseline Scenario) of the report Pre-January 1991information from these wells was used in the formulation of the steady-stateflow model. This information included groundwater level elevations andpumping rates. Since pumping rates of the residential wells are low(approximately 0.35 gpm per well) they were not incorporated into thesteady-state model.

CommentNo.
14 Add the following sentence where indicated to clarify that the fracturedbedrock represents the regional aquifer in the modeled area:
"From published reports and data including boring logs, borehole cameraresults, and packer sampling results, groundwater in the region is producedfor domestic use from shallow, connected fractures in the bedrock. Thebedrock beneath the upper fractured zone (approximately beneath the upper50 to 60 feet of bedrock) does not produce appreciable water yields."
15 Agreed. Add the following text where indicated to discuss the relativeaccuracy of slug tests:
"The results of slug tests should be used in the context of the technicalconstraints of the method. Although some hydrologists do not consider slugtests to be as valuable as pumping tests in most cases, both yield goodpoint-source data for hydraulic conductivity. Using the value of hydraulicconductivity from slug tests and water table maps for the site (to determinesaturated thickness), drawdown was developed for the well field. This hasbeen accomplished using a Theis model (similar to that used in Price andWrightson, 1991) for a uniform aquifer and the more complex SWIFT DI (asused in Phase HI) for a nonuniform aquifer. In effect, the slug tests andwater table data yield sufficient data for the SWIFT m model. In this casethe slug test method of aquifer testing is considered a practical andacceptable method based on the hydrogeological conditions at the Woodlawnlandfill site. Pumping tests, if they had been performed at or near the site,might have resulted in cross-contamination in the aquifer between soil andbedrock portions." (Section 2.6.3.1, Hydrogeologic Setting, insert as a newparagraph, P6, p. 2-14)
16 The east-west trending photo-lineament identified during earlier activitiesextends as a local feature in the immediate area of the site. According tothe Phase I Report (Figure 15) the photo-lineament extends from the north-central portion of the landfill to the west-southwest. Pumping testsconducted in the vicinity of the site (Otton, 1988) do not depict the cone ofdepression graphically to make a judgment on its shape. However, it isunlikely that these pumping tests stressed the aquifer at the site andparticularly near the photo-lineament because these pumping tests wereconducted close to Northeast, Maryland.
17 Round 2 data were used in the model and supplemented with data fromRound 3 when the Round 2 data were found to be unacceptable. Yes,variations in vinyl chloride have been examined (Tables 9 and 10 of thePhase IH Report and Tables 12 to 14 of the Phase IV Report) to justify the
AR303325

CommentNo.
17 use of the data for the groundwater modeling. Round 2 vinyl chloride(cont'd) concentrations were used in all cases with the exception of Monitoring
Wells OW-2 1.1 ppb) and B-4 (0.5 ppb) for which Round 3 data was used.Examination of the W. Barton (P-309) results indicate that variations fromminute to minute cannot separate within-round variation from between-roundvariation. Evidence from the modeling indicates a gradual migration of thevinyl chloride plume over time (20 to 70 years) as shown in Figures 15 to18 of the Phase ffl Report
Revise the last sentence of the first paragraph of Section 2.6.3.2(Groundwater Solutes), p. 2-14, as follows:
"In the case when Round 2 data were not acceptable as based on datavalidation, then Round 3 data were substituted as necessary."
18 No evaluation of groundwater chemical data has been conducted on theon-site monitoring wells to show that vinyl chloride has been produced fromchemical and/or biochemical degradation of other organic compounds.Because of the complex nature of the degradation processes involving severalchemical routes, it was concluded that site-specific proof of this process wasnot possible. The fact mat organic compounds do biodegrade into vinylchloride, particularly in landfills, has been well documented in the literature.References 19 and 23 to 27 of the Phase m Report present a portion of thenumerous articles written on this subject.
19 Agreed. A range for the retardation factor of two to ten was discussed butnot approved in the February 20, 1991 meeting among members of theU.S. EPA state of Maryland, and IT.
Add the following sentence as the third sentence of Paragraph 1 inSection 2.6.33 (Model Input Parameters):
"Approval for a retardation factor of 4 is pending review of Appendix C(mis report) by the U.S. EPA."
20 Agreed. Although dispersivity and diffusivity parameters are read into thegroundwater flow model, they are solute transport model parameters. Movethe parameters "dispersivity of the aquifer formation" and "moleculardiffusivity of the aquifer formation" from the dot list of groundwater flowmodel parameters to the dot list of solute transport model parameters.(Section 2.6.3.3, Model Input Parameters, p. 2-15).
58303326

CommentNo.
21 Agreed. Place all model input parameters (flow and solute transport values)in parentheses in the dot lists in Section 2.6.3.3 (Model Input Parameters),p. 2-15 as follows:
"The site hydrogeologic parameters considered during the construction of thegroundwater flow model are listed below:
• Potentiometric head distribution (groundwater elevations, Table 31,Figure 8)
• Aquifer boundary conditions (Table 39, new table)
• Aquifer recharge (10 inches per year)
• Discharge from the aquifer into the streams in the simulated area(Table 41, new table)
• Aquifer thickness (Figures 8 and 13)
• Hydraulic conductivity distribution (Table 29, Figure 12)
• Compressibility of the aquifer formation (3.0 x 10"6 psi"1)
• Compressibility of the formation fluid (7.0 x 10"6 psi"1)
• Aquifer formation and natural fluid densities (formation density165.3 Ib/ft3, natural fluid density 62.4 Ib/ft3)
• Aquifer natural fluid viscosity (1.124 centipoise at 54°F)
• Temperature in the aquifer (59°F average value)
• Porosity of the aquifer formation (20 percent)
The following parameters were used for the solute transport modeling:
• Dispersivity of the aquifer formation (longitudinal dispersivity factor100 feet, transverse dispersivity factor 10 feet)
• Molecular diffusivity of the aquifer formation (5 frVday)
PT/t-91/WP/303486_Coomcna_Phuc_ni
AR303327

CommentNo.
21 • Observed vinyl chloride concentration (Tables 2 through 5 and 7 through(cont'd) 10 of the Phase m Report; Tables 9 and 11 through 14 of the Phase IV
Report; loading rates Section 2.6.4.2)
• Locations of source points (Cells A and B/C) plus the main area of fill(Figure 1)
• Contaminated fluid density (assumed equal to the natural fluid density of62.4 Ib/ft3 since loading rates are low)
• Contaminated fluid viscosity (Assumed equal to the natural fluidviscosity of 1.124 centipoise at 54*F since loading rates are low)
• Equilibrium retardation factor for the aquifer formation andcontamination (Rf = 4, Appendix C).
The following parameters were then used during the baseline and theproposed pumping scenario model runs:
• Well locations (baseline scenarios, Figures 16 through 18)
• Pumping rates (baseline scenarios and proposed scenarios, 500 gallonsper day per well)
• Pumping periods (baseline scenarios and proposed scenarios, constantpumping for 20, SO, and 70 years)
• Proposed hypothetical well locations (proposed pumping scenariosFigures 19 through 21)."
Also insert the following text for input parameters as indicated below:
"Round 3 (February 1991) groundwater elevations (Figure 8, Table 31) wereused as die input parameters for the potentiometric head (groundwaterelevations) in the modeled area." (Section 2.6.4.1, p. 2-16, ModelDevelopment, first bullet, [Groundwater Elevations])
"Table 39 presents the location of the constant head boundary values."(Section 2.6.4.1, p. 2-16, Model Development, second bullet [BoundaryConditions], insert after the fourth sentence).
SR3Q3328

CommentNo.
22 Add the following text as the second paragraph of Section 2.6.4 ModelDevelopment and Calibration to discuss the rationale for modeling thefractured bedrock and saprolite as a single equivalent porous medium:
"Based on geologic and hydrogeologic data collected during the RI, it wasdetermined that the aquifer extends across two geologic units, i.e., saproliteand fractured bedrock (from similar groundwater elevations in soil andbedrock wells). These data (including boring logs, borehole camera logs, andpacker sampling results) have shown that the upper SO to 60 feet of bedrockis highly fractured. Based on the occurrence and nature of these fractures,groundwater flow in the fractures approximate flow in porous media.
Additional evidence for this conclusion is provided by the aquifer tests (slugtests) performed during Phase n of the RI. These tests have shown, withonly one exception, that hydraulic conductivity in soil and bedrock wellswere of the same magnitude."
23 Agreed. Add the following statement where indicated to indicate that theflow model was calibrated to steady-state conditions:
"The flow model was calibrated to steady-state conditions." (Section 2.6.4.1,under Model Calibration, p. 2-17, PI, SI)."
Add the following text to the end of the fifth paragraph (p. 2-4) ofSection 2.6.3.1 (Hydrogeologic Setting):
"Information gathered during sampling (groundwater elevation measurementsand purging for analytical samples) of several domestic wells indicated matthe aquifer responded by rapidly drawing down (this produces a long, narrowcone of depression). As described in Section 2.4.3 of this report, dynamicconditions (pumping) were encountered in two Domestic Wells(P-487 and P-501) during Round 2 (November 1990) water levelmeasurements. Water levels in both of these wells were observed drawingdown rapidly upon initialization of water use during the measurements."
Add the following text where indicated to provide an explanation of thecontrolling factors in calculating groundwater discharge to the unnamedcreek:
"Discharge to the unnamed creek (tributary to Basin Run Creek) from theaquifer is based on cell-by-cell calculations performed by a subroutine of theSWEPT m model code. Model size (area) and the assigned hydraulicproperties of each aquifer cell are the controlling factors in calculating thedischarge quantities." (Section 2.6.4.1 Model Calibration, p. 2-18, add to theend of P4).
10
48303329

CommentNo.
24 As explained in Section 2.4 of the Phase IQ Report, Round 3 (February1991) groundwater elevation data were used for model development becausethis round represented the most complete set of data (most data points todate). In addition, the third round was conducted to test the assumptionthat all domestic wells were measured during static (nonpumping) conditions.Add the following text after the first sentence of the first bullet(Groundwater Elevations) under Model Development (Section 2.6.4.1,p. 2-16):
"Round 3 groundwater elevations were used in the flow model developmentto provide the most complete set (most data points to date) and'to test theassumption that all domestic wells were measured during static (nonpumping)conditions. Test conditions indicated mat data used represent static waterlevels."
25 Slug test results provide the initial hydraulic conductivity values for input tothe groundwater flow model. These values (along with other input para-meters) represent the initial point from which the model is then calibrated.As stated in the Phase HI Report, the calibration process involves adjustingthe hydraulic conductivity (and other parameters) until the model-simulatedhydraulic heads reasonably match the field-measured hydraulic heads.Therefore, hydraulic conductivity values from a single measuring point(single well) become an average value over a cell (or several cells) duringthe calibration process. As written in the Phase IQ Report (Section 2.6.4,SI), "Groundwater modeling (at the site) provides a means to interpolatebetween and extrapolate beyond field measurements." Therefore, a singlepiece of field data, i.e., a pumping rate of 16 gpm (not 25 gpm as reportedin the agency comments) during packer sampling of ITB-6, provides a basisfor the model to represent aquifer conditions over a broader area inconjunction with other constraints, such as groundwater elevations.
26 Agreed Steady-state conditions are independent of porosity under theaquifer conditions in the vicinity of the site. However, sensitivity analysiswas performed on the porosity to provide an additional check on thecalibration of the steady-state flow model. Replace the last two sentences ofthe second paragraph under sensitivity analysis (p. 2-19, Section 2.6.4.1) withthe following text:
"As expected, the results indicate that the model is not sensitive to changesin porosity (since the steady-state conditions are independent of the porosityunder the aquifer conditions in the vicinity of the site). This exercise(sensitivity analysis of porosity) provided an additional means to evaluate thereliability of the parameters used in the calibrated steady-state flow model.
11
8B3Q333Q

CommentNo.
27 The Phase DI Report (Section 2.6.4.1, Groundwater Flow Modeling,Sensitivity Analysis, p. 2-19, PI) stated that the purpose of the sensitivityanalysis was to determine the reliability of the parameters used in thecalibrated model. Paragraph 4 of this same section stated that existingassigned hydraulic conductivity values provide the best reasonable match tofield conditions (as based on the goodness-of-fit value of 0.035 determinedfrom the calibrated model run). These statements are referring to thereliability of the parameters which were used to calibrate the flow model anddo not make a judgment as to the validity of the model.
28 Agreed. Insert the following text as the new paragraphs 2 and 3 ofSection 2.6.4.2 (Solute Transport Model, p. 2-20):
"Based on site conditions, historical data, waste characterization, andexperience with similar site conditions, initial values for the vinyl chlorideloading rates were assigned to model cells within the landfill site.Successive iteration was used to vary the previously estimated loading rates(loading rates into groundwater, not into soil). Loading rates were adjustedduring the calibration process to match monitoring well analytical data forvinyl chloride.
Loading rates, in general, were higher in Cells A and B/C than in themunicipal landfill area because these cells received the polyvinyl chloride(PVC) sludge directly. However, the loading rate is the rate at which vinylchloride leaches out of the PVC sludge and into the groundwater. The highdensity of Cell B/C contents indicates that loading beneath Cell B/C may notbe as great as loading in areas where the same quantity was placed as adisseminated mass. In the latter case, PVC sludge may present more surfacearea for leaching and faster infiltration to the groundwater.
Vinyl chloride in the landfill area could be due to degradation of otherorganic compounds (or from random dumping of PVC sludge)."
Add the following text after the first sentence of the original paragraph 2(now paragraph 5) of Section 2.6.4.2 (p. 2-20) to provide the total mass ofvinyl chloride that was released based on loading rates used in modelsimulations:
"The total mass of vinyl chloride as based on these loading rates up to thecurrent condition (January 1, 1991) for Cells A and B/C and the municipallandfill area is as follows:
PT/S-91/WP/3034«6_ConanenBiJ>liMe_in 12
W30333I

CommentNo.
28 • Municipal landfill area - 6.14 pounds(cont'd) • Cell B/C - 91.30 pounds
• Cell A - 8.54 pounds
These weights include fractions of a pound resulting from adjustments duringcalibration."
29 See Comment No. 24.
30 The effects of chemical and biochemical processes on contaminant fate andtransport were considered in development of the model. The model does notaccount for destruction of vinyl chloride through biochemical or chemicalalteration. Decreases in vinyl chloride concentrations in the modeling resultsare caused by dispersion and retardation. Therefore, the model presents moreconservative concentration values for vinyl chloride.
31 The selected porosity value of 20 percent was based on a review of allliterature specific to the site area as well as general information sources.The aquifer consists of unconsolidated deposits (saprolite) and fracturedcrystalline bedrock (gneissic granite and metadiorite). Therefore, porosityvalues for both geologic units were considered when the choice was made.
Sensitivity analysis of porosity for the solute transport (transient simulation)of the current condition is presented in the new Table 42. Add thefollowing text as the last paragraph in Section 2.6.5.1 (Baseline Scenario):
"Sensitivity analysis was performed for porosity (the model input value forporosity is 0.2) under transient conditions. Results of this analysis(Table 42) showed that no significant changes in vinyl chlorideconcentrations resulted when the porosity was either increased by 50 percent(from 20 to 30 percent) or decreased by 25 percent (from 20 to 15 percent).Furthermore, as Table 42 shows, no significant changes in vinyl chlorideconcentrations occurred when the retardation factor was recalculated using the"sensitized" porosities (the retardation factor is dependent on the porosity).
32 The present day and simulated groundwater level elevations resulting from70 years of pumping are presented for selected wells in the new Table 40.Add the following text as the fourth paragraph of Section 2.6.5.1 (BaselineScenario, p. 2-21):
13
Sf?3Q3332
CommentNo.
32 "A comparison of present day groundwater level elevations with those(cont'd) resulting from 70 years of pumping are presented in Table 40. This table
shows that the groundwater elevations after 70 years of continuous pumpingrange from 1 to 13 feet lower than the present day elevations."
33 The U.S. EPA Method 502.2 was used (in addition to the CLP protocol) inthe second round of groundwater sampling to achieve a detection limit lowerthan that provided by the CLP. Replace the second sentence of Section 3.1(Chemical Analyses of Groundwater) with the following sentence:
"Method S02.2 was also used in the second round for additional analysis ofvinyl chloride with a detection limit lower than that provided by CLP."
34 Agreed. Replace the title word "Conclusions" to "Findings" in the Phase LTIand Phase IV Reports as indicated below:
Title - Section "3.1.2 Findings," p. 3-2, Phase m Report.
Text - "The following findings were summarized from the chemicalanalytical data for the second round of groundwater sampling:"Section 3.1.2, p. 3-2, PI, SI, Phase in Report.
Title - Section "3.2 Groundwater Modeling Findings," p. 3-3, Phase mReport.
Text - "The following findings are based on results of the groundwatermodeling program reported in Section 2.6 of this report:" Section 3.2, p. 3-3,PI, SI, Phase m Report.
Tide - Section "3.1.2 Findings," p. 3-3, Phase IV Report.
35 Agreed, closer examination is required to determine the source of vinylchloride in the P-309 domestic well. Remove the second sentence of thethird bullet of Section 3.1.2 (Findings, p. 3-2).
36 A new table (Table 41) has been created to show the distribution of therecharge to the Unnamed Creek and to the Basin Run Creek. Revise thesecond bullet of Section 3.2 (Groundwater Modeling Flow, p. 3-3) asfollows:
PT/Wl/WP/303XS6_Cominent*J>h««e_ni 14
/IR303333
CommentNo.
36 • "Most of the southern and a portion of the western groundwatcr flow(cont'd) components are recharged to the Unnamed Creek. This creek runs in a
southeast-northeast direction along the southern part of the Site andflows to the northwest. The recharge distribution is presented inTable 41."
Revise the third bullet of Section 3.2 (Groundwater Monitoring Findings,under Groundwater Flow, p. 3-3) as follows:
• "Most of the northern and a portion of the western groundwater flowcomponents end up being recharged to the Basin Run Creek, to dienorth of the Site. The recharge distribution is presented in Table 41."
37 and 38 In Figure 15, the 0.15 ug/L vinyl chloride plume extends to the P-207(Sorrick) domestic well.
To reflect the new information obtained after submittal of the original reportfor Monitoring Well ITB-6, replace the last bullet under Vinyl ChlorideTransport (Section 3.2 Groundwater Modeling Findings, p. 3-4) with thefollowing text
• "Based on the data included in the original submittal of this report(May 20, 1991), the current condition solute transport modeling runindicates that the boundary of the vinyl chloride plume 0.15 mg/1 doesnot extend to the group of domestic wells (P-501, P-487, P-309) locatedto the northeast of the site. However, additional data (analytical resultsobtained after submittal of this report) from Monitoring Well ITB-6shows that vinyl chloride was detected (Table 9 of the revised Phase IVReport presents this data from sampling events held in May andJuly 1990). As depicted in Figure 15, the 0.15 mg/1 vinyl chlorideplume boundary extends east of the site to the location of the P-207(Sorrick) domestic well."
39 A discussion of the validity of slug test is presented in response to CommentNo. 15 of mis document. In the August 22, 1991 letter to the U.S. EPA(Re: Pumping Test, Woodlawn Landfill) it was stated that slug tests andregional data, which were approved by the U.S. EPA and the state ofMaryland in the Phase ffl Detailed Work Plan, were necessary and sufficientto verify the model input parameters for this phase of the work. Thisconclusion is based on the reasoning that an aquifer test would not verify theinput parameters for the model cell; the test value may be quite different
15

CommentNo.
39 from the average value used in the model. Therefore, the model will serve(cont'd) as a. reliable tool for evaluating remedial alternatives for the feasibility study.
40 Correct the typographic errors by replacing the words "containment" with"contaminant" in the following sentence:
"Table 37 presents the updated potential [maximum contaminant levels(MCLs) and maximum contaminant level goals (MGLGs)] and TBCs(reference doses and cancer risks) for TCL and TAL analytes."(Section 3.3.1, Objectives and Scope of ARARs, P3, S2, p. 3-5).
41 The specific conductance results of the first sampling event (Phase n report,3/90 to 4/90) were reported as being in the units microSiemens percentimeter (uS/cm) but should be in the units milliSiemens per centimeter(mS/cm). Conversion of units from mS/cm to uS/cm (units reported inPhase HI and Phase IV Reports for specific conductance values) shows thatspecific conductance measurements from Phases n, HI, and IV are of thesame magnitude.
42 Monitoring well samples designated for metals analyses were filtered in thefield during collection time. Domestic well samples designated for metalsanalyses were collected in separate containers for filtered and nonfilteredsample types. Add notes to Tables 2, 3, and 4 to indicate mat themonitoring well samples designated for metals analyses were filtered samples.
43 The "RE" designation in Table 10 denotes that the sample was re-extracted(rerun) to meet laboratory QA/QC requirements. Although there is no "RE"data qualifier under the CLP protocol, this designation is common inlaboratory practice. As this is not a CLP abbreviation, it will not be placedon Table 11 (Data Qualifier Definitions and Explanations). However, afootnote will be placed on Table 10 to explain the "RE" designation.
44 Agreed. Change the designation "BFS" to "Woodlawn landfill" in footnote eof Table 24.
45 The columns of data for vinyl chloride concentrations projected after50 years and 70 years were reversed. Correct the vinyl chlorideconcentration projections in Table 36 by placing the vinyl chlorideconcentrations under the correct headings.
46 Add the appropriate tax map designation to the P-S30 wells in Tables 35 and36 in order to distinguish these two different domestic wells.
PT/I-91/WP/3034«6_Coinmea»Jlhu6_in
AR303335
CommentNo.
47 and 48 The proposed MCLs and MCLGs have all been addressed. A review of theregulations indicated that the proposed values presented by the U.S. EPA forPAHs and phthalates are in agreement with the current regulations. TheMCL and MCLG values presented for 1,4-dichlorobenzene(p-dichlorobenzene) are actually finalized standards.
49 The To Be Considered (TBC) concentration for 1,1-dichloroethane andmethylene chloride was recalculated to consider the inhalation route ofexposure.
50 and 52 The TBC concentrations for 1,2-dichloroethene and 1,4-dichlorobenzene wereremoved since final MCL and MCLG values were available for thesecompounds.
51 The TBC concentration for pyrene was retained since the MCL and MCLGvalues for this compound are proposed. MCL or MCLG values are usedonly when they have been promulgated or adopted.
53 The U.S. EPA states that oral exposure to 2 liters per day contaminateddrinking water by a 70 kg adult over a 70-year exposure duration is overlyconservative. We agree with mis comment and have corrected the TBCconcentrations using a 30-year exposure duration. The exposure frequency inthe equation presented by U.S. EPA is 338 days/year. It is assumed this is atypographic error and should be 350 days/year. Also, the factor for air-breathed presented by U.S. EPA is 30 m3/day. This value represents aworst-case scenario. The U.S. EPA Exposure Factors Handbook recommendsan adult daily breathing rate of 20 m3/day in situations where specificactivity patterns are not known. An OSWER Directive (No. 9285.6-03)dated March 25, 1991 also recommends a breathing rate of 20 m3/day.Therefore, the more realistic 20 m3/day will be utilized where appropriate.The ARAR values presented in Table 37 were also recalculated using theexposure duration (30 years), exposure frequency (350 day/year), andaveraging time (25,550 day) suggested in the March 25, 1991 OSWERdirective.
54 Change Table 37 to incorporate the recently promulgated Action Levels forlead in drinking water.
55 Include a statement of the uncertainty of the depth of Domestic Well P-506in the notes (Note 3) in Figure 2. In addition, add this statement toFigure 1 of the Phase m Report and to Figures 1, 2, and 4 of the Phase IVReport.
IT/*-91/WP/3034W_Comnx«*»_Ph«.cJII 17
SB3Q3336

CommentNo.
56 Relabel the potentiometric surface correctly in Figure 2.
57 Figure 14 has been retitled as "Simulated Steady State GroundwaterElevations, Current Conditions" to clarify the conditions represented by themodel.
58 Replace the word "solute" with "vinyl chloride" (as this compound is theonly solute that is contoured) in Figure 15 and other figures whereappropriate.
59 Agreed. Correct any typographic mislabelings of well identification numbersand rescale appropriate figures so that scale is the same.
60 Agreed. Report all RPDs as positive values for Tables 21 through 27 of thePhase m Report and for Tables 25, 27, and 32 through 34 of the Phase IVReport.
61 The recalculation of the retardation factor for vinyl chloride is presented inthe revised Appendix C. The revised Appendix C (Attachment 1) alsocontains a range of retardation coefficient values calculated by varying thepartition coefficient, Kj. The revision includes additional backgroundinformation on the retardation factor for vinyl chloride. Replace the firstfour pages of Appendix C with the recalculation, ranges, and additionalbackground information for the retardation factor.
Agreed. A silt fraction of 0.4 was used in recalculating the retardationfactor for vinyl chloride.
Although correctly applied in Appendix C, the bulk density units of g/cc(grams per cubic centimeter, mass per unit volume) were inadvertentlyinverted in the definition of bulk density.
See Comments No. 18 and 30 for explanation of volatilization of vinylchloride as a transport mechanism.
AR3Q3337

REPORT - PHASE IV - ADDITIONAL FIELD WORKREMEDIAL INVESTIGATION/FEASIBIHTY STUDY
WOODLAWN LANDFILL, CECIL COUNTY, MARYLAND
Response to Comments on the Phase IV Report Additional Field Work
CommentNo.
62 Revise the second sentence of paragraph 3 under Borings in Waste in theExecutive Summary (p. ES-2) as follows:
"BEHP is known to be present in the environment wherever plastics arepresent.
63 Yes, it is meant that no marked difference in lead and mercuryconcentrations were evident in samples collected from presumed cell areasand other areas of the landfill.
64 Agreed. Revise die third paragraph under Groundwater Samples of theExecutive Summary (p. ES-3) as follows:
"Vinyl chloride was detected in concentrations of the same magnitude as theMDL of 0.18 ug/L in Domestic Well P-309 and in Monitoring Well ITB-6 tothe northeast of the site. However, Piezometers ITZ-1 and ITZ-2 anddomestic wells adjacent to P-309 and ITB-6 showed no detection of vinylchloride at the same or lower detection limit. Therefore, based on theseanalytical results and the Phase HI modeling, the vinyl chloride detected inthe P-309 and ITB-6 wells may have come from a source other thanWoodlawn Landfill."
65 Based on the fact mat the Transfer Station Investigation (discharges to andfrom the station septic system) is still underway, we have agreed to eliminatethis statement from the Executive Summary (last sentence, p. ES-4 and fromthe last sentence on p. ES-3 of the Phase DI Report, as per the July22, 1991 letter from the U.S. EPA).
66 Based on a review of me site historical information, PVC sludge wasdeposited in Cells A and B/C from 1978 to late 1980. Revise the followingtext of the Phase ffl and Phase IV Reports as indicated:
"Prom 1978 to late 1980, polyvinyl chloride (PVC) sludge was placed ineach of three cells (A, B, and C) (Figure 1).H (Phase m Report, Section 1.2Site Background, p. 1-2, P2, S4).
19
AH303338

CommentNo.
66 "From 1978 to late 1980, polyvinyl chloride (PVC) sludge was placed in(cont'd) each of three cells (A, B, and C) (Figure 1)." (Phase IV Report, Section 1.2
Site Background, p. 1-3, P2, S4).
67 Include the following discussion on the vertical extent of groundwatercontamination in Section 2.4.1.3 (include as the last paragraph, PS, of thissection):
"Based on data collected during the RI investigation including boring logs,(for monitoring and domestic wells), packer sampling, borehole televisioncamera, and other reference material (Otton, 1988), the vertical extent ofcontamination has been defined. Groundwater occurs in the shallow bedrock(in the upper 60 feet of bedrock) in numerous connective fractures. Theevidence for this conclusion has been documented throughout the RI reports.The results of the packer sampling provide the best supporting evidence forthis conclusion since no groundwater was found below the interval sampledfrom 60 to 85 feet below ground surface (28 to S3 below bedrock top) inMonitoring Well ITB-6. The only place that groundwater contaminationcould be present is within this zone (upper SO to 60 feet of bedrock) whichdefines the vertical extent of contamination."
68 Update Section 2.4.1.3, p. 2-6, with data collected on May 10, May 31, andJuly 2, 1991 for Monitoring Well ITB-6 (The other well [Domestic WellP-309] sampled will be updated in the appropriate section becauseSection 2.4.1 includes additional monitoring wells only) as follows:
"Samples collected during packer sampling (Method S02.2) and subsequentCLP sampling and analysis showed no detections of vinyl chloride (Table 9)for Monitoring Well ITB-6. Method S24.2 (detection limit 0.18 ug/L)analysis of samples collected on May 10, 1991, May 31, 1991, and July 12,1991 showed 0.71 ug/L, 0.38 ug/L, and a nondetection for vinyl chloride,respectively.
69 Soil samples were collected from the top of the saturated zone from boringin waste ITW-14. This boring was added to the program for Phase IVAddendum work to investigate an additional possible source area as describedin this document. Results of analysis of soil samples from the saturatedzone provide qualitative information on the soil and groundwater.
70 Update Section 2.5.3 (Ongoing Monitoring Program, p. 2-15) with the mostrecent groundwater sampling data for Domestic Well P-309 as follows:
PT/8-91/WP/3034S6_Commenti_PhMC_in
AR3Q3339

CommentNo.
70 "Subsequent sampling events for Domestic Well P-309 were performed on(cont'd) May 10, May 31, and July 2, 1991. Analytical results using Method 524.2
(detection limit 0.18 pg/L) showed a nondetection of vinyl chloride onMay 10, 1991, however, a duplicate sample collected minutes later from thePF sampling point showed a detection of 0.4 pg/L. Analytical results for theP-309 well (using Method 524.2 with a detection limit 0.18 pg/L) forsamples collected on May 31 and July 2, 1991 showed no detection of vinylchloride."
71 and 72 The analytical results of sampling conducted on and after May 10, 1991 havebeen included in Section 2.5.4 (Source of vinyl chloride). The source of thevinyl chloride detected in Monitoring Well ITB-6 and Domestic Well P-309has not been determined. Therefore, statements reflecting that the landfill isnot the source of the vinyl chloride in these wells have been removed fromthe Phases m and IV reports.
Replace the text in Section 2.5.4 (Source of Vinyl Chloride) after the fifthsentence with the following sentences:
"This table shows detections of vinyl chloride from analysis of samplescollected on May 10 (0.7 pg/L) and May 31, 1991 (0.38 u/L). Prior to theMay 10, 1991 sampling event, vinyl chloride was not detected in ITB-6 aftersampling two times over a period of three months."
73 The questions submitted to IT during the June 26, 1991 meeting pertaining toSection 2.6.3 are attached to the end of the comment package received onJuly 18, 1991. These questions are lettered a through e and are addressedindividually as follows:
a. This statement means that the overall precision (which refers to thereproducibility of the analytical method for the entire waste boringsample set) is within acceptable limits. This statement has been editedin the Section 2.6 revision presented below.
b. This statement means that the calculated accuracy percentage for theBNA analytical method was outside of the control limits for mis groupof samples. The paragraph containing mis sentence has been edited inthe Section 2.6 revision presented below.
Rather than attempt to establish a correlation between overall andindividual accuracy percentages, this paragraph has been rewritten in theSection 2.6 revision below to report the overall percentage accuracy and
21

CommentNo.
73 individual accuracy for the waste boring sample set. As shown in(cont'd) Table 22, some of the contorol limits were exceeded.
c. The explanation indicating that % RSD and RPD values cannot beinterchanged to evaluate measurement precision was presented in theJuly 9, 1991 IT Fax to the U.S. EPA. The Relative Percent Difference(RPD) and the Percent Relative Standard Deviation (% RSD) are bothmeasures of precision between or among duplicates. However, as statedin the IT FAX (July 9, 1991), "The % RSD is typically used when morethan seven data points are available."
d. The QC criterion for U.S. EPA Method 502.2 for vinyl chloride;according to Tables 2 and 4 of the U.S. EPA document "Methods forthe Determination of Organic Compounds in Drinking Water," U.S. EPA600/4-88/039, December 1988; is one percent (95-96 percent). Theaccuracy data for the Method 502.2 data ranges between 85 to 127percent. The QC criteria is 95 to 96 percent. The results were acceptedinto the data base on the basis that most of the recoveries (Tables 33,34, and 35) for Method 502.2 were higher than 96 percent. Only twoQC samples were below 96 percent recovery and vinyl chloride was notdetected in either of these two samples. This explanation has beengiven in the revision of Section 2.6 below.
e. This phrase has been revised to "between 86 and 100 percent." Thisrevision has been added to the revised Section 2.6 below.
The Data Evaluation section (Section 2.6, p. 2-16) was rewritten andaddresses the four questions pertaining to Section 2.6.3 (the four questionswere submitted to IT during the June 26, 1991 meeting and are attached tothe end of the agency comment letter). Replace Section 2.6 with thefollowing text as indicated:
2.6 Data EvaluationPhase IV work plan (DWP-IV, Revision 02, November 30, 1989) samplesincluding the original borings in waste and seep, sediment, and surface watersamples were analyzed according to the CLP method. Phase IV work planaddendum (DWP-IV Addendum, Revision 0, November 27, 1990) samplesincluding boring waste, sediment, surface water, and groundwater sampleswere analyzed using the CLP methods and Method 502.2 as specified in therespective sections of this report. The data collected for each of theanalytical methods were evaluated individually. The objective, methodology,and results of the data evaluation are presented below.
PT/8-91/WP/3034«6_Cofmntnt»_ptaKjn 22
AR3033M
CommentNo.
73 2.6.1 Objective(cont'd) The objective of data evaluation is to assess the applicability of Phase IV
waste boring samples for use in the public health risk assessment and the FS.All validated chemical data collected during the phased data collectionprogram of the RI for the site will be used for the risk assessment.
2.6.2 MethodologyA detailed QA review was performed by the analytical chemistry taskmanager to verify the quantitative and qualitative reliability of the data asreported by the laboratory. The QA evaluation included the review of datafor conformance with the U.S. EPA-approved QAPP. The data validationprocedure consisted of:
• Precision and accuracy of the analytical methods• Comparability and completeness of the data• Evaluation of laboratory QC samples data (data validation)• Assessment of data for used in modeling, public health risk assessment,
and the FS.
Data validation procedures followed the project QAPP and the U.S. EPAGuidance Document entitled "Laboratory Data Validation FunctionalGuidelines for Evaluating Organic/Inorganic Analyses" February 1 andJuly 1, 1988 (including modifications for Region ffl, 6/88) by the U.S. EPAData Review Work Group.
2.6.2.1 Precision and AccuracyMatrix spike and matrix spike duplicate data received from the laboratorywere used to calculate the precision and accuracy of the analytical methodsas described in Chapter 12.0 of the QAPP. Samples falling outside qualitycontrol (QC) limits were identified and tabulated. "Overall precision" and"overall accuracy" refer to the precision and accuracy of the analyticalmethods based on an entire sample set. The calculation of percent overallprecision and percent overall accuracy are calculated as follows:
sum of parameters _ sum of parameters% Overall Precision = ___analyzed_____out of control x 100
(or Accuracy) sum of parameters analyzed
23

Comment_No.
73 2.6.2.2 Comparability and Completeness(cont'd) Data comparability is a qualitative parameter expressing the confidence with
which one data set can be compared with another. This parameter wasevaluated and it was determined that the data sets were comparable based onthe implementation of standard collection procedures (i.e., bailers used tocollect all samples) and analysis techniques (CLP protocol). In addition, allanalytical results were reported alike in appropriate units. Completeness isdetermined from the calculated percentage of total usable data points out ofthe set of total data points collected and analyzed and available.
2.6.2.3 Evaluation of the Laboratory QC Samples DataThe analytical data packages were reviewed for various blanks according toU.S. EPA guidelines. As indicated earlier, the "10 times" rule has beenapplied to the common laboratory contaminants, including acetone,2-butanone, methylene chloride, toluene, and phthalate esters. The "5 times"rule has been applied to other TCL compounds when found In the associatedblanks.
Metals with Qualifier B [concentrations exceeding instrument detection limit(IDL) but below the contract required detection limit (CRDL)] wereevaluated according to U.S. EPA guidelines (including Region IQ modifica-tions). Values falling below the "5 times" blanks were eliminated from thesummary tables. The results of data evaluation are discussed in thefollowing section.
2.6.3 ResultsData evaluation parameters of laboratory data are summarized in severaltables and referenced in the following discussions. Laboratory data accepted,as verified by the data evaluation below, were added to the data base and areapplicable for use in modeling, public health risk assessment, and the FS.
Precision and accuracy data for VOCs, BNAs, pesticides/PCBs and metalsanalyses for waste borings, seeps, seep soil leachates, surface water, and thesediment samples are summarized in Tables 21 through 24.
Precision and accuracy data for VOC analyses are presented in Table 21.Precision and accuracy for VOCs of the waste boring samples are generallywithin acceptable limits, except the precision data for the samples associatedwith waste Boring ITW-10B. Overall precision (referring to the reproduci-bility of the VOC analytical method for the entire waste boring sample set)of the VOC analytical method is 86 percent (within control limits). Thismeans that the calculation of the overall precision indicates that the
FT/t-91/WP/3034S6_Conm«ia_Ph«ejn 24
1830331*3

CommentNo.
73 reproducibility of the data is 86 percent which places it within the control(cont'd) limits. Therefore, the VOC analytical data for waste boring samples were
accepted into the data base.
Precision data for the BNA analyses as shown in Table 22 are acceptable.The accuracy data for samples ITW-2A, -2B, -2C, LS-2, LS-3, LS-4, SW-1,SW-2, and SB-1 showed 18 of 22 (82%) parameters within control limits.The overall accuracy for the CLP analytical method was 91 percent.Therefore, the data were accepted into the data base.
Overall precision and accuracy data for pesticides/PCBs (Table 23) are withinQC limits and are acceptable. However, no pesticides or PCBs weredetected in any of the samples collected from the Site.
Precision and accuracy data for metals showed that various samples were outof control limits (Table 24). Precision data for waste boring samplesITW-6A, -6B, -6C; 1TW-8A, -8B, -8C; ITW-lOA, -10B, -10C; and ITW-11A,-1 IB are out of control and the data were not accepted into the data base.The overall accuracy data for metals are within 78 percent of QC limits and,therefore, were accepted.
The summary of QA/QC data for the volatiles, BNAs, pesticides/PCBs andmetals (Table 25) show the metals in waste borings to be generally out ofthe QC limits. Data validation results for vinyl chloride and BEHP(Tables 26 and 27) for waste boring, seep, leachate, seep soil, surface water,and sediment samples are within QC limits and the data were accepted intothe data base.
Summaries of precision and accuracy data for the Addendum Work Plansampling, including the surface water, sediments, and Monitoring WellITW-14 boring samples are included in Tables 28 through 31. Precision andaccuracy for VOCs, BNAs, and pesticide/PCB data for these samples arewithin the control limits and were accepted into the data base. Precision formetal analysis for die surface water, sediments, and Monitoring Well ITW-14bore hole samples are out of the control limits and are unacceptable. Anoverall summary of the QA/QC data (Table 32) showed metals to be out ofcontrol limits.
Precision and accuracy data for the Addendum Work Plan samples analyzedfor vinyl chloride by Method 502.2 are included in Table 33. The precisiondata [or relative percent deviation (RPD)] for the test samples werecalculated using two samples is matrix spike and matrix spike duplicatesamples according to the project QAPP. The QC statistic provided by
PT/I-91/WP/303«6_Comincnt»_PhMe_ni 25
AR3033M

jf-—-,• CommentNo.
73 U.S. EPA for Method 502.2 and 524.2 (U.S. EPA Methods for Determination(cont'd) of Organic Compounds in Drinking Water, U.S. EPA 600/4-88/039,
December 1988) is percent relative standard deviation (% RSD). The% RSD is typically used when more than seven data points are available.Because only two data points per sample are available for the measurementof analytical precision, it is more reasonable to use the RPD as themeasurement for analytical precision. Therefore, precision data for the testsamples should not be compared to U.S. EPA guidelines.
Precision and accuracy data for vinyl chloride analysis for the carbontreatment monitoring for Domestic Well P-309 (W. Barton) is presented inTable 34. Since the samples were analyzed according to Method 502.2, theaccuracy data were used for evaluation. The accuracy data for the samplesranged between 85 to 127 percent as compared to QC criteria of 95 to96 percent. However, all the data were accepted into the data base on thebasis that most recoveries (Tables 33, 34, and 35) for Method 502.2 werehigher than 96 percent Only two QC samples (SRF WTR6-01 and P-309-005GWPF, Tables 33 and 34) were below 96 percent recovery. Furthermore,vinyl chloride was not detected in either of these two samples.
For data evaluation by Method 502.2, accuracy (percent recovery) data wereused (Table 33). Data validation for Addendum Work Plan groundwatersamples for vinyl chloride is presented in Table 35. All the data are withinacceptable QC limits and were accepted into the data base. Data validationfor Addendum Work Plan groundwater samples for BEHP is presented inTable 36. All the data are within acceptable QC limits and were acceptedinto the data base. The accuracy data for all the analyses are within QClimits and were accepted into the data base.
Summaries of data completeness for the waste boring samples are presentedin Table 37 and the seep, leachate seep soil, surface water, and sedimentsamples are presented in Table 38.
Precision and accuracy data for the waste boring, seep, leachate seep soil,surface water, and sediment samples for vinyl chloride and BEHP wereacceptable (between 86 to 100 percent) and therefore, the data sets can becompared with confidence.
Summaries of completeness data for waste borings, seep, leachate seep soil,surface water, sediment, and Addendum Work Plan samples are included inTables 37 through 40. Waste boring samples showed 32 vinyl chloride datapoints out of 37 samples are acceptable based on QC limits. BEHP analysisshowed 23 out of 24 data points are acceptable. Of the seep, leachate seep
26

CommentNo.
73 soil, surface water, sediment samples, and samples from the addendum work,(cont'd) none of the samples passed holding times or were lost due to broken con-
tainers. All data were within QC limits indicating 100 percent completenessof data. Each set of data was collected using standard sampling procedures,the same analytical techniques and are reported in the same units, andtherefore are comparable.
74 Agreed.
75 Agreed. Revise the second sentence of paragraph 1 on page 3-3 underMonitoring Well ITB-6, Piezometers ITZ-1 and ITZ-2, and Domestic WellP-309 Samples (Section 3.1.1.4, Additional Groundwater Samples) as follows:
"Prior to further sampling events in May and July, 1991, no VOCs includingvinyl chloride were detected either by CLP or 502.2 methods in any of thegroundwater samples (including packer samples) collected from MonitoringWell ITB-6. Monitoring Well ITB-6 was resampled for vinyl chloride usingMethod 524.2 (detection limit 0.18 pg/1) on May 10, May 31, and July 2,1991. Analytical results were 0.71 uG/L, 0.38 pg/1, and nondetection forthese respective dates."
Add the following text to the end of the second paragraph of the samesection indicated above:
"Additional sampling events were performed on the P-309 well near and afterthe submittal date (May 20, 1991) of this report. Method 524.2 (detectionlimit 0.18 pg/1) was used for sample P-309 for vinyl chloride on May 10,May 31, and July 2, 1991. Analytical results showed no detections for thePF, BF, and AF sampling points on May 10, 1991. However, a duplicatesample collected from the PF sampling point only minutes after the nondetectsample was collected showed a detection of 0.4 pg/1. Analytical results fromthe May 31 and July 2, 1991 sampling events showed no detection of vinylchloride in all three sampling points."
76 Based on review of the data, no correlation appears to exist between BEHPlevels and water levels measured during the three rounds of sampling. Thereview included comparisons of BEHP concentrations and water levels for allwells within and between rounds of data.
77 A portion of the boring in waste samples were not analyzed for semivolatilesbecause the analytical program in the U.S. EPA-approved Phase IV WorkPlan did not include semivolatiles. The work plan required sludges, powders,oils, VOCs, PCBs, and metals (lead, total chromium, and arsenic
27

CommentNo.
77 only). Analytical parameters required by the Phase IV Work Plan were(cont'd) based on the programs established by previous samplers such as the
U.S. EPA, the State of Maryland, and Firestone, Inc. These programs didnot include semivolatiles. However, once Phase n groundwater samplingbegan it became clear that the semivolatiles and additional metals should beadded to the sampling plan. Samples from completed borings were notresampled for the additional analytes.
78 This document has been consulted and the "B" qualifier has been usedproperly in flagging results of organic analysis of soil/waste samples.
79 Table 9 (Summary of Analytical Data, Monitoring Well ITB-6 andpiezometer samples) has been updated to include the analytical results fromsubsequent sampling dates.
80 Table 18 has been updated to include all analytical results for vinyl chlorideto date.
81 Revised. Table 40 (Chemical-Specific Potential ARAR's and TBCs Relativeto Ground and Perched Water at the Woodlawn Landfill Site) with the latest(to date) values has been updated.
82 Add the note "Domestic Well P-506, listed as a bedrock well may notactually extend into bedrock" to Figure 4 to indicate that there is uncertaintyabout the depth of Well P-506 (whether or not it extends into bedrock).This note was also added to Figures 1 and 2 of the Phase IV Report and toFigures 1 and 2 of the Phase m Report.
83 In the July 9, 1991 FAX from IT Corporation it was stated that it was notnecessary to determine the exact location of Cell A because the landfill capwill prevent leaching of materials from the soil to the groundwater. Thefeasibility of placing a cap on the landfill will be determined during the FS.The FS will be performed immediately after approval of the Phases HI and
Reports. Remediation measures will control the existing state of leachedals. This argument assumes, of course, that a landfill cap of one form
another will be part of the selected remedial alternative. By placing a capover die entire landfill, Cell A and other unidentified areas of polyvinylchloride sludge disposal will be effectively controlled (without diggingtrenches and/or test pits which would result in the generation of wastes).
Borings in waste ITW-12 and ITW-13, drilled into the suspected area ofCell A, were added to the program during its course for the purpose of fieldidentification of Cell A. It was decided prior to drilling these two extra
PT/«-91/WP/303«6_Comnienti_Pb««,jn 28
ftR3G33ti7

CommentNo.
83 borings that no samples would be sent to the laboratory for analysis unless(cont'd) visual evidence showed that powders or sludges were encountered. It is
likely that "elevated" headspace readings would result when monitoringdrilling into many areas of the landfill.
84 Agreed. The boring logs (TTW-4 and ITW-6) have been appended toindicate the origin of the powdery substances.
85 This response refers to the letter of July 22, 1991 (sent via FAX). As perthe "Laboratory Data Validation Functional Guidelines for Evaluation ofOrganic Analyses, 2/88, modified for Region ID, 6/88 (D. Rossi letter ofJuly 22), we have reviewed all Phases ffl and IV data validation performedfor the 500-series methods. Although some of the data were consideredunacceptable with respect to accuracy and precision as per U.S.EPA 600/4-88/039, we are accepting them into the data base with aJ-Qualifier because they meet all laboratory criteria (holding times,temperature of sample, nonbreakage of vials, improper documentation, etc.)and the proper methodology has been executed. We have not added the J'sto the tables in this document, although they will appear in the final printing.
29
ftR3G33i»&

UNITED STATES ENVIRONMENTAL PROTECTION AGENCYREGION Ul
841 Chestnut BukingPhiladelphia, Pennsylvania 19107
October 1, 1991
Mr. George B. MarkertSenior ConsultantEnvironmental Affairs1200 Firestone ParkwayAkron, Ohio 44317Re: Aquifer Test
Phase III and Phase IV ReportsWoodlawn Landfill RI/FS, Cecil County, Maryland
Dear Mr. Markert:
EPA has determined that an aquifer test should be conductedat the Woodlawn Landfill site as part of the remedialinvestigation/feasibility study. This test should be conductedto assist in the determination of the technical practicability ofa pump-and-treat alternative for ground water remediation. Inyour letter to EPA dated September 20, 1991, you speculated thata pump-and-treat alternative may not be feasible, and stated thatthe ground water flow and solute transport model would be used toevaluate this remedial alternative and others. EPA believes thatnone of the data collected thus far indicates the infeasibilityof a pump-and-treat alternative from an engineering perspective.Additionally, the ground water model alone cannot be used toevaluate the feasibility of a pump-and-treat alternative ordemonstrate its impracticability. However, the Agency considersthe performance of an aquifer test an essential part of thesedeterminations and is, therefore, requiring that the test beconducted in conjunction with previously proposed treatabilitystudies, j li'
Perl|||ijance of the aquifer test at the site will satisfy asecondar jprjective. The data set generated during theperformance of the test may help to verify the accuracy of thePhase III ground water flow model in predicting aquifer responseto stress conditions. As indicated in my letter to you datedJuly 26, 1991, this may be accomplished by matching the simulatedhydraulic head response to the hydraulic head response observedin the field during the aquifer test. An assessment of theaccuracy of the model in predicting responses to system stress isimperative if the model is to be applied as a predictive tool inthe evaluation of remedial alternatives under consideration forthe site. As previously stated, the current model has limitedutility as a tool for the evaluation of alternatives, since it
1830331*9

Mr. MarkertOctober 1, 1991Page 2
has not been tested under transient conditions using a set ofdata different from that used in model calibration. Given thecurrent status of model verification, EPA cannot consider themodel to be a sound means of forecasting system responses to theremedial alternatives that are being considered for the site.
The following comments pertain to the Phase III and Phase IVReports, the August 1991 responses to Agency comments prepared byIT Corporation, and attachment 2 (Appendix C, Revision 02 - PhaseIII Report) of your letter dated September 20, 1991.
EPA finds the proposed revisions of the Phase IV Report tobe acceptable, and approves of the revised Phase IV Report.However, with respect to your contractor's response to Agencycomment number 83, please note that EPA may consider polyvinylchloride sludge disposal cells A and B/C to be hot spots withinthe landfill which arc suitable for removal and/or treatment. Inthe event that removal and/or treatment are deemed appropriate,additional efforts may be required to locate cell A.Additionally, please correct the proposed revision of Section2.4.1.3 of the Phase IV Report (response to comment number 68) sothat it states that a sample was collected on July 2, 1991,rather than July 12, 1991, and please state on page ES-3 (commentnumber 63), "Lead and mercury are not restricted to or show nomarked differences...."
EPA has not been adequately assured that the retardationfactor selected for vinyl chloride in the Phase III modelingeffort (Rf * 4) accurately reflects vinyl chloride mobility atthe site. Unless the R« value of 4 is verified using site-specific data, the model should be recalibrated using aretardation factor based on the values of the octanol/waterpartition coefficient (K ) presented in the references 1, 2 and3 cited in Table 1 in Revision 02 of Appendix C of the Phase IIIReport. The mean Rf value based on these three validdeterminations of Kg is 1.93, which rounds to 2. Additionalcomments pertaining to Revision 02 of Appendix C are providedbelow.
Reference 2 (Howard, 1989) for Table 1 is consideredunsatisfactory as a source of values for the organic carbonpartition coefficient (Koc). The values of 0.40 and 56 are givenin the reference (page 554) as "reported in standard soil" and"estimated" from water solubility, but are not listed under thechemical and physical properties for vinyl chloride presented onpage 551. This reference should be used only to provide a valuefor K (based on the log K of 1.38), unless the conditionsassociated with the reported value (0.40) can be shown to apply
&R3Q335Q

Mr. MarkertOctober 1, 1991Page 3
to this site, or the error associated with the estimated value(56) is provided and shown to be reasonable.
On page 1 of Appendix C, the statement is made in the secondparagraph that "as long as the Rf value is chosen from theaccepted range of values as given in the literature for vinylchloride (1.35 to 8.73)...," which implies that these values forRf have been provided in the literature. In fact, it is thevalues for the various parameters in the equation used tocalculate Rf that have been selected from published literature.
Regarding the discussion on page 5 of Revision 02 ofAppendix C, note that the solubility of a compound, i.e., themaximum amount of that substance that will dissolve in pure waterat a specified temperature, is a property of that substance witha unique value at a particular temperature. Although theliterature indicates several conflicting values for the watersolubility of vinyl chloride, even at the same water temperature,the range of values presented should not be interpreted as an \indication that "vinyl chloride has a low to high mobility.1*Problems in the determination of the solubility of vinyl chlorideundoubtedly relate to the fact that vinyl chloride is extremelyvolatile, which results in difficulty in its measurement.Furthermore, it is probable that the value of vinyl chloridesolubility noted in Verschueren (1983 and 1977) is an incorrectunit conversion or typographical error based on a solubility of0.11 g/100 g water (which equals 1,100 mg/1, not 1.100 mg/1) fromWeast (1972). Note that EPA rates the potential subsurfacemobility of an organic compound as "high1* when log Koc is lessthan or equal to 2.2 (EPA/540/2-90/011a, "Subsurface RemediationGuidance Table 1 & 2," 1990). Based on the calculated values ofKoc presented in Table 1, vinyl chloride is highly mobile.
Regarding IT'S August 1991 response to Agency comment number21 (page 8), it appears that the values for aquifercompressibility and fluid compressibility were reversed. Inaddition, the value reported for molecular diffusivity of theaquifer (!T1Ct2/day) is very high. Freeze and Cherry (1979)provide a diffusion coefficient range for unconsolidatedmaterials on the order of 10~9 to 10"11 m2/s (approximately 10""3to 10~5 ft2/day). Given these very low values for diffusivity inunconsolidated materials, the high value that you have used seemsunreasonable for the mixed saprolite/crystalline nature of theaquifer at the site.
Note that the proposed modification of Section 2.6.5.1 ofthe Phase III Report (response to comment number 32) states that"groundwater elevations after 70 years of continuous pumpingrange from 1 to 13 feet lower than the present day elevations."
AR3833SI

Mr. MarkertOctober 1, 1991Page 4
However, Table 40 indicates that the simulated 70-year groundwater elevation in well ITB-6 is about 23 feet lower than thepresent day ground water elevation.
Regarding IT'S August 1991 response to Agency comment number53, note that although breathing rate is discussed, it is notclear exactly how the inhalation route of exposure wasincorporated in the TBC concentration presented in Table 37. Astatement should be included in this response, and in Table 37,describing the inhalation exposure assumptions used in the riskcalculations.
Finally, please document the significance of the dotted linerepresenting the 0.15 ppb vinyl chloride isopleth in the legendof figures 15 through 21.
Please submit to EPA and the Maryland Department of theEnvironment within thirty days of your receipt this letter arevised Phase III Report which is responsive to the commentsabove. If you have any questions or comments regarding thismatter, please call me at (215) 597-9238. I will be away fromthe office until October 17, 1991. However, if you or AlanJacobs have any questions regarding the ground water model oraquifer test, you may reach EPA's hydrogeologist, NancyCichowicz, at (215) 597-8118.
Sincerely,
Debra RossiRemedial Project ManagerDelaware/Maryland Section
cc: Barry BelfordNancy CichowiczJohn FairbankKevin GaynorMark GrummerAlan Jacobs
AR303352