cause related marketing: a study of consumer …
TRANSCRIPT

CAUSE RELATED MARKETING: A STUDY OF CONSUMER
NONPROFIT BRAND IDENTIFICATION
by
PATRICK JOSEPH CARR
A THESIS
Presented to the Department of Planning, Public Policy, and Management
and the Graduate School of the University of Oregon in partial fulfillment of the requirements
for the degree of Master of Public Administration
June 2005

ii
“Cause Related Marketing: A Study of Consumer Nonprofit Brand Identification”, a thesis
prepared by Patrick Joseph Carr in partial fulfillment of the requirements for the Master of
Public Administration degree in the Department of Planning, Public Policy, and
Management. This thesis has been approved and accepted by:
____________________________________________________________ Professor Renee Irvin, Chair of the Examining Committee ________________________________________ Date Committee in Charge: Dr. Renee Irvin, Chair Dr. Simona Stan Dr. Jim Van Leuven Accepted by: ____________________________________________________________ Dean of the Graduate School

iii
© 2005 PATRICK JOSEPH CARR

iv
An Abstract of the Thesis of Patrick Joseph Carr for the degree of Master of Public Administration in the Department of Planning, Public Policy and Management
to be taken
June 2005 Title: CAUSE RELATED MARKETING: A STUDY OF CONSUMER NONPROFIT
BRAND IDENTIFICATION
Approved: _______________________________________________
Dr. Renee Irvin
In the past fifty years corporate involvement in the nonprofit sector has gradually
changed from a voluntary practice of corporate philanthropy to the current mainstream practice
of corporate social responsibility through mutually beneficial partnerships. While these
partnerships have become a ubiquitous device in the promotional portfolio of corporate
communication departments, the mechanics behind their effectiveness are still not fully
understood by practitioners and academics. This thesis sought to better understand how
purchase intentions of those active with the nonprofit partner of a cause related marketing
program are moderated by consumer-nonprofit identification through a review of academic
literature and a survey of graduate students. The results show that nonprofit identification is a
good predictor of a volunteer’s or a donor’s intent to purchase cause related marketing products,
and that nonprofit identification is moderated by tenure and frequency of interaction with the
nonprofit.

v
CURRICULUM VITAE NAME OF AUTHOR: Patrick Joseph Carr PLACE OF BIRTH: Quesnel, British Columbia, Canada DATE OF BIRTH: July 29, 1978 GRADUATE AND UNDERGRADUATE SCHOOLS ATTENDED:
University of Oregon
DEGREES AWARDED:
Master of Public Administration, 2005, University of Oregon Master of Business Administration, 2005, University of Oregon Certificate in Nonprofit Management, 2005, University of Oregon Bachelor of Science, 2000, University of Oregon
AREAS OF SPECIAL INTEREST:
Nonprofit/for-profit partnerships Sustainable Business Performance Management Resource Development
PROFESSIONAL EXPERIENCE:
Graduate Teaching Fellow, The Graduate School, University of Oregon, 2004-2005 Graduate Teaching Fellow, Department of Planning, Public Policy, and
Management, University of Oregon, 2003-2004 Kaufman Foundation Summer Fellow, Emerald Kidsports, 2004 Oregon Performance Intern, League of Oregon Cities, 2003
vi
GRANTS, AWARDS AND HONORS:
Allied Art & Administration Foundation, University of Oregon: Al Frazier Award, October 2004
University of Oregon Graduate School: Graduate Service Award, May 2004 University of Oregon: Leon Culbertson Scholarship, April 2004 Oregon Student Assistance Commission: Dorothy Flegel Scholarship, April 2004
Lundquist Center for Entrepreneurship: Kaufman Foundation Social and
Entrepreneurial Fellow, June 2004 University of Oregon: Joseph K. Starr Scholarship, April 2003 Oregon Student Assistance Commission: Dr. Franz and Katherine Stenzel
Scholarship, April 2003 PUBLICATIONS:
Irvin, Renee & Carr, Patrick. (Forthcoming in Summer 2005). “The Emerging Role of Philanthropy in Local Government Finance.” Journal of Public Budgeting & Finance..
Irvin, Renee & Carr, Patrick. (2004, June). The Oregon Guide to Private Fund
Raising for Local Governments. League of Oregon Cities Public Service Report. Carr, Patrick. (2004, Winter). How Oregon Cities Are Coping with Budget Cuts.”
League of Oregon Cities Public Service Report. Carr, Patrick. (2004, Winter). Municipal Planning Fee Evaluation. League of Oregon
Cities Public Service Report.

vii
ACKNOWLEDGMENTS
I wish to express sincere appreciation to Professors Irvin, Stan, and Van Leuven for
their assistance in the preparation of this manuscript. Their guidance was crucial to my
conceptualization of a research problem that built upon the current literature. Thanks are
also due to Dr. David Boush and Dr. Bettina Cornwell for their comments as I first
contemplated the topic of cause related marketing. Fellow graduate student Kim Donovan’s
willingness to discuss shared thesis roadblocks and offer insight on how to address research
challenges was greatly appreciated and helped me better conceptualize the research question.
A fabulous work environment also strengthened my ability to complete this paper and
thanks are extended to everyone in the University of Oregon Graduate School. These
coworkers create a cheerful atmosphere each day in 125 Chapman Hall and I appreciated
their support as a progressed through the completion of this document. Lastly, I would like
to thank my family for their support and guidance throughout my life and especially, thank
my wife, Karen Ellis Carr, for her emotional support, analytical ability, editing prowess,
caring nature, and absolute love.

viii
TABLE OF CONTENTS
Chapter Page
I. INTRODUCTION ...................................................................................................................... 1
Cause Related Marketing........................................................................................................3 Alternatives to Cause Related Marketing............................................................................ 4 Nonprofit Sector Growth...................................................................................................... 7 Identity and Identification ...................................................................................................10 Research Question ................................................................................................................12
II. REVIEW OF LITERATURE ...............................................................................................13
Doing Well by Doing Good ...............................................................................................13 Corporate Public Statements...............................................................................................14 Increased Spending ...............................................................................................................15 Cause Related Marketing......................................................................................................16 Nonprofit Growth as a Provider of Charitable Goods .................................................18
Institutional Incentives for Action ...............................................................................19 Shifting Responsibility of Service Provision...............................................................20 Nonprofit Funding..........................................................................................................20
Why Not the Government? ................................................................................................22 Why Not the Business? .......................................................................................................23 Why Nonprofits?...................................................................................................................24
Efficiency and Efficacy...................................................................................................24 Corporate Perspective ..........................................................................................................27
Beneficial to Business?....................................................................................................27 Business Critical Perspective .........................................................................................28
Nonprofit Perspective ..........................................................................................................29 Beneficial to Nonprofits? ...............................................................................................29 Nonprofit Critical Perspective ......................................................................................31
III. RESEARCH QUESTION ....................................................................................................33
Identity and Identification ...................................................................................................33 Nonprofit-Consumer Identification ..................................................................................36 Branding Explained ..............................................................................................................37
Brand Equity.....................................................................................................................37 Nonprofit Branding ........................................................................................................38
Highly Identified Nonprofits ..............................................................................................39 Hypotheses Tested................................................................................................................40

ix
Chapter Page
IV. METHODOLOGY ................................................................................................................44
Sample Population ................................................................................................................44 Data Collection ......................................................................................................................45 Study Design ..........................................................................................................................47
Nonprofit Selection Protocol .......................................................................................47 For-profit Selection Protocol ........................................................................................48 Identification Measure ....................................................................................................49 Other Measures................................................................................................................50
Data Analysis..........................................................................................................................52
V. FINDINGS.................................................................................................................................57
Regression Models ................................................................................................................59 Nonprofit Identification and Support .........................................................................61 CRM Purchase Intent ....................................................................................................64 Nonprofit CRM Support Intent ..................................................................................66 Support Comparison.......................................................................................................68 Aspirational Identification .............................................................................................71 CSR Viewpoint.................................................................................................................73 Nonprofit Prestige...........................................................................................................75
Other Findings.......................................................................................................................75 Product Related Variables..............................................................................................77
Review of Hypotheses..........................................................................................................82 Review of Other Findings ...................................................................................................83
VI. SUMMARY AND IMPLICATIONS..................................................................................88
Supporters and Latent Supporters Approve ....................................................................90 Support Index...................................................................................................................91 Corporate Identification and Nonprofit-Corporate Fit ...........................................92 Aspirational Traits ...........................................................................................................93 CSR Views ........................................................................................................................93 Organizational Prestige...................................................................................................94 Nonprofit Identification.................................................................................................95
Implications and Recommendations for Nonprofits .....................................................96 Key Managerial Considerations ....................................................................................99
Implications and Recommendations for Businesses ....................................................106 Study Limitations.................................................................................................................113 Implications for Further Research ...................................................................................115

x
Chapter Page
APPENDIX
A. E-MAIL TEXT ........................................................................................................................117
B. SURVEY QUESTIONS ........................................................................................................118
C. FOLLOW UP E-MAIL TEXT .............................................................................................125
D. NONPROFIT BRANDING METHOD .........................................................................126
E. 501 (c)(3) DEFINITION .......................................................................................................127
F. SURVEY RESULTS ................................................................................................................128
BIBLIOGRAPHY ..............................................................................................................................138

xi
LIST OF FIGURES
Figure Page
1. Corporate Social Responsibility Continuum............................................................................ 6
2. Nonprofit Supporters Path to CRM Purchase Intent..........................................................96
3. Path to Nonprofit Commitment ............................................................................................101
4. Path to CRM Purchase Intent.................................................................................................110

xii
LIST OF TABLES
Table Page
1. Secondary Identification Measure ...........................................................................................50
2. Organizational Prestige Measure .............................................................................................51
3. CRM Support ..............................................................................................................................52
4. Support Index Questions .........................................................................................................55
5. CSR Viewpoint Questions ........................................................................................................56
6. Means, SD, and Correlations for Model Variables ...............................................................58
7. Least Squares Regression Model 1 Testing for Hypothesis 1.............................................60
8. Least Squares Regression Model 2 Testing for Hypothesis 1.............................................61
9. Least Squares Regression Model 1 Testing for Hypothesis 2 and 3..................................63
10. Least Squares Regression Model 2 Testing for Hypothesis 2 and 3 ...............................63
11. Least Squares Regression Model 1 Testing for Hypothesis 4...........................................65
12. Least Squares Regression Model 2 Testing for Hypothesis 4...........................................65
13. Least Squares Regression Model 1 Testing for Hypothesis 5...........................................67
14. Least Squares Regression Model 2 Testing for Hypothesis 5...........................................67
15. Least Squares Regression Model 3 Testing for Hypothesis 5...........................................68
16. Least Squares Regression Model 4 Testing for Hypothesis 5...........................................68
17. Least Squares Regression Model 1 Testing for Hypothesis 6...........................................70
18. Least Squares Regression Model 2 Testing for Hypothesis 6...........................................70
19. Least Squares Regression Model 1 Testing for Hypothesis 7...........................................72
20. Least Squares Regression Model 2 Testing for Hypothesis 7...........................................72
21. Least Squares Regression Model 1 Testing for Hypothesis 8...........................................74
22. Least Squares Regression Model 2 Testing for Hypothesis 8...........................................74
23. Brand Preference Influencers .................................................................................................78
24. Product Influencers Separated by Department...................................................................80
25. Summary of Hypotheses..........................................................................................................82
26. Corporate Identification Relationships Identified ..............................................................83
27. CRM Purchase Intent Relationships Identified...................................................................84
28. Nonprofit Identification Relationships Identified ..............................................................84

xiii
Table Page
29. Support Index Relationships Identified................................................................................85
30. Nonprofit Support Relationships Identified........................................................................85
31. CSR Opinion Relationships Identified..................................................................................86
32. Product Related Relationships Identified .............................................................................86
33. Nonprofit Identification ........................................................................................................105
34. Nonprofit Identification by Type of Cause .......................................................................106
35. Corporate Identification ........................................................................................................108

xiv
LIST OF GRAPHS
Graph Page
1. 2003 Contributions: $240 Billion Shown by Source of Contributions ............................10
2. Juice and Soda Product Preferences .......................................................................................77
3. Purchase Frequency ...................................................................................................................78
4. CSR Views and Nonprofit Support ........................................................................................94

1
CHAPTER I
INTRODUCTION
Over the past 100 years the role of corporate social responsibility in the business
sector has evolved in its definition, scope, and initiatives. Many historians credit reformers
such as progressive politician Theodore Roosevelt for introducing the public to corporate
social responsibility through government regulations intended to curb business abuses in the
1900s and 1910s (Whetten, Rands, Godfrey, 2002). Since this first round of public
safeguards was installed, the discussion of business’ role in society has maintained a presence
in public policy and legal circles, its place justified by Whetten, Rands, and Godfrey who
state, “Given the widespread evidence that market forces and moral persuasion are not
sufficient to curb the harmful externalities results from business leaders’ myopic focus on
short term earnings, government regulations and laws have been historically seen as a
necessary buffer between business and society.”
The issues at which these buffers have taken aim have changed over the years,
mirroring the demands placed upon legislators and the courts by special interest groups and
citizen demands. Thus, a diverse set of issues has each had its allotment of national
exposure, including prohibition, women’s suffrage, race relations, equality in the workforce,
environmental justice, cancer, and HIV/AIDS. Early in the 1900s voluntary associations, the
mass media, and the federal government were most often the primary stakeholders best
organized to address these societal issues. But, since WWII the lineup of primary

2
stakeholders has changed, as the private sector’s role in the average citizen’s everyday life has
expanded and companies have been increasingly called upon to address societal issues as a
primary stakeholder (Paisley, 2001). By adopting the role of primary stakeholder in
communities’ problems, businesses have become more engaged in societal issues, and
consequently corporate organizational processes have adjusted to meet these demands.
These changes have caused the focus of corporate organizational social performance to
adjust over time, changing from corporate philanthropy in the 1960s, to community
relations, social auditing, public affairs, advocacy advertising in the 1970s, to cause-related
marketing, strategic philanthropy, corporate governance in the 1980s, and most recently to
employee volunteerism, environmental audits, corporate ethics codes, diversity management,
whistle blower protection in the 1990s (Whetten, et al., 2002).
Information access via the internet about business activities has added to the legal
and policy pressures for increased corporate responsibility. The ease of accessing
information has also been a factor in increasing private sector engagement in public debates,
especially if a company’s products or services align with the societal issue gaining the most
press in the media discourse (Paisley, 2001). Examples of issues that are well covered in
blogs, online chats, and new stories include the pairings of wood product and mining
companies with the environmental movement, apparel companies with third world worker
rights, and alcohol manufacturers with drunk driving awareness. Contrary to forced
engagement is when businesses voluntarily align themselves with a societal issue that is
gaining significant media coverage, e.g. Yoplait’s long-term partnership with the Susan G.
Komen Foundation. Yoplait’s choice to align their brand with a nonprofit organization
which fights breast cancer has been a wise strategic business move, as it has mirrored the rise

3
of cancer as a societal issue during the 1990s, when it became the most common public issue
discussed in U.S. magazine articles, as 1% of all articles from 1991-1998 concerned cancer
(Paisley, 2001). Yoplait’s method of supporting breast cancer shows how companies address
a societal issue through cause related marketing (CRM).
Cause Related Marketing
Defined as the “the process of formulating and implementing marketing activities
that are characterized by an offer from the firm to contribute a specified amount to a
designated cause,” cause related marketing creates an exchange relationship between the
consumer and the business, “when customers engage in revenue providing exchanges that
satisfy organizational and individual objectives” (Varadarajan & Menon, 1988). This
exchange relationship provides explicit information of the donation made, allowing
consumers to donate in exchange for purchasing the company’s product. Varadarajan and
Menon were the first scholars to write extensively on the subject, but it was American
Express (Amex) who is often credited with initiating the first CRM program, in which Amex
made donations to local arts programs in San Francisco (Kelley, 1991; Smith, 1994). Because
of the success of the San Francisco program Amex took the promotion national in 1983
with the intention of raising money for the renovation of the Statue of Liberty in New York
City (Davidson, 1997). Not only did the promotion raise $1.7 million for the renovation, but
it also increased new cardholders by 45 percent and card usage by 28 percent during the
promotion (Varadarajan & Menon, 1988; Davidson, 1997; Ptacek & Salazar, 1997).
CRM programs are increasingly common for brands such as Yoplait who choose to
address societal issues through, as CRM has become a ubiquitous method for businesses to

4
support nonprofits. For businesses, cause related marketing programs (CRMs) are an ideal
method to give back to the communities in which they sell their products or services. Not
only do they provide a evaluation metric, the measurable change in sales (or lids redeemed
for Yoplait) during the cause related promotion, but they have also been shown to provide
corporate benefits including improved image, increased publicity, increased sales, and
improved employee morale (Barone, Miyazaki, & Taylor, 2000; Ptacek & Salazar, 1997).
Additionally, they provide a shield against shareholders critical of corporate philanthropy, as
they are a marketing tactic with a measurable outcome of increased sales (Conlin, Hempel,
Tanzer, & Polek, 2003; Andreasen, 1996). Because of these advantages CRMs have become
the most visible method of business engagement with social issues, but are not the only way
for businesses to support social causes.
Alternatives to Cause Related Marketing
Cause related marketing programs are just one of the many methods through which
businesses can engage in social causes. A continuum of alternatives identified by
Drumwright and Murphy demonstrate the many options available to businesses. They
include philanthropy, strategic philanthropy, sponsorships, company advertising with a social
dimension, cause-related marketing, licensing agreements, social alliances, corporate
volunteerism, strategic corporate volunteerism, and enterprises as possible methods
(Drumwright & Murphy, 2001). Kotler and Lee offer a more condensed list of options,
paring the list down to include cause promotions, cause-related marketing, corporate social

5
marketing, corporate philanthropy, community volunteering, and socially responsible
business practices as the six options available for business who wish to pursue social
engagement (Kotler & Lee, 2005).
At one end of this continuum of social engagement is philanthropy, which is purely
altruistic in nature but has become less common in the corporate sector since the 1980s
(Smith, 1994). At the other end is cause related marketing, which like all the methods has an
altruistic effect, but in practice includes tangible self-interest benefits for business. Figure 1.1
demonstrates this stratification as the six initiatives are organized by levels of altruism, with
cause related marketing serving as the most self interested method, as its use has proven to
be the most measurable increaser of sales for business. The table also shows where
businesses have increasingly focused their support of social causes, leaning toward the right
side of the continuum, as sponsorship and cause related marketing have become the most
common method for business engagement with social causes (Polonsky & Wood, 2001). As
Kotler and Less discuss in their book, cause related marketing and sponsorship are often
part of an integrated marketing campaign, thus most campaigns will have an aspect in each
of the six initiatives in their activation, but companies will not typically provide equal
resources for each initiative area and instead will focus resources on areas where the most
tangible benefit can be found, often coming in the form of cause related marketing.

6
Figure 1.1. Corporate Social Responsibility Continuum
Altruistic ←⎯⎯⎯⎯⎯⎯⎯⎯⎯⎯⎯⎯⎯⎯⎯⎯⎯⎯⎯⎯→ Self-Interested
Socially
Responsible
Business
Practices
Community
Volunteering
Corporate Philanthropy Corporate
Social
Marketing
Cause
Promotions
Cause
Related
Marketing
Source: Carr, Patrick (2005)
While sponsorship and cause related marketing are dominant in the marketplace,
some examples of philanthropy and strategic philanthropy are still visible, with the most
recent coming in the form of companies supporting Indian Ocean tsunami relief efforts.
Companies who have supported the tsunami relief effort could be part of the largest
corporate philanthropic mobilization ever, as estimated total donations from U.S. businesses
for tsunami aid are anticipated to reach $750 million, compared to the previous high of one-
time corporate giving of $682 million donated after the September 11th attacks (Cooperman,
2005). Much of the support has come from pharmaceutical companies, whose public image
has suffered in recent years over high drug prices and whose product is most needed in the
region impacted by the tsunami, prompting them to make in-kind and cash donations. While
these examples of corporate philanthropy exist, CRMs have also been initiated in response
to the tragedy, most prominently by Avon Product Inc. through their sales of Heart of Asia
pins (Cooperman, 2005).
Tsunami relief donated by U.S. companies may set a new record for corporate
giving, but the motives of businesses are admittedly not completely altruistic. Susan Arnot
Heaney of the Avon Foundation, the company’s charitable arm, demonstrates this point
7
when she states that the pins could have a “halo effect” on Avon’s image, but “that’s not
why the company is doing it, it’s just part of the Avon culture to do this, to give back to
society” (Cooperman, 2005). This insistence of corporate benevolence is not confined to
Avon representatives, as 7-Eleven, Starbucks, and Pfizer commented on their tsunami relief
donations by stating respectively, “there is no motive other than the fact that this is the right
thing to do,” “[w]e have always, since day one, given back to the community, it’s expected
that we do things like this,” “[p]hilanthropy is an integral part of our business model”
(Cooperman, 2005). These statements underscore why corporate philanthropy is placed in
the middle of the corporate social responsibility continuum of initiatives, as it has become
much more strategic than corporate philanthropy pre-1990s (Smith, 1994). While
corporations publicly state their support and commitment to social causes, history provides
evidence that the gifts to the tsunami relief efforts will be allocated from a static overall
corporate giving budget, as corporate giving levels have remained between 1.3 percent and
1.5 percent of pretax profits for the past twenty years (Cooperman, 2005). Thus, while
corporations wish to appear to be making philanthropic gifts which rise and fall with
community needs, a more predictable measure of giving is to monitor changes in corporate
profits.
Nonprofit Sector Growth
While corporate social responsibility initiatives have increased in recent years,
businesses do not typically provide charitable goods to the end user, a duty often fulfilled by
an intermediary. This intermediary role most often falls to organizations in the nonprofit
sector, which serve their constituents while working toward the fulfilling the mission of their
8
organization. This role in the U.S. has been enhanced in recent years as the sector has
expanded in scope and size, growing at a 37% rate since 1992 (ACT, 2004).
Many factors have contributed to the nonprofit sector’s growth, including its
increasing relevance in public policy debates (Salamon, 1999) and the percentage of the
sector characterized as religious organizations and entrepreneurial in nature, both which fit
with the current federal administration’s policies related to “faith based initiatives” and an
“ownership society” (McAteer, 2004; Dallek, 2004; Geewax, 2004). A more theoretical
reason for the nonprofit sector’s growth is related to evidence which indicates citizens will
voluntarily contribute to supplemental services when the minimum service level does not
meet their expectations (Weisbrod, 1977). For example, a citizen who wishes for their child
to participate in youth sports in community that does not have a youth sports program may
champion a program to the local government, or work with other parents to establish their
own organization. Lastly, the increasing distrust in government and the accompanying cuts
in government social services programs have shifted social burdens to the nonprofit sector,
trends not likely to shift given the impending retirement of the baby boomers and their need
for health care and social security (Brodhead, 2004; Bradley, Jansen, & Silverman, 2003).
This growth in the nonprofit sector as a provider of charitable services necessitates
that nonprofits match higher service level expectations with the necessary amount of
resources to address the issues with which they were chartered to address. While some
segments within the nonprofit sector have seen diminished funding over the past thirty
years, e.g. the arts (Salamon, 1999), many nonprofits have remained solvent despite increased
competition for donor allocations from other nonprofits and the recent recession (Conlin,
Tanzer, & Polek, 2004). If fact, as the nonprofit sector has grown into its role as a more

9
important provider of charitable services, funding is once again approaching its all-time high
of 2.3% of gross domestic product (GDP) reached in 2000, with donations in 2003 equaling
$240 billion, or 2.2% of GDP (Giving USA, 2004).
While overall funding to the nonprofit sector has increased, the sector’s fragmented
nature, the recent growth of the number of nonprofits, and the increasing competition from
private sector in areas such as hospitals, long-term care, and transportation have all
contributed to the need for nonprofits to diversify their revenue streams (Weisbrod, 1998).
As shown in graph 1.1, most contributions come from individual donors, with six percent,
or $13.46 billion received through corporate giving. This demonstrates the importance of
nonprofits maintaining fundraising strategies which focus on individual giving, especially
with the impending generational wealth transfer (The Economist, 2004), but also gives
credence to the importance of supplemental revenue which could be generated from
corporate giving. In addition, this does not account for the non-monetary benefits nonprofit
organizations can gain through interactions with nonprofits, e.g. increased volunteerism and
brand image enhancement (Lafferty, Goldsmith, & Hult; 2004; Wagner & Thompson, 1994;
Picker, 2001).

10
Graph 1.1. 2003 Contributions: $240 Billion Shown by Source of Contributions
11%
6%
FoundationsCorporationsBequestsIndividuals
9%
74%
Source: Giving USA (2004)
Identity and Identification
Given the prevalence and longevity of CRMs in the marketplace, understanding the
process through which they moderate consumer choice is important to both nonprofit and
corporate practitioners. A better understanding of the factors which influence consumer
choice in CRMs could help practitioners more clearly communicate points of importance
during the promotions, more effectively target consumers and potential donors which fit
each organization’s brand identity, and lead to partnerships between organizations with a
better fit in terms of image and target market. Current research in marketing related to
identity and identification may provide a method which to help better elucidate the process
through which consumers respond to CRMs, helping meet these goals.

11
Organizational identity and identification are basic concepts that have been long
discussed and analyzed in our society’s history. Identity is what is distinctive about an
organization or individual, while identification is the extent to which people incorporate key
organizational or individual identities in their own identity (Dutton, Dukerich, & Harquail,
1994). Organizational identification in the corporate context was first analyzed by Albert &
Whetten (1985) and Ashforth and Mael (1989) who discussed the importance of identity and
identification in terms of how individuals in organizations perceive themselves as members
of a group, organization, or the larger community (Ravasi & Rekom, 2003). Since Albert &
Whetten’s seminal article, identity and identification theories have been applied in other
business contexts, with scholars from management and marketing theorizing that real or
perceived sharing of common traits with an organization, identity overlap, heightens the
attractiveness or sense of self enhancement individuals receive from their association with
the organization (Ashforth, 1998; Bhattacharya, Rao, & Glynn, 1995; Elsbach, 1998; Sen &
Bhattacharya, 2001). The value of identification has been found in studies demonstrating the
positive relationship between individual’s identification with a sponsored nonprofit and their
intent to purchase a sponsor’s products or services (Cornwell & Coote, 2004). Additionally,
it has been theorized that CRM programs positively impact identity overlap when consumers
are presented with information about a company’s corporate social responsibility initiatives
(Sen & Bhattacharya, 2001).

12
Research Question
The fundamental question addressed in this study is whether nonprofit brands
behave in a similar manner as for-profit brands in terms of customer identification. This
basic question leads to more complex issues regarding the interaction of various factors
which influence individual’s intent to purchase from the corporate partner as well as intent
to provide additional support to the nonprofit partner. In this study it is assumed that
individuals will possess a more heightened sense of identification with the nonprofit partner
presented in the survey, as respondents were instructed to select a nonprofit for whom they
had either volunteered, or to whom they had donated in the past five years.

13
CHAPTER II
REVIEW OF LITERATURE
The following sections outline the significance of a study in cause related marketing
and how it will help bring new knowledge to the fields of public policy, nonprofit
management, and marketing.
Doing Well by Doing Good
Doing well by doing good is a frequently cited axiom used to describe businesses
which individually provide social benefits through their operations, or do so with a nonprofit
partner (Reinhardt, 2004; Wickenheiser, 2004; Johnson, 2004; O'Dwyer's, 2003). These
actions often come under the umbrella term of corporate social responsibility (CSR)
initiatives (Vernon, 2004; Henricks, 1991). In the United States CSR initiatives have evolved
over the past fifty years from a voluntary sense of corporate philanthropy to the currently
utilized mainstream practice of CSR as mutually beneficial partnerships (Porter & Kramer,
2002; Burlingame, 2001; Mullen, 1997; Varadarajan & Menon, 1988).
This change is credited by many as a corporate response to rising consumer
perceptions defining community involvement on a wider scale (MacMillan, 2003; Quinn,
2000; Mullen, 1997; Benezra, 1996; Scott, 1995; Smith, 1994). A recent GolinHarris poll
conducted on the state of corporate responsibility corroborated these assertions, showing
that 52% of respondents were inclined to start or increase their business with companies due

14
to their corporate citizenship (GolinHarris, 2004). The GolinHarris report followed a 2002
Cone/Roper report which indicated 91% of consumers would consider switching products
or services if negative publicity surfaced about the company in question (Cone/Roper,
2002). Eighty-nine percent of respondents in this study also stated it was more important
than ever for businesses to be socially responsible, especially in the wake of the Enron and
Worldcom scandals (Cone/Roper, 2002). The Enron, Tyco, Health South, and Worldcom
scandals have also been suggested as reasons for the increasing number of societal issues
which are discussed in board rooms, such as compliance with the Sarbanes-Oxley Act, (The
Economist, 2004; Bloomenthal, 2002), as well as a motive for changing business school
curriculum, such as the Kellogg School of Business at Northwestern University’s inclusion
of a major in Business and its Social Environment, focused around the concept of “doing
well by doing good” (Kellogg, 2002).
Corporate Public Statements
Chief executive officers of major U.S. companies have also taken notice and some
have voiced their opinions in favor of business involvement in social issues. Hasbro
Chairman Alan Hassenfeld provided a statement which crystallizes how some companies
have reacted to questions of businesses’ responsibility in regards to social issues. Responding
to a question about whether conservative economist Milton Friedman was correct in his
belief about not giving away shareholders’ money Hassenfeld stated, “I don't know if he ever
understood the dynamics of a global company on a global basis. Also, our reputation is one
of a company with a heart. We care” (Hempel & Gard, 2004). William Perez, the CEO
replacing longtime Nike founder and CEO Phil Knight, followed a similar path by

15
responding to a question about his stance on community involvement during his tenure with
S.C. Johnson & Son Inc. by stating, “I know business people are often reluctant to get
involved and yes, from my own experience, I admit you will get the occasional raised
eyebrow, the questioning of a business person’s motives for getting involved. But don’t let
that stop you. You’re a member of this community. You have an obligation to take
responsibility for its future (Pulaski, 2004).” Jeffrey Swartz, president and CEO of The
Timberland Company, also commented on the relationship between business and
community by stating, “We believe that companies have the power and the responsibility to
effect positive and lasting change in the world. When you layer in community organizations
and individuals who share this passion, the vision for what we can achieve together is
limitless” (Kotler & Lee, 2005). Besides public statements made by CEOs, corporations are
also increasing their annual reporting on corporate responsibility, as in 2002 45% of the
Global Fortune Top 250 companies issued environmental, social, or sustainability reports,
compared with 35% in the same survey conducted three years earlier (Kotler & Lee, 2005).
Increased Spending
In addition to public statements, companies have also increased spending to promote
the idea of their firms being socially responsible. This is evidenced by an expected 7.5%
increase from the previous year in worldwide cause related sponsorship spending to $991
million in 2004 (Levy, 2004). While cause sponsorship still only accounts for 9% of the $28
billion expected to be spent on sponsorship rights worldwide in 2004, it is viewed as being
markedly different in the market, because as William Chipps, a senior editor with the IEG
Sponsorship Report states, “it really connects companies on an emotional level to a
16
consumer” (Brand Strategy Briefing, 2004; Levy, 2004). From the partnering company’s
standpoint cause marketing promotions, “create the impression among consumers that
you’re really a terrific store” as stated by Curt Weeden, President of the Contributions
Academy, a training organization for corporate giving officials, when asked about Home
Depot’s partnership with National Wildlife Federation (Schwinn, 2003).
While cause related activities have become more prevalent, they have also trended
toward “smart giving” or strategic philanthropy, which is meant to benefit the company’s
financial standing as well as provide resources for social causes (Porter & Kramer, 2002;
Mullen, 1997; Andreasen, 1996, Smith, 1994). This movement toward a bottom line
approach of performance measurement for corporate responsibility also favors expenditures
in CRMs versus corporate giving or sponsorship, as these programs can be evaluated in
terms of sales generated directly from the promotion. A recent business week survey
examined this trend and found that all but four of the 218 S&P 500 companies interviewed
agreed they have a social responsibility, but the majority indicated in practice it comes in a
way which merges charity with the needs of the corporation (Conlin et al., 2003).
Cause Related Marketing
CRMs differ from sponsorships primarily due to their overt presentation of a
business donation when an individual purchases a product, versus a sponsorship’s purpose
of providing access to consumer’s attention while the customer attends or views the
sponsored event. These differences are evident in their formal definitions, as CRM is defined
as “the process of formulating and implementing marketing activities that are characterized
by an offer from the firm to contribute a specified amount to a designated cause when
17
customers engage in revenue providing exchanges that satisfy organizational and individual
objectives” (Varadarajan & Menon, 1988). Compared to CRMs sponsorships are more
indirect in their influencing tactic and are defined as “an investment, in cash or in kind, in an
activity, in return for access to the exploitable commercial potential associated with that
activity” (Meenaghan, 1991).
The use and frequency of CRMs have grown significantly since Varadarajan and
Menon’s seminal paper on the subject, as CRMs are now ubiquitous in consumer product
marketing. This is especially true during the month of October when National Breast Cancer
Awareness month helps transform the symbol of a pink ribbon into products for sale on
store shelves. Breast Cancer Awareness promotions, in particular those put forth by Susan
G. Komen Foundation’s and their corporate partners, cover a wide swathe and include
promotions for online video game tournaments, hotel stays, and video rentals
(WorldWinner, 2004; Wyndham, 2004; Blockbuster, 2004).
While some agreements such as Susan G. Komen Foudations’s are cause specific, a
generational trend has been postulated that today’s young people have, compared to
previous generations, been predisposed to elevated amounts of community service during
their adolescence, leaving them more inclined to support businesses which give to the
community (Gard, 2004). Support for this assumption is based on a survey conducted by a
youth marketing firm showing that 60% of teenagers surveyed said they are more likely to
buy brands that support charitable causes (Alloy, 2001). While anecdotal in terms of causal
evidence, the notion that young people have had more exposure to nonprofits has strong
prima facie evidence, as in 1992 the number of exempt organizations in the U.S. was just
under 1.2 million, but by 2004 it was 1,640,949, with 964,418 of these granted 501(c)(3)

18
status as either public charities or private foundations (ACT, 2004). 501(c)(3) status is
formally defined in the appendix. Thus, while the population in the U.S. has grown 16%
from 253 million in 1992 to 295 million in 2004, the number of exempt organizations has
increased by 37% during the same time period (US Census, 2004). This trend supports the
assumption that someone who is 26 years old in 2004 was more likely to have interaction
with nonprofits between ages 14 and 26 (1992-2004) than a 48-year old between ages 14 and
26 (1962-1974).
Nonprofit Growth as a Provider of Charitable Goods
The following section outlines the rise of the nonprofit sector as a provider of
charitable goods in the U.S. Discussion will cover the aspects which have increased the role
and size of the nonprofit sector, the environmental factors which favor its continuing
importance and why the sector is uniquely positioned to provide social services in
comparison to the for-profit and government sectors.
There are many factors which have contributed to the nonprofit sector’s growth as a
provider of charitable goods. First, the nonprofit sector’s impact on policy and the provision
of charitable goods continues to rise, increasing the sector’s relevancy in public policy
debates (Salamon, 1999). Because the nonprofit sector is often cited as a correction
mechanism for market and government failure, nonprofit organizations continue to prosper
due to their flexibility and responsiveness to citizen needs (Salamon, 1999). As John Stuart
Mill wrote, “Government operations tend to be everywhere alike. With individuals and
voluntary associations, on the contrary, there are varied experiments, and endless diversity of
experience (Mill, 1912).” Second, nonprofit organizations’ perception as entrepreneurial
19
entities and the importance of religious organizations in the nonprofit sector, accounting for
62% of donations according to Indiana University's Center on Philanthropy Panel Study
(The Economist, 2004), mesh with the current federal administration’s policies related to an
“ownership society” and “faith based initiatives” (McAteer, 2004; Dallek, 2004; Geewax,
2004). Both of these policies are controversial and have their critics (Spitzer, 2004; Belcher,
Fandetti, & Cole, 2004), but given the balance of power in the federal government they are
likely to be enacted in further detail during President Bush’s second term in office (Walsh,
2004).
Institutional Incentives for Action
Third, for those social services outside “faith based” definitions there are
institutional factors which provide for maintenance of all causes valued by citizens. In
general, donors will voluntarily provide a supplement to the government provision when
they recognize a mismatch between their view of charitable service provision and the median
voter level of government provision of services (Weisbrod, 1977). That is, when citizens
have different preferences for the public good, some will be dissatisfied due to their
perceived view of an under-provision of the good. Thus, if this group of dissatisfied citizens
has sufficient financial capacity to address the perceived social concerns, nonprofit
organizations will have access to capital and the ability to provide services.

20
Shifting Responsibility of Service Provision
Fourth, the United States has a recent history of increasing distrust in government,
symbolized by Ronald Reagan’s quote on his inauguration day that “government is not the
solution to our problem; government is the problem” (Reagan, 1981). Reagan’s fight against
big government helped signal in an era of increasing distrust in government, which has been
accompanied by the increasing role of the nonprofit sector, the apparent “beneficiary” of
these trends (Brodhead, 2004). Fifth, Reagan’s leadership also prompted accompanying cuts
in government spending, helping to shift social burdens to nonprofits, a trend not likely to
change with the impending retirement of the baby boomers which will further constrain
government as they attempt to provide larger resources to health care and social security
(Bradley et al., 2003). In addition, the current federal administration’s policies are likely to
mirror the approach followed during Reagan’s tenure, further solidifying this trend. Thus,
given these five conditions, it is probable the nonprofit sector will continue to increase its
role as charitable good providers.
Nonprofit Funding
Another factor which supports the maintenance of a healthy nonprofit sector is a
stable funding source. While some service areas in the nonprofit sector have seen funding
levels decrease over the past thirty years, e.g. the arts (Salamon, 1999), many have maintained
funding in the face of federal cuts, despite increasing competition from other nonprofits and
the recent recession (Conlin et al., 2004). Many of these same organizations have actively
positioned themselves as the beneficiary of the current generational distribution of

21
wealth (Havens & Schervish, 2003; Wolff, 1999). This generational transfer of wealth is
expected to be the largest in history, estimated to occur between 1998 and 2052, falling
somewhere between $41 trillion and $136 trillion (The Economist, 2004).
Additionally, because nonprofit organizations have faced funding challenges due to
the recent economic downturn in the U.S., many have had to find alternative streams of
revenue, and consequently proactive groups are now well diversified in their revenue sources
and more stable financially. Unrelated business income is an example of an alternative source
of revenue that Eugene, Oregon, based St. Vincent de Paul has leveraged extensively and
now serves as an example for many nonprofits. St. Vincent de Paul of Lane County, for
example, generates revenue from affordable housing projects, reselling of used furniture and
clothes, selling refurbished products, and reselling donated cars (St. Vincent de Paul, 2004).
As a result of these projects, their 2003 annual revenue was $11,825,582, of which 37% was
accounted for by entrepreneurial ventures (GuideStar, 2004). Interestingly, St. Vincent de
Paul seems to have been created with the intent of leveraging alternative sources of revenue,
as their mission statement states a purpose of assisting “the poor and those in need of
consolation, seeking out and utilizing any resource” (St. Vincent de Paul, 2004).
Finally, individual donor incentives to give, such as “impure altruism,” the
experience of a “warm glow” as a part of the giving experience (Andreoni, 1989; Andreoni,
1990), and the influence of social recognition associated with giving (Harbaugh, 1998),
provide evidence that funding by individual donors will continue. These two examples
demonstrate the exchange relationship integrated into the donation process, as donors are
rewarded for their donations through tangible and intangible benefits.

22
Why Not the Government?
In addition to reasons demonstrating why the nonprofit sector will continue to
attract funding from donors, enabling its role as a provider of charitable goods, reasons exist
indicating why nonprofit organizations are more effective in delivering charitable goods than
government. First, because there is increased homogeneity of citizen preferences at the local
level (Tiebout, 1956), and because nonprofits are generally smaller in size than governmental
organizations, they should be able to adapt more quickly to local needs than state or federal
government programs. Contributing to this is a tendency of state and federal governments to
serve citizens with a singular provision protocol, often spread over many diverse
communities. This does not allow state and federal governments to operationalize adaptation
to client needs across diverse and spatially distributed populations. Additionally,
governments are further handicapped because they often lack information about consumer
demands and because their decision makers face incorrect incentives when attempting to
correct the private market’s failure (Weisbrod, 1977).
Lastly, historical factors favor the nonprofit sector maintaining relevance in the U.S.
Because communities formed before governments in the U.S., citizens who desired public
goods organized voluntary organizations such as schools and fire departments (Salamon,
1999). These citizens chose to organize these associations as voluntary and community based
entities, as they were fearful of a recently defeated monarchy and thus had an aversion to the
formation of governments (Salamon, 1999). As governments were eventually organized the
delivery of many of these services was usurped by these emerging governments, but the

23
reluctance related to the return of a monarchy contributed to the remaining presence of
voluntary organizations, which continued to deliver many services which were traditionally
delivered by the government in other countries.
Why Not Business?
If nonprofits are preferable to government for provision of charitable goods, what
about for-profit companies? They are entrepreneurial by nature, efficient by necessity, and
responsive to customer needs, all seemingly important characteristics for an organization
serving the public. But, there are reasons why the nonprofit form of organization is
preferable to for-profits for the provision of charitable goods. First, where monitoring of the
goods’ provision is incomplete, nonprofit managers have less opportunity to circumvent the
contract and channel the donated funds into distributed profits (Fama & Jensen, 1983;
Hansmann, 1980).
Second, business’ primary objective is to maintain profits, and their performance is
easily judged through their financial statements. In contrast, nonprofits are mission based,
meaning their performance measurements are grounded in meeting non-financial goals.
Thus, the first responsibility of a nonprofit is its mission, while the first responsibility for a
business is its profits. This clear demarcation demonstrates why nonprofit organizations
have more incentive to provide the best possible services to their clients, avoiding the
“skimming of the cream” tendency of for-profits operating in social service markets. Lastly,
because nonprofits do not exist principally to earn profits, consumers who are subject to
contract failure, or information asymmetry, will seek a service provider they can trust
(Hansmann, 1980). For example, consider the situation donors encounter when selecting an

24
overseas aid organization. The choice of the overseas aid organization is difficult because
they do not directly receive the services, or are even able to witness the benefits felt as a
result of their donations. Because nonprofit organizations are not subject to competitive
incentives, which could incent misappropriation of the donor’s funds, the donor is likely to
feel more comfortable donating to a nonprofit organization operating overseas relief efforts.
Given this set of circumstances nonprofits are often the preferred providers because they are
not subject to the same competitive incentives as businesses (Salamon, 1999).
Why Nonprofits?
Therefore, the nonprofit sector is likely to maintain its importance as a provider of
charitable goods because of three factors. First, it has institutional advantages related to
changes in environmental factors and generational trends. Second, these environmental
factors and generational trends contribute to the nonprofit sector’s increased financial
stability. Third, the nonprofit sector has advantages over both the government and business
sectors as a social service provider.
Efficiency and Efficacy
These factors in turn require the nonprofit sector improve its efficiency and efficacy
standards in order to provide the most social services possible. Some estimates of potential
operational efficiency gains in the nonprofit sector have reached $100 billion dollars (Bradley
et al., 2003), contributing to the debate of how to best address efficiency challenges. Bradley
et al. suggest an increase of a more businesslike approach to management of nonprofits, but
this co-mingled approach to management philosophy can also lead to challenges. The

25
challenges of integrating business and nonprofit orientations lead to competing incentives.
Portland State nonprofit management professor Linda Golaszewski discussed this point
while reflecting on the increasing pressure for nonprofits to take a more businesslike
approach. She stated, “You can expect a nonprofit to be run well, but once we expect
nonprofits to be run like businesses, what's to stop them from acting like the Enrons of the
world?" (O’Malley, 2004).
While concerns exist about the merging of business and nonprofit practices, some of
the efficiency gains called for in Bradley’s article could be generated simply by siphoning off
a small percentage of the impending generational transfer of wealth into the nonprofit sector
(The Economist, 2004). If benefactor restrictions associated with these donations were
flexible, the increased capacity provided by this funding could allow organizations to expand
their services, and improving their economies of scale, which should contribute to enhanced
service efficiency. But, the transfer of wealth to the nonprofit sector is not a guarantee.
Thus, other efficiency initiatives should be undertaken.
Drawing from other successful collaborative relationships between organizations,
social alliances provide the opportunity for synergy to emerge between the sectors and in the
process improve efficiencies (Berger, Cunningham, & Drumwright, 2004). CRMs provide
one of the best opportunities for social alliances to form, as businesses have trended toward
this type of partnership recently and nonprofits will continue to need to maintain a
diversification of revenue streams for stability in funding. This places a high level of
importance on the comprehension of how CRMs impact a consumer’s decision to purchase
products, as success at this level of partnership could motivate the furthering of a
partnership to the collaborative stage, in which social alliances form (Austin, 2000). Thus, if

26
a nonprofit organization is more aware of how to leverage their intangible assets in a CRM,
they can improve partnership performance in the form of increased revenue for both
partners, increasing the possibility of moving up the collaborative ladder with the for-profit
partner.
The collaborative ladder is outlined by Austin to include three stages of cross sector
relationships, (1) philanthropic, (2) transactional, and (3) collaborative (Austin, 2000).
Nonprofits aspire to rise from philanthropic to the transactional stage primarily for financial
incentives, as marketing budgets are much larger than community relations and include the
added incentive of “free” promotion for their organization through the marketing
promotion. As Samantha Conlan of Wildlife Conservation Society in New York City states,
“The benefit is greater when the dollars come from the marketing side. When we get a
$200,000 gift, the donor might not want to hear about it again. But if it’s a $200,000
sponsorship, they might put another $200,000 into the marketplace for promotions,
advertising and bringing other partners to the table” (IEG, 2004). Movement from
transactional to collaborative stages occurs when “the partners’ missions, people, and
activities begin to experience more collective action and organizational integration” (Austin,
2000).
Austin admits that the collaborative stage has been reached by very few nonprofits
or companies, but those who have are gaining significant benefits (Austin, 2000). Thus, while
the collaborative stage seems to be the ideal destination for a nonprofit, the process is
iterative, requiring organizations to follow the sports axiom of “winning one game at a time”
by initially focusing on successful donations and transactional partnerships. Additionally, as
Austin discussed, very few nonprofits have reached the collaborative stage and consequently

27
most nonprofits will continue to engage in donation and transactional relationships with
businesses as their primary interactions. Thus, understanding how consumers interpret
partnerships in the transactional stage, e.g. CRMs, is valuable to nonprofits because this
knowledge can help improve the implementation of these programs. With improved
implementation of CRMs a nonprofit can better position their organization for a
collaborative relationship.
Corporate Perspective
The growth of CRMs has led to numerous studies which examine the effect of
partnerships on consumers’ beliefs about partnered companies and their products (Irwin,
Lachowetz, Cornwell, & Clark, 2003; Yechiam, Barron, Erev, & Erez, 2002; Madrigal, 2000;
Barone et al., 2000; Berger, Cunningham, & Kozinets, 1999; Brown & Dacin, 1997; Ross,
Patterson, & Stutts, 1992). Each of these studies examined the effect of partnerships in the
minds of consumers, analyzing elements of the agreements and the benefits companies glean
from them. The following section will discuss the results of these and other studies,
describing their relevance to corporate and nonprofit concerns.
Beneficial to Business?
Research has shown that well-constructed CRM programs provide many benefits for
businesses. For example, Yoplait’s Save Lids to Save Lives campaign with the Susan G.
Komen Foundation had the best response rate of any General Mills consumer promotion in
2004, even higher than those which offered direct benefits, e.g. prizes, to customers (IEG,
2004). General Mills believes the association is such a strong brand asset that they now plan

28
to use the cause’s logo on lids year round (IEG, 2004). Research has also been cited showing
that CRMs have increased the redemption rates of cents off coupons tied to charities (Irwin
et al., 2003) and have helped improve attitudes toward partnered companies (Berger et al.,
1999; Ross et al., 1992). CRMs have also been shown to improve attitudes about partnered
companies’ products (Yechiam et al., 2002; Berger et al., 1999) as well as positively impact
beliefs and purchase intentions toward the partnered business (Irwin et al., 2003).
In addition to the consumer perspective, research on CRMs has been shown to
benefit employee pride (Cone/Roper, 2002), improve sales force relations (Rigney &
Steenhuysen, 1991), improve job attractiveness (Conlin et al., 2004), and help break through
advertising clutter (Oldenburg, 1992). CRMs are also believed to help companies better meet
public expectations, as the approach is viewed as more trustworthy and relevant to society
(Duncan & Moriarty, 1997). As these studies demonstrate, CRMs can be powerful marketing
tools that can positively impact a company’s reputation, providing differentiation in the
marketplace and a competitive advantage over companies in the same business category
(Bronn & Vrioni, 2001).
Business Critical Perspective
While the benefits of CRM to business are widely cited, varying from employee
retention to increased sales, the involvement of corporations with causes has its critics. One
of the most influential critics, the economist Milton Friedman wrote in a 1970 New York
Times Magazine article that the only “social responsibility of business” is to “increase its
profits (Friedman, 1970).” Friedman wrote separately that any deviation from making, “as
much money for their stockholders as possible” is a trend that could “undermine the very

29
foundation of our free society” (Friedman, 1962). In regards to philanthropy he stated, “If
the corporation makes a contribution, it prevents the individual stockholder from himself
deciding how he should dispose of his funds” (Freidman, 1962). Thus, Friedman contends
that corporate philanthropy is not a proper use of corporate funds and any profits generated
should be dispersed by individual stockholder choice, not the corporate executive decision.
Interestingly, CRM is likely an acceptable use of corporate funds from Friedman’s
perspective, as CRM expenditures are typically viewed as a marketing tactic and funds for
these promotions are allocated from marketing budgets (Conlin et al., 2003; Andreasen,
1996).
Nonprofit Perspective
As previously mentioned, nonprofit organizations are increasingly being called on to
provide charitable services while concurrently adjusting to changes in funding and increased
competition from a growing number of competing nonprofits. These factors have prompted
many nonprofit organizations to examine their revenue platform and investigate the possible
benefits of innovative corporate partnerships. The following sections describe the potential
benefits and costs often discovered when a nonprofit investigates these relationships.
Beneficial to Nonprofits?
From a nonprofit organization perspective, corporate support through CSR activities
is valuable if the nonprofit can leverage for-profit business’ ability to promote its cause to a
wider audience (Henricks, 1991) and help reach a previously unsolicited donor base through
a wider product distribution base. Other valued contributions include supplemental revenue

30
through CRM generated income, and improved stature and credibility with other funders,
diversify revenue sources (Wagner & Thompson, 1994). Lastly, CRM programs can lead to
non-cash benefits such as volunteers and board member recruitment (Picker, 2001; Wagner
& Thompson, 1994), and provide a measurable positive third party effect for nonprofit
partners in the form of consumers’ increased likelihood to donate to the cause, post CRM
exposure (Lichtenstein, Drumwright, & Braig, 2004).
In addition to the short term benefits of a CRM promotion, these partnerships can
lead to longer term benefits of “cause branding,” for which the purpose is to create a
stronger association in consumers’ and employees’ minds between the brand and the cause
(Burlingame, 2001). An example of this type of alliance is Timberland’s long-term
partnership with City Year, a youth service corps that works with disadvantaged urban youth
(Lichtenstein et al., 2004). Davidson views these long-term extensions of CRMs as cause-
brand alliances, whose objective is to form a deeper bond with the customer (Davidson,
1997). Evaluation of these relationships has shown attitudes toward both partners can be
enhanced as a consequence of the alliance, contingent upon favorable consumer perception
of the alliance (Lafferty et al., 2004). Interestingly this study also showed that while both
organizations benefited in terms of a more positive assessment of the organizations
following the CRM, it was the nonprofit partner who benefited to a greater extent than the
company brand, as their favorability rating increased more than the company’s brand
(Lafferty et al., 2004).

31
Nonprofit Critical Perspective
While CRMs have proven beneficial on many levels, these agreements can also be
controversial and have been criticized by organizations such as Breast Cancer Action in their
Think Before You Pink campaign for hypocrisy, obscurity in advertising message, and for
unstructured funding allocation by corporate partners (Breast Cancer Action, 2004; Alameda
Times-Star, 2004). One of these assertions has been validated by research showing that
regardless of educational background, consumers are likely to overestimate the amount they
are donating by purchasing CRM products (Olsen, Pracejus, & Brown, 2003).
In addition to the potential negative public relations, the percentage of total giving
that businesses provide gives nonprofits reason to proceed carefully when investigating
CRMs. While the proven benefits of business partnerships can be valuable for charities,
business donations still provide only a fraction of the total giving in the United States. For
example, in 2003 private individuals accounted for 83.5% of giving in the U.S., while
corporations contributed 5.6%, and foundations 10.9% (Giving USA, 2004). Compared to
seven years earlier, these percentages have shifted only slightly, less than 1% for each
category, but total private giving has grown from $138.9 billion in 1996 (Salamon, 1999) to
$240.8 billion in 2003 (Giving USA, 2004).
An example is provided by the Susan G. Komen Foundation, an organization well
known nationwide for CRM programs and which derived 43% of their 2002-2003 total
revenue from corporate support in the form of sponsorships (Komen, 2004). The Susan G.
Komen categorizes their 62 CRM programs which are promoted in the month of October as
corporate contributions separate from Race for the Cure sponsorships. In 2002-2003 these
CRMs contributed $6.4 million, or 5% of total revenue (Komen, 2004). Therefore, while

32
CRM programs can be beneficial to nonprofits in both financial and non-financial terms,
their priority in the hierarchy of fundraising should always match the percentage of
donations derived from these agreements.

33
CHAPTER III
RESEARCH QUESTION
While CRM has been studied extensively in the academic literature and is now
prompting seminars on how to best manage partnerships (Orange County AMA, 2004),
many aspects of CRM programs remain unexplored (Irwin et al., 2003). Therefore, in a quest
to add to the knowledge already possessed about CRM, the question addressed in this study
is;
Do nonprofit brands behave in a similar manner as for-profit brands in terms of
customer identification with the brand?
Identity and Identification
As previously noted in chapter one organizational identity and identification are still
evolving concepts that stem from various academic disciplines and have been increasingly
tested in areas such as marketing (Ravasi & Rekom, 2003). The outgrowth of the currently
utilized theory can be linked back to the work of philosophers such as Socrates, Plato, and
Aristotle, who asked questions about the individual and what defined us (Gioia, 1998). These
philosophers provided a foundation for modern academics, including sociologists, social
scientists, and psychologists, who worked through the early part of century to frame the
concept of personal identity (Gioia, 1998). This work has helped better organize the concept

34
of identity, leading to Tajfel and Turner to conclude that identity is fundamentally a
relational and comparative concept, generated from social interactions with our environment
(Tajfel & Turner, 1985). They state that identity is connected most closely to social group
self reference, perceived or real, which guides individual identification in social terms,
primarily through relational and comparative group comparisons (Tajfel & Turner, 1985).
For example, a teacher at a high school and whose students excel academically and who
primarily continue on to college could find much of their identity in the comparisons with a
school located close by, or one whose students excel at a similar rate.
Taijfel and Turner also point out that identity direction, positive or negative, is often
framed by the comparison group one uses, with higher esteem generated by comparisons to
groups who do not excel at similar rates of the comparison metrics used (Tajfel & Turner,
1985). The essential point from this body of research is that identity is what makes a person
a person (Gioia, 1998). While theories and conversations about identity originally focused
the individual, “Who am I?”, researchers have gradually evolved its use to include groups
and organizations. The first corporate application is linked to the seminal articles of Albert
and Whetten (1985) and Ashforth and Mael (1989). These authors described the importance
of identity and identification in terms of how individuals in organizations perceive
themselves as members of a group, organization, or the larger community (Ravasi & Rekom,
2003).
Identity and identification are unique but related concepts, with identity defined as
what is central, distinctive, and enduring about an organization (Albert & Whetten, 1985)
and identification defined as the extent to which members of an organization incorporate
key organizational identities into their identity (Dutton et al., 1994). Albert & Whetten’s
35
reframing of identity recently underwent another evolution as scholars in marketing have
started to utilize identity and identification as measurement of consumer motivation to
purchase products (Bhattacharya & Sen 2003; Sen & Bhattacharya 2001). These authors
theorize that individuals identify with organizations through common traits, or the
perception of common traits, heightening their attractiveness and the sense of self-
enhancement they receive from their association with the organization. (Ashforth 1998;
Bhattacharya, Rao, & Glynn 1995; Elsbach 1998; Sen & Bhattacharya 2001).
Lichtenstein et al. article outlines a theory of self conceptualization through
corporate identity, which relates to consumer-corporate identification, or the overlap
between individuals self concept and his or her perception of the corporation (Dutton et al.,
1994), This is important in CRM studies as research has shown that corporate social
responsibility initiatives positively influence corporate identification of consumers, as
consumers find additional points of overlap with their definitions of personal and corporate
values (Sen & Bhattacharya, 2001). Lichtenstein’s study analyzed the third party effect
experienced by the nonprofit partner in terms of the consumer’s likelihood to donate and
how a positive identification with the for-profit partner increased the likelihood of donating
to the nonprofit (Lichtenstein et al., 2004). Their study theorizes and provides support that,
“corporate social responsibility induced consumer-corporate identification leads not only to
customer support for the corporation but also to increased support for the nonprofits that
the corporation supports” (Lichtenstein et al., 2004).

36
Nonprofit-Consumer Identification
While these findings are valuable from a nonprofit perspective, potentially increasing
leverage when negotiating CRMs, their study does not acknowledge the direct nonprofit-
consumer identification which may occur as a result of CRMs. Instead it analyzes consumer-
corporate identification by a consumer, with the nonprofit partner as an ancillary piece
which improves the consumer’s perceived overlap of common traits with the nonprofit
partner, as they attribute the nonprofit traits to the corporation (Lichtenstein et al., 2004).
This method assumes consumers have stronger ties, or that more points of identity overlap,
with corporations than they do with the corporation’s partner, the nonprofit.
Intuitively the belief that corporations would have more points of identity overlap
with consumers makes sense because corporations have greater exposure to individuals
through mass media outlets, and with increased exposure consumers have been shown to
engender positive affect toward the corporation they are exposed to (Zajonc, 1968). What
this assumption does not account for are individuals with high nonprofit identification and
whose loyalty to the nonprofit brand overrides other loyalties, e.g. the company brand. Thus,
a consumer who either donates to or volunteers for a nonprofit may have more identity
overlap with the nonprofit partner, so much that the affect transfer or “rub off” effect
marketers seek with CRMs does not happen. This may be especially true with less well-
established brands who partner with well-established nonprofit brands. For example, if
American Cancer Society partnered with a pasta manufacturer for a CRM program it seems

37
logical that the primarily association consumers would make would be with American
Cancer Society. This phenomenon would seem to also be exacerbated in commodity type
markets such as packaged consumer goods like pasta.
Branding Explained
The concept of branding is an often utilized term in marketing, thus before
additional examination of the example of an individual highly identified with a nonprofit, it
is important to have a conceptualization of branding and its application in the for-profit and
nonprofit sectors. The term brand is the name and symbol that gives an identity to a
product, service or company, positioning it in the consumers’ eyes against competing
products, services, and companies and is commonly used in a way to describe a company’s
image. Brands derive meaning from bits of information which are held in individual’s minds
and these bits are referred to as brand associations (Madrigal, Bee, & LaBarge, 2004). These
bits of information can be both product and non-product related attributes and contribute to
overall evaluation or attitude about the brand, commonly referred to as the brand’s image
(Keller, 1993). While brand image is the set of external associations, brand identity is internal
set of associations a company intends to produce with its marketing activities (Aaker, 1996).
Brand Equity
It is through these activities that marketers of products and services attempt to create
favorable images for their company and gain what is termed brand equity, which equals
brand assets, e.g. customer awareness and loyalty, reputation for quality, market leadership,
minus brand liabilities, e.g. environmental problems, lawsuits, product/service failures,

38
complaints. Brand equity is often discussed in business studies and mainstream media now
uses it as a comparison measure for companies, leading to the introduction of a Business
Week annual brand rankings, which ranked Coca-Cola as the most valuable brand in 2003
and 2004, valued at approximately $667 billion (Business Week, 2004).
A positive valuation becomes important when consumers infer the quality of a
product based on the brand equity the company possesses. This equity transfer in the
consumer’s mind occurs when the associations to the brand, the primary and secondary bits
of information consumers possess (e.g. celebrity endorsers, country of origin, price,
experience with product, etc.) help determine whether or not to purchase a product or
service. It has been shown that when the motivation or ability to process brand information
is low, consumers will increasingly base their purchase decision on the secondary bits of
information, celebrity endorsers, country of origin, etc instead of primary bits of
information, such as previous experiences with the product or service (Madrigal et al., 2004).
This is especially applicable for goods that are easily substitutable, e.g. Pepsi vs. Coke,
Albertson’s vs. Safeway, as consumers’ have less motivation to exert themselves cognitively
due to the regularity of the purchase decision made, e.g. the weekly trip to the grocery store,
and the limited financial expenditure each option requires, e.g. buying a cola for one dollar.
Nonprofit Branding
While nonprofit branding is currently not as mainstream as for-profit brand
evaluation, the same principles can be applied to organizations in this sector and are now
being utilized by some nationally recognized nonprofits to determine the value of their brand
to help determine consistent pricing for sponsorships and gain power in negotiating alliances

39
with corporations (Quelch, Austin, & Laidler-Kylander, 2004). By finding a valuation of their
name and logo, nonprofits are able to increase their expertise of their own value, in a form
which is understandable by for-profit partners. Interbrand, a consulting company who
produces the annual business brand rankings for Business Week magazine has used their
valuation method, included in the appendix, to establish brand equities for some national
nonprofit brands (Quelch et al., 2004). While not directly investigated in this study, the
concept of nonprofit brand evaluation is an interesting one and could gain more traction if
CSR initiatives continue to maintain their popularity and effectiveness for businesses.
Highly Identified Nonprofits
The importance of the nonprofit brand is also of concern when evaluating the
reaction to a CRM by an individual with high nonprofit brand identification and whose
loyalty to the nonprofit overrides other loyalties, e.g. a company’s brand. Individuals fitting
this description, especially younger volunteers who have yet to accumulate sufficient assets
to donate to the nonprofit they identify with, are an extremely important target market for
nonprofits to cultivate. As this segment of nonprofit supporters evolve in their relationship
with the nonprofit they could be vulnerable to cognitive inconsistencies if the nonprofit they
support partners with a company contrary to their beliefs. An example of this is an
individual who observes a CRM partnership between their highly identified nonprofit and a
company whose policies they disagree with.

40
Hypotheses Tested
The behavior of highly identified individuals when confronted with a CRM program
between the nonprofit they support and a company X leads to many interesting questions
about the mediating effect of identification on other behaviors. The first relationship
examined investigated the association between tenure and identification. Previous
organizational behavior research has found a positive correlation between organizational
tenure and identification (Kreiner & Ashforth, 2004; Wan-Huggins, Riordan, & Griffeth,
1998; Schneider, Hall & Nygren, 1971). Based on these findings, this study assumed a similar
relationship would exist in a nonprofit/donor-volunteer association. This belief is assumed
because individuals are likely to remain as donors or volunteers with nonprofits they
resonate with and over time become more psychologically identified with the nonprofit.
Thus,
H1: Consumer nonprofit brand identification will be positively related to support of the
nonprofit in the form of volunteering/donating tenure and frequency.
The following three hypotheses tested are related to nonprofit identification and the
assumed impact on nonprofit support and purchase intent. Each investigated the connection
between organizational identification and the intent of enhanced to support to the
corporation and nonprofit.
H2: Consumer corporate brand identification will be positively related to purchase intent
regarding products sold by the corporate partner.

41
H3: Consumer nonprofit brand identification will be positively related to intended purchase
of products sold by the corporate partner.
H4: Consumer nonprofit brand identification will be positively related to planned support of
the nonprofit partner in a CRM relationship.
The example of a highly identified nonprofit supporter confronted with a CRM
partnership between the nonprofit and a company they do not support may cause them to
adjust their opinion of one or both organizations. Conversely, it is assumed that if an
individual finds several commonalities between a corporation and a nonprofit in a CRM
program their opinion of the nonprofit will remain constant, but the corporate partner may
be subject to an “up pull” effect. Measurement of an “up pull” effect is theorized to be
exhibited by enhanced purchase intent and consistent nonprofit support. This leads to the
following hypothesis,
H5: Nonprofit identification will be positively correlated with CRM purchase intent, but the
increase in corporate support will exceed the additional support expressed towards the
nonprofit.
Aspirational traits, traits which people aspire to be defined by, could be valuable for
corporations engaged in CRMs because individuals who aspire to possess or be perceived as
possessing certain traits can cognitively purchase or borrow those traits from a nonprofit for

42
a nominal fee, the price of a CRM product or service. By choosing a yogurt with a pink
ribbon over a yogurt without one, a conscious choice is made by a consumer to support a
cause through their purchase decision, potentially driven in part by their aspirational identity
traits overlap with the nonprofit identity traits. Because as Aronson states, most individuals
attempt to preserve as sense of self that is (1) predictable, consistent, and stable; (2)
competent; and (3) morally good, it is assumed that nonprofit identification judged by
aspirational traits will be a better predictor of purchase intent and future nonprofit support
than the overall nonprofit identification measure which includes all traits (Aronson, 1992).
Thus, keeping with Aronson’s aspirational sense of self, it is theorized that seven traits,
capable, expert, compassionate, fair, high quality, sincere, and sensitive, are better predictors
of purchase intent and future nonprofit support. Stated more formally,
H6: Aspirational trait identification with the nonprofit brand will be positively related to
purchase intent of products sold by the corporate partner, as well as planned support of the
nonprofit partner.
Sen and Bhattacharya found that if consumers believe a significant tradeoff is made
to operate in a socially responsible manner, then company sales will be hurt by CSR
initiatives (Sen & Bhattacharya, 2001). They found this especially applicable when the
company in question produces high quality products and customers do not believe CSR
initiatives will enhance the company’s ability to improve the product or service (Sen &
Bhattacharya, 2001). This phenomenon may seem less relevant in a CRM relationship
because the company is making a donation to a nonprofit, not necessarily altering corporate

43
business practices, but because a CRM program could be consider a proxy of all corporate
social responsibility initiatives the same phenomenon may be present. Thus, consumer
support of CRMs could be indicative of their approval of other corporate CSR initiatives.
H7: CSR views will be positively related to purchase intent of CRM goods.
Prior research has also demonstrated a linkage between organizational prestige and
organizational identification (Cornwell & Coote, 2005; Bhattacharya et al., 1995) and as
Cornwell and Coote state, “individuals are more likely to identify with a nonprofit when the
organization is perceived to be prestigious.” Thus, to confirm this earlier research the
following hypothesis is offered.
H8: Perceived nonprofit prestige as judged by the respondent is positively related to
nonprofit identification.

44
CHAPTER IV
METHODOLOGY
Given the focus of the research question an individual level analysis was undertaken
to examine the impact of identification with a nonprofit brand. To address the research
question an online sampling procedure was initiated. The following section will discuss the
population selected to test the hypotheses, the method of data collection, the study design,
and the appropriateness of the measures used.
Sample Population
The sample population consisted of graduate students from two departments at a
large public university in the Pacific Northwest region of the U.S. This sample population
was selected because as explained earlier, a younger sample population is more likely to have
had interaction with nonprofits, thus it could be assumed they have a more defined identity
of the nonprofits they have been in contact with. Conversely, because an older sample
population would have an opportunity to become more tenured with the nonprofit they
support, a slightly older sample may provide the ideal group to survey. Fortunately, the
sample population provides both of these benefits. First, graduate students are on average
older than undergraduate students, as the median age of graduate students at this public
university is 28.5 versus 21.2 for undergraduate students (University Registrar, 2005).
Second, they are younger in comparison to the average U.S. citizen age of 36.2 (U.S. Census,

45
2005). In addition, graduate students were selected for parsimony reasons, as they are more
easily accessible to survey than undergraduate students.
In addition, because the survey population is on average older than undergraduates,
they have had a longer period of time to crystallize their own identities. This means graduate
students are likely to be more certain of the traits defining them, as most students are certain
of their career path and professional aspirations, especially in graduate programs surveyed,
which have more tightly confined career paths than other graduate programs. Besides a more
defined personal identity, graduate students typically have more defined identities of
nonprofit organizations, as those who attend college are often subject to community service
obligations associated with high school graduation requirements, college application
requirements, and once on campus the presence of service learning pressures (Randall, 2004;
Young, 2003). Given these factors, graduate students provide an ideal population to test the
hypotheses described earlier.
Data Collection
The survey instruments were created using Websurveyor software and published on
a secure server for online access. Graduate students from the two campus departments
received an online survey on February 28, 2005 consisting of 19 questions and were asked to
complete the survey in 10 days. Students selected received one follow up e-mail if the survey
was not returned in within 7 days, with text requesting they complete the survey in the
coming days. To motivate responses a $50 Bookstore gift certificate was offered to a
randomly drawn graduate student. The introduction e-mail text, follow e-mail text, survey
questions, and frequency counts of the survey are included in the appendix. Of the 223
46
graduate students e-mailed the survey link, 113 clicked on the link and completed the survey,
yielding a 50.67% response rate. Of the 113 responses, one was unusable due to omitted
responses, leaving 112 for analysis.
Fifty-three percent of the respondents were female; 43% from the business school,
40% from the planning, public policy, and management department, and 17% choosing to
remain unidentified by department. The average age was 29.31 years (SD=5.97) and 86% of
respondents indicated they are residents of the Eugene, Oregon, with the remaining
indicating residence in close regional proximity to Eugene. To ensure that no statistically
significant differences existed between the full population of graduate students in the two
departments and the sample multiple single sample t tests were conducted.
The first single sample t test compared the mean graduate department score of the
sample, 1.48 (SD=.50) to the population value of 1.49. The difference was not significant
(t (92)= -.118, p>.05). A second single sample t test compared the mean gender score of the
sample, 1.53 (SD=.50) to the population value of 1.45. The difference was not significant
(t (112)= 1.62, p>.05). A final single sample t test compared the mean age of the sample,
29.31 (SD=5.98) to the population value of 28.5. The difference was not significant (t (111)=
1.44, p>.05). For the final test, mean age of the sample, the average age for all graduate
students at the university was used, as data on the mean age for each department was
unavailable. A full copy of the survey results for the respondents are provided in the
appendix, further demonstrating the representative nature of the sample in respect to the full
population of graduate students.

47
Study Design
To effectively measure respondents’ identification with a nonprofit they selected, the
survey utilized two tactics to elicit a concrete identity. First, the nonprofit measured for
identification was self-selected based on respondents’ interaction with the nonprofit as a
donor, volunteer, passive observer, or consumer. To ensure the options available were well
known to respondents, a criterion was established which took into account national image,
financial capacity, and spatial characteristics when selecting nonprofits. These criteria helped
objectively identify nonprofit organizations likely to have both the capacity and media
presence to have established themselves perceptually in respondent’s minds. Because much
of the nonprofit sector operates locally or regionally, the option of selecting a nonprofit not
included on the list was also given to respondents. This option was included because many
nonprofits do not have the capacity to operate beyond their local territory, have members
who are local or regional, or were chartered to address issues that are regional in nature, e.g.
a local river preservation group. This process allowed each respondent to more easily
describe their feelings about the nonprofit selected in Q2 or Q5, as their familiarity with the
nonprofit brand was likely already established.
Nonprofit Selection Protocol
Using www.guidestar.org as a search platform, operating nonprofits, not
foundations, were identified in Washington D.C., Illinois, New York, Texas, California,
Oregon, Washington, and Idaho. These locations were selected because of their regional
association to Eugene, Oregon, (Oregon, Washington, and Idaho), and because these states
contain many of the largest cities in the country, (New York City, Los Angeles, Dallas,

48
Houston, Chicago, etc.), as well as the U.S. capitol. The later two reasons were incorporated
as access to political representatives and major population centers are both factors which
impact location of national nonprofit headquarters. Exempted from the search were
foundations, e.g. United Way and Susan G. Komen Foundation, as well as religious
organizations and universities. These organizations were originally considered, but pulled
from the selection set due to issues related to the length of survey and a desire to focus the
study on one class of the nonprofit sector; organizations providing direct charitable services
to constituents. Once nonprofit organizations were identified in these states they were
further segmented based on annual revenue, with organizations with over $20 million in
annual revenue advancing to the next consideration set. The final selection criterion was
national image presence, measured by two outside reviewers who helped narrow the final
consideration set through an assessment of the organization’s national public reach. These
lists were compared and differences were reconciled, leading to the final 20 organizations
appearing in the survey. Interestingly, only Portland’s Mercy Corps is from the Oregon,
Idaho, and Washington region, as it was the lone nonprofit identified from this region with a
national public reputation and significant financial capacity.
For-profit Selection Protocol
Similar to the selection of nonprofits, selection of for-profit companies was based on
the likelihood of respondents being able to provide a concrete identity of the company.
Thus, a category of companies was selected which respondents were likely to have regular
interaction with, a staple good available in grocery and convenience stores, cola/juice. This
product category was also selected because choosing a soda/juice typically requires low

49
cognitive elaboration as it is a low priced good. Thus, as described earlier in the branding
explanation section, consumers are less motivated to exert themselves mentally and
consequently may more often base their decisions on the secondary bits of information
which make up the companies’ brand image. Conversely, it could be stated because graduate
students are generally not earning a high income they will base their decisions on more
primary bits of information, such as price. To address this mediating factor a question was
added to the survey asking respondents to rank the importance of factors which guide their
soda purchase decision. Options included the variables which typically impact product
choice, availability, corporate responsibility, frequency of promotions, price, product quality,
taste, and quality of promotions. A question was also included which measured the
frequency of product purchase, another potential mediating factor which could impact
purchase intent of soda and juice products.
Identification Measure
To measure nonprofit identification, corporate identification, and nonprofit
corporate fit a modified version of the methodology utilized in the work of Sen &
Bhattacharya (2001) and Lichtenstein et al. (2004) was employed. Adopted by Sen and
Bhattacharya from person-organization fit research (Kristof, 1996), the measure was
calculated as the distance between respondent’s perceived character profile of the nonprofit
and themselves (NP Identification), the company and themselves (Corporate Identification),
and the company and the nonprofit (NP Fit). The personality traits selected for the survey,
see the appendix, were adjusted based on a pretest to fit the online survey method and
population tested. The identification measure focused on the personality component of

50
character, as respondents indicated their opinion of each character trait for the nonprofit
selected, themselves, and the soda/juice brand. A Likert type response scale was used,
1=Strongly Disagree to 5=Strongly Agree, and respondents indicated the extent they
believed each of the 19 traits assessed applied to each entity. A secondary measure of
nonprofit identification was included and was adopted from previous studies on
organizational identification (Cornwell & Coote, 2004; Bhattacharya et al., 1995; Mael &
Ashforth, 1992). Table 4.1 shows the secondary measure of identification used for this study.
Table 4.1 Secondary Identification Measure
Strongly Disagree Disagree No Opinion Agree Strongly
Agree
9) Please select the statement which best fits your feelings about THE NONPROFIT selected in questions 3 or 6:
• When someone criticizes the nonprofit selected it feels like a personal insult. • I am very interested in what others think about the nonprofit. • When I talk about the nonprofit, I usually say "we" rather than "they". • The successes of the nonprofit are my successes. • If a story in the media criticized the nonprofit, I would feel embarrassed/angered. • When someone praises the nonprofit, it feels like a personal compliment.
Other Measures
Commitment to the nonprofit selected in the survey was measured through Q1, Q2,
Q4, and Q5, which asked respondents the level of their philanthropic and volunteer activity
over the past five years with the nonprofit. The response scale for Q1 and Q2 ranged from
0=none at all to 4=regular volunteering or donating. Questions four and five further
elaborated on the endurance of the nonprofit/donor-volunteer relationship and measured

51
the number of years involved with the nonprofit and the frequency of their interactions on a
monthly basis, measured by hours volunteered per week. The organizational prestige
measure was adopted from previous research (Cornwell & Coote, 2005; Bhattacharya et al.,
1995; Mael & Ashforth, 1992). Question eight addressed this measure and table 4.2 shows
the specific wording and response options.
Table 4.2 Organizational Prestige Measure 1 2 3 4 5 9) Please select the statement which best fits your feelings about THE NONPROFIT selected in questions 3 or 6:
The organization is first class in comparison to other nonprofits
The organization is well thought of in the local community
The organization is comparable to other nonprofits
The organization is not quite as important as other nonprofits
The organization is not first class in comparison to other nonprofits
The measure of respondent’s corporate social responsibility viewpoint was adopted
from prior research by Sen & Bhattacharya (2001). Question 17 measured respondents’
beliefs about the trade-offs, or lack of trade-offs, a company makes between corporate social
responsibility and the company’s ability to deliver and produce their product at the highest
level of quality. The final measures serve as dependent measures, purchase intent and future
nonprofit support, Q15 and Q16, which are shown in table 4.3. Question 15 was left
ambiguous in terms of the type of donation made, as previous studies have found high levels
of consumer misinterpretation when attempting to calculate the amount of a CRM donation
(Olsen et al., 2003). In attempt to blunt misinterpretation a more inclusive wording was used
to describe the CRM donation amount, as it was assumed this would capture the more
general motivations of respondents, versus their response to specific giving methods.

52
Table 4.3 CRM Support 1 2 3 4 5 15) If the NONPROFIT and the PRODUCT you selected earlier were to partner for a promotion and A PERCENTAGE OF EVERY PURCHASE was donated to the nonprofit, how would it affect your likelihood to purchase the product?
Much more likely to purchase the product
More likely to purchase the product
No change in behavior
Less likely to purchase the product
Much less likely to purchase the product
How would it affect your support of the nonprofit partner?
Much more likely to volunteer or donate
More likely to volunteer or donate
No change in behavior
Less likely to volunteer or donate
Much less likely to volunteer or donate
Data Analysis
As previously discussed the variables were selected based their ability to serve as
measures to address the hypotheses tested in this study. To demonstrate the sectional nature
of the data, frequency counts of responses are organized in the appendix based on their
grouping. The first section includes question one and two, which measure philanthropic and
volunteer activity of respondents over the past five years. Also included in the first section
are questions four and five, measuring the length and frequency of involvement for those
who have supported a nonprofit organization in the past five years. Combined, these
measures provide a picture of a respondent’s relationship with the nonprofit selected in the
survey.
Section two is comprised of nonprofit supported by the respondent, or if
respondents do not actively support a nonprofit, the organization they would be most likely
to support. These measures were captured by questions three and six. Section three is made

53
of measures which attempt to measure identification with the nonprofit, self, and the
corporation. Question seven measured nonprofit identity, question nine measured nonprofit
identification using an alternative method, question ten measured personal identity
characterization, and question twelve measured corporate identity. Section four measures
perceived organizational prestige of the nonprofit, captured by question eight. Section five
includes questions eleven through fourteen and measures juice or soda preferences, as well
as factors impacting purchase decisions and frequency of juice or soda acquisition. Section
six serves as the dependent variable for much of the analysis in this study, measuring the
proposed CRM impact on purchase intent and additional nonprofit support. Socially
responsible business views are measured by survey question seventeen and assessed the
support of socially responsible business practices by respondents. Responses are shown in
section seven. Finally, section eight shows demographic information, including gender, zip
code, and university department for respondents.
For analysis purposes some data computation was necessary. First, nonprofit
identification measure 1 index was created by computing the difference between the
personal identity characterization, question 10, and nonprofit identity, questions 7. If
negative, the difference score was made positive and once all scores were positive, each one
was recoded. Scores were recoded so that the most identified answer for each trait was four
and the least identified was zero. Finally, each personality trait difference was summed and
the summed score was divided by the number of traits measured, nineteen, to reach the final
nonprofit identification measure 1. This same procedure was followed to create the

54
nonprofit/corporation fit index, the difference between nonprofit identity, question 7, and
corporate identity, question 12, and the corporation identification index, the difference
between personal identity and corporate identity.
Second, the support index was created by summing questions one, two, four, and
five and dividing by four. These four questions were used for this index because volunteer
and philanthropic activity, coupled with years tenured as a supporter and time committed on
a regular basis, are good measures of the overall organizational commitment respondents
have to the nonprofit. Including a support index for just questions one and two or four and
five was considered, but internal consistency results were not adequate for either index.
Weighting considerations were also taken, as with the procedure used places additional
influence on questions four and five, as the scale reaches a higher number. This additional
influence was warranted because questions four and five were deemed to be more precise
measures of organizational involvement, thus the larger range is tolerable. For reference, the
questions used for the support index are shown in table 4.4.

55
Table 4.4 Support Index Questions 1 2 3 4 5 1) Describe the extent of your philanthropic activity, (giving money), over the past 5 years?
None at all
I have made one donation to a nonprofit
I have made several donations to a nonprofit
I regularly make donations to a nonprofit
2) Describe the extent of your volunteer activity, (giving time), over the past 5 years?
None at all
I have volunteered once for a nonprofit
I have volunteered several times for a nonprofit
I volunteer regularly for a nonprofit
4) If yes, how many years have you been involved with the organization?
Less than 1 year
1-3 years 4-6 years 7-9 years Over 9 years
5) If yes, how many hours per month have you spent volunteering for the organization in the past year?
Less than 5 hours
6-10 hours 11-15 hours 16-20 hours
Over 20 hours
Third, a CSR viewpoint index was created by taking the responses from the six
segments of question seventeen and averaging them to create one index. Data was recoded
for the first five parts of the CSR viewpoint question, while the last remained consistent with
the survey data. Table 4.5 shows the questions used to compute CSR viewpoint.

56
Table 4.5 CSR Viewpoint Questions
Strongly Disagree Disagree No Opinion Agree Strongly
Agree 17) Please respond to each statement below by rating your level of agreement varying from strongly agree to strongly disagree
• Socially responsible behavior detracts from companies' ability to provide the best possible products
• Socially responsible behavior by firms is often a cover-up for inferior product offerings • Socially responsible firms produce worse products than do firms that do not worry
about social responsibility • All else equal, a socially responsible firm is likely to have lower technological expertise
than a firm that is not socially responsible • Firms that devote resources towards socially responsible actions have fewer resources
available for increasing employee effectiveness • A company can be both socially responsible and manufacture products of high value
Fourth, to measure the comparison between aspirational traits influence on CRM
purchase intent and CRM nonprofit support seven traits were selected to indexes for
nonprofit identification, corporate identification, and nonprofit/corporation fit. Seven traits;
capable, expert, compassionate, fair, high quality, sincere, and sensitive, were selected and
the process followed the same procedure as used to create the other indexes. Lastly, some
data required recoding to ease the understandability of the data during the analysis and
presentation process. Thus, CSR views, support index, organizational prestige, purchase
intent, and NP support intent were recoded so all variables used in the regression models
were consistent in their direction.

57
CHAPTER 5
FINDINGS
Means, standard deviations (S.D.), and correlations (Pearson Correlation Coefficient)
are presented in table 5.1. These measures were tested for reliability with Cronbach’s Alpha,
a measure of internal consistency. NP Identification 1 scale has an alpha of .84 and NP
Identification 2 scale has an alpha of .79, comparable to Cornwell’s et al. (2005) report of .82
for cancer race participants, Ashforth’s (1990) report of .83 for a sample of managers, and
Mael’s (1988) .81 for a sample of employed business and psychology students (Mael &
Ashforth, 1992). Other internal consistency scores measured include corporate identification
with an alpha of .81, nonprofit/corporate fit with a .82, CSR views with a .86, and support
index with a .41.
Table 5.1 demonstrates a strong correlation between Nonprofit/Corporate Fit and
Corporate Identification (r (96) = .99, p <.01), indicating a significant linear relationship
between the two variables. Thus, the higher identified respondents were with the
corporation, the more they tended to have higher nonprofit/corporate fit. Thus, individuals
who had larger differences between their identity characterization and the corporation’s were
also likely to have larger differences between their characterization of the nonprofit when
compared to the corporation. An example of how this would apply is a donor who views a
corporation as completely opposite from the nonprofit in terms of personality, while also
viewing themselves as more similar to the nonprofit than the corporation. This point

58
demonstrates the value nonprofits can bring to CRM programs, as individuals find a greater
overlap in identity, or see more of themselves in the nonprofit than they do in the a
corporation. This finding also implies an individuals’ opinion of corporate fit depends
primarily on corporate identity perceptions, as the nonprofit identity is more likely to be
close to an individuals own identity. Thus, if fit is important to the success of the promotion,
leveraging the nonprofit identity in a CRM promotion can help bridge the gap between
consumer identity and corporate identity.
Table 5-1. Means, SD, and Correlations for Model Variables
M
SD 1 2 3 4 5 6 7 8 9
1) CRM Purchase Intent 3.97 .76 1.00
2) CRM NP Support Intent
3.18 .64 .26** 1.00
3) NP Identification 1
3.33 .39 .09 -.14 1.00
4) NP Identification 2
3.04 .79 .29** .12 .09 1.00
5) Organizational Prestige
4.21 .78 .13 -.02 -.06 -.02 1.00
6) CSR Views 3.87 .45 .17 -.11 .26** -.03 .02 1.00 7) Corporate
Identification 2.94 .39 -.01 .20* .09 -.02 -.24* -.03 1.00
8) NP-C Fit 2.94 .40 .01 .20* .09 -.02 -.24* -.03 .99** 1.009) Support Index 2.50 .64 .09 -.05 -.07 .35** -.09 -.24* .08 .10 1.00** Correlation is significant at the .01 level (2-tailed) * Correlation is significant at the .05 level (2-tailed)
Additional points of interests include a moderate positive correlation found (r
(108)=.29, p <.01), between Nonprofit Identification Measure 2 and CRM Purchase Intent
and a moderate positive correlation (r ( 95) = .35, p <.01), between Support Index and
Nonprofit Identification Measure 2. This indicates a significant linear relationship between

59
the two variables, meaning more identified individuals tend to provide more support to
CRM programs and to support the nonprofit more in general. Statistically significant weak
positive correlations also existed between CRM Nonprofit Support Intent and CRM
Purchase Intent, CRM Nonprofit Support Intent and Corporate Identification, Nonprofit-
Corporate Fit and CRM Nonprofit Support Intent, and CSR Views and Nonprofit
Identification Measure 1. Statistically significant weak negative correlations existed between
Support Index and CSR Views, Organizational Prestige and Corporate Identification, and
Organizational Prestige and Nonprofit-Corporate Fit.
Regression Models
A series of regression models tested the hypotheses proposed in chapter four. Each
of these models includes two control variables, dichotomous variables gender and location
of the nonprofit supported, local or non-local. These two dummy variables were included
because previous research in organizational behavior has found that personal factors may
impact organizational identification (Wan-Huggins et al., 1998) including such variables as
tenure, job level, gender, and race. Campus department was also considered as a control
variable, but was excluded as it was not significant statistically in any of the regression
models and previous research did not cite its importance.
Models one and two test the effect of identification on support of the nonprofit
partner in a CRM program, which is measured by the amount of volunteering/donating and
the frequency and tenure of these activities. The results are shown in table 5.2 and 5.3. It
should be noted that two separate regression models were used in tests unless noted
otherwise. This allowed both methods of evaluating nonprofit identification to be tested and

60
compared. Two methods were used in the survey in accordance with two separate lines of
research Cornwell & Coote, 2005; Bhattacharya et al., 1995; Mael & Ashforth, 1992 and
Lichtenstein et al., 2004; Sen and Bhattacharya, 2001.
Table 5.2 Least Squares Regression Model 1 Testing for Hypothesis 1 Dependent Variable: Support Index R = .534 R2 = .285 Adjusted R2 = .211 F = 3.835 Significance = .001 N=85 Independent Coefficients Standardized Coefficients Variables Β Std. Error Beta T Signif.(Constant) 4.216 1.048 4.022 .000 NP Identification 1 -.115 .162 -.074 -.711 .479 Female .357 .135 .279 2.649 .010* Local Nonprofit .339 .127 .261 2.666 .009**NP-C Fit 2.325 1.478 1.510 1.573 .120 Corporate Identification
-2.328 1.496 -1.493 -1.556 .124
Organizational Prestige -.140 .081 -.180 -1.720 .090 CSR Views -.414 .155 -.286 -2.680 .009**Age .019 .010 .193 1.946 .055 ** = Significant at the p < .01 level * = Significant at the p < .05 level

61
Table 5.3 Least Squares Regression Model 2 Testing for Hypothesis 1 Dependent Variable: Support Index R = .570 R2 = .325 Adjusted R2 = .253 F = 4.515 Significance = .000 N=83 Independent Coefficients Standardized Coefficients Variables Β Std. Error Beta t Signif.(Constant) 3.162 .982 3.219 .002 NP Identification 2 .189 .084 .235 2.256 .027* Female .316 .134 .245 2.351 .021* Local Nonprofit .225 .134 .173 1.675 .098 NP-C Fit 1.940 1.488 1.234 1.304 .196 Corporate Identification
-1.925 1.501 -1.215 -1.283 .204
Organizational Prestige -.135 .080 -.172 -1.684 .096 CSR Views -.404 .148 -.280 -2.730 .008**Age .020 .009 .204 2.118 .037* ** = Significant at the p < .01 level * = Significant at the p < .05 level
Nonprofit Identification and Support
H1: Consumer nonprofit brand identification will be positively related to support of the
nonprofit in the form of volunteering/donating tenure and frequency.
The regression model shown in table 5.2 did not support H1, but the regression
model shown in table 5.3 did support H1. A significant regression equation was found (F
(8,75)= 4.515, p <.001), with a R2 of .325. This shows that nonprofit identification was a
significant predictor of prior nonprofit support. In addition to nonprofit identification other
variables proved significant as female gender, age, and local nonprofit all had strong positive
relationships with the support index while CSR views had a strong negative relationship.
This last result was surprising, as it indicates the more favorable of corporate social

62
reasonability in business practices; the more apt respondents were to have prior nonprofit
support. This provides evidence that nonprofit service does not necessary equal a favorable
viewpoint on socially responsible business practices. Gender was also considered in these
regression models and the results show female gender is a strong predictor of nonprofit
support, as females has a much higher propensity to serve more than males. Age followed a
similar pattern, as being older was a good predictor of a longer tenured or more active
volunteer or donor with the nonprofit they support. The final significant result was a strong
positive relationship between local proximity and support. This is an intuitive result, as more
tenured or more frequent volunteers are likely to be based close to the nonprofit and locally
based volunteers are more likely to be longer tenured and more frequent in their support.
Another relationship which was not significant, but worth discussing was organizational
prestige, which was moderately negatively related to support in both models, meaning the
less prestigious respondents viewed the organization, the more support they provided. This
result is counterintuitive and could stem from some methodological differences with
previous studies which are discussed in the final chapter.

63
Table 5.4 Least Squares Regression Model 1 Testing for Hypothesis 2 and 3 Dependent Variable: CRM Purchase Intent R = .294 R2 = .086 Adjusted R2 = -.023 F = .788 Significance = .628 N=84 Independent Coefficients Standardized Coefficients Variables Β Std. Error Beta t Signif.(Constant) 2.256 1.425 1.583 .118 NP Identification 1 .216 .201 .129 1.077 .285 Female .170 .174 .122 .975 .333 Local Nonprofit .081 .165 .058 .492 .624 Support Index .029 .141 .027 .204 .839 NP-C Fit .510 1.856 .307 .275 .784 Corporate Identification
-.452 1.878 -.269 -.241 .810
Organizational Prestige .125 .103 .148 1.214 .228 CSR Views -.083 .200 -.053 -.414 .680 Age .018 .012 .167 1.433 .156 ** = Significant at the p < .01 level * = Significant at the p < .05 level
Table 5.5 Least Squares Regression Model 2 Testing for Hypothesis 2 and 3 Dependent Variable: CRM Purchase Intent R = .422 R2 = .178 Adjusted R2 = .077 F = 1.760 Significance = .091 N=82 Independent Coefficients Standardized Coefficients Variables Β Std. Error Beta t Signif.(Constant) 2.189 1.252 1.748 .085 NP Identification 2 .315 .103 .366 3.047 .003**Female .125 .167 .091 .751 .455 Local Nonprofit -.076 .164 -.054 -.465 .644 Support Index -.080 .138 -.075 -.580 .564 NP-C Fit -.291 1.797 -.173 -.162 .872 Corporate Identification
.324 1.812 .191 .179 .859
Organizational Prestige .114 .098 .135 1.161 .249 CSR Views -.021 .186 -.013 -.112 .911 Age .019 .012 .183 1.650 .103 ** = Significant at the p < .01 level * = Significant at the p < .05 level

64
CRM Purchase Intent
H2: Consumer corporate brand identification will be positively related to purchase intent in
regards to products sold by the corporate partner.
H3: Consumer nonprofit brand identification will be positively related to purchase intent in
regards to products sold by the corporate partner.
Multiple linear regressions were calculated predicting respondent’s CRM purchase
intent based on the independent variables included in table 5.4 and 5.5. Neither regression
equation was significant (F (9,75) = .788, p > .05) and (F (9,73) = 1.760, p > .05). Thus, H2
was not supported as a significant linear relationship could not be established with the
regression models tested. Although the regression equation was not significant, H3 was
given partial support in the regression model and further tests on the relationship between
nonprofit identification and CRM purchase intent provide evidence justifying support of the
hypothesis. The discussion of H5 provides additional commentary on this relationship.

65
Table 5.6 Least Squares Regression Model 1 Testing for Hypothesis 4 Dependent Variable: CRM Nonprofit Support Intent R = .514 R2 = .265 Adjusted R2 = .176 F = 3.000 Significance = .004 N=84 Independent Coefficients Standardized Coefficients Variables Β Std. Error Beta t Signif.(Constant) 3.610 1.292 2.793 .007 NP Identification 1 -.165 .182 -.097 -.905 .368 Female .240 .158 .171 1.516 .134 Local Nonprofit .194 .149 .136 1.296 .199 Support Index -.303 .128 -.277 -2.371 .020* NP-C Fit .643 1.683 .383 .382 .704 Corporate Identification
-.255 1.703 -.150 -.150 .882
Organizational Prestige -.031 .093 -.037 -.335 .739 CSR Views -.385 .181 -.242 -2.121 .037* Age .040 .011 .371 3.547 .001** ** = Significant at the p < .01 level * = Significant at the p < .05 level
Table 5.7 Least Squares Regression Model 2 Testing for Hypothesis 4 Dependent Variable: CRM Nonprofit Support Intent R = .524 R2 = .275 Adjusted R2 = .185 F = 3.070 Significance = .004 N=82 Independent Coefficients Standardized Coefficients Variables Β Std. Error Beta t Signif.(Constant) 2.799 1.205 2.323 .023 NP Identification 2 .133 .100 .151 1.338 .185 Female .213 .160 .150 1.329 .188 Local Nonprofit .119 .157 .083 .755 .452 Support Index -.342 .133 -.311 -2.573 .012* NP-C Fit .242 1.730 .141 .140 .889 Corporate Identification
.149 1.744 .086 .086 .932
Organizational Prestige -.027 .094 -.032 -.291 .772 CSR Views -.414 .179 -.261 -2.317 .023* Age .042 .011 .392 3.766 .000** ** = Significant at the p < .01 level * = Significant at the p < .05 level

66
Nonprofit CRM Support Intent
H4: Consumer nonprofit brand identification will be positively related to planned support of
the nonprofit partner in a CRM relationship.
Although two significant regression equations were found (F (9,75) = 3.000, p < .01),
with a R2 of .265 and (F (9,73) = 3.070, p < .01), with a R2 of .275, H4 was not supported as
no significant linear relationship existed between nonprofit identification and CRM
nonprofit support intent. While the H4 was not supported, some results did emerge from
the regression models used. First, aging is a strong predictor of additional support to the
nonprofit engaged in CRM, as age had a negative strong positive relationship with CRM
nonprofit support intent. Second, a strong negative relationship exists between those do not
believe companies make a tradeoff when making social responsible business decisions and
additional support to the nonprofit engaged in a CRM program. This relationship mirrors
the results of tables 5.2 and 5.3, showing corporate social responsibility beliefs do not
positively correlate with nonprofit support. Third, a strong negative relationship was shown
to exist between prior nonprofit support and additional support towards the nonprofit if
engaged in a CRM program. This result indicates that already committed volunteers or
donors, evidenced by their higher support index scores, may reach an upper limit of available
support and can not give any more time or money. Another possible explanation is current
donors may not be swayed in their support by a CRM program, in fact those who are more
supported may be put off by a CRM program, causing them to diminish their support of the
nonprofit as a result.

67
Table 5.8 Least Squares Regression Model 1 Testing for Hypothesis 5 Dependent Variable: CRM Purchase Intent R = .136 R2 = .019 Adjusted R2 = -.011 F = .629 Significance = .598 N=103 Independent Coefficients Standardized Coefficients Variables Β Std. Error Beta t Signif.(Constant) 3.477 .592 5.878 .000 NP Identification 1 .141 .178 .079 .792 .430 Local Nonprofit .100 .141 .070 .707 .481 Female .104 .139 .075 .750 .455 ** = Significant at the p < .01 level * = Significant at the p < .05 level
Table 5.9 Least Squares Regression Model 2 Testing for Hypothesis 5 Dependent Variable: CRM Nonprofit Support Intent R = .182 R2 = .033 Adjusted R2 = .004 F = 1.146 Significance = .334 N=103 Independent Coefficients Standardized Coefficients Variables Β Std. Error Beta t Signif.(Constant) 3.944 .553 7.137 .000 NP Identification 1 -.253 .166 -.151 -1.519 .132 Local Nonprofit .149 .132 .111 1.124 .264 Female .066 .130 .051 .511 .611 ** = Significant at the p < .01 level * = Significant at the p < .05 level

68
Table 5.10 Least Squares Regression Model 3 Testing for Hypothesis 5 Dependent Variable: CRM Purchase Intent R = .305 R2 = .093 Adjusted R2 = .067 F = 3.563 Significance = .017 N=107 Independent Coefficients Standardized Coefficients Variables Β Std. Error Beta t Signif.(Constant) 3.091 .289 10.680 .000 NP Identification 2 .311 .096 .325 3.250 .002**Local Nonprofit -.143 .154 -.093 -.926 .357 Female .003 .142 .002 .020 .984 ** = Significant at the p < .01 level * = Significant at the p < .05 level
Table 5.11 Least Squares Regression Model 4 Testing for Hypothesis 5 Dependent Variable: CRM Nonprofit Support Intent R = .131 R2 = .017 Adjusted R2 = -.011 F = .613 Significance = .608 N=108 Independent Coefficients Standardized Coefficients Variables Β Std. Error Beta t Signif.(Constant) 2.892 .254 11.405 .000 NP Identification 2 .084 .084 .104 1.000 .320 Local Nonprofit .066 .135 .051 .489 .626 Female .018 .124 .014 .146 .884 ** = Significant at the p < .01 level * = Significant at the p < .05 level
Support Comparison
H5: Nonprofit identification will be positively correlated with CRM purchase intent, but the
increase in corporate support will exceed the additional support expressed towards the
nonprofit.

69
A significant regression equation was found (F (3,104) = 3.563, p < .05), with an R2
of .093. Thus, H5 was supported, as a significant positive relationship between nonprofit
identification and CRM purchase intent is evidenced by table 5.10. Nonprofit identification
measure 2 was a significant predictor of CRM purchase intent. Part two of H5, that
corporate support will exceed additional support towards the nonprofit was tested with a
paired sample t test. The mean score for CRM purchase intent was 3.97 (SD=.76) and the
mean score for CRM nonprofit support intent was 3.18 (SD=.64). A significant difference
between the two measures of support was found (t (110) = 9.671, p < .001). This provides
evidence supporting part two of H5, as intent for additional support to the business through
a CRM purchase outweighed the intent for additional support to the nonprofit. Additionally,
while nonprofit identification was significantly related to CRM purchase intent, nonprofit
identification was not related to CRM nonprofit support intent in any of the regression
models tested.
While this finding is significant, some of this effect could be explained by donations
the nonprofit would receive from the CRM program. Therefore, because a donor or
volunteer may feel they are already providing additional support to the nonprofit through
purchasing a CRM product, this implied donation may nullify any motivation for additional
support to the nonprofit. Because the survey sample contained a high percentage of
nonprofit volunteers or donors, 93% of respondents, much of those sampled could find
themselves in such a position.

70
Table 5.12 Least Squares Regression Model 1 Testing for Hypothesis 6 Dependent Variable: CRM Purchase Intent R = .268 R2 = .072 Adjusted R2 = -.024 F = .747 Significance = .650 N=85 Independent Coefficients Standardized Coefficients Variables Β Std. Error Beta t Signif.(Constant) 2.820 1.313 2.147 .035 Aspirational NP Identification
.075 .168 .052 .447 .656
Female .213 .173 .152 1.232 .222 Local Nonprofit .055 .166 .039 .331 .741 Support Index .031 .135 .028 .226 .822 Aspirational Corporate Identification
.021 .151 .016 .136 .892
Organizational Prestige .114 .099 .134 1.150 .254 CSR Views -.057 .209 -.035 -.272 .786 Age .015 .012 .141 1.238 .220 ** = Significant at the p < .01 level * = Significant at the p < .05 level
Table 5.13 Least Squares Regression Model 2 Testing for Hypothesis 6 Dependent Variable: CRM Nonprofit Support Intent R = .512 R2 = .262 Adjusted R2 = .186 F = 3.421 Significance = .002 N=85 Independent Coefficients Standardized Coefficients Variables Β Std. Error Beta t Signif.(Constant) 3.727 1.168 3.189 .002 Aspirational NP Identification
-.210 .150 -.147 -1.407 .164
Female .223 .154 .160 1.453 .150 Local Nonprofit .177 .148 .126 1.198 .235 Support Index -.266 .121 -.248 -2.210 .030* Aspirational Corporate Identification
.306 .135 .234 2.275 .026*
Organizational Prestige -.024 .088 -.028 -.273 .785 CSR Views -.322 .186 -.198 -1.733 .087 Age .037 .011 .343 3.375 .001** ** = Significant at the p < .01 level * = Significant at the p < .05 level

71
Aspirational Identification
H6: Aspirational trait identification with the nonprofit brand will be positively related to
purchase intent of products sold by the corporate partner, as well as planned support of the
nonprofit partner.
Table 5.12 does not show a significant linear relationship, (F (8,77) = .747, p > .05),
and while table 5.13 does show a significant regression equation, (F (8,77) = 3.421, p < .001),
with a R2 of .262, H6 is not supported. Table 5.13 does demonstrate again that aging is a
good predictor of additional support to the nonprofit engaged in CRM, as a strong positive
relationship exists. This keeps with previous regression models show in tables 5.6 and 5.7,
which show a similar relationship. Also consistent with previous regression models, see
tables 5.6 and 5.7, table 5.13 shows a strong negative relationship between support index and
CRM nonprofit support intent. A new result is a strong positive relationship between
aspirational corporate identification and CRM nonprofit support intent. Thus, the greater the
corporate identification on aspiration traits, the more likely additional support is provided to
the nonprofit in a CRM program.

72
Table 5.14 Least Squares Regression Model 1 Testing for Hypothesis 7 Dependent Variable: CSR Views R = .472 R2 = .223 Adjusted R2 = .140 F = 2.690 Significance = .012 N=83 Independent Coefficients Standardized Coefficients Variables Β Std. Error Beta t Signif.(Constant) 4.749 .554 8.575 .000 NP Identification 2 -.015 .064 -.027 -.234 .815 Female .362 .095 .405 3.818 .000**Local Nonprofit -.005 .102 -.006 -.050 .961 Support Index -.224 .082 -.323 -2.730 .008**NP-C Fit .053 1.119 .049 .047 .962 Corporate Identification
-.111 1.128 -.101 -.098 .922
Organizational Prestige -.079 .060 -.145 -1.313 .193 Age .003 .007 .041 .387 .700 ** = Significant at the p < .01 level * = Significant at the p < .05 level
Table 5.15 Least Squares Regression Model 2 Testing for Hypothesis 7 Dependent Variable: CSR Views R = .505 R2 = .255 Adjusted R2 = .177 F = 3.291 Significance = .003 N=85 Independent Coefficients Standardized Coefficients Variables Β Std. Error Beta t Signif. (Constant) 3.922 .679 5.775 .000 NP Identification 1 .206 .112 .191 1.835 .070 Female .320 .092 .363 3.466 .001** Local Nonprofit -.023 .094 -.026 -.249 .804 Support Index -.206 .077 -.298 -2.680 .009** NP-C Fit -.296 1.058 -.278 -.279 .781 Corporate Identification
.227 1.071 .211 .212 .832
Organizational Prestige -.068 .058 -.126 -1.171 .245 Age .005 .007 .071 .681 .498 ** = Significant at the p < .01 level * = Significant at the p < .05 level

73
CSR Viewpoint
H7: CSR views will be positively related to purchase intent of CRM goods.
Tables 5.6 and 5.7 demonstrate a strong negative relationship between CRM
nonprofit support intent and CSR views, but as demonstrated in tables 5.4 and 5.5 H7 is not
supported as a relationship does not exist with CRM purchase intent. Additional regression
models were created to test the relationships between CSR views and the other variables and
are shown in tables 5.14 and 5.15. Two significant regression equations were found (F (8,75)
= 2.690, p < .05) with an R2 of .223 and (F (8,77) = 3.291, p < .01), with an R2 of .255. They
demonstrate a strong positive relationship between female and CSR views, as being a female
is a strong predictor of approving of CSR inclusion in corporate decision making. A strong
negative relationship was also found between the nonprofit support index and CSR views.
This demonstrates that a lack of prior nonprofit support is a good predictor of a propensity
to believe that tradeoffs do not exist for companies making socially responsible business
decisions.

74
Table 5.16 Least Squares Regression Model 1 Testing for Hypothesis 8 Dependent Variable: Nonprofit Identification 1 R = .385 R2 = .148 Adjusted R2 = .059 F = 1.671 Significance = .119 N=85 Independent Coefficients Standardized Coefficients Variables Β Std. Error Beta t Signif.(Constant) 2.957 .735 4.025 .000 Female .104 .098 .126 1.058 .293 Local Nonprofit .059 .093 .071 .632 .529 Support Index -.057 .080 -.088 -.711 .479 NP-C Fit 1.407 1.040 1.423 1.352 .180 Corporate Identification
-1.369 1.054 -1.368 -1.300 .198
Organizational Prestige -.046 .058 -.091 -.788 .433 CSR Views .204 .111 .219 1.835 .070 Age -.009 .007 -.142 -1.290 .201 ** = Significant at the p < .01 level * = Significant at the p < .05 level
Table 5.17 Least Squares Regression Model 2 Testing for Hypothesis 8 Dependent Variable: Nonprofit Identification 2 R = .472 R2 = .223 Adjusted R2 = .140 F = 2.686 Significance = .012 N=83 Independent Coefficients Standardized Coefficients Variables Β Std. Error Beta t Signif.(Constant) 2.352 1.370 1.717 .090 Female .119 .185 .075 .646 .520 Local Nonprofit .464 .174 .286 2.661 .010**Support Index .336 .149 .271 2.256 .027* NP-C Fit 1.378 1.999 .705 .689 .493 Corporate Identification
-1.397 2.016 -.710 -.693 .490
Organizational Prestige .051 .109 .052 .467 .642 CSR Views -.048 .207 -.027 -.234 .815 Age -.009 .013 -.074 -.701 .485 ** = Significant at the p < .01 level * = Significant at the p < .05 level

75
Nonprofit Prestige
H8: Perceived nonprofit prestige as judged by the respondent is positively related to
nonprofit identification.
H8 was not supported as a significant linear relationship was not found in the two
regression models tested, tables 5.16 and 5.17. Table 5.17 does show significant strong
positive relationships between Nonprofit Identification Measure 2 and Local Nonprofit, and
Nonprofit Identification Measure 2 and Support Index, (F (8,75) = 2.686, p < .05), with a R2
of .223. Thus, both prior support and the location of the nonprofit supported, local or non-
local, are good predictors of the level of nonprofit identification.
Other Findings
An independent samples t test was calculated comparing the mean nonprofit
identification score, NP Identification 1, of respondents who identified themselves as
females, to the mean nonprofit identification score of subjects who identified themselves as
male. A significant difference was found between two groups (t (103) = -1.45, p < .05). The
mean score for females showed they were more highly identified (m=3.39, SD=.24) than
males (m=3.28, SD=.50).
Independent samples t tests were then calculated for the other indexes investigated,
CRM Purchase Intent, CRM NP Support Intent, NP Identification 1, NP Identification 2,
Organizational Prestige, CSR Views, Corporate Identification, NP-C Fit, and Support Index
using gender, department, nonprofit support, and local/non local nonprofit location as
sampling factors. All tests were not significant save two exceptions. First, a significant

76
difference was found, (t (95) = -3.494, p <.05), between the mean support index score of
subjects who identified themselves as supporting a local nonprofit and those who identified
themselves as supporting a non-local nonprofit. The mean support index score for those
who support a local nonprofit was significantly higher (m=2.76, SD=.66) than the mean
score for those who support a non-local nonprofit (m=2.32, SD=.56). Intuitively this result
makes sense as the ease of supporting a local organization is less daunting because events
and organizational activities are local and local nonprofits are generally smaller, thus more
accessible. In addition, the cause may resonate more with individuals who live in the same
place where the nonprofit directs its focus.
The second significant difference found was, (t (81) = 1.725, p < .05), between the
mean corporate identification score of business and public policy, planning, and
management students. Business students had significantly higher levels of corporate
identification (m=3.03, SD=.33) with the corporation they selected than public policy,
planning, and management students (m=2.91, SD=.46). This result is valid on its face, as a
business student’s curriculum is likely to paint corporations in a more favorable light, as they
are the primary organization evaluated, which could potentially influence a more positive
perception of corporations in general. This would be consistent with previous studies in
which increased exposure has been shown to engender positive affect toward the entity
exposed to (Zajonc, 1968). Conversely, this finding could be a result of the self selection
which occurs when choosing a graduate program to attend, as individuals with more positive
feelings towards corporations are likely to gravitate towards business programs more than
those which center on government related issues.

77
Product Related Variables
Product preference, factors influencing brand preference were examined, and
frequency of purchase. Graph 5.1 demonstrates the product preference of respondents,
showing the fragmented nature of the soda and juice market which manufacturers and
distributors face.
Graph 5.1: Juice and Soda Product Preferences
0%
5%
10%
15%
20%
25%
30%
35%
OtherOdwalla
CokeDiet Coke
Hansen's
PepsiSnapple
Diet Pepsi
Mt. Dew
Dr. Pepper
SpriteSobe
7-UpBlue Sky
Jones Soda
Sierra Mist
RC Cola
Table 5.18 shows the ranking of factors influencing brand preference of
respondents. This table demonstrates taste and product quality are overwhelming the most
important factors of brand preference to respondents. It is likely these two factors are
somewhat interrelated, as are the factors ranked as least important, promotion frequency and
quality. This assumption is evidenced by an alpha of .60 for the pairing of taste and product
quality and .78 for frequency and quality of promotions.
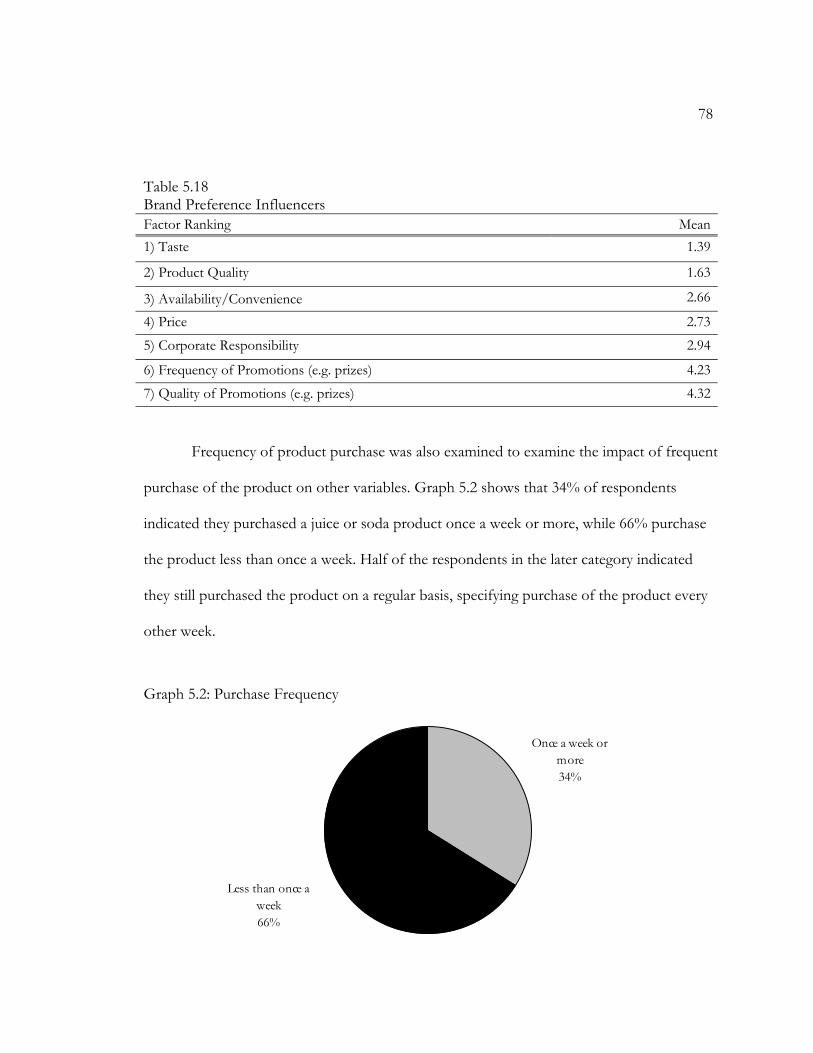
78
Table 5.18 Brand Preference Influencers Factor Ranking Mean1) Taste 1.39
2) Product Quality 1.63
3) Availability/Convenience 2.66
4) Price 2.735) Corporate Responsibility 2.94
6) Frequency of Promotions (e.g. prizes) 4.237) Quality of Promotions (e.g. prizes) 4.32
Frequency of product purchase was also examined to examine the impact of frequent
purchase of the product on other variables. Graph 5.2 shows that 34% of respondents
indicated they purchased a juice or soda product once a week or more, while 66% purchase
the product less than once a week. Half of the respondents in the later category indicated
they still purchased the product on a regular basis, specifying purchase of the product every
other week.
Graph 5.2: Purchase Frequency
Once a week or more34%
Less than once a week66%

79
Numerous independent samples t-tests were calculated to examine the relationship
between other variables examined earlier. The first tests examined the relationship between
gender and product influencers and gender and purchase frequency. A significant difference
was found between the two groups (t (106) = -1.136, p < .05) for one of the product
influencers, availability/convenience, but the remaining influencers and purchase frequency
did not show any significant differences. The mean score for males showed they placed
more importance on availability convenience (m=2.53, SD=1.049) than females (m=2.78,
SD= 1.257). This did not impact the overall order of influencer ranking for males, as the
ranking kept the same order; Taste, Product Quality, Availability/Convenience, Price,
Corporate Responsibility, Frequency of Promotions (e.g. prizes), and Quality of Promotions
(e.g. prizes). But, based on the mean ranking for females, price showed more importance in
decision making for a soda or juice purchase than availability/convenience, as females placed
higher importance on this variable than males in a hierarchical evaluation.
The second test examined the campus department and product influencers and
purchase frequency, with multiple significant differences found. The first significant
difference found (t (87) = -1.908, p < .01) business students place higher importance on
availability/convenience (m=2.43, SD=.927) as a product choice influencer than public
policy, planning, and management students (m=2.88, SD= 1.310). The second significant
difference found (t (87) = -.621, p < .05) business students place higher importance on price
(m=2.60, SD=.948) as a product choice influencer than public policy, planning, and
management students (m=2.74, SD= 1.211). The third significant difference found (t (87) =
-2.659, p < .01) business students place higher importance on taste (m=1.23, SD=.428) as a
product choice influencer than public policy, planning, and management students (m=1.55,

80
SD= .670). The fourth significant difference found (t (85) = -3.216, p < .05) business
students place higher importance on the quality of promotions (m=4.00, SD=1.103) as a
product choice influencer than public policy, planning, and management students (m=4.63,
SD= .586). Table 5.19 shows the difference in hierarchical ranking of product influencers
between business and public policy, planning, and management students.
Table 5.19 Product Influencers Separated by Department
Business Mean Public Policy, Planning, and Management Mean
Taste 1.23** Taste 1.55** Product Quality 1.57 Product Quality 1.65 Availability/Convenience 2.43** Corporate Responsibility 2.40 Price 2.60* Price 2.74* Corporate Responsibility 3.43 Availability/Convenience 2.88** Frequency of Promotions 3.96 Frequency of Promotions 4.35 Quality of Promotions 4.00* Quality of Promotions 4.63* ** = Difference significant at the p < .01 level * = Difference significant at the p < .05 level
A Pearson correlation coefficient was calculated for the relationship between campus
department and the product influencer variables. A strong correlation between campus
department and corporate responsibility was found (r (88) = -.42, p <.01), indicating a
significant linear relationship between the two variables. Moderate correlations were also
found between campus department and quality of promotions (r (87) = .329, p <.01),
campus department and taste(r (89) = .274, p <.01), and campus department and frequency
of promotions(r (89) = .252, p <.05).

81
The third independent samples t-test calculated compared weekly juice and soda
purchasers to less than weekly juice and soda purchasers on product preference influencers.
The test found one significant difference, (t (105) = -2.806, p < .001) as more frequent
purchasers place higher importance on taste (m=1.19, SD=.397) as a product choice
influencer than less frequent purchasers (m=1.50, SD= .608). The other variables did not
exhibit significant differences. A Pearson correlation coefficient was also calculated showing
a strong correlation between purchase frequency and importance of taste (r (107) = .264, p
<.01), corroborating the independent samples t-test results. These results demonstrate as
purchase frequency increases the importance of taste increases as a determinant of product
selection.
A final independent samples t-test compared the purchase frequency, weekly or non-
weekly, on corporate identification. The test found a significant difference, (t (100) = 1.561,
p < .01) as more frequent purchasers exhibited higher levels of identification with the
corporation (m=3.03, SD=.21) than less frequent purchasers (m=2.90, SD= .46). This is
consistent with the suggestion that longer tenured employees will become more identified
with their employer over time and that volunteers/donors will become more identified with
the nonprofit they support over time. While the independent samples t-test demonstrated a
significant difference, a Pearson correlation was calculated measuring this same relationship
showing a strong relationship that was not significant (r (100) = .359, p < .05). These results
are inconsistent, but the correlation was significant at the p > .10 level, indicating partial
support for correlation between the variables.

82
Review of Hypotheses
As shown in table 5.20, the data demonstrated support for hypothesis 1, partial
support for hypothesis 3, and support for hypothesis 5, while two, four, six, seven, and eight
were not supported.
Table 5.20 Summary of Hypotheses Hypotheses ResultH1: Consumer nonprofit brand identification will be positively related to support of the nonprofit in the form of volunteering/donating tenure and frequency.
Supported
H2: Consumer corporate brand identification will be positively related to purchase intent in regards to products sold by the corporate partner.
Not Supported
H3: Consumer nonprofit brand identification will be positively related to purchase intent in regards to products sold by the corporate partner.
Partial Support
H4: Consumer nonprofit brand identification will be positively related to planned support of the nonprofit partner in a CRM relationship.
Not Supported
H5: Nonprofit identification will be positively correlated with CRM purchase intent, but the increase in corporate support will exceed the additional support expressed towards the nonprofit.
Supported
H6: Aspirational trait identification with the nonprofit brand will be positively related to purchase intent of products sold by the corporate partner, as well as planned support of the nonprofit partner.
Not Supported
H7: CSR views will be positively related to purchase intent of CRM goods.
Not Supported
H8: Perceived nonprofit prestige as judged by the respondent is positively related to nonprofit identification.
Not Supported
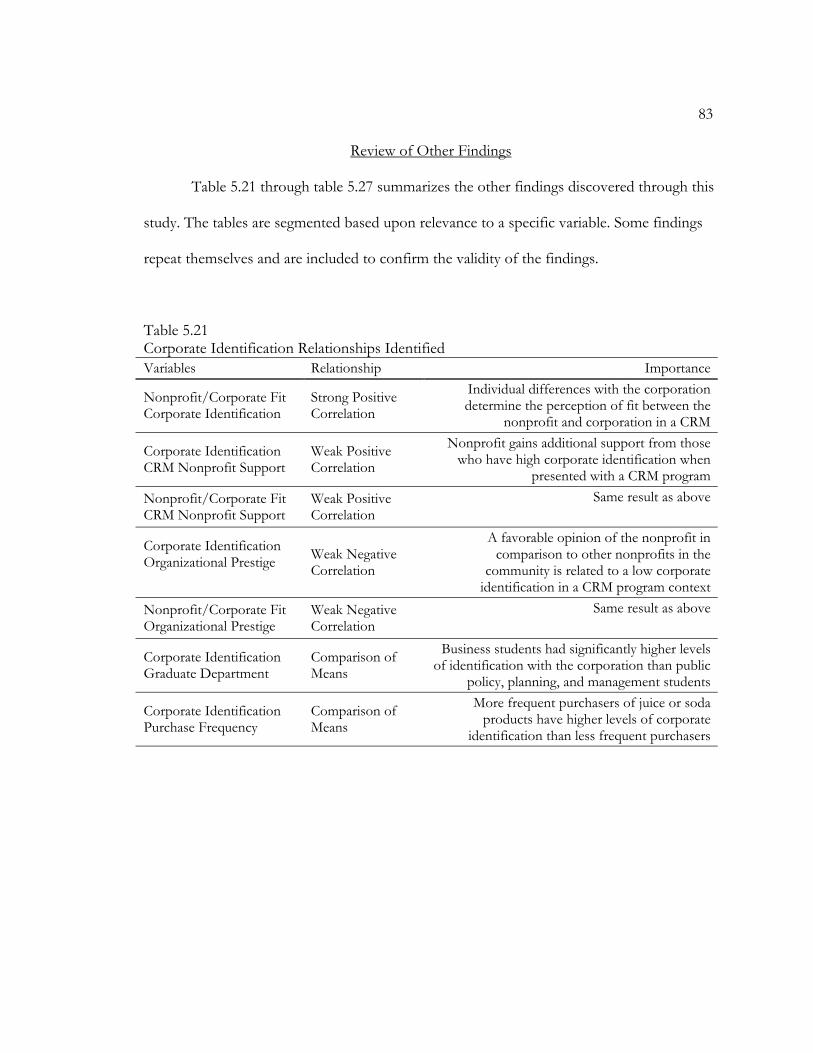
83
Review of Other Findings
Table 5.21 through table 5.27 summarizes the other findings discovered through this
study. The tables are segmented based upon relevance to a specific variable. Some findings
repeat themselves and are included to confirm the validity of the findings.
Table 5.21 Corporate Identification Relationships Identified Variables Relationship Importance
Nonprofit/Corporate Fit Corporate Identification
Strong Positive Correlation
Individual differences with the corporation determine the perception of fit between the
nonprofit and corporation in a CRM
Corporate Identification CRM Nonprofit Support
Weak Positive Correlation
Nonprofit gains additional support from those who have high corporate identification when
presented with a CRM programNonprofit/Corporate Fit CRM Nonprofit Support
Weak Positive Correlation
Same result as above
Corporate Identification Organizational Prestige
Weak Negative Correlation
A favorable opinion of the nonprofit in comparison to other nonprofits in the
community is related to a low corporate identification in a CRM program context
Nonprofit/Corporate Fit Organizational Prestige
Weak Negative Correlation
Same result as above
Corporate Identification Graduate Department
Comparison of Means
Business students had significantly higher levels of identification with the corporation than public
policy, planning, and management students
Corporate Identification Purchase Frequency
Comparison of Means
More frequent purchasers of juice or soda products have higher levels of corporate
identification than less frequent purchasers
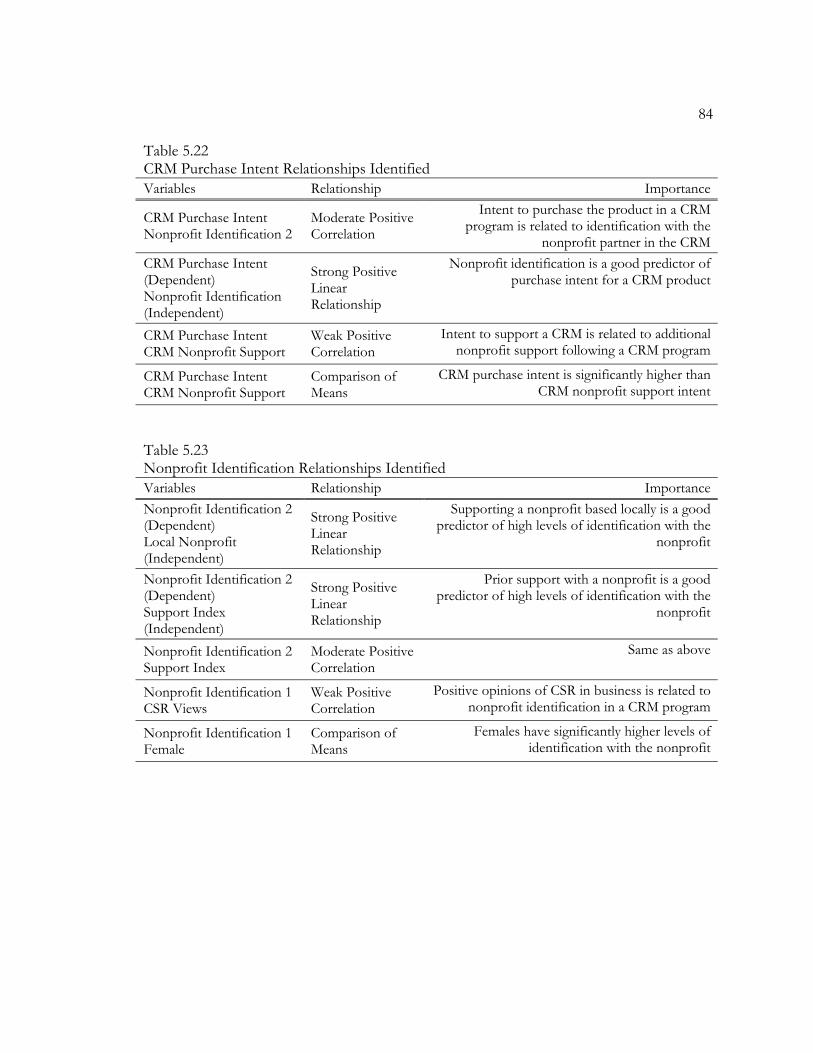
84
Table 5.22 CRM Purchase Intent Relationships Identified Variables Relationship Importance
CRM Purchase Intent Nonprofit Identification 2
Moderate Positive Correlation
Intent to purchase the product in a CRM program is related to identification with the
nonprofit partner in the CRMCRM Purchase Intent (Dependent) Nonprofit Identification (Independent)
Strong Positive Linear Relationship
Nonprofit identification is a good predictor of purchase intent for a CRM product
CRM Purchase Intent CRM Nonprofit Support
Weak Positive Correlation
Intent to support a CRM is related to additional nonprofit support following a CRM program
CRM Purchase Intent CRM Nonprofit Support
Comparison of Means
CRM purchase intent is significantly higher than CRM nonprofit support intent
Table 5.23 Nonprofit Identification Relationships Identified Variables Relationship ImportanceNonprofit Identification 2 (Dependent) Local Nonprofit (Independent)
Strong Positive Linear Relationship
Supporting a nonprofit based locally is a good predictor of high levels of identification with the
nonprofit
Nonprofit Identification 2 (Dependent) Support Index (Independent)
Strong Positive Linear Relationship
Prior support with a nonprofit is a good predictor of high levels of identification with the
nonprofit
Nonprofit Identification 2 Support Index
Moderate Positive Correlation
Same as above
Nonprofit Identification 1 CSR Views
Weak Positive Correlation
Positive opinions of CSR in business is related to nonprofit identification in a CRM program
Nonprofit Identification 1 Female
Comparison of Means
Females have significantly higher levels of identification with the nonprofit

85
Table 5.24 Support Index Relationships Identified Variables Relationship ImportanceSupport Index (Dependent) CSR Views (Independent)
Strong Negative Relationship
Low opinions of CSR in business decisions is a good predictor of high levels of prior nonprofit
service
Support Index CSR Views
Weak Negative Correlation
Same as above
Support Index (Dependent) Local Nonprofit (Independent)
Strong Positive Linear Relationship
Those who support local nonprofits tend to have higher levels of prior nonprofit support
Support Index Local Nonprofit
Comparison of Means
Same as above
Support Index (Dependent) Female (Independent)
Strong Positive Linear Relationship
Females are more likely to have higher levels of prior nonprofit support
Support Index (Dependent) Age (Independent)
Strong Positive Linear Relationship
The older the person the more likely they are to have higher levels of prior nonprofit support
Table 5.25 Nonprofit Support Relationships Identified Variables Relationship ImportanceCRM Nonprofit Support (Dependent) Age (Independent)
Strong Positive Linear Relationship
Aging is good predictor of additional support given to a nonprofit engaged in a CRM program
CRM Nonprofit Support (Dependent) CSR Views (Independent)
Strong Negative Linear Relationship
Negative views of CSR business practices are a good predictor of intent to support a nonprofit
engaged in a CRM program
CRM Nonprofit Support (Dependent) Support Index (Independent)
Strong Negative Linear Relationship
Low levels of prior support of a nonprofit is a good predictor of high levels of intent to provide additional support to the nonprofit engaged in a
CRMCRM Nonprofit Support (Dependent) Aspirational Corporate Identification (Independent)
Strong Positive Linear Relationship
High levels of aspirational corporate identification is a good predictor of CRM
nonprofit support intent
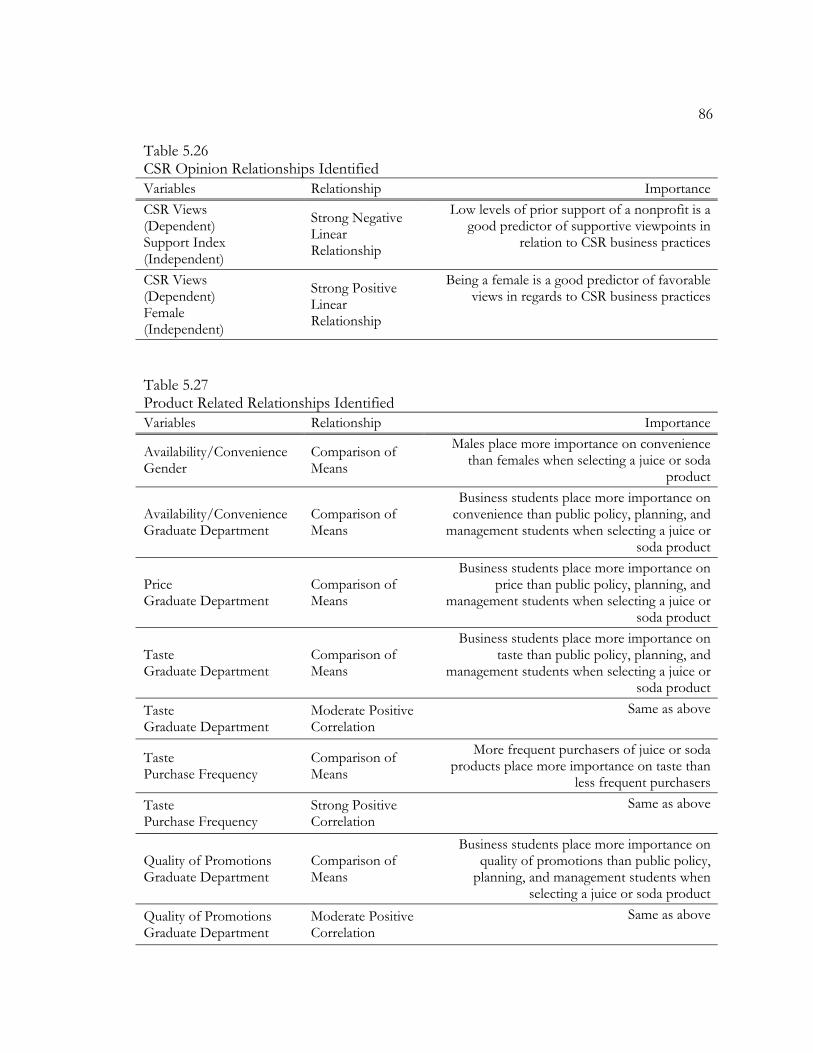
86
Table 5.26 CSR Opinion Relationships Identified Variables Relationship ImportanceCSR Views (Dependent) Support Index (Independent)
Strong Negative Linear Relationship
Low levels of prior support of a nonprofit is a good predictor of supportive viewpoints in
relation to CSR business practices
CSR Views (Dependent) Female (Independent)
Strong Positive Linear Relationship
Being a female is a good predictor of favorable views in regards to CSR business practices
Table 5.27 Product Related Relationships Identified Variables Relationship Importance
Availability/Convenience Gender
Comparison of Means
Males place more importance on convenience than females when selecting a juice or soda
product
Availability/Convenience Graduate Department
Comparison of Means
Business students place more importance on convenience than public policy, planning, and
management students when selecting a juice or soda product
Price Graduate Department
Comparison of Means
Business students place more importance on price than public policy, planning, and
management students when selecting a juice or soda product
Taste Graduate Department
Comparison of Means
Business students place more importance on taste than public policy, planning, and
management students when selecting a juice or soda product
Taste Graduate Department
Moderate Positive Correlation
Same as above
Taste Purchase Frequency
Comparison of Means
More frequent purchasers of juice or soda products place more importance on taste than
less frequent purchasersTaste Purchase Frequency
Strong Positive Correlation
Same as above
Quality of Promotions Graduate Department
Comparison of Means
Business students place more importance on quality of promotions than public policy,
planning, and management students when selecting a juice or soda product
Quality of Promotions Graduate Department
Moderate Positive Correlation
Same as above

87
Variables Relationship Importance
Frequency of Promotions Graduate Department
Moderate Positive Correlation
Importance of the frequency of promotions is related to the graduate department of
respondents when selecting a juice or soda product
Corporate Responsibility Graduate Department
Strong Positive Correlation
Importance of corporate responsibility is related to the graduate department of respondents
when selecting a juice or soda product

88
CHAPTER 6
SUMMARY AND IMPLICATIONS
Since the early twentieth century consumer choice, market forces, and government
intervention have prompted businesses to become more aware of corporate responsibility as
an integral aspect of their business operations. As outside influences have prompted
businesses to increase their social involvement, environmental factors have also shepherded
the rise of corporate responsibility. Factors include the increase of the nonprofit sector in
size, scope, and significance, the decrease of social service funding from government
agencies, and the heightened expectations of consumers in regards to business ethics and
corporate responsibility. Besides outside intervention and changing environmental factors,
corporate social involvement has also been impacted by societal shocks such as 9/11, Enron,
Worldcom, and the tsunami of December 2004. Taken together these factors have not only
prompted businesses to become more publicly active with causes, but have also entrenched
consumer expectations and norms that are likely to maintain corporate and nonprofit
intermingling in the years ahead.
The potential exists for this maintained interaction to eventually lead to the
“independent” sector becoming the “partnered” sector, leaving speculation about the
potential ramifications to organizations in the nonprofit sector. Not only could this systemic
shift change the way nonprofits operate internally, it could also have a profound effect on
the external communications of partnered organizations. Given the importance of external

89
communications in donor relations, volunteer solicitation, membership maintenance, and
advocacy efforts, the impact of increased partnering with businesses could significantly
influence those who receive communication from a nonprofit. In particular, primary
stakeholders could be subject to dissonance if corporate partnerships are counter to their
perception of the nonprofit. Given the serious implications of nonprofit stakeholder
dissonance and its potential to impact stakeholder relations, this study focused on a ever
expanding partnership option between the two sectors, cause related marketing. Within the
context of cause related marketing programs this study sought to better understand how
individuals interact with nonprofit brands in terms of identification with the nonprofit and
how this relationship moderates intended future support of the nonprofit and CRM
purchase intent.
While the sample was representative of graduate students and provides evidence
transferable to a general population, the survey population differed greatly from the general
population in one important aspect, the percentage of individuals who actively support a
nonprofit. Approaching the study it was assumed a large percentage of respondents would
indicate their support of a nonprofit because of the environmental factors associated with
attending an institution of higher education (Randall, 2004; Young, 2003). These factors
increase the likelihood of collegiate involvement with a nonprofit, as those who attend
college will likely give time or money to a nonprofit as part of their university experience.
While high levels of involvement were expected, the percentage involved in the sample, 87%
giving money and 86% volunteering, exceeded expectations. The results were also above
average in comparison to the percentage of donors and volunteers in the U.S., where 89% of
households give charitable contributions and 44% volunteer (Independent Sector, 2002).

90
Thus, while individuals sampled are consumers, the most definitive results from this study
pertain to relationships with nonprofit stakeholders, as this was the most represented group
sampled. Consequently, results will discuss consumer implications, but will also discuss
relations with nonprofit stakeholders, defined for the purposes of this study as those who
donate to or volunteer with a nonprofit organization.
Supporters and Latent Supporters Approve
The study provided overwhelming evidence that consumers, when presented with
a CRM program, will be more likely to purchase the product if a nonprofit they support or
admire receives a donation as a result of the CRM. Thus, as a stakeholder of the nonprofit it
is likely purchase choice in a commodity market like soda or juice will be based on a CRM
association. This was evidenced by the fact that 76% of respondents indicated they would be
more likely, or much more likely to purchase a CRM product if a donation was made to the
nonprofit they support or admire. Interestingly, there was not a significant difference
between respondents who were active with a nonprofit in the past five years, either as a
donor or volunteer, and those who were not. Not only did both groups express a similar
intent to purchase CRM goods, but there was a non-significant difference in their purchase
intent score, (M=4.00, SD=.76) for those not supporting a nonprofit for the past five years,
and (M=3.97, SD=.76) for those who have.
These results demonstrate CRM programs are supported not only by nonprofit
stakeholders, but also by consumers who admire a nonprofit organization and are not active
supporters. This group, termed latent supporters, is where CRM programs seem to draw
their strength, as most individual nonprofits lack a broad national stakeholder network, but

91
any nonprofit can be admired for their work in the community. Thus, a nonprofit that
maintains a regular presence in news coverage for their good work, but does not have a large
membership base can be a compelling purchase influencer for latent supporters, who admire
the cause but choose not to commit through volunteering or donating.
While it is clear CRM programs are actively supported by consumers, both nonprofit
stakeholders and latent supporters, the cognitive process leading to differing levels of
support or opposition of a CRM program is less clear. To attempt to better understand this
process multiple statistical tests were calculated. By examining shared traits the study was
able to examine how identity overlap with a nonprofit moderated other decisions in concert
with other variables investigated. The following section discusses each variable investigated
and how the findings fit within a proposed model of CRM support for nonprofit
stakeholders.
Support Index
It was assumed nonprofit stakeholders with organizational tenure or frequent
organization interactions would be more likely to have high nonprofit brand identification.
This was verified by the findings, but some other interesting findings emerged about those
with high levels of prior support. First, age, female gender, and close location of the
nonprofit were correlated with high levels of prior support. Second, prior support of a
nonprofit was negatively related to positive views on corporate social responsibility, although
this finding is somewhat misleading, as only 1.8% of all respondents had viewpoints that
could be viewed as negative towards corporate social responsibility. While few negative
viewpoints about CSR existed, the findings showed a higher opinion of CSR was a good
92
predictor of a lesser amount of previous service to a nonprofit. Prior support was also
negatively related to additional support of the nonprofit partnered in the CRM agreement
and while it was a good predictor of nonprofit identification, it was not a good predictor of
CRM purchase intent. Thus, prior support, as influenced by age, gender, and the proximity
to nonprofit supported, seems to influence the creation of nonprofit identification, but taken
alone is not enough to impact CRM purchase intent.
Corporate Identification and Nonprofit-Corporate Fit
Corporate identification and nonprofit-corporate fit were not significant influencers
of CRM purchase intent, countering assumptions that a fit of image of would provide
increased support for CRM purchase intent as a result of a attitude balance between the two
organizations (Basil, 2002). While corporate identification was not significant in regards to
CRM support, an interesting result emerged from the analysis of product related variables.
The findings showed those who purchased soda or juice more frequently had higher levels
of corporate identification than those who purchased soda or juice less frequently. While
study limitations keep use from stating that because of more frequent use the higher
corporate identification exists, this finding does provide some evidence that frequent brand
usage narrows the gap between an individual’s identity and the brand’s identity. Providing
additional evidence of this phenomenon is an independent samples t-test showing those who
volunteer more than five hours of time per week have significantly higher nonprofit
identification (M=3.36, SD=.80) than those who do not (M=2.95, SD=.74). So, it is possible

93
that increased interaction positively relates to identification on an organizational level, work
or volunteer relationship, as well as a smaller scale, e.g. the purchase of a soda or juice
product.
Aspirational Traits
The aspirational traits selected for analysis did not prove to be significant influencers
of CRM purchase intent. This could be related to the selection of traits included, as guided
by Aronson’s contention of individual preservation of their self image. A more rigorous
selection of traits could aid future research on whether a difference exists between
aspirational and general traits.
CSR Views
CSR views provided some of the most interesting results as they were contrary to
expected outcomes. It was assumed that CSR views would be positively related to nonprofit
service, but a negative result emerged from the analysis. This demonstrates that service to a
nonprofit does not relate to beliefs of corporate responsibility. Additionally, results showed
the highest opinions of CSR may actually originate from individuals giving the least amount
of their time to social causes through nonprofit service. Graph 6.1 provides evidence of this
assertion with a visual representation of the relationship between CSR views and nonprofit
support.

94
Graph 6.1: CSR Views and Nonprofit Support
3
3.5
4
4.5
0.5 1.251.5 1.75
2 2.252.5 2.75
3 3.253.5 3.75
4 4.5
Support Index
CSR
Vie
ws
Organizational Prestige
Unexpectedly, neither identification measure was significantly related to
organizational prestige. This result could be explained by a difference in measurement
instruments, as this study used a single question as a prestige indicator while previous studies
have used multiple questions with Likert type scale responses (Cornwell & Coote, 2005;
Bhattacharya et al., 1995). Given the methodological differences it is difficult to state
whether the difference is related to the type of organization sampled, or the use of a
different measurement instrument. Bhattacharya et al. evaluated members of an art museum
and Cornwell and Coote evaluated participants of cause related race, while this study focused
on donors and volunteers from many different nonprofits. It is possible membership
organizations such as art museums would appeal to a segment of the population in which
the exclusivity element of the product is a primary motivating factor, prompting
organizational prestige to be more important. This would be similar to membership in a

95
country club and possibly contrary to the experience of buying soda/juice from a grocery
store. Those who attend a cause related race may also have differing prestige motivations as
the sample populations was from one membership group, versus the varied nonprofit
experiences found from this sample.
Nonprofit Identification
Nonprofit identification was shown to be a significant predictor of CRM purchase
intent. This result was consistent with previous research regarding nonprofit identification
and demonstrates the importance of nonprofit identification in predicting behavior of
consumers when presented with a cause partnership (Cornwell & Coote, 2005). Given the
sample population, this study also helps develop a theoretical path to CRM support for
nonprofit stakeholders as shown in figure 6.1. The relationships between variables show that
age, proximity to nonprofit operations, and gender all influence nonprofit support. Prior
nonprofit support is a significant predictor of nonprofit identification, as is proximity to
nonprofit operations, although each seems to operate on different constructs. Prior support
to the nonprofit seems to draw more directly from the variables in the first box, with each
influencing the level of prior support. Finally, CRM purchase intent is influenced by the level
of nonprofit identification, with nonprofit stakeholders indicating more support as nonprofit
identification rises.

96
Figure 6.1: Nonprofit Supporters Path to CRM Purchase Intent
Prior Nonprofit Support Nonprofit
Identification
Proximity to Nonprofit
Age
Proximity to Nonprofit
Gender
CRM Purchase Intent
Implications and Recommendations for Nonprofits
As more businesses understand the value of CRM programs the number of
nonprofit organizations partnering with corporations is likely to grow. While additional
revenue for cash strapped nonprofits may always seem like a positive, there are many factors
which should give nonprofits reason to carefully examine all benefits and costs before
partnering. These factors are discussed in the following section and include
recommendations of how nonprofits can effectively address each issue.
First, because each nonprofit depends on different sources to finance operations, an
analysis of the potential incremental gain with a CRM program should be undertaken. If the
nonprofit is like most in the U.S. the vast majority of revenue is likely to originate from
individual donations (Giving USA, 2004). Thus, because corporate giving is tied to pre tax
profits (Cooperman, 2005) it is unlikely corporate giving will match the gains which could be
felt as a result of the impending wealth transfer from individual donors (The Economist,
2004). Consequently, the prospect of increased planned giving is likely to be a more cost
effective fundraising method as compared to CRM programs. This does not mean every
organization will receive more benefits from planned giving than a CRM program, just that

97
the costs of starting such a CRM program should be compared to other potential fundraising
mechanisms prior to implementation, or if both are already in operation how resources are
allocated to these two giving programs to plan for both short term and long term financial
obligations.
Second, the pricing of a CRM program and the amount of staff time required should
be considered by nonprofits. According to IEG many nonprofits in the U.S. do not charge
enough money of companies when entering into joint marketing agreements (Hall, 2004).
Including employee time, service fees, and minimum donation limits in an agreement will
diminish a nonprofit’s exposure to risk, and will also ensure an equitable exchange of
nonprofit goodwill for the donation. In regards to time spent on a CRM program, nonprofit
executives should measure effectiveness in a manner similar to fundraising special events,
e.g. charity auctions, which also utilize high levels of staff time and are often justified by their
value as a communication vehicle to the local community and attendees. CRM programs can
provide these same benefits and are especially attractive to lesser known nonprofit
organizations which benefit to a greater extent than more familiar nonprofits in terms of
enhanced attitudes about the nonprofit (Lafferty & Goldsmith, 2005).
Third, as corporate giving continues to shift from corporate philanthropy to more
strategic giving (MacMillan, 2003), nonprofits will need to improve their arguments for
corporate dollars. New Jersey Performing Arts Center executive director Sue-Ellen Wright
describes the shift from corporate philanthropy to sponsorship and CRM programs when
she commented on corporate donations by stating, “We don’t always want to convert
companies to sponsors; it’s more expensive for us, but the reality is donor dollars are going
away” (IEG, 2004). To better meet corporate requirements nonprofits will need to rely more

98
on specific measurements of the tangible benefits provided by the partnership, e.g. change in
public image, changing consumer spending habits, and employee satisfaction, and less on
intangibles which are not measurable (IEG, 2004). Performance measurement in the
nonprofit sector is likely to become increasingly critical as both corporations and donors
increase their expectations of a social return on investment. This relates directly to the
popularity of CRM programs, as they are measurable given their direct impact on sales.
Fourth, nonprofits need to be aware of benefits accrued from a partnership and have
a method of measuring success internally. This is important as the findings demonstrate that
individuals give more additional support to the business partner in a CRM than they do the
nonprofit partner. This is evidenced by a comparison between the incremental support
expressed towards the nonprofit and CRM purchase intent. A paired sample t test compared
the mean results for each variable showing purchase intent was 3.97 (SD = .76), and
additional nonprofit support was 3.18 (SD = .64), with a significant difference found (t (109)
= 9.671, p < .001). While those who indicated they would provide more support to the
nonprofit outnumbered those who indicated they would decrease support, 20% to 5%, the
majority, 75%, stated the CRM program would have no impact on their support of the
nonprofit. While the measurable difference in support intent is important and provides
reasoning for implementation of internal monitoring systems for CRM programs, there are
some potential issues with this conclusion.
Three reasons provide arguments of why the difference found in this study is not
significant, each relating to the high percentage of respondents who support a nonprofit.
First, the law of diminishing returns may apply to this sample, as respondents who volunteer
or donate may have already engaged with a nonprofit at a level that fits their maximum

99
allotment of support in the form of contributions or volunteerism. Thus, even though they
may wish to give more support as a result of a CRM program their incremental gifts of time
or money will become smaller and smaller each time approached. Second, survey
respondents selected the nonprofit, thus respondents already had an established giving or
volunteering pattern, which might not be impacted by awareness of a theoretical CRM
program.
Third, it is likely a CRM purchase could evoke feelings of a “no strings” donation,
allowing donors and volunteers to conclude that by buying the product they have done their
part, thus decreasing their inclination to provide additional support to the nonprofit.
Providing contrary evidence to the first and second reasons is the non-significant
relationships between both nonprofit tenure and number of hours volunteered with the
organization and additional support of the nonprofit and CRM purchase intent. Thus, the
length and frequency of service to the nonprofit were not factors in both additional
nonprofit support and CRM purchase intent, meaning low-level supporters had additional
room for donations or volunteer time, but still selected to not provide the nonprofit
additional support.
Key Managerial Considerations
Regardless of how the issue is approached and analyzed, CRM equity is an important
concern and relates to the key factors of CRM success from a nonprofit perspective,
whether it helps generate additional revenue, increase awareness of the organization,

100
improve identification with the nonprofit brand, and engender increased commitment of
latent supporters. The following section discusses how nonprofits can address each of these
key factors to ensure a successful CRM program as well as an equitable partnership.
As mentioned previously the correct pricing of CRM packages is important as a
nonprofit who engages in a CRM program should be rewarded for the risk they assume by
lending their positive brand image to a company. Nonprofit managers should ensure pricing
accounts for staff time, production costs, and the equivalent licensing rights rate which
would be associated with a straight licensing agreement. In addition, a minimum donation
limit should be included in the contract, as well as assurances of language which specifies
donation protocol in the consumer promotional material, as CRM consumer confusion has
been shown to exist regardless of educational background (Olsen et al., 2003). Also,
promotional material language should consider mentioning prior donation amounts or
expected donations. This is advised as a situational decision because research has been
offered both perspectives on the issue, that donation amounts are of important concern to
consumers (Dahl & Lavack, 1995) and that they are not significant (Holmes & Kilbane,
1993).
The remaining three key factors are each related to the concept of commitment as
awareness, identification, and increased commitment among latent supporters each feed into
the proposed path to nonprofit commitment shown in figure 6.2. This conceptual drawing
shows the boundary element of age and nonprofit identification, each which if positive
influences on an individual help push the levels of commitment upward. These boundary
elements could be thought of as guides toward higher levels of commitment to the
nonprofit. The left side of the figure shows the level of nonprofit commitment, which

101
corresponds with the individual action boxes, showing interactions which demonstrate
nonprofit commitment. The figure also demonstrates the linkage between activities and how
nonprofits can slowly build a base of supporters for their activities as they position
individuals for the next step of support. It also shows the importance of identification
building during initial interactions with the organization and how time and age impact an
individual’s growth as a committed supporter of a nonprofit. An important point with this
model is that it is not applicable to all situations, as some nonprofit supporters may be
impacted by life changing events which prompt immediate commitment at a high level, e.g. a
family member diagnosed with cancer. The proposed model deals with a gradual increase in
commitment as experienced by those who initiate interactions with a nonprofit and steadily
increase their support over time.
Figure 6.2: Path to Nonprofit Commitment
Special Event
Attendance
Nonprofit Identification
Planned Giving
Education about Cause
Major Gift
Age
Annual Gift
Volunteering
Nonprofit Commitment

102
Increasing awareness of the nonprofit as a result of a CRM program is an important
aspect of building commitment, as it can serve as the initial spark for individual awareness of
an issue, leading to education about the cause. For organizations whose cause is less familiar
this an especially important as studies have demonstrated attitude toward unfamiliar causes
can be significantly improved in a CRM program with a familiar brand, as they gain more
attitudinal shift than familiar causes (Lafferty & Goldsmith, 2005). Thus, unfamiliar
nonprofits should attempt to allay with brands which are familiar, as brand attitudinal change
was shown to be positive regardless of the familiarity of the cause (Lafferty & Goldsmith,
2005).
This could be a great method for local nonprofits, e.g. Birth to Three, to gain
corporate partners as they are justifiable if the corporation’s CRM goal is attitudinal shift. If
a less familiar nonprofit is able to partner with a corporation they should take steps to ensure
consumer’s heuristics do not lead to misattribution of a familiar nonprofit in place of their
organization. This could limit the ability of a stair stepping process to occur, as newly
educated individuals may express volunteer desires with the more familiar nonprofit instead
of the smaller nonprofit. An example of this could occur when consumers mistakenly
identify a regional nonprofit focused on cancer prevention as the American Cancer Society.
For more familiar causes, e.g. American Cancer Society, there is always a need to educate a
new generation of the importance of their cause, thus CRM programs which reach a youth
target market could be advantageous in starting the process of education and potentially
spurring an early movement to volunteerism.

103
As demonstrated by this study, nonprofit identification is a good predictor of CRM
support. As such the nonprofits which have built the most identified group of active and
latent supporters will have the most bargaining power when negotiating CRM programs,
helping to generate the most revenue from these partnerships. An example of this type of
high identification can be found in the world of sports in which NASCAR commends the
higher than average sponsorship prices, often attributed to their highly identified fans who
exhibit amazing examples of reciprocity by purchasing sponsors products (Lefton, 2004,
King, 2004, King, 2003). This type of highly identified fan is also more apt to BIRG, (Bask
in Reflected Glory), as their self worth is intrinsically tied to the success of the sports
property (Madrigal, 2004; Cialdini, Borden, Thorne, Walker, Freeman, & Sloan, 1976). Fans
in this state of dependence have also been shown to have much higher levels of reciprocity
towards the properties sponsor than less highly identified fans, which places sports
properties such as NASCAR in an advantageous position when seeking sponsorships
(Madrigal, 2004).
Granted, sports and causes are fundamentally different, but nonprofits could still
benefit from improving the way they measure brand identification and as NASCAR has,
continually work to improve identification with their active and latent supporters. Examples
of measures which nonprofits can implement to improve identification include a young
professional project board of directors, the use of CRM programs to educate latent
supporters on easy methods for involvement, and communication messages which praise the
success of the nonprofit projects by linking supporter’s contributions to the organization’s

104
success. These are just a few of the endless list of creative initiatives that could enable
nonprofits to keep supporters stating “we” when talking about a nonprofit as they move up
the commitment ladder.
An assessment of the current nonprofit identification measures of the nonprofits
selected by respondents is shown in table 6.1. While the number of respondents for each
organization does not allow tests of specific differences between nonprofits, a one-way
ANOVA computation comparing nonprofit identification scores found a significant
difference among the nonprofits (F(17,84) = 1.723, p < .05). Tukey’s HSD was not
applicable for determining the nature of differences as some nonprofits had fewer than two
respondents. Earlier tests did show a significant difference between identification of local
nonprofits and non local nonprofits, with local groups having higher levels of identification.
Combined with the information from table 6.1, these findings demonstrate the importance
of national organizations focusing on connectivity with supporters locally, so they feel more
tied to the national headquarters.
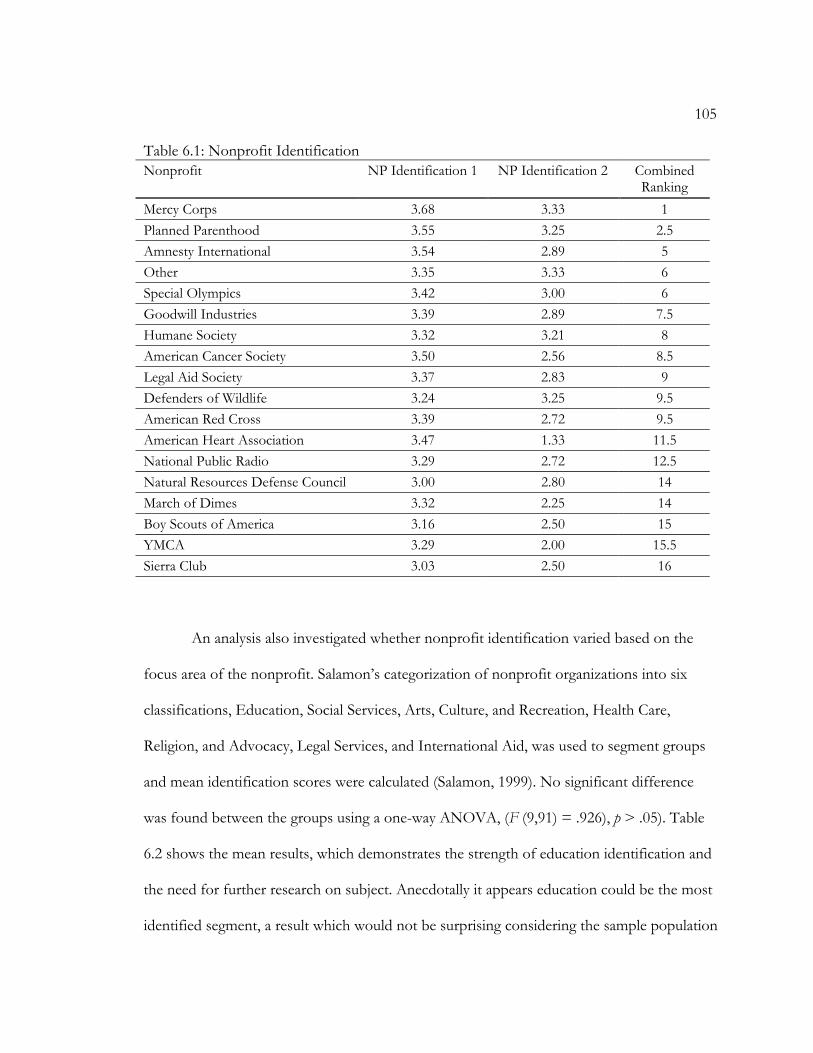
105
Table 6.1: Nonprofit Identification Nonprofit NP Identification 1 NP Identification 2 Combined
Ranking Mercy Corps 3.68 3.33 1 Planned Parenthood 3.55 3.25 2.5 Amnesty International 3.54 2.89 5 Other 3.35 3.33 6 Special Olympics 3.42 3.00 6 Goodwill Industries 3.39 2.89 7.5 Humane Society 3.32 3.21 8 American Cancer Society 3.50 2.56 8.5 Legal Aid Society 3.37 2.83 9 Defenders of Wildlife 3.24 3.25 9.5 American Red Cross 3.39 2.72 9.5 American Heart Association 3.47 1.33 11.5 National Public Radio 3.29 2.72 12.5 Natural Resources Defense Council 3.00 2.80 14 March of Dimes 3.32 2.25 14 Boy Scouts of America 3.16 2.50 15 YMCA 3.29 2.00 15.5 Sierra Club 3.03 2.50 16
An analysis also investigated whether nonprofit identification varied based on the
focus area of the nonprofit. Salamon’s categorization of nonprofit organizations into six
classifications, Education, Social Services, Arts, Culture, and Recreation, Health Care,
Religion, and Advocacy, Legal Services, and International Aid, was used to segment groups
and mean identification scores were calculated (Salamon, 1999). No significant difference
was found between the groups using a one-way ANOVA, (F (9,91) = .926), p > .05). Table
6.2 shows the mean results, which demonstrates the strength of education identification and
the need for further research on subject. Anecdotally it appears education could be the most
identified segment, a result which would not be surprising considering the sample population

106
and their level of schooling. Further research could help determine if institutional factors
exist which currently limit or enhance identification with nonprofits in certain segments of
the nonprofit sector.
Table 6.2: Nonprofit Identification by Type of Cause Cause Focus Area NP Identification 1 NP Identification 2 Combined
Ranking
Education 3.45 3.63 1
Social Services 3.35 3.01 3
Arts, Culture, and Recreation 3.32 3.05 3.5 Health Care 3.34 2.93 4
Religion 3.19 3.42 4 Advocacy, Legal Services, and International Aid 3.30 2.92 5.5
Implications and Recommendations for Businesses
The unequivocal support of CRMs by practitioners demonstrates the level of
acceptance they have gained from consumers, as their application has mushroomed since
American Express’s introduction of CRMs as a mainstream marketing tactic the early 1980s.
Academic analysis has also demonstrated CRMs positive influence on consumer’s attitude
toward the firm, attitude toward the product involved, attitude toward the non-profit, and
brand and retail switching (Berger et al., 1999; Ross et al., 1992; Smith & Alcorn, 1991). This
twin acceptance demonstrates the usefulness of CRMs as a marketing tactic, but also points
to the need for additional understanding of the mechanics prompting its success.
Additionally, because CRMs are everywhere in the marketplace a saturation effect could
require firms to more overtly emphasis points of differentiation from CRM competitors and
to become more strategic in their selection of nonprofit partners. To accomplish this task,

107
marketing practitioners need to understand how consumers interpret CRM partnerships and
what drives their acceptance and purchase intent. This study attempted to shed light on this
issue, investigating how consumers interpret and react to CRM programs through the lens of
organizational identification. The following section details the implications of the research
findings on marketing strategy and offer recommendations of how professionals can act on
these findings so CRMs continue to meet business goals.
Based on the findings, it is apparent nonprofit identification positively impacts CRM
purchase intent for both types of nonprofit supporters, active and latent. The findings also
demonstrate corporate identification occurs at a lower level than nonprofit identification,
although it appears corporate identification improves as frequency of product use increases.
While individuals showed high levels of nonprofit identification, (M=3.32, SD=.39), the
majority of respondents had low levels of identification with the juice or soda manufacturers,
(M=2.94, SD=.40). There was a significant difference between the two measures of
identification, as evidenced by a paired sample t test (t (98) = 7.206, p <.001). Table 6.3
exhibits the individual brand identification.

108
Table 6.3: Corporate Identification Brand Corporate IdentificationHansen's 3.22Odwalla 3.18Blue Sky 3.16Sobe 3.14Snapple 3.02Dr. Pepper 3.02Jones Soda 3.00Other 2.99Sprite 2.957-Up 2.92Diet Pepsi 2.89Sierra Mist 2.89Coke 2.87Mt. Dew 2.67Pepsi 2.64Diet Coke 2.63RC Cola 2.53
Given the study’s findings firms wishing to benefit from CRM programs should give
careful consideration to the selection of a nonprofit partner. The selection of a nonprofit can
be broken into a sequential process, with examples of potential steps explained as follows.
First, because CRM programs can have multiple goals, e.g. increase sales, improve company
image, reach specified target market, etc., the initial step should be the choice of an
overarching CRM program goal, followed by the strategic selection of a nonprofit partner.
The second step, nonprofit selection, should begin with an internal analysis of current
customer’s corporate identification and discovery of the intangible identifiers that make up
the company’s brand DNA. This type of analysis should create a better-segmented market of
potential and current customers, helping to understand the personality traits of customers

109
currently serviced and the traits of unrealized and targeted customers. This is an important
step as while corporate-nonprofit fit was not deemed significant in this study, previous
research studies have found it a significant influencer of CRM acceptance (Basil, 2002).
Once this information is gathered, the search for a partner should become easier as a
firm now has psychographic information of current and targeted customers. The strength of
identification occurs in the next step, matching nonprofit brand identity with the customer
or targeted group identity, which helps narrow the selection pool of nonprofits. The size of
the initial pool to narrow from should be wide, including both local and national nonprofits.
Some limitations should be considered for strategic and practical reasons, for example local
firm and national nonprofit may not be a good match unless the nonprofit operates a local
office or event. Once a pool of potential partners is identified further investigation should be
conducted to determine nonprofit’s membership numbers, current partnerships, donors,
programs currently under operation, and most importantly the level of nonprofit
identification of targeted customers, latent nonprofit supports, and active nonprofit
supporters.
As demonstrated by the findings and shown in figure 6.3, latent supporters path to
CRM purchase intent seems to start with proximity to the nonprofit, which relates to higher
nonprofit identification. Previous research provides support for this assertion as low cause
importance customers were found to be more supportive of CRMs supporting local
nonprofits and those which focused on a cause which was important to them (Landreth,
2002). High cause importance customers in this same study expressed CRM support for
both national and local donations as long as the cause was important to them (Landreth,

110
2002). These results fit with the findings from this study, as low cause importance customers
are similar to latent supporters and high cause importance customers are similar to highly
identified supporters.
Thus, when selecting from the pool of nonprofit partners a firm should be careful to
consider the identification of targeted customers, latent and active nonprofit supporters, and
be sure the nonprofit characteristics fit with the target group. For example, consider if
Hansen’s were analyzing the merits of a CRM program with Mercy Corps, the nonprofit
with the highest identification score, in which they hoped to reach a new customer base.
Through their research Hansen’s would be aware of Mercy Corps’ high identification scores,
which for Mercy Corps supporters seem related to the fact that cause importance overrides
the nonprofits’ lack of local initiatives. The final check would be that the targeted group of
consumers had similar awareness of and levels of identification with Mercy Corps, as latent
and active supporters of just Mercy Corps would not likely provide a significant customer
base to justify a CRM program. Conversely, if Hansen’s were considering a partnership with
the Sierra Club, the nonprofit with the lowest identification score, they would need to be
assured that Sierra Club programs operate in the same market as their target customers.
Figure 6.3: Path to CRM Purchase Intent
Prior Nonprofit Support Nonprofit
Identification
Proximity to Nonprofit
Age
Proximity to Nonprofit
Gender
CRM Purchase Intent
111
Identification is a helpful tool when selecting a nonprofit partner, but for companies
with poor social responsibility records there are other considerations to deliberate about
when selecting a partner. If the firm has a poor corporate social responsibility record, it is
recommended they partner with a nonprofit whose cause relates directly to the area of
criticism, as it shows an intention to address area of concern (Lichtenstein et al., 2004). The
qualifier for this recommendation is that the CRM must be interpreted as a genuine, thus a
simple communication message will likely fail without more substantial corporate
adjustments, signaling legitimate intentions to improve in the area of criticism.
Once the nonprofit partner has been selected, there are some recommendations
related to identification and how to successfully leverage it while managing a CRM
partnership. First, ethical considerations are imperative in the selection of a nonprofit
partner, the internal management of the CRM program, and resulting donation. The growth
of the nonprofit sector and lack of similar growth in the IRS enforcement unit assigned to
nonprofits has left many nonprofits unchecked for years, thus due diligence should be
conducted by any corporation examining a nonprofit partner (ACT, 2004). From a corporate
perspective any abuse of CRM programs is likely to result in a quick backlash for all
programs, as Polonsky and Wood (2001) suggest when discussing the possibility of
corporate malfeasance, “consumers will ultimately catch on to corporate abuses of CRM,
resulting in all programs losing credibility. This point relates directly to the third issue,
pricing clarity. Consumer confusion has been shown to exist at all levels of education, thus
corporations need to ensure donation amounts are not overstated or deceptive (Olsen et al.,
2003).

112
Second, the use of the identification information gleaned during the nonprofit
selection process should be referenced when crafting the communication message, as it can
serve as a useful guide to ensure the message is on target with perceived organizational
identity. Clarity in the message could be aided by focusing on the traits that individuals most
identified with themselves and the nonprofit partner. For example, this study showed
respondents felt most strongly about seven traits when describing the nonprofit, as capable,
sincere, compassionate, a leader, cooperative, fair, high quality, and expert each had a mean
score over 4.00, (1=strongly disagree, 5=strongly agree). When describing themselves
respondents felt most strongly about the following traits, sincere, fair, compassionate,
cooperative, capable, high quality, sensitive, and progressive. Thus, focusing on the traits that
overlapped in significance, sincere, fair, compassionate, cooperative, capable, and high
quality, could aid message clarity. This exercise could be conducted at a nonprofit-individual
level, allowing for a message targeted specifically to their identity overlap.
The final issue for firms considering a CRM program is their industry structure, as
CRM programs seem to be ideally suited for consumer product commodity markets. This is
why the study focused on a product category considered a commodity market, juice and
soda. Because soda and juice products have small variations in price, taste, quality, and
availability, the importance of intangible aspects of the product increases. As the importance
of intangibles increases, the brand and what it represents becomes more valuable as it can
serve as the differentiating factor in consumer product selection. A CRM program has the
ability to positively influence product and firm perceptions (Berger et al., 1999), thus adding
another small differentiating factor to the brand identity. As Liz Howard, director of the
Center for Nonprofit Management at Northwestern University's Kellogg School of

113
Management states, “Consumers with a basically equal product will pay a little bit more for
the product produced by the company that is perceived as a good corporate citizen” (Stock,
2004).
The final qualifier for a successful CRM partnership seems to be a long-term alliance
between the firm and the nonprofit, in which the brand identity of the corporation can start
to take on some of the positive traits of the nonprofit partner. It is recommend to contact
for a minimum of three years, as it allows consumers to cognitively match the association of
the nonprofit and the company and can help companies move towards a mutually beneficial
social alliance (Austin, 2000). Cause-related marketing consultant Lisa Miller comments on
companies who believe CRMs are a quick fix by stating, “A cause-related partnership is like a
marriage, it's not a one-night stand” (Cranston, 2003). The longer time frame not only
provides long-term benefits to the nonprofit, but can also help build competitive advantage
for corporations as it creates additional points of differentiation from competitors
(Lichtenstein et al., 2004). In addition, because commoditization is increasingly common in
consumer product markets the use of CRM programs is not likely to diminish in future
years. When used strategically CRM programs can provide an additional point of
differentiation, helping create competitive advantage for firms that use it adeptly.
Study Limitations
As with any experiment several limitations exist in regards to the study. First, because
this study used a cross sectional quasi experimental design determining causality was not
possible, but elaboration on the significant relationships identified are valid as proper
protocols were followed in regards to internal reliability and validity of the sample

114
(O’Sullivan, Rassel, & Berner, 2003). Second, the use of a quasi experimental research design
limits the ability to generalize about a broader population with certainty, as the sample was
chosen for reasons of parsimony in addition to its relevance to the research question. A
student population, especially those with advanced business education, is likely to be better
educated on corporate motivations of CRM programs, potentially influencing their
responses in comparison to other consumer groups. Third, the online survey method is not
comparable to a realistic purchase environment in which consumers would be confronted
with a CRM program. Analysis of actual purchase behavior, e.g. Lichtenstein et al. 2004,
would provide more certainty of the study’s external validity.
The final limitation is related to the behavior of the two separate variables used to
capture nonprofit identification, which were not significantly correlated. This limitation is
more critical to findings related to corporate identification then nonprofit identification, but
is noted because some ancillary findings are based on the corporate identification and
corporate/nonprofit fit variables. Since the primary recommendations offered were based on
a more direct method of data analysis, nonprofit identification measure two, they are
considered more reliable. Corporate identification, nonprofit identification measure one, and
corporate/nonprofit fit used an indirect method of identification scoring and because of the
inconsistencies found in nonprofit identification should be refined additionally for use in
future research. The indirect method of analysis did provide some intuitive results, e.g.
business students and frequent users of juice/soda products have higher levels of corporate
identification, but a direct approach of assessing corporate identification, similar to nonprofit
identification measure two, should be developed to ensure consistency.

115
Implications for Further Research
The research resulting from this study was developed due to the growing relevance
of identity and identification in the marketing literature. It built upon the theory of CRM
purchase intent being related to nonprofit identification. Previous research focused on the
influence of a nonprofit partner on corporate identification, while this study separated the
identification measures, measuring both corporate identification and nonprofit identification
separately. The results yield important insights on how nonprofit identification influences
CRM purchase intent, as well as influencers leading to more identified nonprofit supporters.
Valuable to both nonprofit and marketing managers, the findings also point to areas of
future research, as many uncertainties still exist and will require additional analysis to better
understand the motives of consumers and nonprofit supporters when presented with a
CRM.
First, nonprofit-corporate fit did not yield a significant result as an influencer of
CRM purchase intent, contrary to prior studies (Basil, 2002). This result is likely due to a
difference in measurement, as respondents in the study were not presented with the CRM
partnership until after assessing each organization’s identity. Because the study did not
measure attitude change, only perceptions of organizational identity, the impact of a CRM
on attitudinal change was not captured and could be investigated in future research. Second,
organizational prestige was not a significant predictor of CRM purchase intent, contrary to
prior research (Cornwell & Coote, 2005; Bhattacharya et al., 1995). It is assumed this is
either a result of a difference in measurement or differences between sample populations.

116
This should prompt further investigation of whether organizational prestige is only
important for specific memberships, or if its value is universal as a significant influencer of
organizational commitment.
Third, as Lichtenstein et al. demonstrated the next frontier of CRM research should
focus on analyzing actual purchase behavior. One area in that may prove rewarding is an
evaluation of the difference between CRM shopping in public bricks and mortar locations
versus the presence of CRM programs in online shopping locations. A recent study by Dr.
Brian Hare and Dr. Terry Burnham may provide direction on this type of research, as they
recently found in an experiment that individuals were more likely to donate when they were
being watched compared to when they were left alone to make donation decisions (Woods,
2005). Their study provides insight into the potential differences that may exist between
online CRM and bricks and mortar CRM, as consumers in physical locations may
instinctively feel like someone is watching them when they make a purchase due to presence
of other shoppers. This could prompt them to preference a CRM good over a non-CRM
good when making a purchase decision. Finally, this study focused on what could be
described as a frivolous product, juice and soda, while prior research has showed consumers
have more favorable attitudes of CRM when the product was frivolous, e.g. hot fudge
sundae, as opposed to utilitarian, e.g. laundry detergent (Strahilevitz & Myers, 1998). Future
researchers may consider investigating whether nonprofit identification varies with the type
of product benefits experienced by the consumer, and if product differences impact CRM
purchase intent.

117
APPENDIX A
E-MAIL TEXT Subject Line: Request for Thesis Help Hello fellow PPPMer (or MBAer). My name is Patrick Carr, I’m a graduate student in business and public policy and have a favor to ask. As part of my graduate requirements I must write a thesis, which I’m currently working on. Completing a thesis requires independent research and it turns out graduate students are a great sample population for my study. Thus I’m hoping you could take 10 minutes to complete this quick and easy survey. As a reward for completing the survey you will be automatically entered into a random drawing for a $50 GIFT CERTIFICATE at the University of Oregon Bookstore. Odds of winning are good as only two departments on campus are being polled, and both have fewer than 125 students enrolled. The focus of my research is aimed toward better understanding the interactions between businesses and nonprofit organizations, in an effort to gain further knowledge of how to best structure these partnerships. To complete the survey all you need to do is click on the web site link below and complete the short questionnaire, which should take less than 10 minutes. If you do not wish to participate, simply discard this e-mail. Responses will be completely anonymous; your name will not appear anywhere in the report. Completing and returning the questionnaire constitutes your consent to participate. If you choose to participate, please COMPLETE THIS SURVEY BY MARCH 11TH, 10 days from now, which will help me graduate on time. This will also give you a good procrastination activity as you prepare for final exams. CLICK HERE TO COMPLETE SURVEY: http://naboo.uoregon.edu/ws/wsb.dll/pcarr/UO.htm If you prefer, you can keep this e-mail for your records. If you have any questions regarding the research, please contact Patrick Carr, at the Public Policy, Planning, & Management Department/Lundquist College of Business, [email protected] or my faculty advisor, Professor Renee Irvin, at the Public Policy, Planning, & Management Department, [email protected]. If you have any questions regarding your rights as a research subject, please contact the Office of Human Subjects Compliance at the University of Oregon at (541) 346-2510. Thank you again for your help. Sincerely, Patrick Carr

118
APPENDIX B
SURVEY QUESTIONS A growing number of nonprofits are using corporate partnerships as an integral part of their fundraising portfolio. In an effort to better understand nonprofits and businesses partnerships this study has been undertaken. If you have any questions or comments about the survey, please contact Patrick Carr at [email protected]. Thank you for your participation. 1) Describe the extent of your philanthropic activity, (giving money), over the past 5 years? 1-None at all 2-I have made one donation to a nonprofit 3-I have made several donations to a nonprofit 4-I regularly make donations to a nonprofit 2) Describe the extent of your volunteer activity, (giving time), over the past 5 years? 1-None at all 2-I have volunteered once for a nonprofit 3-I have volunteered several times for a nonprofit 4-I volunteer regularly for a nonprofit 3) If you HAVE volunteered for or donated money to a nonprofit, which of the following national nonprofit organizations have you donated money to, or volunteered for in the past 5 years? (Select only one; choose the nonprofit which you have supported the most over the past five years) 1-American Cancer Society 2-American Red Cross 3-American Heart Association 4-Amnesty International 5-Boys & Girls Club 6-Boy Scouts of America 7-Defenders of Wildlife 8-Goodwill Industries 9-Humane Society 10-Legal Aid Society 11-March of Dimes 12-Mercy Corps 13-National Audubon Society 14-National Geographic Society 15-National Public Radio

119
16-Natural Resources Defense Council 17-Planned Parenthood 18-Sierra Club 19-Special Olympics 20-YMCA 21-Other (please specify) If you selected other, please specify: 4) If yes, how many years have you been involved with the organization? 1-Less than 1 year 2-1 – 3 years 3-4 – 6 years 4-7 – 9 years 5-Over 9 years 5) If yes, how many hours per month have you spent volunteering for the organization in the past year? 1-Less than 5 hours 2-6 – 10 hours 3-11 – 15 hours 4-16 – 20 hours 5-Over 20 hours 6) If you HAVE NOT volunteered for or donated money to a nonprofit, to which of the following national nonprofit organizations would you be most likely to donate, or volunteer for? (Select only one) 1-American Cancer Society 2-American Red Cross 3-American Heart Association 4-Amnesty International 5-Boys & Girls Club 6-Boy Scouts of America 7-Defenders of Wildlife 8-Goodwill Industries 9-Humane Society 10-Legal Aid Society 11-March of Dimes 12-Mercy Corps 13-National Audubon Society 14-National Geographic Society 15-National Public Radio

120
16-Natural Resources Defense Council 17-Planned Parenthood 18-Sierra Club 19-Special Olympics 20-YMCA 21-Other (please specify) If you selected other, please specify: 7) Describe THE NONPROFIT selected in question 3 or 6 by matching the attributes below along dimensions of agree and disagree. Options: 1-Strongly Disagree, 2-Disagree, 3-No Opinion, 4-Agree, 5-Strongly Agree "Activist" accurately describes nonprofit selected: "Capable" accurately describes nonprofit selected: "Dishonest" accurately describes nonprofit selected: "Innovative" accurately describes nonprofit selected: "Enlightened" accurately describes nonprofit selected: "A leader" accurately describes nonprofit selected: "Expert" accurately describes nonprofit selected: "Progressive" accurately describes nonprofit selected: "Compassionate" accurately describes nonprofit selected: "Fair" accurately describes nonprofit selected: "Risk averse" accurately describes nonprofit selected: "Conservative" accurately describes nonprofit selected: "High quality" accurately describes nonprofit selected: "Sincere" accurately describes nonprofit selected: "Cooperative" accurately describes nonprofit selected: "Inconsiderate" accurately describes nonprofit selected: "Sensitive" accurately describes nonprofit selected: "Democratic" accurately describes nonprofit selected: "Inefficient" accurately describes nonprofit selected: 8) Please select the statement which best describes THE NONPROFIT selected in question 3 or 6: 1-The organization is first class in comparison to other nonprofits 2-The organization is well thought of in the local community 3-The organization is comparable to other nonprofits 4-The organization is not quite as important as other nonprofits 5-The organization is not first class in comparison to other nonprofits

121
9) Please select the statement which best fits your feelings about THE NONPROFIT selected in questions 3 or 6: Options: 1-Strongly Disagree, 2-Disagree, 3-No Opinion, 4-Agree, 5-Strongly Agree When someone criticizes the nonprofit selected it feels like a personal insult. I am very interested in what others think about the nonprofit. When I talk about the nonprofit, I usually say "we" rather than "they". The successes of the nonprofit are my successes. If a story in the media criticized the nonprofit, I would feel embarrassed/angered. When someone praises the nonprofit, it feels like a personal compliment. 10) Describe YOURSELF by matching the attributes below along dimensions of agree and disagree. Options: 1-Strongly Disagree, 2-Disagree, 3-No Opinion, 4-Agree, 5-Strongly Agree "Activist" accurately describes me: "Capable" accurately describes me: "Dishonest" accurately describes me: "Innovative" accurately describes me: "Enlightened" accurately describes me: "A leader" accurately describes me: "Expert" accurately describes me: "Progressive" accurately describes me: "Compassionate" accurately describes me: "Fair" accurately describes me: "Risk averse" accurately describes me: "Conservative" accurately describes me: "High quality" accurately describes me: "Sincere" accurately describes me: "Cooperative" accurately describes me: "Inconsiderate" accurately describes me: "Sensitive" accurately describes me: "Democratic" accurately describes me: "Inefficient" accurately describes me: 11) Which juice or soda PRODUCT do you most often purchase for yourself or family? 1-7-Up 2-Blue Sky 3-Coke 4-Diet Coke 5-Diet Pepsi 6-Dr. Pepper

122
7-Hansen's 8-Jones Soda 9-Mt. Dew 10-Odwalla 11-Pepsi 12-Snapple 13-Sprite 14-Sierra Mist 15-Sobe 16-RC Cola 17-Nantucket Nectars 18-Other (please specify) If you selected other, please specify: 12) Describe THE BRAND selected in the previous question by matching the attributes below along dimensions of agree and disagree. Options: 1-Strongly Disagree, 2-Disagree, 3-No Opinion, 4-Agree, 5-Strongly Agree "Activist" accurately describes the brand: "Capable" accurately describes the brand: "Dishonest" accurately describes the brand: "Innovative" accurately describes the brand: "Enlightened" accurately describes the brand: "A leader" accurately describes the brand: "Expert" accurately describes the brand: "Progressive" accurately describes the brand: "Compassionate" accurately describes the brand: "Fair" accurately describes the brand: "Risk averse" accurately describes the brand: "Conservative" accurately describes the brand: "High quality" accurately describes the brand: "Sincere" accurately describes the brand: "Cooperative" accurately describes the brand: "Inconsiderate" accurately describes the brand: "Sensitive" accurately describes the brand: "Democratic" accurately describes the brand: "Inefficient" accurately describes the brand:

123
13) How often do you purchase THE BRAND selected? 1-Over 3 times per week 2-2-3 times per week 3-1 time per week 4-Every other week 5-Once a month or less 6-Never, don't drink juice or soda 14) Please respond to each factor listed below by choosing the option (most important to least important) that best describes its importance to you when picking a soda or juice. Options: 1-Most Important, 2-More Important, 3-No Opinion, 4-Less Important, 5-Least Important Availability/Convenience Corporate Responsibility Frequency of Promotions (e.g. prizes) Price Product Quality Taste Quality of Promotions (e.g. Prizes) 15) If the NONPROFIT and the PRODUCT you selected earlier were to partner for a promotion and A PERCENTAGE OF EVERY PURCHASE was donated to the nonprofit, how would it affect your likelihood to purchase the product? 1-Much more likely to purchase the product 2-More likely to purchase the product 3-No change in behavior 4-Less likely to purchase the product 5-Much less likely to purchase the product 16) How would it affect your support of the nonprofit partner? 1-Much more likely to volunteer or donate 2-More likely to volunteer or donate 3-No change in behavior 4-Less likely to volunteer or donate 5-Much less likely to volunteer or donate

124
17) Please respond to each statement below by rating your level of agreement varying from strongly agree to strongly disagree Options: 1-Strongly Disagree, 2-Disagree, 3-No Opinion, 4-Agree, 5-Strongly Agree Socially responsible behavior detracts from companies' ability to provide the best possible products Socially responsible behavior by firms is often a cover-up for inferior product offerings Socially responsible firms produce worse products than do firms that do not worry about social responsibility All else equal, a socially responsible firm is likely to have lower technological expertise than a firm that is not socially responsible Firms that devote resources towards socially responsible actions have fewer resources available for increasing employee effectiveness A company can be both socially responsible and manufacture products of high value 18) Gender: 1-Male 2-Female 19) Age: 20) Zip Code: 21) Thank you for completing this survey. Your assistance is greatly appreciated. If you would like to be eligible for the $50 dollar University of Oregon Bookstore gift certificate please submit your e-mail address below. The winner will be notified by March 28th.

125
APPENDIX C
FOLLOW UP E-MAIL TEXT Hello again. I just wanted to offer a quick reminder that you are eligible to enter a contest for a $50 gift certificate at the University of Oregon Bookstore. To enter yourself all you need to do is take 10 minutes to complete a quick and easy survey. In addition to the potential reward, you will also be assisting me in graduating on time, a goal I’m sure all of you can relate to. To complete the survey all you need to do is click on the web site link below and complete the short questionnaire at the linked website, which should take less than 10 minutes. Responses will be completely anonymous; your name will not appear anywhere in the report. Completing and returning the questionnaire constitutes your consent to participate. CLICK HERE TO COMPLETE SURVEY: http://naboo.uoregon.edu/ws/wsb.dll/pcarr/UO.htm Thank you again for your help. Sincerely, Patrick Carr
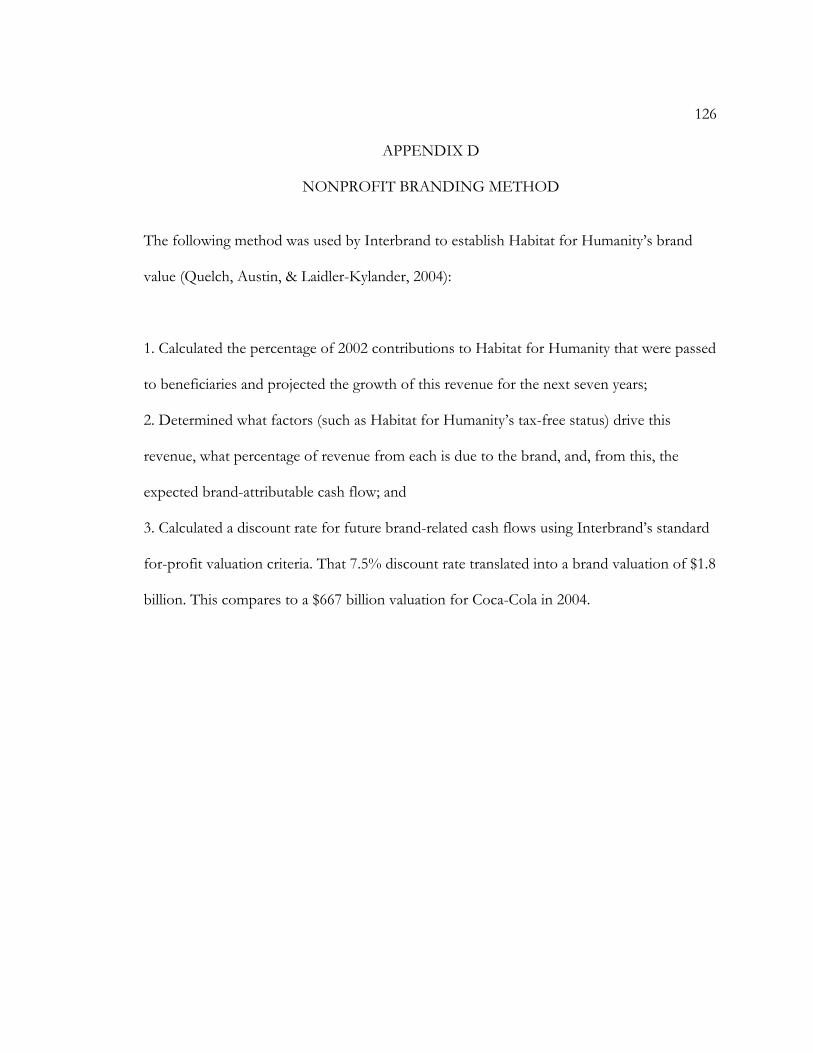
126
APPENDIX D
NONPROFIT BRANDING METHOD
The following method was used by Interbrand to establish Habitat for Humanity’s brand
value (Quelch, Austin, & Laidler-Kylander, 2004):
1. Calculated the percentage of 2002 contributions to Habitat for Humanity that were passed
to beneficiaries and projected the growth of this revenue for the next seven years;
2. Determined what factors (such as Habitat for Humanity’s tax-free status) drive this
revenue, what percentage of revenue from each is due to the brand, and, from this, the
expected brand-attributable cash flow; and
3. Calculated a discount rate for future brand-related cash flows using Interbrand’s standard
for-profit valuation criteria. That 7.5% discount rate translated into a brand valuation of $1.8
billion. This compares to a $667 billion valuation for Coca-Cola in 2004.

127
APPENDIX E
501 (C)(3) DEFINITION
UNITED STATES CODE ANNOTATED TITLE 26. INTERNAL REVENUE CODE SUBTITLE A--INCOME TAXES CHAPTER 1--NORMAL TAXES AND SURTAXES SUBCHAPTER F--EXEMPT ORGANIZATIONS PART I--GENERAL RULE § 501. Exemption from tax on corporations, certain trusts, etc. (a) Exemption from taxation. --An organization described in subsection (c) or (d) or section 401(a) shall be exempt form taxation under this subtitle unless such exemption is denied under section 502 or 503. (b) Tax on unrelated business income and certain activities. --An organization exempt from taxation under subsection (a) shall be subject to tax to the extent provided in parts II, III, and VI of this subchapter, but (notwithstanding parts II, III, and VI of this subchapter) shall be considered an organization exempt from income taxes for the purpose of any law which refers to organizations exempt from income taxes. (c) List of exempt organizations.--The following organizations are referred to in subsection (a):
(1) Any corporation organized under Act of Congress which is an instrumentality of the United States but only if such corporation--
(A) is exempt from Federal income taxes--
(i) under such Act as amended and supplemented before July 18, 1984, or (ii) under this title without regard to any provision of law which is not contained in this title and which is not contained in a revenue Act, or
(B) is described in subsection (1).
(2) Corporations organized for the exclusive purpose of holding title to property, collecting income therefrom, and turning over the entire amount thereof, less expenses, to an organization which itself is exempt under this section. Rules similar to the rules of subparagraph (G) of paragraph (25) shall apply for purposes of this paragraph. (3) Corporations, and any community chest, fund, or foundation, organized and operated exclusively for religious, charitable, scientific, testing for public safety, literary, or educational purposes, or to foster national or international amateur sports competition (but only if no part of its activities involve the provision of athletic facilities or equipment), or for the prevention of cruelty to children or animals, no part of the net earnings of which insures to the benefit of any private shareholder or individual, no substantial part of the activities of which is carrying on propaganda, or otherwise attempting, to influence legislation (except as otherwise provided in subsection (h)), and which does not participate in, or intervene in (including the publishing or distributing of statements), any political campaign on behalf of (or in opposition to) any candidate for public office.
Source: I.R.C. § 501(c)(3)

128
APPENDIX F
SURVEY RESULTS
Section 1: Philanthropic or Volunteer Activity Describe the extent of your philanthropic activity, (giving money), over the past 5 years?
None at all I have made one
donation to a nonprofit
I have made several donations
to a nonprofit
I regularly make donations to a
nonprofit Percentage 13.4% 16.1% 51.8% 18.8%
Count 15 18 58 21 Describe the extent of your volunteer activity, (giving time), over the past 5 years?
None at all I have
volunteered once for a nonprofit
I have volunteered
several times for a nonprofit
I volunteer regularly for a
nonprofit
Percentage 14.3% 14.3% 46.4% 25% Count 16 16 52 28
If you have volunteered or donated money to a nonprofit, how many years have you been involved with the organization?
Less than 1 year 1-3 years 4-6 years 7-9 years Over 9 years
Percentage 18.4% 47.6% 19.4% 4.9% 9.7% Count 19 49 20 5 10
If you have volunteered or donated money to a nonprofit, how many hours per month have you spent volunteering for the organization in the past year?
Less than 5 hours 6-10 hours 11-15 hours 16-20 hours Over 20
hours Percentage 65.6% 17.7% 5.2% 4.2% 7.3%
Count 63 17 5 4 7
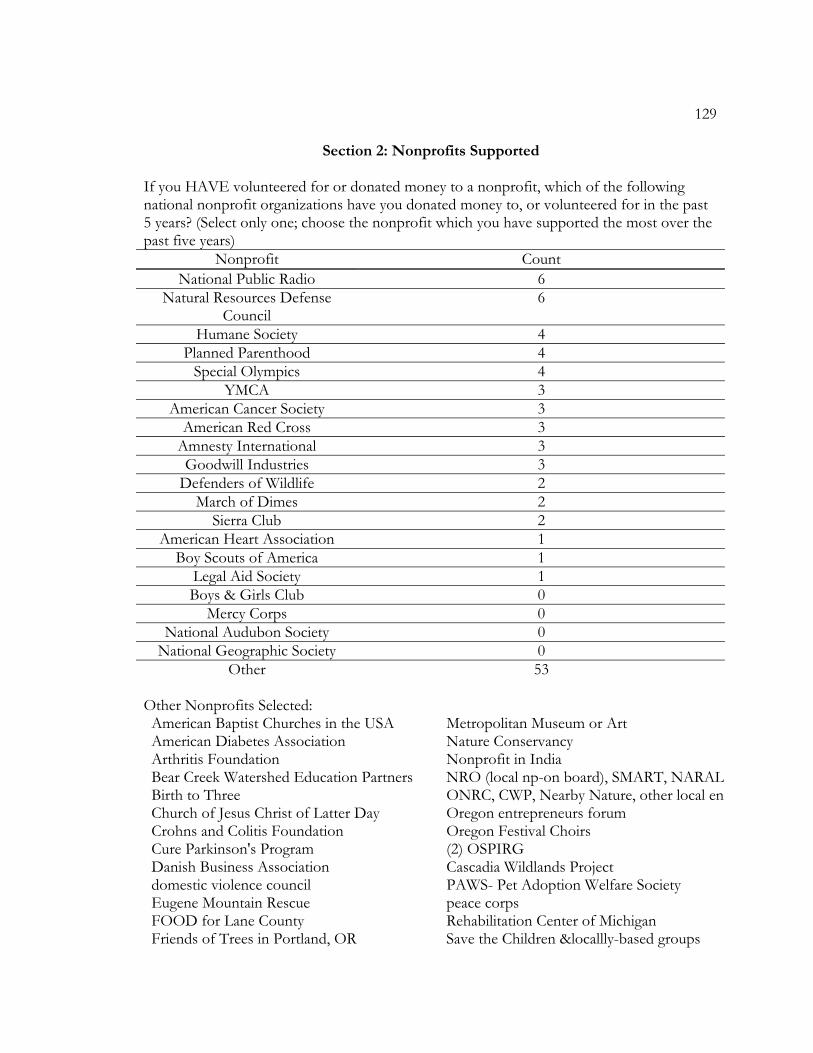
129
Section 2: Nonprofits Supported
If you HAVE volunteered for or donated money to a nonprofit, which of the following national nonprofit organizations have you donated money to, or volunteered for in the past 5 years? (Select only one; choose the nonprofit which you have supported the most over the past five years)
Nonprofit Count National Public Radio 6
Natural Resources Defense Council
6
Humane Society 4 Planned Parenthood 4
Special Olympics 4 YMCA 3
American Cancer Society 3 American Red Cross 3
Amnesty International 3 Goodwill Industries 3
Defenders of Wildlife 2 March of Dimes 2
Sierra Club 2 American Heart Association 1
Boy Scouts of America 1 Legal Aid Society 1 Boys & Girls Club 0
Mercy Corps 0 National Audubon Society 0
National Geographic Society 0 Other 53
Other Nonprofits Selected: American Baptist Churches in the USA Metropolitan Museum or Art American Diabetes Association Nature Conservancy Arthritis Foundation Nonprofit in India Bear Creek Watershed Education Partners NRO (local np-on board), SMART, NARALBirth to Three ONRC, CWP, Nearby Nature, other local enChurch of Jesus Christ of Latter Day Oregon entrepreneurs forum Crohns and Colitis Foundation Oregon Festival Choirs Cure Parkinson's Program (2) OSPIRG Danish Business Association Cascadia Wildlands Project domestic violence council PAWS- Pet Adoption Welfare Society Eugene Mountain Rescue peace corps FOOD for Lane County Rehabilitation Center of Michigan Friends of Trees in Portland, OR Save the Children &locallly-based groups

130
(4) Habitat for Humanity Sexual Assault Support Services (2) Human Rights Campaign Shavers Fork Coalition KBOO community radio, Portland Snohomish County Health and Safety KRVM radio station Society of Environmental Journalists Lane County Food Policy Council St, Vincent De Paul, Various Church LDS Church Humanitarian Fund Statewide Nonprofit League of Conservation Voters Student Conservation Association (2) local church Susan G. Koleman Breast Cancer local homeless shelter, Portland OR (4) United Way local organizations only United Way, WOW hall, paralyzed vets USA Local, not national nonprofits Willama Restoration Project Margham, Inc. (www.margham.org)
If you have NOT volunteered for or donated money to a nonprofit, to which of the following national nonprofit organizations would you be most likely to donate, or volunteer for? (Select only one)
Nonprofit Count National Public Radio 3 Amnesty International 1 Goodwill Industries 1
Humane Society 0 American Red Cross 0 Planned Parenthood 0
Sierra Club 0 Boy Scouts of America 0
Boys & Girls Club 0 Special Olympics 0
YMCA 0 American Cancer Society 0
Natural Resources Defense Council
0
Defenders of Wildlife 0 March of Dimes 0
American Heart Association 0 Legal Aid Society 0
Mercy Corps 0 National Audubon Society 0
National Geographic Society 0 Other 3
Other Nonprofits Selected:
• Breast Cancer • Oregon Public Broadcasting • Head Start

131
Section 3: Identification Exercises Respondents matched the attributes provided below based on their opinion of the nonprofit they have supported in the past 5 years or were most likely to support.
Strongly Disagree Disagree No Opinion Agree Strongly
Agree Activist 13.4% 28.6% 17.9% 25% 15.2% Capable 1.8% 2.7% 4.5% 49.5% 41.4%
Dishonest 77.7% 16.1% 2.7% .9% 2.7% Innovative 1.8% 10.7% 20.5% 48.2% 18.8%
Enlightened .9% 4.5% 23.2% 47.3% 24.1% A Leader .9% 5.4% 9.8% 48.2% 35.7% Expert .9% 7.2% 10.8% 52.3% 28.8%
Progressive 3.6% 6.3% 14.3% 46.4% 29.5% Compassionate .9% 3.6% 12.5% 36.6% 46.4%
Fair .9% 3.6% 11.7% 55.9% 27.9% Risk Averse 7.1% 25% 48.2% 16.1% 3.6% Conservative 22.3% 29.5% 23.2% 21.4% 3.6% High Quality 1.8% 2.7% 10.7% 57.1% 27.7%
Sincere .9% .9% 8.0% 46.4% 43.8% Cooperative .9% 1.8% 17.9% 47.3% 32.1%
Inconsiderate 63.4% 27.7% 6.3% 1.8% .9% Sensitive 1.8% 6.3% 22.3% 43.8% 25.9%
Democratic 0% 4.5% 35.7% 45.5% 14.3% Inefficient 29.5% 47.3% 14.3% 7.1% 1.8%
Please select the statement which best fits your feelings about the nonprofit selected:
Strongly Disagree Disagree No
Opinion Agree Strongly Agree
When someone criticizes the nonprofit selected it feels like a personal insult
4.5% 22.7% 24.5% 35.5% 12.7%
I am very interested in what others think about the nonprofit
6.3% 17.1% 29.7% 32.4% 14.4%
When I talk about the nonprofit, I usually say "we" rather than "they"
19.1% 44.5% 17.3% 12.7% 6.4%
The successes of the nonprofit are my successes
8.2% 30.9% 21.8% 30.9% 8.2%
If a story in the media criticized the nonprofit, I would feel embarrassed/angered
8.2% 19.1% 16.4% 46.4% 10%
When someone praises the nonprofit, it feels like a personal compliment
9% 31.5% 21.6% 32.4% 5.4%

132
Respondents matched the attributes provided below based on their opinion of themselves. THE PERSONAL Attribute Matching Exercise
Strongly Disagree Disagree No Opinion Agree Strongly
Agree Activist 8% 39.3% 13.4% 33% 6.3% Capable 0% 0% 1.8% 67% 31.3%
Dishonest 71.4% 25.9% .9% 1.8% 0% Innovative 0% 3.6% 20.7% 66.7% 9%
Enlightened 0% 0% 15.2% 73.2% 11.6% A Leader 0% 4.5% 14.3% 59.8% 21.4% Expert 1.8% 17% 29.5% 46.4% 5.4%
Progressive .9% 2.7% 10.7% 61.6% 24.1% Compassionate 0% 2.7% 5.4% 48.2% 43.8%
Fair 0% 0% 3.6% 58.6% 37.8% Risk Averse 5.4% 36.6% 20.5% 35.7% 1.8% Conservative 29.5% 39.3% 11.6% 17% 2.7% High Quality 0% 0% 13.4% 63.4% 23.2%
Sincere 0% .9% 3.6% 54.5% 41.1% Cooperative 0% .9% 3.6% 60.7% 34.8%
Inconsiderate 46.8% 46.8% 5.4% .9% 0% Sensitive 0% 4.5% 10.7% 58.9% 25.9%
Democratic .9% 2.7% 14.5% 61.8% 20% Inefficient 35.7% 50.9% 7.1% 5.4% .9%

133
Respondents matched the attributes provided below based on their opinion of the brand they selected as the juice or soda product they are most likely to purchase. THE BRAND Attribute Matching Exercise
Strongly Disagree Disagree No Opinion Agree Strongly
Agree Activist 13.2% 21.7% 48.1% 14.2% 2.8% Capable 3.8% 1.9% 41.5% 48.1% 4.7%
Dishonest 18.9% 35.8% 40.6% 2.8% 1.9% Innovative 3.8% 8.5% 36.8% 40.6% 10.4%
Enlightened 2.8% 13.2% 50% 27.4% 6.6% A Leader 3.8% 5.7% 33% 42.5% 15.1% Expert 2.8% 5.7% 52.8% 28.3% 10.4%
Progressive 2.8% 14.2% 40.6% 34.9% 7.5% Compassionate 5.7% 15.1% 58.5% 18.9% 1.9%
Fair 5.7% 7.6% 65.7% 17.1% 3.8% Risk Averse 5.7% 21.7% 60.4% 9.4% 2.8% Conservative 10.4% 21.7% 50.0% 13.2% 4.7% High Quality .9% 2.8% 23.6% 34.9% 37.7%
Sincere 1.9% 10.4% 64.2% 18.9% 4.7% Cooperative 2.8% 5.7% 78.3% 10.4% 2.8%
Inconsiderate 12.3% 27.4% 57.5% 1.9% .9% Sensitive 4.7% 12.3% 70.8% 9.4% 2.8%
Democratic 4.7% 8.5% 75.5% 9.4% 1.9% Inefficient 16% 30.2% 52.8% .9% 0%
Section 4: Nonprofit Organizational Prestige
Please select the statement which best describes the nonprofit you have selected:
Percentage The organization is first class in comparison to other nonprofits 39.3% The organization is well thought of in the local community 46.4% The organization is comparable to other nonprofits 10.7% The organization is not quite as important as other nonprofits 3.6% The organization is not first class in comparison to other nonprofits 0%
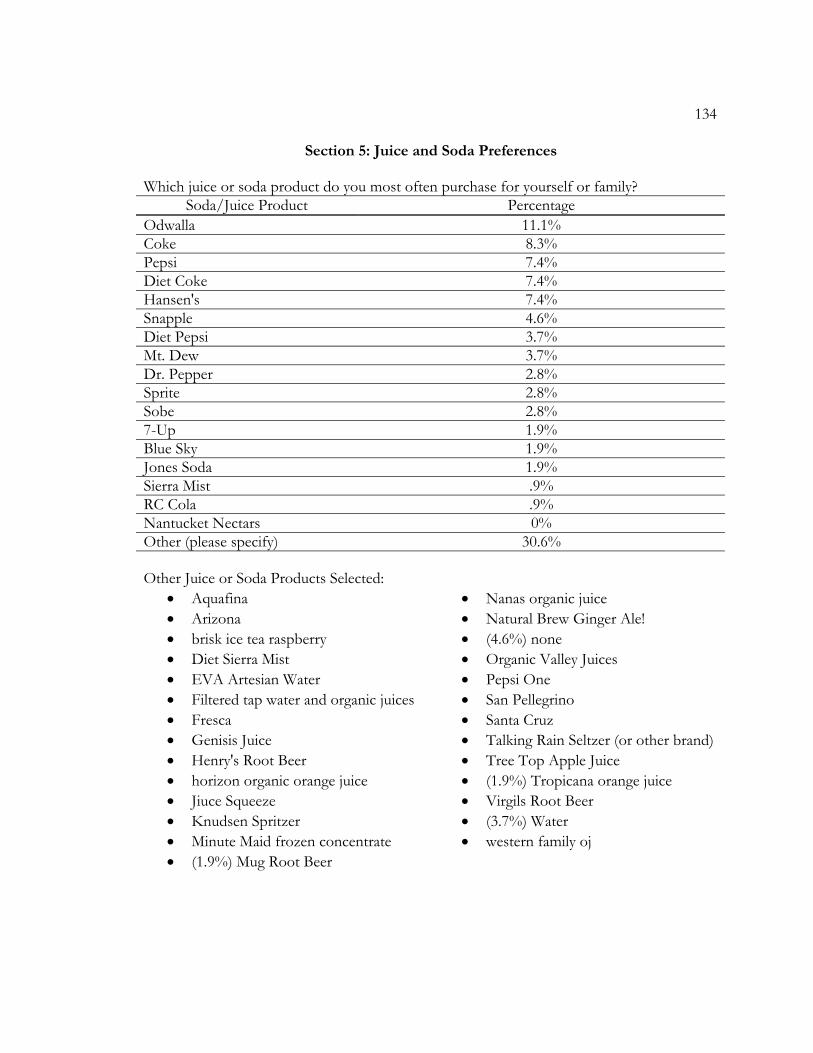
134
Section 5: Juice and Soda Preferences Which juice or soda product do you most often purchase for yourself or family?
Soda/Juice Product Percentage Odwalla 11.1% Coke 8.3% Pepsi 7.4% Diet Coke 7.4% Hansen's 7.4% Snapple 4.6% Diet Pepsi 3.7% Mt. Dew 3.7% Dr. Pepper 2.8% Sprite 2.8% Sobe 2.8% 7-Up 1.9% Blue Sky 1.9% Jones Soda 1.9% Sierra Mist .9% RC Cola .9% Nantucket Nectars 0% Other (please specify) 30.6% Other Juice or Soda Products Selected:
• Aquafina • Nanas organic juice • Arizona • Natural Brew Ginger Ale! • brisk ice tea raspberry • (4.6%) none • Diet Sierra Mist • Organic Valley Juices • EVA Artesian Water • Pepsi One • Filtered tap water and organic juices • San Pellegrino • Fresca • Santa Cruz • Genisis Juice • Talking Rain Seltzer (or other brand) • Henry's Root Beer • Tree Top Apple Juice • horizon organic orange juice • (1.9%) Tropicana orange juice • Jiuce Squeeze • Virgils Root Beer • Knudsen Spritzer • (3.7%) Water • Minute Maid frozen concentrate • western family oj • (1.9%) Mug Root Beer

135
How often do you purchase THE BRAND selected?
Frequency Percentage Over 3 times per week 2.8% 2-3 times per week 12.8% 1 time per week 18.3% Every other week 27.5% Once a month or less 33% Never, don’t drink juice or soda 5.5% Purchase factor importance when selecting a soda or juice
Most Important
More Important No Opinion Less
Important Least
Important Availability/ Convenience
9.3% 53.7% 7.4% 21.3% 8.3%
Corporate Responsibility
10.3% 35.5% 15.9% 26.2% 12.1%
Frequency of Promotions (e.g. prizes)
0% 10.2% 7.4% 31.5% 50.9%
Price 8.3% 48.1% 10.2% 28.7% 4.6% Product Quality
46.2% 47.2% 4.7% .9% .9%
Taste 63.9% 34.3% .9% .9% 0% Quality of Promotions (e.g. prizes)
1.9% 2.8% 11.3% 29.2% 54.7%
Section 6: CRM Impact on Purchase Intention and Nonprofit Support
If the NONPROFIT and the PRODUCT you selected earlier were to partner for a promotion and A PERCENTAGE OF EVERY PURCHASE was donated to the nonprofit, how would it affect your likelihood to purchase the product?
Much more likely to
purchase the product
More likely to purchase the product
No change in behavior
Less likely to purchase the
product
Much less likely to
purchase the product
Frequency 23.6% 52.7% 21.8% .9% .9%

136
How would the promotion impact your support of the nonprofit partner?
Much more likely to
volunteer or donate
More likely to volunteer or donate
No change in behavior
Less likely to volunteer or
donate
Much less likely to
volunteer or donate
Frequency 4.5% 15.3% 75.7% 2.7% 1.8%
Section 7: Socially Responsible Business Views Opinion of Socially Responsible Business Practices
Strongly Disagree Disagree No
Opinion Agree Strongly Agree
Socially responsible behavior detracts from companies' ability to provide the best possible products
63.4% 29.5% 3.6% 2.7% .9%
Socially responsible behavior by firms is often a cover-up for inferior product offerings
33.3% 41.5% 13.5% 11.7% 0%
Socially responsible firms produce worse products than do firms that do not worry about social responsibility
57.7% 32.4% 8.1% .9% .9%
All else equal, a socially responsible firm is likely to have lower technological expertise than a firm that is not socially responsible
53.6% 33% 10.7% 1.8% .9%
Firms that devote resources towards socially responsible actions have fewer resources available for increasing employee effectiveness
49.1% 30.4% 11.6% 8% .9%
A company can be both socially responsible and manufacture products of high value
0% 0% 1.8% 20.5% 77.7%
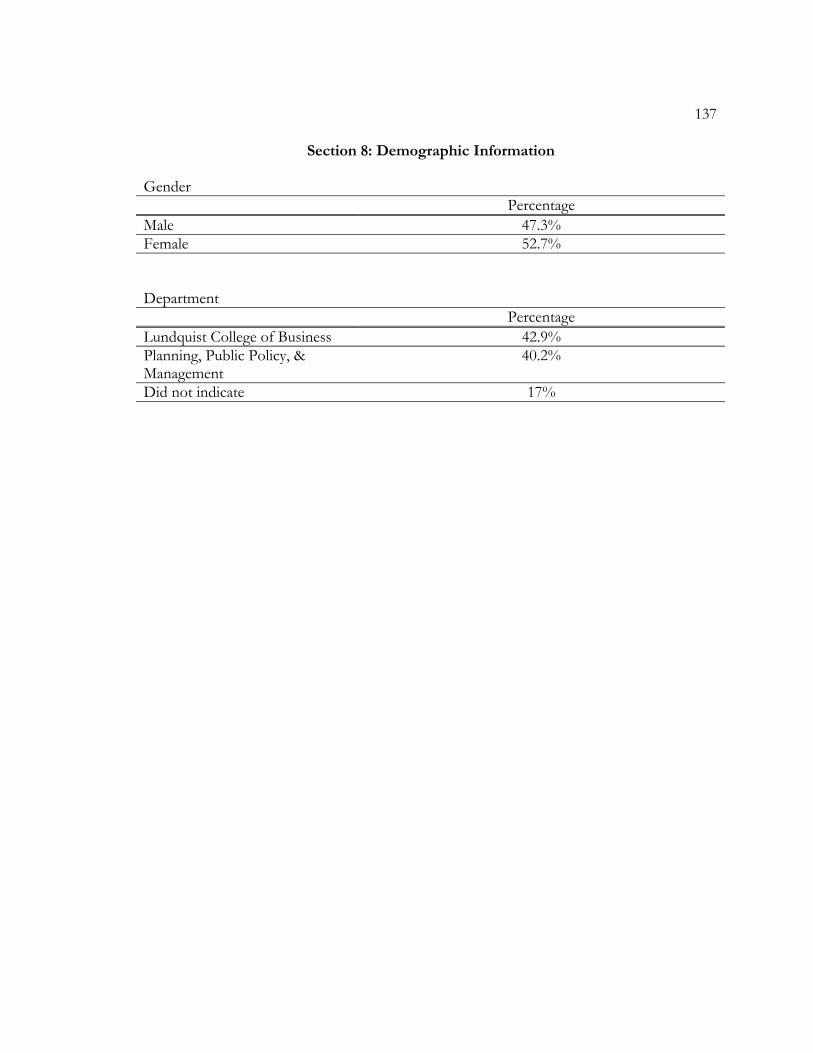
137
Section 8: Demographic Information Gender
Percentage Male 47.3% Female 52.7%
Department Percentage
Lundquist College of Business 42.9% Planning, Public Policy, & Management
40.2%
Did not indicate 17%

138
BIBLIOGRAPHY Aaker, D. (1996). Building Strong Brands. The Free Press, New York, NY. Advisory Committee on Tax Exempt and Government Entities (ACT) (2004, June 9) Third
Report of the ACT. United States Internal Revenue Service. Alameda Times-Star. Raising awareness about awareness-raising products. (2004, October
11) Alameda Times-Star. Albert, S. & Whetten, D.A. (1985). “Organizational identity.” In Research in Organizational
Behavior, L.L. Cummings & B.M. Staw, eds. Greenwich, CT: JAI, 263-195. Alloy Press Release. (2001, November). Charities, Giving and Teens. BPM: Beats per Minute
Online Newsletter. New York, NY: Alloy Y-Access, Triple Dot Communications & Alloy, Inc.
Andreasen, Alan (1996 November/December). Profits for nonprofits: Find a corporate
partner, Harvard Business Review, 74, 47-59. Andreoni, James. (1989). Giving with Impure Altruism: Applications to Charity and
Ricardian Equivalence. Journal of Political Economy 97(6), 1447-58. Andreoni, James. (1990). Impure Altruism and Donations to Public Goods: A Theory of
Warm-Glow Giving? Economic Journal 100(??), 464-77. Aronson, Elliot (1992), “The Return of the Repressed: Dissonance Theory Makes a
Comeback,” Psychological Inquiry, 3 (4), 303-311. Ashforth, Blake E. (1998). “Becoming: How Does the Process of Identification Unfold?” in
Identity in Organizations, David A. Whetten and Paul C. Godfrey, eds. Thousand Oaks, CA: Sage Publications, 213–22.
Ashforth, B.E. & Mael, F.A. (1989). Social identity theory and the organization. Academy of
Management Review, 14(1), 20-39. Austin, James E. (2000). The Collaboration Challenge. San Francisco, CA: Jossey-Bass
Publishers.

139
Barone, M.J., Miyazaki, A.D., & Taylor, K.A. (2000). The influence of cause related marketing on consumer choice: Does one good turn deserve another? Journal of Management Science, 28(2), 248-262.
Basil, Debra. (2002). Cause-Related Marketing and Consumer Attitudes: The Effects of
Balance and Fit on Cognitive Processing. Unpublished doctoral dissertation, University of Colorado at Boulder.
Belcher, J. R., Fandetti, D., & Cole, D. (2004, April) Is Christian Religious Conservatism
Compatible with the Liberal Social Welfare State? Social Work, 49(2), 269-276. Benezra, K. (1996). Cause and effects marketing. Brandweek. 37(17), 38-40. Berger, Ida E., Cunningham, Peggy H. & Drumwright, Minette E. (2004, Fall), “Social
Alliances: Company/Nonprofit Collaboration,” California Management Review, (47)1, 58-91.
Berger, Ida E., Cunningham, Peggy H., & Kozinets, Robert V. (1999). Consumer Persuasion
Through Cause-Related Advertising. Advances in Consumer Research, 26(1), 491-498. Bhattacharya, C.B., Rao, Hayagreeva, & Glynn, Mary Ann (1995, October). “Understanding
the Bond of Identification: An Investigation of Its Correlates Among Art Museum Members,” Journal of Marketing, 59(4), 46–57.
Bhattacharya, C.B. & Sankar Sen. (2003, April). “Consumer–Company Identification: A
Framework for Understanding Consumers’ Relationships with Companies,” Journal of Marketing, 67, 76–88.
Blockbuster Press Release. (2004, October 18). Blockbuster Increases Support for the Fight
Against Breast Cancer With Release of New Blockbuster Gift Card. Dallas, TX: Blockbuster, Inc.
Bloomenthal, Harold S. (2002). Sarbanes-Oxley Act in Perspective 2002-2003 Edition. Eagan,
MN: West Group’s Bradley, Bill, Jansen, Paul, & Silverman, Lee. (2003, May). The Nonprofit Sectors $100
Billion Opportunity. Harvard Business Review, 81(9), 94-103. Brand Strategy Briefing. (2004, September 15). Global forecast for 2004. Brand Strategy, 58. Breast Cancer Action Press Release. (2004, September 28). Barbara Ehrenreich, Breast
Cancer Action Say: “Before You Give Another Nickel or Dime to Breast Cancer Research, Think Before You Pink.” San Francisco, CA: Breast Cancer Action.

140
Brodhead, Tim. (2004, December 3). Excerpt of Speech Titled: Philanthropy in the Era of Globalization. Presented at Community Foundations Symposium on a Global Movement in Berlin, Germany.
Bronn, Peggy Simic & Vrioni, Albana Bellui. (2001). Corporate social responsibility and
cause-related marketing: an overview. International Journal of Advertising, 20(2), 207-222. Brown, T.J. & Dancin, P.A. (1997, January). The company and the product: Corporate
associations and consumer product responses. Journal of Marketing, 61, 68-84 Burlingame, Dwight F. (2001). The Corporate Support Marketplace. Greenfield, James M.
The Nonprofit Handbook: Fundraising, 3rd Edition. New York: NY: John Wiley & Sons.
Business Week. (2004, August 2). The 100 Top Brands. Issue 3894, 68-72. Cialdini, R.B., Borden, R.J., Thorne, A. Walker, M.R., Freeman, S., & Sloan, L.R. (1976).
Basking in reflected glory: three (football) field studies. Journal of Personality and Social Psychology, 34, 366-375.
Cone Communications Press Release. (2002, October 2)New National Survey Finds
Americans Intend to Punish Corporate “Bad Guys,” Reward Good Ones. Boston, MA: Cone, Inc.
Conlin, M., Hempel, J., Tanzer, J. & Polek, J. (2003, December 1). Philanthropy 2003: The
Corporate Donors. Business Week, 3860. Conlin, M., Tanzer, J. & Polek, J. (2004, November 29). Philanthropy 2004: The Corporate
Givers. Business Week, 3910, 100-104. Cooperman, Alan. (2005, January 26). Cause and Effect: Tsunami Aid is Goodwill and Good
Business. The Washington Post, E01. Cornwell, Bettina T. & Coote, Leonard V. (2005, March) Corporate sponsorship of a cause:
the role of identification in purchase intent. Journal of Business Research, 58(3), 268-275. Cranston, Belinda. (2003, February 5). The pitfalls of cause marketing. B&T Weekly,
(Australia) Dahl, Darren & Anne M. LaVack. (1995). “Cause Related Marketing: Impact of Size of
Cause-Related Promotion on Consumer Perception and Participation,” in Marketing Theory and Applications: American Marketing Association Winter Educators Conference, David W. Stewart and Naufel J. Vilcassim eds.,Chicago: American Marketing Association, 6, 476-481.

141
Dallek, Robert. (2004, November 5). U.S. Presidential Election: Will Bush Deepen the Antagonisms in my Country? The Independent London: England, 39.
Davidson, J. (1997). Cancer sells. Working Women, 22, 36-39. Drumwright, M.E. & Murphy, P. (2001). Corporate societal marketing. In The handbook of
marketing and society, edited by P.N. Bloom and G.T. Gundlach, 168-183. Thousand Oaks, CA: Sage Publications.
Duncan, T. & Moriarty, S. (1997). Driving Brand Value: Using Integrated Marketing to
Manage Profitable Stakeholder Relationships. New York: McGraw-Hill. Dutton, Jane, Dukerich, Janet, & Harquail., Celia. (1994, June). Organizational Images and
Member Identification. Administrative Science Quarterly, 39(2), 239-264. Economist, The. (2004, July 17) The uncertain return of the hero boss; America's business
backlash. The Economist, 372(8384), 63-65. Economist, The. (2004, July 29) Doing well and doing good: Why a new golden age of
philanthropy may be dawning, The Economist, 372(8386), 57-60. Elsbach, Kimberly D. (1998). “The Process of Social Identification: With What Do We
Identify” in Identity in Organizations, David A. Whetten and Paul C. Godfrey, eds. Thousand Oaks, CA: Sage Publications, 232–37.
Fama, Eugene F. & Jensen, Michael C., Agency Problems and Residual Claims. Michael C.
Jensen, Foundations of Organizational Strategy, (1998). Harvard University Press, Journal of Law & Economics, Vol. 26, June 1983
Freidman, Milton. Capitalism and Freedom. Chicago, IL: University of Chicago Press, 1962 Freidman, Milton. (1970). New York Times Magazine, in Porter, M. & Kramer, M. (2002,
December) The Competitive Advantage of Corporate Philanthropy. Harvard Business Review. 80(12), 56-68.
Gard, Lauren. (2004, November 22). We’re Good Guys, Buy from Us. Business Week. 72-74. Geewax, Marilyn. (2004, November 6). Bush's tax agenda certain to draw fire. The Atlanta
Journal-Constitution, 1G. Gioia, Dennis A. (1998). “From Individual to Organizational Identity” in Identity in
Organizations, David A. Whetten and Paul C. Godfrey, eds. Thousand Oaks, CA: Sage Publications, 17–30.

142
Giving USA (2004, July) Giving USA, a publication of Giving USA Foundation, researched and written by the Center on Philanthropy at Indiana University. Glenview, IL: Giving USA Foundation
GolineHarris/Change Press Release. (2004). September 17, 2004 American's Corporate
Citizenship Expectations Continue to Rise. Chicago, IL: Golin/Harris International. GuideStar. (2004, December 5). <www.guidestar.org> Hall, Holly. (2004, September 2). Charities Advised to Ask Companies to Pay More in
Marketing Deals. The Chronicle of Philanthropy, 11-12. Hansmann, H. (1980). The role of nonprofit enterprise. Yale Law Journal, 89(5), 835-901. Harbaugh, William T. (1998, February). What do donations buy? A model of philanthropy
based on prestige and warm glow. Journal of Public Economics, 67(2), 269-284. Havens, John J. & Paul G. Schervish. (2003). “Why the $41 Trillion Wealth Transfer
Estimate is Still Valid: A Review of Challenges and Questions.” Journal of Gift Planning, 7(1), 11-15, 47-50.
Hempel, J. & Gard, L. (2004, August 4). Daily Briefing: Newsmaker Q&A. Business Week
Online. Henricks, M. (1991). Cause Related Marketing; Doing well by doing good. Sales and Marketing
Management, 143(3), 60-65. Holmes, John H. & Christopher Kilbane (1993), “Selected Effects of Price and Charitable
Donations,” Journal of Nonprofit and Public Sector Marketing, 1 (4), 67-83. IEG Sponsorship Report. (2004, July 12). In Depth: How Nonprofits can work with Donors
to add Sponsorships to the Mix. IEG Sponsorship Report, 23 (13). IEG Sponsorship Report. (2004, August 30). Assertions. IEG Sponsorship Report, 23 (16). Independent Sector, The. (2002, February 12). Giving and Volunteering in the United States Fact
Sheet. I.R.C. § 501(c)(3) (West 2004). Irwin, Richard, Lachowetz, Tony, Cornwell, Bettina, & Clark, John. (2003) Cause-Related
Sport Sponsorship: An Assessment of Spectator Beliefs, Attitudes, and Behavioral Intentions. Sports Marketing Quarterly, 12(3), 131-139.

143
Johnson, Robert. (2004, August 9) Turn your weaknesses into strengths; Anheuser-Busch gets good will from good deeds. Crain's Chicago Business, SB6.
Keller, K.L. (1993). Conceptualizing, measuring, and managing customer-based brand equity.
Journal of Marketing, 57, 1-22. Kelley, B. (1991). Cause-related marketing: Doing well while doing good. Sales and Marketing
Management, 143(3), 60-64. Kellogg School Management Newsletter. (2004, November 28).
<http://www.kellogg.northwestern.edu/kwo/win02/indepth/doingwell.htm> King, B. (June 23, 2003). Cold call launched a $750 m deal. Sports Business Journal. King, B. (Feb. 9, 2004). Nextel ready to connect to NASCAR and its fans. Sports Business
Journal. Komen, Susan G. Breast Cancer Foundation Home Page. (2004, December 10).
<www.komen.org> Kotler, Philip & Lee, Nancy. (2005). Corporate social responsibility: doing the most good for
your company and your cause. John Wiley & Sons: Hoboken, NJ. 22. Kreiner, Glen E. & Ashforth, Blake E. (2004). Evidence toward an expanded model of
organizational identification. Journal of Organizational Behavior, 25, 1-27. Kristof, Amy L. (1996). Person-Organization Fit: An Integrative Review of Its
Conceptualizations, Measurement, and Implications. Personnel Psychology, 49(1), 1-49. Lafferty, Barbara, Goldsmith, Ronald, & Hult, Tomas. (2004, July). The Impact of the
Alliance on the Partners: A Look at Cause-Brand Alliances. Psychology & Marketing, 21(7), 509-531.
Lafferty, Barbara & Goldsmith, Ronald. (2005). Cause-brand alliances: does the cause help
the brand or does the brand help the cause? Journal of Business Research, 58, 423-429. Landreth, Stacy. (2002). For a good cause: The effects of cause importance, cause proximity,
congruency and participation effort on consumers' evaluations of cause-related marketing. Unpublished doctoral dissertation, Louisiana State University.
Lefton, Terry. (Sept. 20, 2004). NASCAR deal fuels gains, survey shows. Sports Business
Journal.

144
Levy, Melissa. (2004, October 28) Marketing with a cause; Company tie-ins with issues gain goodwill - and help sales. Minneapolis Star Tribune, Metro Edition, Business Section, 1D.
Lichtenstein, Donald, Drumwright, Minette, & Braig, Bridgette. (2004, October). The Effect
of Corporate Social Responsibility on Customer Donations to Corporate-Supported Nonprofits. Journal of Marketing, (68), 16-32.
MacMillan, Carrie. (2003, February). Cause & Effect. Promo, 3-10. Madrigal, R. (2004). A review of team identification and its influence on consumers’
responses toward corporate sponsors. In L.R. Kahle & Chris Riley (ed.), Sports Marketing and the Psychology of Marketing Communication, pp. 241 - 255. Mahwah, NH: Erlbaum
Madrigal, R. (2000). The influence of social alliances with sports teams on intentions to
purchase corporate sponsors’ products. Journal of Advertising, 29(4), 13-24. Madrigal, R., Bee, C., & LaBarge, M. (2004), Using the Olympics and FIFA World Cup to
Enhance Global Brand Equity: A Case Study of Two Companies in the Payment Services Category. Working Paper.
Mael F. & Ashforth B. (1992) Alumni and their alma mater: a partial test of the reformulated
model of organizational identification. Journal of Organizational Behavior, 13(2), 103-123.
McAteer, Michael. (2004, November 13). U.S. Christians await president's payback. The
Toronto Star, Religion Section, L12. Meengahan, T. (1991). The role of sponsorship in the marketing communication mix.
International Journal of Advertising, 10(1), 35-47. Mill, John Stuart. (1912). On Liberty, quoted in Salamon, Lester M. (1999) American’s Nonprofit
Sector: A Primer. New York, NY: The Foundation Center. 13. Mullen, J. (1997). Performance-based corporate philanthropy: how ‘giving smart’ can further
corporate goals. Public Relations Quarterly. Summer, 42(8), 42–49. O'Dwyer's PR Services Report. Big oil could use some CSR. (2003, September). O'Dwyer's
PR Services Report.. Editorial Section, 6. Oldenburg, D. (1992) Big companies plug big causes for big gains. Business and Society Review,
8(3), 22-23.
145
Olsen, Douglas G., Pracejus, John W., & Brown, Norman R. (2003, Fall). When Profit Equals Price: Consumer Confusion About Donation Amounts in Cause-Related Marketing. Journal of Public Policy and Marketing, 22(2), 170-181.
O’Malley, Julia. (2004, December 9). Membership protests Northeast YMCA closure. The
Oregonian. Metro Section. C1-3. Orange County American Marketing Association Press Release. (2004, October 21).
Nonprofit and Corporate Marketing Executives Join Together for Workshops, Fine Food and a Full-Day Conference to Promote the Benefits of Cause Related Marketing Partnerships. Tustin, CA: OCAMA.
O’Sullivan, Elizabethann, Rassel, Gary, & Berner, Maureen. (2003). Research Methods for
Public Administrators, 4th Edition. New York, NY: Addison Wesley Longman. Paisley, William J. (2001). “Public Communication Campaigns: The American Experience.”
in Public Communication Campaigns 3rd Edition, Rice, Ronald E. and Atkin, Charles K., Thousand Oaks, CA: Sage Publications, 3-22.
Picker, Lester A. (2001). “The Corporate Support Marketplace.” in The Nonprofit
Handbook: Fundraising 3rd Edition, Greenfield, James M., New York, NY: John Wiley & Sons, 615-647.
Polonsky, Michael Jay & Wood, Greg. (2001, June). Can the Overcommercialization of
Cause-Related Marketing Harm Society? Journal of Macromarketing. 21(1), 8-22. Porter, M. & Kramer, M. (2002, December). The Competitive Advantage of Corporate
Philanthropy. Harvard Business Review. 80(12), 56-68. Ptacek, J.J. & Salazar, G. (1997). Enlightened self-interest: Selling business on the benefits of
cause related marketing. Nonprofit World. 15(4), 9-13. Pulaski, Alex. (2004, November 28). Nike CEO vision both grass-roots and global. The
Oregonian. A1, A14-15. Quelch, John A., Austin, James E., & Laidler-Kylander, Nathalie. (2004, April). Mining Gold
in Not-for-Profit Brands. Harvard Business Review, 82(4), 24. Quinn, Jane B. (2000, December 10). 'Cause Marketing' Catches On. The Washington Post,
Final Edition, Financial Section, H02. Salamon, Lester M. (1999) American’s Nonprofit Sector: A Primer. New York, NY: The
Foundation Center.

146
Schneider, B., Hall, D.T., & Nygren, H.T. (1971). Self image and job characteristics as correlates of changing organizational identification. Human Relations, 24, 397-416.
Schwinn, Elizabeth. (2003, August 7) Constructing a Marketing Deal. The Chronicle of
Philanthropy Scott, A. (1995). Twenty somethings. Business Ethics, 9(5), 38-42. Sen, S. & Bhattacharya, C.B. (2001, May). Does Doing Good Always Lead to Doing Better?
Consumer Reactions to Corporate Social Responsibility. Journal of Marketing Research, (38)2, 225-244.
Smith, C. (1994). The new corporate philanthropy. Harvard Business Review, 72(3), 105-116. Smith, Scott M. & Alcorn, David S.. (1991). “Cause Marketing: A New Direction in the
Marketing of Corporate Social Responsibility,” Journal of Consumer Marketing, 8(3), 19-35.
Spitzer, Eliot. (2004, November 22). A Democratic ownership agenda: Own Up. New
Republic, 231(21), 1. St. Vincent de Paul Home Page. (2004, December 5). <www.sdvp.us> Stock, Kyle. (2004, December 13). Corporate philanthropy gets more strategic. The Post and
Courier, (Charleston, South Carolina) Strahilevitz, Michael & John G. Myers. (1998, March). “Donations to charity as purchase
incentives: how well they work may depend on what you are trying to sell,” Journal of Consumer Research, 24, 434-46.
Tajfel, H. & Tuner, J.C. (1985). The social identity theory of intergroup behavior. In The
psychology of intergroup relations, S. Worchel & W.G. Austin, eds. Chicago: Nelson Hall, 7-24.
Tiebout, Charles M. (1956). “A Pure Theory of Local Expenditures.” Journal of Political
Economy, 64(5), 416-424. Randall, Laura. (2004, November 15). In the Schools: Colleges Say, Don't Bother To
Dabble. The New York Times, Section F, Column 5, 4. Ravasi, Davide & Rekom, Johan Van. (2003). Key Issues in Organizational Identity and
Identification Theory. Corporate Reputation Review, 6(2), 118-132. Reagan, Ronald. (1981, January 20). Excerpt of Inaugural Address.

147
Reinhardt, Andy. (2004, January 26). Tomra Systems. Business Week, International Edition; N 3867, 60.
Rigney, M. & Steenhuysen, J. (1991). Conscience raising. Advertising Age, 62(35), 19. Ross, J.K., Patterson, L. & Stutts, M.A. (1992). Consumers’ perceptions of organizations that
use cause-related marketing. Journal of the Academy of Marketing Science, 20(1), 93-97. United States Census Bureau. (2004, November 29). U.S. Census Bureau, Population
Division: US Popclock Projections. <http://www.census.gov/cgi-bin/popclock> United States Census Bureau. (2005, January 24). U.S. Census Bureau, National Population
Estimates. <http://www.census.gov/popest/national/asrh/NC-EST2003-as.html> University of Oregon Registrar. (2005, January 24). University of Oregon Registrar,
Enrollment Facts. < http://registrar.uoregon.edu/stats/factsataglance.htm> Varadarajan, P.R., & Menon, A. (1988 July). Cause-related marketing: A coalignment of
marketing strategy and corporate philanthropy. Journal of Marketing, 52, 58-74. Vernon, Lillian. (2004, November 24). Business Link to a Charity Can Help Both. Ventura
County Star. Business Section, A1. Wagner, L. & R. L. Thompson. (1994). Cause-related marketing: Fundraising tool or phony
philanthropy? Nonprofit World 12(6): 9-13. Walsh, Kenneth T. (2004, November 15). The Man with the Mandate. U.S. News & World
Report, 137(17), 34-38. Wan-Huggins, V.N., Riordan, C.M., & Griffeth, R.W. (1998). The development and
longitudinal test of a model of organizational identification. Journal of Applied Social Psychology, 28, 727-749.
Weisbrod, Burton A. (1977). “Toward a Theory of the Voluntary Nonprofit Sector in a
Three-Sector Economy,” in Burton A. Weisbrod (ed.), The Voluntary Nonprofit Sector. Lexington MA: D.C. Heath and Company, 133-151.
Weisbrod, Burton A. (1998). To Profit or Not to Profit: The Commercialization of the
Nonprofit Sector. Cambridge, MA: Harvard University Press. Whetten, David A., Rands, Gordon, & Godfrey, Paul. (2002). “What Are the
Responsibilities of Business to Society?” in Pettigrew, Andrew, Thomas, Howard, and Whittington, Richard (ed.), Handbook of Strategy Management. Thousand Oaks CA: Sage Publications, 373-408.

148
Wickenheiser, Matt. (2004, June 1) Doing well by doing good; A conference this week will explore how socially responsible behavior can help a company’s bottom line. Portland Press Herald, Portland, Maine. Business Section, 1C.
Wolff, Edward. (1999). “The Economy and Philanthropy” in Clotfelter, Charles T. and
Ehrlich, Thomas (eds.), Philanthropy and the Nonprofit Sector in a Changing America, Bloomington IN: Indiana University Press, 73-98.
Woods, Vanessa. (2005, March 19). Pay up, you are being watched. New Scientist, 2491, 12. WorldWinner Press Release. (2004, September 27). WorldWinner(TM) and the Susan G.
Komen Breast Cancer Foundation Invite Gamers to Challenge a Life-Threatening Opponent During Breast Cancer Awareness Month. Newton, MA: WorldWinner Inc.
Wyndham Press Release. (2004, September 15). Wyndham International expands annual
"Dream for the Cure" program to further the Komen Foundation Mission. Dallas, TX: Wyndham Inc.
Yechiam, Eldad, Barron, Greg, Erev, Ido & Erez, Miriam. (2002, March 16). On the
robustness and the direction of the effect of cause-related marketing. Journal of Consumer Behavior, 2(4), 320-332.
Young, Jeffrey. (2003, April 11). Persuading Students to Care: Eugene Lang's Program Aims
to Prod Colleges Into Encouraging Civic Involvement. The Chronicle of Higher Education, 47-50.
Zajonc, R. B. (1968). Attitudinal effects of mere exposure. Journal of Personality and Social
Psychology, 9, 1-27.