cb property insights q1 2015
DESCRIPTION
market trendsTRANSCRIPT
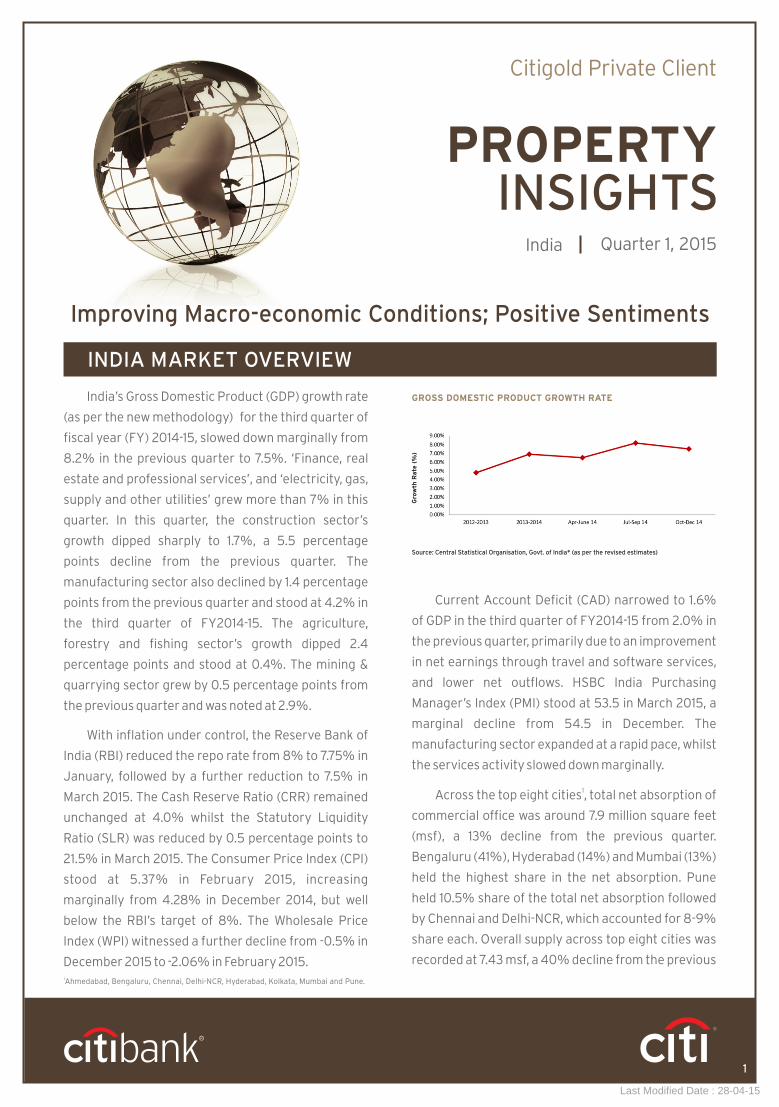
India’s Gross Domestic Product (GDP) growth rate
(as per the new methodology) for the third quarter of
fiscal year (FY) 2014-15, slowed down marginally from
8.2% in the previous quarter to 7.5%. ‘Finance, real
estate and professional services’, and ‘electricity, gas,
supply and other utilities’ grew more than 7% in this
quarter. In this quarter, the construction sector’s
growth dipped sharply to 1.7%, a 5.5 percentage
points decline from the previous quarter. The
manufacturing sector also declined by 1.4 percentage
points from the previous quarter and stood at 4.2% in
the third quarter of FY2014-15. The agriculture,
forestry and fishing sector’s growth dipped 2.4
percentage points and stood at 0.4%. The mining &
quarrying sector grew by 0.5 percentage points from
the previous quarter and was noted at 2.9%.
With inflation under control, the Reserve Bank of
India (RBI) reduced the repo rate from 8% to 7.75% in
January, followed by a further reduction to 7.5% in
March 2015. The Cash Reserve Ratio (CRR) remained
unchanged at 4.0% whilst the Statutory Liquidity
Ratio (SLR) was reduced by 0.5 percentage points to
21.5% in March 2015. The Consumer Price Index (CPI)
stood at 5.37% in February 2015, increasing
marginally from 4.28% in December 2014, but well
below the RBI’s target of 8%. The Wholesale Price
Index (WPI) witnessed a further decline from -0.5% in
December 2015 to -2.06% in February 2015.
Current Account Deficit (CAD) narrowed to 1.6%
of GDP in the third quarter of FY2014-15 from 2.0% in
the previous quarter, primarily due to an improvement
in net earnings through travel and software services,
and lower net outflows. HSBC India Purchasing
Manager’s Index (PMI) stood at 53.5 in March 2015, a
marginal decline from 54.5 in December. The
manufacturing sector expanded at a rapid pace, whilst
the services activity slowed down marginally.
1Across the top eight cities , total net absorption of
commercial office was around 7.9 million square feet
(msf), a 13% decline from the previous quarter.
Bengaluru (41%), Hyderabad (14%) and Mumbai (13%)
held the highest share in the net absorption. Pune
held 10.5% share of the total net absorption followed
by Chennai and Delhi-NCR, which accounted for 8-9%
share each. Overall supply across top eight cities was
recorded at 7.43 msf, a 40% decline from the previous
INDIA MARKET OVERVIEW
Citigold Private Client
PROPERTY INSIGHTS
India Quarter 1, 2015
Improving Macro-economic Conditions; Positive Sentiments
1
GROSS DOMESTIC PRODUCT GROWTH RATE
Gro
wth
Rate
(%
)
Source: Central Statistical Organisation, Govt. of India* (as per the revised estimates)
1Ahmedabad, Bengaluru, Chennai, Delhi-NCR, Hyderabad, Kolkata, Mumbai and Pune.
Last Modified Date : 28-04-15

quarter. Due to healthy leasing, the overall vacancy
levels across these eight cities dropped by 0.5
percentage points from the previous quarter, and was
noted at 18.3% in the first quarter of 2015.
In the retail sector, across the top eight cities, only
Bengaluru witnessed new mall supply of 0.2 msf. A few
malls have deferred their completion timelines due to
construction delays and in some cases, due to delay in
obtaining required approvals. In the wake of low new
supply, the overall mall vacancies across the top eight
cities remained largely stable at 14.7%
In the residential sector, approximately 24,600
units were launched across the top eight cities in this
quarter, a 21% decline from the previous quarter.
Bengaluru had a major share of these unit launches at
17%, closely followed by Mumbai contributing 16% to
the total unit launches. Capital values remained
largely stable in both high-end and mid segment units
of five cities including Ahmedabad, Delhi-NCR, Mumbai,
Kolkata and Pune, primarily due to existing high unsold
inventory. Bengaluru and Chennai witnessed a 5-7%
capital value appreciation in the mid segment due to an
increase in demand. In Hyderabad, limited availability in
the high-end segment resulted in 3-6% capital value
appreciation in select submarkets. With downward
revision of repo rates and reduction in home loan
interest rates, housing demand is likely to increase in
the coming quarters.
The Consumer Price Index (CPI) increased
marginally from 5.19% in January to 5.37% in
February 2015, however the inflation largely seemed
to be under control. In order to revive the economic
growth, the RBI reduced its benchmark lending rate -
the repo rate - twice (0.50 basis points in total) in the
first quarter of 2015, to 7.5%. The Cash Reserve
Ratio (CRR) remained unchanged at 4.0%. However,
the Statutory Liquidity Ratio (SLR) was reduced by
0.5 percentage point from December 2014 to 22.5%
in March 2015. The Wholesale Price Index (WPI) continued to
witness a decline for the last four months, and was
noted at -2.06% in February 2015 from -0.5% in
December 2015, due to a decline in the prices of food
products, manufactured goods, fuel and power. In
February 2015, food inflation was noted at 7.74%.
Although this was a marginal decline from January, it
registered a 2.79 percentage points increase from
December 2014. The fuel and power inflation stood at -
14.72% a further decline from -7.82% recorded in
December. Inflation for manufactured goods dropped
by 1.11 percentage points to 0.33% in February 2015.
Economic Trends
Trends & Updates
2
EXCHANGE RATE MOVEMENT (INR/USD)
Source: RBI
INR
/US
D
FDI INFLOW IN HOUSING AND REAL ESTATE SECTOR
INR
Cro
re
Source: Dept. of Industrial Policy & Promotion, Govt, of India
Last Modified Date : 28-04-15
India’s GDP is projected to attain 7.4% growth at
the end of FY2014-15. With the government’s agenda
to boost infrastructure investments, and improve
the business environment, private investments are
anticipated to increase in the future periods. This quarter witnessed an improvement in the
Indian Rupee from INR 63.6 in December 2014 to INR
62.5 in March 2015, as against the US Dollar. The
rupee strengthened in this quarter primarily due to
increased inflows from Foreign Institutional
Investors (FIIs).
The total FDI inflows in India were INR 155,489
crore during April 2014 – January 2015, of which
2.8% came in the construction development sector
(comprising townships, housing, bui lt-up
infrastructure), which was around INR 4,359 crores.
FDI doubled in January 2015 in comparison to the
same month last year, making it the highest inflow in
the past 29 months.
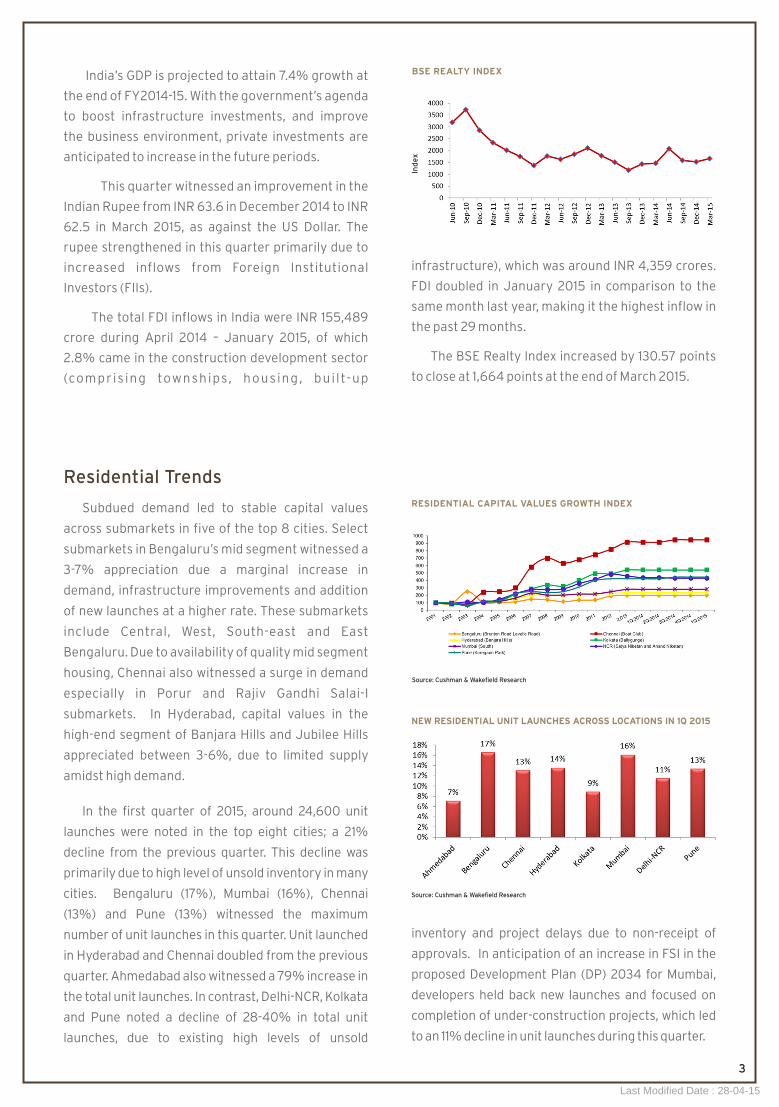
The BSE Realty Index increased by 130.57 points
to close at 1,664 points at the end of March 2015.
3
Subdued demand led to stable capital values
across submarkets in five of the top 8 cities. Select
submarkets in Bengaluru’s mid segment witnessed a
3-7% appreciation due a marginal increase in
demand, infrastructure improvements and addition
of new launches at a higher rate. These submarkets
include Central, West, South-east and East
Bengaluru. Due to availability of quality mid segment
housing, Chennai also witnessed a surge in demand
especially in Porur and Rajiv Gandhi Salai-I
submarkets. In Hyderabad, capital values in the
high-end segment of Banjara Hills and Jubilee Hills
appreciated between 3-6%, due to limited supply
amidst high demand.
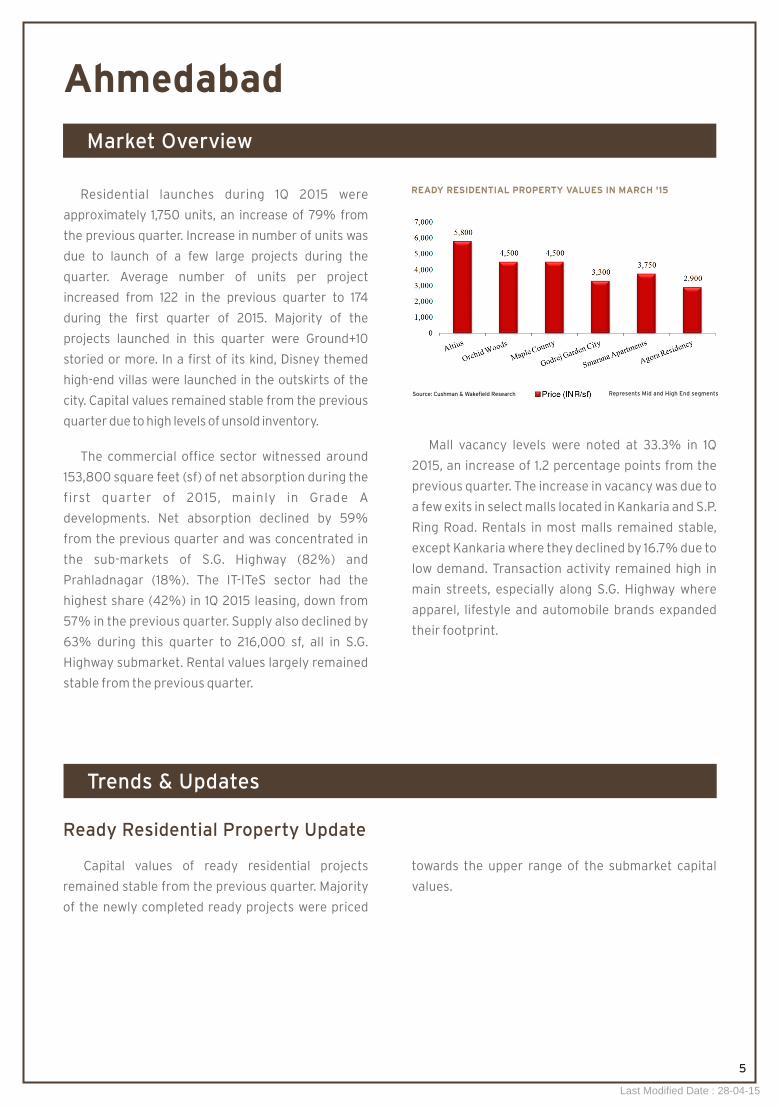
In the first quarter of 2015, around 24,600 unit
launches were noted in the top eight cities; a 21%
decline from the previous quarter. This decline was
primarily due to high level of unsold inventory in many
cities. Bengaluru (17%), Mumbai (16%), Chennai
(13%) and Pune (13%) witnessed the maximum
number of unit launches in this quarter. Unit launched
in Hyderabad and Chennai doubled from the previous
quarter. Ahmedabad also witnessed a 79% increase in
the total unit launches. In contrast, Delhi-NCR, Kolkata
and Pune noted a decline of 28-40% in total unit
launches, due to existing high levels of unsold
inventory and project delays due to non-receipt of
approvals. In anticipation of an increase in FSI in the
proposed Development Plan (DP) 2034 for Mumbai,
developers held back new launches and focused on
completion of under-construction projects, which led
to an 11% decline in unit launches during this quarter.
Residential Trends
BSE REALTY INDEX
Ind
ex
RESIDENTIAL CAPITAL VALUES GROWTH INDEX
Source: Cushman & Wakefield Research
NEW RESIDENTIAL UNIT LAUNCHES ACROSS LOCATIONS IN 1Q 2015
Source: Cushman & Wakefield Research
Last Modified Date : 28-04-15

4
Index
Ahmedabad................................................................................... 5
Bengaluru...................................................................................... 8
Chandigarh.................................................................................... 12
Chennai.......................................................................................... 14
Delhi - National Capital Region (NCR) .................................... 19
Jaipur ............................................................................................ 27
Hyderabad..................................................................................... 23
Kolkata.......................................................................................... 30
Mumbai........................................................................................... 35
Pune............................................................................................... 39
Last Modified Date : 28-04-15
Ahmedabad
Market Overview
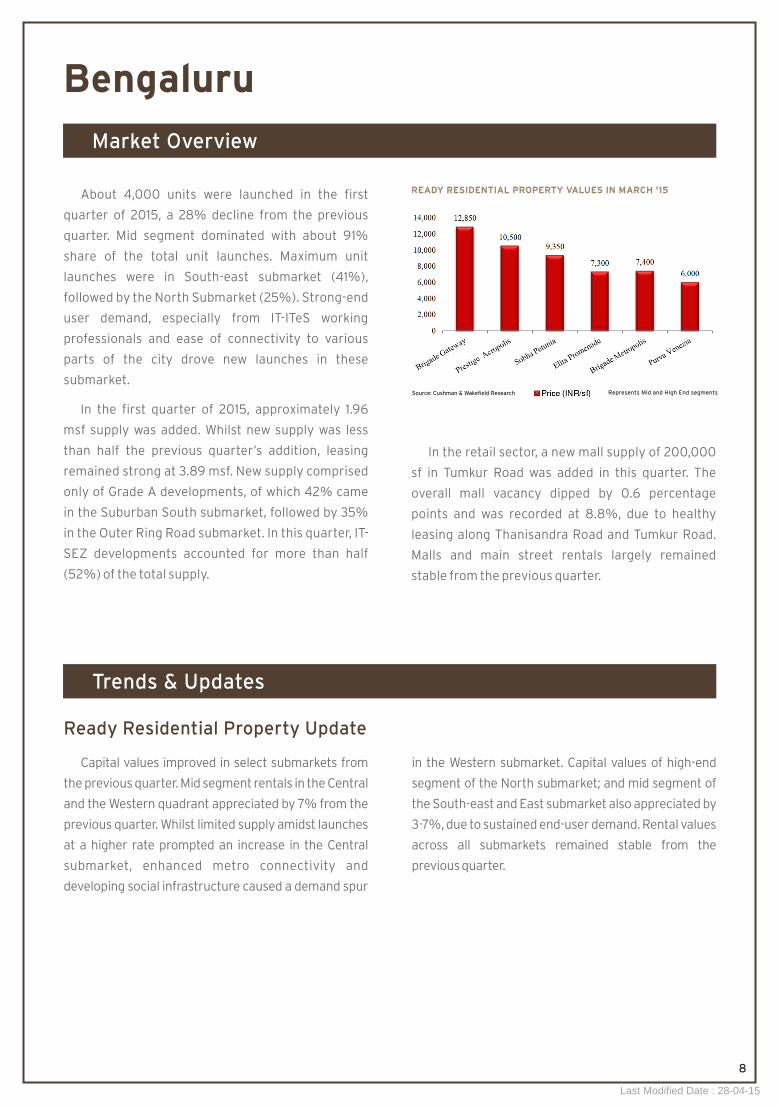
Residential launches during 1Q 2015 were
approximately 1,750 units, an increase of 79% from
the previous quarter. Increase in number of units was
due to launch of a few large projects during the
quarter. Average number of units per project
increased from 122 in the previous quarter to 174
during the first quarter of 2015. Majority of the
projects launched in this quarter were Ground+10
storied or more. In a first of its kind, Disney themed
high-end villas were launched in the outskirts of the
city. Capital values remained stable from the previous
quarter due to high levels of unsold inventory.
The commercial office sector witnessed around
153,800 square feet (sf) of net absorption during the
first quarter of 2015, mainly in Grade A
developments. Net absorption declined by 59%
from the previous quarter and was concentrated in
the sub-markets of S.G. Highway (82%) and
Prahladnagar (18%). The IT-ITeS sector had the
highest share (42%) in 1Q 2015 leasing, down from
57% in the previous quarter. Supply also declined by
63% during this quarter to 216,000 sf, all in S.G.
Highway submarket. Rental values largely remained
stable from the previous quarter.
Mall vacancy levels were noted at 33.3% in 1Q
2015, an increase of 1.2 percentage points from the
previous quarter. The increase in vacancy was due to
a few exits in select malls located in Kankaria and S.P.
Ring Road. Rentals in most malls remained stable,
except Kankaria where they declined by 16.7% due to
low demand. Transaction activity remained high in
main streets, especially along S.G. Highway where
apparel, lifestyle and automobile brands expanded
their footprint.
Capital values of ready residential projects
remained stable from the previous quarter. Majority
of the newly completed ready projects were priced
Trends & Updates
Ready Residential Property Update
towards the upper range of the submarket capital
values.
5
READY RESIDENTIAL PROPERTY VALUES IN MARCH '15
Source: Cushman & Wakefield Research Represents Mid and High End segments
Last Modified Date : 28-04-15

New unit launches declined by 79% from the
previous quarter and around 1,750 units were
launched in 1Q 2015. Average project size also
increased from 122 units in the previous quarter to
174 units in this quarter. Around 65% of units
launched in this quarter catered to the mid segment
New Residential Launches
whilst 33% to the high-end segment. Western
peripheral locations such as Bopal, South Bopal and
Ambli dominated the launch activity with a 47%
share. 3 BHK configurations had the maximum
contribution to new launches with a 43% share
followed by 2 BHKs (28%) and 4 BHKs (22%).
Average Capital Values – High-end Segment (INR '000/sf)
Satellite
Vastrapur
S.G.Highway
Prahlad Nagar
Location
4.0 - 4.8
3.7 - 4.0
3.7 - 4.3
4.2 - 5.3
2010
4.3 - 6.0
3.7 - 5.0
3.7 - 4.5
4.2 - 6.0
2011
4.3 - 6.0
3.7 - 5.0
3.7 - 4.5
4.2 - 6.0
2012
4.3 - 6.0
3.7 - 5.0
3.7 - 4.5
4.2 - 6.2
2013
4.3 - 6.0
3.7 - 5.0
3.7 - 5.0
4.2 - 6.2
1Q 2015
4.3 - 6.0
3.7 - 5.0
3.7 - 5.0
4.2 - 6.2
2014
Source: Cushman and Wakefield Research
Note: The above values for high-end segment typically include units of 2,000-4,000 sf
Average Capital Values – Mid Segment (INR ‘000/sf)
#Satellite
Vastrapur#
S.G.Highway
Prahlad Nagar
Location
Project Name Developer Location Number of Units* Type Area of Units (sf)
Aaryan Gloria 560 Apartments 2 BHK: 999 to 1,4353 BHK:1,440
Aaryan Builders Bopal
Upland Villas 280 Villas 4 BHK: 2,925 to 3,8705 BHK: 4,950 to 6,0756 BHK: 9,900
Arvind
Infrastructure
Nasmed
Gala Eternia 216 Apartments 3 BHK: 1,385 to 1,745Gala
Infrastructure
Thaltej
Savvy Swaraaj 208 Apartments 2.5 BHK: 1,3803 BHK: 1,730
Savvy
Infrastructure
S.G. Highway
Binori Grandeur 152 Apartments 4 BHK: 2,995Binori Buildcon Ambli
Binori Gracia 102 Apartments 3 BHK: 1,435Binori Buildcon South Bopal
Binori Mable 52 Apartments 3 BHK: 1,965Binori Buildcon Prahladnagar
Dev Atelier 50 Apartments 3 BHK: 2,164Dev Group Prahladnagar
Setu Scarlet 36 Apartments 3 BHK: 2,070Setu Infracon Motera
Indraprasth Kadamb 42 Apartments 4 BHK: 3,000Deep Group,
Vedant Developers
Prahladnagar
Sepal Elegant 2 42 Apartments 1 BHK: 7562 BHK: 1,008 to 1,026
Swetalee
Developers
& Sepal Buildcon
Chandkheda
2.8 - 3.8
2.6 - 3.5
3.0 - 3.8
2.8 - 3.6
2010
2.8 - 4.3
2.6 - 3.8
3.3 - 4.3
3.2 - 4.2
2011
2.8 - 4.3
2.6 - 3.8
3.3 - 4.3
3.2 - 4.2
2012
2.8 - 4.3
2.6 - 3.9
3.0 - 4.3
3.2 - 4.3
2013
2.8 - 4.3
2.6 - 3.9
3.0 - 4.3
3.2 - 4.3
1Q 2015
2.8 - 4.3
2.6 - 3.9
3.0 - 4.3
3.2 - 4.3
2014
Source: Cushman and Wakefield Research
Note: The above values for mid segment typically include units of 1,200-1,800 sf#Limited availability at quoted values
6
Last Modified Date : 28-04-15

Commercial Office Sector
Ahmedabad witnessed 242,000 sf of supply
during this quarter, primarily in the S.G. Highway
sub-market. Leasing of 153,800 sf was noted during
the quarter with the IT-ITeS sector having the
highest share at 42%, followed by the chemicals
sector at 34%. Transaction activity in the form of
outright purchases by local traders was also
prominent during the quarter. Continued
transaction activity led to a quarterly decline in
Grade A vacancy levels by 1.7 percentage points and
was noted at 33.4%. Rental values remained stable
from the previous quarter.
7
Retail Sector
Low transaction activity led to an increase in mall
vacancy levels, which were noted at 33.3% in 1Q
2015. Lack of quality spaces and upkeep in certain
malls led to a few exits. Rentals remained stable from
the previous quarter across malls and main streets.
However, enquiries for prime main streets increased
due to which transaction activity may improve in the
coming year. Quick Service Restaurants (QSRs) such
as Starbucks and Burger King are looking to open
their first stores in the city whilst Dunkin Donuts
opened its first store in the city during this quarter.
Outlook
Residential launches in the upcoming quarter are
likely to remain at par with 1Q 2015, considering the
high levels of unsold inventory. Capital values are
also likely to remain stable across submarkets in the
upcoming quarter.
110,000 sf of office supply is expected to become
operational in Prahladnagar during the next quarter.
Although the under construction pipeline has
declined, high vacancy levels due to subdued
demand may lead to a downward pressure on rental
values in the upcoming quarter.
Mall rentals in the S.G. Highway sub-market may
decline in the upcoming quarter due to persistently
high vacancy levels. However, rentals in Vastrapur
may appreciated due to healthy demand and low
vacancy levels. Rentals in the main streets of C.G.
Road and Prahladnagar may appreciate, considering
the high levels of enquiries from F&B and lifestyle
brands. Rentals are likely to remain stable in all other
main streets in the next quarter.
Under Construction Residential Property Update
Peripheral locations along S.G. Highway and Bopal
and areas in north Ahmedabad such as Chandkheda,
Motera, etc. witnessed significant construction
activity during the quarter. Capital values across most
submarkets remained stable from the previous
quarter.
Last Modified Date : 28-04-15
Bengaluru
Market Overview
Ready Residential Property Update
Trends & Updates
Capital values improved in select submarkets from
the previous quarter. Mid segment rentals in the Central
and the Western quadrant appreciated by 7% from the
previous quarter. Whilst limited supply amidst launches
at a higher rate prompted an increase in the Central
submarket, enhanced metro connectivity and
developing social infrastructure caused a demand spur
in the Western submarket. Capital values of high-end
segment of the North submarket; and mid segment of
the South-east and East submarket also appreciated by
3-7%, due to sustained end-user demand. Rental values
across all submarkets remained stable from the
previous quarter.
About 4,000 units were launched in the first
quarter of 2015, a 28% decline from the previous
quarter. Mid segment dominated with about 91%
share of the total unit launches. Maximum unit
launches were in South-east submarket (41%),
followed by the North Submarket (25%). Strong-end
user demand, especially from IT-ITeS working
professionals and ease of connectivity to various
parts of the city drove new launches in these
submarket.
In the first quarter of 2015, approximately 1.96
msf supply was added. Whilst new supply was less
than half the previous quarter’s addition, leasing
remained strong at 3.89 msf. New supply comprised
only of Grade A developments, of which 42% came
in the Suburban South submarket, followed by 35%
in the Outer Ring Road submarket. In this quarter, IT-
SEZ developments accounted for more than half
(52%) of the total supply.
In the retail sector, a new mall supply of 200,000
sf in Tumkur Road was added in this quarter. The
overall mall vacancy dipped by 0.6 percentage
points and was recorded at 8.8%, due to healthy
leasing along Thanisandra Road and Tumkur Road.
Malls and main street rentals largely remained
stable from the previous quarter.
READY RESIDENTIAL PROPERTY VALUES IN MARCH '15
Source: Cushman & Wakefield Research Represents Mid and High End segments
8
Last Modified Date : 28-04-15

Source: Cushman and Wakefield Research
Note: The above values for high-end segment typically include units of 2,000-4,000 sf.
Location
Central
South
Off-Central
East
North
Average Capital Values – High-end Segment (INR’000/sf)
2009
12.0 - 14.5
6.0 - 8.5
5.0 - 6.8
5.6 - 7.0
5.5 - 7.0
2010
13.5 - 17.5
6.0 - 9.5
5.0 - 7.0
6.5 - 7.5
5.5 - 7.0
2011
14.0 - 18.0
6.5 - 10.0
6.0 - 8.5
6.8 - 8.0
6.5 - 8.0
2012
18.0 - 28.0
6.5 - 10.0
7.0 - 9.0
6.5 - 9.0
6.5 - 8.2
1Q 2015
18.0 - 30.0
7.0 - 10.5
8.0 - 11.0
6.5 - 10.0
7.0 - 11.0
2014
18.0 - 30.0
7.0 - 10.3
8.0 - 11.0
6.5 - 10.0
7.0 - 9.8
2013
18.0 - 30.0
6.8 - 10.3
8.0 - 11.0
6.5 - 10.0
7.0 - 9.5
2008
14.0 - 18.0
7.0 - 9.0
6.5 - 7.5
6.5 - 9.0
6.0 - 8.0
Key to locations:
High-end Segment
Central: Lavelle Road, Off Palace Road, Off Cunnigham
Road, Ulsoor Road, Richmond Road
South: Koramangala, Outer Ring Road, Bannerghatta
Road, JP Nagar
Off-Central: Frazer Town, Benson Town, Richards Town,
Dollars Colony
East: Whitefield (villas)
North: Hebbal, Yelahanka, Jakkur, Devanahalli
Mid Segment
Central: Brunton Road, Artillery Road, Ali Askar Road,
Cunningham Road
East: Marathalli, Whitefield, Old Airport Road
South-East: Sarjapur Road, Outer Ring Road, HSR
Layout
South: Kormangala, Jakkasandra
South-West: Jayanagar, J P Nagar, Kanakpura Road,
Bannerghatta Road, BTM Layout
North: Hebbal, Bellary Road, Yelahanka, Dodballapur
Road, Jalahalli
Off-Central*: Vasanth Nagar, Richmond Town and
Indiranagar
Off-Central**: Cox Town, Frazer Town, HRBR, Benson
Town, etc.
North-West: Malleshwaram, Rajajinagar
9
Source: Cushman and Wakefield Research
Note: The above values for mid segment typically include units of 1,600-2,000 sf.
Average Capital Values – (INR’000/sf)Mid Segment
Location
Central
East
South-East
North
South-West
Off-Central*
Off-Central**
North-West
South
2008
5.8 - 7.0
2.7 - 3.1
2.9 - 4.0
5.0 - 6.5
2.8 - 4.2
3.5 - 6.0
4.0 - 6.0
4.2 - 5.8
3.0 - 4.0
2009
5.0 - 6.0
2.4 - 2.7
2.5 - 3.2
2.8 - 4.0
2.7 - 3.9
3.3 - 5.7
3.7 - 5.7
3.5 - 5.2
4.6 - 5.7
2010
5.5 - 7.0
2.7 - 3.1
2.8 - 4.0
2.8 - 4.4
3.2 - 4.5
4.0 - 6.2
3.8 - 6.2
3.8 - 5.6
4.8 - 6.0
2011
6.0 - 7.5
3.2 - 3.8
3.4 - 5.0
3.0 - 4.8
3.6 - 5.0
4.5 - 6.7
4.3 - 6.7
4.3 - 6.2
5.0 - 6.5
2012
6.0 - 8.0
3.8 - 4.8
4.0 - 5.5
6.0 - 9.0
4.0 - 5.5
5.0 - 7.5
5.0 - 7.0
4.5 - 6.5
3.5 - 5.5
2013
9.0 - 12.0
4.0 - 5.5
4.5 - 5.9
4.5 - 6.5
7.0 - 10.0
6.0 - 8.0
5.5 - 6.5
3.5 - 5.5
6.0 - 9.0
2014
9.0 - 12.0
4.0 - 5.5
4.5 - 6.0
4.5 - 6.5
7.0 - 10.0
6.5 - 8.5
6.0 - 6.8
4.0 - 5.5
6.0 - 9.0
1Q 2015
9.5 - 13.0
4.3 - 5.7
4.5 - 6.3
4.5 - 6.5
7.0 - 10.0
6.5 - 8.5
6.0 - 6.8
4.0 - 6.5
7.0 - 10.0
Last Modified Date : 28-04-15

New Residential Launches
In the first quarter of 2015, approximately 4,000
units were launched, of which 76% were from units
pre-launched in the previous quarters. Whilst total
unit launches declined by 28% from the previous
quarter, mid segment’s share remained strong at
91%. 41% of total unit launches came in Sarjapur and
Hosur Road in the South-east submarket.
Additionally, 25% of the unit launches came in
Yelahanka and Kogilu areas in the North submarket.
Several villa plot launches were also noted in this
quarter, especially in Southern and Northern
quadrants of the city.
Location Number of Units* Type Area of Units (in sf)Project Name Developer
Sobha Silicon Oasis Sobha Developers Hosur Road 918 Apartments 2 BHK: 1,3503 BHK: 1,675
Brigade Northridge Brigade Group Kogilu Main Road 600 Apartments 2 BHK: 1,2503 BHK: 2,000
SNN Raj Etternia SNN Builders Haralur Road 576 Apartments 1 BHK: 5602 BHK: 1,2703 BHK: 1,670
The Tree Provident Housing Off Magadi Road 560 Apartments 1 BHK: 6052 BHK: 1,0003 BHK: 1,256
Salarpuria SattvaLaurel Heights
Salarpuria SattvaGroup
Tumkur Road 438 Apartments 2 BHK: 9922.5 BHK: 1,2403 BHK: 1,416
Edge Waters Bren Corporation Sarjapur Road 191 Apartments 2 BHK: 1,0403 BHK: 1,418
Shrinikethan RNS InfrastructuresLimited
Yeshwantpur 186 Apartments 3 BHK: 3,0504 BHK: 3,390
RMZ Azure RMZ Bellary Road 182 Apartments 2 BHK: 1,6023 BHK: 2,100
After the rain Total Environment Yelahanka 127 Villas 4 BHK: 3,090
Green Aspire Tetra Grand Off ThanisandraRoad
120 Apartments 2 BHK: 8663 BHK: 1,453
ATZ Estrella ATZ Properties Varthur Road 110 Apartments 2 BHK: 1,3023 BHK: 1,780
The Urban Forest Alchemy Real Estate Whitefield 75 Apartments 2 BHK: 1,3143 BHK: 1,826
10
* Estimated and as per market information
Under Construction Residential Property Update
Around 168,000 residential units are under
construction across various submarkets, with mid
segment accounting for about 56%, followed by 26
% in the affordable segment. Capital values of under
construction residential projects remained mostly
stable from the previous quarter. A few projects
nearing completion include Vaswani Reserve in
Marathahalli, Sunrise Towers in Whitefield and HM
Grandeur in Frazer Town.
Last Modified Date : 28-04-15

11
Retail Sector
Rentals remained stable from the previous
quarter in malls as well as main streets of most sub-
markets. During this quarter, a few F&B, electronics,
footwear and apparel retailers leased spaces in malls
located along Thanisandra Road and Tumkur Road.
In the main streets, Brigade Road rentals dipped by
3.2% from the previous quarter due to a preferential
shift of the tenants towards other locations such as
Indiranagar and Koramangala. Benefitting from the
spill over demand from nearby saturated locations,
Koramangala 80 Feet Road witnessed a 4.3% rental
appreciation from the previous quarter.
Commercial Office Sector
Net absorption of around 3.3 msf was recorded in
Grade A developments during the first quarter of
2015; a 7% increase from the previous quarter.
Leasing of 3.89 msf was noted in this quarter, 33% of
which was in the Outer Ring Road submarket. IT-ITeS
sector dominated leasing and had a 68% in the total
transactions. Further, pre-commitments of
approximately 0.85 msf were noted in this quarter.
Office rentals also appreciated in select submarkets.
Sustained demand and limited availability of quality
spaces resulted in Grade A weighted average rental
appreciation along the Outer Ring Road, Peripheral
East and Peripheral North submarkets by 6.7%, 4.2%
and 6.0% respectively. In contrast to these, the
Suburban South and Suburban East submarkets
witnessed a decline of 4.4% and 9.3% respectively.
Whilst rental correction in a few buildings caused this
dip in the Suburban South, low demand led to a decline
in the Suburban East. Overall Grade A vacancy levels
decreased by 1.6 percentage points due to healthy
transactions and was noted at 8.0%.
Given the significantly high number of pre-
launches (around 13,000), residential unit launches
in the subsequent quarters are expected to be
strong. Rental and Capital values are likely to hold
steady as the existing supply presently exceeds the
demand.
Around 7.3 msf of office space supply is expected
to be added in the next quarter, most of which is
likely to be in Grade A developments. Given the
strong demand, transaction activity may remain
high in the upcoming quarters. Rentals may
Outlook
appreciate in select submarkets such as the Outer
Ring Road and Peripheral East due to a sustained
demand.
Rentals in most malls and main streets are likely
to remain stable in the next quarter. New BEL Road
and Kamanahalli Main Road are fetching increased
enquiries from international brands, amidst limited
space availability. However, rentals are expected to
gain traction in the coming quarters.
Last Modified Date : 28-04-15

Market Overview
Chandigarh
In the first quarter of 2015, approximately 700
units were launched in the Tri-City region. New
launches were primarily in the outskirts in
submarkets of Zirakpur, Mullanpur and Mohali. The
high-end segment witnessed improvement in
transaction activity during the quarter; however, the
capital values remained stable from the previous
quarter. Capital values in the mid segment too
remained stable across submarkets. With improved
connectivity to Mullanpur, this submarket witnessed
an increased interest from the homebuyers.
Approximately 650,000 sf of office space was
added to the Tri-City during the first quarter of 2015,
primarily in Mohali. Demand for office space
improved during the quarter with significant space
take-up from companies in BFSI, construction and
automobile sectors. Grade A office rentals softened
during the quarter, as investors agreed to lease out
their spaces at lower rentals considering the
prevailing subdued demand conditions.
No new mall space was added to the Tri-City
region in the first quarter of 2015. Vacancy levels
during the quarter declined as retailers of
accessories and apparels took up space across the
region. Demand continued to be tepid in the main
streets. Rentals remained stable for both malls and
main streets across Chandigarh
Trends & Updates
Capital values remained stable across all locations,
from the previous quarter. Transaction activity in the
high-end segment improved during the quarter with
availability of good deals at competitive prices. Capital
values in Mohali and Zirakpur hardened during the
quarter with continued interest from end-users but
remained stable amidst reduced investor demand.
READY RESIDENTIAL PROPERTY VALUES IN MARCH '15
Source: Cushman & Wakefield Research Represents Mid and High End segments
12
Ready Residential Property Update
Last Modified Date : 28-04-15

Location
Chandigarh Sector: 2-11
Chandigarh Sector: 28
Panchkula
Manimajra
4Q 2013
155,000 - 170,000/sqyd
140,000 - 160,000/sqyd
110,000 - 145,000/sqyd
14,000/sf
1Q 2014
155,000 - 170,000/sqyd
140,000 - 160,000/sqyd
110,000 - 145,000/sqyd
14,000/sf
1Q 2015
155,000 - 170,000/sqyd
140,000 - 160,000/sqyd
110,000 - 145,000/sqyd
14,000/sf
4Q 2014
155,000 - 170,000/sqyd
140,000 - 160,000/sqyd
110,000 - 145,000/sqyd
14,000/sf
3Q 2014
155,000 - 170,000/sqyd
140,000 - 160,000/sqyd
110,000 - 145,000/sqyd
14,000/sf
2Q 2014
155,000 - 170,000/sqyd
140,000 - 160,000/sqyd
110,000 - 145,000/sqyd
14,000/sf
Average Capital Values – High-end Segment (INR)
Source: Cushman and Wakefield Research
Note: The above values for high-end segment typically include units of 2,000-4,000 sf, both apartments and villa *sqyd: Square Yard
Mid Segment:
Mohali: Sectors - 114, 115, 127
Panchkula: Sector - 20
High-end Segment:
Panchkula: Sectors - 2, 4, 6, 7, 8, 9, 15
Key to Locations:
Location
Zirakpur
Mohali
Dera Bassi
Panchkula
4Q 2013
2,800 - 3,600
3,200 - 4,000
3,000 - 3,200
2,800 - 3,500
1Q 2014
2,800 - 3,400
3,000 - 3,800
2,800 - 3,200
2,800 - 3,400
1Q 2015
2,800 - 3,600
3,200 - 4,200
2,700 - 3,500
2,900 - 3,500
4Q 2014
2,800 - 3,600
3,200 - 4,200
2,700 - 3,500
2,900 - 3,500
3Q 2014
2,800 - 3,500
3,200 - 4,000
2,800 - 3,500
2,900 - 3,500
2Q 2014
2,800 - 3,400
3,200 - 3,800
2,800 - 3,400
2,800 - 3,400
Average Capital Values – Mid Segment (INR/sf )
Source: Cushman and Wakefield Research
Note: The above values for mid segment apartments typically include units of 1,600-2,000 sf
The Tri-City region witnessed launch of around
700 units in the first quarter of 2015. With basic prices
in the range of INR 3,200-5,000/sf, new launches were
primarily in the northern and southern regions such
as Mullanpur, Zirakpur and Mohali.
New Residential Launches
Project Name Developer Location Number of Units* Type Area of Units (sf)
GBP Centrum 300 IndependentFloors
1 BHK: 475 to 491GBP Builders Zirakpur
Central Greens 280 Apartments 3 BHK: 1,460Preet Land Promoters and Developers
Sector 86, Mohali
Celestia Grand 60 IndependentFloors
3 BHK: 1,415Omaxe Mullanpur
Golden Oak SanskritiHomes
54 Apartments 3 BHK: 2,000Golden OakEstates
Mullanpur
13
Last Modified Date : 28-04-15

Commercial Office Sector
In 1Q 2015, BFSI, construction and automobile
sector companies had a major share in office space
take-up. Quoted rentals of IT Parks and SEZs were
around INR 50-60/sf/month and commercial spaces
were at INR 70-95/sf/month.
In 1Q 2015, capital values of under construction
projects increased by 2-3% across locations in
Mullanpur as developers revised basic selling prices
due to improved infrastructure in the region.
Approximately 450 units across several projects in
Zirakpur, Panchkula and Mohali are expected to be
ready for possession in the next quarter.
Under Construction Residential Property Update
The first quarter of 2015 witnessed retailer activity
primarily from accessories’ brands in mall locations
across the Tri-City region with brands such as Da
Milano and Inglot taking up spaces. Demand in main
street locations remained tepid during the quarter
Retail Sector
with footwear and apparel retailers such as Geox and
Levis taking up space in prominent locations. Rentals
across malls and main street locations remained
stable from the previous quarter.
Capital values are likely to remain stable in the
high-end segment despite improvement in
transaction activity, considering that there exists
significant unsold inventory. New launch activity is
likely to pick up in the northern submarket of
Mullanpur. Panchkula is expected to witness
softening of mid segment capital values due to
significant availability of ready to move projects.
No new office supply is likely to be added in the
next quarter. Demand may remain moderate and
Outlook
rentals are expected to remain stable over the next
quarter, considering the prevailing high vacancies.
Approximately 350,000 sf of mall space is
scheduled for completion in the second quarter of
2015, which is likely to increase vacancy levels in
Mohali submarket. Mall rentals are likely to remain
stable in Chandigarh city whilst they may soften
marginally in the peripheral submarkets.
14
Last Modified Date : 28-04-15
Chennai
Market Overview
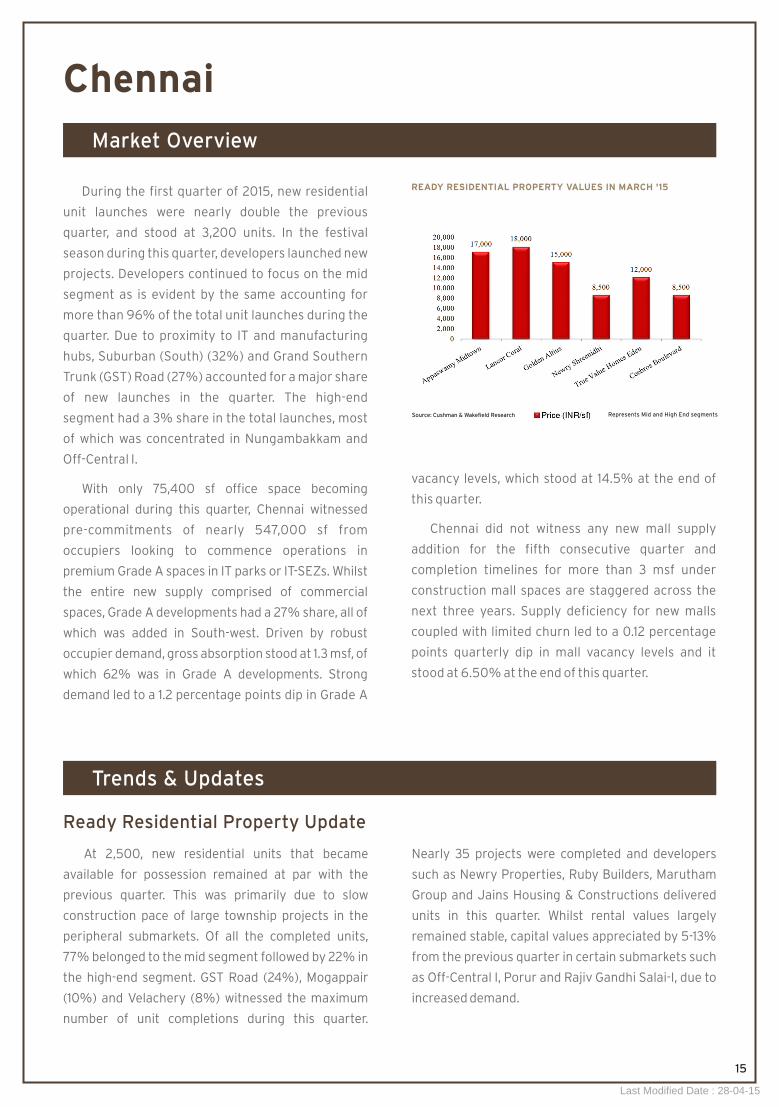
During the first quarter of 2015, new residential
unit launches were nearly double the previous
quarter, and stood at 3,200 units. In the festival
season during this quarter, developers launched new
projects. Developers continued to focus on the mid
segment as is evident by the same accounting for
more than 96% of the total unit launches during the
quarter. Due to proximity to IT and manufacturing
hubs, Suburban (South) (32%) and Grand Southern
Trunk (GST) Road (27%) accounted for a major share
of new launches in the quarter. The high-end
segment had a 3% share in the total launches, most
of which was concentrated in Nungambakkam and
Off-Central I.
With only 75,400 sf office space becoming
operational during this quarter, Chennai witnessed
pre-commitments of nearly 547,000 sf from
occupiers looking to commence operations in
premium Grade A spaces in IT parks or IT-SEZs. Whilst
the entire new supply comprised of commercial
spaces, Grade A developments had a 27% share, all of
which was added in South-west. Driven by robust
occupier demand, gross absorption stood at 1.3 msf, of
which 62% was in Grade A developments. Strong
demand led to a 1.2 percentage points dip in Grade A
vacancy levels, which stood at 14.5% at the end of
this quarter.
Chennai did not witness any new mall supply
addition for the fifth consecutive quarter and
completion timelines for more than 3 msf under
construction mall spaces are staggered across the
next three years. Supply deficiency for new malls
coupled with limited churn led to a 0.12 percentage
points quarterly dip in mall vacancy levels and it
stood at 6.50% at the end of this quarter.
READY RESIDENTIAL PROPERTY VALUES IN MARCH '15
Source: Cushman & Wakefield Research Represents Mid and High End segments
Trends & Updates
Ready Residential Property Update
At 2,500, new residential units that became
available for possession remained at par with the
previous quarter. This was primarily due to slow
construction pace of large township projects in the
peripheral submarkets. Of all the completed units,
77% belonged to the mid segment followed by 22% in
the high-end segment. GST Road (24%), Mogappair
(10%) and Velachery (8%) witnessed the maximum
number of unit completions during this quarter.
Nearly 35 projects were completed and developers
such as Newry Properties, Ruby Builders, Marutham
Group and Jains Housing & Constructions delivered
units in this quarter. Whilst rental values largely
remained stable, capital values appreciated by 5-13%
from the previous quarter in certain submarkets such
as Off-Central I, Porur and Rajiv Gandhi Salai-I, due to
increased demand.
15
Last Modified Date : 28-04-15

Source: Cushman & Wakefield Research
Note: The above values for mid segment typically include units of 1,000-2,000 sf
The time series have been adjusted to reflect the updated values
Average Capital Values – Mid Segment (INR ’000/sf)
Location
Adyar
Rajiv Gandhi
Salai (Perungudi)
Velachery
T. Nagar
Mylapore
Mogappair
Kilpauk
2009
4.5 - 6.5
2.5 - 2.8
3.5 - 4.0
4.0 - 6.5
NA
NA
4.5 - 6.0
2008
4.5 - 6.5
2.5 - 3.6
3.8 - 4.2
4.0 - 6.5
NA
NA
4.5 - 6.0
2010
6.0 - 8.5
3.5 - 4.5
3.5 - 5.0
7.5 - 10.5
NA
NA
6.0 - 8.0
2011
8.0 - 11.0
4.0 - 5.5
3.5 - 5.5
8.5 - 11.5
8.0 - 12.5
5.0 - 5.5
7.5 - 9.5
2012
9.0 - 13.0
5.0 - 6.3
4.5 - 6.5
8.5 - 14.0
10.0 - 15.0
5.0 - 6.5
9.0 - 12.0
10.0 - 14.0
5.0 - 6.3
6.0 - 8.0
10.0 - 17.0
12.0 - 17.0
5.0 - 7.5
2014
No availability
No availability
12.0 - 15.0
5.0 - 7.0
6.0 - 8.0
10.0 - 17.0
12.0 - 17.0
5.0 - 7.5
1Q 2015
10.0 - 14.0
5.0 - 6.3
6.0 - 8.0
10.0 - 16.0
12.0 - 17.0
5.0 - 7.5
9.0 - 12.0
2013
Source: Cushman & Wakefield Research
Note: The above values for high-end segment typically include units of 1,800-4,000 sf
The time series have been adjusted to reflect the updated values
*RA Puram also includes Alwarpet and Abhiramapuram
**Poes Garden also includes Venus Colony and Kasturi Rangan Road
Location 2008
18.0-24.0
13.0-15.0
NA
NA
5.5-10.0
14.5-20.0
13.0-16.0
6.0-9.0
4.0-8.0
Boat Club
R.A Puram*
Besant Nagar
Kotturpuram
Adyar
Poes Garden**
Nungambakkam
Anna Nagar
Kilpauk
2010
18.0-23.0
13.0-16.5
NA
NA
8.0-12.0
14.5-20.0
13.0-16.5
7.5-10.5
8.0-12.0
2009
18.0-20.0
13.0-15.0
NA
NA
5.5-9.5
14.5-18.0
13.0-16.0
6.0-9.0
4.0-8.0
2011
20.0-25.0
14.0-17.0
12.5-13.5
12.0-14.0
11.5 - 13.5
17.5-24.5
13.0-17.0
8.0-11.5
9.0-15.0
2012
23.0-27.0
15.0-19.0
13.0-14.5
14.0-16.0
13.0-14.5
18.5-25.0
17.0-20.0
12.0-14.0
12.0-15.0
Average Capital Values – High-end Segment (INR ‘000/sf)
2013
23.0-33.0
17.0-23.0
13.5-15.0
14.0-20.0
14.0-17.5
20.5-28.0
14.0-25.0
12.0-17.0
12.0-16.0
2014
23.0-35.0
17.0-23.0
13.5-15.0
14.0-20.0
14.0-17.5
20.5-33.0
14.0-25.0
12.0-17.0
12.0-16.0
1Q 2015
23.0-35.0
17.0-25.0
13.5-15.0
14.0-20.0
16.0-17.5
20.5-33.0
14.0-25.0
12.0-17.0
12.0-16.0
New Residential Launches
At 3,200, unit launches nearly doubled from the
previous quarter as many developers launched new
projects during the first quarter, to coincide with the
auspicious Pongal festival. New unit launches in the
mid segment continued to dominate and witnessed
more than 220% quarterly increase, as developers
focused on introducing products in this segment
that matched the homebuyers’ affordability.
Locations along the IT corridor of Rajiv Gandhi Salai
such as Sholinganallur, Siruseri as well as Suburban
(South) locations such as 200 Feet Pallavaram
T h o ra i p a k ka m Ro a d , M e d a va k ka m a n d
Perumbakkam witnessed significant new launches
due to their proximity to IT parks and IT-SEZs. New
launches in the high-end segment declined by 70%
over the previous quarter with launches largely
concentrated in Nungambakkam, Kotturpuram and
Off-Central I.
16
Last Modified Date : 28-04-15

Project Name Developer Location Number of Units* Type Area of Units (in sf)
S.I.S Queenstown South India Shelters
India Pvt. Ltd.Guduvanchery 424 Apartments 2 BHK: 623 to 1,226
2.5 BHK: 1,263 to 1,304
3 BHK: 1,373 to 1,508
Pinnacle Crest Baashyam
ConstructionsSholinganallur 421 Apartments 1 BHK: 579 to 607
2 BHK: 1,109 to 1,186
2.5 BHK: 1,336 to 1,357
3 BHK: 1,582 to 1,592
Temple Waves Amarprakash
DevelopersChrompet 405 Apartments 2 BHK: 616 to 918
3 BHK: 980
Casa Grande Cherry Pick
Casa Grande Pvt. Ltd. Perumbakkam 380 Apartments 1 BHK: 590 to 701
2 BHK: 1,199 to 1,354
2.5 BHK: 1,186 to 1,433
3 BHK: 1,379 to 1,624
3.5 BHK: 1,546 to 1,768
Real ValuePadmalaya Grand –Tower P,Q,E,F
Real Value Promoters Siruseri 288 Apartments 2 BHK: 942 to 1,060
3 BHK: 1,380 to 1,454
SkyPod Residences Vishwakarma Properties 200 Ft Pallavaram
Thoraipakkam Road280 Apartments 2 BHK:1,111
3 BHK: 1,363
S&P Essence - Phase I S&P Living Spaces Ayanambakkam 200 Apartments 1.5 BHK: 560 to 566
2 BHK: 952 to 953
3 BHK: 1,746 to 1,761
Urban Tree Wow Urban Tree Infrastructure Medavakkam 169 Apartments 2 BHK: 926 to 1,177
3 BHK: 1,428
Jamals Caladium Jamals Enterprises Velappanchavadi 158 Apartments 2 BHK: 955 to 1,105
3 BHK: 1,280 to 1,385
Silver Crest Rajkham Builders Madurapakkam 116 Apartments 2 BHK: 1,002 to 1,072
2.5 BHK: 1,271
3 BHK: 1,258 to 1,400
Vrindavan Enclave Amaar Foundations &
PropertiesVirugambakkam 64 Apartments 2 BHK: 972 to 1,110
3 BHK: 1,200 to 1,838
Color County Color Homes Iyappanthangal 60 Apartments 2 BHK: 884 to 974
3 BHK: 1,124 to 1,177
Tower of Adyar Nahar Group Adyar 56 Apartments 3 BHK: 2,113
4 BHK: 2,384 to 2,420
Shrayans Cara Properties Nungambakkam
High Road47 Apartments 4 BHK: 4,000 to 5,000
Hamlin AKB Developers Pallavaram 45 Apartments 2 BHK: 783 to 1,033
3 BHK: 1,265
GVSPL Raksha Green Valley Shelters
Pvt. Ltd.Valasaravakkam 35 Apartments 2 BHK: 1,145 to 1,165
2 BHK: 1,570 to 1,860
Green Crest Green Valley Shelters
Pvt. Ltd.Anna Nagar 28 Apartments 3 BHK: 1,260 to 1,345
Navin's Skanda Navin Housing Chrompet 16 Apartments 2 BHK: 1,032
3 BHK: 1,180
Sri Lakshmivilas Altis Properties Kotturpuram 11 Apartments 3 BHK: 2,392
4 BHK: 2,692
Aise Devinrayan Housing Nandanam 5 Apartments 4 BHK: 2,462
Sree Sarada Nivas Devinarayan Housing Mandaveli 4 Apartments 3 BHK: 2,494
Aquarelle Devinarayan Housing Kanathur 4 Apartments 3 BHK: 5,850 to 5,968
Sangeeth Arihant Foundations Shanthi Colony 3 Apartments 3 BHK: 2,000
* Estimated and as per market information 17
Last Modified Date : 28-04-15
Commercial Office Sector
Despite the improving occupier demand, Grade A
net absorption levels dipped by 19% from the
previous quarter and stood at 495,000 sf at the end
of the first quarter of 2015. This decline was
primarily due to change in employee to space ratio
requirements of a few major IT-ITeS companies. The
IT corridor of Suburban South (64%) and Peripheral
South (32%) witnessed maximum net absorption of
Grade A spaces. IT-ITeS sector was the major
demand driver and accounted for nearly 95% of
total gross absorption during the quarter. Rentals
largely remained stable in all sub markets, as
compared to the previous quarter.
Outlook
Whilst more than 4,300 residential units remain in
soft launch stages, the number of new unit launches
during the next quarter may remain at par with 1Q
2015, as developers may channelize larger efforts
towards completion of under construction units.
In the next quarter, nearly 1.5 msf of new office
supply is expected be added. Of the total new supply,
65% is expected to constitute Grade A spaces, all of
which will become operational in Suburban South.
Whilst leasing may strengthen, overall vacancy
levels may increase in the next quarter due to this
substantial new supply addition.
As no new mall supply is likely to be added in the
next quarter, mall vacancy levels may decline further
as prevalent demand for mall spaces from footwear,
F&B and apparel retailers remains strong. Anna
Nagar - 2nd Avenue and Pondy Bazar may witness
rental appreciation due to healthy demand and
limited options for prime retail spaces.
Retail Sector
Established main streets such as Anna Nagar 2nd
Avenue witnessed a steep rental escalation of 15%
compared to the last quarter as strengthening
demand and entry of new retailers prompted owners
(not affected by ongoing infrastructure upgrades) to
charge higher rentals. Purusawakam High Road too
witnessed a 4% rental rise due to higher demand
from footwear and apparel retailers.
As of 1Q 2015, under construction units across
various segments were around 33,600. As per
current estimates, these units are likely to complete
by the end of 2015. More than 90% of these units are
apartment projects and the remaining are villas, row
Under Construction Residential Property Update
houses and duplexes. Nearly one-third of these units
consist of new phases in existing township
developments in peripheral locations such as
Chrompet, Oragadam, Vandalur-Kelambakkam
Road, Perambur and Siruseri.
18
Last Modified Date : 28-04-15

Delhi - National Capital Region (NCR)
Market Overview
With around 2,800 new unit launches, Delhi-NCR
witnessed a decline of approximately 68% during
the first quarter of 2015, as compared to the
previous quarter. The decline in new launches was
primarily due to increasing unsold inventory, forcing
developers to restrict new launches. Capital values
remained stable from the previous quarter across all
submarkets in Delhi-NCR. With stable demand,
rentals also remained stable during the quarter
across most submarkets.
With Grade A office supply addition of about 2.1
msf in the first quarter of 2015, a marginal decline of
around 2.9% was noted from the previous quarter.
This quarter witnessed net absorption of more than
0.6 msf in Grade A developments, a 58% decline
from the previous quarter. No pre-commitments
were noted during the first quarter of 2015. Rental
values firmed up significantly in Gurgaon CBD, due
to limited availability and significant demand.
No new mall supply was added in the first quarter
of 2015, resulting in overall mall vacancy declining by
0.5 percentage points to 14.4%. Demand remained
high for mall spaces in Ghaziabad, Gurgaon and
South Delhi. Rental values in malls remained stable
from the previous quarter. Main street locations
across Greater Kailash, Lajpat Nagar and Green Park
witnessed healthy space take-up during the quarter.
Trends & Updates
Ready Residential Property Update
Due to subdued transaction activity, capital
values across all segments of various submarkets
remained stable from the previous quarter.
Transaction activity in the luxury segment seems to
be recovering with availability of several value deals
in this segment. Although the market remains buyer
friendly, capital values continued to remain stable
due to existing high unsold inventory.
READY RESIDENTIAL PROPERTY VALUES IN MARCH '15
Source: Cushman & Wakefield Research Represents Mid and High End segments
19
Last Modified Date : 28-04-15
High-end Segment:
South-west: Shanti Niketan, Westend, Anand Niketan,
Vasant Vihar, etc.
South-east: Friends Colony East, Friends Colony West,
Maharani Bagh, Greater Kailash – I, Greater Kailash – II, etc.
South-central: Defence Colony, Anand Lok, Niti Bagh,
Gulmohar Park, Hauz Khas Enclave, Safdarjung
Development Area, Mayfair Gardens, Panchsheel Park,
Soami Nagar, Sarvaodaya Enclave, etc.
Central: Jorbagh, Golf Links, Amrita Shergil Marg,
Aurangzeb Road, Prithviraj Road, Sikandara Road, Tilak
Marg, Ferozshah Road, Mann Singh Road, Sunder Nagar,
Nizamuddin, Tees January Marg, Chanakyapuri, etc.
Gurgaon-Luxury: Golf Course Road (Sectors 26, 26A, 27,
28, 42, 43, 53-56)
Gurgaon-High end: Golf Course Road (Sectors 24-26,
26A, 27, 28, 42, 43, 53-56), Mehrauli-Gurgaon Road
(Sectors 24-26) Golf Course Extension Road (Sectors 58-
63, 63A, 65-67 and 67A), Sohna Road (Sectors 38, 47-
49), Central Gurgaon (Sectors 40, 41, 44-46, 50-52 and
57) and Dwarka Expressway (Sectors 99, 99A, 102, 102A,
103-110, 110A, 111-114)
Noida: Sectors 34-37, 39-41, 44, 50, 51, 92, 93, 96-98,
128 and 133
Mid Segment:
South-east: New Friends Colony, Kalindi Colony, Ishwar
Nagar, Sukhdev Vihar, Kailash Colony, Pamposh Enclave, etc.
South-central: Uday Park, Green Park, Saket, Asiad
Village, Geetanjali Enclave, Safdarjung Enclave,
Sarvapriya Vihar, Panchsheel Enclave, Navjeevan Vihar, etc.
Gurgaon: Sohna Road (Sectors 38, 47-49), Southern
Peripheral Road (Sectors 68-70, 70A, 71-73), New Gurgaon
(Sectors 76-81, 81A, 82, 82A, 83-86, 88, 88A, 88B, 89,
89A, 90-93, 95, 95A and 95B) Dwarka Expressway
(Sectors 99, 99A, 102, 102A, 103-110, 110A, 111-114) and
Sohna
Noida: Sectors 50, 74-79, 82, 83, 110, 112, 115-121, 134, 135,
137, 143, 150, 151 and 168), Greater Noida and Yamuna
Expressway
Key to Locations:
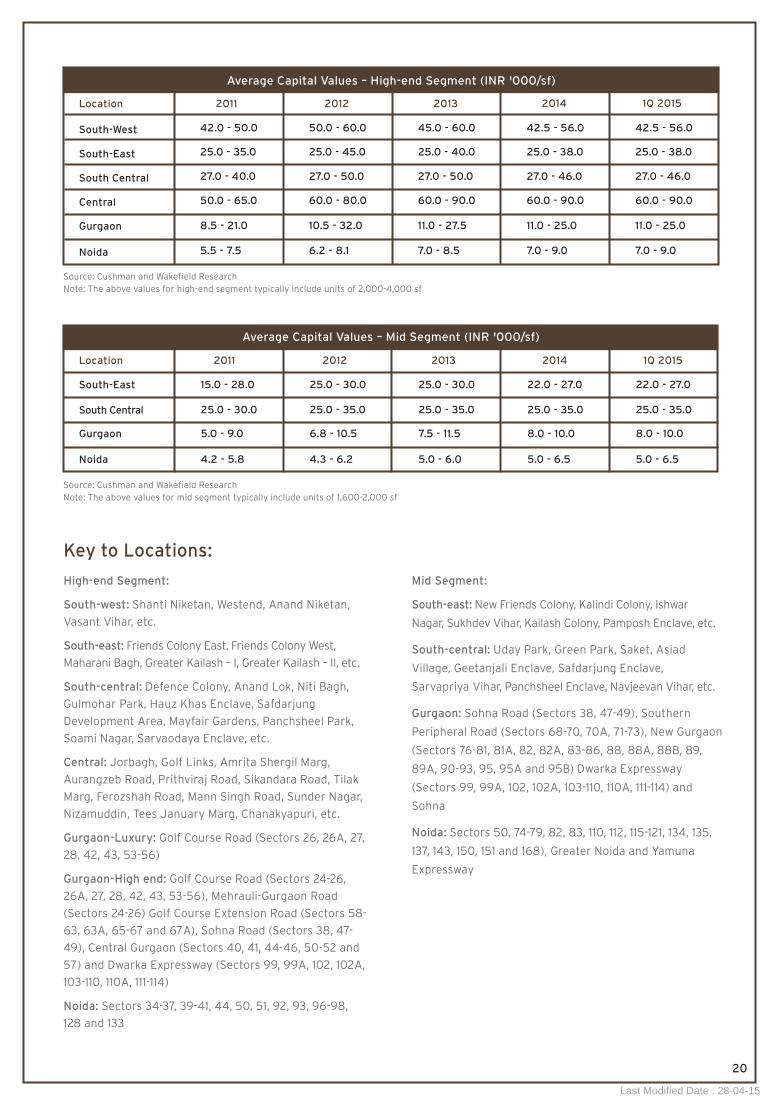
Average Capital Values – High-end Segment (INR '000/sf)
Location
South-West
South-East
South Central
Central
Gurgaon
Noida
42.0 - 50.0
25.0 - 35.0
27.0 - 40.0
50.0 - 65.0
8.5 - 21.0
5.5 - 7.5
2011
50.0 - 60.0
25.0 - 45.0
27.0 - 50.0
60.0 - 80.0
10.5 - 32.0
6.2 - 8.1
2012
45.0 - 60.0
25.0 - 40.0
27.0 - 50.0
60.0 - 90.0
11.0 - 27.5
7.0 - 8.5
2013
42.5 - 56.0
25.0 - 38.0
27.0 - 46.0
60.0 - 90.0
11.0 - 25.0
7.0 - 9.0
2014
42.5 - 56.0
25.0 - 38.0
27.0 - 46.0
60.0 - 90.0
11.0 - 25.0
7.0 - 9.0
1Q 2015
Source: Cushman and Wakefield Research
Note: The above values for high-end segment typically include units of 2,000-4,000 sf
Source: Cushman and Wakefield Research
Note: The above values for mid segment typically include units of 1,600-2,000 sf
Average Capital Values – Mid Segment (INR '000/sf)
South-East
South Central
Gurgaon
Noida
Location
15.0 - 28.0
25.0 - 30.0
5.0 - 9.0
4.2 - 5.8
2011
25.0 - 30.0
25.0 - 35.0
6.8 - 10.5
4.3 - 6.2
2012
25.0 - 30.0
25.0 - 35.0
7.5 - 11.5
5.0 - 6.0
2013
22.0 - 27.0
25.0 - 35.0
8.0 - 10.0
5.0 - 6.5
2014
22.0 - 27.0
25.0 - 35.0
8.0 - 10.0
5.0 - 6.5
1Q 2015
20
Last Modified Date : 28-04-15
21
Amrapali Enchante ApartmentsAmrapali Sector 16B, Greater
Noida (West)
650 2 BHK: 850 to 900
3 BHK: 1,050 to 1,150
Familia ApartmentsNimai Group Sector 7, Sohna 650 2 BHK: 1,150
3 BHK: 1,450
Sports Home ApartmentsDevsai Construction Sector 1, Greater
Noida (West)
366 2 BHK: 1,140
4 BHK: 3,210
Bollywood Towers ApartmentsAmrapali Sector 1, Greater
Noida (West)
360 2 BHK: 975 to 1,100
Omaxe Riyasat ApartmentsOmaxe Sector 93B, Noida 276 2 BHK: 1,225
3 BHK: 1,675
The Crest ApartmentsDLF DLF Phase V, Gurgaon 250 4 BHK: 3,081 to 3,497
Mahagun Villaments ApartmentsMahagun Group Sector 10, Greater
Noida (West)
104 3 BHK: 2,600
4 BHK: 2,950
Ayana Independent
FloorsRaheja Sector 79B, Gurgaon 96 3 BHK: 1,800 to 2,430
4 BHK: 2,564
Aspire Independent
FloorsAce Developers Sector 1, Greater Noida
(West)
72 2 BHK: 1,160
3 BHK: 1,365
4 BHK: 1,595
Project Name Developer Location Number of Units* Type Area of Units (in sf)
* Estimated and as per market information
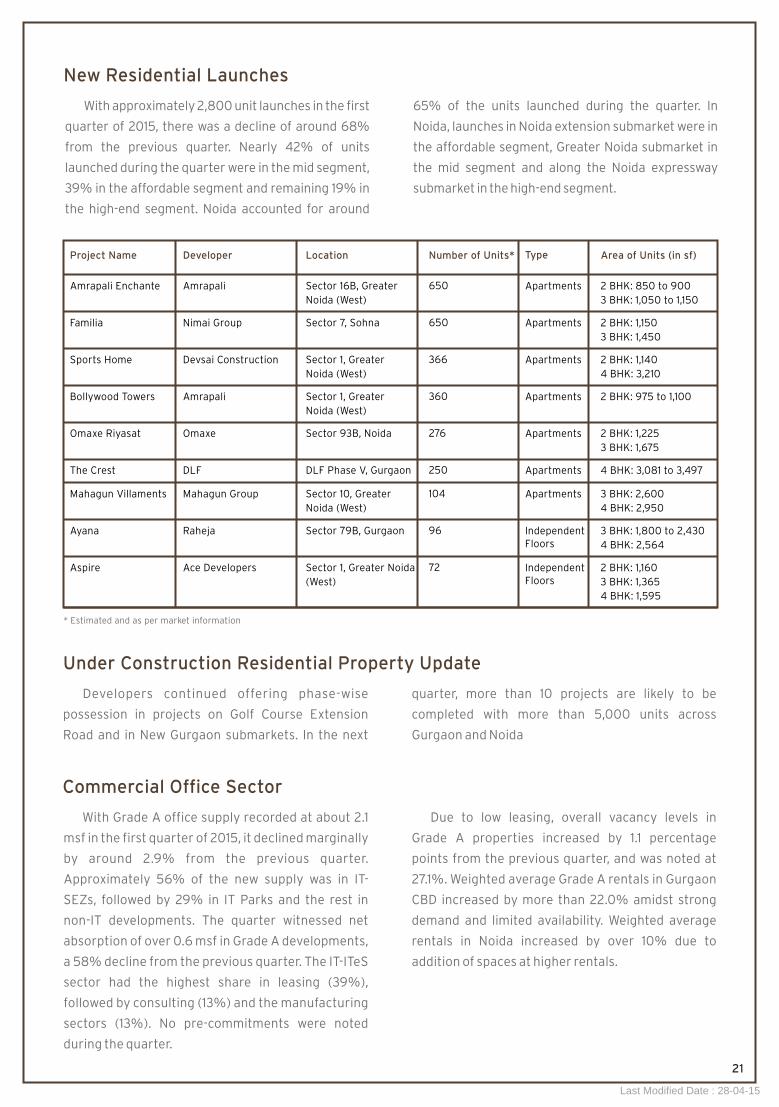
With approximately 2,800 unit launches in the first
quarter of 2015, there was a decline of around 68%
from the previous quarter. Nearly 42% of units
launched during the quarter were in the mid segment,
39% in the affordable segment and remaining 19% in
the high-end segment. Noida accounted for around
New Residential Launches
65% of the units launched during the quarter. In
Noida, launches in Noida extension submarket were in
the affordable segment, Greater Noida submarket in
the mid segment and along the Noida expressway
submarket in the high-end segment.
Developers continued offering phase-wise
possession in projects on Golf Course Extension
Road and in New Gurgaon submarkets. In the next
Under Construction Residential Property Update
quarter, more than 10 projects are likely to be
completed with more than 5,000 units across
Gurgaon and Noida
Commercial Office Sector
With Grade A office supply recorded at about 2.1
msf in the first quarter of 2015, it declined marginally
by around 2.9% from the previous quarter.
Approximately 56% of the new supply was in IT-
SEZs, followed by 29% in IT Parks and the rest in
non-IT developments. The quarter witnessed net
absorption of over 0.6 msf in Grade A developments,
a 58% decline from the previous quarter. The IT-ITeS
sector had the highest share in leasing (39%),
followed by consulting (13%) and the manufacturing
sectors (13%). No pre-commitments were noted
during the quarter.
Due to low leasing, overall vacancy levels in
Grade A properties increased by 1.1 percentage
points from the previous quarter, and was noted at
27.1%. Weighted average Grade A rentals in Gurgaon
CBD increased by more than 22.0% amidst strong
demand and limited availability. Weighted average
rentals in Noida increased by over 10% due to
addition of spaces at higher rentals.
Last Modified Date : 28-04-15

22
Mall vacancy levels were recorded at 14.4%, a 0.5
percentage points decline from the previous quarter.
Demand for mall spaces was driven mainly by
retailers of accessories and apparel such as Carat
Lane, Fossil, Nappadori, etc. Robust demand and
limited availability led to a quarterly rental increase
Retail Sector
of 7.1% in DLF Galleria, Gurgaon. Rentals in other
main street locations maintained status quo during
the quarter. F&B and jewellery retailers were the key
demand generators across main streets with brands
such as Subway, The Backyard and Senco Gold,
expanding their presence in the city.
Developers are likely to focus on completing
under construction projects rather than launching
new projects in the short term. As a result, new
launch activity may remain subdued in the next
quarter. In the absence of significant triggers for
demand improvement, capital values in Delhi and
Gurgaon may remain stable in the next quarter.
However, capital values in Noida may strengthen in
the next quarter due to continued end-user demand.
Approximately 3.9 msf of office space is likely to
be added in the next quarter. Although some of this
may be deferred, vacancy levels are likely to
increase, as net absorption is not likely to keep pace
with the supply.
Outlook
Nearly 1.9 msf of new mall supply is scheduled for
completion in the next quarter across Ghaziabad,
South Delhi and West Delhi. With tepid demand,
rental values are expected to remain stable. In
addition, infusion of new supply would lead to an
increase in vacancy levels in select submarkets.
Rentals across most main street locations are
expected to remain stable. Prominent main street
locations such as Connaught Place, Lajpat Nagar
and Greater Kailash II are expected to witness
continued retailer interest.
Last Modified Date : 28-04-15
Market Overview
Hyderabad
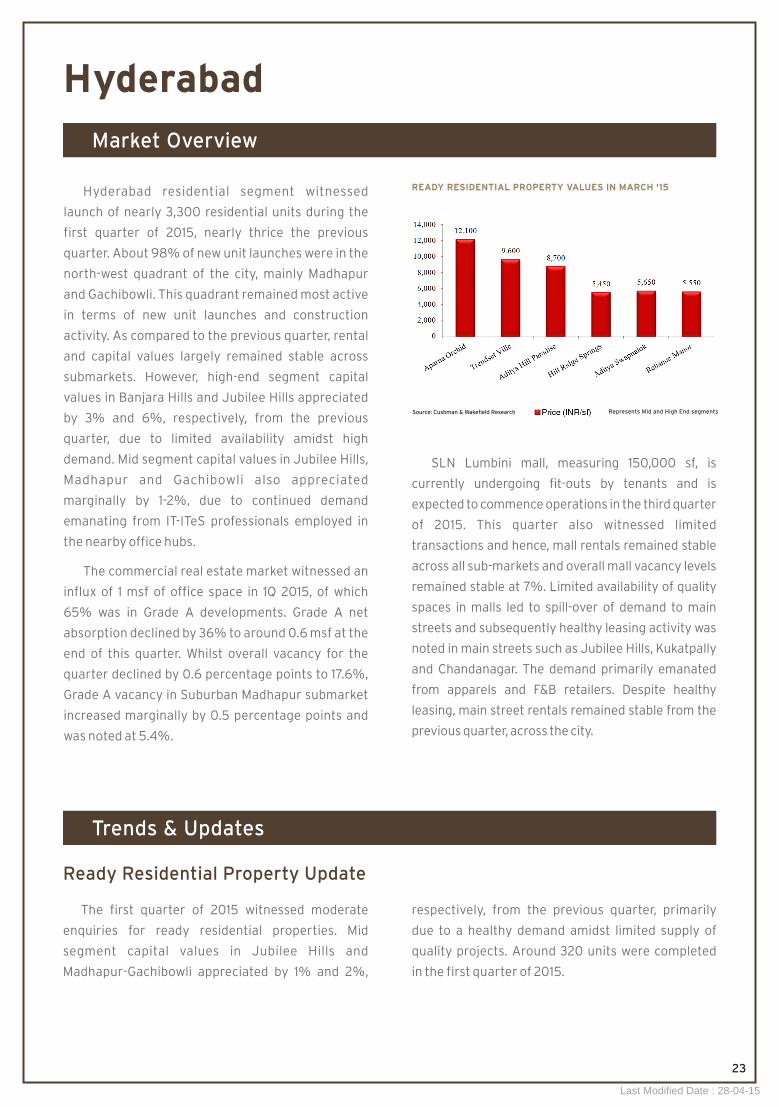
Hyderabad residential segment witnessed
launch of nearly 3,300 residential units during the
first quarter of 2015, nearly thrice the previous
quarter. About 98% of new unit launches were in the
north-west quadrant of the city, mainly Madhapur
and Gachibowli. This quadrant remained most active
in terms of new unit launches and construction
activity. As compared to the previous quarter, rental
and capital values largely remained stable across
submarkets. However, high-end segment capital
values in Banjara Hills and Jubilee Hills appreciated
by 3% and 6%, respectively, from the previous
quarter, due to limited availability amidst high
demand. Mid segment capital values in Jubilee Hills,
Madhapur and Gachibowli also appreciated
marginally by 1-2%, due to continued demand
emanating from IT-ITeS professionals employed in
the nearby office hubs.
The commercial real estate market witnessed an
influx of 1 msf of office space in 1Q 2015, of which
65% was in Grade A developments. Grade A net
absorption declined by 36% to around 0.6 msf at the
end of this quarter. Whilst overall vacancy for the
quarter declined by 0.6 percentage points to 17.6%,
Grade A vacancy in Suburban Madhapur submarket
increased marginally by 0.5 percentage points and
was noted at 5.4%.
SLN Lumbini mall, measuring 150,000 sf, is
currently undergoing fit-outs by tenants and is
expected to commence operations in the third quarter
of 2015. This quarter also witnessed limited
transactions and hence, mall rentals remained stable
across all sub-markets and overall mall vacancy levels
remained stable at 7%. Limited availability of quality
spaces in malls led to spill-over of demand to main
streets and subsequently healthy leasing activity was
noted in main streets such as Jubilee Hills, Kukatpally
and Chandanagar. The demand primarily emanated
from apparels and F&B retailers. Despite healthy
leasing, main street rentals remained stable from the
previous quarter, across the city.
Trends & Updates
Ready Residential Property Update
The first quarter of 2015 witnessed moderate
enquiries for ready residential properties. Mid
segment capital values in Jubilee Hills and
Madhapur-Gachibowli appreciated by 1% and 2%,
respectively, from the previous quarter, primarily
due to a healthy demand amidst limited supply of
quality projects. Around 320 units were completed
in the first quarter of 2015.
23
Source: Cushman & Wakefield Research Represents Mid and High End segments
READY RESIDENTIAL PROPERTY VALUES IN MARCH '15
Last Modified Date : 28-04-15

New Residential Launches
The first quarter of 2015 witnessed three times
residential unit launches compared to the previous
quarter. Approximately 3,300 units were launched in
this quarter, all in the high-end segment. New
projects were launched primarily in Madhapur and
Gachibowli.
24
Project Name Developer Location Number of Units* Type Area of Units (in sf)
Highfields Prestige Constructions Gachibowli 2,240 Apartments 2 BHK: 1,283
2.5 BHK: 1,410 to 1,492
3 BHK: 1,742
3.5 BHK: 1,919 to 1,993
4 BHK: 2,713 to 2,848
3 BHK+Home Theatre: 4,070
Etania Lansum Gachibowli 552 Apartments 3 BHK: 1,895 to 3,255
4 BHK: 4,085
Ivy League Prestige Constructions Madhapur 349 Apartments 2 BHK: 1,327 to 1,355
3 BHK: 1,738 to 2,051
4 BHK: 3,031 to 3,498
Source: Cushman and Wakefield Research
Note: The above values for high-end segment typically include units of 1,600-4,000 sf
Banjara Hills
Jubilee Hills
Himayatnagar
West & East Marredpally
Begumpet, Somajiguda
Madhapur, Gachibowli
Kukatpally
Miyapur, Nizampet
Location 2009
3.3 - 4.0
2.6 - 3.3
5.8 - 6.5
5.5 - 6.3
3.3 - 4.0
3.3 - 3.8
3.9 - 4.5
3.5 - 4.3
2010
3.5 - 4.5
2.7 - 3.4
6.0 - 7.2
6.0 - 7.0
3.7 - 4.0
3.5 - 4.0
4.1 - 4.5
3.8 - 4.9
2011
3.8 - 5.1
2.8 - 3.5
6.4 - 7.5
6.2 - 7.2
3.7 - 4.2
3.6 - 4.3
4.3 - 4.8
3.9 - 5.3
2012
3.8 - 5.1
2.9 - 3.5
6.5 - 7.5
6.1 - 7.2
3.6 - 4.2
3.6 - 4.3
4.3 - 4.7
4.1 - 5.3
2013
4.0 - 6.0
2.9 - 3.5
7.0 - 9.5
6.5 - 9.5
4.0 - 5.5
4.0 - 5.5
4.5 - 5.5
4.5 - 6.0
2014
4.0 - 6.0
2.9 - 3.5
7.0 - 9.5
6.5 - 9.5
4.0 - 5.5
4.0 - 5.5
4.5 - 5.5
4.5 - 6.0
4.0 - 6.0
2.9 - 3.5
7.0 - 10.0
7.0 - 10.0
4.0 - 5.5
4.0 - 5.5
4.5 - 5.5
4.5 - 6.0
1Q 2015
Average Capital Values – High-end Segment (INR ‘000/sf)
Source: Cushman and Wakefield Research
Note: The above values for mid segment typically include units of 1,200-1,600 sf
Banjara Hills
Jubilee Hills
Himayatnagar
West & East Marredpally
Begumpet, Somajiguda
Madhapur, Gachibowli
Kukatpally
Miyapur, Nizampet
Location
2.4 - 2.9
1.8 - 2.5
3.6 - 4.2
3.5 - 4.0
2.7 - 3.0
2.5 - 2.8
2.6 - 3.1
2.5 - 3.1
2009
3.6 - 4.5
3.7 - 4.0
2.7 - 3.5
2.7 - 3.2
1.8 - 2.5
2.7 - 3.0
2.8 - 3.5
2.6 - 3.4
2010
2.9 - 3.5
2.4 - 3.0
3.8 - 4.6
4.0 - 4.2
2.7 - 3.7
2.8 - 3.2
2.9 - 3.6
2.8 - 3.5
2011
2.9 - 3.6
2.2 - 3.4
3.8 - 4.8
4.0 - 4.2
2.8 - 3.6
2.7 - 3.2
2.8 - 3.6
3.0 - 3.8
2012
3.1 - 4.0
2.7 - 3.4
4.0 - 5.0
3.8 - 4.4
3.0 - 3.8
3.0 - 3.5
3.0 - 4.0
3.5 - 4.2
2013
3.3 - 4.0
2.8 - 3.6
4.0 - 5.2
3.8 - 4.4
3.0 - 3.8
3.0 - 3.5
3.2 - 4.0
3.6 - 4.5
2014
3.3 - 4.0
2.9 - 3.6
4.0 - 5.2
3.8 - 4.5
3.0 - 3.8
3.0 - 3.5
3.2 - 4.0
3.8 - 4.6
1Q 2015
Average Capital Values - Mid Segment (INR ‘000/sf)
Last Modified Date : 28-04-15

25
Under Construction Residential Property Update
The North-West quadrant continued to witness
robust construction activities. Capital values of high-
end segment projects at Banjara Hills and Jubilee Hills
appreciated by 3% and 6%, respectively, from the
previous quarter due to limited availability amidst
high demand. Capital values of mid segment projects
at Jubilee Hills, Madhapur and Gachibowli too
appreciated marginally by 1-2% from the previous
quarter, due to sustained demand driven by IT-ITeS
professionals, coupled with availability of good
offerings at competitive prices.
Project Name Developer Location Number of Units* Type Area of Units (in sf)
Northstar District 1 Northstar Homes Gachibowli 151 Apartments 3BHK: 1,600 to 2,400
Fortune Galaxy Fortune Developers Banjara Hills 55 Apartments 3 BHK: 1,445 to 2,400
Studio: 500 to 900
* Estimated and as per market information
In the commercial office sector, majority of the
supply was concentrated in the suburban locations
of Madhapur (65%) and Gachibowli (21%). Although
IT-ITeS sector dominated leasing activity with a 65%
share, majority of the space (53%) was leased in
non-IT buildings. Grade A net absorption for the
quarter was 0.6 msf, recording a 36% quarterly
decline. Whilst overall vacancy declined by 0.6
percentage points (to 17.6%), low absorption
Commercial Office Sector
coupled with high supply addition in Grade A
developments in Suburban Madhapur submarket
resulted in a 0.5 percentage point increase in
vacancy. Rentals continued to remain nearly stable
across all submarkets, except the Prime Suburban
submarket where the weighted average rental
values declined by 6% due to an increase in vacant
spaces amidst high supply.
SLN Lumbini mall, measuring 150,000 sf, is
currently undergoing fit-outs by tenants and is
expected to commence operations in the third
quarter of 2015. This quarter witnessed limited
transactions and hence, mall rentals remained
stable across all sub-markets. Overall mall vacancy
levels remained stable from the previous quarter
Retail Sector
and were noted at 7%. Healthy leasing activity was
noted in main streets such as Jubilee Hills,
Kukatpally and Chandanagar. Demand primarily
emanated from apparel & F&B retailers. Despite
healthy leasing, main street rentals remained stable
across the city.
Last Modified Date : 28-04-15

26
High-end segment capital values may appreciate
marginally in Banjara Hills and Jubilee Hills in the
next quarter. Mid segment capital values in
submarkets such as Banjara Hills, Jubilee Hills,
Madhapur and Gachibowli may witness marginal
appreciation due to sustained demand and
availability of good offerings at competitive prices.
Nearly 2.6 msf of supply infusion is expected in
the upcoming quarter. Rental values in Suburban
Gachibowli submarket may appreciate marginally in
the next quarter as upcoming supply is likely to be
introduced at higher rentals. Limited availability of
Outlook
quality office spaces in Madhapur may result in
heightened demand in Gachibowli.
With no new supply addition and limited
availability in existing malls, rentals are likely to
remain stable in the next quarter. Rentals across
most main streets are expected to remain stable in
the upcoming quarter as leasing is expected to
remain steady. However, access related issues in
specific micro-markets such as Raj Bhavan Road /
Somajiguda may be a reason for waning retailers’
interest, which may lead to lower demand and
subsequently lower rentals.
Last Modified Date : 28-04-15

Market Overview
Jaipur
Approximately 1,200 units were launched in
Jaipur during the first quarter of 2015, a 44%
decline from the previous quarter. The quarter
witnessed unti launches primarily in the mid
segment. Locations across Mansarovar witnessed
the highest number of new unit launches followed by
Sirsi Road and Vaishali Nagar. Capital Values
appreciated marginally (around 1-3%) in both mid
and high-end segment.
No new office supply was added in the first
quarter of 2015. Transaction activity remained
stable during the quarter with demand primarily
from IT-ITeS and manufacturing companies. Rentals
maintained status quo from the previous quarter,
across all submarkets.
No new mall supply was added during the first
quarter of 2015. Healthy transaction activity was
noted in the main street locations of Mirza Ismail
(M.I.) Road and Malviya Nagar. During the quarter,
demand for mall spaces arose from large apparel,
lifestyle and F&B retailers. Rentals across malls and
main street locations maintained status quo during
the quarter.
Trends & Updates
Ready Residential Property Update
Capital values increased in the range of 1-2%
across high-end and mid segment properties during
the first quarter of 2015, due to stable demand from
end-users. In the high-end segment, whilst capital
values remained stable in Bapu Nagar, C-Scheme
witnessed the highest increase of 2.1% followed by
Civil Lines (1.4%) and Malviya Nagar (1.3%).
READY RESIDENTIAL PROPERTY VALUES IN MARCH '15
Source: Cushman & Wakefield Research Represents Mid and High End segments
27
Last Modified Date : 28-04-15

New Residential Launches
In the first quarter of 2015, new project launches
were primarily in the Western peripheries of the city.
Nearly 1,200 units were launched, of which 39%
were in Mansarovar followed by 34% in Sirsi Road,
17% in Vaishali Nagar and remaining in Jagatpura.
The quarter witnessed launches only in the mid
segment. The Basic Sale Price (BSP) of the new
launches ranged from INR 2,400-3,500/sf.
Project Name Developer Location Number of Units* Type Area of Units (in sf)
Terraza Greens Shivank Group Mansarovar 380 Apartments 2 BHK: 1,257 to 1,390
3 BHK: 1,321 to 1,782
Ozone SNG Group Sirsi Road 312 Apartments 2 BHK: 950 to 1,509
3 BHK: 1,200 to 2,000
The Horizon Vardhman Group Vaishali Nagar 204 Apartments 2 BHK: 900 to 1,200
3 BHK: 1,420 to 1,545
Bhavyaa Green Aradhana Buildtech Jagatpura 108 Apartments 2 BHK: 1,050 to 1,310
3 BHK: 1,560 to 1,580
Atelier Erica Apeksha Group Sirsi Road 98 Apartments 2 BHK: 980
3 BHK: 1,300 to 1,450
The Trump IPG Group Mansarovar 90 Apartments 2 BHK: 952 to 1,300
3 BHK: 1,300
28
Source: Cushman and Wakefield Research
Note: The above values for high-end segment typically include units of 2,000-4,000 sf, both apartments and villas
*sqyd: Square Yard
Average Capital Values – High End (INR ‘000/sf)
Location
C- Scheme
Bapu Nagar
Civil Lines
Malviya Nagar
1Q 2014
8,000-10,500/sf
7,000-9,000/sf
80,000-100,000/sqyd
75,000-95,000/sqyd
3Q 2014
8,000-11,000/sf
7,000-9,000/sf
80,000-110,000/sqyd
75,000-100,000/sqyd
2Q 2014
8,000-10,500/sf
7,000-9,000/sf
80,000-100,000/sqyd
75,000-95,000/sqyd
Average Capital Values – High-end Segment (INR)
1Q 2015
8,200-11,200/sf
7,000-9,000/sf
82,500-115,000/sqyd
77,500-105,000/sqyd
4Q 2014
8,000-11,000/sf
7,000-9,000/sf
80,000-115,000/sqyd
75,000-105,000/sqyd
Source: Cushman and Wakefield Research
Note: The above values for mid segment apartments typically include units of 1,600-2,000 sf, both apartments and villas
*sqyd: Square Yard
Average Capital Values – High End (INR ‘000/sf)
Location
Malviya Nagar
Vaishali Nagar
Mansarovar
Jagatpura
3Q 2014
60,000-75,000/sqyd
2,900-3,600/sf
2,800-3,800/sf
2,900-3,400/sf
1Q 2015
65,000-77,500/sqyd
3,000-3,600/sf
2,800-3,850/sf
2,900-3,500/sf
4Q 2014
65,000-75,000/sqyd
2,900-3,600/sf
2,800-3,850/sf
2,900-3,500/sf
2Q 2014
60,000-75,000/sqyd
2,900-3,400/sf
3,000-3,500/sf
2,900-3,300/sf
1Q 2014
60,000-75,000/sqyd
2,900-3,300/sf
3,000-3,400/sf
2,900-3,200/sf
Average Capital Values – Mid Segment (INR)
* Estimated and as per market information
Last Modified Date : 28-04-15

Commercial Office Sector
No new office supply was added in the first quarter
of 2015. Rental values in the Central Business District
(CBD) of MI Road and C-Scheme remained stable at
INR 65/sf/month and that for Secondary Business
District (SBD) at INR 35-50/sf/month. IT-ITeS and
manufacturing companies had a majority share in
office space take-up during the quarter.
No new mall supply was added during the first
quarter of 2015. Demand for mall spaces was primarily
from large lifestyle and apparel brands such as Marks
& Spencer and Shoppers Stop. Main street locations of
MI Road and Malviya Nagar witnessed interest from
Retail Sector
apparels and F&B retailers such as Van Heusen, Allen
Solly and Dunkin Donuts. Rentals remained stable
from the previous quarter across malls and main
street locations.
Capital values in the residential sector are likely
to remain stable in the short term with marginal
improvement in submarkets of C-scheme and Sirsi
Road, due to bettering infrastructure. Considering
that only a few projects are currently in the pre-
launch stages, number of new launches are likely to
decline in the future periods.
New office space measuring 80,000 sf is
expected to be added during the next quarter. Rental
Outlook
values are expected to remain stable with stagnant
demand for office space.
No new mall supply is expected to be added in the
next quarter. Rentals are expected to remain stable
in malls due to existing high vacancies. Main street
location of MI road, Malviya Nagar and Vaishali
nagar are expected to witness slight increase in
rentals due to increased interest from retailers.
Under Construction Residential Property Update
Around 11 projects began offering possession in
the first quarter of 2015. Submarkets of Vaishali
Nagar witnessed the highest share of completions
along with projects on Ajmer Road and Sanganer
submarkets. The next quarter is expected to witness
completions primarily in the submarket of C-schme
and Sanganer.
29
Last Modified Date : 28-04-15
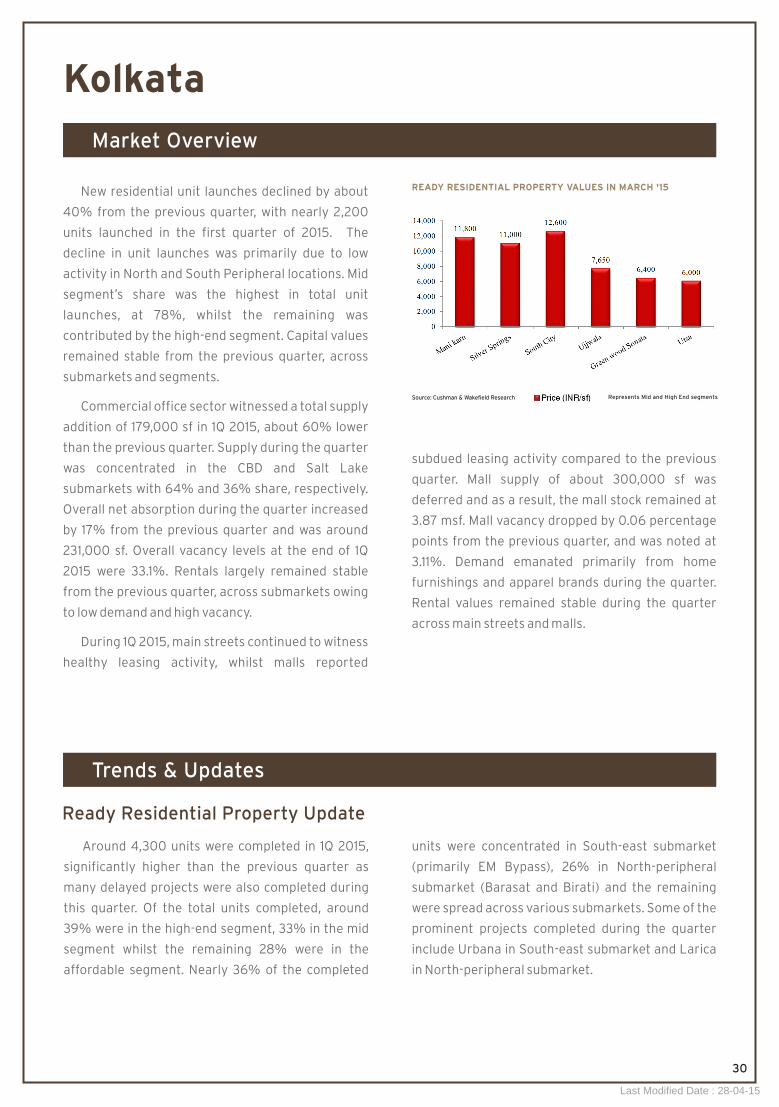
Market Overview
Kolkata
New residential unit launches declined by about
40% from the previous quarter, with nearly 2,200
units launched in the first quarter of 2015. The
decline in unit launches was primarily due to low
activity in North and South Peripheral locations. Mid
segment’s share was the highest in total unit
launches, at 78%, whilst the remaining was
contributed by the high-end segment. Capital values
remained stable from the previous quarter, across
submarkets and segments.
Commercial office sector witnessed a total supply
addition of 179,000 sf in 1Q 2015, about 60% lower
than the previous quarter. Supply during the quarter
was concentrated in the CBD and Salt Lake
submarkets with 64% and 36% share, respectively.
Overall net absorption during the quarter increased
by 17% from the previous quarter and was around
231,000 sf. Overall vacancy levels at the end of 1Q
2015 were 33.1%. Rentals largely remained stable
from the previous quarter, across submarkets owing
to low demand and high vacancy.
During 1Q 2015, main streets continued to witness
healthy leasing activity, whilst malls reported
subdued leasing activity compared to the previous
quarter. Mall supply of about 300,000 sf was
deferred and as a result, the mall stock remained at
3.87 msf. Mall vacancy dropped by 0.06 percentage
points from the previous quarter, and was noted at
3.11%. Demand emanated primarily from home
furnishings and apparel brands during the quarter.
Rental values remained stable during the quarter
across main streets and malls.
Trends & Updates
Ready Residential Property Update
Around 4,300 units were completed in 1Q 2015,
significantly higher than the previous quarter as
many delayed projects were also completed during
this quarter. Of the total units completed, around
39% were in the high-end segment, 33% in the mid
segment whilst the remaining 28% were in the
affordable segment. Nearly 36% of the completed
units were concentrated in South-east submarket
(primarily EM Bypass), 26% in North-peripheral
submarket (Barasat and Birati) and the remaining
were spread across various submarkets. Some of the
prominent projects completed during the quarter
include Urbana in South-east submarket and Larica
in North-peripheral submarket.
READY RESIDENTIAL PROPERTY VALUES IN MARCH '15
Source: Cushman & Wakefield Research Represents Mid and High End segments
30
Last Modified Date : 28-04-15

31
High-end Segment:
South: Southern Avenue, Hindustan Park, Triangular
Park, Lake Terrace.
South Central: Ballygunge, Queens Park, Rainy Park,
Gurusaday Road, Ballyguange Circular Road, Dover Lane.
South-East: EM Bypass - Science City, Christopher Road,
Pancha Sayar.
South-West: Alipore Park Road, Ashoka Road, Burdwan
Road, Belvedere Road.
Central: Park Street, Camac Street, Shakespeare Sarani,
Minto Park, Elgin Road, Lee Road, Loudon Street, Rowdon
Street.
North: Kankurgachi, Lake Town, VIP Road, Ultadanga,
Narkeldanga Main Road
East: Salt Lake
North-East: New Town, Rajarhat
Mid segment:
South: Golf Green, Tollygunge, Lake Gardens, Jodhpur Park
South-central: Deshpriya Park, Hazra Road, Bhawanipur
South-east: Ajoy Nagar, Hiland Park, PA Shah
Connector
North-east: Rajarhat, Rajarhat Chowmatha
South-west: Tollyguange Circular Road, New Alipore,
Behala, Jones Lang Sarani
North: Jessore Road, Ultadanga, Shyambazar, Bagbazar,
Girish Park, Manicktala, Dum Dum
North peripheral: BT Road, Barasat, Madhyamgram,
Sodepur
South peripheral: Garia, Narendrapur, Sonarpur,
South-west peripheral**: Joka, Maheshtala, Budge
Budge, Thakurpukur
Key to Locations:Key to Locations:
Source: Cushman and Wakefield Research
Note: The above values for mid segment typically include units of 1,000-2,000 sf
Average Capital Values – Mid Segment (INR ‘000/sf)
Location
South
South - Central
South - East
North - East
North
2009
2.7 - 3.9
4.2 - 5.3
2.4 - 2.8
1.9 - 2.2
1.8 - 3.4
2010
3.2 - 4.5
4.5 - 6.0
2.5 - 3.2
2.2 - 2.7
2.2 - 4.7
2011
3.8 - 5.5
5.5 - 8.0
2.8 - 4.5
2.4 - 3.0
2.8 - 5.2
2012
3.8 - 5.5
5.5 - 8.0
2.8 - 4.5
2.4 - 3.5
2.8 - 5.2
2013
3.8 - 6.5
5.8 - 8.8
2.9 - 5.0
2.7 - 4.0
3.0 - 5.8
1Q 2015
4.0 - 6.7
5.9 - 8.9
3.0 - 5.2
2.9 - 4.1
3.1 - 6.0
2014
4.0 - 6.7
5.9 - 8.9
3.0 - 5.2
2.9 - 4.1
3.1 - 6.0
Average Capital Values – Mid Segment (INR ‘000/sf)
East
North - East
South
South - Central
South - East
South - West
Central
4.0 - 5.2
3.0 - 4.0
4.8 - 5.9
8.5 - 9.6
4.5 - 5.7
8.6 - 9.8
7.2 - 10.0
2009
4.5 - 6.0
3.5 - 5.0
6.3 - 8.5
10.0 - 18.0
5.8 - 9.2
10.0 - 15.0
9.0 - 15.0
2011
4.5 - 6.8
3.8 - 5.7
7.0 - 12.0
10.0 - 18.0
5.8 - 9.5
10.0 - 15.0
10.0 - 17.0
2012
5.0 - 7.7
4.2 - 6.5
7.5 - 13.0
12.5 - 18.5
6.0 - 10.5
12.0 - 17.0
12.0 - 19.5
2013
5.0 - 7.7
4.3 - 6.5
7.5 - 13.0
12.5 - 18.5
6.2 - 11.0
12.0 - 17.0
12.0 - 19.5
2014
4.0 - 5.5
3.2 - 4.5
5.3 - 6.8
9.5 - 13.0
4.5 - 8.0
8.9 - 13.0
8.0 - 12.5
20102010Location
5.0 - 7.7
4.3 - 6.5
7.5 - 13.0
12.5 - 18.5
6.2 - 11.0
12.0 - 17.0
12.0 - 19.5
1Q 2015
Source: Cushman and Wakefield Research
Note: The above values for high-end segment typically include units of 2,000-4,000 sf
Average Capital Values – High-End Segment (INR ‘000/sf)
Last Modified Date : 28-04-15

New residential unit launches dropped by about
40% from the previous quarter, with 2,200 units
launched in the first quarter of 2015. The decline in
unit launches was primarily due to low launch activity
in North and South peripheral locations wherein large
project launches were deferred due to approval
delays. Of the total unit launches during the quarter,
New Residential Launches
about 78% catered to the mid segment, whilst the
remaining to the high-end segment. A few theme-
based projects were launched during the quarter in
Rajarhat and EM Bypass in North-east and South-east
submarkets, respectively. A few developers also
offered home loan interest rates as low as 7-8%
(under special schemes) to attract buyers.
32
Springfield
Unimark Group
Rajarhat 522
Apartments
2 BHK: 923 to 1,008
3 BHK: 1,160 to 1,417
4 BHK:1,711 to 1,738
Galaxia 2
Siddha Group
Rajarhat 408
Apartments
2 BHK: 1,005 to 1,090
3 BHK: 1,230 to 1,370
The Pyramid
Mounthill Realty
Rajarhat 340
Apartments
2 BHK: 969
3BHK: 1,301 to 1,536
Richmond Park (Phase 1)
Eden Group
Atlas More 150
Apartments
2 BHK: 844 to 994
3 BHK:1,035 to 1,318
Zen
PS Group/ SrijanRealty
Topsia
117 Apartments
3 BHK: 2,123 to 2,317
4 BHK: 2,831 to 2,940
Belvedere
Eden Group
Nayabad 75
Apartments
1 BHK: 400 to 459
2 BHK: 763 to 987
3 BHK: 1,133 to 1,342
Kings Hut (Phase 2)
Real Networth Builders
Rajarhat 72
Apartments
2 BHK: 762 to 875
3 BHK: 930 to 1,262
Sky Terraces
Eden Group
Nayabad 63
Apartments
2 BHK: 972 to 1,029
3BHK: 1,121 to 1,484
Tolly Signature Plus
Eden Group
Tollygunge 62
Apartments
2 BHK: 956 to 1,151
3 BHK: 1,294 to 1,660
Orange Nest
Cancun Group
Rajarhat 56
Apartments
2 BHK: 880 to 1,040
3 BHK: 1,135 to 1,300
Fabulous Duo
Fabulous Group
Rajarhat 48
Apartments
2 BHK: 872 to 1,032
3 BHK: 1,269 to 1,464
Sarovar Residency
Sweet Hut Group
Rajarhat 45
Apartments
2 BHK: 810 to 9502
3 BHK: 1,270
Avion
Sri Siddhi Vinayak
Rajarhat 41
Apartments
1 BHK: 482
2 BHK: 700 to 891
3 BHK:1,016 to 1,310
Sinjini Apartment
Sweet Hut Group
Rajarhat 38
Apartments
2 BHK: 900 to 937
3 BHK: 1,145 to 1,280
Elanza
Magnolia Infra
Rajarhat 32
Apartments
2 BHK: 845 to 875
Aspire
Magnolia Infra
Rajarhat 32
Apartments
2 BHK: 650 to 720
3 BHK: 920 to 1,150
Iris
Cancun Group
Rajarhat 30
Apartments
1 BHK: 561
2 BHK: 704 to 915
Jeevandeep
Banyan Tree Group
Rajarhat 25
Apartments
1 BHK: 487
2 BHK: 810 to 1,032
3 BHK:1,122
Sikha Tuku
Unimark Group
Garia 14 Apartments
3 BHK: 1,500 to 1,635
Palatial
Saltee Group
Syed Amir Ali Avenue 13 Apartments
4 BHK: 4,500
Exotica (Block K)
Eden Group
EM Bypass 8 Apartments
2 BHK: 920 to 983
Project Name Developer Location Number of Units* Type Area of Units (in sf)
* Estimated and as per market information
Last Modified Date : 28-04-15

33
Under Construction Residential Property Update
Approximately 5,700 units were in the final
stages of construction and are likely to be delivered
in the next quarter. Prominent projects that are
nearing completion include Orbit Crystal in the
South-west submarket and Clubtown Gateway in the
North-east submarket, both catering to the high-end
segment. In 1Q 2015, capital values of under
construction projects remained stable across
submarkets. However, select projects in the North-
east and North submarket’s mid segment witnessed
marginal appreciation of about 2-3% on the back of
healthy demand owing to the location’s proximity to
IT hubs and improving physical infrastructure.
Commercial Office Sector
Around 178,500 sf of office space was added in 1Q
2015, about 63% lower than the previous quarter.
This was primarily due to deferment of a few large
projects, owing to subdued demand. Nearly 64% of
total supply added during the quarter was
concentrated in the CBD, whilst the remaining 36%
was in the Salt Lake submarket. Total net absorption
during the fourth quarter was noted at 231,000 sf, an
increase of 16% from the previous quarter. However,
the total Grade A net absorption was higher
(288,000 sf) due to relocations from lower grade
properties. About 92% of the total absorption was
noted in the peripheral submarkets of Salt Lake
(75%) and Rajarhat (17%). Overall vacancy levels at
the end of 1Q 2015 were 33.1% whilst the rentals
remained stable from the previous quarter.
During 1Q 2015, main streets witnessed healthy
leasing activity, whilst it remained subdued in malls as
compared to the previous quarter. Central locations
such as Camac Street, Elgin Road, Theatre Road and
Park Street led the leasing activity in both main
streets and malls. Home furnishings and apparels
were the most active segments during the quarter.
International apparel brand Marks & Spencer
expanded its presence in the city by leasing 16,000 sf
Retail Sector
of retail space in prime main street of Elgin Road in
central Kolkata. Mall supply of about 300,000 sf was
deferred and so the mall stock remained at 3.87 msf.
Hence, mall vacancy dropped by 0.06 percentage
points and was noted at 3.11%. Global restaurant chain
- Thank God Its Friday (TGIF) leased about 9,800 sf in a
mall located on Elgin Road. Rental values remained
stable during the quarter across main streets and
malls in most sub-markets.
Last Modified Date : 28-04-15
Outlook
Total unit launches in the next quarter are likely
to be higher than the current quarter, considering
that there are significant projects in the pre-launch
stages. Rajarhat in the North-east submarket is
likely to contribute significantly to the new launches
along with peripheral locations in North (BT Road,
Madhyamgram, and Barasat) and South (Garia, Joka,
Sonarpur). Capital values are likely to remain stable
across submarkets.
Commercial office sector is anticipated to witness
huge supply addition of about 1.9 msf in the next
quarter, of which 75% is previously deferred supply.
Nearly 66% of this upcoming supply would be
concentrated in Sector-V, Salt Lake submarket,
followed by 15% in Rashbehari Connector
submarket. Net absorption is anticipated to improve
in the next quarter considering the enquiry levels
and pre-commitments. However, as demand is
unlikely to keep pace with the upcoming supply,
vacancy levels are expected to increase
substantially. As a result, rentals are expected to
remain stable or witness marginal downward
pressure in peripheral submarkets of Salt Lake and
Rajarhat.
During the next quarter, mall supply of about
638,000 sf is likely to be added, which would be
concentrated in South and West Kolkata. Healthy
leasing activity is anticipated across malls and main
streets, considering the enquiry levels and
availability of retail spaces. Rentals are expected to
remain stable across most malls and main streets.
34
Last Modified Date : 28-04-15
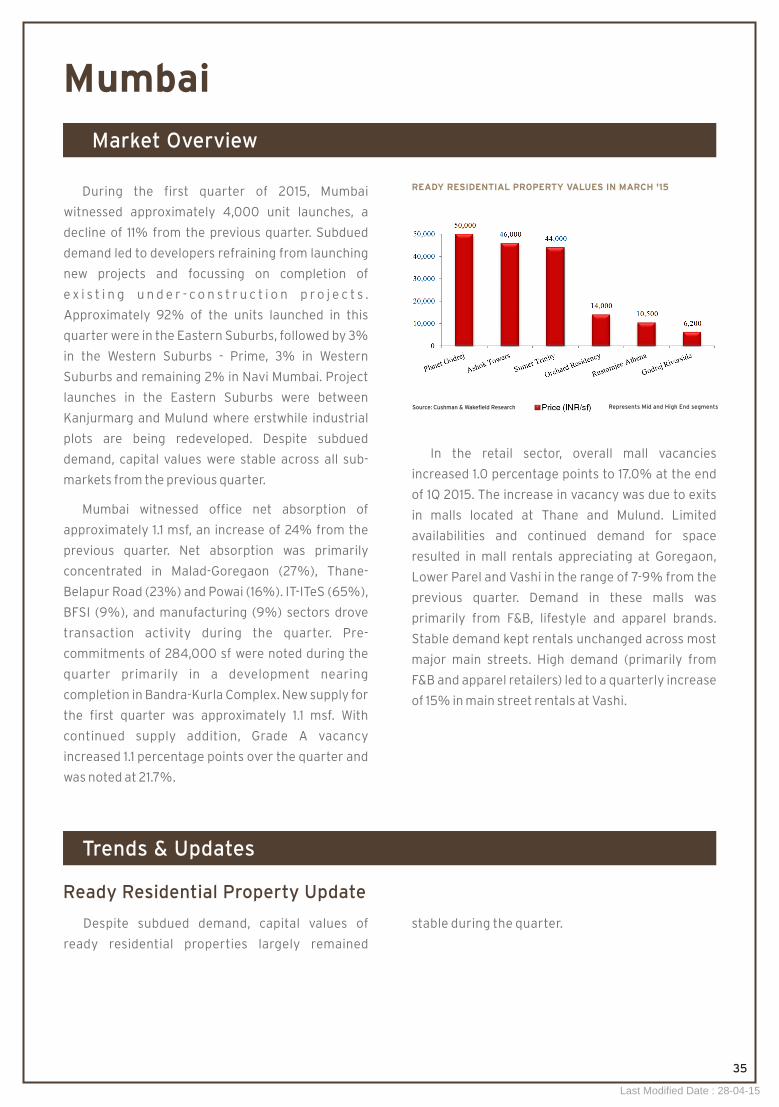
Market Overview
Mumbai
During the first quarter of 2015, Mumbai
witnessed approximately 4,000 unit launches, a
decline of 11% from the previous quarter. Subdued
demand led to developers refraining from launching
new projects and focussing on completion of
e x i s t i n g u n d e r - c o n s t r u c t i o n p r o j e c t s .
Approximately 92% of the units launched in this
quarter were in the Eastern Suburbs, followed by 3%
in the Western Suburbs - Prime, 3% in Western
Suburbs and remaining 2% in Navi Mumbai. Project
launches in the Eastern Suburbs were between
Kanjurmarg and Mulund where erstwhile industrial
plots are being redeveloped. Despite subdued
demand, capital values were stable across all sub-
markets from the previous quarter.
Mumbai witnessed office net absorption of
approximately 1.1 msf, an increase of 24% from the
previous quarter. Net absorption was primarily
concentrated in Malad-Goregaon (27%), Thane-
Belapur Road (23%) and Powai (16%). IT-ITeS (65%),
BFSI (9%), and manufacturing (9%) sectors drove
transaction activity during the quarter. Pre-
commitments of 284,000 sf were noted during the
quarter primarily in a development nearing
completion in Bandra-Kurla Complex. New supply for
the first quarter was approximately 1.1 msf. With
continued supply addition, Grade A vacancy
increased 1.1 percentage points over the quarter and
was noted at 21.7%.
In the retail sector, overall mall vacancies
increased 1.0 percentage points to 17.0% at the end
of 1Q 2015. The increase in vacancy was due to exits
in malls located at Thane and Mulund. Limited
availabilities and continued demand for space
resulted in mall rentals appreciating at Goregaon,
Lower Parel and Vashi in the range of 7-9% from the
previous quarter. Demand in these malls was
primarily from F&B, lifestyle and apparel brands.
Stable demand kept rentals unchanged across most
major main streets. High demand (primarily from
F&B and apparel retailers) led to a quarterly increase
of 15% in main street rentals at Vashi.
Ready Residential Property Update
Trends & Updates
Despite subdued demand, capital values of
ready residential properties largely remained
stable during the quarter.
35
READY RESIDENTIAL PROPERTY VALUES IN MARCH '15
Source: Cushman & Wakefield Research Represents Mid and High End segments
Last Modified Date : 28-04-15

36
South: Colaba, Cuffe Parade, Nariman Point, Churchgate, etc.
South Central: Altamount Road, Carmichael Road, Malabar
Hill, Napeansea Road, Breach Candy, Pedder Road, etc.
Central: Worli, Prabhadevi, Lower Parel/ Parel
North: Bandra (W), Khar (W), Santacruz (W), Juhu, etc.
Far North: Andheri (W), Malad, Goregaon, etc.
North-East: Powai
Key to Locations:
2008
27.0 - 34.0
34.0 - 43.0
13.5 - 19.5
7.0 - 9.0
18.0 - 28.0
6.0 - 7.4
15.0 - 26.0
6.4 - 8.5
28.0 - 37.0
35.0 - 45.0
16.0 - 24.0
8.5 - 11.5
2009
17.0 - 30.0
6.5 - 8.5
30.0 - 40.0
40.0 - 48.0
16.0 - 25.0
9.0 - 12.0
2010
35.0 - 45.0
43.0 - 52.0
22.0 - 37.0
18.0 - 27.0
10.0 - 14.0
8.5 - 12.5
2012
40.0 - 50.0
45.0 - 58.0
23.0 - 40.0
20.0 - 30.0
10.0 - 14.0
9.0 - 13.0
2014
45.0 - 58.0
23.0 - 40.0
40.0 - 50.0
20.0 - 30.0
10.0 - 14.0
9.0 - 13.0
1Q 2015
40.0 - 50.0
45.0 - 58.0
23.0 - 40.0
20.0 - 30.0
10.0 - 14.0
8.5 - 12.5
2013
17.0 - 35.0
6.5 - 10.0
30.0 - 40.0
43.0 - 52.0
16.0 - 25.0
9.0 - 13.0
2011
Average Capital Values – Mid Segment (INR'000/sf)
Source: Cushman and Wakefield Research
Note: The above values for mid segment typically include units of 1,400-2,500 sf for South, South-Central, Central and North and units of 900-1,400 sf for
Far North and North-East
South Central
South Central
Source- Cushman and Wakefield Research
Note: The above values for high-end segment typically include units of 2,500-6,000 sf for South, South-Central, Central and North and units of 1,650-3,000 sf
for North (Santacruz & Juhu), Far North and North-East
South
Central
North
Far North
North East
Location
South
Central
North
Far North
North East
Location 2008
43.0 - 55.0
47.0 - 67.0
27.0 - 31.0
9.0 - 13.0
33.0 - 53.0
14.0 - 18.0
34.0 - 55.0
10.0 - 16.0
42.5 - 58.0
42.0 - 66.0
22.0 - 30.0
10.0 - 16.5
2009
35.0 - 55.0
10.0 - 16.0
43.0 - 60.0
45.0 - 70.0
24.0 - 32.0
11.0 - 16.5
2010
48.0 - 70.0
46.0 - 78.0
34.0 - 58.0
28.0 - 40.0
12.5 - 18.0
14.0 - 22.0
2012
15.0 - 22.0
48.0 - 75.0
46.0 - 83.0
27.0 - 65.0
28.0 - 48.0
12.5 - 18.0
2014
48.0 - 75.0
46.0 - 83.0
27.0 - 65.0
28.0 - 50.0
12.5 - 20.0
15.0 - 22.0
1Q 2015
15.0 - 22.0
48.0 - 75.0
46.0 - 83.0
27.0 - 65.0
28.0 - 48.0
12.5 - 18.0
2013
32.0 - 54.0
10.0 - 18.0
45.0 - 65.0
45.0 - 75.0
24.0 - 32.0
11.0 - 16.5
2011
Average Capital Values High-end Segment (INR ’000/sf)–
Last Modified Date : 28-04-15

New Residential Launches
Approximately 4,000 units were launched in the
first quarter of 2015, a decline of 11% from the
previous quarter. Mid and high-end segment
contributed 49% and 51% respectively to total unit
launches during the quarter. A premium project with
large unit size offerings was launched in Mulund, due
to which 3 BHK offerings dominated unit launches
with a 53% contribution, followed by 2 BHKs (24%),
4 BHKs (8%), 1 BHKs (8%) and 1.5 BHKs (7%).
37
Eternia
Oberoi Realty
Mulund 1,100 Apartments 3 BHK: 880 to 1,012 sf*
Runwal Forest
Runwal Group
Kanjurmarg 1,100 Apartments 1 BHK: 725 sf
2 BHK: 1,025 to 1,200 sf3 BHK: 1,575 to 1,800 sf
Enigma
Oberoi Realty
Mulund 600 Apartments 3 BHK: 1,257 sf*
4 BHK: 1,862 sf*
One Spirit
Nirmal Lifestyle
Mulund 480 Apartments 1 BHK: 639 sf
2 BHK: 882 sf3 BHK: 1,143 sf
Alta Vista
Spenta Corporation
Chembur 360 Apartments 1 BHK: 690 to 715 sf
2 BHK: 989 to 1,108 sf3 BHK: 1,452 to 1,582 sf
Lamansion
K Mordani Realty
Bandra East 146
Apartments 2 BHK: 1,225 to 1,235 sf3 BHK: 1,575 to 1,585 sf
Prisma
Oberoi Realty
Jogeshvari Vikhroli
Link Road
100 Apartments 4 BHK: 1,691 to 2,075 sf*
Akshar Alvario
Akshar Developers
Nerul 92
Apartments 2 BHK: 1,195 to 1,210 sf3 BHK: 1,805 to 2,120 sf
Project Name Developer Location Number of Units* Type Area of Units (in sf)
# Estimated and as per market information* Based on carpet area
Both peripheral and suburban locations
witnessed healthy construction activity during the
first quarter of 2015. Despite subdued demand,
developers held on to the capital values. With an aim
Under Construction Residential Property Update
to increase sales velocity, a few developers offered
subvention schemes and low down payment options
whilst some collaborated with financial institutions
to offer lower interest rates for a certain period.
New office supply of 1.1 msf became operational in
Mumbai, all of which was in Grade A developments.
Supply was nearly half the previous quarter and was
concentrated in Kurla (45%), Malad-Goregaon
Commercial Office Sector
(38%) and Lower Parel (17%). Low demand resulted
in CBD rentals declining by 10% during the quarter.
Rentals in all other submarkets continued to be
quoted in a similar range during the first quarter.
Last Modified Date : 28-04-15

Retail Sector
High demand coupled with limited availabilities
resulted in main street rentals at Vashi increasing by
15% over the quarter. Stable demand resulted in
rentals remaining unchanged across all other main
streets. Mall rentals appreciated in Vashi (9%),
Goregaon (8%) and Lower Parel (7%) during the
quarter. Select malls in Goregaon and Lower Parel
are looking to get in new brands to boost trading
densities and maintain their distinctiveness
amongst competitors.
Outlook
In February 2015, the Municipal Corporation of
Greater Mumbai released draft Development Plan
2034 which proposes higher FSI of upto 8,
depending on the location. This may lead to a decline
in project launches, as developers may refrain from
launching new projects until these regulations come
into effect. Residential capital values are expected to
remain stable in the short term, as any price hike
may negatively affect demand.
The second quarter of 2015 is expected to witness
office supply of 1.5 msf in Bandra-Kurla Complex.
With improving macro-economic conditions and
companies looking to execute growth strategies,
demand is likely to improve in the coming quarters.
Rentals are likely to improve in a few locations such
as Lower Parel and Goregaon in the upcoming
months due to high demand and limited quality
availabilities; rentals in all other sub-markets are
likely to remain stable.
Mall rentals may appreciate in quality
developments in Lower Parel and Goregaon due to
increasing demand from F&B and apparel brands.
High level of enquiries for prime main streets of
Borivali LT Road and Lokhandwala - Andheri may also
result in higher rentals at these locations. Enquiries
for quality space remains high especially from foreign
apparel brands such as H&M, Gap and Massimo Dutti,
due to which transaction activity in main streets is
likely to increase in the coming quarter.
38
Last Modified Date : 28-04-15

Market Overview
Pune
Nearly 3,300 units were launched in Pune in the
first quarter of 2015. Launch activity declined by
33% from the previous quarter, as many developers
launched only select blocks in their upcoming
projects. Mid segment contributed 70% to the total
unit launches, followed by the high-end (21%) and
affordable segment (9%). Capital values remained
stable from the previous quarter across all
segments.
Total office supply of 731,300 sf was added in the
first quarter of 2015. 76% of this supply was
contributed by Grade A developments in Off-CBD –
East and Suburban East micro-markets. 68% of the
supply came in through completion of 500,000 sf
phase in an SEZ. Despite substantial supply addition,
healthy transaction activity led to 0.5 percentage
points quarterly decline in All Grade vacancy, to be
noted at 19.9% in 1Q 2015.
Mall inventory remained unchanged in 1Q 2015, as
a mall was deferred due to approval delays. Mall
vacancy dipped by 2.3 percentage points in a
quarter, to be noted at 20.7% due to stable
transaction activity and no new supply addition.
Trends & Updates
Ready Residential Property Update
Due to high unsold inventory, capital values
across locations maintained status quo. The quoted
values remained in the same range across segments
as developers staggered launch activity in phases, to
better manage project cash-flows and concentrate
on clearing existing stock. One luxury project in
suburban Pune, handed over units in one tower.
READY RESIDENTIAL PROPERTY VALUES IN MARCH '15
Source: Cushman & Wakefield Research Represents Mid and High End segments
39
Last Modified Date : 28-04-15
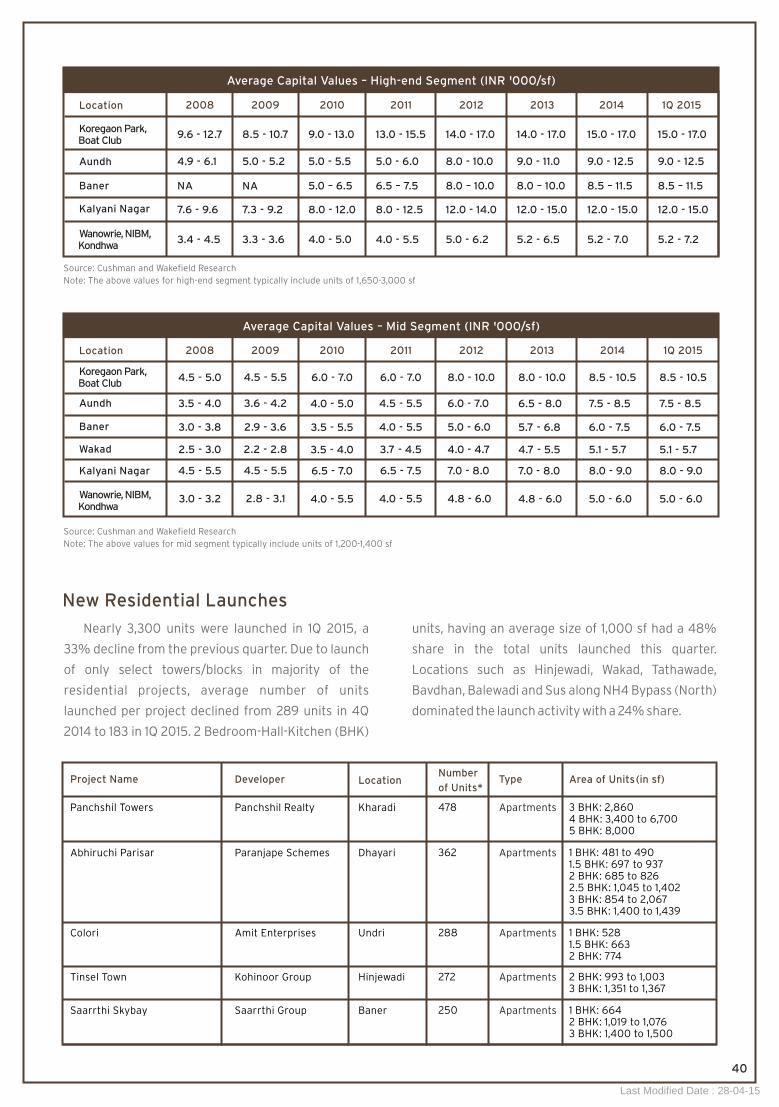
40
Source: Cushman and Wakefield Research
Note: The above values for high-end segment typically include units of 1,650-3,000 sf
Koregaon Park, Boat Club
Wanowrie, NIBM,Kondhwa
Location
Aundh
Baner
Kalyani Nagar
2008
3.4 - 4.5
9.6 - 12.7
4.9 - 6.1
NA
7.6 - 9.6
2009
3.3 - 3.6
8.5 - 10.7
5.0 - 5.2
NA
7.3 - 9.2
Average Capital Values – High-end Segment (INR '000/sf)
2010
4.0 - 5.0
9.0 - 13.0
5.0 - 5.5
5.0 – 6.5
8.0 - 12.0
2011
4.0 - 5.5
13.0 - 15.5
5.0 - 6.0
6.5 – 7.5
8.0 - 12.5
2012
5.0 - 6.2
14.0 - 17.0
8.0 - 10.0
8.0 – 10.0
12.0 - 14.0
2014
15.0 - 17.0
9.0 - 12.5
8.5 – 11.5
12.0 - 15.0
5.2 - 7.0
2013
14.0 - 17.0
9.0 - 11.0
8.0 – 10.0
12.0 - 15.0
5.2 - 6.5
1Q 2015
15.0 - 17.0
9.0 - 12.5
8.5 – 11.5
12.0 - 15.0
5.2 - 7.2
Source: Cushman and Wakefield Research
Note: The above values for mid segment typically include units of 1,200-1,400 sf
Average Capital Values – Mid Segment (INR '000/sf)
2008
3.5 - 4.0
3.0 - 3.8
2.5 - 3.0
4.5 - 5.5
4.5 - 5.0
3.0 - 3.2
2009
3.6 - 4.2
2.9 - 3.6
2.2 - 2.8
4.5 - 5.5
4.5 - 5.5
2.8 - 3.1
2010
4.0 - 5.0
3.5 - 5.5
3.5 - 4.0
6.5 - 7.0
6.0 - 7.0
4.0 - 5.5
2011
4.5 - 5.5
4.0 - 5.5
3.7 - 4.5
6.5 - 7.5
6.0 - 7.0
4.0 - 5.5
2012
6.0 - 7.0
5.0 - 6.0
4.0 - 4.7
7.0 - 8.0
8.0 - 10.0
4.8 - 6.0
1Q 2015
7.5 - 8.5
6.0 - 7.5
5.1 - 5.7
8.0 - 9.0
8.5 - 10.5
5.0 - 6.0
2014
7.5 - 8.5
6.0 - 7.5
5.1 - 5.7
8.0 - 9.0
8.5 - 10.5
5.0 - 6.0
2013
8.0 - 10.0
6.5 - 8.0
5.7 - 6.8
4.7 - 5.5
7.0 - 8.0
4.8 - 6.0
Koregaon Park, Boat Club
Wanowrie, NIBM,Kondhwa
Location
Aundh
Baner
Kalyani Nagar
Wakad
New Residential Launches
Nearly 3,300 units were launched in 1Q 2015, a
33% decline from the previous quarter. Due to launch
of only select towers/blocks in majority of the
residential projects, average number of units
launched per project declined from 289 units in 4Q
2014 to 183 in 1Q 2015. 2 Bedroom-Hall-Kitchen (BHK)
units, having an average size of 1,000 sf had a 48%
share in the total units launched this quarter.
Locations such as Hinjewadi, Wakad, Tathawade,
Bavdhan, Balewadi and Sus along NH4 Bypass (North)
dominated the launch activity with a 24% share.
of Units*Project Name Developer Location
Number Type Area of Units (in sf)
Panchshil Realty Kharadi Apartments 3 BHK: 2,8604 BHK: 3,400 to 6,7005 BHK: 8,000
478Panchshil Towers
Paranjape Schemes Dhayari Apartments 1 BHK: 481 to 4901.5 BHK: 697 to 9372 BHK: 685 to 8262.5 BHK: 1,045 to 1,4023 BHK: 854 to 2,0673.5 BHK: 1,400 to 1,439
362Abhiruchi Parisar
Amit Enterprises Undri Apartments 1 BHK: 5281.5 BHK: 6632 BHK: 774
288Colori
Kohinoor Group Hinjewadi Apartments 2 BHK: 993 to 1,0033 BHK: 1,351 to 1,367
272Tinsel Town
Saarrthi Group Baner Apartments 1 BHK: 6642 BHK: 1,019 to 1,0763 BHK: 1,400 to 1,500
250Saarrthi Skybay
Last Modified Date : 28-04-15

41
* Estimated and as per market information
of Units*Project Name Developer Location
Number Type Area of Units (in sf)
Paranjape Schemes Rahatani Apartments 2 BHK: 635 to 1,3673 BHK: 926 to 1,604
231Richmond Park
JV - Goel GangaDevelopments, GaganDevelopers, KalyaniConstructions, FortuneProperties
Baner Apartments 2 BHK: 1,1923 BHK: 1,562 to 1,591
204Ganga Acropolis
Nyati Group Undri Apartments 2 BHK: 1,0003 BHK: 1,295 to 1,608
192Nyati Ethos
Paranjape Schemes Tathawade Apartments 2 BHK: 788 to 1,2222.5 BHK : 1,757 to 1,9683 BHK: 1,199 to 1,711
160Azure
Adi Group Wakad Apartments 2 BHK: 9962.5 BHK: 1,022 to 1,033
144The Address
Kalpataru Manjri Apartments 1 BHK: 6502 BHK: 1,0503 BHK: 1,426
138Kalpataru Serenity
JV- Panama Group and Sunarch Developers
Handewadi Apartments 1 BHK: 8392 BHK: 1,0282.5 BHK: 1,316
133Silverstone
Paranjape Schemes Bavdhan Apartments 2 BHK: 829 to 8823 BHK: 1,055 to 1,131
100Gloria Grand
Montvert Homes Sus Apartments 2 BHK: 936 to 9402.5 BHK: 1,060 to 1,1193 BHK: 1,316 to 1,428
90Montvert Avion
Lodha Gahunje Apartments 2 BHK: 1,34188Lodha Riviera
Sobha Developers
Kothrud Apartments 3 BHK: 1,755 to 2,0813 BHK (PH): 3,4004 BHK: 2,574
82Sobha Elanza
JV- VastupurtiAssociates, ValayRealty, Excell Constructions, Crystal Landmarks
Baner Apartments 2 BHK: 991 to 1,1133 BHK (PH): 2,503 to 2,704
44Skylark Residences
Montvert Homes Balewadi Apartments 3 BHK: 1,494 to 1,5154 BHK (PH): 3,050 to 3,183
38Montvert Lumiere
In 1Q 2015, three reputed developers came up with
individual property exhibitions. These exhibitions
offered attractive schemes and discounts for both
on-the-spot as well as online bookings, and some
projects were available for very low booking
amounts. Due to the attractive discounts and
promotional activities, these events were successful
in generating significant footfalls. Going forward,
Under Construction Residential Property Update
many developers are expected to follow the trend
and come up with individual property exhibitions.
Existing high unsold inventory levels led to capital
values remaining stable across segments and
locations. NH4 Bypass in the West and Kharadi,
Wagholi etc. in the East witnessed significant
construction activity during the quarter.
Last Modified Date : 28-04-15
Residential launches are expected to remain
stable in the upcoming quarter, as developers are
likely to open only select towers for bookings in new
residential projects, considering the existing high
unsold inventory. This is likely to lead to stability in
rental and capital values in the short term.
Nearly 3 msf of Grade A supply is expected to be
added in the next quarter. High quantum of new
supply may lead to marginal increase in vacancies
despite healthy transaction activity. This supply
addition is likely to be at higher rentals which may
Outlook
lead to an upward revision in overall weighted
average rentals.
Two malls nearing completion are expected to
witness some transaction activity in the next
quarter. Additionally, lack of quality availabilities on
main streets is expected to retain the preference for
malls amongst occupiers. Mall rentals are expected
to remain stable in the coming quarter. However, new
mall supply in the vicinity of main streets may exert a slight
pressure on main street rentals in the coming months.
Malls continued to drive leasing activity in the
first quarter of 2015. Hadapsar and Koregaon Park
sub-market recorded rental correction of 3.8% and
5% during the quarter, due to exit of a few retailers
from select malls amidst declining enquiries. Due to
limited options for mall spaces, rentals declined by
Retail Sector
3.1% and 3.8% from the previous quarter, in MG
Road and FC Road respectively. However, during the
same period, main streets of Aundh and Old Mumbai
Pune Highway in PCMC recorded 2.6% and 4.5%
rental appreciation respectively as more retailers
scouted for newer locations.
42
Pune recorded 838,200 sf of net absorption in the
first quarter of 2015. Though the net absorption levels
declined by 41% from the previous quarter, it
improved 35% from the same period last year. 76% of
total net absorption was in Grade A developments.
Approximately 1.03 msf of leasing activity was
recorded in 1Q 2015, with 57% contribution from IT-
Commercial Office Sector
ITeS sector. Nagar Road, Yerwada and Hinjewadi
witnessed majority of the leasing activity during the
quarter. Overall weighted average rentals registered a
marginal improvement from the previous quarter, due
to an increase in quoted rentals of certain Grade A
buildings and new supply addition at higher rentals.
Last Modified Date : 28-04-15

GENERAL DISCLOSURE
All data, figures, information provided hereto are provided and/or collated by Cushman & Wakefield India and that Citibank or any of its
representatives, officers, employees or affiliates makes no representations or warranties as to the accuracy or completeness of any
information furnished hereto. This report has been prepared by Cushman & Wakefield India solely for information purposes. It does not
purport to be a complete description of the markets or developments contained in this material. The information on which this report is based
has been obtained from sources that Cushman & Wakefield India believes in its reasonable bona fide faith to be reliable, but Cushman &
Wakefield India has not independently verified such information and do not guarantee/ warranty the accuracy, genuineness or completeness
of the information therein. This report contains information available to the public and has been relied upon by Cushman & Wakefield on the
basis that it is accurate and complete. Information contained herein should not, in whole or part, be published, reproduced or referred to
without prior approval. Cushman & Wakefield accepts no responsibility if this should prove not to be the case. Any such reproduction should
be credited to Cushman Wakefield.
©2015 Cushman & Wakefield, Inc. All rights reserved.
Disclaimer – Cushman & Wakefield
The market data and information herein contained (“Information”) is the product or service of a third party not affiliated to Citibank NA, Citigroup
Inc or Its Affiliates. None of the Information represents the opinion of, counsel from, recommendation or endorsement by Citibank NA, Citigroup
Inc or Its Affiliates, Officers, Employees or Agents. This report has been created/compiled by Cushman & Wakefield India and that this report in no
way represents the opinion or view of Citibank NA, Citigroup Inc or Its Affiliates. The properties/projects that are indicated/mentioned herein
above have been selected randomly for the purpose of this report and that such mention/indication of the same does not, in anyway whatsoever,
indicate any preference or promotion by Citibank of the same. Citibank does not intend to suggest or promote any specific area, builder, developer
or construction company that may have been mentioned/indicated in this report. You may not use the Information for any unlawful purpose or
any purpose not expressly permitted hereby. Reproduction of the Information in any form is prohibited.
Disclaimer - Citibank
The Information is provided “as is”, without warranty of any kind, it has not been independently verified by Citibank NA, Citigroup Inc or Its
Affiliates, Officers, Employees or Agents and use of the Information is at your sole risk. Citibank NA, Citigroup Inc or Its Affiliates, Officers,
Employees or Agents shall not be liable and expressly disclaim liability for any error or omission in the content of the Information, or for any
actions taken by you or any third party, in reliance thereon. The Information is not guaranteed to be error-free, or to be relied upon for
investment purposes, and Citibank NA, Citigroup Inc or Its Affiliates, Officers, Employees or Agents make no representation or warranty as to
the accuracy, truth, adequacy, timeliness or completeness, fitness for purpose, title, non infringement of third party rights or continued
availability of the Information.
IN NO EVENT SHALL CITIBANK NA, CITIGROUP INC OR ITS AFFILIATES, OFFICERS, EMPLOYEES OR AGENTS, BE LIABLE FOR ANY LOSS OR
DAMAGE OF ANY KIND WHATSOEVER (INCLUDING, WITHOUT LIMITATION, ANY SPECIAL, CONSEQUENTIAL, INCIDENTAL OR INDIRECT
DAMAGES, OR DAMAGES FOR LOSS OF PROFITS, BUSINESS INTERRUPTION, AND ANY AND ALL FORMS OF LOSS OR DAMAGE,
REGARDLESS OF THE FORM OF ACTION OR THE BASIS OF THE CLAIM, WHETHER OR NOT FORESEEABLE) ARISING OUT OF THE USE OF THE
INFORMATION (PROVIDED IN ANY MEDIUM), EVEN IF ANY OF CITIBANK NA, CITIGROUP INC OR ITS AFFILIATES, OFFICERS, EMPLOYEES OR
AGENTS, HAS BEEN ADVISED OF THE POSSIBILITY OF SUCH LOSS OR DAMAGE.
© 2015 Citigroup Inc. Citi, Citibank and Arc Design and Citigold Private Client are registered service marks of Citigroup Inc. or its affiliates
used and registered throughout the world.
NO WARRANTY
LIMITATION OF LIABILITY
This research report has been prepared by Cushman & Wakefield
specially for distribution to Citibank customers.
43
Last Modified Date : 28-04-15