cbc performance and quality improvement meeting data for
TRANSCRIPT

CBC Performance and Quality Improvement MeetingData for Week Ended Sunday, July 04, 2021
No Meeting This Week
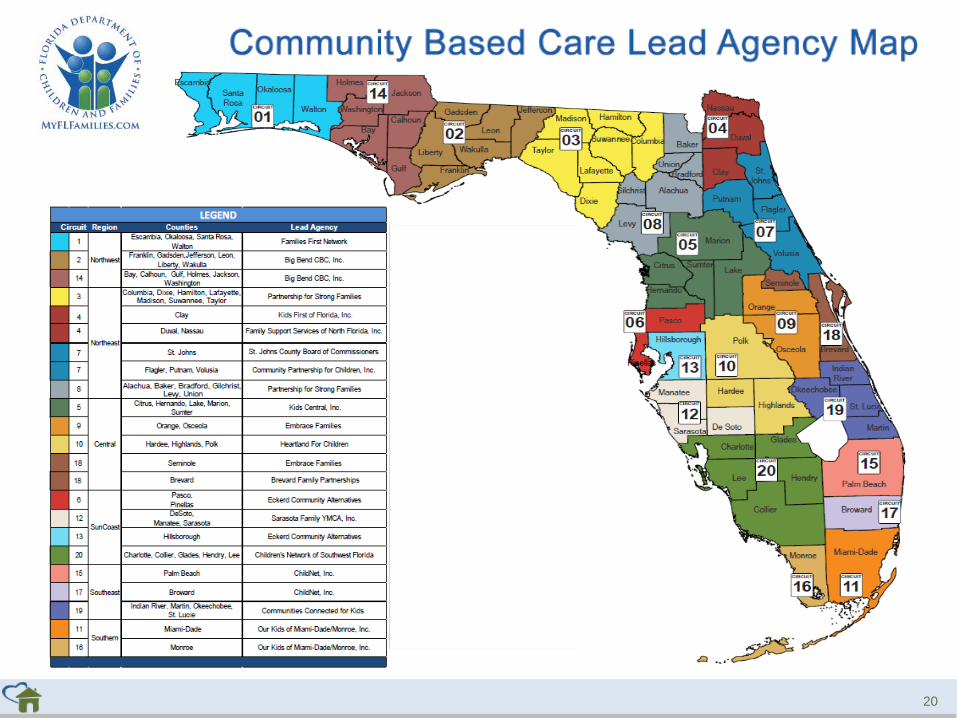
Circuit 10 – Central Region

Community Based Care Lead Agency ScorecardFY 20-21, 3rd Quarter: January 01, 2021 to March 31, 2021
22
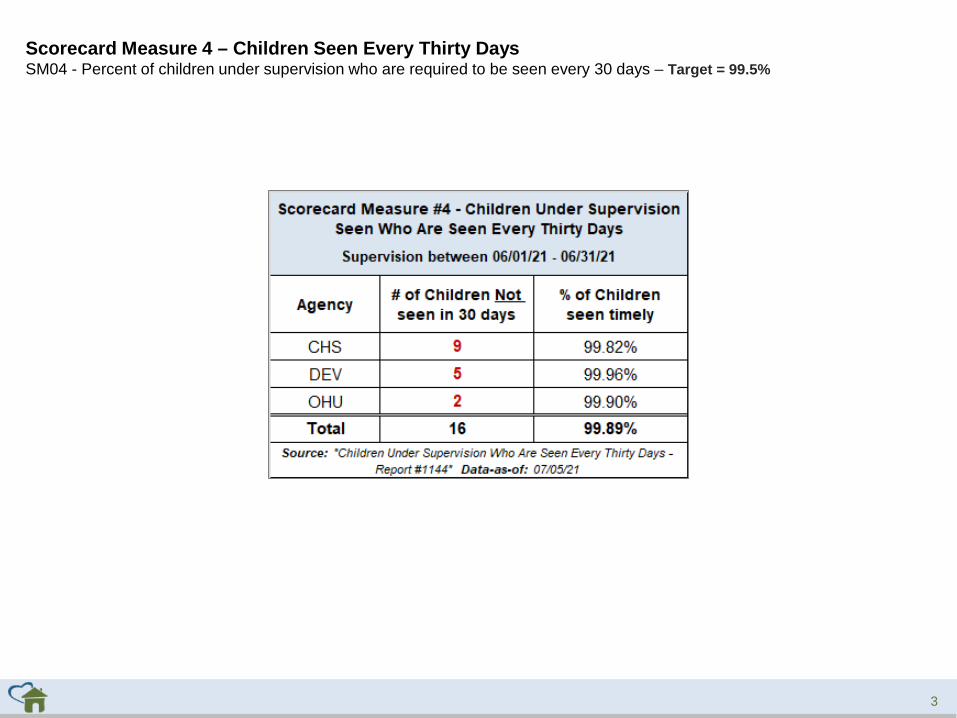
Scorecard Measure 4 – Children Seen Every Thirty DaysSM04 - Percent of children under supervision who are required to be seen every 30 days – Target = 99.5%
3
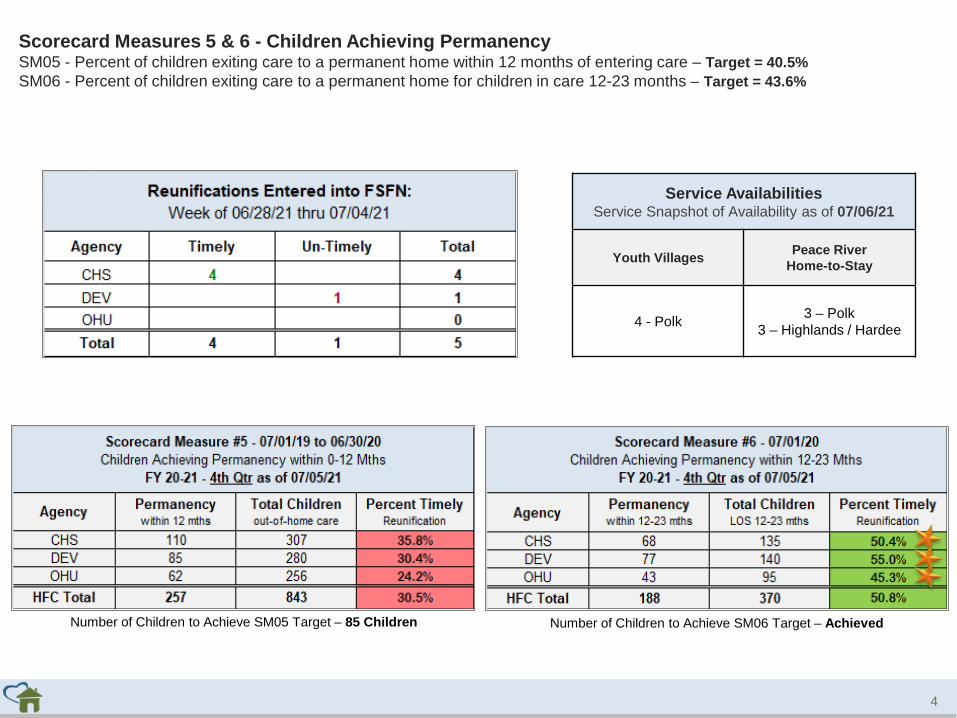
Scorecard Measures 5 & 6 - Children Achieving PermanencySM05 - Percent of children exiting care to a permanent home within 12 months of entering care – Target = 40.5%SM06 - Percent of children exiting care to a permanent home for children in care 12-23 months – Target = 43.6%
Number of Children to Achieve SM05 Target – 85 Children Number of Children to Achieve SM06 Target – Achieved
4
Service AvailabilitiesService Snapshot of Availability as of 07/06/21
Youth Villages Peace RiverHome-to-Stay
4 - Polk 3 – Polk 3 – Highlands / Hardee
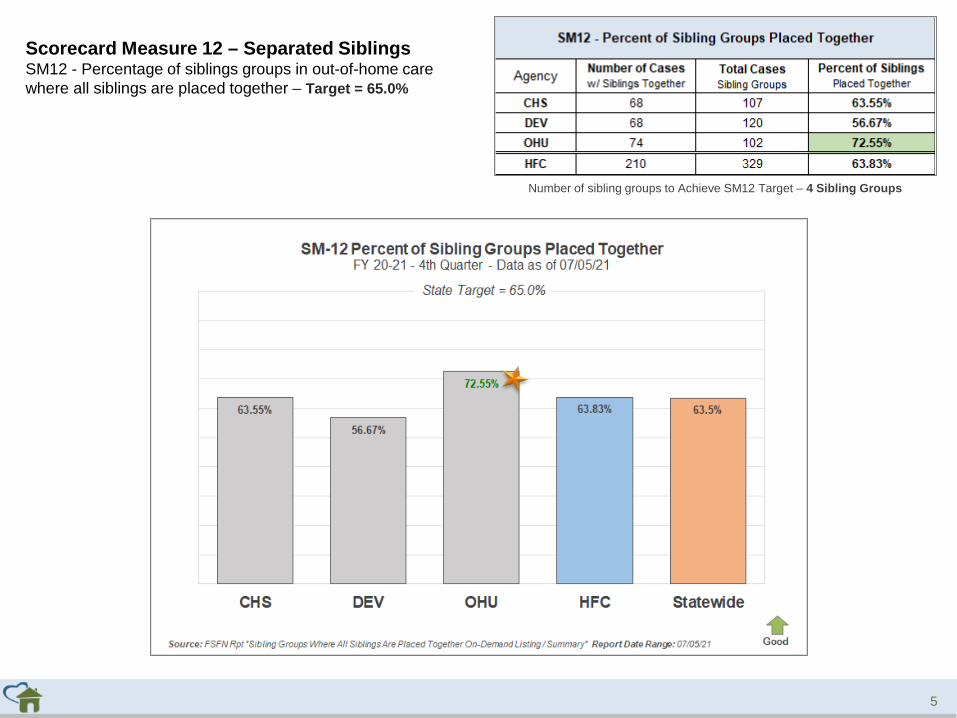
Scorecard Measure 12 – Separated Siblings SM12 - Percentage of siblings groups in out-of-home care where all siblings are placed together – Target = 65.0%
5
Number of sibling groups to Achieve SM12 Target – 4 Sibling Groups

6
Adoption FinalizationsPercent of Adoptions Finalized with 24 Months of Removal & Percent of Adoption Goal Met
Upcoming Finalization DatesJuly 14, 2021July 28, 2021
DCF ADOPTION COHORT CHANGEThe current data reflects the adjusted adoptive
credits as of 1/1/2021The primary CBC will now split the adoption credit with
the Out-of-County CBC effective July 1, 2020

Children’s Legal Services- Shelter ReportCLS Weekly Shelter Report FY 2021-22 as of July 05, 2021
7

Case Transfer Staffing Data Case Transfer Data For Fiscal Year July 1, 2021 – June 30, 2022 - Data as of 07/06/21
Children Entering & Exiting CareNumber of Children Entering and Exiting Out-of-Home Care per Month
8

Neighbor to Family – Weekly & Monthly Census 20-21 Fiscal Year to Month - Percentage of Children Not Sheltered: 98.1%
9
“NTF was absolutely amazing…. has helped my family so much."- Parent Satisfaction Survey – Q: “What we are doing well?”

10
Missing Children HFC – DCF Circuit 10 Missing Youth Data as of Reporting Date
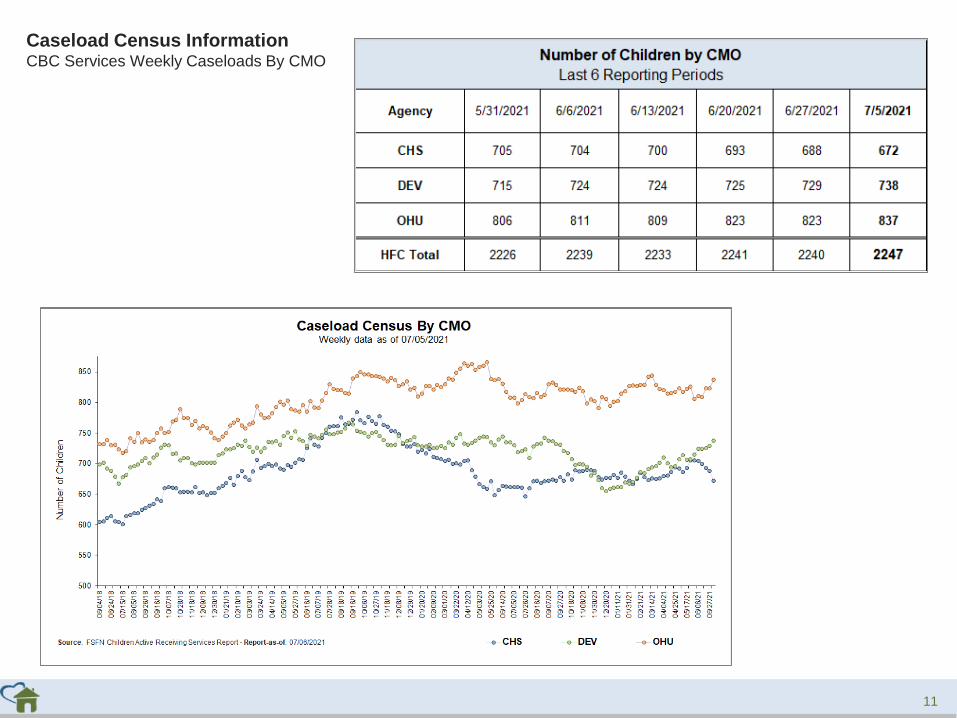
Caseload Census Information CBC Services Weekly Caseloads By CMO
11

*These OHU case managers contain caseloads that are over 70% OCS cases. On average an
OCS case compares to 1.54 regular cases (i.e., 20 OCS cases approx. equals 13 regular cases).
All CHS case managers are supported by Case-Aim support. On average a Case-Aim supported
case compares to 1.33 regular cases (i.e., 20 cases with Case-Aim approx. equals 15 cases
without Case-Aim support).
12Red = Supervisors, FTC Facilitators, Adoption & Resigned CMs carrying cases

Caseload Census Information Case Manager Caseload Breakdown by Agency – Data as of 07/05/2021
Case Management Organization Turnover12 Month Case Manager Turnover Rates by Agency
* Data Excludes Unit Supervisors, Non-ICPC Adoption, FTC Facilitators, IL CMs & Resigned CMs Count
13

Healthcare InformationData Entered Into FSFN for Children in Out-of-Home Care
14
Scorecard Measures 9 & 10 - Children Receiving Healthcare ServicesSM 9 - Percent of children in out-of-home care who have received medical services in the last 12 months – Target = 95.0%SM 10 - Percent of children in out-of-home care who have received dental services in the last 7 months – Target = 95.0%
Number of Dental Visits to Achieve SM10 Target – AchievedNumber of Medical Visits to Achieve SM09 Target – Achieved

Source: FSFN Report “Case Management Safety Management Listing” , Data-as-of: 07/06/21
15
In-Home Safety Plan ManagementPercent of Completed In-Home Safety Plans under 180 Effective Days – Target: 95.0%

Target = 70% Mothers and 50% Fathers - seen monthly
16
Source: FSFN Data Warehouse – Ad Hoc Report; Data-as-of: 07/05/21
Monthly Birth Parent Contacts
17
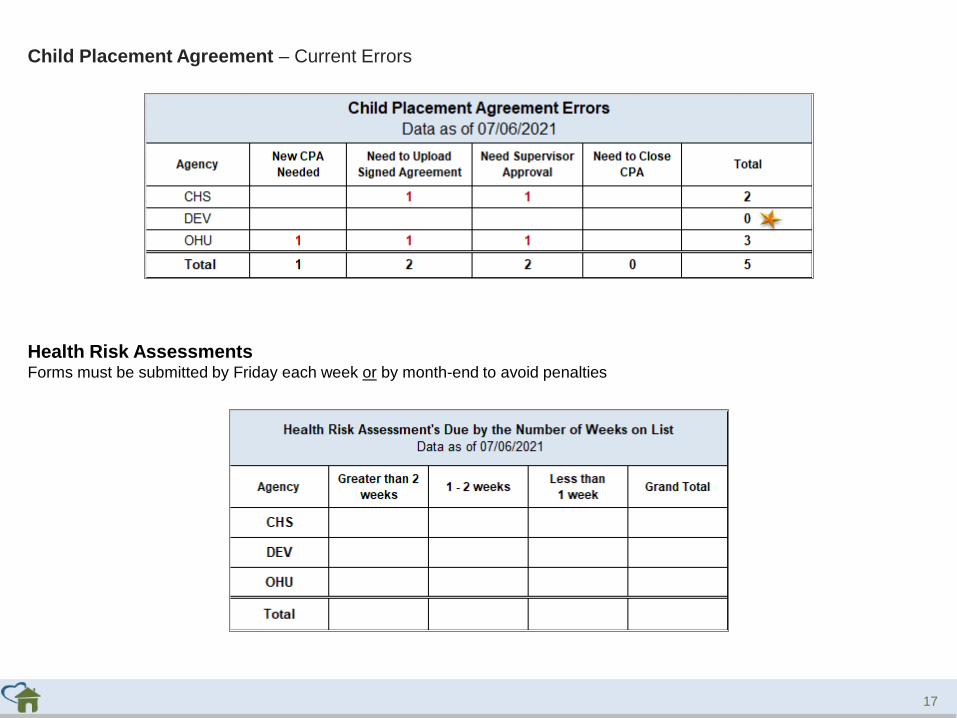
Child Placement Agreement – Current Errors
Health Risk AssessmentsForms must be submitted by Friday each week or by month-end to avoid penalties
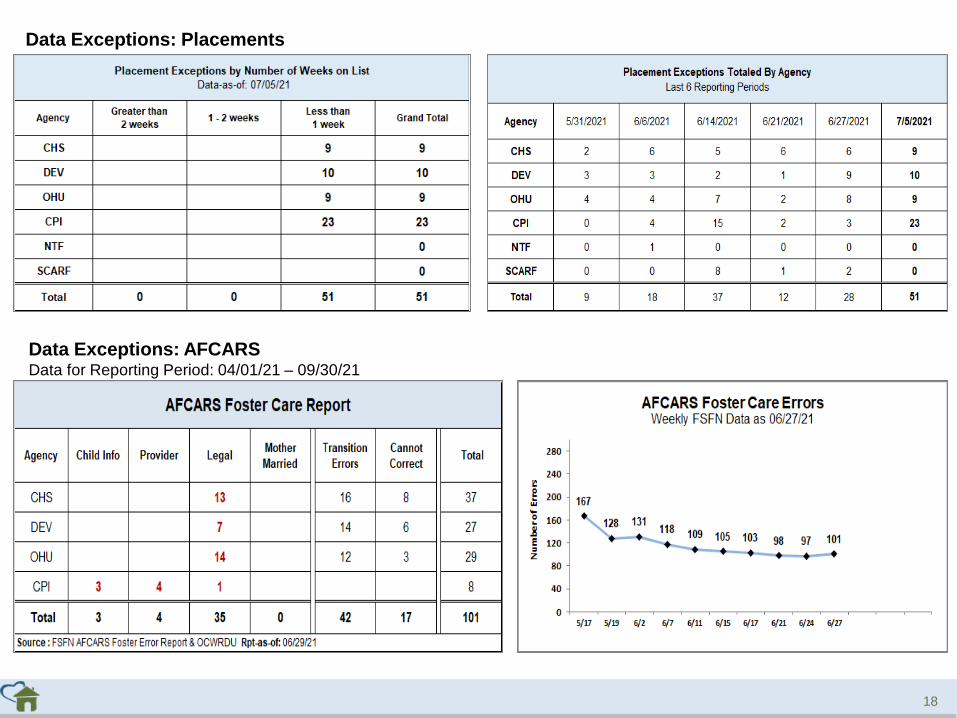
Data Exceptions: AFCARSData for Reporting Period: 04/01/21 – 09/30/21
18
Data Exceptions: Placements
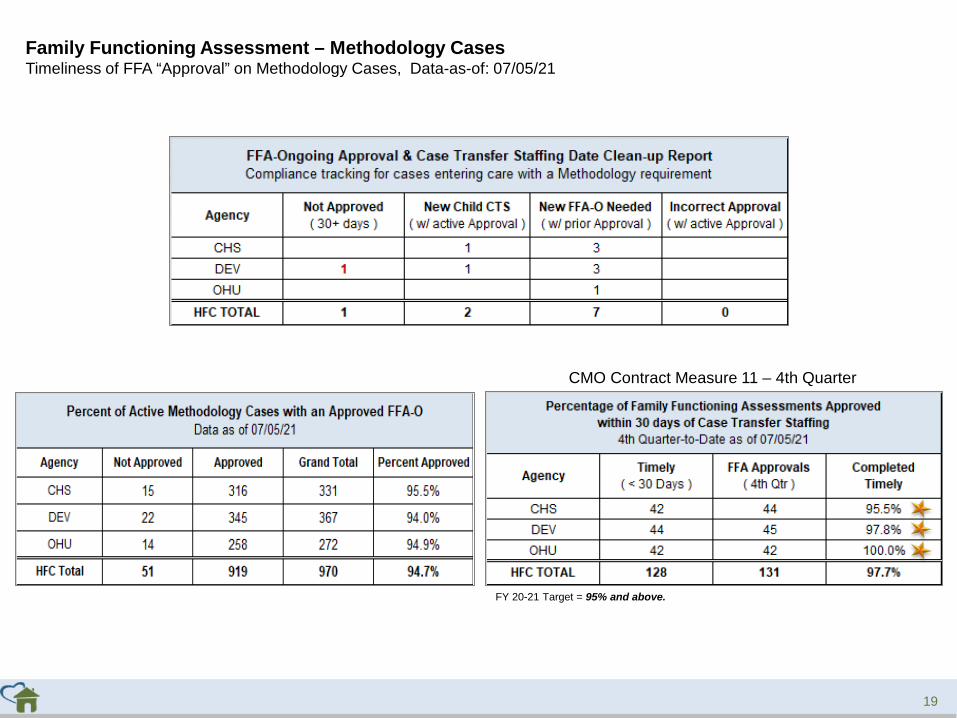
CMO Contract Measure 11 – 4th Quarter
FY 20-21 Target = 95% and above.
Family Functioning Assessment – Methodology CasesTimeliness of FFA “Approval” on Methodology Cases, Data-as-of: 07/05/21
19
20