cbcs working paper - centralbank.cwcentralbank.cw/uploads/files/measuring labor productivity...
TRANSCRIPT

CBCS WORKING PAPER
MEASURING LABOR PRODUCTIVITY IN CURAÇAO
JULY 2017
BY SHEKINAH DARE
CBCS.WP/16/2

2

Measuring Labor Productivity in Curaçao
Simon Bolivar Plein 1Willemstad,
CuraçaoPhone: (599 9) 434-5500
Fax: (599 9) 461-5004E-mail: [email protected]
Centrale Bank van Curaçao en Sint MaartenResearch Department
Shekinah Dare
July 2017

This paper measures the contribution of labor productivity and employment to output growth in Curaçao across four 4-year periods between 2003 and 2015. Output growth was estimated by the GDP and GVA. To this end, a shift-share method was applied to decompose Curaçao’s labor productivity growth into its (1) within effect, (2) static shift effect, and (3) dynamic shift effect. This decomposition made it possible to examine whether Curaçao’s economic sectors had become more or less productive and whether its industry mix, estimated by employment shares, had shifted towards more or less productive sectors.
The empirical results confirm the negative contribution of Curaçao’s labor productivity to output growth over the past 13 years. The contribution of labor productivity stems from both within and dynamic shift effects, except for the period 2012-2015.
JEL Classification Numbers: J240
Keywords: Labor productivity, Employment, Shift-share analysis.
Author’s e-mail address: [email protected]
The views expressed in this paper are those of the author and do not necessarily reflect those of the Centrale Bank van Curaçao en Sint Maarten (CBCS). However, the author would like to express her sincere gratitude to Candice Henriquez, Eric Matto, and Marelva de Windt of the CBCS, as well as Dainadira Eustatius-Martis of the Central Bureau of Statistics (CBS) for their
valuable contribution to this paper.
ABSTRACT
4

CONTENT
1 Introduction 2 Drivers of labor productivity3 Measuring labor productivity4 Data and method 4.1 Variables and assumptions 4.2 Empirical estimation5 Empirical results 5.1 Modelling labor productivity in Curaçao 5.2 Shift-share decomposition analysis 6 ConclusionReferences
79
111313141717172628
5

LIST OF ABBREVIATIONS
CBS Central Bureau of Statistics CuraçaoCBCS Centrale Bank van Curaçao en Sint MaartenCMA Centered Moving AverageGDP Gross Domestic ProductGVA Gross Value AddedNAf. Netherlands Antillean guilderOECD Organization for Economic Co-operation and DevelopmentSMA Simple Moving Average
6

Productivity growth is the key driver of long-run economic growth because it quantifies the ef-ficiency at which a country can transform its inputs into useful outputs (Evenson and Sardido, 1986; Mundlak, Larson, and Butzer, 2004; Freeman, 2008).
A distinction can be made between (1) single factor or partial factor productivity, and (2) multi-factor or total factor productivity (Baldwin, Gu, and Macdonald, 2014). Single factor productiv-ity takes only one input into account, i.e., labor or capital, while multifactor productivity consid-ers both labor and capital inputs.
Labor productivity indicators can help in understanding and examining historical and current changes in an economy. They provide an indication of a country’s standard of living, interna-tional competitiveness, output growth, and social development (Freeman, 2008). Most countries estimate labor productivity to observe how their production efficiency develops over time, in dif-ferent economic sectors, or compared to other countries in the region. This information is impor-tant because increasing labor productivity can unlock growth potential (IMF, 2016). Countries with strong labor productivity growth tend to register high output growth rates because they can produce more goods and services with the same amount of labor.
For more than a decade, Curaçao has been operating below its capacity as reflected by low output and labor productivity growth rates and, in some years, even negative rates. In the period 2012-2015, Curaçao registered on average output and labor productivity growth rates of -0.4% and -0.2%, respectively.1
The objective of this paper is twofold. First, the contribution of labor productivity and employ-ment to output growth in Curaçao is measured for four 4-year periods: 2003-2006, 2006-2009, 2009-2012, and 2012-2015. Second, a shift-share analysis is applied to decompose Curaçao’s aggregate labor productivity growth to examine (1) whether its sectors have become more or less productive, and (2) whether its industry mix, in terms of employment shares, has shifted towards more or less productive sectors. Based on this analysis, the economic sectors with the highest labor productivity levels and growth rates can be identified, necessary to provide policy recom-mendations to foster economic growth in Curaçao. To the author’s knowledge, previous studies on labor productivity (growth) in Curaçao such as TAC Economics (2013) and IMF (2016) have not applied these methods.
1 Sources: CBCS estimate and IMF (2016), respectively.
INTRODUCTION1
7

The paper proceeds as follows. Section 2 elaborates on a diagram developed by the Conference Board of Canada (2014) concerning the drivers of labor productivity. In section 3, the measure-ment of labor productivity is outlined. Section 4 discusses the data and method used to estimate the contribution of labor productivity and employment to output growth and to apply the shift-share decomposition analysis. Section 5 discusses the main empirical results, and section 6 pres-ents the conclusions of this analysis.
8

The Conference Board of Canada (2014) developed a diagram to illustrate the key drivers of la-bor productivity as shown in Figure 1. The top section consists of organization-specific factors. In this section, organizations can improve their labor productivity by (1) investing in physical capital, (2) investing in human capital, or (3) improving their processes and technologies (i.e., innovation) (Iparraguirre, 2007; Office for National Statistics, 2007).
These possibilities are described below.
1. Investing in physical capital: Physical capital refers to tangible assets such as machin-ery, equipment, and land (Iparraguirre, 2007; Office for National Statistics, 2007). Investing more in physical capital can contribute positively to labor productivity if workers can pro-duce more (higher quality) products for the same amount of labor.
2. Investing in human capital: Human capital refers to the education and specialization of the workforce (Iparraguirre, 2007; Office for National Statistics, 2007). Investing in human capital results in a better skilled workforce due to new technologies and new organizational structures, leading to more productive employees.
3. Improving processes and technologies: Innovation is defined by the OECD and Eurostat Oslo Manual as “the implementation of a new or significantly improved product (good or service), or process, a new marketing method, or a new organizational method in business practices, workplace organization or external relations.” (OECD and Eurostat, 2005, chap-ter 3, page 46). The literature distinguishes four types of innovation activities: (1) product innovations, (2) process innovations, (3) marketing innovations, and (4) organizational in-novations. Innovation creates dynamic technical efficiency gains such as new equipment that works more efficiently, thereby increasing labor productivity.
DRIVERS OF LABOR PRODUCTIVITY2
Invest
ment
Hum
an C
apita
l
Innovation
Business & policy environment
Global forces
Source: The Conference Board of Canada, 2014
Figure 1: Drivers of labor productivity
9

The mid-section of the diagram is the business and policy environment in which an organiza-tion operates. This environment can directly or indirectly affect the organization-specific factors mentioned in the top section. Policymakers can help organizations by facilitating an attractive business climate for entrepreneurs and enhancing the capacity of individuals and companies to innovate successfully.
The bottom section refers to the dynamics in the global economy, such as changes in interna-tional commodity prices that cannot be controlled by the private and public sectors in small open economies like Curaçao.
Thus, improving labor productivity requires a multifaceted approach (The Conference Board of Canada, 2014). However, to monitor changes in labor productivity growth requires accurate measurement, which will be dealt with in the next section.
10
According to Syverson (2011), of all available productivity measures, i.e., labor, capital, and multifactor productivity measures, labor productivity measures are used most often in determin-ing productivity.
Labor productivity measures reflect the efficiency with which inputs are used by a country’s working population to produce goods and services. This is shown in equation (1) (Freeman, 2008):
OutputL
Input=
where L is labor productivity, Output is the volume measure of output, and Input is the measure of input use.
The volume measure of output is the goods and services produced, which can be estimated by Gross Domestic Product (GDP) or Gross Value Added (GVA) (Freeman, 2008). However, the GVA is preferred because taxes are excluded.
The measure of input use indicates the effort, time, and skills of the working population and can be computed by the total number of hours worked or the total number of employed persons (Freeman, 2008). The total number of hours worked is preferred because the total number of employed persons does not take into account changes in (1) the average number of hours worked due to part-time work, overtime, absence from work, or shifts in normal hours, (2) multiple job holdings, and (3) self-employed persons.
Moreover, the total number of hours worked is measured independently from the workforce (Kitov and Kitov, 2008) because not all employed persons work the same number of hours de-pending on the sector in which a person works. Hence, the total number of hours worked can change without a change in the employment level and vice versa.
Although (labor) productivity measures are quite straightforward, several measurement issues arise when they are based on actual production data. The compilation of the total number of hours worked is not always clear and is difficult to compare on an international level (Freeman, 2008). Also, estimates of the total number of hours worked are not always available for a long
MEASURING LABOR PRODUCTIVITY3
11

time period. For example, in Curaçao, the Central Bureau of Statistics (CBS) measures the total number of hours worked every 10 years in the Census,2 implying that these data are available only for the years 2001 and 2011. However, the Labor Force Survey of 2015 (Jansen, 2015) in-cluded estimates of the total number of hours worked for the years 2014 and 2015. Therefore, the total number of hours worked for Curaçao is available for the years 2001, 2011, 2014, and 2015.
2 Census data for 2001 and 2011 were provided to the author upon request.
12

This section deals with the data and method used to (1) estimate the contribution of labor pro-ductivity and employment to output growth in Curaçao and (2) examine the drivers of Curaçao’s labor productivity growth.
4.1 VARIABLES AND ASSUMPTIONS
The analysis covered four 4-year periods between 2003 and 2015, i.e., 2003-2006, 2006-2009, 2009-2012, and 2012-2015, to ensure that the general development of the variables was not sig-nificantly affected by changes in a particular year.
Data for Curaçao concerning the GDP at market prices, the GVA at market prices, the inflation rate, the real GDP growth rate, the total number of hours worked, the total number of employed persons, and the total population were derived from the Central Bureau of Statistics Curaçao (CBS) for the period 2003-2015. However, the total numbers of employed persons in 2010 and 2012 were estimated based on 3-year Centered Moving Averages (CMA) to smooth the develop-ment path because no data were available for these two years.
For the entire analysis, the GDP and the GVA at constant prices (2000=100) were measured by correcting the GDP and the GVA at market prices for the CPI inflation.3
For the analysis by economic sector, the GVA per sector was assumed to be the sum of the value added of (1) nonfinancial corporations, (2) financial corporations, (3) the government, and (4) households and nonprofit institutions serving households as defined by the CBS. Due to lack of available data on the value added of households and nonprofit institutions serving households for the period 2013-2015, Simple Moving Averages (SMA) were assumed starting with the period 2010-2012. That is, an average of the period 2010-2012 was used for the year 2013, an average of 2011-2013 was used for the year 2014, and an average of 2012-2014 was used for the year 2015.4
As noted in section 3, the total number of hours worked for Curaçao was available only for the years 2001, 2011, 2014, and 2015. For these years, the data were provided by the CBS per cat-
3 The CPI inflation is used because no GDP deflator is yet available for Curaçao.4 The value added of households and nonprofit institutions serving households has increased considerably over the period 2003-2012, recording a growth of 82.1%. Therefore, a more recent period of 2010-2012 was used to estimate the value added of households and nonprofit institutions serving households over the period 2013-2015. No significant changes occurred over the period 2010-2012 (a growth of 9.0%); hence changing the SMA estimated for the period 2013-2015 would not change the conclusions drawn in this paper.
DATA AND METHOD4
13

egory of working hours per week. However, in each report, other categories were used. The Cen-sus 2001 had 7 categories of working hours per week: (1) 15-19 hours, (2) 20-29 hours, (3) 30-37 hours, (4) 38-42 hours, (5) 43-50 hours, (6) 51 or more hours, and (7) an unknown category. The Census 2011 had 5 categories of working hours per week: (1) up to 25 hours, (2) between 26 and 39 hours, (3) 40 hours, (4) between 41 and 45 hours, and (5) 46 hours or more. The Labor Force Survey (Jansen, 2015) had 6 categories of working hours per week, i.e., (1) 4-20 hours, (2) 21-39 hours, (3) 40 hours, (4) 41-60 hours, (5) more than 60 hours, and (6) unknown or not reported category.
According to the Census and Labor Force Survey data, more than 60% (specifically ranging be-tween 60.3% and 65.3%) of Curaçao’s employees work 40 hours per week or between 38 and 42 hours per week. Nevertheless, as no comparable time series data could be obtained for the period 2003-2015, the labor productivity measure in terms of GDP per hour worked was excluded from the study.
4.2 EMPIRICAL ESTIMATION
The analysis was divided into two parts. In the first part, the contribution of labor productivity and employment to Curaçao’s output growth was measured using an approach similar to that of The Conference Board (2015). Output growth was measured using both the GDP and the GVA. As illustrated in Figure 2, Curaçao’s GDP and GVA are almost perfectly correlated to one an-other. The Pearson’s correlation coefficient, i.e., a statistical indicator of the strength of the linear relationship between two variables, is 0.998 (University of the West of England, 2016).
Figure 2: Comparison between the GDP and the GVA (in millions NAf.)
0
100
200
300
400
500
600
3,000
4,000
5,000
6,000
2003 2004 2005 2006 2007 2008 2009 2010 2011 2012 2013* 2014* 2015*
Difference at constant pr ices Difference at market pr ices
GDP at constant pr ices GVA at constant pr ices
GDP at market pr ices GVA at market pr ices
Source: Central Bureau of Statistics Curaçao and author’s calculations
14

*Estimates by the Central Bureau of Statistics Curaçao GDP and GVA are expressed in current prices (available at the CBS) and in constant prices (calculated by the author, 2000=100).
In the second part of the analysis, a shift-share technique was applied to decompose the aggregate labor productivity growth of Curaçao into (1) within-sector productivity gains, (2) employment shifts from sectors with low productivity levels to sectors with high productivity levels or vice versa, and (3) employment shifts from sectors with a low productivity growth rate to sectors with a high productivity growth rate or vice versa (Timmer and Szirmai, 2000).
The shift-share decomposition technique is a practical tool to separate national and sectoral con-tributions of aggregate labor productivity growth (Dinc, 2002). The technique is useful primar-ily to identify and target sectors that might generate future growth opportunities. However, the technique has some shortcomings, which include not considering the impact of business cycles and the sensitivity to the time period chosen. Despite these shortcomings, the technique has been used in a wide range of studies including a regional analysis of labor productivity in the manufac-turing sector (Ledebur and Moomaw, 1983) and the impact of employment in the transportation sector on regional growth (Toft and Stough, 1986).
The shift-share technique decomposes the aggregate labor productivity growth into three effects as shown in equation (2) (Goh, 2013; Timmer and Szirmai, 2000):
1 1 1 1 1 1 11 1 1
1 1 1 1 1 1 1
n n nt t it it it it it it it it it iti i i
t it t t t t t t t
P P P P Y P L L P P L Lx x xP P Y P L L P L L
− − − − − − −− − −
− − − − − − −
− − −= + − + −
∑ ∑ ∑ (2)
where Pt is the productivity level of Curaçao in period t; 1
nt iti
Y Y−
=∑ is the total value added of Curaçao in period t;
1
nt iti
L L−
=∑ is the total employment of Curaçao in period t; and 1, ,i n= … is the ith economic sector of Curaçao.
These effects are discussed below.
1. Within effect: 1 1
11 1
n it it iti
it t
P P YxP Y
− −−
− −
−
∑ , the contribution of labor productivity growth within each sector to the aggregate labor productivity growth - also known as the within term;
2. Static shift effect: 1 1
11 1
n it it iti
t t t
P L LxP L L
− −−
− −
−
∑ , the contribution from changes in employment
shares of sectors with various labor productivity levels to the aggregate labor productivity growth - also known as the between term; and
3. Dynamic shift effect: 1 1
11 1
n it it it iti
t t t
P P L LxP L L
− −−
− −
−−
∑ , the contribution from changes in employ-
ment shares of sectors with various labor productivity growth rates to the aggregate labor productivity growth - also known as the cross term.
15

The static (dynamic) shift effect is positive if the employment share of economic sectors with above-average labor productivity levels (growth rates) increases (Timmer and Szirmai, 2000). Conversely, the static (dynamic) shift effect is negative if growing economic sectors have below-average labor productivity levels (growth rates) or if the employment share of sectors with high productivity levels (growth rates) decreases.
16
5.1 MODELLING LABOR PRODUCTIVITY IN CURAÇAO
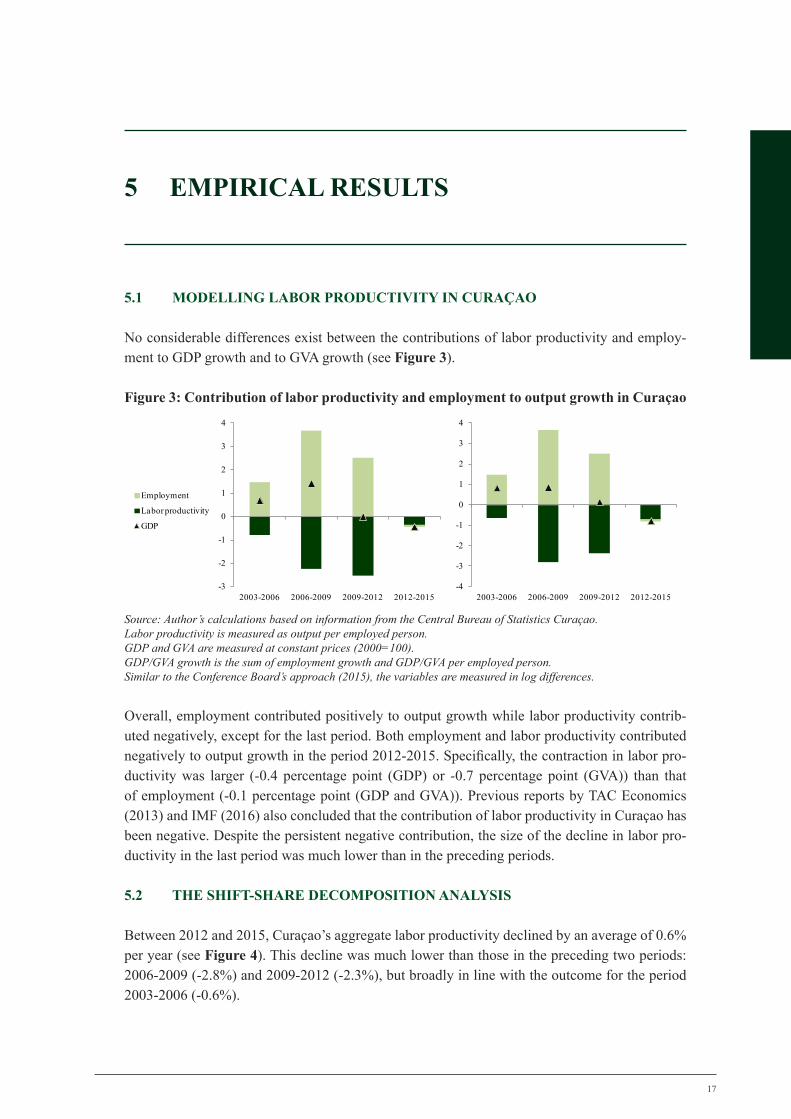
No considerable differences exist between the contributions of labor productivity and employ-ment to GDP growth and to GVA growth (see Figure 3).
Figure 3: Contribution of labor productivity and employment to output growth in Curaçao
-3
-2
-1
0
1
2
3
4
2003-2006 2006-2009 2009-2012 2012-2015
Employment
Labor productivity
GDP
-4
-3
-2
-1
0
1
2
3
4
2003-2006 2006-2009 2009-2012 2012-2015
Source: Author’s calculations based on information from the Central Bureau of Statistics Curaçao.Labor productivity is measured as output per employed person.GDP and GVA are measured at constant prices (2000=100). GDP/GVA growth is the sum of employment growth and GDP/GVA per employed person. Similar to the Conference Board’s approach (2015), the variables are measured in log differences.
Overall, employment contributed positively to output growth while labor productivity contrib-uted negatively, except for the last period. Both employment and labor productivity contributed negatively to output growth in the period 2012-2015. Specifically, the contraction in labor pro-ductivity was larger (-0.4 percentage point (GDP) or -0.7 percentage point (GVA)) than that of employment (-0.1 percentage point (GDP and GVA)). Previous reports by TAC Economics (2013) and IMF (2016) also concluded that the contribution of labor productivity in Curaçao has been negative. Despite the persistent negative contribution, the size of the decline in labor pro-ductivity in the last period was much lower than in the preceding periods.
5.2 THE SHIFT-SHARE DECOMPOSITION ANALYSIS
Between 2012 and 2015, Curaçao’s aggregate labor productivity declined by an average of 0.6% per year (see Figure 4). This decline was much lower than those in the preceding two periods: 2006-2009 (-2.8%) and 2009-2012 (-2.3%), but broadly in line with the outcome for the period 2003-2006 (-0.6%).
EMPIRICAL RESULTS5
17

Figure 4: Decomposition of labor productivity growth
-4
-3
-2
-1
0
1
2
2003-2006 2006-2009 2009-2012 2012-2015
Within effect
Static shift effect
Dynamic shift effect
Labor productivity growth
Source: Author’s calculations based on information from the Central Bureau of Statistics Curaçao.Aggregate labor productivity growth is measured as GVA per employed person.GVA is measured at constant prices (2000=100). GVA growth is the sum of within effects, static shift effects, and dynamic shift effects.Similar to previous studies like Goh (2013), the contribution of the effects to aggregate labor productivity growth is expressed in percentage points.
The negative aggregate labor productivity growth in the 2012-2015 period was caused by a de-cline in the dynamic shift effect (-1.0%), mitigated by an increase in the static shift effect (0.4%). Meanwhile, the within-sector gains in labor productivity remained muted (0.0%).
1. Within effect: After declining in earlier periods, average labor productivity growth in the various economic sectors remained flat in the period 2012-2015 and, therefore, did not con-tribute to aggregate labor productivity growth.
2. Static shift effect: In the period 2012-2015, the employment shares of more productive sectors increased, while the employment shares of less productive sectors dropped, imply-ing a shift in employment towards more productive sectors. Hence, the static shift effect contributed positively to aggregate labor productivity growth by 0.4 percentage-points per year on average. The average contribution of the static shift effect over the period 2012-2015 was consistent with the average labor productivity growth trend registered in the preceding 4-year periods.
3. Dynamic shift effect: The dynamic shift effect made a negative contribution of -1.0% to ag-gregate labor productivity growth in the period 2012-2015. This effect stemmed from a rise in employment shares of sectors with lower productivity growth rates and a decline in sectors with higher productivity growth rates, indicating a shift in employment towards sectors with lower productivity growth rates. The average contribution of the dynamic shift effect in the period 2012-2015 was worse than the average productivity drag posted in the earlier periods.
A further examination of the within effect, static shift effect, and dynamic shift effect revealed the following observations.
18
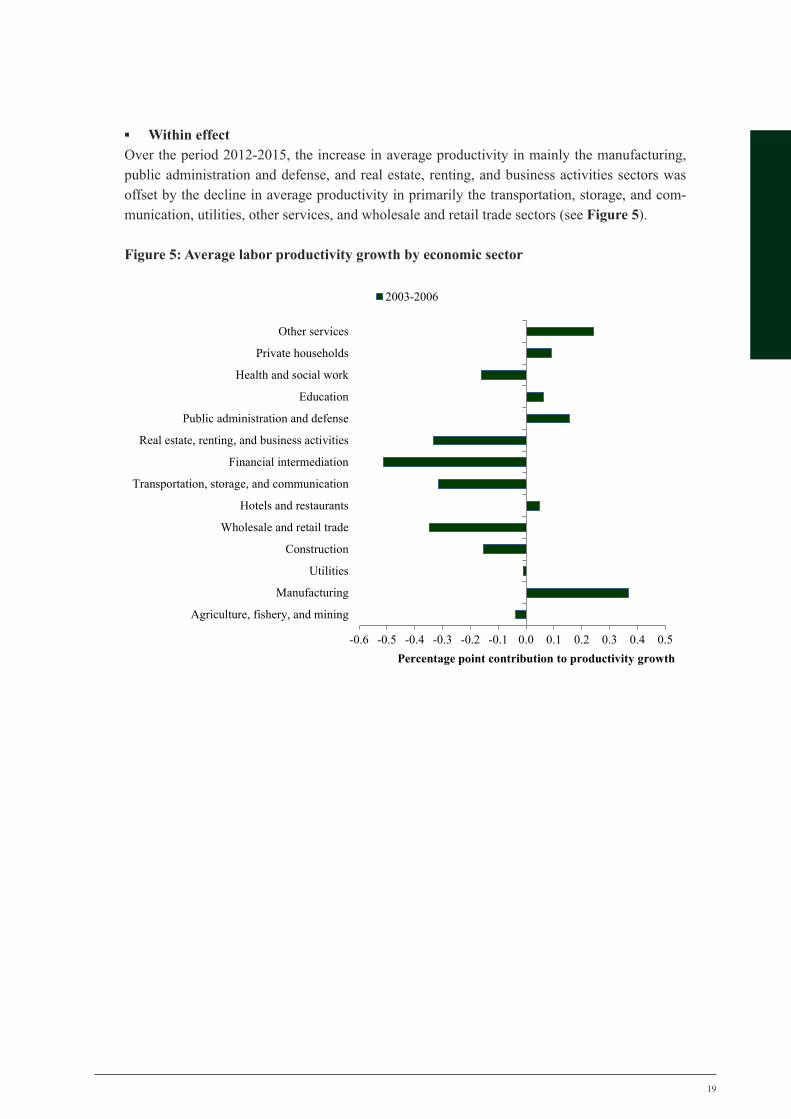
▪ Within effect Over the period 2012-2015, the increase in average productivity in mainly the manufacturing, public administration and defense, and real estate, renting, and business activities sectors was offset by the decline in average productivity in primarily the transportation, storage, and com-munication, utilities, other services, and wholesale and retail trade sectors (see Figure 5).
Figure 5: Average labor productivity growth by economic sector
-0.6 -0.5 -0.4 -0.3 -0.2 -0.1 0.0 0.1 0.2 0.3 0.4 0.5
Agriculture, fishery, and mining
Manufacturing
Utilities
Construction
Wholesale and retail trade
Hotels and restaurants
Transportation, storage, and communication
Financial intermediation
Real estate, renting, and business activities
Public administration and defense
Education
Health and social work
Private households
Other services
Percentage point contribution to productivity growth
2003-2006
19

-2.0 -1.5 -1.0 -0.5 0.0 0.5
Agriculture, fishery, and mining
Manufacturing
Utilities
Construction
Wholesale and retail trade
Hotels and restaurants
Transportation, storage, and communication
Financial intermediation
Real estate, renting, and business activities
Public administration and defense
Education
Health and social work
Private households
Other services
Percentage point contribution to productivity growth
2006-2009
-1.2 -1.0 -0.8 -0.6 -0.4 -0.2 0.0 0.2
Agriculture, fishery, and mining
Manufacturing
Utilities
Construction
Wholesale and retail trade
Hotels and restaurants
Transportation, storage, and communication
Financial intermediation
Real estate, renting, and business activities
Public administration and defense
Education
Health and social work
Private households
Other services
Percentage point contribution to productivity growth
2009-2012
20

-1.0 -0.5 0.0 0.5 1.0 1.5
Agriculture, fishery, and mining
Manufacturing
Utilities
Construction
Wholesale and retail trade
Hotels and restaurants
Transportation, storage, and communication
Financial intermediation
Real estate, renting, and business activities
Public administration and defense
Education
Health and social work
Private households
Other services
Percentage point contribution to productivity growth
2012-2015
Source: Author’s calculations based on information from the Central Bureau of Statistics Curaçao.Aggregate labor productivity growth is measured as GVA per employed person.GVA is measured in constant prices (2000=100). Similar to previous studies like Goh (2013), the within-sector contributions to aggregate labor productivity growth are expressed in percentage points.Note that the author constructed the other services sector, consisting of other community, social, and personal service activities such as arts, entertainment, and recreation, other service activities, activities of extraterritorial organiza-tions and bodies, and unknown or not reported activities as defined by the CBS.
21
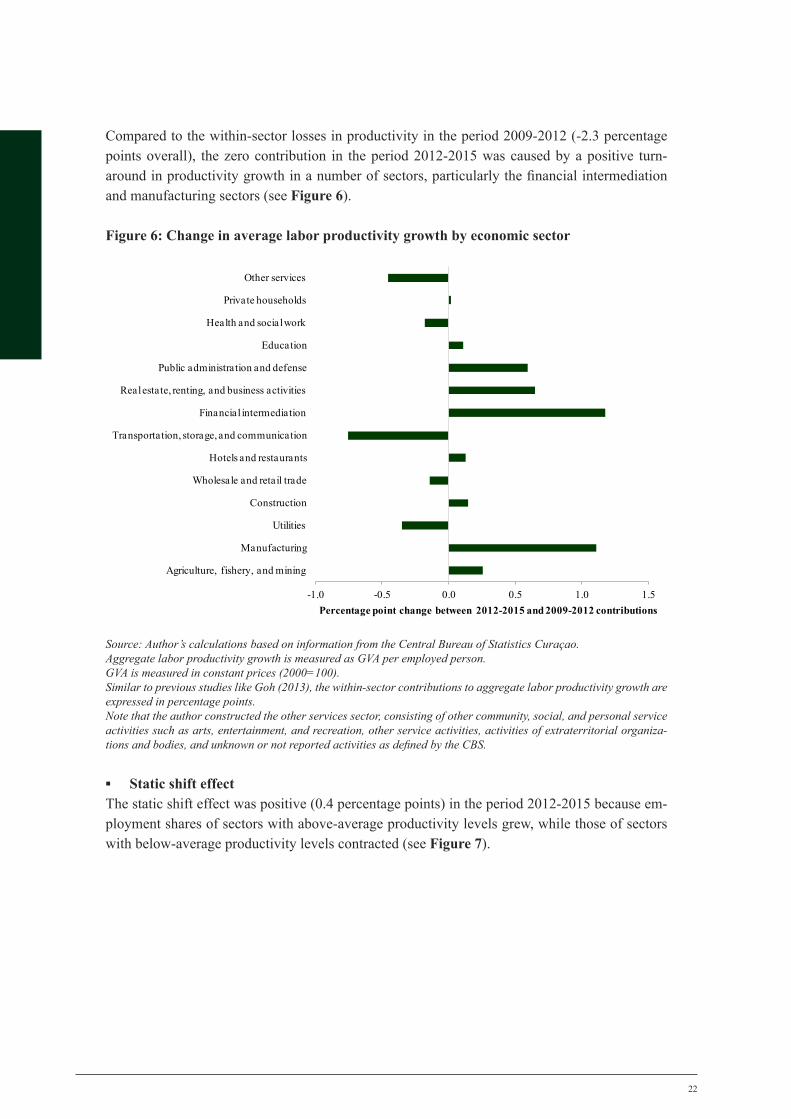
Compared to the within-sector losses in productivity in the period 2009-2012 (-2.3 percentage points overall), the zero contribution in the period 2012-2015 was caused by a positive turn-around in productivity growth in a number of sectors, particularly the financial intermediation and manufacturing sectors (see Figure 6).
Figure 6: Change in average labor productivity growth by economic sector
-1.0 -0.5 0.0 0.5 1.0 1.5
Agriculture, fishery, and mining
Manufacturing
Utilities
Construction
Wholesale and retail trade
Hotels and restaurants
Transportation, storage, and communication
Financial intermediation
Real estate, renting, and business activities
Public administration and defense
Education
Health and social work
Private households
Other services
Percentage point change between 2012-2015 and 2009-2012 contributions
Source: Author’s calculations based on information from the Central Bureau of Statistics Curaçao.Aggregate labor productivity growth is measured as GVA per employed person.GVA is measured in constant prices (2000=100). Similar to previous studies like Goh (2013), the within-sector contributions to aggregate labor productivity growth are expressed in percentage points.Note that the author constructed the other services sector, consisting of other community, social, and personal service activities such as arts, entertainment, and recreation, other service activities, activities of extraterritorial organiza-tions and bodies, and unknown or not reported activities as defined by the CBS.
▪ Static shift effect The static shift effect was positive (0.4 percentage points) in the period 2012-2015 because em-ployment shares of sectors with above-average productivity levels grew, while those of sectors with below-average productivity levels contracted (see Figure 7).
22
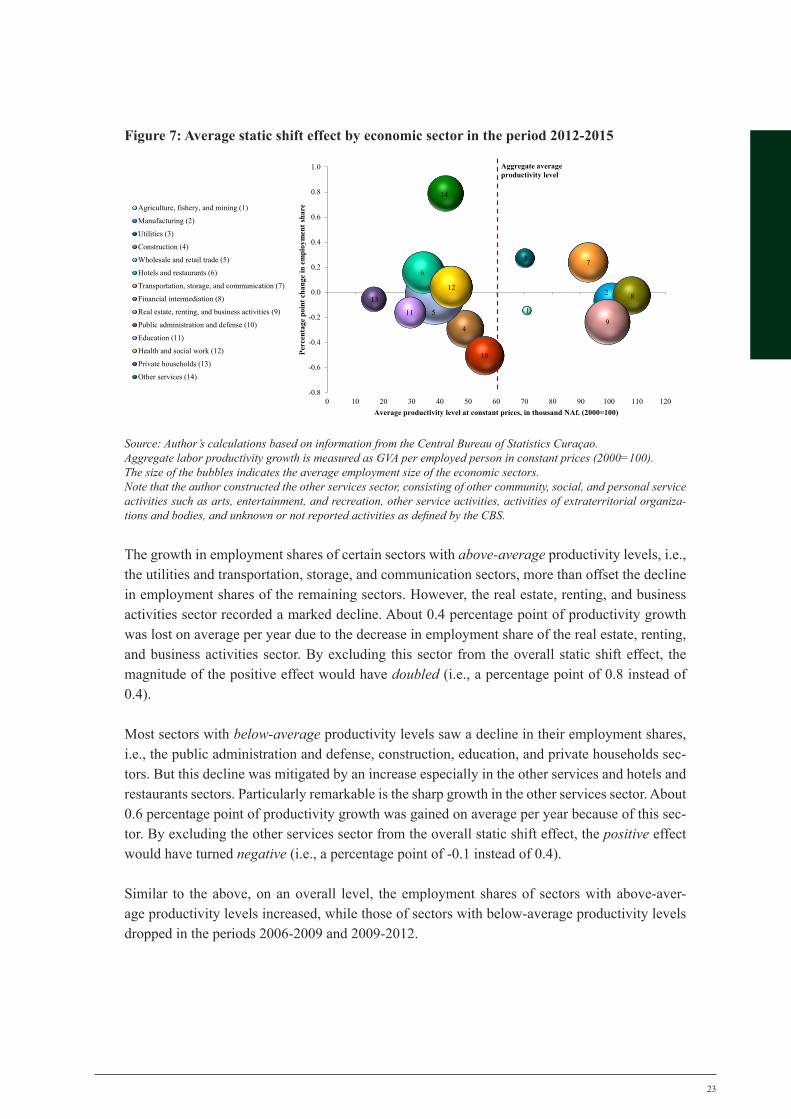
Figure 7: Average static shift effect by economic sector in the period 2012-2015
1
2
3
4
5
67
8
9
10
11
1213
14
-0.8
-0.6
-0.4
-0.2
0.0
0.2
0.4
0.6
0.8
1.0
0 10 20 30 40 50 60 70 80 90 100 110 120
Perc
enta
ge p
oint
cha
nge
in e
mpl
oym
ent s
hare
Average productivity level at constant prices, in thousand NAf. (2000=100)
Agriculture, fishery, and mining (1)
Manufacturing (2)
Utilities (3)
Construction (4)
Wholesale and retail trade (5)
Hotels and restaurants (6)
Transportation, storage, and communication (7)
Financial intermediation (8)
Real estate, renting, and business activities (9)
Public administration and defense (10)
Education (11)
Health and social work (12)
Private households (13)
Other services (14)
Aggregate average productivity level
Source: Author’s calculations based on information from the Central Bureau of Statistics Curaçao.Aggregate labor productivity growth is measured as GVA per employed person in constant prices (2000=100).The size of the bubbles indicates the average employment size of the economic sectors.Note that the author constructed the other services sector, consisting of other community, social, and personal service activities such as arts, entertainment, and recreation, other service activities, activities of extraterritorial organiza-tions and bodies, and unknown or not reported activities as defined by the CBS.
The growth in employment shares of certain sectors with above-average productivity levels, i.e., the utilities and transportation, storage, and communication sectors, more than offset the decline in employment shares of the remaining sectors. However, the real estate, renting, and business activities sector recorded a marked decline. About 0.4 percentage point of productivity growth was lost on average per year due to the decrease in employment share of the real estate, renting, and business activities sector. By excluding this sector from the overall static shift effect, the magnitude of the positive effect would have doubled (i.e., a percentage point of 0.8 instead of 0.4).
Most sectors with below-average productivity levels saw a decline in their employment shares, i.e., the public administration and defense, construction, education, and private households sec-tors. But this decline was mitigated by an increase especially in the other services and hotels and restaurants sectors. Particularly remarkable is the sharp growth in the other services sector. About 0.6 percentage point of productivity growth was gained on average per year because of this sec-tor. By excluding the other services sector from the overall static shift effect, the positive effect would have turned negative (i.e., a percentage point of -0.1 instead of 0.4).
Similar to the above, on an overall level, the employment shares of sectors with above-aver-age productivity levels increased, while those of sectors with below-average productivity levels dropped in the periods 2006-2009 and 2009-2012.
23

▪ Dynamic shift effectThe variable on the x-axis is the difference between Figures 7 and 8, which illustrates a static variable, i.e., the labor productivity level, and a dynamic variable, i.e., the labor productivity growth rate, respectively.
In the period 2012-2015, the negative dynamic shift effect (-1.0 percentage point) resulted from the joint effect of an increase in employment shares of sectors with below-average productivity growth rates and a decrease in those sectors with above-average productivity growth rates (see Figure 8).
Figure 8: Average dynamic shift effects by economic sector in the period 2012-2015
12
3
5
67
8
9
10
11
1213
14
-0.8
-0.6
-0.4
-0.2
0.0
0.2
0.4
0.6
0.8
1.0
-25% -15% -5% 5% 15% 25% 35% 45% 55% 65% 75%
Perc
enta
ge p
oint
cha
nge
in e
mpl
oym
ent s
hare
Average productivity growth, in %
Agriculture, fishery, and mining (1)
Manufacturing (2)
Utilities (3)
Construction (4)
Wholesale and retail trade (5)
Hotels and restaurants (6)
Transportation, storage, and communication (7)
Financial intermediation (8)
Real estate, renting, and business activities (9)
Public administration and defense (10)
Education (11)
Health and social work (12)
Private households (13)
Other services (14)
Source: Author’s calculations based on information from the Central Bureau of Statistics Curaçao.Aggregate labor productivity growth is measured as GVA per employed person in constant prices (2000=100).The size of the bubbles indicates the average employment size of the economic sectors.Note that the author constructed the other services sector, consisting of other community, social, and personal service activities such as arts, entertainment, and recreation, other service activities, activities of extraterritorial organiza-tions and bodies, and unknown or not reported activities as defined by the CBS.
The employment shares of sectors with below-average productivity growth rates increased par-ticularly because the growth achieved in the other services, utilities, hotels and restaurants, and transportation, storage, and communication sectors exceeded the decline recorded in the con-struction, real estate, renting, and business activities, and education sectors.
All sectors with above-average productivity growth rates experienced a contraction in their em-ployment shares, notably the public administration and defense sector.
Similarly, on an overall level, the employment shares of sectors with below-average productivity growth rates rose, while those of sectors with above-average productivity growth rates contracted in the periods 2003-2006, 2006-2009, and 2009-2012.
24

Comparison between static shift effect and dynamic shift effect In all 4-year periods examined, the static shift effect was positive, while the dynamic shift effect was negative. A discrepancy thus exists between the shift in employment shares of sectors with above-average or below-average productivity levels (static shift effect) and sectors with above-average or below-average productivity growth rates (dynamic shift effect).
In the period 2012-2015, the financial intermediation, manufacturing, and real estate, renting, and business activities sectors recorded the highest above-average productivity levels. A similar outcome resulted for the preceding 4-year periods, except that the manufacturing sector was re-placed by the utilities sector in those periods.
The manufacturing sector recorded the highest above-average productivity growth rate over the period 2012-2015.5 In the previous 4-year periods, the manufacturing sector also recorded among the highest above-average labor productivity growth rates. The continuous positive productivity growth registered in the manufacturing sector could be attributed to the intensive use of Informa-tion and Communication Technology (ICT) in this sector with the aim of developing efficient business processes.
Interesting to note is that, like other Caribbean countries, Curaçao has been promoting the tour-ism sector as its main economic pillar. According to the CBS, the hotels and restaurants sector can be used as a proxy for the tourism sector in Curaçao. Based on the shift-share analysis above, it seems that the hotels and restaurants sector has registered below-average productivity levels in all 4-year periods as well as below-average productivity growth rates in the more recent periods of 2009-2012 and 2012-2015.
Although the average productivity level of the hotels and restaurants sector has increased from NAf. 27,033 in the period 2003-2006 to NAf. 34,130 in the period 2012-2015, this sector remains among the three sectors with the lowest labor productivity levels. Furthermore, the average pro-ductivity growth rate of the hotels and restaurants sector was negative in the periods 2009-2012 and 2012-2015, registering -1.1% and -0.8%, respectively.
As the IMF (2016) points out, increasing labor productivity is a prerequisite to unlocking a coun-try’s growth potential. In the economy of Curaçao, it seems that the average productivity level in the tourism sector is among the lowest, and the average productivity growth rate has been negative in the past years. These findings imply that focusing solely on promoting the tourism sector without increasing productivity growth in this sector will not help Curaçao attain a higher sustainable growth path.
5 Note that labor productivity growth recorded in the agriculture, fishery, and mining sector was actually the highest over the period 2012-2015, while the manufacturing sector had the second-highest growth rate. Given the small and negligible employment size of the agriculture, fishery, and mining sector in the total economy of Curaçao (i.e., only 0.4%), the author chose not to focus on this sector as an engine to unlock growth potential in the country. Other sectors that also registered positive labor productivity growth rates in the period 2012-2015 were public administration and defense, education, financial intermediation, and real estate, renting, and business activities, after contracting in the previous 4-year periods.
25

Labor productivity indicators often are used to observe how the production efficiency of a coun-try changes over time and in different economic sectors. In this paper, the contribution of labor productivity and employment to output growth in Curaçao was measured across four 4-year periods over the last 13 years. In addition, a shift-share analysis was applied to examine to what extent Curaçao’s labor productivity growth stemmed from (1) productivity changes within sec-tors and/or (2) changes in employment across sectors. This analysis also was used to identify the sectors with the highest labor productivity levels and growth rates, information useful for policy recommendations.
Overall and in line with other reports, Curaçao’s labor productivity has contributed negatively to output growth in the years studied. The negative contribution of labor productivity came from both the within effect and the dynamic shift effect, except for the period 2012-2015. In that period, the contribution resulted solely from the dynamic shift effect because the employment shares of sectors with below-average productivity growth rates increased, while those of sectors with above-average productivity growth rates decreased.
The financial intermediation, manufacturing, and real estate, renting, and business activities sectors recorded the highest above-average productivity levels, while the manufacturing sector registered the highest above-average productivity growth rate. The positive labor productivity growth recorded in the manufacturing sector could be explained by the intensive use of ICT in this sector to develop efficient business processes.
Curaçao, like other Caribbean countries, has been promoting the tourism sector (proxied by the hotels and restaurants sector) as its most important economic pillar. Nevertheless, it seems that the hotels and restaurants sector has registered below-average labor productivity levels in all 4-year periods and below-average labor productivity growth rates in the two more recent peri-ods. Given that growing labor productivity can unlock growth potential, as argued by the IMF, this result suggests that focusing only on promoting the tourism sector without increasing labor productivity in this sector will not lead Curaçao onto a higher sustainable growth path.
A limitation of this study is the lack of time series data for the total number of hours worked in Curaçao. Therefore, the study covered only labor productivity in terms of GDP per employed person, thereby excluding labor productivity in terms of GDP per hour worked.
Similar to this paper, many researchers have focused on measuring labor productivity by divid-ing output by the total number of employed persons or the total number of hours worked (Even-
CONCLUSION6
26
son and Sardido, 1986). Nonetheless, labor productivity is an incomplete indicator of efficiency. Companies can boost output per hour worked by investing in more machinery and equipment per employed person. But once the additional capital spending is taken into consideration, this investment might result in limited or no gain in overall economic efficiency. Multifactor produc-tivity is thus a better proxy for an economy’s return on capital than labor productivity. However, international comparison of multifactor productivity is more difficult than labor productivity as countries value their capital stock in a variety of ways.
Looking ahead, labor productivity indicators and their drivers should be developed for countries in the Caribbean region to allow for international comparison. Furthermore, labor productivity should be supplemented by multifactor or total factor productivity indicators to measure overall economic efficiency.
27

REFERENCES
Baldwin, John R., Wulong Gu, Ryan Macdonald, and Beiling Yan. Productivity: What is it? How is it measured? What has Canada’s performance been over the period 1961 to 2012? Otta-wa: Statistics Canada, 2014. Accessed May 8, 2016. http://www.statcan.gc.ca/pub/15-206-x/15-206-x2014038-eng.pdf.
Jansen, Irálice. Supply side of the labour market of Curaçao. Curaçao: Central Bureau of Statistics, 2015. Accessed May 8, 2016. http://www.cbs.cw/website/publications_231/rubriek/labour-force-survey-publications_85.html.
Dinc, Mustafa. Regional and Local Economic Analysis Tools. Washington DC: World Bank Institute, 2002. Accessed May 8, 2016. http://info.worldbank.org/etools/docs/library/128789/Dinc%202001.pdf.
Evenson, Robert and M.L. Sardido. “Regional total factor productivity change in Philippine agriculture,” Philippine Journal of Development 13, no. 23 (1986): 40-61.
Freeman, Rebecca. Labour productivity indicators. France: OECD Statistics Directorate, 2008. Accessed May 8, 2016. http://www.oecd.org/std/labour-stats/41354425.pdf.
Goh, Tee Wei. “Feature Article: A Shift-Share Analysis of Singapore’s Labour Productivity Growth, 1998- 2013.” Economic Survey of Singapore (2013): 70-77. Accessed May 8, 2016. https://www.mti.gov.sg/researchroom/siteassets/pages/economic-survey-of-singapore-2013/fa_aes2013.pdf.
International Monetary Fund (IMF). “Kingdom of the Netherlands – Curaçao and Sint Maarten 2016 article IV consultation discussions – Press release; staff report, and informational annex.” IMF Country Report, no. 16/276 (2016). Accessed May 8, 2016. https://www.imf.org/external/pubs/ft/scr/2016/cr16276.pdf.
Iparraguirre, Jose L. “The Five Drivers of Productivity. How much does each one contribute? Causal analysis of regional labor productivity in the UK.” Paper presented at the EcoMod Inter-national Conference on Regional and Urban Modelling, June 1-2, 2007.
Kitov, Ivan and Oleg Kitov. The driving force of labor productivity. Germany: University Library of Munich, 2008. Accessed May 8, 2016. http://mpra.ub.uni-muenchen.de/9069/01/MPRA_paper_9069.pdf.
28

The Conference Board of Canada. “Labour productivity growth.” Last modified May 2014. http://www.conferenceboard.ca/hcp/provincial/economy/labour-productivity.aspx.
Ledebur, Larry and Ronald L. Moornaw. “A shift-share analysis of regional labor productivity in manufacturing,” Growth and Change 14, no. 1 (1983): 2-9.
Mundlak, Yair, Donald Larson, and Rita Butzer. “Agricultural dynamics in Thailand, Indonesia and the Philippines,” The Australian Journal of Agricultural and Resource Economics 48, no. 1 (2004): 95-126.
OECD and Eurostat. Oslo manual: Guidelines for collecting and interpreting innovation data (3rd edition). Paris: OECD Publishing, 2005. Accessed May 8, 2016. http://www.oecd-ilibrary.org/docserver/download/9205111e.pdf?expires=1473967188&id=id&accname=guest&checksum=C4C0A368D623DA23C88B6FF4D3CD7BA5.
Office for National Statistics. The ONS productivity handbook: A statistical overview and guide. Great Britain: Palgrave Macmillan, 2007. Accessed May 8, 2016. http://webarchive.na-tionalarchives.gov.uk/20160105160709/http://www.ons.gov.uk/ons/guide-method/method-qual-ity/specific/economy/productivity-measures/productivity-handbook/index.html.
University of the West of England (UWE). “Pearson’s correlation coefficient.” Last modified 2016. http://learntech.uwe.ac.uk/da/Default.aspx?pageid=1442.
Syverson, Chad. “What Determines Productivity?” Journal of Economic Literature 49, no. 2 (2011): 326-365.
TAC Economics. “Strategies for sustainable long term economic development in Curaçao.” Report presented at the workshop for sustainable long-term economic development, Willemstad, Curaçao, April 18, 2013.
The Conference Board. Productivity Brief: Global productivity growth stuck in the slow lane with no signs of recovery in sight. New York: The Conference Board, 2015. Accessed May 8, 2016. https://www.conference-board.org/retrievefile.cfm?filename=The-Conference-Board-2015-Productivity-Brief.pdf&type=subsite.
Timmer, Marcel P. and Adam E. Szirmai. “Productivity growth in Asian manufacturing: the structural bonus hypothesis examined,” Structural Change and Economic Dynamics 11, no. 4 (2000): 371-392.
Toft, Graham S. and Roger R. Stough. Transportation employment as a source of regional economic growth: a shift-share approach. Washington DC: Transportation Research Board, 1986. Accessed May 8, 2016. http://mpra.ub.uni-muenchen.de/9069/01/MPRA_paper_9069.pdf.
29

30