ccs system modelling: enabling technology to … 1a to 3a/1a4 - lawal.pdfccs system modelling:...
TRANSCRIPT

© 2014 Process Systems Enterprise Limited
Adekola Lawal – Senior Consultant, Power & CCS
CCS system modelling: enabling technology to help accelerate commercialisation and manage
technology risk
10th ECCRIA 15 September 2014

© 2014 Process Systems Enterprise Limited
Overview
Systems modelling for CCS
CCS process models
Power generation
Solvent-based CO2 capture
CO2 compression
CO2 transmission and injection
Applications
Case Study 1 – CCS Chain
Shell CCS Operability study
DECC Industrial CCS study

© 2014 Process Systems Enterprise Limited
Systems modelling for CCS
© 2014 Process Systems Enterprise Limited
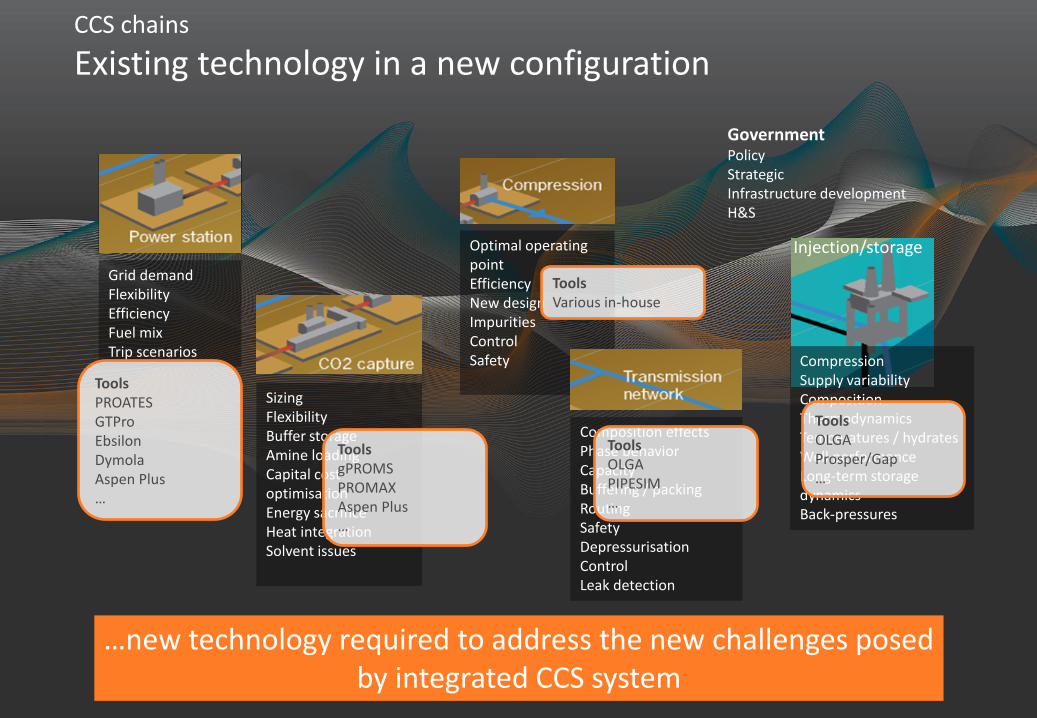
Grid demand Flexibility Efficiency Fuel mix Trip scenarios
Sizing Flexibility Buffer storage Amine loading Capital cost optimisation Energy sacrifice Heat integration Solvent issues
Optimal operating point Efficiency New design Impurities Control Safety
Composition effects Phase behavior Capacity Buffering / packing Routing Safety Depressurisation Control Leak detection
Tools PROATES GTPro Ebsilon Dymola Aspen Plus …
Tools gPROMS PROMAX Aspen Plus …
Tools Various in-house
Tools OLGA PIPESIM …
CCS chains
Existing technology in a new configuration
Government Policy Strategic Infrastructure development H&S
Compression Supply variability Composition Thermodynamics Temperatures / hydrates Well performance Long-term storage dynamics Back-pressures
Injection/storage
…new technology required to address the new challenges posed by integrated CCS system
Tools OLGA Prosper/Gap …
© 2014 Process Systems Enterprise Limited
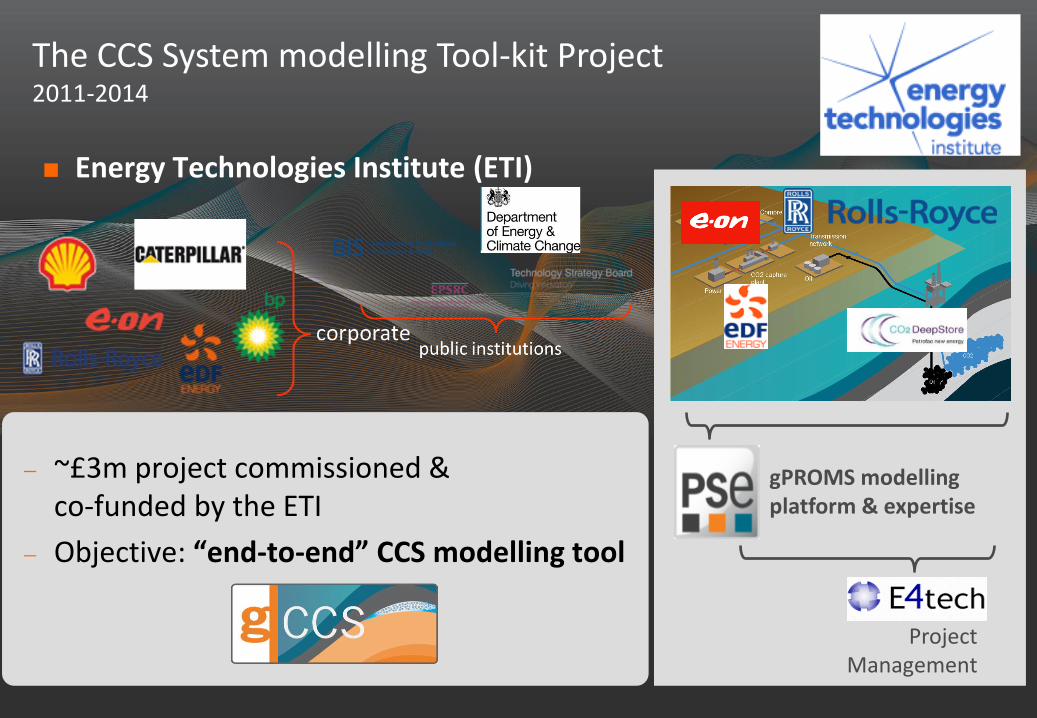
The CCS System modelling Tool-kit Project 2011-2014
Energy Technologies Institute (ETI)
gPROMS modelling platform & expertise
Project Management
~£3m project commissioned & co-funded by the ETI
Objective: “end-to-end” CCS modelling tool

© 2014 Process Systems Enterprise Limited
System-wide modelling Key enabling technology for CCS
Explore complex decision space rapidly based on high-fidelity, technically realistic models
resolve own technical and economic issues
take into account upstream & downstream behaviour
Manage interactions and trade-offs
Evaluate technology – existing and next-generation
judge relative merits of emerging technologies
support consistent, future-proof choices
Integrating platform for
working with other stakeholders in chain
collaborative R&D, working with academia

© 2014 Process Systems Enterprise Limited
CCS System Modelling Tool-Kit
gCCS initial scope (2014/Q3)
Process models
Power generation
Conventional: pulverised-coal, CCGT
Non-conventional: oxy-fuelled, IGCC
Solvent-based CO2 capture
CO2 compression & liquefaction
CO2 transportation
CO2 injection in sub-sea storage
Materials models
cubic EoS (PR 78)
flue gas in power plant
Corresponding States Model
water/steam streams
SAFT-VR SW/ SAFT- Mie
amine-containing streams in CO2 capture
SAFT- Mie
near-pure post-capture CO2 streams
© 2014 Process Systems Enterprise Limited
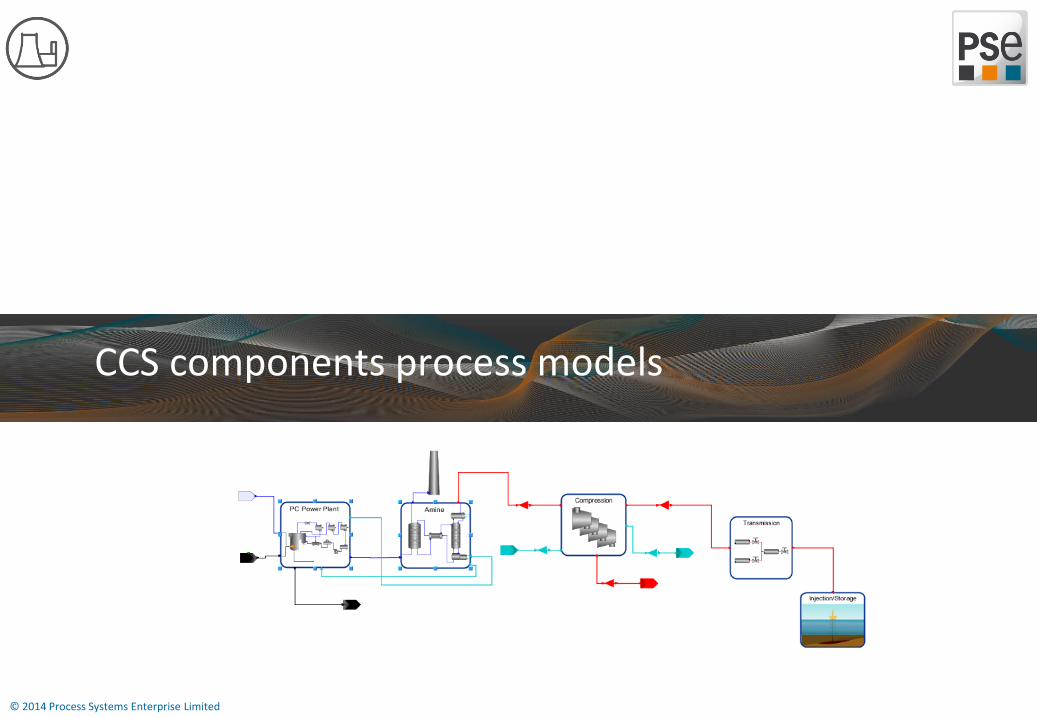
CCS components process models

© 2014 Process Systems Enterprise Limited
Governor valve
Feed Water Heaters
Deaerator Condenser
Generator
Coal
Air
Boiler
Turbine sections
Flue gas treatment
> 10 recycles & closed water/steam loop
Sub-system #1
Supercritical pulverized coal power plant

© 2014 Process Systems Enterprise Limited
gCCS Power Plant library – conventional power generation
CCGT power plant
Gas Turbine
Condenser
Generator
Steam turbines
Steam drums
Economisers, superheaters, evaporators
Input flexibility: Total power output or natural gas flowrate specified
Air
Natural Gas
Steam to Capture Plant
Condensate return
Stack

© 2014 Process Systems Enterprise Limited
Process side
Sub-system #1 – other power technologies considered
Oxyfuel power plant
Ste
am c
ycle
Compression and
purification
Oxyfuel boiler and
recycle

© 2014 Process Systems Enterprise Limited
Steam Cycle
Sub-system #1 – other power technologies considered
Oxyfuel power plant P
roce
ss s
ide

© 2014 Process Systems Enterprise Limited
Integrated Gasification Combined Cycle power plant (IGCC)
Air separation unit
(ASU) and compression
Gasification and
syngas cooling
Syngas conditioning
Acid gas removal
(AGR) and
sulphur recovery
unit (SRU)
Gas turbine
HRSG and steam
turbines
Sub-system #1 – other power technologies considered
IGCC power plant

© 2014 Process Systems Enterprise Limited
CO2 inlet
Absorber
Direct Contact Cooler (DCC)
Buffer Tank
Stripper
Reboiler
Condenser
CO2 capture rate controller
Solvent /water make-up controllers
Sub-system #2
CO2 capture plant

© 2014 Process Systems Enterprise Limited
Sub-system #3
CO2 compression plant
Fixed speed electric drive
Variable speed electric drive
Dehydration unit
Cooler KO drum
Compression section
(Frame #1: 4 ; Frame #22)
Surge valve

© 2014 Process Systems Enterprise Limited
Pipelines Schedule 40, 18’’
Emergency shutdown valves
(ESD) Gate valve
Vertical riser from sea bed
CO2 flowmeter
Sub-system #4
CO2 transmission pipelines
20km
16
0m
200km
-20
0m

© 2014 Process Systems Enterprise Limited
Wells 7’’, 2km
Distribution header
Choke valves
Reservoir ~250 bar
Wellhead connections
20m above water, 70m submerged
Sub-system #5
CO2 injection & storage in reservoir

© 2014 Process Systems Enterprise Limited
Offshore dense-phase injection; 4 injection wells
~2km reservoir depth (acknowledgement:
CO2DeepStore)
220km of pipeline Onshore and Offshore
~800MWe Supercritical Pulverized coal (acknowledgement: E.ON)
4 compression trains 2 frames per train Surge control (acknowledgement: Rolls-Royce)
Chemical absorption MEA solvent 90% CO2 capture
System overview
29,700 equations/variables 27,991 algebraic 1,709 differential
Computation time (on desktop computer) ~200s for steady state
(much) less for sensitivity runs
~7h for 50h dynamic simulation

© 2014 Process Systems Enterprise Limited
System model hierarchy
© 2014 Process Systems Enterprise Limited
Case Study: state-state analysis

© 2014 Process Systems Enterprise Limited
Scenario Description Power plant operation
(% of nominal load) Capture plant operation
(CO2 % captured)
SS1.1 (a,b,c) Base Load Power Plant (a) 100%; (b) 75%; (c) 50% 0% (no capture)
SS1.2 (a, b) Base load CCS Chain 100% (a) 90%; (b) 50%
SS1.3 (a, b) Part Load Analysis (a) 75%; (b) 50% 90%
SS1.4 Extreme Weather: Max Summer
100% 90%
SS1.5 Extreme Weather: Max Winter 100% 90%
Steady-state scenarios
used for model calibration (e.g. Stodola constants for steam turbines; HTA for feed water heaters, etc.)
Temperatures
(oC)
Affected sub-systems Base Case
Extreme Summer
ExtremeWinter
Cooling water Power, Capture, Compression 18 22 7
Air Power, Transmission, Injection
15 30 -15
Sea water Transmission, Injection 9 14 4
NB. Geothermal gradient of +27.5oC / km

© 2014 Process Systems Enterprise Limited
Steady-state analysis
Power generation
100% 0%
75% 0%
50% 0%
100% 90%
100% 50%
75% 90%
50% 90%
100% 90%
Summer
100% 90%
Winter
: coal milling + power plant auxiliaries
: coal milling + power plant auxiliaries + CO2 compression
: capture plant steam

© 2014 Process Systems Enterprise Limited
Case Study: dynamic analysis
© 2014 Process Systems Enterprise Limited
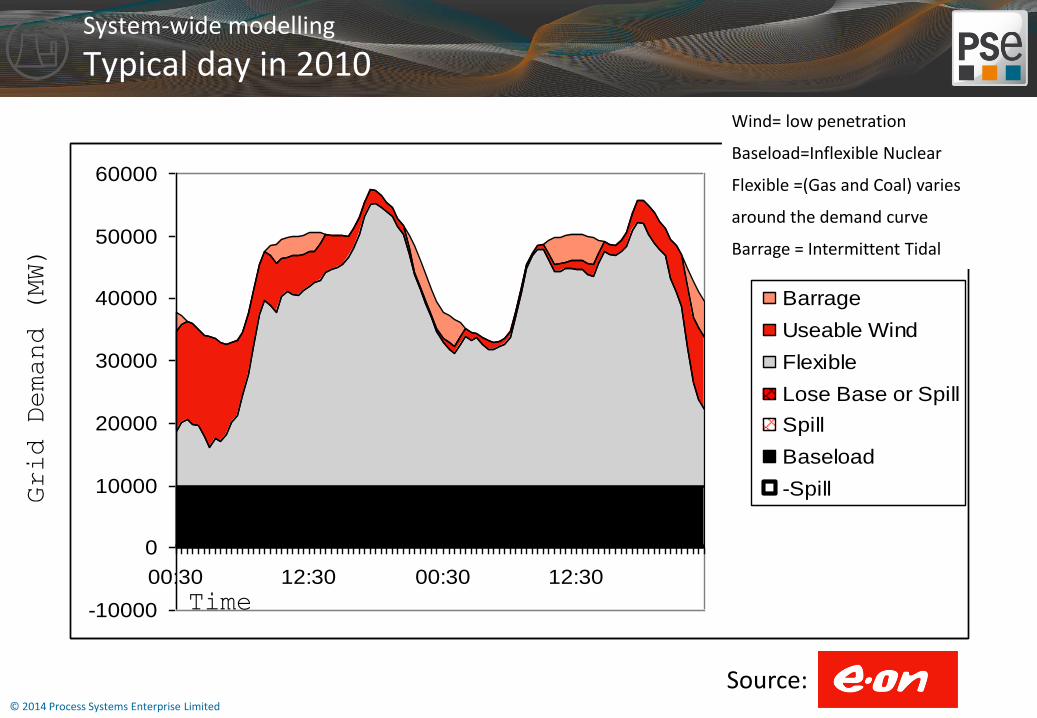
System-wide modelling
Typical day in 2010
-10000
0
10000
20000
30000
40000
50000
60000
00:30 12:30 00:30 12:30
Barrage
Useable Wind
Flexible
Lose Base or Spill
Spill
Baseload
-Spill
Wind= low penetration
Baseload=Inflexible Nuclear
Flexible =(Gas and Coal) varies
around the demand curve
Barrage = Intermittent Tidal
Time
Grid Demand (MW)
Source:

© 2014 Process Systems Enterprise Limited
System-wide modelling
Windy day in 2030 with high wind penetration
-10000
0
10000
20000
30000
40000
50000
60000
00:30 12:30 00:30 12:30
Barrage
Useable Wind
Flexible
Lose Base or Spill
Spill
Baseload
-Spill
Wind= high penetration
Flexible =(Gas and Coal) varies
around the demand curve and also
variations in wind power
Grid Demand (MW)
Time
Additional power at night is large
enough to impact base load plant
– requires spill of renewable or
baseload power.
Source:

© 2014 Process Systems Enterprise Limited
Power
Load
5 mins
5 mins 75%
100%
Time
1 hour
5 hours 23.5 hours
42.5 hours
Power
Load
5 mins 75%
100%
Time
5 hours
Dynamic analysis
Scheduled changes in power plant load
Scenario DS1.1 Scenario DS1.2

© 2014 Process Systems Enterprise Limited
3 4 5 6 7 8 9 1050
55
60
65
70
Mass f
low
rate
(kg/s
)
3 4 5 6 7 8 9 10400
500
600
700
800
Net
Pow
er
(MW
e)
(a) Coal mass flowrate
3 4 5 6 7 8 9 1032
3334
3536
3738
Net
Eff
icie
ncy (
%)
3 4 5 6 7 8 9 10400
500
600
700
800
Net
Pow
er
(MW
e)
(b) Power plant net efficiency
3 4 5 6 7 8 9 100
0.5
1
Ste
m p
ositio
n
3 4 5 6 7 8 9 10400
500
600
700
800
Net
Pow
er
(MW
e)
(c) Governor valve stem position
3 4 5 6 7 8 9 100
0.5
1
Ste
m p
ositio
n
3 4 5 6 7 8 9 10400
500
600
700
800
Net
Pow
er
(MW
e)
(d) LP turbine inlet valve stem position
3 4 5 6 7 8 9 10600
650
700
750
800
Mass f
low
rate
(kg/s
)
3 4 5 6 7 8 9 10400
500
600
700
800
Net
Pow
er
(MW
e)
(e) Flue gas mass flowrate
3 4 5 6 7 8 9 100.137
0.1375
0.138
Time (hours)
Volu
me f
raction
3 4 5 6 7 8 9 10400
500
600
700
800
Net
Pow
er
(MW
e)
(f) CO2 volume fraction in flue gas
Dynamic analysis
Power plant
Controller maintains steam to reboiler
>3.5bar
Steam is saturated here
Coal mass flowrate
Power plant net efficiency
Flue gas mass flowrate
CO2 vol fraction
LP turbine inlet valve stem position
Governor valve stem position

© 2014 Process Systems Enterprise Limited
3 4 5 6 7 8 9 1084
86
88
90
92
94
96
Time (hours)
CO
2 c
aptu
re r
ate
(%
)
3 4 5 6 7 8 9 10400
500
600
700
800
Net
Pow
er
(MW
e)
(a) CO2 capture rate
3 4 5 6 7 8 9 101000
1100
1200
1300
1400
1500
1600
Time (hours)
Lean s
olv
ent
flow
rate
(kg/s
)
3 4 5 6 7 8 9 10400
500
600
700
800
Net
Pow
er
(MW
e)
(b) Lean solvent flowrate to absorber
3 4 5 6 7 8 9 1080
100
120
Time (hours)
Reboile
r ste
am
requirem
ent
(kg/s
)
3 4 5 6 7 8 9 10400
500
600
700
800N
et
Pow
er
(MW
e)
(c) Reboiler steam requirement
DS 1.1
DS 1.2
3 4 5 6 7 8 9 10100
110
120
130
140
150
160
Time (hours)
CO
2 pr
oduc
t flo
wra
te (
kg/s
)
3 4 5 6 7 8 9 10400
500
600
700
800
Net
Pow
er (
MW
e)
(a) CO2 product flowrate
3 4 5 6 7 8 9 103
3.5
4
Time (hours)Spe
cific
reg
ener
atio
n re
quire
men
t (M
J/kg
CO
2)
3 4 5 6 7 8 9 10400
500
600
700
800
Net
Pow
er (
MW
e)
(b) Specific regeneration requirement
3 4 5 6 7 8 9 1010
15
20
25
Time (hours)
Sol
vent
spe
cific
dem
and
(m3/
tonn
e C
O2)
3 4 5 6 7 8 9 10400
500
600
700
800
Net
Pow
er (
MW
e)
(c) Solvent specific demand
DS 1.1
DS 1.2
Dynamic analysis
CO2 capture plant
CO2 capture rate
Solvent flowrate to absorber
Steam to reboiler
CO2 production rate (kg/s)
3 4 5 6 7 8 9 1040
50
60
70
80
Leve
l (%
)
3 4 5 6 7 8 9 10400
500
600
700
800
Net
Pow
er (M
We)
(a) Absorber sump level
3 4 5 6 7 8 9 1040
50
60
70
80
Leve
l (%
)
3 4 5 6 7 8 9 10400
500
600
700
800
Net
Pow
er (M
We)
(b) Stripper sump level
3 4 5 6 7 8 9 100.02
0.025
0.03
0.035
0.04
Vol
ume
fract
ion
3 4 5 6 7 8 9 10400
500
600
700
800
Net
Pow
er (M
We)
(c) Absorber liquid holudp at 8.5m
3 4 5 6 7 8 9 100
100
200
300
400
Time (hours)
Leve
l (%
)
3 4 5 6 7 8 9 10400
500
600
700
800
Net
Pow
er (M
We)
(d) Buffer tank level
Solvent buffer tank level (%)

© 2014 Process Systems Enterprise Limited
3 4 5 6 7 8 9 1036
37
38
39
40
41
Net
Eff
icie
ncy (
%)
3 4 5 6 7 8 9 1080
100
120
Reboile
r ste
am
dem
and (
kg/s
)(b) Power plant net efficiency vs reboiler steam demand
Time (hours)
3 4 5 6 7 8 9 10600
700
800
Mass f
low
rate
(kg/s
)
3 4 5 6 7 8 9 10400
500
600
700
800
Net
Pow
er
(MW
e)
(a) Flue gas mass flowrate
Dynamic analysis
Power/CO2 capture two-way coupling
Flue gas flowrate
Power plant net efficiency vs. reboiler steam demand

© 2014 Process Systems Enterprise Limited
3 4 5 6 7 8 9 107
7.5
8
Pow
er
requirem
ent
(MW
e)
3 4 5 6 7 8 9 10400
500
600
700
800
Net
Pow
er
(MW
e)
(a) Electric drive 1 power requirement
DS 1.1
DS 1.2
3 4 5 6 7 8 9 103
3.5
4
4.5
5
Pow
er
requirem
ent
(MW
e)
3 4 5 6 7 8 9 10400
500
600
700
800
Net
Pow
er
(MW
e)
(b) Electric drive 2 power requirement
3 4 5 6 7 8 9 1038
38.1
38.2
38.3
38.4
Pre
ssure
(bara
)
3 4 5 6 7 8 9 10400
500
600
700
800
Net
Pow
er
(MW
e)
(c) Dehydrator inlet pressure
3 4 5 6 7 8 9 1096
97
98
99
100
Time (hours)
Pre
ssure
(bara
)
3 4 5 6 7 8 9 10400
500
600
700
800
Net
Pow
er
(MW
e)
(d) Compressor discharge pressure
Dynamic analysis
CO2 compression plant
Drive #1 power
Drive #2 power
Dehydrator inlet pressure
Compressor discharge pressure
3 4 5 6 7 8 9 100
10
20
30
40
50
Surg
e m
arg
in (
%)
3 4 5 6 7 8 9 10400
500
600
700
800
Net
Pow
er
(MW
e)
(a) Compressor section 1 surge margin
3 4 5 6 7 8 9 100
10
20
30
40
50
Surg
e m
arg
in (
%)
3 4 5 6 7 8 9 10400
500
600
700
800
Net
Pow
er
(MW
e)
(b) Compressor section 2 surge margin
3 4 5 6 7 8 9 100
10
20
30
40
50
Surg
e m
arg
in (
%)
3 4 5 6 7 8 9 10400
500
600
700
800
Net
Pow
er
(MW
e)
(c) Compressor section 3 surge margin
3 4 5 6 7 8 9 100
10
20
30
40
50
Surg
e m
arg
in (
%)
3 4 5 6 7 8 9 10400
500
600
700
800
Net
Pow
er
(MW
e)
(d) Compressor section 4 surge margin
3 4 5 6 7 8 9 100
10
20
30
40
50
Surg
e m
arg
in (
%)
3 4 5 6 7 8 9 10400
500
600
700
800
Net
Pow
er
(MW
e)
(e) Compressor section 5 surge margin
3 4 5 6 7 8 9 100
10
20
30
40
50
Time (hours)
Surg
e m
arg
in (
%)
3 4 5 6 7 8 9 10400
500
600
700
800
Net
Pow
er
(MW
e)
(f) Compressor section 6 surge margin
Surge margins
Drive #1, Section #1
Drive #1, Section #3
Drive #1, Section #2
Drive #2, Section #1
Drive #2, Section #2
Drive #2, Section #3
Compressor surge control

© 2014 Process Systems Enterprise Limited
Dynamic analysis
CO2 transmission pipelines
Buffer potential for flexible operation
5 10 15 20 25 30 35 40 45 50100
110
120
130
140
150
160
Time (hours)
Ma
ss f
low
rate
(kg
/s)
Pipeline inlet
At landfall valve
At 100km
Pipeline outlet
© 2014 Process Systems Enterprise Limited
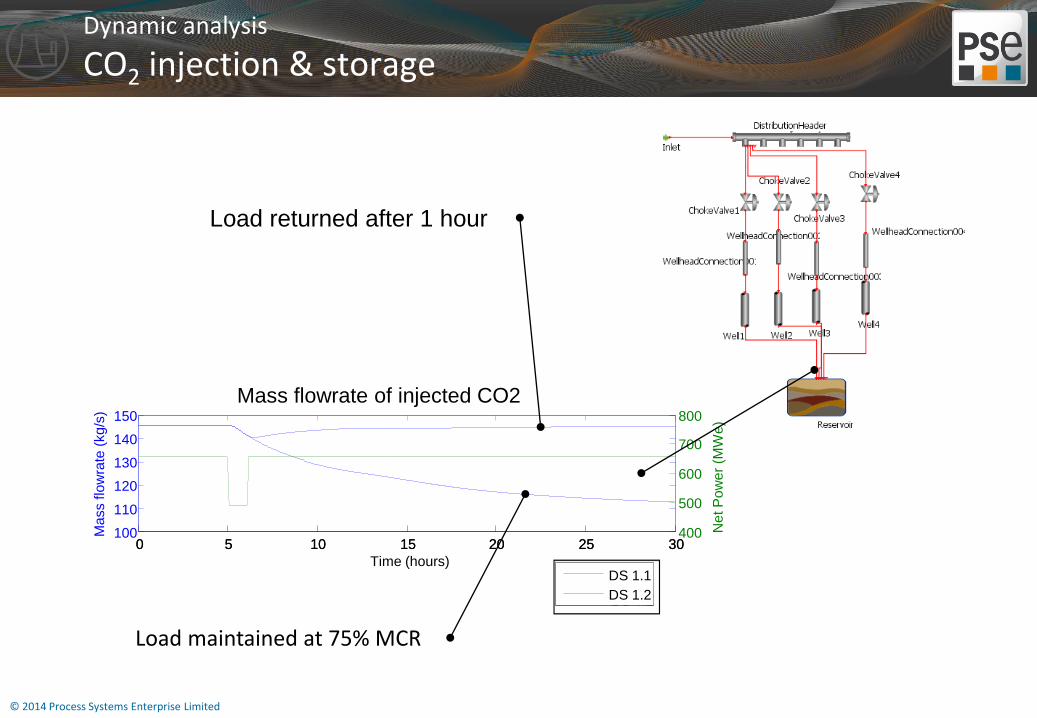
Dynamic analysis
CO2 injection & storage
0 5 10 15 20 25 30 100
110
120
130
140
150
Time (hours)
Ma
ss flo
wra
te (
kg
/s)
0 5 10 15 20 25 30 400
500
600
700
800
Ne
t P
ow
er
(MW
e)
Mass flowrate of injected CO2
DS 1.1
DS 1.2
Load returned after 1 hour
Load maintained at 75% MCR
© 2014 Process Systems Enterprise Limited
Case Study: Shell Flexibility

© 2014 Process Systems Enterprise Limited
Operability studies of capture plant
Source: Shell

© 2014 Process Systems Enterprise Limited
Case Study: Industrial CCS Techno-economics

© 2014 Process Systems Enterprise Limited
Industrial CCS Techno-economics
Source: Carbon Capture Journal

© 2014 Process Systems Enterprise Limited
Thank you