cd equisearch pvt ltd -...
TRANSCRIPT

CD Equisearch Pvt Ltd Feb 28, 2018
Equities Derivatives Commodities Distribution of Mutual Funds Distribution of Life Insurance
L.G.Balakrishnan&Bros Ltd
No. of shares (m) 15.7
Mkt cap (Rs crs/$m) 1712/263.9
Current price (Rs/$) 1091/16.8
Price target (Rs/$) 1324/20.4
52 W H/L (Rs.) 1144/545
Book Value (Rs/$) 349/5.4
Beta 0.9
Daily volume (avg. monthly) 13260
P/BV (FY18e/19e) 3.2/2.8
EV/EBITDA (FY18e/19e) 8.9/7.6
P/E (FY18e/19e) 19.9/16.5
EPS growth (FY17/18e/19e) 3.4/31.0/21.0
OPM (FY17/18e/19e) 12.3/13.3/14.0
ROE (FY17/18e/19e) 15.3/17.4/18.1
ROCE(FY17/18e/19e) 13.3/15.0/16.6
D/E ratio (FY17/18e/19e) 0.3/0.2/0.1
BSE Code 500250
NSE Code LGBBROSLTD
Bloomberg LGBB IN
Reuters LBG.BO
Shareholding pattern %
Promoters 47.7
MFs / Banks / FIs 14.7
FPIs 0.6
Govt. Holding -
Public & others 37.0
Total 100.0
As on Dec 31, 2017
Recommendation
BUY
Analyst
KISHAN GUPTA, CFA, FRM
Phone: + 91 (33) 4488 0043
E- mail: [email protected]
Consolidated (Rs crs)
FY15
FY16 FY17
FY18e FY19e
Income from operations 1172.98 1205.30 1282.70 1446.91 1616.41
Other Income 8.80 3.92 9.94 9.59 10.54
EBITDA (other income included) 151.08 141.60 167.71 201.75 236.81
Profit after MI & associate profit
65.97 63.37 65.51 85.83 103.88
EPS(Rs) 42.03 40.38 41.74 54.68 66.18
EPS growth (%) 9.9 -3.9 3.4 31.0 21.0
Company Brief L G Balakrishnan (LGB) manufactures roller chains and undertakes metal
forming,including warm & cold forging, fine blanking and machined parts.
Quarterly Highlights � Spurred by sturdy off take of its value-enhancing metal forming business
(+22.7%), LGB's revenue growth in Q3 rose at the highest rate (19.8%) in at
least ten quarters , resurrecting its revenue share to 18.6% from just 16.3% a
year ago; 9MFY18's at 18.3% Vs 17% in the same period a year ago.
Buttressed by higher margins in its effervescent transmission business
(11.4% Vs 7.3%) as well as metal forming business (14.1% Vs 6.1%), PBT
(adjusted) rose by unyielding 88.4% and post tax earnings by no less
vivacious 88.3%.
� Yet, if it would not was demonetization of high currency notes in Q3 last
fiscal, this outcome would have looked far less spirited as EBIT of
transmission business stood at 8.1% in Q3FY16 and that of metal forming
business at 10.1%. Nonetheless, metal forming business 9MFY18 EBIT all
but equaled that of FY17's. Remarkable recovery instigated by LGB’s
transmission business EBIT in 9MFY18 (32.5% growth) - and EBIT margin
surged to 10.3% Vs 8.2% - helped it post 37.5% in PBT and PAT by 30.3%.
� Restrained operating expenses (excluding raw material costs - as raw
material to sales ratio surged by 200 bps 45.6% in 9MFY18) coupled with
decent revenue growth helped post nearly 90bps expansion in OPMs.
Outperforming broader demand trends in Indian two wheeler industry
(read: motorcycles), LGB's transmission business revenues rose in double
digits. LGB's Board has granted in principle approval for merger of its
wholly owned subsidiary, BCW V Tech India Pvt Ltd, w.e.f April 1, 2017.
� The stock currently trades at 19.9x FY18e EPS of Rs 54.68 and 16.5x FY19e
EPS of Rs 66.18. Spurred by higher than estimated margins of both
transmission and metal forming businesses, LGB's current fiscal's EPS has
been revised upwards by 11.2% and next fiscal's by 14.6%. Improved
earnings thus would buoy return on capital - ROE projected at 18.1% in
FY19 from 15.3% in FY17 - and quicker working capital conversion.
Emerging strongly from twin blows of demonetization and GST, rural
discretionary spending is expected to rise, thus boosting demand for two-
wheelers. On balance we maintain our buy rating on the stock with revised
target of Rs 1324 (previous target: Rs 808) based on 20x FY19 earnings
(forward PEG: ~1), over a period of 6-9 months.

2
2
CD Equisearch Pvt Ltd
Equities Derivatives Commodities Distribution of Mutual Funds Distribution of Life Insurance
[
Outlook & Recommendation
Two wheeler industry
Riding on a strong economic recovery post demonetization and GST enforcement in Q3 last year, SIAM expects Indian
automobile industry to post slightly better outcome next fiscal. Driven largely by higher off take of utility vehicles (14-15%
growth in FY19) and near modest sale of cars (8-9%), Indian passenger vehicle industry is projected to grow at 8-10%; 8.1%
growth in domestic off take in passenger vehicle logged in April-December 2017. The voluminous two wheeler industry
would more or less toe its recent growth trend to post 11-13% growth in dispatches (11.8% in April-December 2017) with
motorcycles dispatches expected to rise by 9-11% (9.8%) and scooters 13-16% (18.5%).
Large untapped market for scooters in north east and some of the eastern states like Orissa, Bihar and Chhattisgarh - where
vehicle penetration is awfully low - coupled with renewed demand for some of the southern states could animate the Indian
scooter demand, reckons SIAM. Yet caution is buzzword for the Indian consumer industry barely remains oblivious to rise in
interest rates - emerging mainly from inflation, higher commodity prices - particularly crude oil, and vagaries of monsoons.
SIAM asserts that although couple of successive good monsoon years has put rural economy on strong footing, seldom Indian
economy experiences three successive good monsoon years.
Prodded by dream run of its iconic scooter brand 'Activa', Honda Motorcycle & Scooter India (HMSI) published a stunning
20% growth in domestic dispatches in April-Dec 2017, helping it surpass 5m sales in 2017; its sight set at 6m unit sales in 2017-
18. New capacity expansion, new product launches and envious market penetration in tier II and tier III markets hastened
Honda's pursuit to 5m annual sales mark. Milestones were not reserved for Hero Honda too logged record volumes in CY17 -
over 7m for the first time ever, powering its focus on the premium segment and scooters. It recently launched three updated
motorcycles in 2018 models of Super Splendor, Passion Pro and the Passion XPro and has been rolling out these models pan -
India in a phased manner from January.
According to some media reports, Maruti Suzuki has set its sight on annual sales of 2.5 units by 2025 from 1.5m in 2016-17,
thus nudging its tier I auto component suppliers to ramp up their investments in and around its Gujarat plant, amid
disruptive changes in Indian passenger vehicle industry ranging from tightening regulations on safety and emission and
global outcry over cutting down on dependence on fossil fuels and thus vehicular pollution. IHS Market, a global forecasting
firm, expects the Indian car market to grow in double digits for the next two years.

3
3
CD Equisearch Pvt Ltd
Equities Derivatives Commodities Distribution of Mutual Funds Distribution of Life Insurance
Financials & Valuation
Thanks to prodigious base effect - emanating from demonetization of high currency Indian notes sometime in November 2016 - the
Indian two-wheeler industry grew by a dazzling 33.4% in January with scooter and most notable motorcycle segment growing by
48.3% and 28.6% respectively. Not unsurprisingly, Indian motorcycle segment growth has relentlessly perked in last few quarters
from 3.44% in Q1 to 7.7% in H1 to 9.9% in Apr-Jan period. Passenger vehicle segment trends barely differed for its dispatches growth
rose from an abysmal 4.4% in Q1 to a modest 9.2% in H1 to 8.1% in April-December period.
Powered by double digit two wheeler industry growth in FY19 and a fairly stable outlook for passenger vehicle industry (8-10%
growth estimated), LGB has ramped up capex this fiscal, channelizing funds - nearly Rs 100 crs($15.4m) - in automation to
replacement of assets to erection of new capacities involving both transmission and metal forming businesses. Wherefore, its
transmission business revenues would grow by a sober 12% next fiscal and value enriching metal forming's by 15% with the former
undoubtedly evincing not run-of-the-mill rise. Yet unflinching dependence on automobile industry - that too mainly on two wheelers
- has no puny impact on business risk evaluation.
Animated by richer product mix and higher volumes of machining products - for four wheelers - LBG's metal forming business
margins stunningly rose to 14.1% in Q3 from 8.2% in Q2 and a terrible 6.1% in Q3 of last fiscal and revenues rose by a blistering
22.7% (y-o-y) , though not exactly comparable due to previous year's sales gross of excise. Though metal forming business margin is
estimated to slightly improve next fiscal piggybacking on stable demand for four wheelers and favorable product mix - peddles over
300 different products. Still its margins has dreadfully vacillated - not impervious to swaying fortunes of Indian automobile industry
- over the years from 3.4% in FY13 to 12.6% in FY15 to 9% in FY17.
The stock currently trades at 19.9x FY18e EPS of Rs 54.68 and 16.5x FY19e EPS of Rs 66.18. Increased business automation would not
help it put a lid of manpower costs - up by just 7.4% in 9MFY18 - but also prop up margins through rollout of valued added
products. Yet alienation to subtleties of auto industry demand trends - arising from monsoons or interest rates or consumer spending
or inflation - remain arduous as ever. All thanks to improved economic outlook and anticipation of normal monsoons, auto industry
dispatches would be barely austere. Termination of Tata Motors dealership agreement by the end of current fiscal would help stem
losses. Weighing odds, we maintain our buy rating on the stock with revised target of Rs 1324 (previous target: Rs 808) based on 20x
FY19 earnings (forward PEG: ~1), over a period of 6-9 months. For more info refer to our May report.
Risks & Concerns
Dreary automobile sector
As the automobile sector forms a bulk of LGB's revenue, slow pick up in two wheeler sales could impact its volumes. Lower than
expected moderation in interest rates would further jeopardize resurrection in auto demand.
Margin pressure
Plethora of factors imperil margins including rising raw material costs, acute power shortages, pricing pressure by clients (read
OEMs) and import of auto components from low cost locations.
4
4
CD Equisearch Pvt Ltd
Equities Derivatives Commodities Distribution of Mutual Funds Distribution of Life Insurance
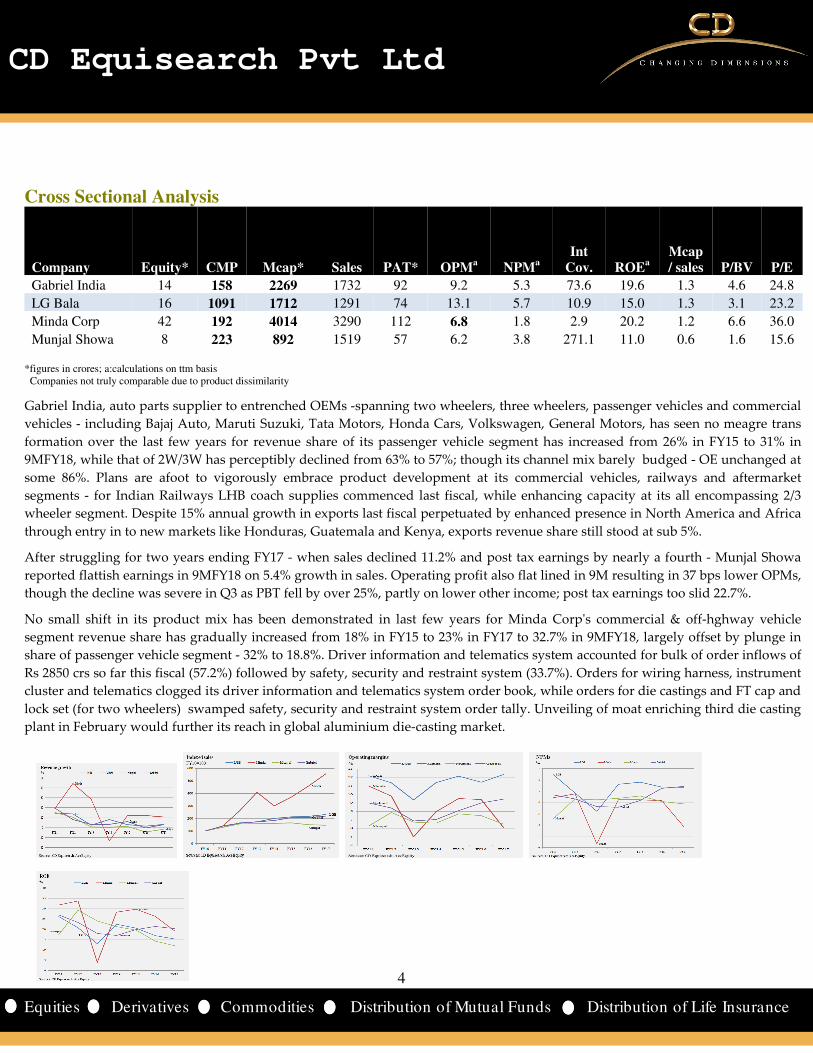
Cross Sectional Analysis
Company Equity* CMP Mcap* Sales PAT* OPMa NPMa Int
Cov. ROEa Mcap / sales P/BV P/E
Gabriel India 14 158 2269 1732 92 9.2 5.3 73.6 19.6 1.3 4.6 24.8
LG Bala 16 1091 1712 1291 74 13.1 5.7 10.9 15.0 1.3 3.1 23.2
Minda Corp 42 192 4014 3290 112 6.8 1.8 2.9 20.2 1.2 6.6 36.0
Munjal Showa 8 223 892 1519 57 6.2 3.8 271.1 11.0 0.6 1.6 15.6 *figures in crores; a:calculations on ttm basis Companies not truly comparable due to product dissimilarity
Gabriel India, auto parts supplier to entrenched OEMs -spanning two wheelers, three wheelers, passenger vehicles and commercial
vehicles - including Bajaj Auto, Maruti Suzuki, Tata Motors, Honda Cars, Volkswagen, General Motors, has seen no meagre trans
formation over the last few years for revenue share of its passenger vehicle segment has increased from 26% in FY15 to 31% in
9MFY18, while that of 2W/3W has perceptibly declined from 63% to 57%; though its channel mix barely budged - OE unchanged at
some 86%. Plans are afoot to vigorously embrace product development at its commercial vehicles, railways and aftermarket
segments - for Indian Railways LHB coach supplies commenced last fiscal, while enhancing capacity at its all encompassing 2/3
wheeler segment. Despite 15% annual growth in exports last fiscal perpetuated by enhanced presence in North America and Africa
through entry in to new markets like Honduras, Guatemala and Kenya, exports revenue share still stood at sub 5%.
After struggling for two years ending FY17 - when sales declined 11.2% and post tax earnings by nearly a fourth - Munjal Showa
reported flattish earnings in 9MFY18 on 5.4% growth in sales. Operating profit also flat lined in 9M resulting in 37 bps lower OPMs,
though the decline was severe in Q3 as PBT fell by over 25%, partly on lower other income; post tax earnings too slid 22.7%.
No small shift in its product mix has been demonstrated in last few years for Minda Corp's commercial & off-hghway vehicle
segment revenue share has gradually increased from 18% in FY15 to 23% in FY17 to 32.7% in 9MFY18, largely offset by plunge in
share of passenger vehicle segment - 32% to 18.8%. Driver information and telematics system accounted for bulk of order inflows of
Rs 2850 crs so far this fiscal (57.2%) followed by safety, security and restraint system (33.7%). Orders for wiring harness, instrument
cluster and telematics clogged its driver information and telematics system order book, while orders for die castings and FT cap and
lock set (for two wheelers) swamped safety, security and restraint system order tally. Unveiling of moat enriching third die casting
plant in February would further its reach in global aluminium die-casting market.

5
5
CD Equisearch Pvt Ltd
Equities Derivatives Commodities Distribution of Mutual Funds Distribution of Life Insurance
Financials
Quarterly Results -Standalone Figures in Rs crs
Q3FY18 Q3FY17 % chg. 9MFY18 9MFY17 % chg.
Income from operations 333.46 278.28 19.8 960.10 840.95 14.2
Other Income 1.46 1.37 6.7 2.68 3.32 -19.1
Total Income 334.92 279.65 19.8 962.78 844.26 14.0
Total Expenditure 284.78 245.09 16.2 828.98 733.59 13.0
PBIDT (other income included) 50.14 34.56 45.1 133.80 110.68 20.9
Interest 2.13 3.03 -29.7 7.43 10.23 -27.4
Depreciation 13.64 12.55 8.7 39.44 36.47 8.1
PBT 34.37 18.98 81.1 86.94 63.98 35.9
Tax 11.90 6.24 90.8 30.01 19.79 51.7
PAT 22.47 12.74 76.4 56.93 44.19 28.8
Extraordinary Item - 0.49 -100.0 - 0.49 -100.0
Adjusted Net Profit 22.47 12.25 83.4 56.93 43.70 30.3 EPS (F.V. 10) 14.32 7.80 83.4 36.27 27.84 30.3
Equity 15.70 15.70 - 15.70 15.70 -
Segment Results Figures in Rs crs
Q3FY18 Q3FY17 % chg. 9MFY18 9MFY17 % chg.
Segment Revenue
Transmission 268.37 249.74 7.5 784.25 741.75 5.7
Metal forming 62.18 50.68 22.7 182.63 158.96 14.9
Others 2.91 10.85 -73.2 29.18 36.92 -21.0
Total 333.46 311.29 7.1 996.06 937.63* 6.2
Segment EBIT
Transmission 30.66 18.34 67.2 80.63 60.83 32.5
Metal forming 8.74 3.07 185.0 17.07 12.32 38.5
Others -1.73 0.67 -358.2 -0.23 2.76 -108.4
Total 37.66 22.07 70.6 97.47 75.92 28.4
Interest 2.13 3.03 -29.7 7.43 10.23 -27.4
Unallocable exp 1.17 0.07 1659.4 3.10 1.71 81.1
PBT 34.37 18.98 81.1 86.94 63.98 35.9
• Excise duty included

6
6
CD Equisearch Pvt Ltd
Equities Derivatives Commodities Distribution of Mutual Funds Distribution of Life Insurance
Financials
Income Statement - Consolidated Figures in Rs crs
FY15 FY16 FY17 FY18e FY19e
Income from operations 1172.98 1205.30 1282.70 1446.91 1616.41
Growth (%) 5.8 2.8 6.4 12.8 11.7
Other Income 8.80 3.92 9.80 9.58 10.52
Total Income 1181.78 1209.22 1292.50 1456.49 1626.93
Total Expenditure 1030.70 1067.63 1124.79 1254.74 1390.12
EBITDA (other income included) 151.08 141.60 167.71 201.75 236.81
Interest 17.70 17.89 15.53 11.05 10.02
EBDT 133.38 123.71 152.18 190.70 226.78
Depreciation 39.47 45.93 52.69 57.73 66.28
Tax 20.49 12.92 29.97 45.21 54.57
Net profit 73.42 64.86 69.52 87.76 105.94
Minority interest 2.79 2.28 4.22 2.44 2.56
Associate profit 0.58 0.91 1.05 0.50 0.50
Net profit after MI&AP 71.21 63.50 66.35 85.83 103.88
Extraordinary item 5.24 0.12 0.84 0.00 0.00
Adjusted Net Profit 65.97 63.37 65.51 85.83 103.88
EPS (Rs.) 42.03 40.38 41.74 54.68 66.18
Segment Results Figures in Rs crs
FY15 FY16 FY17 FY18e FY19e
Segment Revenue
Transmission 799.78 859.47 919.78 1048.89 1174.75
Metal forming 184.60 180.91 201.26 247.73 284.89
Others 188.61 164.93 161.66 150.30 156.77
Net sales 1172.98 1205.30 1282.70 1446.91 1616.41
Segment EBIT
Transmission 77.85 69.37 84.13 111.06 129.22
Metal forming 23.29 18.14 18.10 24.88 29.91
Others 3.87 12.22 15.78 11.26 14.95
Sub Total 105.00 99.73 118.01 147.20 174.09
Unallocable exp (net of income) -6.61 4.07 2.86 3.18 3.56
Interest 17.70 17.89 15.53 11.05 10.02
PBT 93.91 77.78 99.62 132.97 160.51

7
7
CD Equisearch Pvt Ltd
Equities Derivatives Commodities Distribution of Mutual Funds Distribution of Life Insurance
Consolidated Balance Sheet Figures in Rs crs
FY15 FY16 FY17 FY18e FY19e
SOURCES OF FUNDS
Share Capital 15.70 15.70 15.70 15.70 15.70
Reserves 348.95 400.60 465.66 544.92 633.68
Total Shareholders Funds 364.65 416.30 481.36 560.61 649.37
Minority Interest 12.79 15.32 16.92 19.36 21.92
Long term debt 99.31 94.88 91.58 71.04 35.47
Total Liabilities 476.74 526.49 589.86 651.00 706.76
APPLICATION OF FUNDS
Gross Block 586.02 691.35 755.92 862.94 937.94
Less: Accumulated Depreciation 270.01 310.79 349.33 407.06 473.34
Net Block 316.01 380.56 406.59 455.88 464.60
Capital Work in Progress 36.54 10.22 13.95 12.00 12.00
Investments 17.60 18.52 19.57 20.07 20.57
Current Assets, Loans & Advances
Inventory 230.55 227.88 232.58 220.96 236.42
Sundry Debtors 146.55 152.52 175.50 196.56 218.18
Cash and Bank 7.33 8.04 18.99 28.97 34.13
Other Assets 24.05 32.82 23.13 22.23 23.70
Total CA & LA 408.48 421.26 450.21 468.72 512.44
Current liabilities 305.23 309.94 292.47 297.86 293.96
Provisions 7.18 2.03 0.31 0.31 0.31
Total Current Liabilities 312.41 311.97 292.78 298.17 294.27
Net Current Assets 96.07 109.30 157.43 170.55 218.17
Net Deferred Tax (net of liability) -16.51 -18.49 -16.33 -16.93 -17.71
Other Assets (Net of liabilities) 27.03 26.39 8.65 9.44 9.13
Total Assets 476.74 526.49 589.86 651.00 706.76

8
8
CD Equisearch Pvt Ltd
Equities Derivatives Commodities Distribution of Mutual Funds Distribution of Life Insurance
Cash Flow Statement Figures in Rs crs
FY17 FY18e FY19e
Net Income (a) 69.52 87.76 105.94 Non cash exp. & others (b) 48.79 53.23 61.03
Depreciation 52.69 57.73 66.28
Profit / loss on sale of assets -1.20 - -
Others -2.70 -4.49 -5.25 (Increase) / decrease in NWC (c) 22.40 4.79 -29.51
Inventory -4.71 11.63 -15.47
Change in assets (net of liabilities) 27.10 -13.62 -14.05
Operating cash flow (a+b+c) 140.71 145.79 137.45 Proceeds on sale of assets 1.87 - -
Purchase of fixed assets -91.18 -102.23 -78.55
Investments - - -
Others 5.50 10.12 7.96 Investing cash flow (d) -83.81 -92.11 -70.60
Net borrowings -43.55 -26.55 -46.81
Dividends paid -2.15 -13.22 -15.11
Financing cash flow (e) -45.70 -39.78 -61.93
Net change (a+b+c+d+e) 11.20 13.90 4.93
9
9
CD Equisearch Pvt Ltd
Equities Derivatives Commodities Distribution of Mutual Funds Distribution of Life Insurance
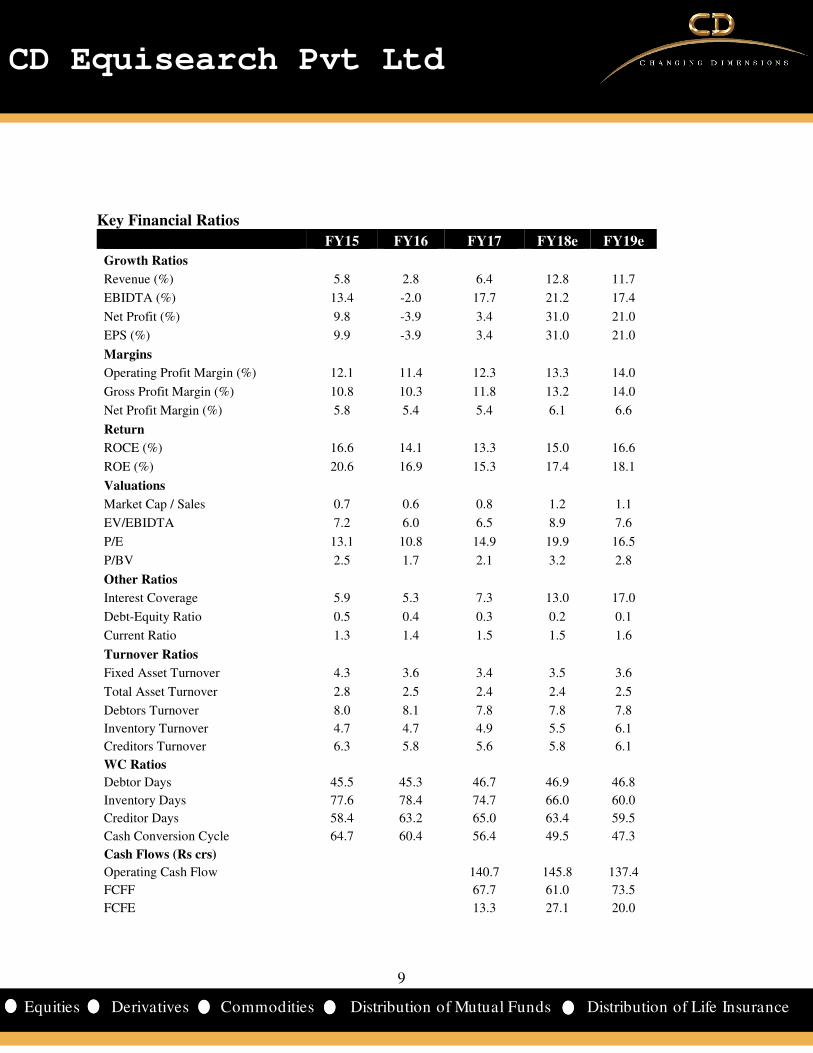
Key Financial Ratios
FY15 FY16 FY17 FY18e FY19e
Growth Ratios
Revenue (%) 5.8 2.8 6.4 12.8 11.7
EBIDTA (%) 13.4 -2.0 17.7 21.2 17.4
Net Profit (%) 9.8 -3.9 3.4 31.0 21.0
EPS (%) 9.9 -3.9 3.4 31.0 21.0
Margins
Operating Profit Margin (%) 12.1 11.4 12.3 13.3 14.0
Gross Profit Margin (%) 10.8 10.3 11.8 13.2 14.0
Net Profit Margin (%) 5.8 5.4 5.4 6.1 6.6
Return
ROCE (%) 16.6 14.1 13.3 15.0 16.6
ROE (%) 20.6 16.9 15.3 17.4 18.1
Valuations
Market Cap / Sales 0.7 0.6 0.8 1.2 1.1
EV/EBIDTA 7.2 6.0 6.5 8.9 7.6
P/E 13.1 10.8 14.9 19.9 16.5
P/BV 2.5 1.7 2.1 3.2 2.8
Other Ratios
Interest Coverage 5.9 5.3 7.3 13.0 17.0
Debt-Equity Ratio 0.5 0.4 0.3 0.2 0.1
Current Ratio 1.3 1.4 1.5 1.5 1.6
Turnover Ratios
Fixed Asset Turnover 4.3 3.6 3.4 3.5 3.6
Total Asset Turnover 2.8 2.5 2.4 2.4 2.5
Debtors Turnover 8.0 8.1 7.8 7.8 7.8
Inventory Turnover 4.7 4.7 4.9 5.5 6.1
Creditors Turnover 6.3 5.8 5.6 5.8 6.1
WC Ratios
Debtor Days 45.5 45.3 46.7 46.9 46.8
Inventory Days 77.6 78.4 74.7 66.0 60.0
Creditor Days 58.4 63.2 65.0 63.4 59.5
Cash Conversion Cycle 64.7 60.4 56.4 49.5 47.3
Cash Flows (Rs crs)
Operating Cash Flow 140.7 145.8 137.4
FCFF 67.7 61.0 73.5
FCFE 13.3 27.1 20.0

10
10
CD Equisearch Pvt Ltd
Equities Derivatives Commodities Distribution of Mutual Funds Distribution of Life Insurance
Cumulative Financial Data Figures in Rs crs FY11-13 FY14-16 FY17-19e
Income from operations 2584 3487 4346
Transmission revenues 1718 2389 3143
Metal forming revenues 461 531 734
Transmission to total (%) 67 69 72
Transmission EBIT 163 221 324
Transmission EBIT margin (%) 9.5 9.3 10.3
Operating profit 280 406 576
EBIT 201 295 428
PBT 145 241 392
PAT 121 189 255
Dividends 26 36 45
OPM (%) 10.8 11.6 13.3
NPM (%) 4.7 5.6 6.0
Interest coverage 3.6 5.5 11.7
ROE (%) 20.1 19.6 16.7
ROCE (%) 16.4 15.7 14.8
Debt-equity ratio* 0.7 0.4 0.1
Fixed asset turnover 4.7 4.0 3.6
Total asset turnover 2.9 2.7 2.4
Debtors turnover 8.5 8.4 7.8
Inventory turnover 4.8 4.8 5.4
Creditors turnover 7.2 6.7 6.0
Debtors days 43.0 43.4 46.7
Inventory days 75.8 75.3 67.4
Creditor days 51.0 54.4 60.7
Cash conversion cycle 67.8 64.4 53.5
Dividend payout ratio (%) 21.1 18.2 17.9
FY11-13 implies two years ending fiscal 13; *as on terminal year;
Scantier expansion of metal forming business in FY14-16 pummeled its consolidated revenue share to 15.2% in FY14-16 period
from 17.9% in the preceding three year period (see table), while that of transmission business zoomed 200 bps to 68.5%; though
transmission business EBIT margin slightly shrank – 9.3% Vs 9.5% in FY11-13 period (see table). Despite talk of improving
demand for automobiles in general, particularly for passenger cars, LGB’s transmission revenues would rise by a displeasing
31.6% in FY17-19 period (see table), way off from 39% in FY14-16 period, yet with a high revenue share at 72.3%. Sparked by
expanding margins of rather subdued metal forming business, overall OPMs would rise to 13.3% in FY17-19 e period from
11.6% in the previous three year period.
Late recovery of earnings in current fiscal after dreadful impact of demonetization savaged Indian automobile industry in
FY17, would barely help support vociferous return on capital expansion.- ROE estimated to decline to 16.7% in FY17-19 period
from 19.6%. Faster repayment of long term capital would stymie financial leverage. Increased sales would buoy outstanding
debtors – debtors days to rise to 46.7 from 43.4 in FY14-16 period and 43.0 in FY11-13 period.
11
11
CD Equisearch Pvt Ltd
Equities Derivatives Commodities Distribution of Mutual Funds Distribution of Life Insurance
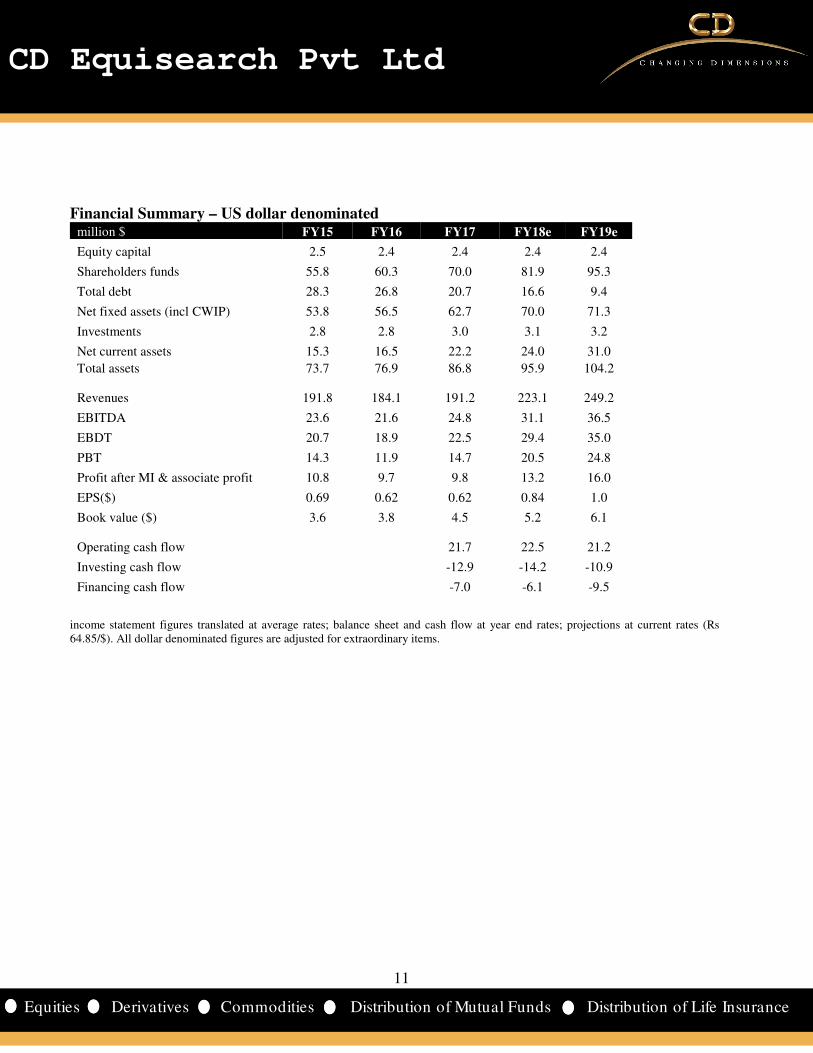
Financial Summary – US dollar denominated million $ FY15 FY16 FY17 FY18e FY19e
Equity capital 2.5 2.4 2.4 2.4 2.4
Shareholders funds 55.8 60.3 70.0 81.9 95.3
Total debt 28.3 26.8 20.7 16.6 9.4
Net fixed assets (incl CWIP) 53.8 56.5 62.7 70.0 71.3
Investments 2.8 2.8 3.0 3.1 3.2
Net current assets 15.3 16.5 22.2 24.0 31.0
Total assets 73.7 76.9 86.8 95.9 104.2 Revenues 191.8 184.1 191.2 223.1 249.2
EBITDA 23.6 21.6 24.8 31.1 36.5
EBDT 20.7 18.9 22.5 29.4 35.0
PBT 14.3 11.9 14.7 20.5 24.8
Profit after MI & associate profit 10.8 9.7 9.8 13.2 16.0
EPS($) 0.69 0.62 0.62 0.84 1.0
Book value ($) 3.6 3.8 4.5 5.2 6.1
Operating cash flow 21.7 22.5 21.2
Investing cash flow -12.9 -14.2 -10.9
Financing cash flow -7.0 -6.1 -9.5
income statement figures translated at average rates; balance sheet and cash flow at year end rates; projections at current rates (Rs 64.85/$). All dollar denominated figures are adjusted for extraordinary items.

12
12
CD Equisearch Pvt Ltd
Equities Derivatives Commodities Distribution of Mutual Funds Distribution of Life Insurance
Disclosure& Disclaimer CD Equisearch Private Limited (hereinafter referred to as ‘CD Equi’) is a Member registered with National Stock Exchange of India Limited,
Bombay Stock Exchange Limited and Metropolitan Stock Exchange of India Limited (Formerly known as MCX Stock Exchange Limited). CD
Equi is also registered as Depository Participant with CDSL and AMFI registered Mutual Fund Advisor. The associates of CD Equi are
engaged in activities relating to NBFC-ND - Financing and Investment, Commodity Broking, Real Estate, etc.
CD Equi is registered under SEBI (Research Analysts) Regulations, 2014 with SEBI Registration no INH300002274. Further, CD Equi hereby
declares that –
• No disciplinary action has been taken against CD Equi by any of the regulatory authorities.
• CD Equi/its associates/research analysts do not have any financial interest/beneficial interest of more than one percent/material
conflict of interest in the subject company(s) (kindly disclose if otherwise).
• CD Equi/its associates/research analysts have not received any compensation from the subject company(s) during the past twelve
months.
• CD Equi/its research analysts has not served as an officer, director or employee of company covered by analysts and has not been
engaged in market making activity of the company covered by analysts.
This document is solely for the personal information of the recipient and must not be singularly used as the basis of any investment decision.
Nothing in this document should be construed as investment or financial advice. Each recipient of this document should make such
investigations as they deem necessary to arrive at an independent evaluation of an investment in the securities of the companies referred to in
this document (including the merits and risks involved) and should consult their own advisors to determine the merits and risks of such an
investment.
Reports based on technical and derivative analysis center on studying charts of a stock's price movement, outstanding positions and trading
volume, as opposed to focusing on a company's fundamentals and as such, may not match with a report on a company's fundamentals.
The information in this document has been printed on the basis of publicly available information, internal data and other reliable sources
believed to be true but we do not represent that it is accurate or complete and it should not be relied on as such, as this document is for general
guidance only. CD Equi or any of its affiliates/group companies shall not be in any way responsible for any loss or damage that may arise to
any person from any inadvertent error in the information contained in this report. CD Equi has not independently verified all the information
contained within this document. Accordingly, we cannot testify nor make any representation or warranty, express or implied, to the accuracy,
contents or data contained within this document.
While, CD Equi endeavors to update on a reasonable basis the information discussed in this material, there may be regulatory compliance or
other reasons that prevent us from doing so.
This document is being supplied to you solely for your information and its contents, information or data may not be reproduced, redistributed
or passed on, directly or indirectly. Neither, CD Equi nor its directors, employees or affiliates shall be liable for any loss or damage that may
arise from or in connection with the use of this information.
CD Equisearch Private Limited (CIN: U67120WB1995PTC071521)
Registered Office: 37, Shakespeare Sarani, 3rd Floor, Kolkata – 700 017; Phone: +91(33) 4488 0000; Fax: +91(33) 2289 2557 Corporate Office: 10,
Vasawani Mansion, 5th Floor, Dinshaw Wachha Road, Churchgate, Mumbai – 400 020. Phone: +91(22) 2283 0652/0653; Fax: +91(22) 2283, 2276
Website: www.cdequi.com; Email: [email protected]
buy: >20% accumulate: >10% to ≤20% hold: ≥-10% to ≤10% reduce: ≥-20% to <-10% sell: <-20%
Exchange Rates Used- Indicative
Rs/$ FY14 FY15 FY16 FY17
Average 60.5 61.15 65.46 67.09
Year end 60.1 62.59 66.33 64.84
All $ values mentioned in the write-up translated at the average rate of the respective quarter/ year as applicable. Projections converted at
current exchange rate. Cumulative dollar figure is the sum of respective yearly dollar value.