ceds 2010 update
TRANSCRIPT
8/4/2019 CEDS 2010 Update
http://slidepdf.com/reader/full/ceds-2010-update 1/37
TexomaComprehensive
Economic
Development Strategy2010 Annual Update
8/4/2019 CEDS 2010 Update
http://slidepdf.com/reader/full/ceds-2010-update 2/37
Page 1 of 37
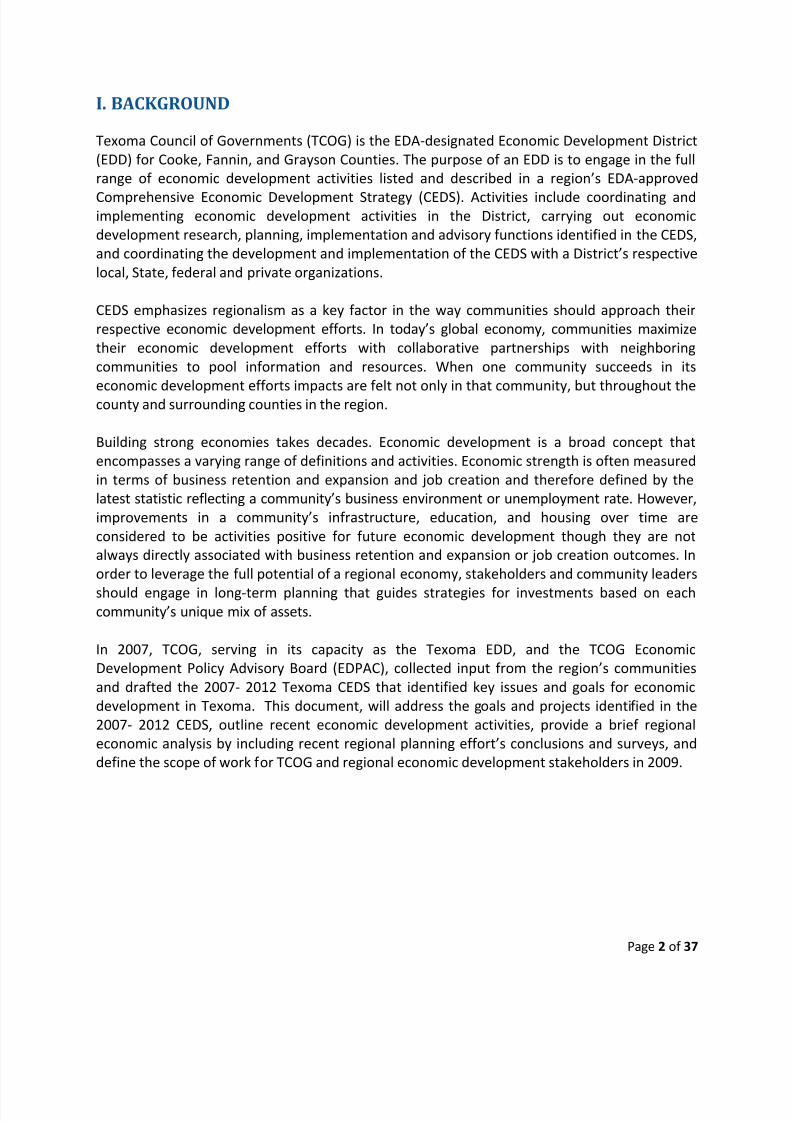
ContentsI. BACKGROUND ............................................................................................................................................ 2
Program Coordination .............................................................................................................................. 3
II. REGIONAL ANALYSIS ................................................................................................................................. 4
Population ................................................................................................................................................. 4
Industry and Occupation ........................................................................................................................... 7
Targeted Industries and Occupations ................................................................................................... 7
Baseline Cluster Analysis ..................................................................................................................... 12
Business Environment ............................................................................................................................. 18
Texoma Innovation Index and Analysis............................................................................................... 19
Workforce ............................................................................................................................................... 25
Skill Needs for Available, Critical, and Projected Jobs ........................................................................ 25
Key Trends ........................................................................................................................................... 27
III. PROGRESS REPORT ................................................................................................................................. 29
Ongoing Regional Projects .................................................................................................................. 30
Recent Successes .................................................................................................................................... 30
EDA Awards......................................................................................................................................... 30
Other Achievements in Economic Development ................................................................................. 31
IV. SCOPE OF WORK FOR 2010 ................................................................................................................... 33
Appendix A. ................................................................................................................................................. 34
EDA Distress Criteria- TEXOMA Statistical Report .................................................................................. 34
Economic Distress Criteria- Primary Elements .................................................................................... 34
Economic Distress Criteria- Geographic Components ........................................................................ 34
Appendix B. ................................................................................................................................................. 35
Innovation Index Methodology .................................................................................................................. 35
8/4/2019 CEDS 2010 Update
http://slidepdf.com/reader/full/ceds-2010-update 3/37
Page 2 of 37
I. BACKGROUND
Texoma Council of Governments (TCOG) is the EDA-designated Economic Development District
(EDD) for Cooke, Fannin, and Grayson Counties. The purpose of an EDD is to engage in the full
range of economic development activities listed and described in a region’s EDA-approved
Comprehensive Economic Development Strategy (CEDS). Activities include coordinating andimplementing economic development activities in the District, carrying out economic
development research, planning, implementation and advisory functions identified in the CEDS,
and coordinating the development and implementation of the CEDS with a District’s respective
local, State, federal and private organizations.
CEDS emphasizes regionalism as a key factor in the way communities should approach their
respective economic development efforts. In today’s global economy, communities maximize
their economic development efforts with collaborative partnerships with neighboring
communities to pool information and resources. When one community succeeds in its
economic development efforts impacts are felt not only in that community, but throughout thecounty and surrounding counties in the region.
Building strong economies takes decades. Economic development is a broad concept that
encompasses a varying range of definitions and activities. Economic strength is often measured
in terms of business retention and expansion and job creation and therefore defined by the
latest statistic reflecting a community’s business environment or unemployment rate. However,
improvements in a community’s infrastructure, education, and housing over time are
considered to be activities positive for future economic development though they are not
always directly associated with business retention and expansion or job creation outcomes. In
order to leverage the full potential of a regional economy, stakeholders and community leaders
should engage in long-term planning that guides strategies for investments based on eachcommunity’s unique mix of assets.
In 2007, TCOG, serving in its capacity as the Texoma EDD, and the TCOG Economic
Development Policy Advisory Board (EDPAC), collected input from the region’s communities
and drafted the 2007- 2012 Texoma CEDS that identified key issues and goals for economic
development in Texoma. This document, will address the goals and projects identified in the
2007- 2012 CEDS, outline recent economic development activities, provide a brief regional
economic analysis by including recent regional planning effort’s conclusions and surveys, and
define the scope of work for TCOG and regional economic development stakeholders in 2009.
8/4/2019 CEDS 2010 Update
http://slidepdf.com/reader/full/ceds-2010-update 4/37
Page 3 of 37
Program Coordination
The Texoma Economic Development District (EDD) coordinates economic development
activities in the three-county Texoma region. All three counties have elected to be part of the
district’s organization and programming. The EDD provides information about economic
development strategy and initiatives, sources of funds for businesses and public agencies, andcommunity data when requested.
The CEDS is coordinated by staff at the Texoma Council of Governments (TCOG) with input from
its Board of Directors, members, timely and significant research and analysis reports as noted in
the appendices, and information from the counties‘, municipalities‘, and special districts‘
comprehensive plans and infrastructure capital improvement plans. The Council of
Governments also contacted area specialists in the fields of downtown revitalization,
education, economic development and workforce development.
In addition to local government efforts, TCOG has initiated a number of economic development
training seminars designed for local officials and economic development practitioners. These
training seminars have focused on the rules and regulations regarding sales tax for economic
development in Texas.
The name and address of the local contact is:
Texoma Council of Governments
Ryan Gleason, Community Development Director
1117 Gallagher Drive Suite 300
Sherman, Texas 75090
Voice: (903) 813-3520Fax: (903) 813-3539
To obtain a copy of the 2010-2011 CEDS Annual Update, please contact TCOG’s Economic
Development Office at (903) 813-3523.
8/4/2019 CEDS 2010 Update
http://slidepdf.com/reader/full/ceds-2010-update 5/37
Page 4 of 37
2
4
6
8
10
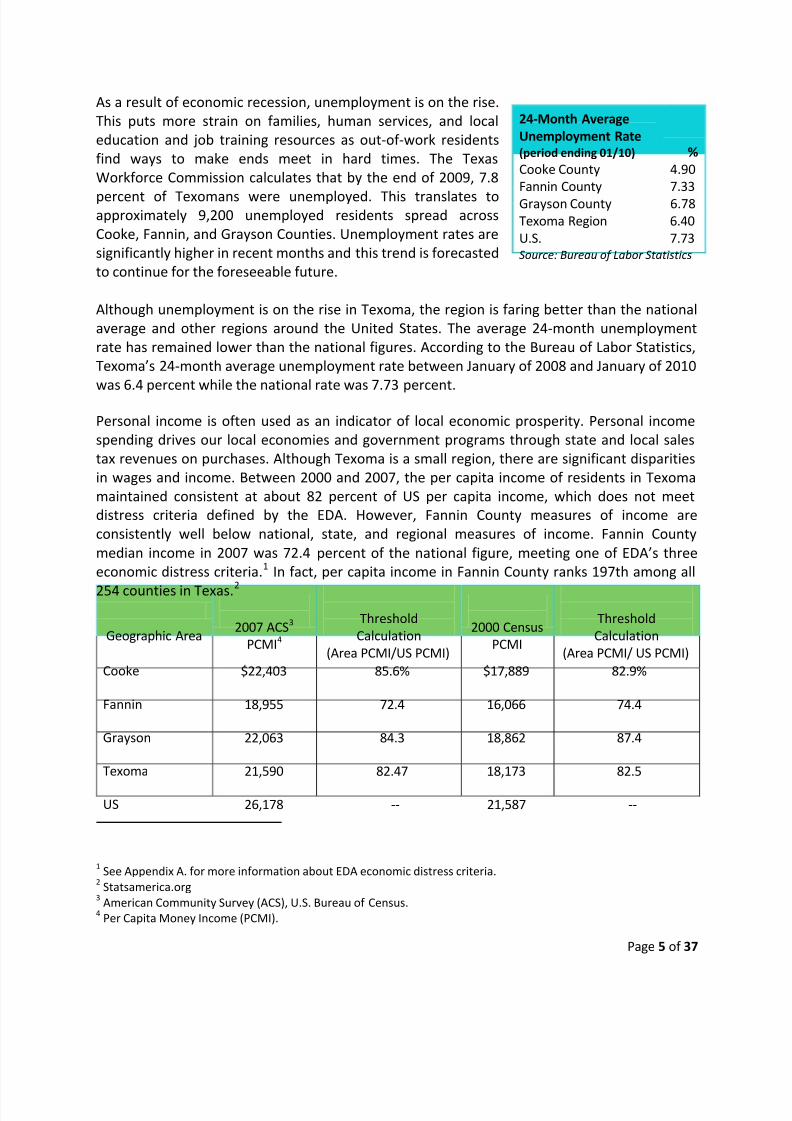
2000 2007 2008 Dec-09
Seasonally Adjusted
Unemployment Rates
Cooke
Fannin
Grayson
Texas
US
Source: TRACER
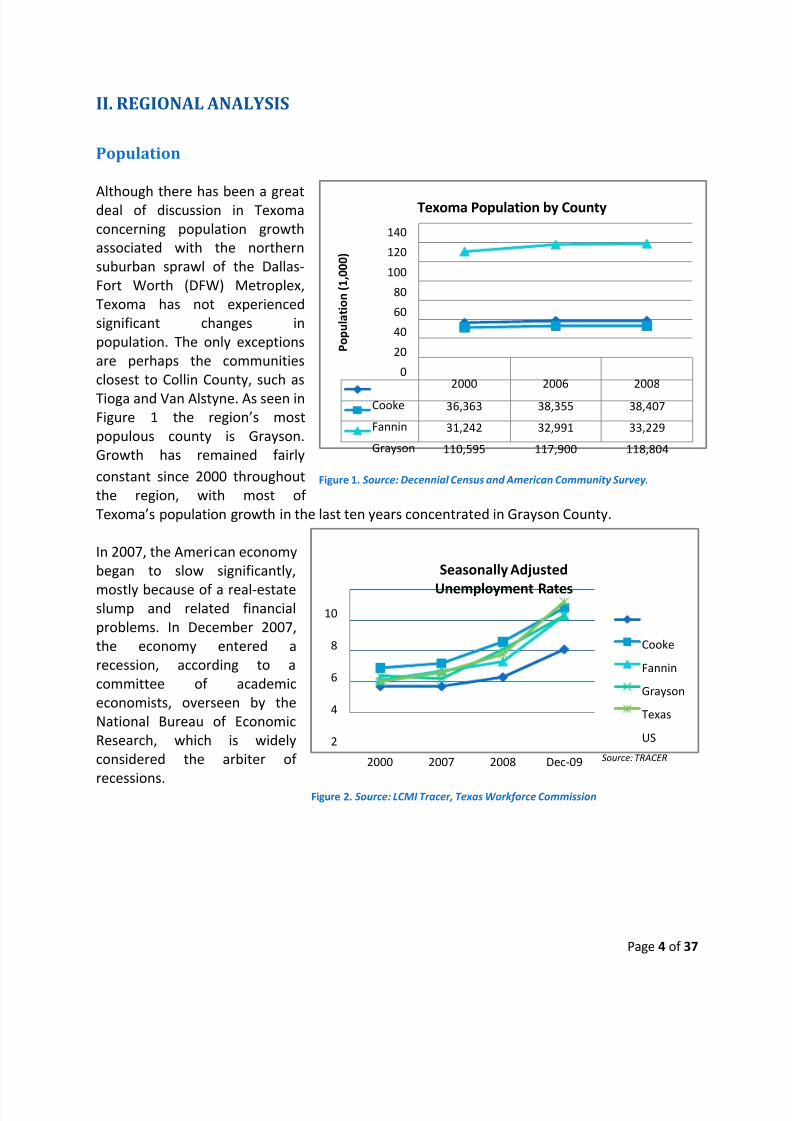
2000 2006 2008
Cooke 36,363 38,355 38,407
Fannin 31,242 32,991 33,229
Grayson 110,595 117,900 118,804
0
20
40
60
80
100
120
140
P o p u l a t i o n (
1 , 0
0 0 )
Texoma Population by County
II. REGIONAL ANALYSIS Population
Although there has been a greatdeal of discussion in Texoma
concerning population growth
associated with the northern
suburban sprawl of the Dallas-
Fort Worth (DFW) Metroplex,
Texoma has not experienced
significant changes in
population. The only exceptions
are perhaps the communities
closest to Collin County, such as
Tioga and Van Alstyne. As seen inFigure 1 the region’s most
populous county is Grayson.
Growth has remained fairly
constant since 2000 throughout
the region, with most of
Texoma’s population growth in the last ten years concentrated in Grayson County.
In 2007, the American economy
began to slow significantly,
mostly because of a real-estateslump and related financial
problems. In December 2007,
the economy entered a
recession, according to a
committee of academic
economists, overseen by the
National Bureau of Economic
Research, which is widely
considered the arbiter of
recessions.Figure 2. Source: LCMI Tracer, Texas Workforce Commission
Figure 1. Source: Decennial Census and American Community Survey.
8/4/2019 CEDS 2010 Update
http://slidepdf.com/reader/full/ceds-2010-update 6/37
Page 5 of 37
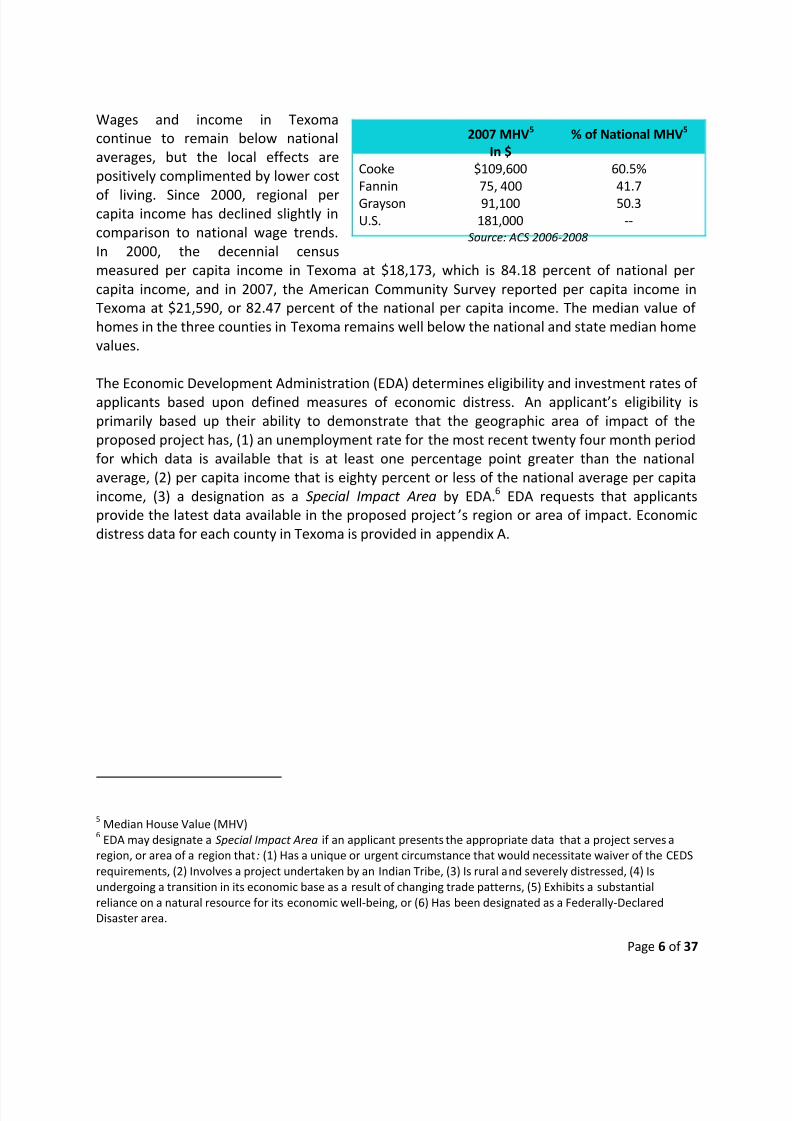
As a result of economic recession, unemployment is on the rise.
This puts more strain on families, human services, and local
education and job training resources as out-of-work residents
find ways to make ends meet in hard times. The Texas
Workforce Commission calculates that by the end of 2009, 7.8
percent of Texomans were unemployed. This translates toapproximately 9,200 unemployed residents spread across
Cooke, Fannin, and Grayson Counties. Unemployment rates are
significantly higher in recent months and this trend is forecasted
to continue for the foreseeable future.
Although unemployment is on the rise in Texoma, the region is faring better than the national
average and other regions around the United States. The average 24-month unemployment
rate has remained lower than the national figures. According to the Bureau of Labor Statistics,
Texoma’s 24-month average unemployment rate between January of 2008 and January of 2010
was 6.4 percent while the national rate was 7.73 percent.
Personal income is often used as an indicator of local economic prosperity. Personal income
spending drives our local economies and government programs through state and local sales
tax revenues on purchases. Although Texoma is a small region, there are significant disparities
in wages and income. Between 2000 and 2007, the per capita income of residents in Texoma
maintained consistent at about 82 percent of US per capita income, which does not meet
distress criteria defined by the EDA. However, Fannin County measures of income are
consistently well below national, state, and regional measures of income. Fannin County
median income in 2007 was 72.4 percent of the national figure, meeting one of EDA’s three
economic distress criteria.1
In fact, per capita income in Fannin County ranks 197th among all
254 counties in Texas.2
1See Appendix A. for more information about EDA economic distress criteria.
2Statsamerica.org
3American Community Survey (ACS), U.S. Bureau of Census.
4Per Capita Money Income (PCMI).
24-Month Average
Unemployment Rate(period ending 01/10) %
Cooke County 4.90
Fannin County 7.33
Grayson County 6.78
Texoma Region 6.40
U.S. 7.73Source: Bureau of Labor Statistics
Geographic Area2007 ACS3
PCMI4
Threshold
Calculation
(Area PCMI/US PCMI)
2000 Census
PCMI
Threshold
Calculation
(Area PCMI/ US PCMI)
Cooke $22,403 85.6% $17,889 82.9%
Fannin 18,955 72.4 16,066 74.4
Grayson 22,063 84.3 18,862 87.4
Texoma 21,590 82.47 18,173 82.5
US 26,178 -- 21,587 --
8/4/2019 CEDS 2010 Update
http://slidepdf.com/reader/full/ceds-2010-update 7/37
Page 6 of 37
Wages and income in Texoma
continue to remain below national
averages, but the local effects are
positively complimented by lower cost
of living. Since 2000, regional percapita income has declined slightly in
comparison to national wage trends.
In 2000, the decennial census
measured per capita income in Texoma at $18,173, which is 84.18 percent of national per
capita income, and in 2007, the American Community Survey reported per capita income in
Texoma at $21,590, or 82.47 percent of the national per capita income. The median value of
homes in the three counties in Texoma remains well below the national and state median home
values.
The Economic Development Administration (EDA) determines eligibility and investment rates of
applicants based upon defined measures of economic distress. An applicant’s eligibility is
primarily based up their ability to demonstrate that the geographic area of impact of the
proposed project has, (1) an unemployment rate for the most recent twenty four month period
for which data is available that is at least one percentage point greater than the national
average, (2) per capita income that is eighty percent or less of the national average per capita
income, (3) a designation as a Special Impact Area by EDA.6 EDA requests that applicants
provide the latest data available in the proposed project ’s region or area of impact. Economic
distress data for each county in Texoma is provided in appendix A.
5Median House Value (MHV)
6EDA may designate a Special Impact Area if an applicant presents the appropriate data that a project serves a
region, or area of a region that: (1) Has a unique or urgent circumstance that would necessitate waiver of the CEDS
requirements, (2) Involves a project undertaken by an Indian Tribe, (3) Is rural and severely distressed, (4) Is
undergoing a transition in its economic base as a result of changing trade patterns, (5) Exhibits a substantial
reliance on a natural resource for its economic well-being, or (6) Has been designated as a Federally-Declared
Disaster area.
2007 MHV5
In $
% of National MHV5
Cooke $109,600 60.5%
Fannin 75, 400 41.7
Grayson 91,100 50.3
U.S. 181,000 --Source: ACS 2006-2008
8/4/2019 CEDS 2010 Update
http://slidepdf.com/reader/full/ceds-2010-update 8/37
Page 7 of 37
Industry and Occupation
Industry and occupational analyses provide insights into the foundation of a region’s
competitive advantages. Understanding a region’s key industries and high-demand occupations
help economic development practitioners and local policy makers see how firms fit into the
local economy so they may make informed decisions about local development initiatives.
This section provides information about the targeted industries and occupations of Workforce
Solutions Texoma (WST), our region’s local workforce board, and a baseline industry and
occupational cluster analysis generated by statsamerica.org, an EDA-funded online economic
analysis tool. Each source provides useful information about key areas of growth and decline
while utilizing different methodologies.
Targeted Industries and Occupations
In order to most efficiently target workforce and business needs in Texoma, Workforce
Solutions Texoma develops a list of targeted industries and occupations. WST focuses theirservices on these areas because they are high-growth or high-demand industries in which
residents seeking employment are most likely to become employed at a livable wage. WST
developed this list of targeted industries and occupations by consulting both regional leaders
and the rich market data provided by the Labor Market and Career Information (LMCI), a
division of the Texas Workforce Commission (TWC).
Workforce Texoma talked with local economic development organizations to determine which
industries they are currently targeting. Economic Development Corporations take direction
from their respective city councils and therefore, the industries they are targeting have been
adopted in conjunction with their city’s strategic planning. In order to develop a comprehensivelist of industries from which to begin the targeting analysis, Workforce Texoma utilized three
existing lists, the North American Industry Classification System (NAICS), Texas Governor Rick
Perry’s Industry Cluster Initiative, and Ray Perryman’s list of targeted industries in his report
Texas Our Texas. A crosswalk was developed in order to align the three lists. Economic
developers were asked to indicate which industries on the NAICS and Perry lists they are
targeting. In addition to the input provided by the economic development partners, the
occupations included on Workforce Texoma’s current Demand Occupations List were
integrated into the crosswalk to more fully analyze the industries the Workforce Board should
prioritize.
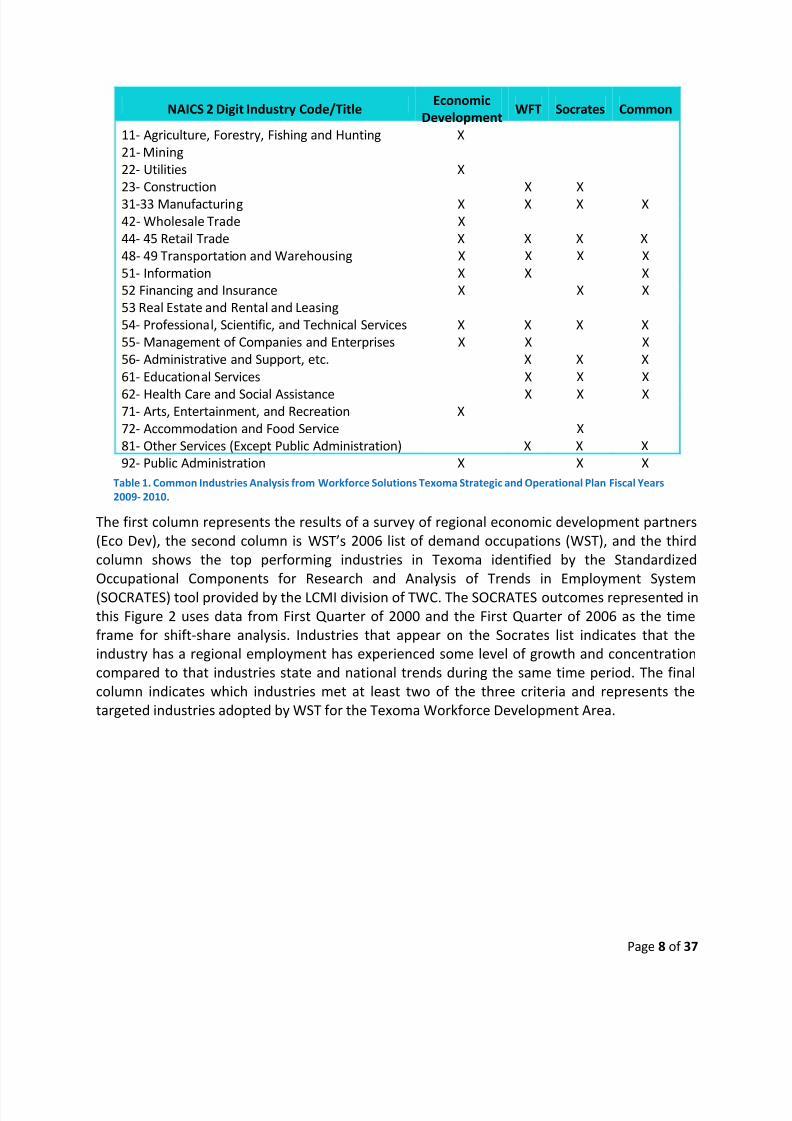
Figure 2 illustrates the results of the crosswalk analysis and charts which NAICS industries were
identified or targeted by at least two of the three methods of analysis.
8/4/2019 CEDS 2010 Update
http://slidepdf.com/reader/full/ceds-2010-update 9/37
Page 8 of 37
The first column represents the results of a survey of regional economic development partners
(Eco Dev), the second column is WST’s 2006 list of demand occupations (WST), and the third
column shows the top performing industries in Texoma identified by the Standardized
Occupational Components for Research and Analysis of Trends in Employment System
(SOCRATES) tool provided by the LCMI division of TWC. The SOCRATES outcomes represented in
this Figure 2 uses data from First Quarter of 2000 and the First Quarter of 2006 as the time
frame for shift-share analysis. Industries that appear on the Socrates list indicates that the
industry has a regional employment has experienced some level of growth and concentration
compared to that industries state and national trends during the same time period. The final
column indicates which industries met at least two of the three criteria and represents the
targeted industries adopted by WST for the Texoma Workforce Development Area.
NAICS 2 Digit Industry Code/TitleEconomic
DevelopmentWFT Socrates Common
11- Agriculture, Forestry, Fishing and Hunting X
21- Mining
22- Utilities X
23- Construction X X
31-33 Manufacturing X X X X
42- Wholesale Trade X
44- 45 Retail Trade X X X X
48- 49 Transportation and Warehousing X X X X
51- Information X X X
52 Financing and Insurance X X X
53 Real Estate and Rental and Leasing
54- Professional, Scientific, and Technical Services X X X X
55- Management of Companies and Enterprises X X X
56- Administrative and Support, etc. X X X
61- Educational Services X X X
62- Health Care and Social Assistance X X X71- Arts, Entertainment, and Recreation X
72- Accommodation and Food Service X
81- Other Services (Except Public Administration) X X X
92- Public Administration X X X
Table 1. Common Industries Analysis from Workforce Solutions Texoma Strategic and Operational Plan Fiscal Years
2009- 2010.
8/4/2019 CEDS 2010 Update
http://slidepdf.com/reader/full/ceds-2010-update 10/37
Page 9 of 37
Texoma Area Targeted Industries
After analyzing the results of the input from the economic development partners, current list of
demand occupations, and the information provided by SOCRATES, the following list of targeted
industries, based on two-digit NAICS codes, was adopted for the Texoma Workforce
Development Area (Cooke, Fannin, and Grayson Counties):
Construction
The Texoma Area has seen an active commercial and residential construction trade for a
number of years. Continued retail development will continue to keep commercial
construction brisk, and the 2005 announcement of more than 2,000 jobs with Ruiz
Foods and the opening Tyson Fresh Meats in Sherman in 2006. New construction jobs
are on the horizon should Panda Energy International Inc. obtain the air permit and
follow through with plans to develop a 500-MW combined-cycle natural gas power plant
in Sherman.
Manufacturing – including Advanced Manufacturing and Aerospace and Defense
Even though a large number of the jobs lost locally were in manufacturing, the Texoma
region has a reputation of a strong work ethic consistent with the needs of
manufacturers. All of the local economic developers are currently targeting
manufacturing, and the local airport plays a major role in the future of the area.
Retail Trade
The addition of a major retail development is Grayson County has provided
approximately 1,000 new jobs in recent years. The retail sector has always been ademand sector, but pressure from newly created manufacturing jobs is causing retail
wages to go up.
Transportation and Warehousing
Truck driving has traditionally been a good occupation for Workforce Texoma
customers. Increased traffic into the area based on new manufacturing locations may
provide additional opportunities in this sector.
Information – including Information and Computer Technology
One of Texoma’s largest sectors of the manufacturing industry is in semiconductors with
companies including Texas Instruments, MEMC Southwest, and GlobiTech, Inc. Although
these industries have historically provided many, well-paying jobs in Texoma, they are in
decline with numerous plant closures and reductions in workforce.
Professional, Scientific, and Technical Services
8/4/2019 CEDS 2010 Update
http://slidepdf.com/reader/full/ceds-2010-update 11/37
Page 10 of 37
With the continued emphasis on Manufacturing, and particularly with the emerging
focus on advanced manufacturing, drafters will continue to be in demand. The Area is
also interested in attracting research and development.
Educational Services
The Texoma Area is home to 34 independent school districts with a combined annual
enrollment of almost 33,000 students. Teaching is a good occupational choice.
Health Care and Social Assistance
Two of Texoma’s largest employers are Wilson N. Jones Memorial Hospital in Sherman
and Texoma Medical Center in Denison. With more than 1,000 employees each, these
two hospitals offer ongoing employment opportunities in the healthcare field. TMC
recently opened a new hospital facility that includes more beds, surgery rooms, andmore emergency and trauma beds.
Other Services (except Public Administration)
Automotive and diesel mechanics are included in this NAICS category. Texoma has a
thriving automotive market and a number of dealerships offering opportunities for
trained mechanics.
Texoma Targeted Occupations
The Labor Market and Career Information (LMCI) division of the Texas Workforce Commission(TWC) recently released occupational projections through 2012. This study presented
information including: Occupations Adding the Most Jobs, Fastest Growing Occupations,
Occupations with the Most Annual Average Openings. The historical makeup and current trends
in the local labor market support this list. A number of the jobs included in this list are also
included in the current Workforce Texoma Demand Occupations List.
After developing the list of Occupations in Demand, the list was sorted by wage, and those
occupations with an average entry wage greater that the Texoma adopted Target Wage of
$9.00 per hour were placed on the DRAFT Target Occupations List. This list was then compared
with the previous target occupations list, and local training programs to create the final
Targeted Occupations List.
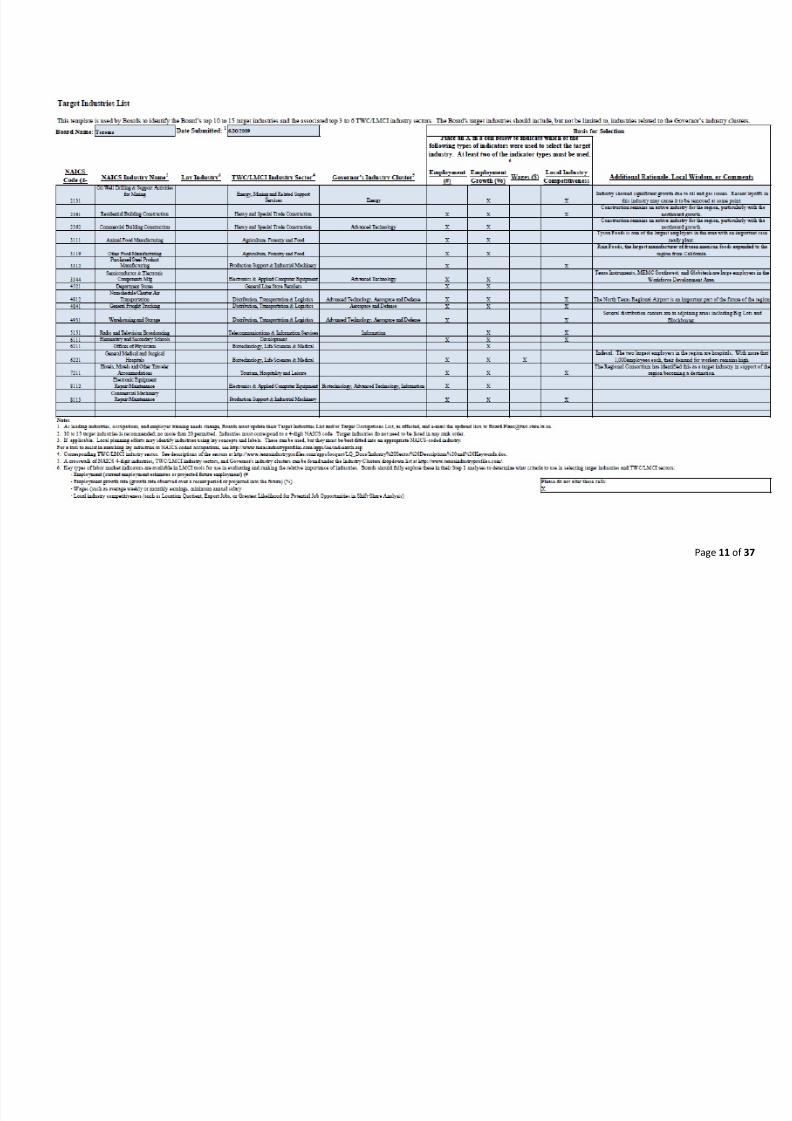
8/4/2019 CEDS 2010 Update
http://slidepdf.com/reader/full/ceds-2010-update 12/37
Page 11 of
8/4/2019 CEDS 2010 Update
http://slidepdf.com/reader/full/ceds-2010-update 13/37
Page 12 of 37
Baseline Cluster Analysis
Cluster analyses of industry and occupation networks are a relatively new approach in regional
development that focuses on the knowledge, skills and abilities of the individuals who work in
certain jobs. A cluster is a network of industries, people, and organizations in close geographic
proximity.
This cluster analysis provides fast insights into the talent base that drives a local or regional
economy. With this tool, economic development professionals can begin to structure effective
collaborations with businesses managers, educators, and workforce development
professionals. This baseline cluster analysis must be paired with a discussion of the unique
characteristic of firms that make up these clusters in our region in order to understand the
nuanced relationships that create Texoma’s economic base. Two clusters, referred to by the
same label, in different regions will vary in their actual industry composition according to their
“base” industry, industry mix and degree of industrial diversification, anchoring firms, ancillary
and supporting industries, integral organizations, informal (i.e., “know-how sharing”)arrangements and critical growth poles.
This type of analysis is useful in a number of different ways. By understanding the dynamics of
growth within a cluster, an economic development professional can communicate more
effectively with educators and workforce development professionals to build a talent pipeline
needed to support businesses in Texoma. The baseline occupational and industry cluster
analyses provided in this section measure characteristics of clusters over time. The information
provided is simply a point-in-time analysis of existing clusters in Texoma. Further study should
be done to identify clusters that are at-risk, emerging, or have the potential for future growth.
8/4/2019 CEDS 2010 Update
http://slidepdf.com/reader/full/ceds-2010-update 14/37
Page 13 of 37
Texoma Occupation Clusters
Working with occupational data can quickly become overwhelming, so to simplify analysis and
aid in understanding, the tool focuses on fifteen knowledge-based occupation clusters.
Occupation clusters help to analyze the regional knowledge-based workforce in greater detail,
determine how well occupation cluster strengths align with the region’s industry clusterstrengths, understand the local workforce and educational situation within the broader regional
economic development context, bridge the gap between workforce and economic
development when constructing a regional economic development strategy, diagnose how well
positioned the region is to participate effectively in a knowledge-based innovation economy.
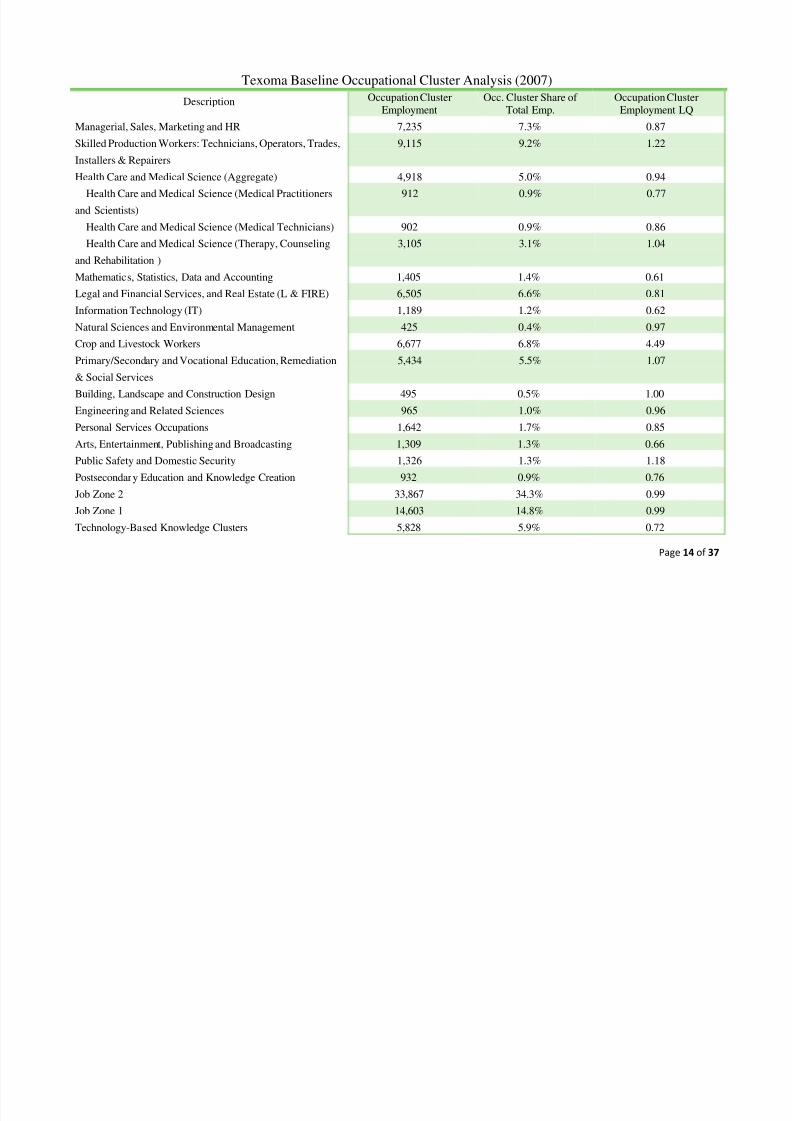
The following chart illustrates the number of jobs in each cluster, the cluster’s share of total
regional employment, and the location quotient of the cluster (a measurement of how
concentrated that cluster is in Texoma compared to the nation.
The table below looks at Texoma and identifies those occupations with the strongest
percentage change and the largest increase in the number of jobs from 2001 to 2007. Agents
and business managers of artists, performers, and athletes had the largest percentage change,
but that occupational segment is relatively small. Photographers represent the largest growth
category in absolute terms, with 99 new jobs added in that occupational category.
8/4/2019 CEDS 2010 Update
http://slidepdf.com/reader/full/ceds-2010-update 15/37
Page 14 of 37
Texoma Baseline Occupational Cluster Analysis (2007)
Description Occupation ClusterEmployment
Occ. Cluster Share of Total Emp.
Occupation ClusterEmployment LQ
Managerial, Sales, Marketing and HR 7,235 7.3% 0.87
Skilled Production Workers: Technicians, Operators, Trades,
Installers & Repairers
9,115 9.2% 1.22
Health Care and Medical Science (Aggregate) 4,918 5.0% 0.94
Health Care and Medical Science (Medical Practitionersand Scientists)
912 0.9% 0.77
Health Care and Medical Science (Medical Technicians) 902 0.9% 0.86
Health Care and Medical Science (Therapy, Counseling
and Rehabilitation )
3,105 3.1% 1.04
Mathematics, Statistics, Data and Accounting 1,405 1.4% 0.61
Legal and Financial Services, and Real Estate (L & FIRE) 6,505 6.6% 0.81
Information Technology (IT) 1,189 1.2% 0.62
Natural Sciences and Environmental Management 425 0.4% 0.97
Crop and Livestock Workers 6,677 6.8% 4.49
Primary/Secondary and Vocational Education, Remediation
& Social Services
5,434 5.5% 1.07
Building, Landscape and Construction Design 495 0.5% 1.00
Engineering and Related Sciences 965 1.0% 0.96
Personal Services Occupations 1,642 1.7% 0.85
Arts, Entertainment, Publishing and Broadcasting 1,309 1.3% 0.66
Public Safety and Domestic Security 1,326 1.3% 1.18
Postsecondary Education and Knowledge Creation 932 0.9% 0.76
Job Zone 2 33,867 34.3% 0.99
Job Zone 1 14,603 14.8% 0.99
Technology-Based Knowledge Clusters 5,828 5.9% 0.72
8/4/2019 CEDS 2010 Update
http://slidepdf.com/reader/full/ceds-2010-update 16/37
Page 15 of 37
Texoma Industry Clusters
The industry cluster analysis helps the practitioner to see networks of businesses that are
creating wealth in their local or regional economy. The tool focuses on seventeen clusters
across the United States in order to provide a framework that is easy to understand. It also
allows users to combine individual counties to define custom regions.
Close geographic proximity and engagement in similar or related economic activities are the
key factors leading to development of clusters. These characteristics enhance the likelihood of
exchanges among cluster firms, facilitating mutual support, and economic growth. “When
members of a cluster are located in close proximity, they can capture synergies that increase
productivity, innovative capacity and new business formation.”7
The linkages between spatial
proximity and innovation potential are particularly important from a regional development
perspective. In particular, supportive policies and a nurturing business environment may
further strengthen the innovative milieu and thus enhance regional advantages.
Industry clusters help to describe how industries in a region compare to each other, identify
growth trends through regional location quotient analysis, reveal emerging industries in a
region, analyze the mix of clusters in a diverse region that might include both rural and urban
areas, rethink business expansion strategies, reveal groups of industries that have similar
workforce needs, prioritize groups of firms that have growth potential, and create regional
identities and improve marketing effectiveness.
On average, U.S. counties specialize in slightly more than two industry clusters (LQ > 1.2,
meaning that the cluster’s share of employment in the county is at least 20 percent higher than
the cluster’s share of employment nationally).8
With data provided by this tool, users can create a matrix to show industry employment
location quotients for each county in the region and for the region as a whole. This matrix
enables practitioners to see the overall competitive strengths of the region’s economy.
However, cluster analysis must be used judiciously because it relies upon historical data, and
the past is not a perfect predictor for the future. For example, a region currently specialized in a
particular cluster may not have a bright future if the national and global outlook for that cluster
is one of decline.
7Porter, M. 2001. Clusters of innovation: Regional foundations of U.S. Competitiveness. Available from
http://www.usistf.org/download/documents/Clusters-of-Innovation/Clusters-of-Innovation.pdf . 8 Unlocking Rural Competitiveness: The Role of Regional Clusters. Available from
http://www.statsamerica.org/innovation/reports/trifold_single_pages.pdf .
8/4/2019 CEDS 2010 Update
http://slidepdf.com/reader/full/ceds-2010-update 17/37
Page 16 of 37
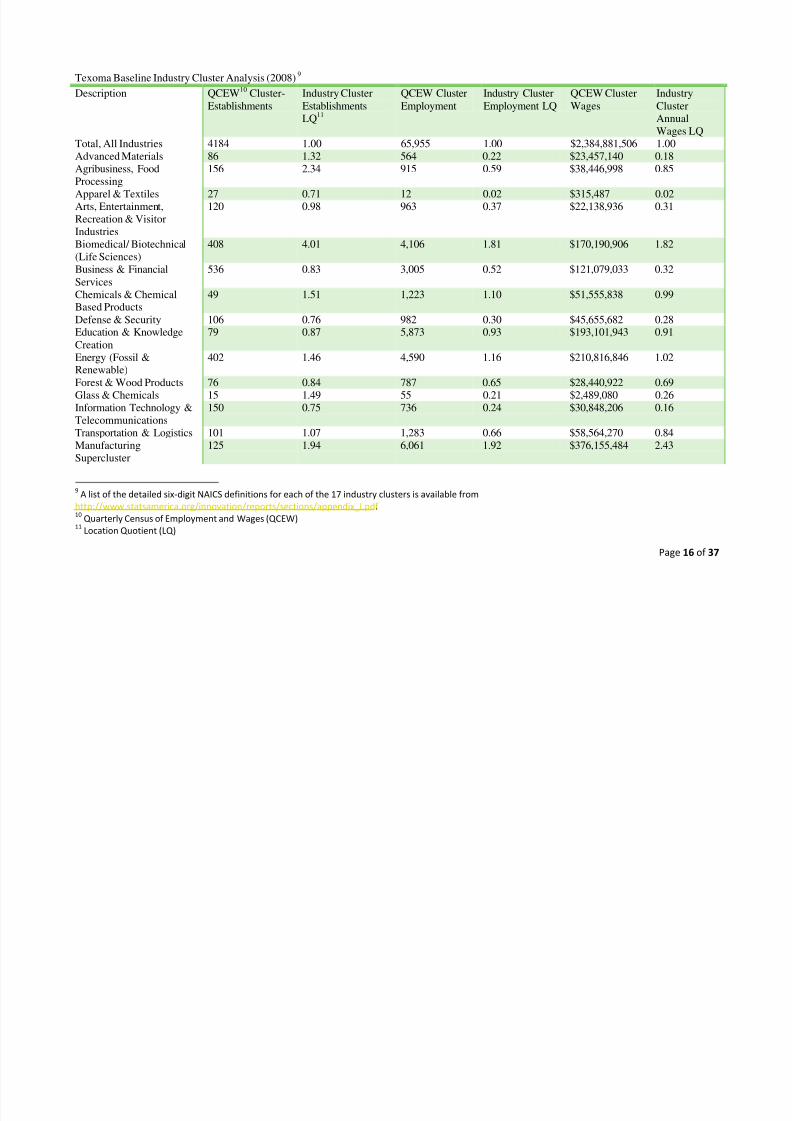
Texoma Baseline Industry Cluster Analysis (2008)9 Description QCEW10 Cluster-
Establishments Industry ClusterEstablishmentsLQ11
QCEW ClusterEmployment Industry Cluster
Employment LQ QCEW ClusterWages Industry
ClusterAnnualWages LQ
Total, All Industries 4184 1.00 65,955 1.00 $2,384,881,506 1.00 Advanced Materials 86 1.32 564 0.22 $23,457,140 0.18Agribusiness, FoodProcessing
156 2.34 915 0.59 $38,446,998 0.85
Apparel & Textiles 27 0.71 12 0.02 $315,487 0.02Arts, Entertainment,Recreation & VisitorIndustries
120 0.98 963 0.37 $22,138,936 0.31
Biomedical/ Biotechnical(Life Sciences) 408 4.01 4,106 1.81 $170,190,906 1.82
Business & FinancialServices 536 0.83 3,005 0.52 $121,079,033 0.32
Chemicals & ChemicalBased Products 49 1.51 1,223 1.10 $51,555,838 0.99
Defense & Security 106 0.76 982 0.30 $45,655,682 0.28Education & KnowledgeCreation 79 0.87 5,873 0.93 $193,101,943 0.91
Energy (Fossil &Renewable) 402 1.46 4,590 1.16 $210,816,846 1.02
Forest & Wood Products 76 0.84 787 0.65 $28,440,922 0.69
Glass & Chemicals 15 1.49 55 0.21 $2,489,080 0.26Information Technology &Telecommunications 150 0.75 736 0.24 $30,848,206 0.16
Transportation & Logistics 101 1.07 1,283 0.66 $58,564,270 0.84ManufacturingSupercluster 125 1.94 6,061 1.92 $376,155,484 2.43
9A list of the detailed six-digit NAICS definitions for each of the 17 industry clusters is available from
http://www.statsamerica.org/innovation/reports/sections/appendix_I.pdf . 10
Quarterly Census of Employment and Wages (QCEW)11
Location Quotient (LQ)
8/4/2019 CEDS 2010 Update
http://slidepdf.com/reader/full/ceds-2010-update 18/37
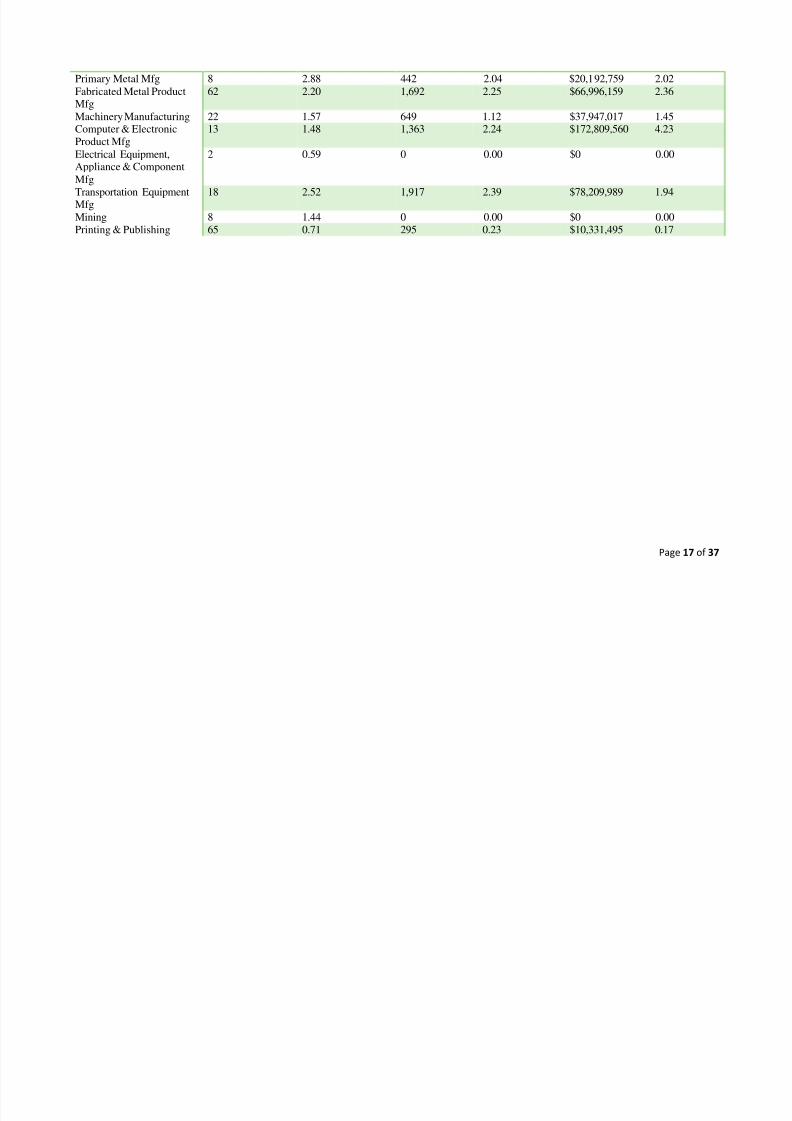
Page 17 of 37
Primary Metal Mfg 8 2.88 442 2.04 $20,192,759 2.02Fabricated Metal ProductMfg 62 2.20 1,692 2.25 $66,996,159 2.36
Machinery Manufacturing 22 1.57 649 1.12 $37,947,017 1.45Computer & ElectronicProduct Mfg 13 1.48 1,363 2.24 $172,809,560 4.23
Electrical Equipment,Appliance & ComponentMfg
2 0.59 0 0.00 $0 0.00
Transportation EquipmentMfg 18 2.52 1,917 2.39 $78,209,989 1.94
Mining 8 1.44 0 0.00 $0 0.00Printing & Publishing 65 0.71 295 0.23 $10,331,495 0.17
8/4/2019 CEDS 2010 Update
http://slidepdf.com/reader/full/ceds-2010-update 19/37
Page 18 of 37
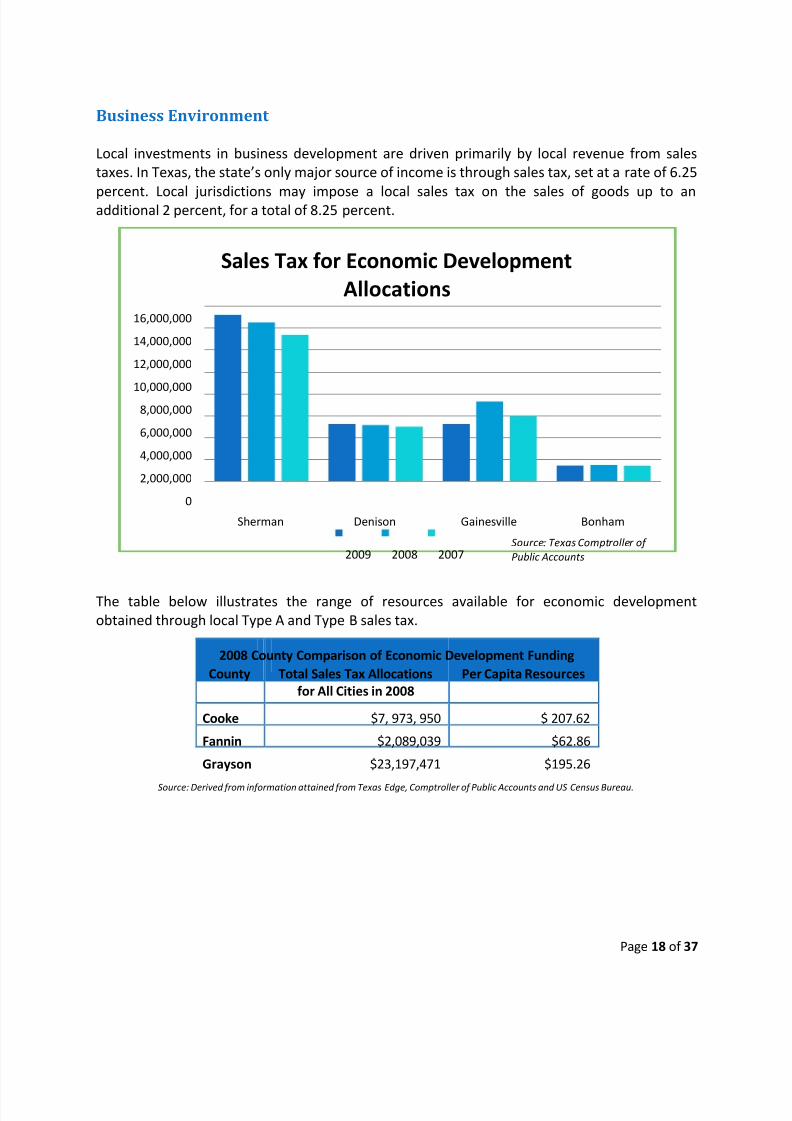
Business Environment
Local investments in business development are driven primarily by local revenue from sales
taxes. In Texas, the state’s only major source of income is through sales tax, set at a rate of 6.25
percent. Local jurisdictions may impose a local sales tax on the sales of goods up to anadditional 2 percent, for a total of 8.25 percent.
The table below illustrates the range of resources available for economic development
obtained through local Type A and Type B sales tax.
2008 County Comparison of Economic Development Funding
County Total Sales Tax Allocations
for All Cities in 2008
Per Capita Resources
Cooke $7, 973, 950 $ 207.62
Fannin $2,089,039 $62.86
Grayson $23,197,471 $195.26
Source: Derived from information attained from Texas Edge, Comptroller of Public Accounts and US Census Bureau.
0
2,000,000
4,000,000
6,000,000
8,000,00010,000,000
12,000,000
14,000,000
16,000,000
Sherman Denison Gainesville Bonham
Sales Tax for Economic Development
Allocations
2009 2008 2007Source: Texas Comptroller of
Public Accounts
8/4/2019 CEDS 2010 Update
http://slidepdf.com/reader/full/ceds-2010-update 20/37
Page 19 of 37
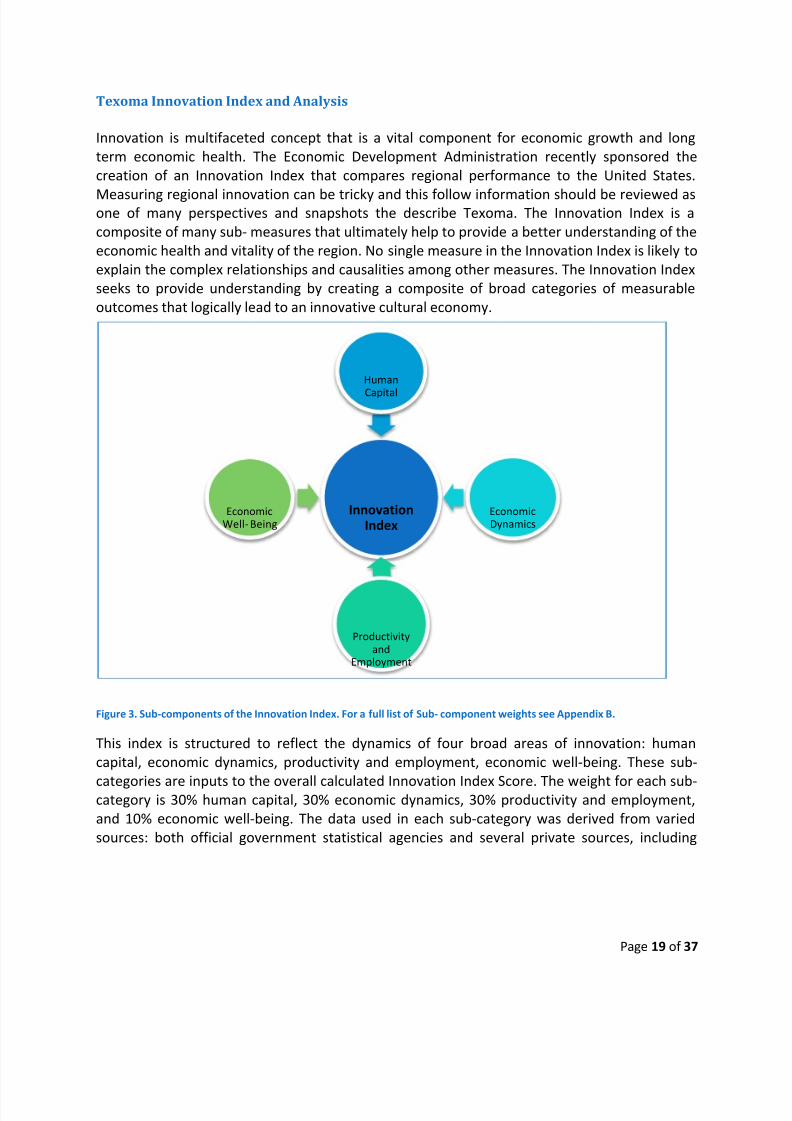
Texoma Innovation Index and Analysis
Innovation is multifaceted concept that is a vital component for economic growth and long
term economic health. The Economic Development Administration recently sponsored the
creation of an Innovation Index that compares regional performance to the United States.
Measuring regional innovation can be tricky and this follow information should be reviewed asone of many perspectives and snapshots the describe Texoma. The Innovation Index is a
composite of many sub- measures that ultimately help to provide a better understanding of the
economic health and vitality of the region. No single measure in the Innovation Index is likely to
explain the complex relationships and causalities among other measures. The Innovation Index
seeks to provide understanding by creating a composite of broad categories of measurable
outcomes that logically lead to an innovative cultural economy.
Figure 3. Sub-components of the Innovation Index. For a full list of Sub- component weights see Appendix B.
This index is structured to reflect the dynamics of four broad areas of innovation: human
capital, economic dynamics, productivity and employment, economic well-being. These sub-
categories are inputs to the overall calculated Innovation Index Score. The weight for each sub-category is 30% human capital, 30% economic dynamics, 30% productivity and employment,
and 10% economic well-being. The data used in each sub-category was derived from varied
sources: both official government statistical agencies and several private sources, including
InnovationIndex
Human
Capital
EconomicDynamics
Productivityand
Employment
EconomicWell- Being
8/4/2019 CEDS 2010 Update
http://slidepdf.com/reader/full/ceds-2010-update 21/37
Page 20 of 37
Moody’s economy.com, Innovation Economy 360, and Economic Modeling Specialists, Inc.
(EMSI).12
In updated research using a descriptive cross-sectional regression model, the research team
found that the following indicators have a positive and significant relationship to increases in
GDP per worker:
1. Change in high-tech employment share
2. Average small establishments per 10,000 workers
3. Percent of population, ages 25-64, with some college or an associate’s degree
4. Population growth rate for ages 25-44
The Innovation Index is designed to highlight factors that indicate a region is more or less ready
to participate in the knowledge economy. The index is not by itself intended to directly guide
decisions about investments in the region as the data used to calculate the analysis may not be
the latest available and, therefore, unable to reflect recent events in Texoma.
Interpreting the Innovation Index (also referred to as the portfolio index) can get complex given
its broad, multi-metric nature with both innovation inputs and outputs. In order to identify
those specific factors with the greatest influence on economic growth, while controlling for
some non-innovation factors, the Innovation Index research team statistically analyzed the
innovation input data. Interpreting the results is simpler than the portfolio approach because
there is only one output measure―economic growth (i.e., GDP-per-worker growth).
12A complete list of calculations, models, and definitions used in the Texoma Innovation Index is available from
http://www.statsamerica.org/innovation/reports/sections2/C.pdf .
8/4/2019 CEDS 2010 Update
http://slidepdf.com/reader/full/ceds-2010-update 22/37
Page 21 of 37
75 80 85 90 95 100
Texoma
Texas
Oklahoma
U.S.
86.6
94.2
83.7
100
Texoma Texas Oklahoma U.S.
Innovation Score86.6 94.2 83.7 100
Innovation Index
80 85 90 95 100 105
Texoma
Texas
Oklahoma
U.S.
92.3
100.4
89.9
100
Human Capital Sub-Component
Human Capital Index
Score
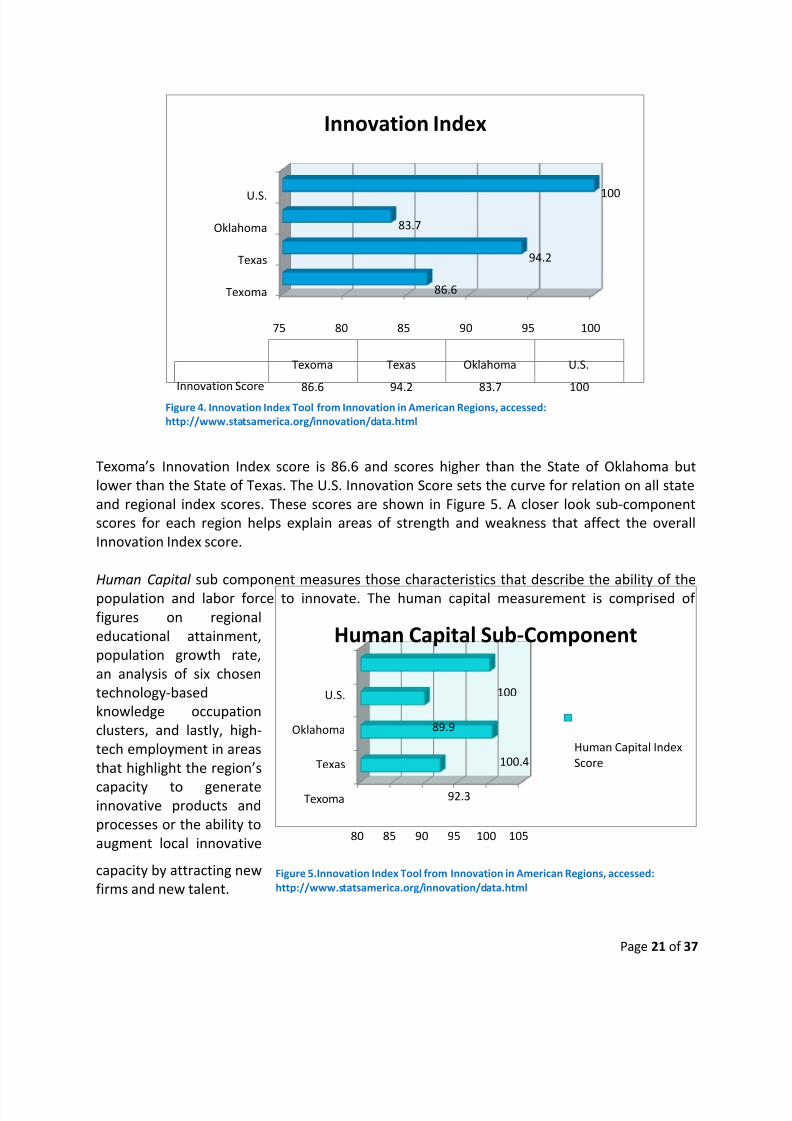
Texoma’s Innovation Index score is 86.6 and scores higher than the State of Oklahoma but
lower than the State of Texas. The U.S. Innovation Score sets the curve for relation on all state
and regional index scores. These scores are shown in Figure 5. A closer look sub-component
scores for each region helps explain areas of strength and weakness that affect the overall
Innovation Index score.
Human Capital sub component measures those characteristics that describe the ability of the
population and labor force to innovate. The human capital measurement is comprised of
figures on regional
educational attainment,
population growth rate,
an analysis of six chosen
technology-based
knowledge occupation
clusters, and lastly, high-
tech employment in areas
that highlight the region’s
capacity to generateinnovative products and
processes or the ability to
augment local innovative
capacity by attracting new
firms and new talent.
Figure 4. Innovation Index Tool from Innovation in American Regions, accessed:
http://www.statsamerica.org/innovation/data.html
Figure 5.Innovation Index Tool from Innovation in American Regions, accessed:
http://www.statsamerica.org/innovation/data.html
8/4/2019 CEDS 2010 Update
http://slidepdf.com/reader/full/ceds-2010-update 23/37
Page 22 of 37
0 50 100
Texoma
Texas
Oklahoma
U.S.
79.9
83.8
73.7
100
Economic Dynamics
Sub-Component
Economic Dynamics
Index Score
Texoma’s human capital sub component is fairly comparable to regions in Texas. Texoma’s
strengths in human capital are in the areas of educational attainment and high-tech
employment share. Educational attainment has a significant impact on per capita GDP of
region and a large number of Texomans have at least some college and a n associate’s degree
when compared to state and national averages. 35 percent of Texoma residents have some
college or associate’s degree while Texas and U.S. averages are 29 percent.
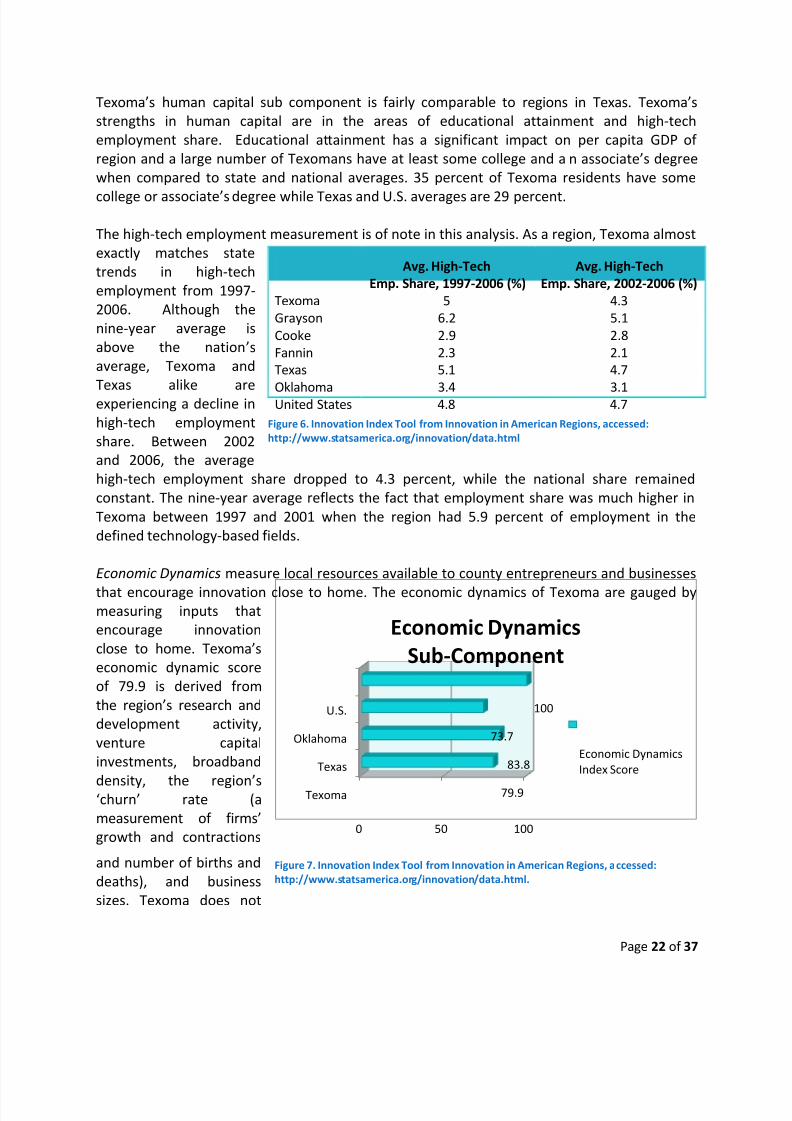
The high-tech employment measurement is of note in this analysis. As a region, Texoma almost
exactly matches state
trends in high-tech
employment from 1997-
2006. Although the
nine-year average is
above the nation’s
average, Texoma and
Texas alike are
experiencing a decline in
high-tech employment
share. Between 2002
and 2006, the average
high-tech employment share dropped to 4.3 percent, while the national share remained
constant. The nine-year average reflects the fact that employment share was much higher in
Texoma between 1997 and 2001 when the region had 5.9 percent of employment in the
defined technology-based fields.
Economic Dynamics measure local resources available to county entrepreneurs and businesses
that encourage innovation close to home. The economic dynamics of Texoma are gauged bymeasuring inputs that
encourage innovation
close to home. Texoma’s
economic dynamic score
of 79.9 is derived from
the region’s research and
development activity,
venture capital
investments, broadband
density, the region’s‘churn’ rate (a
measurement of firms’
growth and contractions
and number of births and
deaths), and business
sizes. Texoma does not
Avg. High-Tech
Emp. Share, 1997-2006 (%)
Avg. High-Tech
Emp. Share, 2002-2006 (%)
Texoma 5 4.3
Grayson 6.2 5.1
Cooke 2.9 2.8
Fannin 2.3 2.1
Texas 5.1 4.7
Oklahoma 3.4 3.1United States 4.8 4.7
Figure 6. Innovation Index Tool from Innovation in American Regions, accessed:
http://www.statsamerica.org/innovation/data.html
Figure 7. Innovation Index Tool from Innovation in American Regions, accessed:
http://www.statsamerica.org/innovation/data.html.
8/4/2019 CEDS 2010 Update
http://slidepdf.com/reader/full/ceds-2010-update 24/37
Page 23 of 37
0 50 100
Texoma
Texas
Oklahoma
U.S.
83.5
94.3
74
100
Productivity and Employment
Index Sub- Component
Productivity and
Employment Score
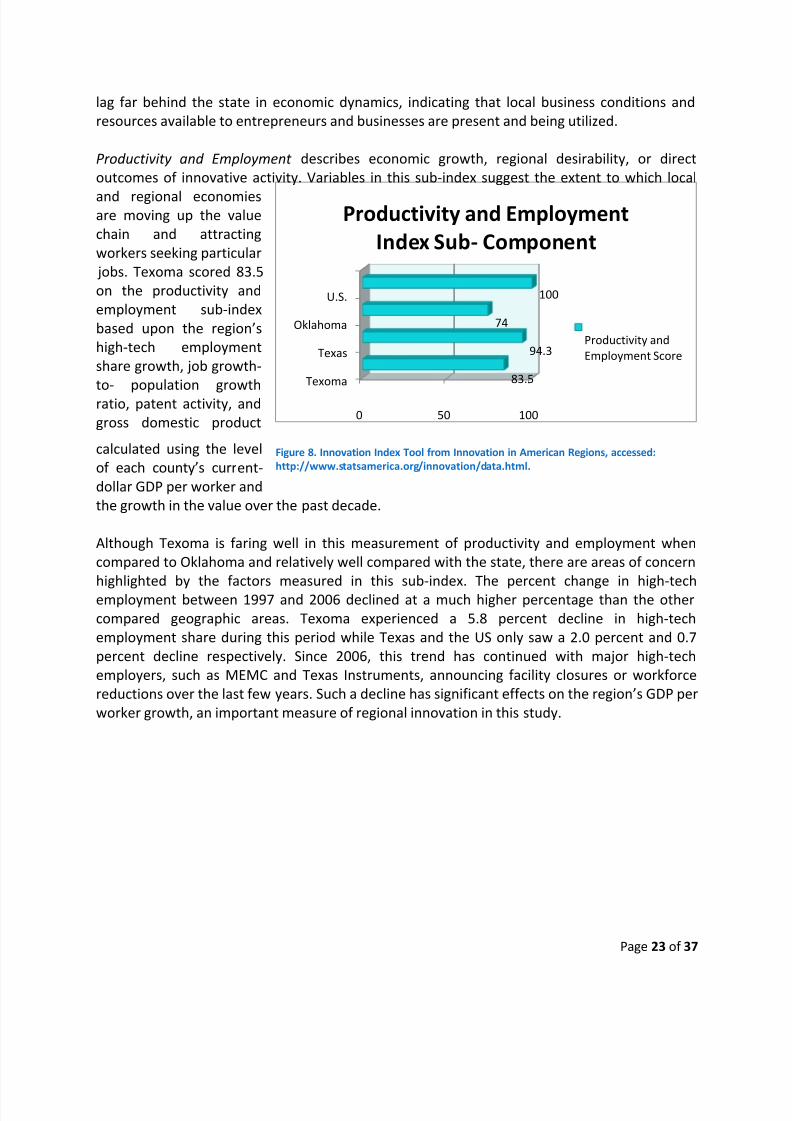
lag far behind the state in economic dynamics, indicating that local business conditions and
resources available to entrepreneurs and businesses are present and being utilized.
Productivity and Employment describes economic growth, regional desirability, or direct
outcomes of innovative activity. Variables in this sub-index suggest the extent to which local
and regional economiesare moving up the value
chain and attracting
workers seeking particular
jobs. Texoma scored 83.5
on the productivity and
employment sub-index
based upon the region’s
high-tech employment
share growth, job growth-
to- population growth
ratio, patent activity, and
gross domestic product
calculated using the level
of each county’s current-
dollar GDP per worker and
the growth in the value over the past decade.
Although Texoma is faring well in this measurement of productivity and employment when
compared to Oklahoma and relatively well compared with the state, there are areas of concern
highlighted by the factors measured in this sub-index. The percent change in high-tech
employment between 1997 and 2006 declined at a much higher percentage than the other
compared geographic areas. Texoma experienced a 5.8 percent decline in high-tech
employment share during this period while Texas and the US only saw a 2.0 percent and 0.7
percent decline respectively. Since 2006, this trend has continued with major high-tech
employers, such as MEMC and Texas Instruments, announcing facility closures or workforce
reductions over the last few years. Such a decline has significant effects on the region’s GDP per
worker growth, an important measure of regional innovation in this study.
Figure 8. Innovation Index Tool from Innovation in American Regions, accessed:
http://www.statsamerica.org/innovation/data.html.
8/4/2019 CEDS 2010 Update
http://slidepdf.com/reader/full/ceds-2010-update 25/37
Page 24 of 37
95 100 105 110
Texoma
Texas
Oklahoma
U.S.
99.4
101.7
105.2
100
Economic Well- Being
Index Sub- Component
Economic Well- Being
Score
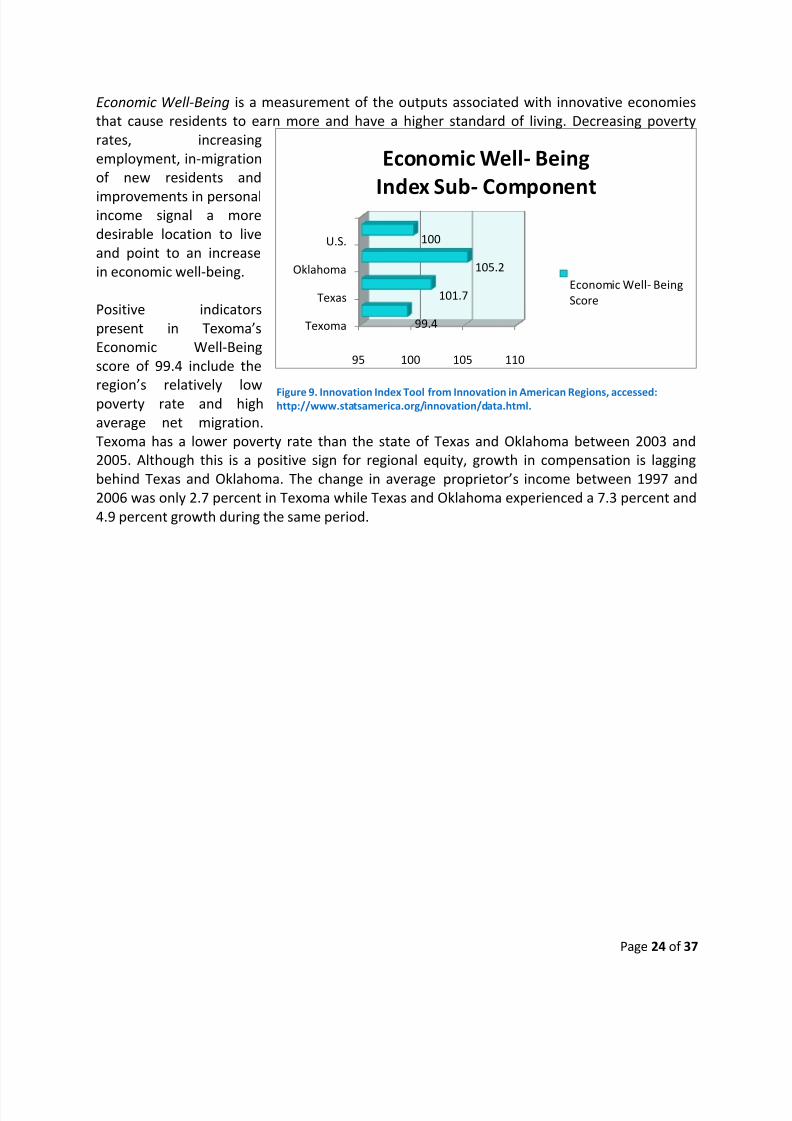
Economic Well-Being is a measurement of the outputs associated with innovative economies
that cause residents to earn more and have a higher standard of living. Decreasing poverty
rates, increasing
employment, in-migration
of new residents and
improvements in personalincome signal a more
desirable location to live
and point to an increase
in economic well-being.
Positive indicators
present in Texoma’s
Economic Well-Being
score of 99.4 include the
region’s relatively low
poverty rate and high
average net migration.
Texoma has a lower poverty rate than the state of Texas and Oklahoma between 2003 and
2005. Although this is a positive sign for regional equity, growth in compensation is lagging
behind Texas and Oklahoma. The change in average proprietor’s income between 1997 and
2006 was only 2.7 percent in Texoma while Texas and Oklahoma experienced a 7.3 percent and
4.9 percent growth during the same period.
Figure 9. Innovation Index Tool from Innovation in American Regions, accessed:http://www.statsamerica.org/innovation/data.html.
8/4/2019 CEDS 2010 Update
http://slidepdf.com/reader/full/ceds-2010-update 26/37
Page 25 of 37
Workforce
Addressing the challenges of a global economy requires a shift away from traditional economic
development models. Instead of low-wage rates and tax incentives, regions in industrialized
countries compete today on the quality of their skilled workforce and incentives that reward
innovation.13
Workforce development is usually tied closely to educational attainment and communication
and collaboration between workforce/education organizations, economic development
organizations, and the private sector, resource allocation, and effectiveness of service delivery.
The development of skills necessary to fill high wage jobs is critical to the continued economic
development efforts in the region, especially as our region experiences changes in labor market
demands.
Schools educate and prepare the future workforce for the region. Youth who do not aspire to
higher education and who lack career training opportunities are lost to a cycle of poverty thatwill envelope their families and children and continued to be repeated in their children. The
region’s public schools, colleges, and workforce boards provide education opportunities for
Texoma residents to gain skills and training necessary to enter the labor force.
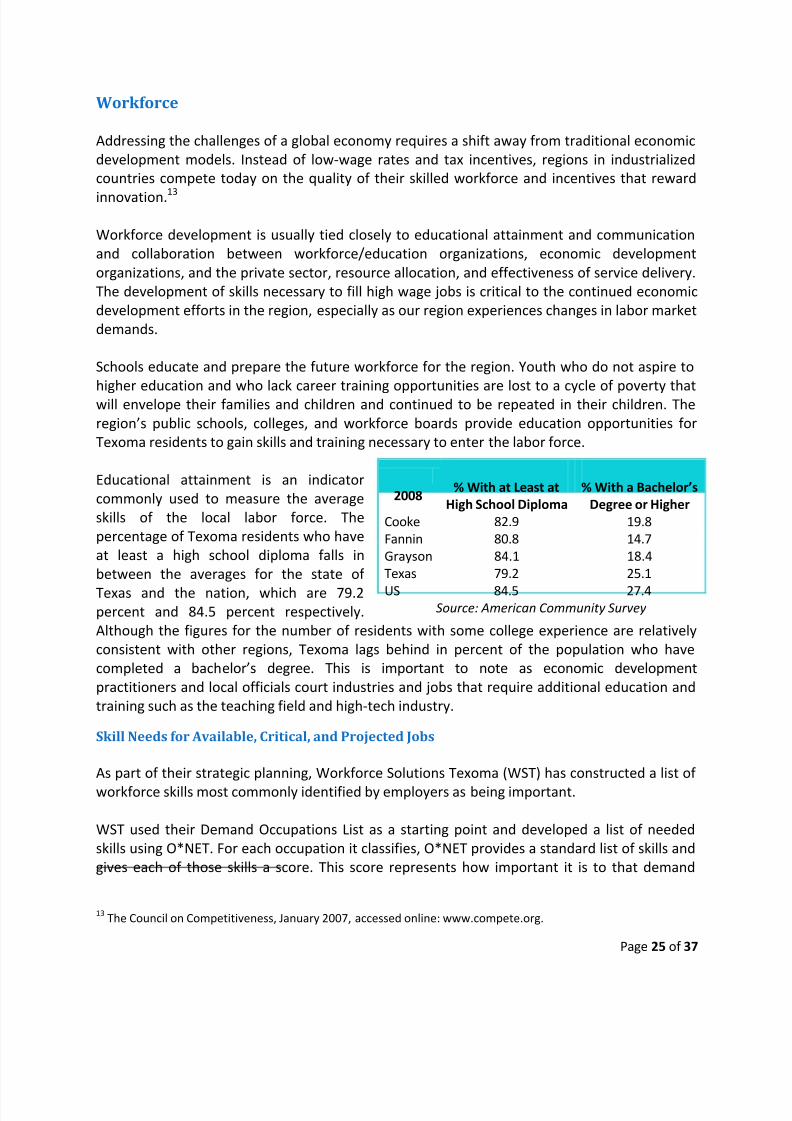
Educational attainment is an indicator
commonly used to measure the average
skills of the local labor force. The
percentage of Texoma residents who have
at least a high school diploma falls in
between the averages for the state of
Texas and the nation, which are 79.2percent and 84.5 percent respectively.
Although the figures for the number of residents with some college experience are relatively
consistent with other regions, Texoma lags behind in percent of the population who have
completed a bachelor’s degree. This is important to note as economic development
practitioners and local officials court industries and jobs that require additional education and
training such as the teaching field and high-tech industry.
Skill Needs for Available, Critical, and Projected Jobs
As part of their strategic planning, Workforce Solutions Texoma (WST) has constructed a list of
workforce skills most commonly identified by employers as being important.
WST used their Demand Occupations List as a starting point and developed a list of needed
skills using O*NET. For each occupation it classifies, O*NET provides a standard list of skills and
gives each of those skills a score. This score represents how important it is to that demand
13The Council on Competitiveness, January 2007, accessed online: www.compete.org.
2008% With at Least at
High School Diploma
% With a Bachelor’s
Degree or Higher
Cooke 82.9 19.8
Fannin 80.8 14.7
Grayson 84.1 18.4
Texas 79.2 25.1
US 84.5 27.4Source: American Community Survey
8/4/2019 CEDS 2010 Update
http://slidepdf.com/reader/full/ceds-2010-update 27/37
Page 26 of 37
occupation. The importance scores for all the occupations on the list were recorded, and then
averaged.
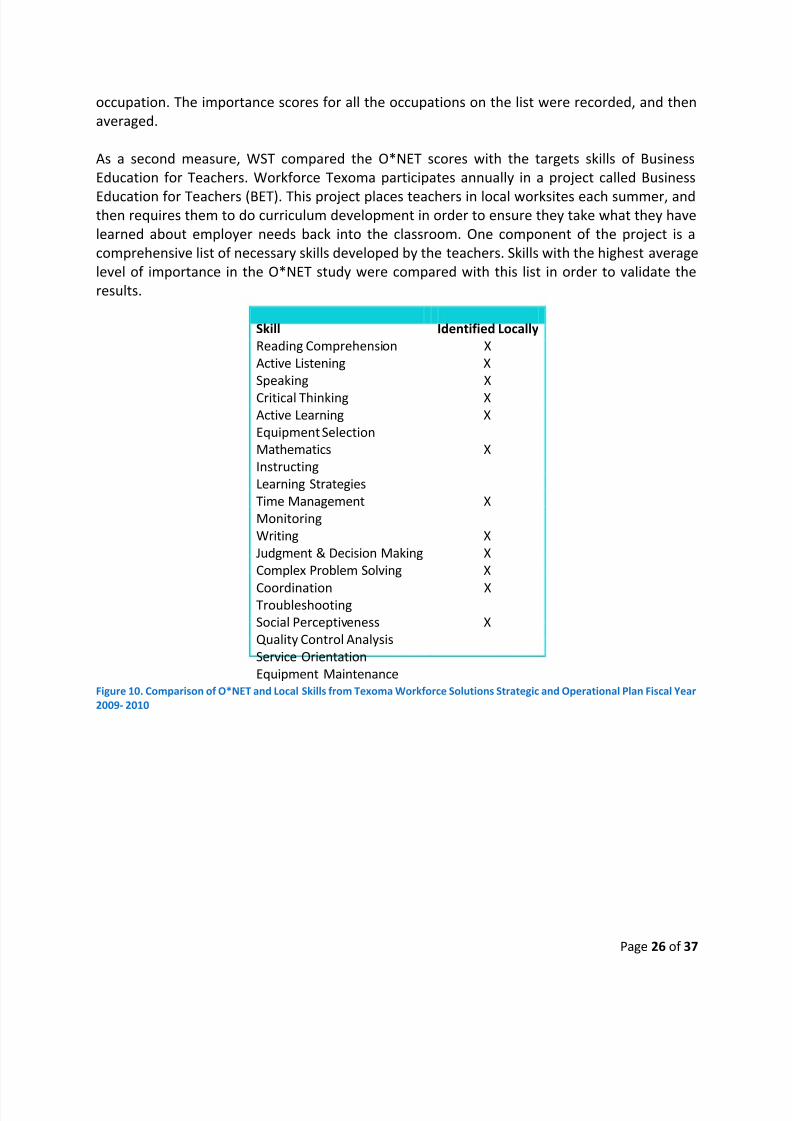
As a second measure, WST compared the O*NET scores with the targets skills of Business
Education for Teachers. Workforce Texoma participates annually in a project called Business
Education for Teachers (BET). This project places teachers in local worksites each summer, andthen requires them to do curriculum development in order to ensure they take what they have
learned about employer needs back into the classroom. One component of the project is a
comprehensive list of necessary skills developed by the teachers. Skills with the highest average
level of importance in the O*NET study were compared with this list in order to validate the
results.
Skill Identified Locally
Reading Comprehension X
Active Listening X
Speaking X
Critical Thinking XActive Learning X
Equipment Selection
Mathematics X
Instructing
Learning Strategies
Time Management X
Monitoring
Writing X
Judgment & Decision Making X
Complex Problem Solving X
Coordination XTroubleshooting
Social Perceptiveness X
Quality Control Analysis
Service Orientation
Equipment MaintenanceFigure 10. Comparison of O*NET and Local Skills from Texoma Workforce Solutions Strategic and Operational Plan Fiscal Year
2009- 2010
8/4/2019 CEDS 2010 Update
http://slidepdf.com/reader/full/ceds-2010-update 28/37
Page 27 of 37
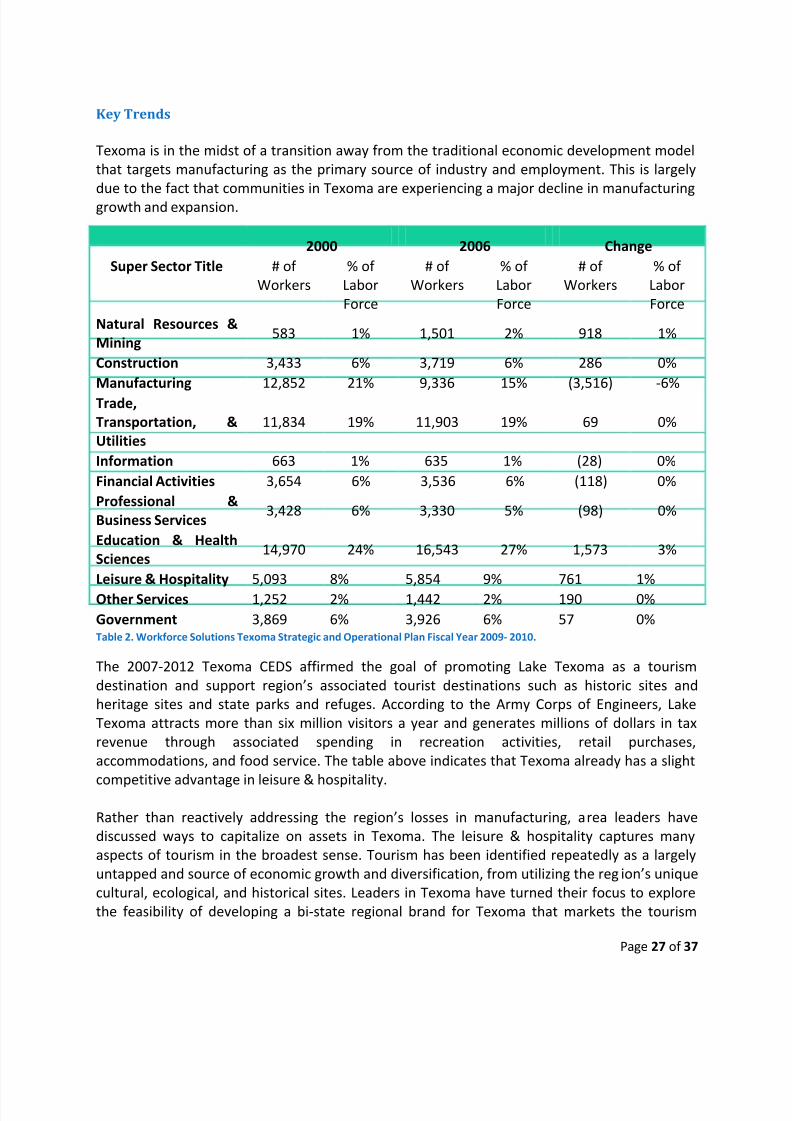
Key Trends
Texoma is in the midst of a transition away from the traditional economic development model
that targets manufacturing as the primary source of industry and employment. This is largely
due to the fact that communities in Texoma are experiencing a major decline in manufacturing
growth and expansion.
2000 2006 Change
Super Sector Title # of
Workers
% of
Labor
Force
# of
Workers
% of
Labor
Force
# of
Workers
% of
Labor
Force
Natural Resources &
Mining583 1% 1,501 2% 918 1%
Construction 3,433 6% 3,719 6% 286 0%
Manufacturing 12,852 21% 9,336 15% (3,516) -6%
Trade,
Transportation, &
Utilities
11,834 19% 11,903 19% 69 0%
Information 663 1% 635 1% (28) 0%
Financial Activities 3,654 6% 3,536 6% (118) 0%
Professional &
Business Services3,428 6% 3,330 5% (98) 0%
Education & Health
Sciences14,970 24% 16,543 27% 1,573 3%
Leisure & Hospitality 5,093 8% 5,854 9% 761 1%
Other Services 1,252 2% 1,442 2% 190 0%
Government 3,869 6% 3,926 6% 57 0%Table 2. Workforce Solutions Texoma Strategic and Operational Plan Fiscal Year 2009- 2010.
The 2007-2012 Texoma CEDS affirmed the goal of promoting Lake Texoma as a tourism
destination and support region’s associated tourist destinations such as historic sites and
heritage sites and state parks and refuges. According to the Army Corps of Engineers, Lake
Texoma attracts more than six million visitors a year and generates millions of dollars in tax
revenue through associated spending in recreation activities, retail purchases,
accommodations, and food service. The table above indicates that Texoma already has a slight
competitive advantage in leisure & hospitality.
Rather than reactively addressing the region’s losses in manufacturing, a rea leaders have
discussed ways to capitalize on assets in Texoma. The leisure & hospitality captures many
aspects of tourism in the broadest sense. Tourism has been identified repeatedly as a largely
untapped and source of economic growth and diversification, from utilizing the reg ion’s unique
cultural, ecological, and historical sites. Leaders in Texoma have turned their focus to explore
the feasibility of developing a bi-state regional brand for Texoma that markets the tourism

8/4/2019 CEDS 2010 Update
http://slidepdf.com/reader/full/ceds-2010-update 29/37
Page 28 of 37
assets of Texoma. With the new world-class casinos of the Chickasaw and Choctaw Nations, the
steady attraction of Lake Texoma, and the growth of the D/FW Metroplex and Oklahoma City,
the Texoma region is in the ideal location for living, working, and playing. Attracting visitors,
new residents, and even new business to this region through a coordinated marketing effort
will generate revenues for all of Texoma’s communities and attractions.
8/4/2019 CEDS 2010 Update
http://slidepdf.com/reader/full/ceds-2010-update 30/37
Page 29 of 37
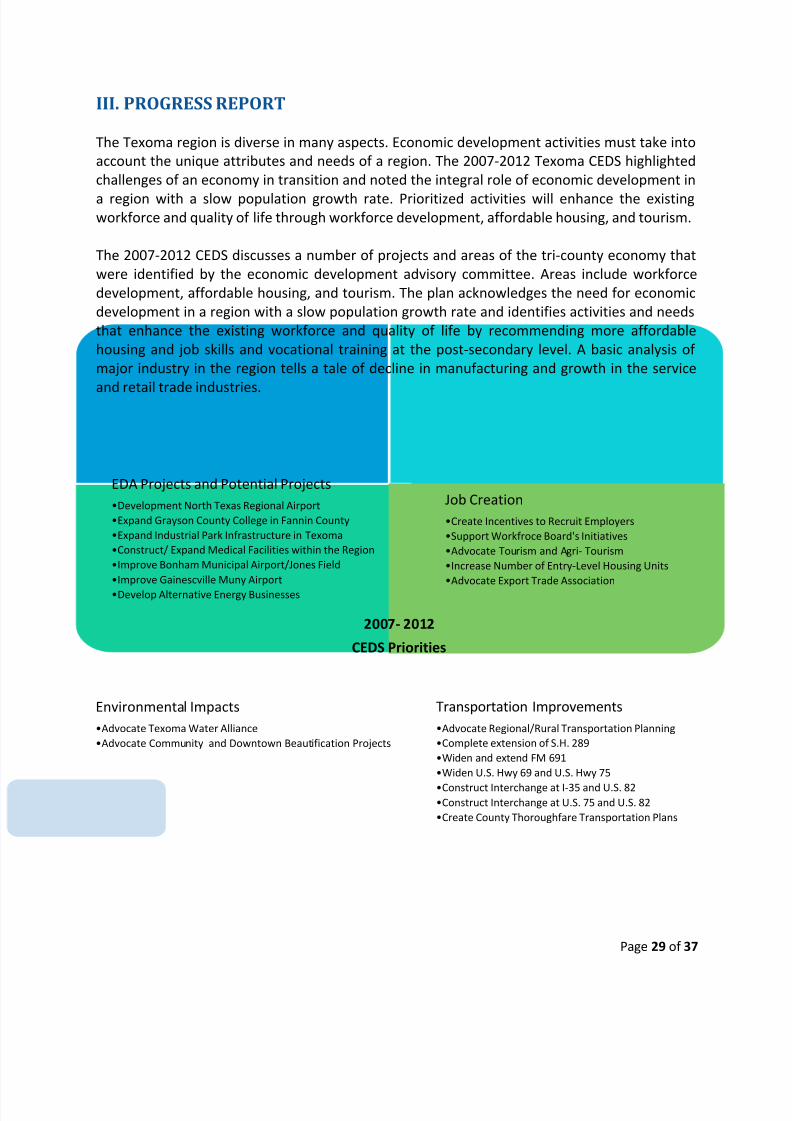
EDA Projects and Potential Projects
•Development North Texas Regional Airport
•Expand Grayson County College in Fannin County
•Expand Industrial Park Infrastructure in Texoma
•Construct/ Expand Medical Facilities within the Region
•Improve Bonham Municipal Airport/Jones Field
•Improve Gainescville Muny Airport
•Develop Alternative Energy Businesses
Job Creation
•Create Incentives to Recruit Employers
•Support Workfroce Board's Initiatives
•Advocate Tourism and Agri- Tourism
•Increase Number of Entry-Level Housing Units
•Advocate Export Trade Association
Environmental Impacts
•Advocate Texoma Water Alliance
•Advocate Community and Downtown Beautification Projects
Transportation Improvements
•Advocate Regional/Rural Transportation Planning
•Complete extension of S.H. 289
•Widen and extend FM 691
•Widen U.S. Hwy 69 and U.S. Hwy 75
•Construct Interchange at I-35 and U.S. 82•Construct Interchange at U.S. 75 and U.S. 82
•Create County Thoroughfare Transportation Plans
2007- 2012
CEDS Priorities
III. PROGRESS REPORT
The Texoma region is diverse in many aspects. Economic development activities must take into
account the unique attributes and needs of a region. The 2007-2012 Texoma CEDS highlighted
challenges of an economy in transition and noted the integral role of economic development in
a region with a slow population growth rate. Prioritized activities will enhance the existingworkforce and quality of life through workforce development, affordable housing, and tourism.
The 2007-2012 CEDS discusses a number of projects and areas of the tri-county economy that
were identified by the economic development advisory committee. Areas include workforce
development, affordable housing, and tourism. The plan acknowledges the need for economic
development in a region with a slow population growth rate and identifies activities and needs
that enhance the existing workforce and quality of life by recommending more affordable
housing and job skills and vocational training at the post-secondary level. A basic analysis of
major industry in the region tells a tale of decline in manufacturing and growth in the service
and retail trade industries.
8/4/2019 CEDS 2010 Update
http://slidepdf.com/reader/full/ceds-2010-update 31/37
Page 30 of 37
Ongoing Regional Projects
Texoma Regional Marketing. The Texoma Council of Governments (TCOG) and residents of the
Texoma region have a strong connection with South Oklahoma through the natural movement
of human and physical capital. The regions share a common labor shed, retail market, and
cultural economics, making bi-state relationships necessary for positive economic outcomes inour communities. Lake Texoma may be the single greatest asset in southern Oklahoma and
northern Texas, yet there is no comprehensive or unified approach to either protecting it for
future generations or marketing it as an economic development resource. In April of 2009, the
Texoma Regional Consortium hosted a forum in which more than 200 people came together to
begin discussing these issues. There was considerable agreement that Lake Texoma has the
potential to anchor a brand for the region that promotes significant economic activity in Texas
and Oklahoma. Thoughtful development of this resource can contribute to a strong economic
future by improving the “quality of place” that attracts and keeps young professionals and
entrepreneurs in the region. While there is a tremendous amount of work to be done in the
long-term to ensure that the potential of Lake Texoma is fully realized, the overwhelming
opinion was that a marketing plan is the first achievable step.
The Texoma Council of Governments (TCOG) was asked to take the lead on this project with a
particular emphasis on identifying potential funding sources and coordinating the activities of a
Steering Committee. Stakeholders, including the Choctaw Nation, Denison Development
Alliance, the City of Sherman, Private Developers, Rural Enterprises of Oklahoma, Inc., Southern
Oklahoma Development Association, and Workforce Solutions Texoma, have met to discuss
strategies for developing a regional brand that can market the virtues of the region’s assets.
Recent Successes
EDA Awards
Center for Workplace Learning. In 2003, the Center for Workplace Learning at Grayson County
College received a Public Works, Economic Adjustment Infrastructure Investments by EDA.
Grayson County College was the recipient for a $1,700,000 public works investment
($1,000,000 EDA investment and $700,000 applicant investment). To date, this successful
project has created 1268 jobs and 1175 existing jobs have been retained for a total of 2443 jobs
created and retained.
Grayson County Community College, Fannin Campus. Grayson County College was awarded an
EDA Economic Adjustment grant in August of 2009 to partially fund the construction of apermanent building in Fannin County. The $2 million matching grant will help Grayson County
College replace their extension site in Bonham with a new facility, the Rayburn Center, which
will house regional business and industrial one-stop workforce training and education for
Fannin County. The Rayburn Center has been designed as a regional center for advancing
economic productivity and viability with the creation of a regional one-stop location for local
business incubation and instruction in advanced techniques and processes of management,
8/4/2019 CEDS 2010 Update
http://slidepdf.com/reader/full/ceds-2010-update 32/37
Page 31 of 37
manufacturing, assembly, workforce training and retention, and competition. The Rayburn
Center will be located on 100 acres of donated land on U.S. Highway 82.
In order to raise the $2 million in matching funds required of the EDA grant, Grayson County
College is in the process of annexing Fannin County in their taxing district. Fannin County
residents currently pay out-of-district rates when they register for GCC classes. Shouldannexation be approved, Fannin County residents would pay approximately thirty percent less
for each 3 hour course. Fannin County voters will decide on May 8, 2010 whether or not they
approve paying the same tax rate currently being paid by Grayson County taxpayers in
exchange for a break in tuition rates and the construction of a permanent GCC facility in
Bonham.
Other Achievements in Economic Development
North Texas Regional Airport (NTRA). Over the last few years the North Texas Regional Airport
(NTRA) has positioned itself to be the region’s center of aviation travel and training with hopes
of attracting economic activity from the Dallas/Fort Worth Metroplex, only sixty miles to thesouth. As part of a multi-jurisdiction collaborative effort, NTRA has developed a marketing
strategy for its hundreds of shovel-ready acres of industrial land with runway, highway and
railway access. The extension of HWY 289 was completed in December of 2009 and now links
the airport with Lake Texoma and the DFW Metroplex along the airport’s eastern edge. NTRA
continues to enhance its facilities and site feature with completion of the first phase of the
$16.9 million Capital Improvement Program. In April 2009, the water drainage system was
updated to correct the undersized water drainage and a $4.0 million taxiway rehabilitation
project is still underway that will completely overlay the airports taxiways. In 2010, NTRA will
revisit and update their 2002 Master Plan in order to systematically plan their capital
improvement projects for the coming years.
Transportation. In December 2008, The Sherman-Denison Planning Organization (MPO)
completed a Corridor Plan for FM 691 to provide recommendations for short and long term
improvements integral to serve the added capacity due to developments of the US 75/FM 691
interchange and NRTA. Through meetings with stakeholders, the study determined the desired
“look and feel” of the right away and recommended a general approach for collaborative
management between Grayson County, TxDOT, the Cities of Sherman and Denison, and the
Grayson County Regional Mobility Authority, that includes options for a new ramping scheme at
US 75 and recommendations for the development of a Corridor Access Management Plan to
study the access management tools that can implemented to accommodate existing local and
regional traffic capacity demands.
Texoma Area Paratransit System (TAPS) launched its first fixed bus routes on August 24th with
the Roo and Viking Routes that links Austin College and Grayson County College with shopping
outlets in the area.
8/4/2019 CEDS 2010 Update
http://slidepdf.com/reader/full/ceds-2010-update 33/37
Page 32 of 37
Industry. Panda Energy will be building a combined cycle natural gas plant in Sherman to meet
the increased power needs of North Texas. Richard Evans with Panda Energy said the plant will
be located on Progress Drive and will sit on 20 acres out of a 205-acre parcel of land. The
Sherman generating station will supply the power needs of 400,000 to 450,000 homes.
Construction could begin by the first quarter 2010. After that, it will be about 27 months before
the plant is up and running. The construction phase of the plant will require 500 construction jobs. Once the plant is up and running, Evans said the plant could mean well-paying jobs for up
to 27 people.
The City of Sherman and Grayson county commissioners have approved incentives to bring
Panda Energy to Sherman. Even with rebates and incentives, Panda Energy will still be paying
taxes of $100 million a year.
Health Care. In December of 2009, Texoma Medical Center (TMC) moved into their new facility
located at the corner of U.S. Hwy 75 and State Hwy 69 next to the 140,000 square-foot CIGNA
call center. The new hospital center has 165 beds, room to expand to 241 beds based on need,
a bigger Emergency Department with 26 beds with 4 trauma beds, and an adjacent three-story,
120,000-square-foot medical office building that will open in early 2010. The CIGNA call center
and TMC have added more than 150 million dollars in property tax value for the city of Denison.
8/4/2019 CEDS 2010 Update
http://slidepdf.com/reader/full/ceds-2010-update 34/37
Page 33 of 37
IV. SCOPE OF WORK FOR 2010
In 2010, TCOG will work with area leaders to pursue the development of a brand and
comprehensive marketing study for Texoma; reflecting the objective for growth in tourism
identified at the 2009 Lake Texoma Symposium. This activity is a significant step towards the
development of Texoma as Lake Texoma and the Casinos and Resorts in Southern Oklahomaare a major economic driver of the region and subsequently, a major factor is transforming the
Texoma labor market.
TCOG, in its role as the Texoma Economic Development District, will continue to work with the
region’s economic development leaders to prepare the CEDS updates. This will include tracking
emerging regional trends and performance of regional clusters, as well as maintaining an open
dialogue with local officials and the private sector about regional activities and goals. TCOG will
also organize and host additional economic development training opportunities for Texoma’s
economic development practitioners and local officials.
8/4/2019 CEDS 2010 Update
http://slidepdf.com/reader/full/ceds-2010-update 35/37
Page 34 of 37
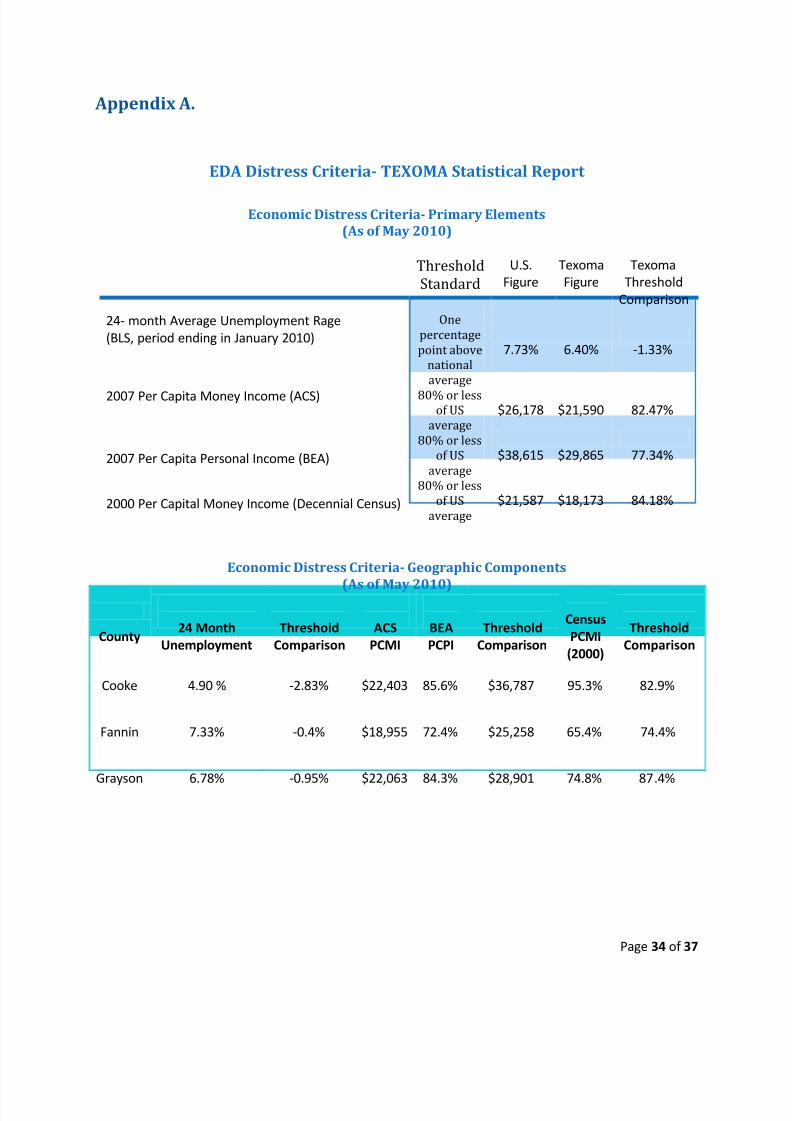
Appendix A.
EDA Distress Criteria- TEXOMA Statistical Report
Economic Distress Criteria- Primary Elements
(As of May 2010)
Threshold
Standard
U.S.
Figure
Texoma
Figure
Texoma
Threshold
Comparison
24- month Average Unemployment Rage
(BLS, period ending in January 2010)
One
percentage
point above
national
average
7.73% 6.40% -1.33%
2007 Per Capita Money Income (ACS) 80% or lessof US
average
$26,178 $21,590 82.47%
2007 Per Capita Personal Income (BEA)
80% or less
of US
average
$38,615 $29,865 77.34%
2000 Per Capital Money Income (Decennial Census)
80% or less
of US
average
$21,587 $18,173 84.18%
Economic Distress Criteria- Geographic Components
(As of May 2010)
County24 Month
Unemployment
Threshold
Comparison
ACS
PCMI
BEA
PCPI
Threshold
Comparison
Census
PCMI
(2000)
Threshold
Comparison
Cooke 4.90 % -2.83% $22,403 85.6% $36,787 95.3% 82.9%
Fannin 7.33% -0.4% $18,955 72.4% $25,258 65.4% 74.4%
Grayson 6.78% -0.95% $22,063 84.3% $28,901 74.8% 87.4%
8/4/2019 CEDS 2010 Update
http://slidepdf.com/reader/full/ceds-2010-update 36/37
Page 35 of 37
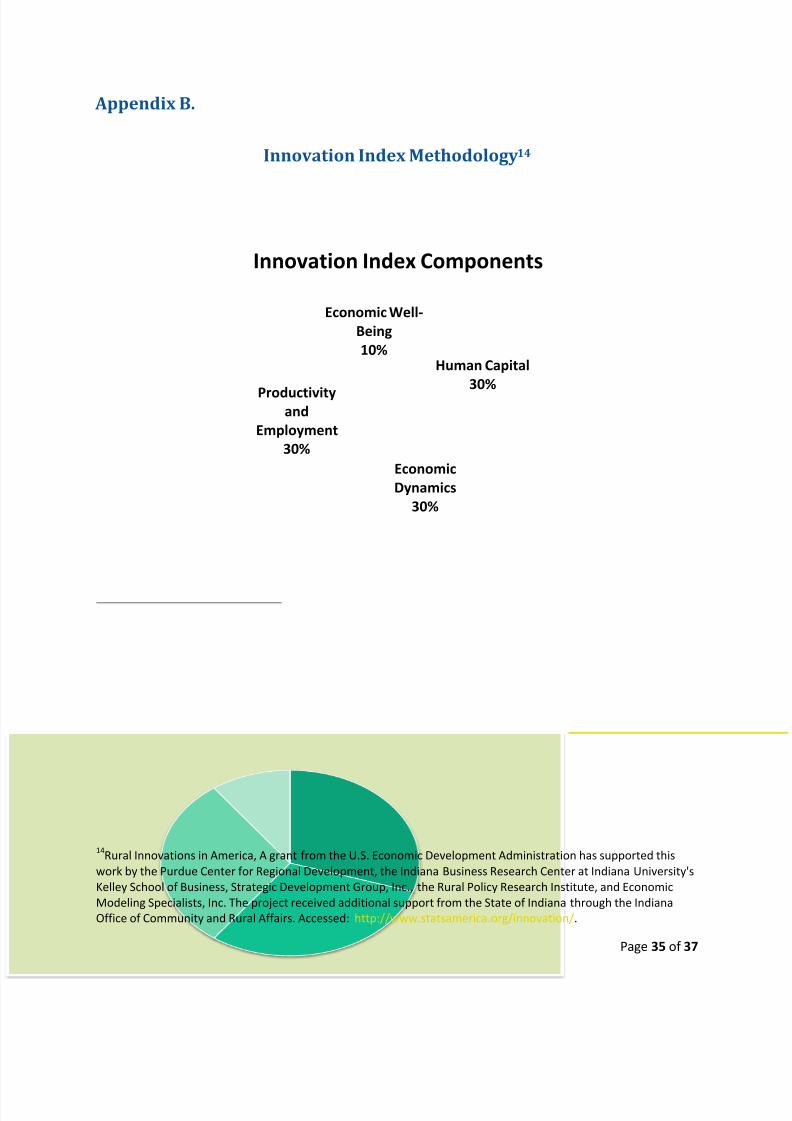
Appendix B.
Innovation Index Methodology14
14Rural Innovations in America, A grant from the U.S. Economic Development Administration has supported this
work by the Purdue Center for Regional Development, the Indiana Business Research Center at Indiana University's
Kelley School of Business, Strategic Development Group, Inc., the Rural Policy Research Institute, and Economic
Modeling Specialists, Inc. The project received additional support from the State of Indiana through the Indiana
Office of Community and Rural Affairs. Accessed: http://www.statsamerica.org/innovation/.
Human Capital
30%
Economic
Dynamics
30%
Productivityand
Employment
30%
Economic Well-
Being
10%
Innovation Index Components
8/4/2019 CEDS 2010 Update
http://slidepdf.com/reader/full/ceds-2010-update 37/37
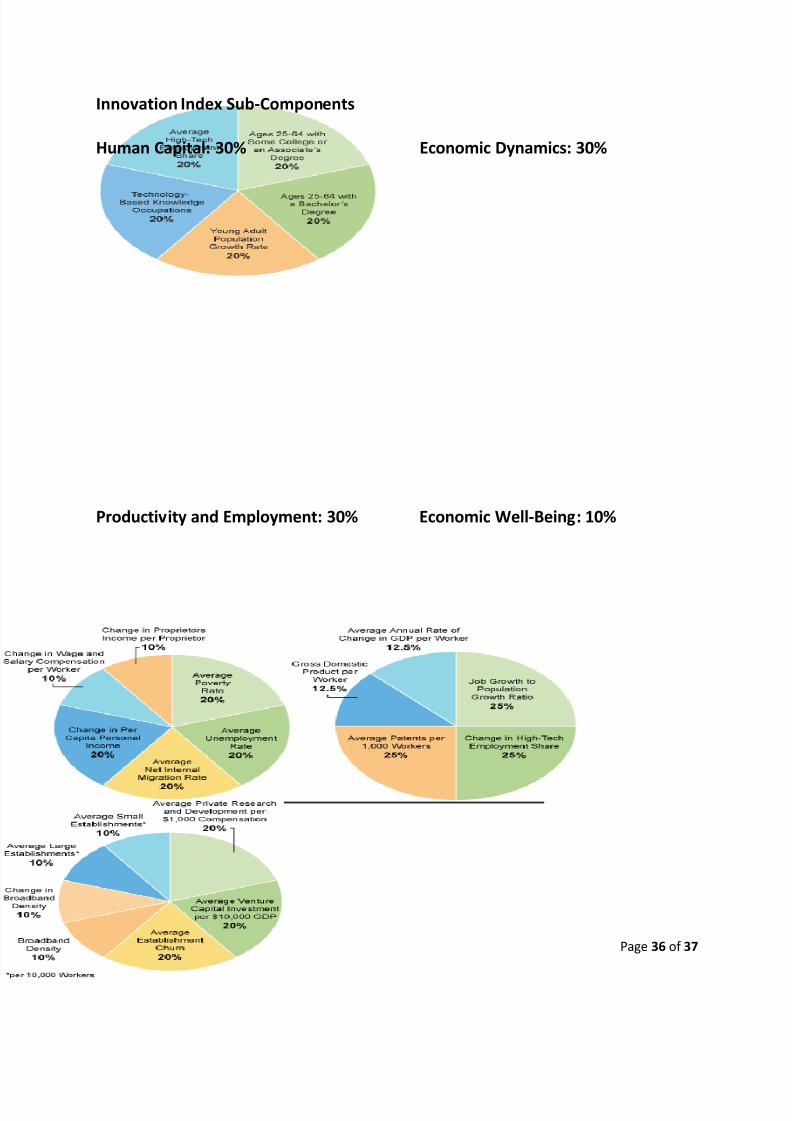
Innovation Index Sub-Components
Human Capital: 30% Economic Dynamics: 30%
Productivity and Employment: 30% Economic Well-Being: 10%