ceip 40-month final en rev - social research and ... · - v - tables and figures table page 3.1...
TRANSCRIPT


SRDC
BOARD OF DIRECTORS
CHAIR RICHARD A. WAGNER Partner, Ogilvy Renault
MEMBERS PETER BARNES President, Peter Barnes Enterprises Inc. PAUL BERNARD Professor, Department of Sociology, Université de Montréal MONICA BOYD Professor, Department of Sociology, University of Toronto YVON FORTIN Director General, Institut de la Statistique du Québec JOHN F. HELLIWELL Professor, Department of Economics, University of British Columbia SHARON MANSON SINGER President, Canadian Policy Research Networks ELIZABETH PARR-JOHNSTON President, Parr Johnston Economic and Policy Consultants IAN STEWART
JEAN-PIERRE VOYER Executive Director, Social Research and Demonstration Corporation

Improving Skills, Networks, and Livelihoods through Community-Based Work
Three-Year Impacts of the Community Employment Innovation Project
David Gyarmati Shawn de Raaf
Claudia Nicholson Boris Palameta
Taylor Shek-Wai Hui Melanie MacInnis
October 2007
The Community Employment Innovation Project is funded by Human Resources and Social Development Canada (HRSDC) and the Nova Scotia Department of Community Services (NS-DCS). The findings and conclusions stated in this report do not necessarily represent the official positions or policies of HRSDC or NS-DCS. La version française de ce document peut être obtenue sur demande.

The Social Research and Demonstration Corporation is a non-profit organization and registered charity with offices in Ottawa and Vancouver. SRDC was created specifically to develop, field test, and rigorously evaluate social programs. SRDC’s two-part mission is to help policy-makers and practitioners identify social policies and programs that improve the well-being of all Canadians, with a special concern for the effects on the disadvantaged, and to raise the standards of evidence that are used in assessing social policies. As an intermediary organization, SRDC attempts to bridge the worlds of academic researchers, government policy-makers, and on-the-ground program operators. Providing a vehicle for the development and management of complex demonstration projects, SRDC seeks to work in close partnership with all levels of governments — federal, provincial and local — as well as with communities where these projects take place.
Copyright © 2007 by the Social Research and Demonstration Corporation
- iii -
Contents
Tables and Figures v
Acknowledgements x
1 Background and Overview of CEIP 1 Background 1 How is CEIP Different? 2 CEIP Program Model, In Depth 6 CEIP Evaluation Design 8 Overview of the 40-Month Impact Study 12 Report Outline 13
2 Implementing CEIP 14 Engaging Communities 14 Establishing a Program Office 14 Recruiting Study Participants 15 Participating in CEIP 16 CEIP Projects and Work Placements 19 Summary 23
3 Impacts on Employment, Earnings, and Job Characteristics 24 Impacts on Full-Time Employment 24 CEIP versus Non-CEIP Employment 30 Impacts on Monthly Earnings 32 Cumulative Measures of CEIP’s Employment Impacts 37 Impacts on Wages and Hours of Work 38 Impacts on Jobs: Occupations, Skill Levels, Duration 40 Summary 45
4 Impacts on Income, Hardship and Well-Being 47 Impacts on EI and IA Receipt 47 Impacts on Incomes and Low-Income Status 53 Impacts on Financial Status 60 Impacts on Harship, Expectation and Well-Being 63 Summary 67
5 Impacts on Social Capital 68 Overview: Social Capital 68 Impacts of CEIP on Social Capital Development Over 40 Months 71 Summary 80

- iv -
6 Imapcts on Employability 81 Soft Skills 81 Attitudes Towards Work and Transfer Payments 87 Education and Training 90 Job Search 91 Mobility 93 Summary 95
7 Impacts on Volunteering 96 Impacts on Volunteering 96 Summary 102
8 Summary of Findings 104 Post-Program Follow-Up 108
Appendices
A Analysis of Non-Response Bias in the 40-Month Report Sample 109
B Program Satisfaction 119
C Regression-Adjusted Impact Estimates 122
D Subgroup Impacts 140
References 158

- v -
Tables and Figures Table Page 3.1 Impacts on CEIP and Non-CEIP Employment — EI Sample 35
3.2 Impacts on CEIP and Non-CEIP Employment — IA Sample 36
3.3 Cumulative Impacts on Earnings, Hours, and Months With Employment During Months 1 to 38 37
3.4 Impacts on Distribution of Wages and Hours (Month 32) 40
3.5 Impacts on Occupation Type of Main Job During Months 1 to 40 41
3.6 Impacts on Skill Level of Main Job During Months 1 to 40 43
3.7 Average Number of Jobs Held During Months 1 to 40 44
3.8 Impacts on Duration of Main Job During Months 1 to 40 45
4.1 Impacts on EI Monthly Benefits — EI Sample 49
4.2 Impacts on EI and IA Monthly Benefits — IA Sample 52
4.3 Impacts on Personal and Household Income Prior to the 40-Month Follow-Up Interview 53
4.4 Impacts on Household Low-Income (LICO) Status Prior to the 40-Month Follow-Up Interview 58
4.5 Impacts on Personal Finance at the 40-Month Follow-Up Interview 62
4.6 Impacts on Harship at the 40-Month Follow-Up Interview 64
4.7 Impacts on Expectation, Health and Well-Being at the 40-Month Follow-Up Interview 65
5.1 Number of Contacts Able to Provide Various Resources 72
5.2 Structural Characteristics of Social Networks — Tie Strength and Network Density 74
5.3 Network Heterogeneity 77
5.4 Composite Measures of Change from Baseline to 40 Months 79
6.1 Impacts on Working Skills at the 40-Month Follow-Up Interview 83
6.2 Impacts on Attitudes to Work and Transfer Payments, at the 40-Month Follow-Up Interview 89
6.3 Impacts on Non-CEIP-Provided Training at the 40-Month Follow-Up Interview 91
6.4 Impacts on Job Search at the 40-Month Follow-Up Interview 92
6.5 Impacts on Mobility at the 40-Month Follow-Up Interview 94
7.1 Impacts on Formal Volunteering with Groups or Organizations 98
7.2 Impacts on Informal Volunteering 100
7.3 Impacts on Volunteering on Participants Working Full-Time 101
7.4 Changes in Informal and Formal Volunteering from Baseline to 40 Months 103

- vi -
A.1 Comparison of Characteristics of Original Baseline and 40-Month Survey Samples — EI Sample 113
A.2 Comparison of Characteristics of Original Baseline and 40-Month Survey Samples — IA Sample 115
A.3 Impacts on EI Receipt and Payments by Respondents and Non-Respondents — EI Sample 117
A.4 Impacts on EI Receipt and Payments by Respondents and Non-Respondents — IA Sample 118
B.1 Program Satisfaction at 40 Months After Enrolment Among Program Group 120
C.1 Impacts on Occupation Type of Main Job During Months 1 to 40 128
C.2 Impacts on Personal and Household Income Prior to the 40-Month Follow-Up Interview 128
C.3 Impacts on Household Low-Income Cut-Off (LICO) Status Prior to the 40-Month Follow-Up Interview 129
C.4 Impacts on Personal Finance at the 40-Month Follow-Up Interview 130
C.5 Impacts on Hardship at the 40-Month Follow-Up Interview 131
C.6 Network Heterogeneity 132
C.7 Composite Measures of Change from Baseline to 40 Months 133
C.8 Impacts on Working Skills at the 40-Month Follow-Up Interview 134
C.9 Impacts on Attitude to Work and Transfer Payments at the 40-Month Follow-Up Interview 136
C.10 Impacts on Non-CEIP-Provided Training at the 40-Month Follow-Up Interview 137
C.11 Impacts on Mobility at the 40-Month Follow-Up Interview 138
C.12 Impacts on Formal Volunteering with Groups or Organizations 139
D.1 Impacts on Full-Time Employment by Subgroup — Percentage Employed Full-Time Between Months 19 and 38 144
D.2 Impacts on Household Income by Subgroup — Average Household Income at the 40-Month Survey ($) 145
D.3 Impacts on Income of Other Household Members by Subgroup — Average Income of Other Household Members at the 40-Month Survey ($) 146
D.4 Impacts on Spousal Employment by Subgroup — Participants with a Working Spouse (%) 147
D.5 Impacts on Incidence of Low Income by Subgroup — Participants with Household Income Less than LICO 148
D.6 Impacts on the Severity of Poverty — Participants with Household Income Less than 75% of LICO 149
D.7 Impacts on Total EI Payments by Subgroup — Total EI Payments from Months 1 to 38 ($) 150

- vii -
D.8 Impacts on Total IA Payments by Subgroup — Total AI Payments from Months 1 to 38 ($) 151
D.9 Impacts on Total Contacts who Can Help Find a Job by Subgroup — Average Number of Contacts 152
D.10 Impacts on Working Skills by Subgroup — Problem-Solving Skills 153
D.11 Impacts on Working Skills by Subgroup — Systems Thinking 154
D.12 Impacts on Mobility by Subgroup —Participants who Moved Outside Cape Breton (%) 155
D.13 Impacts on Volunteering by Subgroup — Participants Not Having Formally Volunteered in 22 Months (%) 156
D.14 Impacts on Volunteering by Subgroup — Participants Not Having Informally Volunteered in 22 Months (%) 157

- viii -
Figure Page 2.1 CEIP Participation Rates by Months From Enrolment 17
2.2 CEIP Projects by Organization or Sector Served (2000–2005) 19
2.3 CEIP Jobs — Total Positions Filled, by Occupation 22
2.4 Total Participant Placements, by Occupation 23
3.1a Full-Time Employment Rates, by Months from Random Assignment — EI Sample 26
3.1b Full-Time Employment Rates, by Months from Random Assignment — IA Sample 27
3.2a Impacts on Full-Time Employment Rates, by Activity Limitation — EI Sample 29
3.2b Impacts on Full-Time Employment Rates, by Activity Limitation — IA Sample 29
3.3a CEIP versus Non-CEIP Employment — EI Sample 30
3.3b CEIP versus Non-CEIP Employment — IA Sample 32
3.4a Average Monthly Earnings for CEIP and Non-CEIP Employment, by Quarter — EI Sample 33
3.4b Average Monthly Earnings for CEIP and Non-CEIP Employment, by Quarter — IA Sample 34
4.1 Percentage Receiving Regular EI Benefits — EI Sample 48
4.2 Percentage Receiving IA Benefits — IA Sample 51
4.3 Income of Other Household Members by Presence of Children 56
4.4 Percentage of Participants with a Working Spouse, by Presence of Children 57
4.5 Low-Income Status at 40-Month Survey by Baseline Family Structure 59
4.6 Household Income Less than 75% of LICOs at 40-Month Survey 60
5.1 Average Number of Contacts who Can Provide Help Finding a Job by Income Group 72


- x -
Acknowledgements
The Community Employment Innovation Project (CEIP) is the result of collaboration among a large number of organizations and individuals. We would like to acknowledge and thank those who have been instrumental to CEIP’s success.
CEIP would not have been possible without the support of Human Resources and Social Development Canada (HRSDC), the principal funder of the project and the originator of the idea that eventually became CEIP. We offer special thanks to Satya Brink, Urvashi Dhawan-Biswal, Bagala Biswal, and Neil Bouwer for their ongoing support and advice. We would also like to thank CEIP’s sponsor, the Nova Scotia Department of Community Services (NS-DCS) for their support, including, most recently, Lynn Hartwell and her team at Policy and Information Management in Halifax.
We acknowledge the contributions made by our local delivery partners in the Cape Breton Regional Municipality who helped make CEIP a reality on the ground. We want to thank Charlene Giovanetti-King and the Cape Breton Family YMCA, Mary McNeil and the Breton Business Centre, Judy McMullen and Matthew Bruffato of the Atlantic Coastal Action Program — Cape Breton, and Mike and Sharon Currie of Breton Rehab Services. Setting up and running the CEIP office involved an incredible effort and special thanks are due to the hard-working staff, including Bill McCarron, Anita Maynard, David Hillier, Diana Jensen, Ian MacIntyre, Bernadette Gillis, Janie MacDonald, Kathie Ball, Margie Paruch, Terri-Lynn Jennings, Ron Cote, Wendy Marinelli, and Jacqueline Buchanan.
We are also grateful to our many research partners for their significant contributions. We offer a special thought and our utmost gratitude for the late Hélène Lavoie who was taken away from us close to the completion of the project. Hélène managed Statistics Canada’s role in the selection and recruitment of CEIP participants as well as the administration of follow-up surveys. We are grateful for her dedication to the project and commitment to quality. We lost a valuable member of the CEIP team and a dear friend.
We would also like to thank Eddy Ross, Nancy Brooks, and the Special Surveys Division at Statistics Canada for their continued work on the CEIP participant surveys. Similarly, Michael Ornstein and David Northrup at the Institute for Social Research (ISR) contributed greatly with their administration of the community survey and their ongoing support and advice. The contributions of our many present and past colleagues here at the Social Research and Demonstration Corporation (SRDC) are too lengthy to list. The success of the project would not have been possible without collaboration among the whole organization. For this specific report, we would like to thank Doug Tattrie for his feedback on the analysis, Hongmei Cao who conducted the fact checking, and Eliza Bennett who edited the report and oversaw its translation and production. We also offer special thanks for the support and advice of Jean-Pierre Voyer, SRDC’s Executive Director and the former Executive Director, John Greenwood, who provided valuable insight during much of the design and implementation of CEIP.
A special acknowledgement is also made of the contributions of the dedicated volunteers who served on CEIP community boards — the New Waterford and Area

- xi -
Social and Economic Action Society, the Sydney Mines CEIP Association, the District 7 Innovation Project Association, the Glace Bay Community Improvement Society, and the North Sydney–Barra Community Development Association, as well as the many organizations that sponsored projects in their communities. Finally, we want to express our very special thanks to the individual participants in CEIP, both those who worked on projects and those who, as members of CEIP’s control group, are telling us how much difference this intervention makes.
The Authors

- 1 -
Chapter 1: Background and Overview of CEIP
Canada has enjoyed a prosperous period of stable economic growth for more than a decade. Employment levels have increased for 14 consecutive years and the national unemployment rate has reached a 30-year record low (Statistics Canada, 2006). However, there are regions of the country that have not shared equally in the benefits of sustained growth and still face chronic high unemployment. Industrial Cape Breton is one such example, where closure of coal mines and a declining steel industry have resulted in double-digit unemployment rates for over a decade. Despite a thriving national economy, the current unemployment rate in Cape Breton remains more than twice the national average at 13 per cent, with particular communities faring much worse still (Statistics Canada, 2007b). Other examples include the Gaspésie region of Quebec, which has a history of reliance on seasonal industries, with a current unemployment rate of 18 per cent (Canada Economic Development, 2007), and several single-industry towns in British Columbia that suffer from declines in logging and local pulp and paper mills. Unemployed individuals in these areas face higher risks of deteriorating skills, reduced employability, poverty, and social exclusion. Similarly, communities may face significant out-migration, reduced cohesion, and decline in their capacity.
A variety of employment programming has been implemented by governments over the last 30 years to address situations of enduring unemployment. Although many of these programs met their short-term objectives, the problem persists and innovative responses are needed. This report reviews a study of one such response — the Community Employment Innovation Project (CEIP) — a long-term research and demonstration project that is testing an alternative form of income transfer payment for the unemployed in areas of chronic high unemployment. In exchange for their entitlements to Employment Insurance (EI) and income assistance (IA), CEIP offered volunteers up to three years of work on projects that were developed by local communities in the Cape Breton Regional Municipality (CBRM). Participants were therefore involved in a significant period of stable earned income and gained an opportunity to accumulate work experiences, acquire new skills, and expand networks of contacts.
BACKGROUND
Community Employment Programs CEIP is different from earlier community-based employment programs in a number
of critical ways. Government responses to the problem of chronic regional unemployment in Canada have included a variety of direct job creation programs, many of which simultaneously aimed to involve and support communities. During the 1970s, a number of temporary community employment programs were introduced, including the Local Initiatives Program (LIP), Local Employment Assistance Program (LEAP), and Canada
- 2 -
Works, which had dual goals of job creation and community improvement. Similar programming followed in the 1980s under the Local Economic Development Assistance (LEDA) program and Canada Employment Program (CEP). The 1990s brought more focus to particular active labour market policies including earnings supplements, wage subsidies, and self employment assistance. Although the emphasis on direct job creation programs was substantially reduced in Canada, active measures under the 1996 EI Act still do provide for limited funding of such programs through the Job Creation Projects (JCP) measure.
Governments in the United States have also used community-based jobs in various capacities. In the 1980s, community work experience programs (CWEP) were initiated in several states, as part of mandatory “workfare” (Holzer, 2002). With the welfare reforms of the 1990s, several large-scale projects using community service employment (CSE) were implemented, often as components of a larger demonstration, including Vermont’s Community Service Employment Program (Sperber & Bloom, 2002) and the New Hope Project (Brock, Doolittle, Fellerath, & Wiseman, 1997).
HOW IS CEIP DIFFERENT? CEIP is not a traditional job creation project. Although the program does address a
short-term need for employment, it is first and foremost a research study that is testing an active re-employment strategy as an alternative to the passive receipt of EI or IA. Designers of CEIP also sought to build upon lessons learned from earlier approaches in developing the program model. This section elaborates on the theoretical underpinnings of CEIP and reviews some of the key features of the program that distinguish it from earlier responses to chronic regional unemployment.
Active Labour Market Policy and the Emphasis on Employment Since the late 1980s, labour market policy discussions have been dominated by what
is known as active labour market policy measures.1 The idea is that transfer programs should encourage recipients to work or learn rather than passively receiving cash benefits. This interest in active measures has affected policy developments in both the federal EI and provincial IA programs in Canada and also provided the impetus for the introduction of CEIP.2
CEIP is an attempt to experiment with another alternative to the so-called “passive” receipt of benefits. In this case, the transfer recipients were encouraged to take up community employment, recognizing the limited possibilities for market work in areas of high and continuing unemployment. The goal of testing an active labour market policy alternative had several implications for the CEIP design. The program model could not provide participants with financial benefits to participants that were substantially higher than those for which it was an alternative. Moreover, it could not provide large amounts of capital — financial or otherwise — since the provision of such capital is not a role typically assumed by a transfer program. And although the program could, in principle, 1See for example the Organization for Economic Cooperation and Development (1989, 1990). 2 For a more complete review of the developments within the Employment Insurance and Income Assistance programs relevant to the design of CEIP, see Gyarmati, de Raaf, Nicholson, Kyte, and MacInnis (2006).

- 3 -
provide job training, other existing components of the EI program provide training and the funders had other ways to learn about the effects of training and human capital accumulation.
Parallel with the federal interest in active labour market measures was a general trend in provincial governments towards reforming welfare through work. Measures aimed at increasing participation in the labour market were seen as essential steps toward reducing welfare dependency and social exclusion. In Nova Scotia, coincident with the development of CEIP, the provincial government was also planning broader changes to the IA system by adding a requirement for all IA recipients to have their employment readiness assessed and making enhanced employment supports3 available to facilitate transitions from welfare to work.
In providing alternative employment opportunities for IA recipient, the CEIP program model was seen as consistent with the heightened focus on employment inherent in the program changes that the provincial government was making.
The Role of Communities: Empowerment and Capacity-Building Many earlier community-based employment initiatives had the dual objectives of
providing jobs for the unemployed and supporting projects that aimed to help communities. CEIP is not unique in this respect. However, although some programs, particularly those from the 1970s and early 1980s, aimed to empower communities with control over project priorities, there was rarely a strong link between projects and broader community development goals.4 In many cases, project sponsors were other public agencies or organizations, with objectives that were not connected to any locally identified community needs. The US experience with community job creation offers similar lessons and emphasizes the need to “tie work projects explicitly to community needs.”5
A fundamental idea underlying CEIP that distinguishes it from earlier interventions is the notion that local communities should be able to define their needs and then develop projects that might meet those needs. To that end, CEIP placed extensive community control over project development in order to explicitly link projects with local priorities and needs. The role played by the communities had two main dimensions.
First, each community had to create a democratic decision-making structure regarding the use of CEIP resources. These CEIP community boards were initially charged with developing strategic plans and setting priorities for the kinds of projects that would have access to workers supplied by CEIP.
Second, communities were responsible for mobilizing local project sponsors to develop projects that would employ CEIP workers. It was hoped that the organization, 3Enhanced employment supports included extended prescription drug coverage for up to 12 months after starting a job, reimbursement of up to $400 a month in childcare expenses and $150 a month in transportation costs, payment of a one-time “new start” allowance of $200 for part-time employment and $400 for full-time employment, a disregard of 30 per cent of net earnings from the calculation of IA benefit entitlement, a covering of the costs of some work-related items (work boots, uniforms, tools, and supplies), and an increase in the coverage of costs for employment-related training courses.
4 See Roy and Wong (1998) for a review of evaluation studies of Canadian job creation programming. 5 See Johnson (1997) for a review of lessons learned from US community employment programs.

- 4 -
planning, and mobilization of projects would serve as a catalyst for community action and that these process would, in turn, support capacity growth and improve social and market conditions in ways that were consistent with locally identified community needs.
Social Economy: the Source of Community Projects CEIP also differs from past programs in that it grows from a body of knowledge and
practical experience with the “social economy” (Policy Research Initiative, 2005; Ninacs, 2002) While definitions of the “social economy” vary, a common element is that of organizations and institutions, which are neither entirely private — producing goods and services for sale in the market — nor entirely public — operating as part of a tax-funded government bureaucracy. CEIP is exploring whether this “third sector” can be used to develop opportunities for work, while recognizing that some communities have smaller market sectors than others. The idea is to encourage activities that are meaningful for both the participant and the community, in ways that the public and private sector have not.
However, in the context of a community-controlled model, CEIP did not impose a definition of the social economy on communities. They were free to determine the precise nature of the projects, within limited guidelines, and could, for example, choose to focus their resources in existing non-profit organizations rather than create new “social enterprises.” Furthermore, CEIP provided communities primarily “free” labour, with little capital support, as it is testing an alternative to EI or IA, not an economic development project. One could think that the lack of capital would limit the project development options of communities. The idea is to test this notion, using a rigorous design, to determine if the social economy can in fact provide a range of opportunities — “meaningful” jobs — without large capital investments.
Job Placements and Program Services: Varied Opportunities and Supports CEIP was designed to replicate traditional employment. Participants were required to
work for 35 hours a week on locally developed projects; in return, they were paid a community wage at a rate of up to $325 per week. CEIP employment was insurable under the EI program and covered by the Nova Scotia Workers’ Compensation program and the Canada Pension Plan. Optional medical benefits were also available.
However, from the perspective of participant workers, there are several unique features of CEIP that set it apart from earlier interventions. Many previous initiatives have been criticized for offering employment that is much less desirable than a traditional job (Sherwood, 1999). This employment often involved temporary, lower-skilled, short-term positions, of less than a year in duration, in a singular work placement.
CEIP built on these lessons and offered an extended length of eligibility, varied job placements, and a unique set of supporting program services. Participants were eligible for CEIP for three years, as long as they did not return to regular EI benefits or IA as their primary source of income. This would provide more significant employment duration than was possible in earlier programs. In addition, rather than a single work placement, participants were able to take on a number of successive new job assignments to obtain a wider range of work experiences. This was actively encouraged through case (participant) management and the use of a job-matching coordinator.

- 5 -
Although CEIP participants’ main activity was working on community-based projects, a number of ancillary activities were also built into the program model, including an employability assessment, basic job-readiness training, limited transferable skills training, and job search support to aid in the transition to other market employment.
Social Capital, Skill Acquisition, and Enhancing Employability CEIP is not an intervention that seeks to explicitly develop human capital. Rather, the
focus is on the maintenance and acquisition of skills and social capital through work experience. In particular, the varied nature of many job opportunities in the social economy can require flexibility, collaboration, and multitasking, which might be expected to produce effects on skills that are transferable to a number of different jobs. These are often referred to as generic or soft skills (McLaughlin, 1992) like adaptability, teamwork, and commitment to learning.
At the same time, CEIP also aimed to enhance participants’ social capital. Consistent with recent conceptual developments, especially work done by the Policy Research Initiative (2003), CEIP adopts a definition of social capital that emphasizes the availability of resources and supports within social networks. Social capital has garnered significant attention among policy-makers in recent years, with growing interest in possible policy measures to enhance networks and the links to employment and self-sufficiency that they may provide.
Social capital is accessed through the social network to which the person belongs. If a person’s network contains only bonding social capital (family and close friends), the network will likely provide access to a narrower variety of resources than if it also contains bridging social capital (more distant friends and associates who are also linked to other networks). Vertical linkages in the network to people of higher socioeconomic status would give the person capacity to leverage resources, ideas, and information that can help change their fortunes. CEIP is intended to expand the bridging and linking social capital — i.e. provide broader networks with vertical dimensions.
Mechanisms were built into the CEIP program model to encourage the development of social capital and skills in ways that earlier programs did not. For example, the long duration of CEIP eligibility as well as the availability of multiple and varied job placements provided for a wider range of opportunities for skill development and expansion of social networks. Unlike earlier interventions, CEIP is also assessing the effects of the program on both the skills and social networks of participants — independently of their labour market experience. This is important in order to understand what gives rise to any longer-term impacts on employment, or to explain the absence of such impacts. Do employment gains arise because of improved skills and human capital? Or is social capital a more significant factor? If, however, the program does not lead to increased employment in the long-term, is it because the program is not effective in improving skills, networks, and employability of participants, or is it simply indicative of the lack of job opportunities in an area of chronic unemployment?

- 6 -
Rigorous Evaluation: Random Assignment Design A defining feature of many earlier community-based employment programs,
particularly those based in Canada, is their lack of rigorous evaluation. Studies were often included only as part of costing and accountability measures, which largely used pre–post analyses where participant outcomes were compared before and after the program. These approaches have difficulty measuring the true impact of programs as they do not have adequate counterfactuals — measures of what would have happened to participants in the absence of the program. Furthermore, studies tended to focus on the post-program employment outcomes of participants, with little attention paid to the mechanisms through which employability may be improved, including measures of skill acquisition and development of social networks.
In contrast, CEIP has been set up as a demonstration project using a multiple methods approach to evaluate its effects on both individuals and communities. This includes a random assignment evaluation design — widely accepted as the most reliable way to estimate a program’s impacts — in order to assess the effect of CEIP on program participants.
CEIP PROGRAM MODEL, IN DEPTH
The Offer to Individuals An invitation to participate in CEIP was offered to a random sample of EI
beneficiaries from Cape Breton Regional Municipality who were at least 18 years of age, had received at least $1 of regular EI benefits during the selection month, and who had received between 10 and 13 weeks of benefits while also having 12 or more weeks of entitlement remaining on their claim.6 Similarly, the CEIP offer was also made to a random sample of IA recipients who were residents of CBRM, at least 18 years of age, and received at least $1 in benefits during the month they were selected as a potential sample member.
The core of the CEIP offer made to eligible individuals was the chance to exchange their entitlements to EI or IA for the opportunity to work for up to three years on projects in selected communities in the CBRM. In most respects, CEIP employment was set up to replicate a traditional job. Participants were required to work (or engage in other eligible activities) for 35 hours a week. In return, they were paid a community wage, which was initially set at $280 a week and was then indexed to increases in the provincial minimum wage, eventually increasing to $325 a week. CEIP employment was insurable under the EI program and covered by the Nova Scotia Workers’ Compensation program and the Canada Pension Plan. Participants were paid for statutory holidays and accumulated an entitlement to personal days, which could be taken as paid vacation or sick days. They
6 By not selecting from the entire caseload, CEIP avoided selecting new applicants and person with only a short period on EI — who may have been able to re-enter the workforce quickly. Furthermore, with at least 12 or more weeks remaining on their claim, there was a trade-off in participating in CEIP, in that selected individuals had to evaluate the effect of giving up future EI benefits. Chapter 2 discusses the selection and recruitment process in more detail.

- 7 -
could also choose to enrol in a private health plan, with premiums shared between CEIP and the participants who opted for coverage.
An important parameter of the CEIP program model was that during the eligibility period, participants were free to leave the project to take a job or to enrol in a training course, for example, and could later return if their three-year period of eligibility had not expired. However, participants who left CEIP and returned to EI or IA forfeited any further eligibility to take part in CEIP.7 Although CEIP participants worked mainly on community-based projects, a number of ancillary activities were built into the program model (Text Box 1.1).
7 CEIP did, however, allow participants to receive IA top-up payments to supplement their CEIP earnings, provided they did not resort to basic IA benefits as their principal source of income (comprising more than half of their total income).
Text Box 1.1: CEIP Ancillary Activities
Employability Assessment The initial two weeks of CEIP participation consisted of an orientation period during which
participants underwent an employability assessment to determine their level of job readiness and to collect information on their prior experience, skills, and interests to support job-matching — the process of assigning participants to community work placements.
Basic Job-Readiness and Transferable Skills Training Although CEIP was not a training intervention, limited training components were provided, including
basic job-readiness training and some transferable skills modules. Most participants received introductory job-readiness modules prior to their initial placements, while others received additional modules to help deal with identified performance issues. All participants also received a limited amount of transferable skills training in the form of short courses on such topics as first aid, occupational health and safety, and computer literacy.
Transitional and Self-Directed Projects Although the majority of CEIP work placements were community-based, some participants, who
were either between assignments or who were assessed as not job-ready, spent some time working in a transitional job provided by the CEIP consortium, rather than by a community. Another alternative to community placements with sponsors were self-directed projects: participants could choose to try to develop their own ideas into a self-directed project and CEIP would provide them with one week of entrepreneurship training and a further 11 weeks in which to develop a project proposal.
Portfolio Development and Job Search Supports Towards the end of their eligibility period, participants were able to receive assistance in portfolio
building to bring together material (such as descriptions of positions held, training certificates, and letters of recommendation) accumulated over the three years of CEIP participation. Finally, during the final three months of eligibility, each participant was given paid time off — up to seven hours per week — to engage in job search activities.

- 8 -
The Role of Communities A small number of communities in industrial Cape Breton were selected to take part
in CEIP. These communities were as much participants in CEIP as the individuals who were enrolled in the project. Individual participants were given the opportunity to take part in employment; however, the responsibility for generating the employment opportunities rested with the communities.
The role played by the communities had two main dimensions. First, each community had to create a democratic structure to make decisions regarding the use of CEIP resources. These CEIP community boards were initially charged with developing strategic plans and setting priorities for the kinds of projects that would have access to workers supplied by CEIP. Second, the communities were responsible for organizing specific projects that would employ CEIP workers to help address the community needs that were identified. This was a shared responsibility. Any community organization or individual could develop a proposal to sponsor a project (although they must have had the capacity to manage the project, including providing any other resources that might have been needed, such as facilities, tools and equipment, supervisors, and workers with specialized skills). The community boards were responsible for deciding which proposals would be approved and granted access to the pool of CEIP workers.
The main element of CEIP’s offer to communities was the chance to benefit from the “free labour” provided by and paid for by the project, and it was hoped that this would serve as a catalyst for community action. However, CEIP’s design recognized that communities would vary in their capacity to undertake the tasks assigned to them. Consequently, each community board received a planning grant of up to $30,000 to defray some of the direct costs of engaging in CEIP activities at the local level. In addition, the CEIP budget included funds to hire and make available to community boards expertise to support them in undertaking CEIP-related tasks (such as setting up and running the volunteer community boards, engaging in marketing and communications activities, mobilizing communities, and strategic planning).
CEIP EVALUATION DESIGN CEIP is managed by the Social Research and Demonstration Corporation (SRDC), a
non-profit social policy research organization that specializes in developing, implementing, and evaluating large-scale demonstration projects to test innovative social policies and programs. CEIP has been set up as a demonstration project to assess the feasibility of implementing a community-based jobs program for the long-term unemployed, to estimate the benefits generated by such a program, and to determine whether the benefits are worth the cost of producing them. In considering benefits, CEIP is considering both those that accrue to individuals who work on the community-based projects and those that are experienced by the communities where the projects take place.
What types of benefits might CEIP be expected to produce? For the individual participants, the program may enhance their employability, leading to more employment and increased earnings in the future as well as reduced reliance on transfers. Working on community-based projects offers them an opportunity to gain work experience and

- 9 -
acquire new skills. As well as adding to “human capital,” CEIP may also contribute to an individual’s social capital, as participants who work together may develop stronger peer support networks. Participants are also brought into contact with project-sponsoring organizations and with individuals and organizations that benefit from the services being provided. This gives participants a chance to develop stronger social networks in the community.
Communities may also benefit from the program, since there may be a positive contribution to community development. The products or services provided by the community projects are focused on needs identified at the local level, and can thus directly provide value to the community. The availability of the free labour provided by CEIP participants, or the services provided by the organizations employing them, may strengthen existing community organizations or lead to the creation of new ones. Community board volunteers or those involved in sponsoring projects may themselves develop new skills or stronger social networks. Over time, a community’s resilience and its capacity to overcome adversity may be enhanced. Finally, for the governments funding CEIP and for society as a whole, this program model may be a cost-effective alternative to traditional transfer payments.
The evaluation strategy for CEIP is designed to address all these issues. It includes four main components:
• Implementation research to carefully document how the project was
implemented, to assess how closely the program in the field matched the original design, to evaluate potential participants’ understanding of the CEIP offer, and to identify delivery issues that can aid in better understanding how and why the program worked (or failed to work).
• Individual impact studies using a random assignment design to compare the experiences of those in CEIP’s program group with the experiences of a control group who were not eligible to work on community-based projects. Three impact studies are produced at different phases of the project: (1) an early impact report at 18 months after enrolment of participants; (2) an interim report at 40 months covering the full period of program eligibility, and (3) a final report at 54 months post-enrolment focusing on post-program actions.
• A community effects study using both a “theory of change” approach8 and a quasi-experimental comparison community design to evaluate the effects on the communities that participated in CEIP
• A benefit–cost analysis to compare the economic benefits that accrue to both the participating individuals and the communities with the cost of producing those benefits.
The first component, implementation research, has been completed and published (Greenwood, Nicholson, Gyarmati, Kyte, MacInnis & Ford, 2003). The latter two, a
8 Theory of change is a methodology for evaluating Comprehensive Community Initiatives (CCIs). The theory, derived through extensive stakeholder consultation, identifies what community changes CEIP may produce and how these changes will occur. If data supports the theory, effects can be more reliably attributed to CEIP. See Connell and Kubisch (1998) for more on theory of change methodology.

- 10 -
community effects study is the subject of a separate report, and a benefit–cost analysis is forthcoming. The primary focus of this report is the 40-month individual impact study, the methodology and data sources of which are described below.
Methodology The goal of the individual impact analysis is to measure the changes in outcomes that
CEIP produces for participating individuals. The methodology being used to conduct the analysis is a random assignment evaluation design. Simply looking at the outcomes of those who take part in a program in isolation would overstate the program’s achievements because all positive developments would be attributed to the program — this would not identify the extent to which the observed outcomes simply reflect what people would have done on their own. The challenge in an impact evaluation is to determine the difference that the program makes — the changes in outcomes that result from the program.
The process of random assignment ensures that there are no systematic pre-existing differences between the program and control groups.9 They differ only in that one group is eligible for the program and the other is not. Therefore, any differences that are observed over time in the experiences of the two groups can be attributed with confidence to the program.
Data Sources There are four data sources being used for the impact study in this report. Each source
is described in more detail below.
Baseline Survey A baseline survey was administered to all CEIP volunteers at the point of enrolment
in the study. The survey collected information on a range of demographic characteristics, household composition, income, and employment history. Beyond being useful to describe the population involved in the study, the baseline survey provides data to support the impact analysis.
First, baseline data are used to establish covariates when running adjusted impact regressions. Due to random assignment, the program and control group are expected to be similar in characteristics. Nonetheless, some differences in the two groups may be observed due to sampling variation. Such differences are a problem of precision rather than bias, and can be dealt with through regression adjustment using the baseline covariates. Although this report presents unadjusted impacts, regression-adjusted impacts have been calculated and are mentioned where adjusted impacts diverge significantly from the unadjusted. Adjusted impact tables are also included in Appendix C.
9 Strictly speaking, the expected values of the averages for all pre-existing characteristics of the program group and the control group are the same, although their actual values may differ somewhat, especially in small samples. Random assignment ensures that the two groups will not differ systematically, but it does not guarantee that they will be identical. Random differences can still occur, and although they do not introduce systematic bias into the impact estimates, they do reduce the precision of the estimates. Data on the characteristics of the sample can be collected just prior to random assignment and can be used subsequently in regression models to adjust for these random differences and improve the precision of the estimates. See for example Mohr (1995) and Orr (1999).
- 11 -
Second, baseline data can be used to create subgroups to assess variations in impacts across the program group. For this report, subgroup impacts are discussed briefly, throughout each chapter, where relevant. A selection of subgroup impact tables is also included in Appendix D.
Follow-Up Surveys: 18- and 40-Month Interviews The primary data sources used for this impact study are the 18- and 40-month follow-
up surveys. Statistics Canada administered these as telephone surveys to program and control group members approximately 18 and 40 months after their enrolment in the study. Modules covered all of the key outcomes of interest, which could not be analyzed through administrative data sources, including employment history, personal and household income, social capital, employability skills, household composition, attitudes, and health and well-being.
Administrative Data Files EI and IA administrative records are used to determine the amounts and duration of
transfer receipt by sample members.
Project Management Information System A Project Management Information System (PMIS) was implemented in the CEIP
program office to support operations and service delivery while also collecting critical research data including participation rates in CEIP, types of community jobs, duration of work, and amounts of community wages received. This information is used in conjunction with survey and administrative data to derive the employment and earnings outcomes.
OVERVIEW OF THE 40-MONTH IMPACT STUDY In November 2006, SRDC released a report (Gyarmati et al., 2006) that highlighted
early impacts of CEIP on participants, measured at 18 months after enrolment in the study. Early impact results demonstrate that, as hypothesized, CEIP has provided a significant stable period of full-time employment to both EI and IA program group members, over and above what they would have achieved without the program. Impacts on earnings were substantial, as were reductions in reliance on EI and IA benefits. This translated into increased income for participants, particularly for the IA sample, where large reductions in the incidence of poverty were observed. Associated with this improved income and employment stability are small but positive impacts on social networks, volunteering, life satisfaction, and attitudes to work.
Although these results were promising, they were preliminary in that they covered less than half the eligibility period for most participants. In contrast, the 40-month analysis covers the full period of eligibility for all program group members. The results of the 40-month analysis, when compared to those of the 18-month report, can not only address questions about whether short-term impacts of CEIP are sustained, but also whether additional impacts might arise from the longer duration.
- 12 -
As discussed above, most previous initiatives involving community jobs were generally short-term positions of less than a year. CEIP is unique in the length of its eligibility period and its focus on employment in the social economy. Hence, the nature and number of the work placements it can provide to participants may be more diverse than traditional programs, potentially offering a wider array of opportunities for social capital and skill development to improve employability. However, a competing view might suggest that a longer duration of eligibility will be of little use to some, particularly the more difficult to employ, or worse, could be counterproductive and encourage dependence.
More specifically, the 40-month results will extend the early 18-month findings and address the following questions:
• Will impacts on full-time employment be maintained at high levels through the
second half of CEIP eligibility? Or will some participants, particularly those in the IA sample, have difficulty maintaining CEIP jobs and return to welfare?
• If participants are able to maintain high rates of employment, what will the nature
of those jobs be? • If a wider range of work opportunities are in fact provided through CEIP, do these
translate into enhanced transferable skills for program group members? • Do earnings gains achieved by participants translate into increases in income for
their households through the second half of the CEIP eligibility? Are differential effects of CEIP on other household members’ incomes or on their propensities to work sustained?
• How significant are the income gains for program group families after their full
eligibility? Is the severity of poverty reduced substantially? Does this in turn reduce the extent of hardship experienced?
• Do the small impacts on social networks observed at 18 months increase in the
second half of the CEIP eligibility? Does CEIP lead to the development of more bridging and linking social capital? Does the structure of social networks continue to change in a positive way?
• Do early impacts on volunteering within community organizations persist over
three years?
Appendix A describes the 40-month report sample that is used to address these questions, and presents an analysis of non-response and program–control group baseline differences in order to assess the integrity of the experimental impact estimates. This analysis confirms that that the integrity of the experiment has been maintained and that impact estimates presented herein are unbiased estimates of the true impact of CEIP.

- 13 -
Nonetheless, a small number of baseline differences between program and control groups arose, by chance, and although they are not reflective of systematic problems with random assignment or non-response bias, regression-adjusted impacts were calculated as part of the analysis, and are included in Appendix C. For the large majority of outcomes, there are few differences between estimates derived from either approach. Furthermore, when differences do arise, the direction of the impact remained the same; only the magnitude and level of statistical significance changed. In these instances, the reader can choose to rely on the adjusted estimates or on the more conservative result. Nevertheless, the key findings of this report are unaffected by the choice of estimation method.
REPORT OUTLINE Chapter 2 provides a brief review of the implementation of CEIP including the
engagement of communities, the development of the CEIP office and program services, participant recruitment, and details on the types of projects and jobs that program participants have been working on. Following the background on implementation, the next two chapters present the impacts of CEIP on the central economic outcomes of interest in the study. Chapter 3 presents impacts on employment rates, earnings, wages, and the characteristics of jobs held by program group members. This includes a review of CEIP’s impacts on the occupational types, skill levels, and durations of the primary jobs held by program group members. Chapter 4 reviews impacts on EI and IA transfer receipt, personal and household income, the incidence of low incomes, and impacts on health and well-being as well as the extent of hardship experienced. Chapter 5 moves beyond economic impacts and presents impacts of CEIP on social capital. Chapter 6 reviews a number of additional outcomes related to the employability of participants including their transferable skills, attitudes towards work and transfer payments, participation in education and training, and their residential mobility and migration from Cape Breton. Chapter 7 presents impacts of CEIP on the extent of volunteering activities among program group members. Chapter 8 offers a number of conclusions containing important policy implications that arise from the findings presented in this report.

- 14 -
Chapter 2: Implementing CEIP
This chapter provides a brief review of the implementation of the Community Employment Innovation Project (CEIP). It first outlines the process of engaging communities and looks at the role they play in the study, as well as the establishment of the CEIP program office in Cape Breton. The remainder of the chapter presents an overview of the recruitment of participants and details their response to the offer in terms of the take-up and participation rates in various elements of the program since their enrolment in the study.
ENGAGING COMMUNITIES Following a show of support at a series of public meetings held in each community,
six Cape Breton communities1 accepted the offer to take part in CEIP. A group of community members, having completed a preliminary exploration of perceived community needs, formed a community board and submitted the board for acceptance by the Project Implementation Committee (PIC).2 In seeking acceptance, the board was required to demonstrate that it had community support and that it had established itself in a manner that would allow it to function effectively.
Once accepted, each community board was required to prepare a strategic plan, which would be used in soliciting, reviewing, and selecting projects for approval. Subsequent to the approval of the strategic plan by the PIC, a community board was authorized to begin approving projects submitted to it by organizations that wished to sponsor projects, and to receive CEIP participants to work on approved projects.
As a result of this community engagement process, five out of six communities that agreed to take part in CEIP went on to approve projects. From the time of the first project approvals in October 2000 until the end of program operations in July 2005, the five communities approved a total of 295 projects, which provided a total of 2,113 participant work placements.
ESTABLISHING A PROGRAM OFFICE The successful implementation of CEIP required a program with a unique set of
services and delivery partners, as well as access to existing community networks. In an effort to meet these needs, in September 1999, the Social Research and Demonstration Corporation (SRDC) issued a Request for Proposals (RFP) targeted to local individuals and organizations. The RFP finalist organizations were presented with a proposal from
1 The pre-amalgamation towns of Dominion, Glace Bay, New Waterford, North Sydney, and Sydney Mines, and the Whitney Pier neighbourhood of the pre-amalgamation city of Sydney were invited to participate in CEIP.
2 A committee established by CEIP’s funders, Human Resources and Social Development Canada (HRSDC) and the Nova Scotia Department of Community Services (NS-DCS), to oversee project implementation.

- 15 -
SRDC to participate in CEIP as a partner in the consortium that would operate the CEIP office.
The CEIP office would play a central role in the recruitment process (alongside Statistics Canada), deliver services directly to participants and act as the coordinating body that would match participants to sponsored employment opportunities that had gained the approval of the community boards. The organizations that agreed to form the CEIP consortium (the Cape Breton Family YMCA, Breton Business Centre, Breton Rehab Services (BRS) and the Atlantic Coastal Action Program — Cape Breton) came together in December 1999 and, following a series of initial preparation and development tasks, officially opened the CEIP office by the end of August 2000.
RECRUITING STUDY PARTICIPANTS As mentioned in chapter one, participants for CEIP were selected from among
beneficiaries of Employment Insurance (EI) and income assistance (IA) recipients, residing in the Cape Breton Regional Municipality (CBRM). Separate selection criteria and processes were implemented for EI beneficiaries and IA recipients, which reflected the rules and regulations that govern each transfer program.
Sample Selection and Enrolment The sample selection process for EI and IA sample members was undertaken by
Statistics Canada.3 EI beneficiaries were selected and enrolled from July 2000 to June 2002, while the IA selection process was from June 2001 to June 2002. EI beneficiaries were randomly selected from a monthly derivative of the HRSDC Benefits and Overpayments file (BNOP), which is used for administering employment insurance claims and payments. Eligible IA recipients were selected from IA recipients who expressed an interest in participating in CEIP, after being notified by NS-DCS about CEIP and their eligibility to participate in the program.
Once selected, individuals were invited to attend an information session to learn about CEIP and its benefits. Attendees interested in participating in the study were required to complete an enrolment form consisting of an informed consent section and questions that captured baseline measures on individual and socioeconomic characteristics.
During the enrolment phase, 5,980 eligible EI beneficiaries and 804 eligible IA recipients were randomly selected and mailed letters of invitation to an information session. The show-up rate to information sessions was 27 per cent among EI beneficiaries and 69 per cent among invitees from the IA caseload. The majority of those who showed up at an information session volunteered for CEIP by signing the enrolment form. Of the 1,620 EI beneficiaries that showed up, 1,006 signed the enrolment form, as well as 516 of the 557 attendees from the IA sample. Those who did not take up the offer did so for various reasons. The most often mentioned reasons by EI non-volunteers were the low CEIP wages, the expectation of returning to a previous employer, or other employment.
3 A detailed description of the selection process for EI beneficiaries and IA recipients is provided in Chapter 5 of The Community Innovation Project: Design and implementation, Greenwood et al. (2003).

- 16 -
IA non-volunteers most often cited personal, family and health reasons for not joining CEIP.
Random Assignment Once the enrolment form was completed, the next stage in the recruitment process
was to determine who would receive the offer of community-based work. The random assignment process, performed on SRDC’s random assignment software application, is fully automated and executed using anonymous files. The software application randomly assigned each individual to one of the two research groups — program or control group — and generated a list of the assignments. During the two-year enrolment period, 1,006 eligible EI beneficiaries and 516 IA recipients were enrolled in CEIP.4 Half of the enrolees from both the EI and IA samples were randomly assigned to the program group (i.e. offered community-based work) and the other half to the control group.
Orientation Once random assignment was completed, the CEIP office was notified of the research
status for each enrolee. The CEIP office then notified each enrolee, by mail, of his or her random assignment result. In order to complete the CEIP enrolment process and be eligible to participate in community-based work, program group members were required to attend an orientation session and sign a project participation agreement (PPA) within five weeks of receiving the letter. Of the 757 persons assigned to the program group (499 EI beneficiaries and 258 IA recipients), 684 attended an orientation session and 668 signed a PPA.
PARTICIPATING IN CEIP The enrolment statistics mentioned above are for the entire CEIP research sample.
However, the focus of this report is on the 1,262 CEIP enrolees who completed the 40-month survey. The breakdown by EI beneficiaries and IA recipients is 851 EI (441 program group; 410 control group) and 411 (210 program group; 201 control group) IA sample members.
The vast majority of program group members signed the PPA and went on to participate in one or more CEIP-related activity(ies) during the 40-month post-enrolment period. Of the 441 EI program group members in the 40-month report sample, 395 attended an orientation session and 381 signed a project participation agreement. Similarly high proportions of the 210 IA program group members in the report sample attended orientation (198 persons), all of whom also signed the PPA.
Figure 2.1 shows the percentage of the program group in the 40-month report sample that participated in a CEIP-related activity (CEIP-based projects or other approved CEIP activities) during their three-year eligibility after signing the enrolment form. Signing of the PPA by program group members was essential to completing the enrolment process and participating in CEIP-based projects, but not everyone who signed a PPA subsequently worked on CEIP community-based jobs.
4 Eight sample members were dropped from the study, bringing the total to 998 EI sample members.

- 17 -
Among those who signed the PPA, 368 EI sample members and 198 IA sample members were engaged in CEIP activities at some point during the three-year eligibility period. CEIP offered each member of the program group up to three years of participation in community-based work, but within this eligibility period, participants were free to leave CEIP for another job or training, and then return to CEIP. There was no limit on the length or frequency of such absences. Program group members may also have not participated on CEIP projects after signing the PPA for other reasons (for example, health and migration). Participation rates peaked for the EI sample at 78 per cent during the fourth month after enrolment, and gradually declined over the remainder of the eligibility. The highest level of participation among IA program group members was observed during the sixth month after enrolment, at 91 per cent, and declined gradually over the remaining follow-up.
Figure 2.1: CEIP Participation Rates by Months from Enrolment
Source: Calculations from the CEIP project management information system (PMIS).
The two months immediately following enrolment are marked by very low participation rates, because for most they were still in the process of completing enrolment. On average, there were 44 days between people signing the enrolment form and signing the PPA, but in some instances, as many as 112 days passed. Much of this time was taken up by day-to-day tasks required to get things done. As mentioned earlier, signing of the enrolment form was only one of the first steps in the enrolment process.
0 5
10 15 20 25 30 35 40 45 50 55 60 65 70 75 80 85 90 95
100
1 2 3 4 5 6 7 8 9 10 11 12 13 14 15 16 17 18 19 20 21 22 23 24 25 26 27 28 29 30 31 32 33 34 35 36 37 38
Months From Random Assignment
EI Sample
IA Sample
Perc
enta
ge E
mpl
oyed

- 18 -
The enrolment forms were then mailed to Statistics Canada to verify eligibility and electronically captured before random assignment could occur. Once random assignment was completed, individuals were notified of their assignment by mail. Program group members then had to attend an orientation session, within five weeks from date of notification of their assignment, and sign a PPA in order to start participating in CEIP projects or ancillary activities.
Upon signing the PPA, participants took part in a two-week orientation period. During this time, a detailed employability assessment was conducted and some transferable-skills and job-readiness training were provided to participants. Results of the assessment were used to decide whether a participant was required to attend one or more basic job-readiness training modules or spend time on a transitional job, before being assigned to a community-based project. The collected information was also used to help match the participant with available community project placements.
Job-Readiness Training The second week of orientation included basic job-readiness workshops. The
workshops, organized around the themes of “Survival in the Workplace” and “How to Be a More Effective Person,” were designed to provide information to participants to help them in both their personal and professional life. The Christopher Leadership course was available on request and provided individuals with the tools and knowledge to be a more effective communicator, build self-confidence and self-esteem.
Transferable Skills During the entire CEIP eligibility period, participants had access to workshops in
Cardiopulmonary Resuscitation (CPR), Occupational Health and Safety (OHS), Workplace Hazardous Materials Information System (WHMIS). Participants could also participate in customer service, entrepreneurial and basic computer training. These training modules were open to all, except for the one-week entrepreneurial training course, which was only provided to participants interested in developing their own ideas into a CEIP project.5
As expected, IA participants were more likely to be assigned to basic job-readiness training since many had little or no prior work experience. Nearly 90 per cent of IA sample members completed one or more basic job-readiness training modules, while approximately two-thirds of EI sample members did so.
Several program group members also took advantage of the various transferable skills training that were available through CEIP. Instructional sessions on occupational health and safety, workplace hazardous materials information system, and cardiopulmonary resuscitation, were the classes most often attended by CEIP participants during their CEIP eligibility period.
5 For the most part, community projects were sponsored by local organizations. However, participants, or groups of participants, were given the opportunity to develop their own ideas for projects. Those who wanted to pursue this option were given 12 weeks to develop their ideas. During the first week they were required to attend a one-week entrepreneurial training program. Over the next 11 weeks, participants were engaged in project development at the CEIP resource centre where an additional resource person was available one day a week to provide advice and encouragement.

- 19 -
CEIP PROJECTS AND WORK PLACEMENTS Once participants were deemed job-ready and had completed the initial orientation
period, they were assigned to community work placements.6 A total of 295 projects were created by communities through CEIP during the project’s five years of activity, which generated a total of 1,300 positions and 2,113 work placements for participants, allowing many to work in multiple positions.
Figure 2.2 provides a breakdown of CEIP projects that were created based on the type of organization or the community sector that is being served by the project. Text Box 2.1 provides detailed descriptions. A broad range of community needs were targeted through CEIP projects. The largest category is health, safety and environment (41), which includes volunteer fire departments, health boards, and environmental action groups. The second and third largest project categories involve services to youth (33), and those that provide some form of upkeep and beautification services (31) to the community. This is followed by equal numbers of projects in the area of arts and culture (29) and services to seniors (29). Recreational activities (26) and services to the poor (26) sharing the position of fifth largest categories.
Figure 2.2: CEIP Projects by Organization or Sector Served (2000–2005)
29
26
41
31
25
12
17
22
26
29
4
33
0
5
10
15
20
25
30
35
40
45
Arts/C
ulture
Recrea
tion
Health
,Safe
ty,Env
ironm
ent
Upkee
p,Bea
utifca
tion
CEDA, CEIP
Boa
rd
Service
Club
s
Disable
d
Suppo
rts fo
r Work
,Trainin
g
Service
s for
the po
or
Senior
sYou
thOthe
r
Source: CEIP Project Management Information System. Note: CEDA refers to Community Economic Development Agencies.
6 For some, there may have been a period of work on transitional projects while they were waiting for a suitable community placement. Transitional projects were run by the CEIP office and consortium partner ACAP Cape Breton.
- 20 -
Text Box 2.1: CEIP Community Projects Arts/Culture CEIP arts and culture projects focused on enhancing or expanding the work of CBRM organizations
devoted to performing and visual arts, as well as those promoting and preserving community history, values and traditions. Project sponsors under this category included theaters, galleries and artists’ associations, schools, heritage and historical societies and community events committees. Positions offered under this category involved costume-making, tour guide, administration, fundraising, and event management/planning.
Recreation CEIP recreation projects expanded or enhanced the services offered by local venues and associations
to residents interested in sports, hobbies and an active lifestyle. Project sponsors under this category included activity venues (arenas, rinks, pools, sports fields and complexes, community centres), sports clubs and special events. Positions offered involved maintenance, coordination, fundraising, instruction and guide work.
Health/Safety/Environment CEIP projects addressing health, safety or the environment aimed to support the efforts of community
organizations that protect and support the health and safety of both residents and the ecosystem in which they live. Sponsors under this category included volunteer fire departments, community policing offices, health boards, support and special interest groups, and environmental action groups. Positions offered under this category included field researchers and workers, home energy and water auditor, administrative assistant, maintenance worker, community outreach worker and fundraiser.
Upkeep/Beautification CEIP upkeep/beautification projects addressed a community need for infrastructure and landscaping
work to enhance the “eye appeal” of local buildings and outdoor spaces. Sponsors under this category included churches, church auxiliaries, cemeteries, and community groups. Positions offered included maintenance worker, carpenter and groundskeeper.
CEDA/CEIP Board CEIP projects under this category were involved with the work of CEIP community boards and local
Community Economic Development Agencies (CEDAs). CEIP community boards were responsible for soliciting, reviewing and approving project proposals for their specific communities, with the larger goal of enhancing life in the community according to their strategic plan and priorities. CEDAs shared a similar broad goal, with each one having a unique mission and vision for their respective coverage areas. Positions offered under this category included office administrator and outreach worker for CEIP community boards and administrative, outreach, research and coordinator positions for CEDAs.
Service Clubs CEIP service club projects were sponsored by local groups devoted to providing service and support
to community members, either enhancing or expanding on their exiting activities. Project sponsors under this category included area branches of Kinsmen, Knights of Columbus, Rotary Club and auxiliary associations. Positions offered under this category included facility worker, maintenance worker, administrator, fundraiser and events coordinator.
Disabled CEIP disabled sector projects enhanced or expanded the capacity of organizations offering services
and advocacy for youth and adults affected by physical or intellectual disabilities or mental health issues. Project sponsors under this category provided a range of services, both for clients within specific communities and across CBRM. Services included one or more of behavioural coaching, personal care, recreational and social activities, employment counseling and job training, as well as advocacy and housing. Positions offered under this category included client support worker, office administrator, researcher, volunteer, special events coordinator, and fundraiser.
(continued)

- 21 -
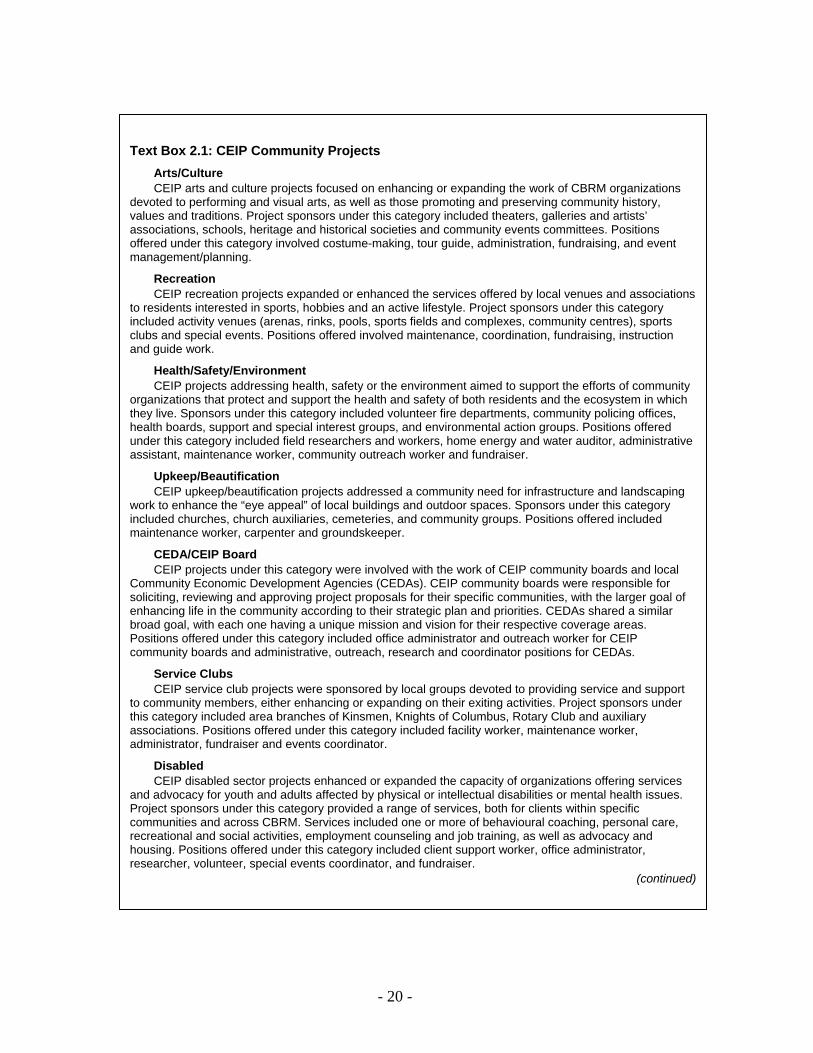
Figure 2.3 presents the total number of positions that were created and filled by CEIP participants, based on the type of occupation. It illustrates that CEIP projects provided a range of occupations for participants throughout all 10 of the National Occupational Categorizations (NOC). The largest category is by far service positions (378), which include some skilled occupations, intermediate sales and service positions, and a large proportion of elemental positions. The next largest set of placements was in business, finance, and administrative positions (231) and natural and applied sciences (230). The latter included some technical occupations with skilled positions dominating. Business, finance and administrative positions included some professional and skilled positions, while elemental occupations make up the majority.
Text Box 2.1: CEIP Community Projects (Cont’d) Supports for Work/Training CEIP projects providing supports to work and/or training expanded or enhanced the services offered by
sponsoring organizations to persons seeking to improve their employability and find work. Services and supports included childcare, employment counseling, computer access, employability and literacy training and were available both to residents of local communities and across CBRM. Project sponsors under this category included an employment outreach, public internet access sites, work re-entry, skills enhancement or retraining programs, a small business program and daycares. Positions offered under this category included office administration, reception, instructor, childcare worker, maintenance and facility staff.
Services for the Poor CEIP projects offering services to the poor enhanced or expanded on the capacity of organizations
providing supports and emergency intervention to low-income residents or persons in crisis. Project sponsors under this category include food banks, shelters, a housing association, a residential treatment centre, and various charitable organizations. Positions offered under this category involved client support worker, fundraiser, collection worker, maintenance worker, administrator, and receptionist.
Seniors CEIP senior sector projects enhanced or expanded the capacity of organizations offering services,
health care, recreation and advocacy for older members of the community. Project sponsors under this category included assisted and independent living facilities, legions, seniors and pensioners clubs, policing services and a community development agency. Positions offered under this category included maintenance worker, facility staff, social/activity facilitator, researcher, cleaner and contact worker.
Youth CEIP projects serving the youth sector enhanced or expanded on the capacity of community
organizations offering services or facilities to younger members of the community. Capacity was improved either through the provision of youth-centered service providers or the upkeep and improvement of youth-accessed facilities. Project sponsors under this category included educational institutions, recreational and athletic associations, youth centres, religious organizations and special events. Positions offered under this category included receptionist, administrator, activity coordinator, maintenance worker, facilitator, coach, researcher and outreach worker.
Other CEIP projects categorized as “other” do not fit easily or solely into any of the above categories. The
number of projects in this category was small (4) and they were sponsored through the business sector, within the rules of CEIP — i.e. profits earned must be used for the benefit of the community as a whole, not for private benefit; projects should not displace or compete with existing private or public employment. Project sponsors included community-minded small business owners and offered entry-level work experience to participants in the fields of agriculture, food production, and musical instrument maintenance.
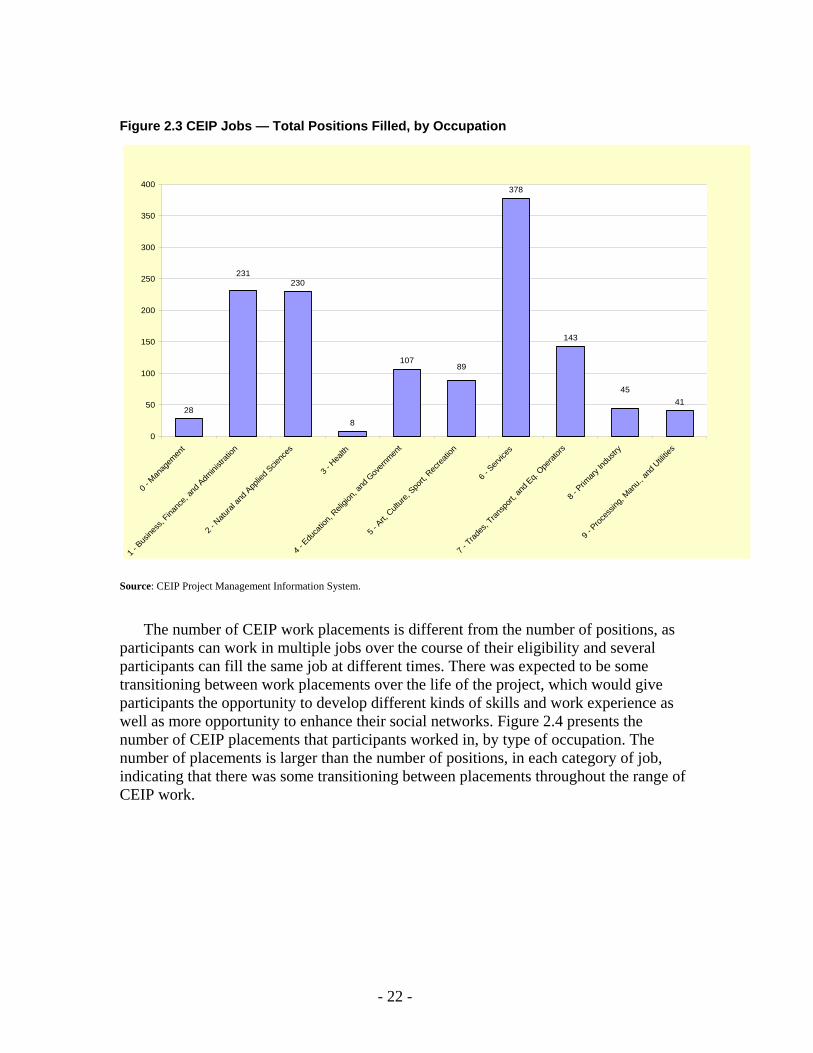
- 22 -
Figure 2.3 CEIP Jobs — Total Positions Filled, by Occupation
28
230
8
107
378
143
41
89
45
231
0
50
100
150
200
250
300
350
400
0 - M
anag
emen
t
1 - B
usine
ss, F
inanc
e, an
d Adm
inistr
ation
2 - N
atural
and A
pplie
d Scie
nces
3 - H
ealth
4 - E
duca
tion,
Religio
n, an
d Gov
ernmen
t
5 - A
rt, Cult
ure, S
port,
Recrea
tion
6 - S
ervice
s
7 - Trad
es, T
ransp
ort, a
nd E
q. Ope
rators
8 - P
rimary
Indu
stry
9 - P
roces
sing,
Manu.,
and U
tilitie
s
Source: CEIP Project Management Information System.
The number of CEIP work placements is different from the number of positions, as participants can work in multiple jobs over the course of their eligibility and several participants can fill the same job at different times. There was expected to be some transitioning between work placements over the life of the project, which would give participants the opportunity to develop different kinds of skills and work experience as well as more opportunity to enhance their social networks. Figure 2.4 presents the number of CEIP placements that participants worked in, by type of occupation. The number of placements is larger than the number of positions, in each category of job, indicating that there was some transitioning between placements throughout the range of CEIP work.
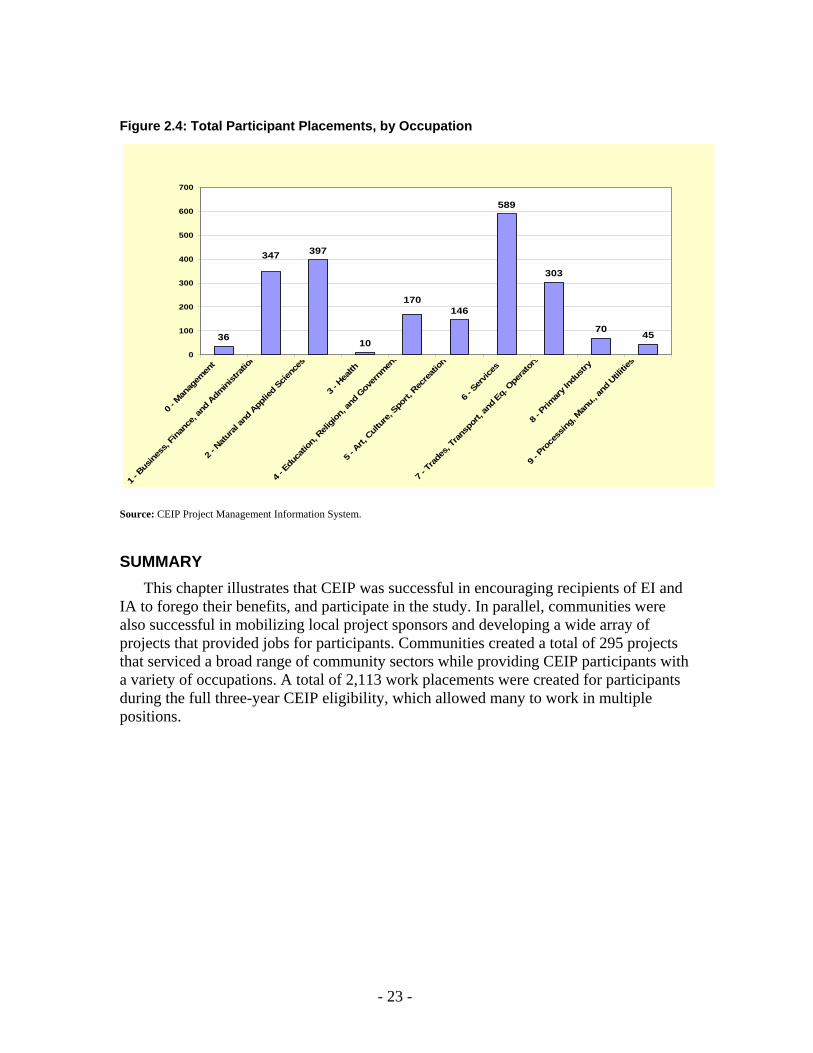
- 23 -
Figure 2.4: Total Participant Placements, by Occupation
36
397
10
146
589
303
70 45
170
347
0
100
200
300
400
500
600
700
0 - M
anag
emen
t
1 - B
usine
ss, F
inanc
e, an
d Adm
inistr
ation
2 - N
atura
l and
App
lied S
cienc
es
3 - H
ealth
4 - E
duca
tion,
Religio
n, an
d Gov
ernm
ent
5 - A
rt, C
ultur
e, Spo
rt, R
ecre
ation
6 - S
ervic
es
7 - Tr
ades
, Tra
nspo
rt, an
d Eq.
Opera
tors
8 - P
rimar
y Ind
ustry
9 - P
roce
ssing
, Man
u., an
d Utili
ties
Source: CEIP Project Management Information System.
SUMMARY This chapter illustrates that CEIP was successful in encouraging recipients of EI and
IA to forego their benefits, and participate in the study. In parallel, communities were also successful in mobilizing local project sponsors and developing a wide array of projects that provided jobs for participants. Communities created a total of 295 projects that serviced a broad range of community sectors while providing CEIP participants with a variety of occupations. A total of 2,113 work placements were created for participants during the full three-year CEIP eligibility, which allowed many to work in multiple positions.

- 24 -
Chapter 3: Impacts on Employment, Earnings,
and Job Characteristics
This chapter examines the impacts of the Community Employment Innovation Project (CEIP) on the employment rates, earnings, and characteristics of jobs held by CEIP program group members. Impacts are derived through a comparison of program group member outcomes with a benchmark sample, the control group — a group of Employment Insurance (EI) and Income Assistance (IA) recipients who are similar to CEIP program group members but who were not eligible to participate in CEIP. The results in this chapter cover the first 40 months since enrolment in the study, which includes the entire 36-month period of eligibility for CEIP.1 Later reports will extend the analysis beyond the eligibility period, addressing the impact of CEIP on program group members’ longer-term employment outcomes.
IMPACTS ON FULL-TIME EMPLOYMENT Early CEIP results demonstrated that participants overwhelmingly accepted the offer
of three years of full-time work at a community wage offered by CEIP. This enabled nearly all participants in both the EI and IA samples to work, leading to significant positive impacts on employment (particularly full-time employment) and earnings for the program group in the first 18 months of the program. Employment impacts peaked in the second quarter of the program’s operations at nearly 45 percentage points for the EI sample and nearly 75 percentage points for the IA sample, and began to gradually decline at the 18-month mark. CEIP also had an overall positive impact on hourly wages and hours worked per week in the first 18 months of the program.
These results demonstrated that, as hypothesized, CEIP provided a significant stable period of full-time employment to both EI and IA program group members, over and above what they would have achieved without the program. However, these findings were preliminary in that they were measured near the mid-point of eligibility.
Figures 3.1a and 3.1b shows the full-time employment of the program and control groups among the EI and IA samples respectively over the full period of eligibility. These results confirm that CEIP enabled participants to achieve high full-time employment rates throughout the course of the project.
EI Sample Among the EI sample, the rate of full-time employment of the program group peaks
at 89.5 per cent in month 8 and remains steady throughout the eligibility period, only
1 Although eligibility for CEIP was 36 months, it took between 2–4 months for most participants to complete their initial enrolment in the program and start working following their month of random assignment. A non-trivial portion of the sample does not have a complete month of post-program data by the time of their 40-month interview. As a result, some outcomes are presented for slightly less than 40 months.

- 25 -
decreasing slightly to 82.1 per cent in month 38. By comparison, the full-time employment rate of the control group increases rapidly in the first 8 months to 50.1 per cent, as EI entitlement is exhausted, then gradually to 52.8 per cent in month 38. The employment rate of the control group also displays a cyclical pattern reflecting some seasonality of employment. There are dips in employment at around months 10, 23 and 35. Since CEIP recruited a stock of EI claimants who were unemployed at the same time, those who were seasonally employed are likely to be unemployed at the same time in subsequent years.
The positive impact on full-time employment was sustained throughout the eligibility period, remaining above 29 percentage points through month 38.
IA Sample Among the IA sample, the rate of full-time employment of the program group peaks
at 94.6 per cent at six months. Unlike the EI sample, the full-time employment rate gradually declines throughout the eligibility period to 75.2 per cent at 38 months. The full-time employment rate of the control group increases rapidly in the first 18 months to 31 per cent, and remains relatively steady afterwards.
With the full-time employment rate of the control group remaining stable after the first 18 months, the positive impact on full-time employment is sustained throughout the eligibility period although it drops slightly following the gradual decrease in the program group full-time employment. The impact peaks in month 5 at 80.2 percentage points and declines thereafter to 47.1 percentage points in month 38.
- 26 -
Figure 3.1a: Full-Time Employment Rates, by Months from Random Assignment — EI Sample
Source: Calculations from 40-month follow-up administrative and survey data.
-20 -15 -10
-5 0 5
10 15 20 25 30 35 40 45 50 55 60 65 70 75 80 85 90 95
100
1 2 3 4 5 6 7 8 9 10 11 12 13 14 15 16 17 18 19 20 21 22 23 24 25 26 27 28 29 30 31 32 33 34 35 36 37 38
Months From Random Assignment
Program GroupControl GroupImpacts
Full-
Tim
e Em
ploy
men
t Rat
e (%
)

- 27 -
Figure 3.1b: Full-Time Employment Rates, by Months from Random Assignment — IA Sample
Source: Calculations from 40-month follow-up administrative and survey data.
The results from both EI and IA samples display two important patterns. First, full-time employment of control group members increases only in the early stage and the trend does not continue after the first 18 months. In the absence of CEIP, full-time employment rates fail to reach even 60 per cent, suggesting that sample members have difficulty in finding full-time jobs. Second, the full-time employment rate among the program group remains high throughout the eligibility period (above 80 per cent). Any concern that participants, particularly in the IA sample, would have difficulty maintaining employment does not appear warranted. But is this the case for all participants, even among those with significant barriers to employment?
Subgroups — Differences in Impacts on Employment One criticism of long-term community-based employment is that it may only benefit
the more highly employable participants. Some argue that those with significant barriers to employment will be unable to maintain community jobs for an extended three-year eligibility. For example, those who possess physical or mental health conditions that restrict activity levels can have a harder time maintaining full-time employment. In particular, community-based jobs can often require a higher degree of flexibility in terms of tasks and responsibilities, which may pose additional challenges for those with employment constraints.
-15 -10 -5 0 5
10 15 20 25 30 35 40 45 50 55 60 65 70 75 80 85 90 95
100
1 2 3 4 5 6 7 8 9 10 11 12 13 14 15 16 17 18 19 20 21 22 23 24 25 26 27 28 29 30 31 32 33 34 35 36 37 38
Months From Random Assignment
Program GroupControl GroupImpacts
Full-
Tim
e Em
ploy
men
t Rat
e (%
)

- 28 -
In order to determine if less employable participants shared equally in the employment gains attributable to CEIP, differences in impacts were assessed across various subgroups. Gyarmati et al. (2006) performed subgroup analysis over the initial 18 months of the study and found differences only among EI sample members, where program group members who were older, single and low-income were likely to experience higher full-time employment rates as a consequence of participating in CEIP. The current analysis examines subgroup differences in the impact on full-time employment in the second half of the eligibility period (months 19 to 38) and confirms that program group members who are single and low-income continue to experience larger employment impacts. In addition, CEIP appears to have a stronger effect in the later part of the eligibility period on those who would otherwise be at a disadvantage in finding and/or maintaining full-time employment. Among the EI sample, larger employment impacts are observed on program group members who had at least one health limitation as well as individuals with fewer contacts in their social networks. Among the IA sample, those with denser social networks — as well as those with a longer history of IA receipt — appear to experience somewhat larger employment impacts as well.
To illustrate the difference in impacts between two subgroups, Figures 3.2a and 3.2b compare the differences in CEIP’s impacts on those with and without an activity limitation for the EI and IA samples respectively. For both the EI and IA samples, the impact on full-time employment between the two subgroups is fairly similar in the first half of the project; however, in later stages of eligibility, beginning around month 23, CEIP’s impacts on full-time employment are consistently higher for program group members with an activity limitation. (See Appendix D for full subgroup impact estimates.)
This demonstrates that those with employment barriers are able to maintain long-duration community-based work when appropriate supports are available and suitable job placements are achieved. Furthermore, the incremental employment gains are largest among certain disadvantaged groups: in lower-income groups, those lacking social supports, and those with employment barriers that arise from activity restrictions.

- 29 -
Figure 3.2a: Impacts on Full-Time Employment Rates, by Activity Limitation — EI Sample
Source: Calculations from 40-month follow-up administrative and survey data.
Figure 3.2a: Impacts on Full-Time Employment Rates, by Activity Limitation — IA Sample
Source: Calculations from 40-month follow-up administrative and survey data
-20
-10
0
10
20
30
40
50
60
70
80
90
1 2 3 4 5 6 7 8 9 10 11 12 13 14 15 16 17 18 19 20 21 22 23 24 25 26 27 28 29 30 31 32 33 34 35 36 37 38
Months from Random Assignment
Perc
enta
ge
With Activity Limitation Without Activity Limitation
-20 -10
0 10 20 30 40 50 60 70 80 90
1 2 3 4 5 6 7 8 9 10 11 12 13 14 15 16 17 18 19 20 21 22 23 24 25 26 27 28 29 30 31 32 33 34 35 36 37 38
Months from Random Assignment
Perc
enta
ge
With Activity Limitation Without Activity Limitation

- 30 -
CEIP VERSUS NON-CEIP EMPLOYMENT Impacts of approximately 30 and 50 percentage points at the end of the eligibility
period on the EI and IA program groups, respectively, confirm that CEIP led to employment levels that were higher than what would have been achieved without the program. However, an important question concerns the extent to which the impacts on full-time employment are driven directly by CEIP jobs and whether these jobs will be sustainable in the long run.
If the participants of a public employment program perceive it as just another form of transfer payment, a lengthy program could encourage program dependency, particularly if jobs do not provide any opportunity for skill development. Many previous public employment programs were short-term (up to 12 months) to prevent such dependency. In contrast, CEIP offered up to three years of stable employment to develop social capital and improve employability.
Still, there is no simple way to measure the degree of program dependency. The best way to examine this issue is to study the long-term impacts on post-program employment and benefit receipt. However, employment of participants within the eligibility period can shed some light about potential program dependency: if few program group members are transitioning into non-CEIP jobs, it may be a sign of program dependency. As a result, there may be a marked decline in employment levels once their CEIP eligibility ends.
CEIP permitted participants to leave the program at any time without losing their eligibility, provided they did not return to EI or IA benefits as their primary source of income. Participants, therefore, were free to pursue other employment opportunities to complement or replace their CEIP earnings. Although early results revealed that most program group members were employed solely through CEIP in the first 18 months, it was expected that, in the second half of the eligibility period, an increasing percentage might utilize their work experience and begin to move into non-CEIP employment.
Figures 3.3a and 3.3b present the monthly full-time employment rates for the EI and IA sample, respectively, while illustrating the percentage of program group members in CEIP and non-CEIP jobs. The thatched area indicates the proportion of program group members who were engaged solely in CEIP employment, while the gray shaded area indicates the proportion of program group members who held only full-time, non-CEIP jobs.
EI Sample Figure 3.3a confirms that, among the EI sample, fewer than 23 per cent of program
group members were employed full-time in non-CEIP jobs in the first half of the eligibility period; this gradually increases starting in month 21, reaching over one-third of the program group (36 per cent) by 38 months. Although the overall full-time employment rate of program group members remains higher than the control group at 38 months, CEIP has resulted in a lower percentage of program group members employed in non-CEIP jobs than what would have occurred had the program not been implemented. Since such a high proportion of program group members remained in CEIP employment until the end of their eligibility, it is likely that CEIP’s impacts on full-time employment
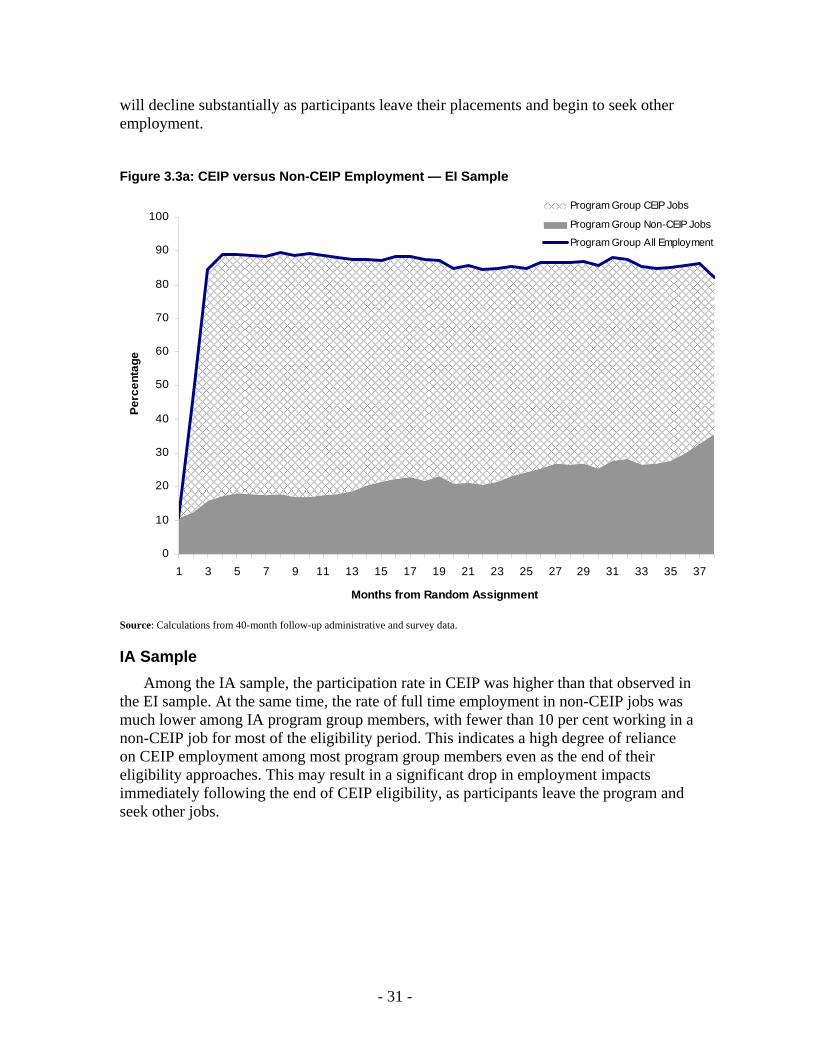
- 31 -
will decline substantially as participants leave their placements and begin to seek other employment.
Figure 3.3a: CEIP versus Non-CEIP Employment — EI Sample
0
10
20
30
40
50
60
70
80
90
100
1 3 5 7 9 11 13 15 17 19 21 23 25 27 29 31 33 35 37
Months from Random Assignment
Perc
enta
ge
Program Group CEIP Jobs
Program Group Non-CEIP Jobs
Program Group All Employment
Source: Calculations from 40-month follow-up administrative and survey data.
IA Sample Among the IA sample, the participation rate in CEIP was higher than that observed in
the EI sample. At the same time, the rate of full time employment in non-CEIP jobs was much lower among IA program group members, with fewer than 10 per cent working in a non-CEIP job for most of the eligibility period. This indicates a high degree of reliance on CEIP employment among most program group members even as the end of their eligibility approaches. This may result in a significant drop in employment impacts immediately following the end of CEIP eligibility, as participants leave the program and seek other jobs.
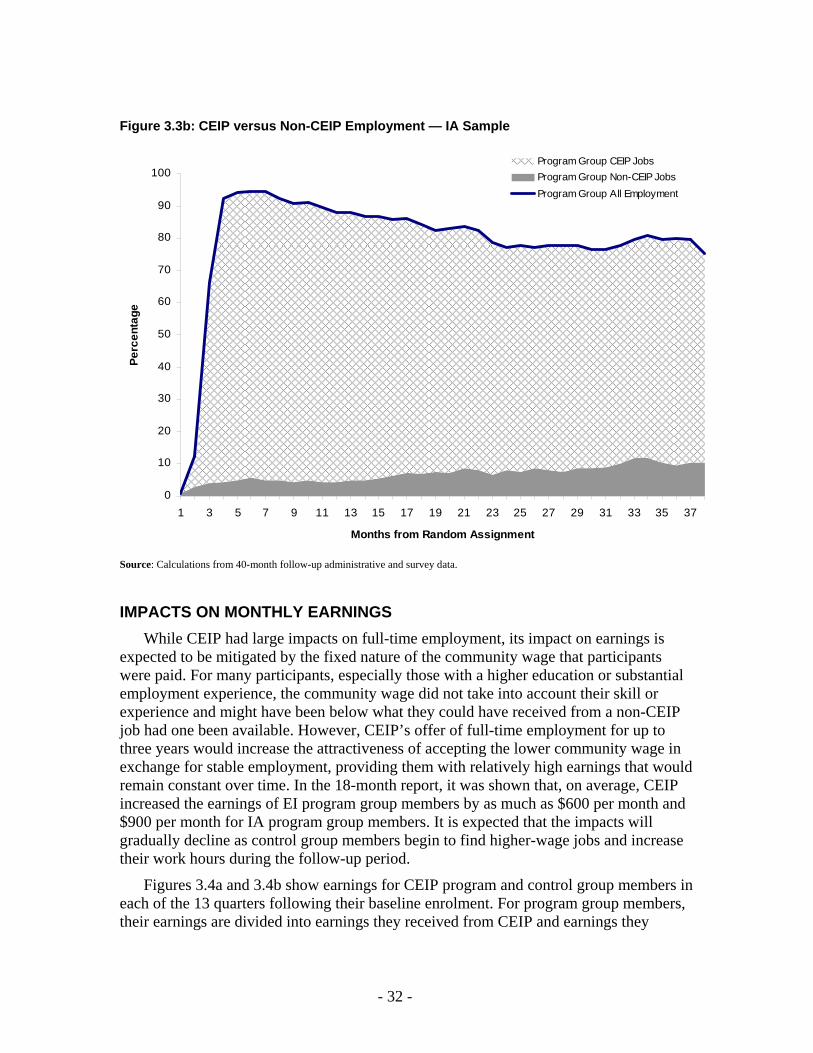
- 32 -
Figure 3.3b: CEIP versus Non-CEIP Employment — IA Sample
0
10
20
30
40
50
60
70
80
90
100
1 3 5 7 9 11 13 15 17 19 21 23 25 27 29 31 33 35 37
Months from Random Assignment
Perc
enta
ge
Program Group CEIP JobsProgram Group Non-CEIP JobsProgram Group All Employment
Source: Calculations from 40-month follow-up administrative and survey data.
IMPACTS ON MONTHLY EARNINGS While CEIP had large impacts on full-time employment, its impact on earnings is
expected to be mitigated by the fixed nature of the community wage that participants were paid. For many participants, especially those with a higher education or substantial employment experience, the community wage did not take into account their skill or experience and might have been below what they could have received from a non-CEIP job had one been available. However, CEIP’s offer of full-time employment for up to three years would increase the attractiveness of accepting the lower community wage in exchange for stable employment, providing them with relatively high earnings that would remain constant over time. In the 18-month report, it was shown that, on average, CEIP increased the earnings of EI program group members by as much as $600 per month and $900 per month for IA program group members. It is expected that the impacts will gradually decline as control group members begin to find higher-wage jobs and increase their work hours during the follow-up period.
Figures 3.4a and 3.4b show earnings for CEIP program and control group members in each of the 13 quarters following their baseline enrolment. For program group members, their earnings are divided into earnings they received from CEIP and earnings they
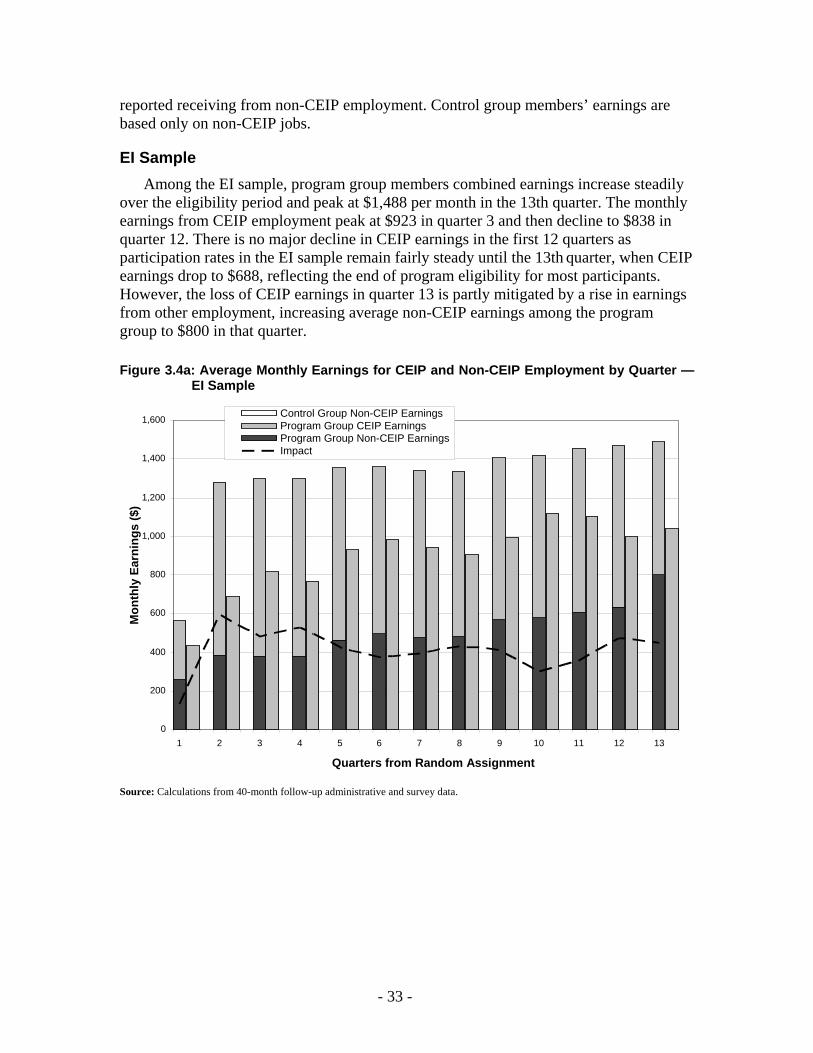
- 33 -
reported receiving from non-CEIP employment. Control group members’ earnings are based only on non-CEIP jobs.
EI Sample Among the EI sample, program group members combined earnings increase steadily
over the eligibility period and peak at $1,488 per month in the 13th quarter. The monthly earnings from CEIP employment peak at $923 in quarter 3 and then decline to $838 in quarter 12. There is no major decline in CEIP earnings in the first 12 quarters as participation rates in the EI sample remain fairly steady until the 13th quarter, when CEIP earnings drop to $688, reflecting the end of program eligibility for most participants. However, the loss of CEIP earnings in quarter 13 is partly mitigated by a rise in earnings from other employment, increasing average non-CEIP earnings among the program group to $800 in that quarter.
Figure 3.4a: Average Monthly Earnings for CEIP and Non-CEIP Employment by Quarter — EI Sample
Source: Calculations from 40-month follow-up administrative and survey data.
0
200
400
600
800
1,000
1,200
1,400
1,600
1 2 3 4 5 6 7 8 9 10 11 12 13
Quarters from Random Assignment
Mon
thly
Ear
ning
s ($
)
Control Group Non-CEIP EarningsProgram Group CEIP EarningsProgram Group Non-CEIP EarningsImpact

- 34 -
IA Sample Among the IA sample members, CEIP continues to have a dramatic impact on the
earnings of the program members. The average monthly non-CEIP earnings of the program group members are growing slightly from $41 in quarter 1 to $210 in quarter 12, consistently less than half of the earnings of the control group. Control group members’ earnings are relatively low, but they increase substantially in the first six quarters and plateau at just over $400 per month. Program group members’ monthly earnings from CEIP employment jump to $1,031 in the second quarter and remain at roughly $1,000 for the rest of the eligibility period. The combined earnings of IA sample program group members peak much earlier than that of the EI sample at $1,182 per month in the third quarter and remain steady at approximately $1,100. As a result, the impact on earnings is sustained at approximately $650 per month for the remainder of the eligibility period.
Figure 3.4b: Average Monthly Earnings for CEIP and Non-CEIP Employment by Quarter — IA Sample
Source: Calculations from 40-month follow-up administrative and survey data.
Tables 3.1 and 3.2 present quarterly estimates summarizing the impacts on CEIP and non-CEIP employment and earnings through the first 13 quarters of the study. These results confirm that CEIP participation has replaced some market employment that the program group would otherwise have pursued. This result was to be expected, since CEIP
0
200
400
600
800
1,000
1,200
1,400
1,600
1 2 3 4 5 6 7 8 9 10 11 12 13
Quarters from Random Assignment
Mon
thly
Ear
ning
s ($
)
Control Group Non-CEIP EarningsProgram Group CEIP EarningsProgram Group Non-CEIP EarningsImpact

- 35 -
offered stable and full-time employment for three years. Many participants would have been less inclined to pursue market employment while engaged in the project. It is anticipated that the increased experience and employment contacts that participants may receive through CEIP will lead to better jobs and improved employment outcomes in the longer term. Nonetheless, the fact that non-CEIP employment has been significantly reduced may result in a marked decline in future employment rates among the program group, at least in the immediate period following the end of eligibility, before many have transitioned into other market employment. These longer-term post-program impacts will be examined in a future report with data collected in a third follow-up survey at 54 months, which is over a year after the end of CEIP eligibility.
Table 3.1: Impacts on CEIP and Non-CEIP Employment — EI Sample
Program Standard Program Control Difference StandardOutcome Group Error Group Group (Impact) ErrorFull-time employment rate (%)Quarter 1 37.0 *** (1.3) 12.7 25.5 -12.8 *** (2.5)Quarter 2 75.4 *** (2.1) 17.3 37.0 -19.7 *** (2.8)Quarter 3 74.9 *** (2.1) 16.9 45.0 -28.1 *** (2.9)Quarter 4 75.1 *** (2.1) 16.9 43.7 -26.7 *** (2.9)Quarter 5 71.7 *** (2.2) 19.6 49.1 -29.5 *** (2.9)Quarter 6 69.4 *** (2.2) 21.8 52.1 -30.4 *** (3.0)Quarter 7 68.2 *** (2.3) 21.8 52.5 -30.7 *** (2.9)Quarter 8 67.1 *** (2.3) 21.8 47.5 -25.6 *** (3.0)Quarter 9 65.0 *** (2.3) 25.6 51.3 -25.8 *** (3.1)Quarter 10 63.8 *** (2.4) 26.4 56.3 -29.9 *** (3.1)Quarter 11 63.6 *** (2.3) 27.6 55.4 -27.8 *** (3.1)Quarter 12 62.0 *** (2.4) 28.3 50.3 -22.1 *** (3.1)Quarter 13 57.6 *** (2.4) 34.2 52.0 -17.7 *** (3.3)Average earnings ($/month)Quarter 1 306.9 *** (13.3) 257.7 436.0 -178.3 *** (51.5)Quarter 2 899.2 *** (26.1) 383.2 690.3 -307.1 *** (68.9)Quarter 3 923.2 *** (26.6) 377.1 818.3 -441.2 *** (68.2)Quarter 4 919.9 *** (26.7) 377.5 769.5 -392.0 *** (65.5)Quarter 5 890.9 *** (27.8) 464.1 928.6 -464.5 *** (77.3)Quarter 6 866.8 *** (28.9) 493.1 986.1 -493.0 *** (70.2)Quarter 7 863.7 *** (29.6) 476.6 945.4 -468.8 *** (65.2)Quarter 8 854.8 *** (30.0) 483.2 907.3 -424.1 *** (70.6)Quarter 9 837.7 *** (30.7) 569.6 994.3 -424.8 *** (77.8)Quarter 10 842.6 *** (31.6) 577.7 1,120.3 -542.6 *** (74.7)Quarter 11 852.3 *** (32.1) 606.0 1,103.4 -497.4 *** (75.9)Quarter 12 838.2 *** (32.6) 633.1 997.8 -364.7 *** (74.3)Quarter 13 688.2 *** (30.2) 800.2 1,039.6 -239.4 *** (91.0)Sample size (total = 851) 441 410
CEIP Employment Non-CEIP Employment
Source: Calculations from 40-month follow-up survey and administrative data. Notes: The estimates for each quarter are calculated by averaging the three months within a quarter. Two-tailed t-tests were applied to differences between the outcomes for the program and control groups. Statistical significance levels are indicated as: * = 10 per cent; ** = 5 per cent; *** = 1 per cent. Rounding may cause slight discrepancies in sums and differences. “Full-time employment” is defined as working on average 30 or more hours per week during a calendar month.

- 36 -
Table 3.2: Impacts on CEIP and Non-CEIP Employment — IA Sample
Program Standard Program Control Difference StandardOutcome Group Error Group Group (Impact) ErrorFull-time employment rate (%)Quarter 1 23.8 *** (1.4) 2.5 8.1 -5.6 *** (2.0)Quarter 2 88.1 *** (2.2) 4.9 13.8 -8.8 *** (2.7)Quarter 3 86.7 *** (2.3) 4.6 20.2 -15.6 *** (3.0)Quarter 4 84.0 *** (2.5) 4.4 23.4 -18.9 *** (3.1)Quarter 5 81.3 *** (2.6) 4.9 22.6 -17.6 *** (3.1)Quarter 6 77.9 *** (2.8) 6.7 28.0 -21.4 *** (3.5)Quarter 7 77.3 *** (2.8) 7.8 29.2 -21.4 *** (3.5)Quarter 8 74.1 *** (3.0) 7.6 27.0 -19.4 *** (3.5)Quarter 9 71.6 *** (3.1) 8.1 26.5 -18.4 *** (3.5)Quarter 10 71.1 *** (3.1) 8.3 27.4 -19.1 *** (3.6)Quarter 11 69.7 *** (3.2) 10.3 31.0 -20.7 *** (3.7)Quarter 12 71.3 *** (3.1) 10.6 29.7 -19.1 *** (3.7)Quarter 13 70.0 *** (3.2) 10.5 27.9 -17.4 *** (3.6)Average earnings ($/month)Quarter 1 187.0 *** (14.3) 41.2 134.8 -93.6 ** (42.8)Quarter 2 1,031.3 *** (28.0) 85.2 210.7 -125.6 ** (50.7)Quarter 3 1,068.6 *** (30.9) 113.6 309.2 -195.6 *** (67.1)Quarter 4 1,025.8 *** (33.5) 105.0 377.9 -272.9 *** (68.5)Quarter 5 1,010.8 *** (35.7) 116.4 403.4 -286.9 *** (71.2)Quarter 6 981.2 *** (38.0) 138.2 480.7 -342.6 *** (75.1)Quarter 7 983.8 *** (38.0) 165.5 430.2 -264.7 *** (70.0)Quarter 8 960.3 *** (40.8) 144.2 421.5 -277.3 *** (55.5)Quarter 9 954.5 *** (42.9) 145.7 413.5 -267.7 *** (56.8)Quarter 10 960.2 *** (43.7) 159.2 433.1 -273.9 *** (59.2)Quarter 11 961.3 *** (45.0) 189.7 488.3 -298.5 *** (62.1)Quarter 12 970.6 *** (44.6) 209.7 466.7 -257.1 *** (62.8)Quarter 13 939.4 *** (43.6) 186.2 470.0 -283.7 *** (60.6)Sample size (total = 411) 210 201
CEIP Employment Non-CEIP Employment
Source: Calculations from 40-month follow-up survey and administrative data. Notes: The estimates for each quarter are calculated by averaging the three months within a quarter. Two-tailed t-tests were applied to differences between the outcomes for the program and control groups. Statistical significance levels are indicated as: * = 10 per cent; ** = 5 per cent; *** = 1 per cent. Rounding may cause slight discrepancies in sums and differences. “Full-time employment” is defined as working on average 30 or more hours per week during a calendar month.

- 37 -
CUMULATIVE MEASURES OF CEIP’S EMPLOYMENT IMPACTS An alternative way to look at CEIP’s impact on employment and earnings is to
examine its cumulative effect over the entire eligibility period rather than its impact at one particular point in time. Cumulative impact estimates provide a measure of the “full” effect of CEIP, accounting for the sum total of the incremental financial resources and work experience that CEIP provided participants throughout its operational phase. CEIP’s cumulative impacts on employment and earnings over the first 38 months are shown in Table 3.3. Impacts are first shown for CEIP earnings only, then for market employment (non-CEIP) earnings, and finally for combined earnings from both CEIP and non-CEIP employment. The cumulative impacts echo the results from monthly estimates. Overall, CEIP increased participants’ hours of work and earnings significantly through CEIP employment. However, CEIP employment did substitute for some market employment as shown in the decrease in hours, earnings and duration of non-CEIP employment among program group members, particularly among the EI sample.
Table 3.3: Cumulative Impacts on Earnings, Hours and Months with Employment During Months 1 to 38
EI Sample IA SampleProgram Control Standard Program Control Standard
Cumulative Outcome Group Group Error Group Group Error
Cumulative EarningsCEIP Earnings 31,065 0 31,065 *** (935.6) 35,165 0 35,165 *** (1171.0)Non-CEIP Earnings 19,024 35107 -16,084 *** (1961.1) 5,268 15,315 -10,047 *** (1807.4)Total Earnings 50,086 35107 14,979 *** (1742.8) 40,430 15,315 25,115 *** (1929.5)
Cumulative HoursCEIP Hours 3,592 0 3,592 *** (107.6) 3,981 0 3,981 *** (131.2)Non-CEIP Hours 1,594 3319 -1,726 *** (147.0) 563 1,784 -1,220 *** (170.8)Total Hours 5,183 3319 1,864 *** (134.9) 4,544 1,784 2,760 *** (193.1)
Cumulative Months with EmploymentMonths with CEIP Employment 25.0 0 25.0 *** (0.7) 27.7 0.0 27.7 *** (0.9)Months with Non-CEIP Employment 11.2 22 -11.0 *** (0.9) 4.4 13.2 -8.8 *** (1.1)Total Months with Any Employment 32.4 22 10.2 *** (0.7) 30.1 13.2 16.9 *** (1.1)
Sample size 441 409 210 199
Difference(Impact)
Difference(Impact)
Source: Calculations from the 40-month survey and administrative data. Notes: Sample sizes vary for individual measures because of missing values. This may cause slight discrepancies in sums and
differences. All analyses were only for those who responded to the 40-month survey. Two-tailed t-tests were applied to differences in outcomes between the program and control groups. Statistical significance
levels are indicated as: * = 10 per cent; ** = 5 per cent; *** = 1 per cent. Rounding may cause slight discrepancies in sums and differences.

- 38 -
EI Sample The cumulative outcomes for both samples show that CEIP had large, significant
impacts on program group members’ earnings, hours and months of employment. Among the EI sample, CEIP paid program group members on average a total of $31,065 in earnings (average of $818 per month) for 3,592 hours of employment (or 95 hours per month) in CEIP projects over 38 months, leading to a cumulative impact of $14,979 in earnings ($394 per month) for 1,864 additional hours of employment (49 hours per month) over the 38-month period.
The bottom panel of outcomes estimates CEIP’s impact on the number of months in which the individual had at least one dollar in earnings. Although CEIP participants are eligible for stable full-time community employment for three years, the incremental effect on the period of employment is less than 36 months. As shown in the table, control group members on average worked 22.2 months. Program group members had on average 25 months where they reported at least one dollar in earnings from CEIP and 11.2 fewer months in which they worked in a non-CEIP job. Overall, CEIP increased employment over the 38-month period by 10.2 months on average.
IA Sample The extent to which IA sample members had greater levels of participation in the
CEIP project than EI sample members is evident in their cumulative impacts, as CEIP paid on average $35,165 in earnings (or $925 per month) over the 38-month period. Since the control group in the IA sample worked fewer hours than their EI counterparts, CEIP displaced less market-based employment for IA program group members. CEIP’s cumulative impact on program group members’ earnings was $25,115 over 38 months, or $661 per month, while its cumulative impact on hours was 2,760, or 73 additional hours of employment per month over the period. Overall, CEIP increased IA sample members’ total months with employment by 16.9 months on average over the course of the program’s operations.
IMPACTS ON WAGES AND HOURS OF WORK Since the community wage paid by CEIP was fixed at a set rate for all participants,
regardless of skill or experience, and participants were expected to participate in CEIP work or other approved projects for 35 hours per week, one expectation is that CEIP might lower average wages for more employable participants while increasing wages and hours for participants with a lesser degree of attachment to the labour market. Gyarmati et al. (2006) found that CEIP led to increased wages and hours worked among the IA sample, measured near the mid-point of CEIP eligibility. Among the EI sample, while it increased wages and hours worked for a majority of program group members, it did reduce them for a significant proportion who would have received higher wages or worked more hours per week if they had not participated in CEIP.
Table 3.4 shows the estimated impact of CEIP on the overall distribution of hourly wages and hours worked per week from both CEIP and non-CEIP employment during a typical month of the project’s operation in the second half of the eligibility period.

- 39 -
Overall, CEIP’s impacts on wages and hours worked remain consistent with the 18-month findings.
Among the EI sample, CEIP increased the percentage of program group members who had a wage of $2–$3 above the minimum wage (by 45.2 percentage points) and who worked full-time at 35 hours per week (by 33.7 percentage points) compared to the control group. This was driven largely by a decrease in the percentage of those who did not work (by 23.2 percentage points) and those who would have worked but at lower wages (by 10.1 percentage points) and with fewer hours (by 10.1 percentage points). However, CEIP also led to a decrease in the percentage of program group members receiving higher wages, particularly at $6 or more above minimum wage (by 8 percentage points). There was also a reduction of 13.3 percentage points of program group members who worked between 40–44 hours per week. Compared to results observed at 18 months, program group members made some wage gains in the latter half of the project, mitigating the extent to which CEIP reduced the percentage of higher wage earnings.
Among the IA sample, CEIP increased the percentage of program group members who had a wage of $2–3 above minimum by 57.4 percentage points compared to the control group. Again, this was driven largely by decreasing the percentage who did not work (by 35.7 per cent) and those who would have worked but at lower wages (by 12.2 per cent). There were no negative impacts on the percentage of higher wage earners among the IA sample, although fewer were working between 36–44 hours per week (by 14.6 percentage points).
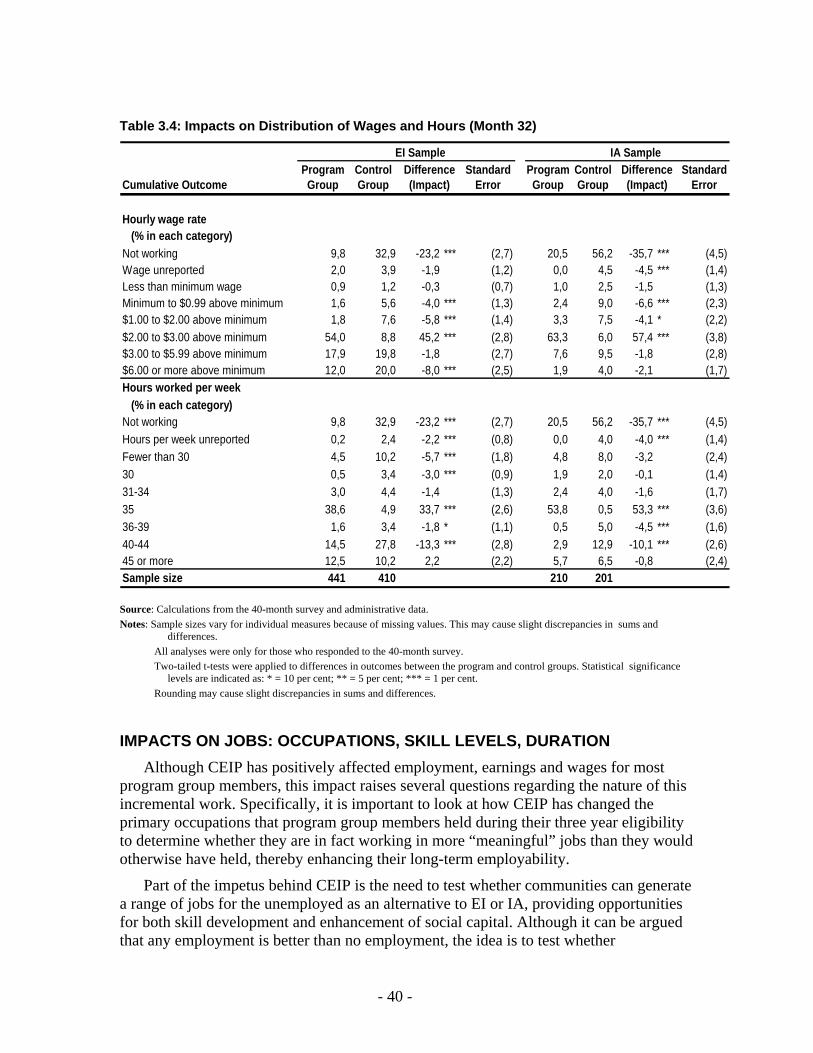
- 40 -
Table 3.4: Impacts on Distribution of Wages and Hours (Month 32)
EI Sample IA SampleProgram Control Standard Program Control Standard
Cumulative Outcome Group Group Error Group Group Error
Hourly wage rate (% in each category)Not working 9,8 32,9 -23,2 *** (2,7) 20,5 56,2 -35,7 *** (4,5)Wage unreported 2,0 3,9 -1,9 (1,2) 0,0 4,5 -4,5 *** (1,4)Less than minimum wage 0,9 1,2 -0,3 (0,7) 1,0 2,5 -1,5 (1,3)Minimum to $0.99 above minimum 1,6 5,6 -4,0 *** (1,3) 2,4 9,0 -6,6 *** (2,3)$1.00 to $2.00 above minimum 1,8 7,6 -5,8 *** (1,4) 3,3 7,5 -4,1 * (2,2)$2.00 to $3.00 above minimum 54,0 8,8 45,2 *** (2,8) 63,3 6,0 57,4 *** (3,8)$3.00 to $5.99 above minimum 17,9 19,8 -1,8 (2,7) 7,6 9,5 -1,8 (2,8)$6.00 or more above minimum 12,0 20,0 -8,0 *** (2,5) 1,9 4,0 -2,1 (1,7)Hours worked per week (% in each category)Not working 9,8 32,9 -23,2 *** (2,7) 20,5 56,2 -35,7 *** (4,5)Hours per week unreported 0,2 2,4 -2,2 *** (0,8) 0,0 4,0 -4,0 *** (1,4)Fewer than 30 4,5 10,2 -5,7 *** (1,8) 4,8 8,0 -3,2 (2,4)30 0,5 3,4 -3,0 *** (0,9) 1,9 2,0 -0,1 (1,4)31-34 3,0 4,4 -1,4 (1,3) 2,4 4,0 -1,6 (1,7)35 38,6 4,9 33,7 *** (2,6) 53,8 0,5 53,3 *** (3,6)36-39 1,6 3,4 -1,8 * (1,1) 0,5 5,0 -4,5 *** (1,6)40-44 14,5 27,8 -13,3 *** (2,8) 2,9 12,9 -10,1 *** (2,6)45 or more 12,5 10,2 2,2 (2,2) 5,7 6,5 -0,8 (2,4)Sample size 441 410 210 201
Difference(Impact)
Difference(Impact)
Source: Calculations from the 40-month survey and administrative data. Notes: Sample sizes vary for individual measures because of missing values. This may cause slight discrepancies in sums and
differences. All analyses were only for those who responded to the 40-month survey. Two-tailed t-tests were applied to differences in outcomes between the program and control groups. Statistical significance
levels are indicated as: * = 10 per cent; ** = 5 per cent; *** = 1 per cent. Rounding may cause slight discrepancies in sums and differences.
IMPACTS ON JOBS: OCCUPATIONS, SKILL LEVELS, DURATION Although CEIP has positively affected employment, earnings and wages for most
program group members, this impact raises several questions regarding the nature of this incremental work. Specifically, it is important to look at how CEIP has changed the primary occupations that program group members held during their three year eligibility to determine whether they are in fact working in more “meaningful” jobs than they would otherwise have held, thereby enhancing their long-term employability.
Part of the impetus behind CEIP is the need to test whether communities can generate a range of jobs for the unemployed as an alternative to EI or IA, providing opportunities for both skill development and enhancement of social capital. Although it can be argued that any employment is better than no employment, the idea is to test whether

- 41 -
“meaningful” jobs — some possibly higher-skilled — can be generated through the social economy with minimal capital investment.
Impacts on Occupation Types Table 3.5 presents the impact of CEIP on the types of occupations in the main job
(defined as the longest-held job since enrolment in the study) held by program group members since their enrolment in the study. The top of the table shows that a higher percentage of program group members than control group members worked in the 40 months since enrolment.
Table 3.5: Impacts on Occupation Type of Main Job During Months 1 to 40
EI Sample IA SampleProgram Control Standard Program Control Standard
Outcome Group Group Error Group Group Error
Employment in months 1 to 40Did not work 3.6 9.3 -5.6 *** (1.7) 4.3 27.9 -23.6 *** (3.4)Worked 96.4 90.7 5.6 *** (1.7) 95.7 72.1 23.6 *** (3.4)
Occupation typeBusiness, finance and administration 18.4 14.6 3.7 (2.6) 11.4 11.4 0.0 (3.1)Natural and applied sciences and related 6.1 4.1 2.0 (1.5) 2.4 1.0 1.4 (1.3)Health 2.9 4.6 -1.7 (1.3) 1.4 3.5 -2.1 (1.5)Social science, education, government service and religion 7.3 2.7 4.6 *** (1.5) 11.4 2.5 8.9 *** (2.5)Art, culture, recreation and sport 4.5 1.2 3.3 *** (1.2) 2.4 1.0 1.4 (1.3)Sales and service 34.7 34.9 -0.2 (3.3) 41.4 38.8 2.6 (4.8)Trades, transport and equipment operators and related 17.2 16.1 1.1 (2.6) 17.6 6.0 11.6 *** (3.2)Unique to primary industry 1.8 4.9 -3.1 ** (1.2) 7.6 1.5 6.1 *** (2.1)Unique to processing, manufacturing and utilities 3.4 7.6 -4.2 *** (1.5) 0.0 6.5 -6.5 *** (1.7)
Sample size 441 410 210 201
Impact Impact
Source: Calculations from the 40-month survey data. Notes: Sample sizes vary for individual measures because of missing values. This may cause slight discrepancies in sums and
differences. All analyses were only for those who responded to the 40-month survey. Two-tailed t-tests were applied to differences in outcomes between the program and control groups. Statistical significance
levels are indicated as: * = 10 per cent; ** = 5 per cent; *** = 1 per cent. Rounding may cause slight discrepancies in sums and differences.
The bottom part of the table shows that the distribution of jobs across the first-digit NOC appears quite similar for program and control groups in both the EI and IA samples. About one half of all main jobs were in Sales and Service occupations (NOC6) and Business, Finance, and Administrative positions (NOC1) for both the program and control groups, suggesting that CEIP led to a range of occupations broadly similar to what would occur in the absence of the program. However, CEIP reduced the percentage of program group members who never worked within the eligibility period since enrolment by 6 percentage points among the EI sample and by a striking 24 percentage points among the IA sample. Therefore, impacts on occupational types in many cases represent a movement from unemployment into a new occupation rather than a switch from one type of job to another, especially among the IA sample.

- 42 -
Among the EI sample, CEIP increased the percentage of program group members with main occupations in Social Science, Education, and Religion (NOC4) and Arts, Culture, Recreation, and Sport (NOC5) by 8 percentage points. There was an accompanying decrease of about 7 percentage points in program group members working in occupations unique to Primary Industries (NOC8) and Processing, Manufacturing and Utilities (NOC9), indicating a small shift away from these fields. Similarly, among the IA sample, CEIP increased the percentage of program group members with main occupations in Social Science, Education, and Religion (NOC4) by 9 percentage points. Similar to the EI sample, there was a 6.5 percentage point decrease among program group members working in Processing, Manufacturing, and Utilities. However, there was also an 18 percentage point increase among those with main jobs in Trades, Transport and Equipment Operators (NOC7) and Primary industries. Unlike the EI sample, these findings are entirely reflective of a shift from unemployment into these occupations rather than a shift away from particular job types. Overall, these results indicate that CEIP jobs are not too different from the occupations participants would have had worked in the absence of CEIP.
Impacts on Job Skill Levels In addition to the type of occupations that program group members held, of critical
interest is CEIP’s impact on the skill level of their jobs. Are more program group members working in higher-skilled positions, which might enhance their longer-term employability? Table 3.6 presents the impact of CEIP on the distribution of program group members with a main job in the second-digit NOC categories, which reflect a particular skill level for a given occupation. Categories have been grouped according to high-skilled and management (management, professional and positions requiring college education2), medium-skilled (intermediate position requiring high school education), and low-skilled occupations (elemental position requiring less than high school education).
Among the EI sample, CEIP increased the percentage of program group members with main jobs in both low-skilled (9.4 percentage point increase) and high-skilled and management positions (9.4 percentage point increase) when compared to the control group. There are accompanying decreases in the percentage who did not work (5.6 percentage points) and those who held medium-skilled positions (13.2 percentage points). Among the IA sample, CEIP had the largest impact on low-skilled positions, increasing the percentage of program group members with low-skilled jobs by 28.2 percentage points, followed by a decrease in the percentage who did not work (by 23.6 percentage point). CEIP also increased program group members’ employment in high-skilled and management positions by 11.4 percentage points and decreased those who held medium-skilled positions by 16.1 percentage points.
2 The National Occupation Classification assigns management occupation to a unique skill level that is not comparable to other skill levels. However, management occupations are combined with higher-skill occupations in this analysis due to the small cell size (less than 2.5 per cent of EI sample and 1 per cent of IA sample) in data.

- 43 -
Table 3.6: Impacts on Skill Level of Main Job During Months 1 to 40
EI Sample IA SampleProgram Control Standard Program Control Standard
Outcome Group Group Error Group Group Error
Skill levelHigh-skilled
Management, professional, college 33.6 24.1 9.4 *** (3.1) 22.4 10.9 11.4 *** (3.7)
Medium-skilled High school Required 25.9 39.0 -13.2 *** (3.2) 14.8 30.8 -16.1 *** (4.1)
Low-skilled 37.0 27.6 9.4 *** (3.2) 58.6 30.3 28.2 *** (4.7)`
Did not work 3.6 9.3 -5.6 *** (1.7) 4.3 27.9 -23.6 *** (3.4)
Sample size 441 410 210 201
Impact Impact
Source: Calculations from the 40-month survey data. Notes: Sample sizes vary for individual measures because of missing values. This may cause slight discrepancies in sums and
differences. All analyses were only for those who responded to the 40-month survey. Two-tailed t-tests were applied to differences in outcomes between the program and control groups. Statistical significance
levels are indicated as: * = 10 per cent; ** = 5 per cent; *** = 1 per cent. Rounding may cause slight discrepancies in sums and differences.
In most cases, the changes in the distribution of the skill level of program group members’ main jobs likely reflect a shift from unemployment to low-skilled jobs and from medium-skilled to higher-skilled occupations. However, given the relative magnitude of these impacts, CEIP has likely led to a small increase in the proportion of program group members working in lower-skilled jobs at the expense of medium-skilled positions. The small reduction in the percentage of program group members receiving higher wage rates, discussed above, would seem to confirm this finding. Overall, these results demonstrate that CEIP has been successful not only in increasing employment, but in shifting some program group members into occupations that are higher skilled than jobs they would have otherwise held.
Number of Jobs Held and Impacts on Job Durations In addition to the occupation types and skill levels, CEIP is expected to have
influenced the number of positions and the duration of jobs that program group members held. The idea was for CEIP to provide varied job opportunities to enhance both skills and social networks, while at the same time providing longer-term employment stability. This was actively encouraged through participant management and job-matching. The success of these efforts can be measured by the extent to which program group members held multiple jobs over the course of their eligibility, and whether balance was achieved, by providing significantly increased job duration in their main occupation.
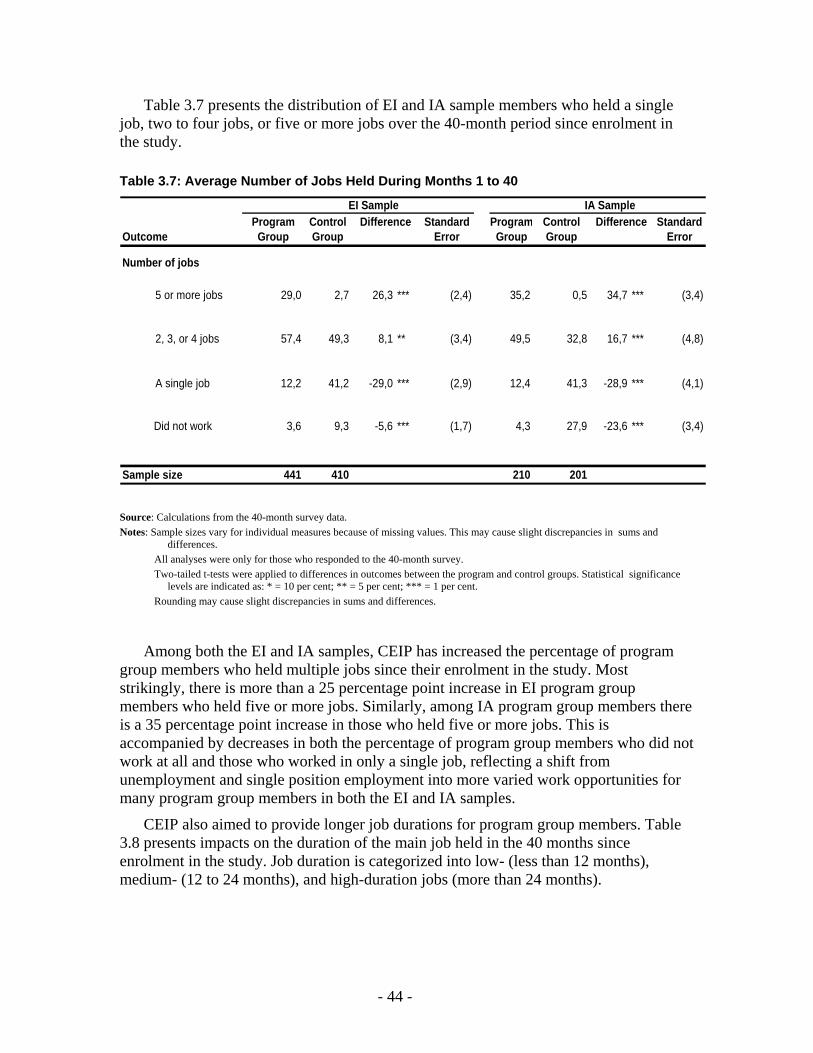
- 44 -
Table 3.7 presents the distribution of EI and IA sample members who held a single job, two to four jobs, or five or more jobs over the 40-month period since enrolment in the study.
Table 3.7: Average Number of Jobs Held During Months 1 to 40
EI Sample IA SampleProgram Control Standard Program Control Standard
Outcome Group Group Error Group Group Error
Number of jobs
5 or more jobs 29,0 2,7 26,3 *** (2,4) 35,2 0,5 34,7 *** (3,4)
2, 3, or 4 jobs 57,4 49,3 8,1 ** (3,4) 49,5 32,8 16,7 *** (4,8)
A single job 12,2 41,2 -29,0 *** (2,9) 12,4 41,3 -28,9 *** (4,1)
Did not work 3,6 9,3 -5,6 *** (1,7) 4,3 27,9 -23,6 *** (3,4)
Sample size 441 410 210 201
Difference Difference
Source: Calculations from the 40-month survey data. Notes: Sample sizes vary for individual measures because of missing values. This may cause slight discrepancies in sums and
differences. All analyses were only for those who responded to the 40-month survey. Two-tailed t-tests were applied to differences in outcomes between the program and control groups. Statistical significance
levels are indicated as: * = 10 per cent; ** = 5 per cent; *** = 1 per cent. Rounding may cause slight discrepancies in sums and differences.
Among both the EI and IA samples, CEIP has increased the percentage of program group members who held multiple jobs since their enrolment in the study. Most strikingly, there is more than a 25 percentage point increase in EI program group members who held five or more jobs. Similarly, among IA program group members there is a 35 percentage point increase in those who held five or more jobs. This is accompanied by decreases in both the percentage of program group members who did not work at all and those who worked in only a single job, reflecting a shift from unemployment and single position employment into more varied work opportunities for many program group members in both the EI and IA samples.
CEIP also aimed to provide longer job durations for program group members. Table 3.8 presents impacts on the duration of the main job held in the 40 months since enrolment in the study. Job duration is categorized into low- (less than 12 months), medium- (12 to 24 months), and high-duration jobs (more than 24 months).

- 45 -
Table 3.8: Impacts on Duration of Main Job During Months 1 to 40
EI Sample IA SampleProgram Control Standard Program Control Standard
Outcome Group Group Error Group Group Error
Job durationHigh
More than 24 months 52.6 46.6 6.0 * (3.4) 42.4 23.9 18.5 *** (4.6)
Medium 12 to 24 months 37.6 29.0 8.6 *** (3.2) 42.4 16.9 25.5 *** (4.4)
LowLess than 12 months 7.9 16.3 -8.4 *** (2.2) 12.4 33.3 -21.0 *** (4.0)
Did not work 3.6 9.3 -5.6 *** (1.7) 4.3 27.9 -23.6 *** (3.4)
Sample size 441 410 210 201
Impact Impact
Source: Calculations from the 40-month survey data. Notes: Sample sizes vary for individual measures because of missing values. This may cause slight discrepancies in sums and
differences. All analyses were only for those who responded to the 40-month survey. Two-tailed t-tests were applied to differences in outcomes between the program and control groups. Statistical significance
levels are indicated as: * = 10 per cent; ** = 5 per cent; *** = 1 per cent. Rounding may cause slight discrepancies in sums and differences.
Among both the EI and IA samples, CEIP has decreased the percentage of program group members who did not work and who worked in low-duration jobs. Among the EI sample, CEIP shifted workers into primarily medium-duration positions (8.6 percentage point impact), and, to a lesser extent, high-duration jobs. However, among the IA sample, there is a dramatic shift from unemployment and low-duration jobs into both medium- and high-duration jobs (25.5 and 18.5 percentage point impact, respectively). Thus for many participants, CEIP was able to achieve a balance between encouraging multiple work opportunities while increasing the duration of the primary position they held during their participation in the project.
SUMMARY During the course of its operations, CEIP was effective in increasing the full-time
employment rates and average monthly earnings of both EI and IA program group members. Despite providing a fixed wage to participants, CEIP also had an overall positive effect on program group members’ wages, while increasing their weekly hours of work. CEIP was not only successful in increasing employment, but also in shifting some program group members into higher-skilled jobs than what they would have otherwise held. In addition, CEIP has increased the percentage of program group

- 46 -
members who held multiple jobs over the course of their eligibility, thereby offering more varied work opportunities. The duration of the primary job held was also improved, and a balance was struck between varied experience and job stability for participants.
- 47 -
Chapter 4: Impacts on Income, Hardship, and Well-Being
The Community Employment Innovation Project (CEIP) significantly increased the earnings of program group members during their eligibility period by providing three years of stable employment. At the same time, they were required to give up their Employment Insurance (EI) or income assistance (IA) benefits in order to remain eligible for the program. As a result, the incomes of program group members are not expected to increase as much as the CEIP earnings they received. Furthermore, full-time employment of participants could also affect their spouses’ or other family members’ labour force participation or other income sources. For example, the added income from CEIP might relieve pressure on participants’ family members to work. It might also incite other family members to work as CEIP earnings disqualify the household from IA entitlement and increase the opportunity cost of non-working for all family members. In order to determine how CEIP affected the total household income of program group members, it is important to examine the loss in payments from EI or IA, along with any changes in household composition and family members’ working decisions that arise as a result of CEIP.
Income is just one dimension of CEIP’s possible effect on the living conditions of participants and their families. CEIP’s impact on their income stream alone could lead to changes in financial status, poverty, hardship, and health and well-being. To appreciate CEIP’s effects, it is important to examine these additional dimensions of participants’ and their families’ living conditions.
IMPACTS ON EI AND IA RECEIPT To be selected for CEIP, both the EI and IA sample members had to have received
benefits in the month of their sample selection, and EI sample members had to have entitlement left on their claim. IA benefits are determined by household composition and the recipients are paid at a consistent rate. Regular EI benefit entitlement is determined by the applicant’s work history and rate of unemployment in the region he or she lives. Both IA and EI benefits are affected by earnings received by the beneficiary.
CEIP significantly increased program group members’ earnings, thus affecting their eligibility to claim EI benefits and the amount of IA benefits they could have received. Participants were informed that if they returned to either regular EI benefits or basic IA benefits, they would no longer be eligible for participation in CEIP. Consequently, in making the decision to remain on CEIP, participants made a real choice between CEIP employment and receipt of further EI or IA benefits.
In the first 18 months of the follow-up period, CEIP significantly reduced reliance on EI and IA benefits. Given the high participation rates of the program group in CEIP, it is expected that the substantial reductions in EI and IA receipt would be sustained throughout the 36-month CEIP eligibility period. However, CEIP employment is

- 48 -
insurable employment under the EI program, and participants could qualify for EI benefits after their 36 months of CEIP employment. At the same time, IA rules stipulate that IA benefits are provided only if EI benefits are exhausted, so it is expected that the reduction in IA receipt arising from CEIP will continue beyond the period of CEIP eligibility, while EI receipt would likely begin to increase following the end of eligibility. Although we may expect to see an initial increase in EI receipt in month 37, for most sample members there is very little post-eligibility data available from the 40-month survey. As a result, this analysis remains largely for the in-program period of eligibility. Transfer receipt during the post-CEIP transition period will be explored in more detail in the future with the final 54-month follow-up survey.
Receipt of Benefits among the EI Sample The first CEIP follow-up report revealed that program group members of the EI
sample left EI sooner than the control group and reduced their EI receipt substantially. Figure 4.1 shows the percentage of the EI program group members receiving regular EI benefits in months 1 to 38. The largest impact on EI receipt occurs at 4 months with 61.7 percentage points, as only 16.6 per cent of program group members received benefits in the month compared with 78.3 per cent of control group members. After this point, the impact quickly diminishes to 20 percentage points in month 8.
Figure 4.1: Percentage Receiving Regular EI Benefits — EI Sample
Source: Calculations from 40-month administrative data.
-80
-60
-40
-20
0
20
40
60
80
100
1 2 3 4 5 6 7 8 9 10 11 12 13 14 15 16 17 18 19 20 21 22 23 24 25 26 27 2829 30 31 32 33 34 35 36 37 38
Months from Random Assignment
Program GroupControl Group Impact
Perc
enta
ge R
ecei
ving
EI B
enef
its

- 49 -
The percentage of control group members receiving regular EI benefits displays a cyclical pattern from month 8 to month 38. EI receipt of program group members remained stable during the same period. As a result, the impacts display a countercyclical pattern that mirrors the changes of EI receipt by the control group members. CEIP reduced EI receipt of EI program group members from 15.9 to 26.8 percentage points between month 8 and month 37.1 Thus, the reduction of EI receipt was sustained throughout the period of CEIP eligibility.
Table 4.1 provides the estimated impact of CEIP on average monthly EI receipt during quarters 1 to 12 of the follow-up period. Similar to CEIP’s impact on the incidence of EI receipt, the largest impact occurred early in quarter 2 at $353, and displayed a similar cyclical pattern over time.
Table 4.1: Impacts on EI Monthly Benefits — EI Sample
Program Control Difference StandardOutcome Group Group (Impact) ErrorAverage monthly EI benefits ($)Quarter 1 584 763 -180 *** (31)Quarter 2 89 443 -353 *** (25)Quarter 3 47 165 -118 *** (17)Quarter 4 53 236 -183 *** (23)Quarter 5 40 245 -205 *** (22)Quarter 6 52 168 -116 *** (19)Quarter 7 78 201 -123 *** (24)Quarter 8 96 267 -171 *** (26)Quarter 9 83 259 -176 *** (25)Quarter 10 78 202 -125 *** (23)Quarter 11 76 194 -118 *** (23)Quarter 12 90 230 -140 *** (25)Quarter 13 97 232 -135 *** (24)Sample size 441 410
Source: Calculations from 40-month administrative data. Notes: The estimates for the first twelve quarters are calculated by averaging the three months within a quarter. The estimates for quarter 13 are calculated by averaging the two months within the quarter. Sample sizes vary for individual measures because of missing values. Two-tailed t-tests were applied to differences between the outcomes for the program and control groups. Statistical significance levels are indicated as: * = 10 per cent; ** = 5 per cent; *** = 1 per cent. Rounding may cause slight discrepancies in sums and differences.
As well as looking at the average impacts among the EI sample, additional subgroup analysis was performed to estimate differences in impacts of CEIP on the total EI benefit payments at 1–38 months. A range of subgroups was defined based on demographic and socioeconomic characteristics measured at the time of enrolment. Results of this subgroup analysis (see Table D.7 in Appendix D) reveal that CEIP was most effective in reducing EI amounts for program group members who were older, male, less educated
1 The increase in EI receipt in month 38 is due to the eligibility period finishing in month 37 for a small proportion of the program group participants.

- 50 -
and had 10 or more years of labour market experience. EI program group members who were 40 years of age and older experienced more than double the reductions in total EI payments compared to their younger counterparts less than 30 years of age. The reductions in total EI payments were at least one-and-a-half times larger for men than women ($8,319 versus $4,542), and were similarly larger for those with 10 or more years of work experience than those with less ($6,833 versus $4,270) and for those with a high school diploma than those without ($8,528 versus $5,343).
Unemployed EI claimants who exhaust their benefits may seek financial support from income assistance. About 1 per cent of program group and 5 per cent of control group members claimed IA benefits in months 1 to 38, leading to a small but significant negative impact on IA receipt throughout the eligibility period.2
Receipt of Benefits among the IA Sample
IA Benefits Although participants were required to forego EI benefits in order to remain eligible
for CEIP, some supplementary IA benefits were permitted (i.e. monthly IA benefits that did not exceed 50 per cent of total income). Even though the CEIP offer appears to have been attractive to IA recipients — many left the IA program completely — it was anticipated that a significant proportion would continue to receive some supplementary IA benefits. As shown in the first CEIP follow-up report, CEIP reduced the proportion of IA program group members receiving benefits in each month by half in the first 18 months. It is important to know whether the reductions in IA receipt were sustained throughout the CEIP eligibility period.
Figure 4.2 presents the percentage of monthly basic IA receipt and the impact of CEIP for the IA sample. The percentages of control group members in the IA sample receiving IA benefits were in steady decline, going from 90.6 per cent in month 1 to 53.2 per cent in month 38. CEIP halved the percentage of program group members receiving IA benefits in month 5 when CEIP employment had started for most participants. The impact remains steady throughout the period of CEIP eligibility: only 21.9 per cent of IA program group members received IA benefits in month 38, a reduction of 31.3 percentage points.
2 Some IA administrative data of EI sample members are censored to protect privacy. The exact estimates are therefore not presented.

- 51 -
Figure 4.2: Percentage Receiving IA Benefits — IA Sample
Source: Calculations from 40-month administrative data.
Since CEIP allowed participants to supplement their CEIP earnings with IA benefits as long as IA was not the principal source of income, CEIP was expected to have a larger impact on the total amount of IA benefits received than on the percentage receiving IA benefits. Table 4.2 shows CEIP’s impact on average monthly IA and EI receipt for the IA sample from quarters 1 to 12. CEIP’s impact on IA receipt peaked at $341 per month in quarter 2 and declined afterwards as a result of the decrease the amount of benefits received by the control group ($519 in quarter 1 compared to $296 in the 12th quarter). From around the third quarter, the amount of benefits received by the program group hovered between $76 and $95.
-60
-40
-20
0
20
40
60
80
100
1 2 3 4 5 6 7 8 9 10 11 12 13 14 15 16 17 18 19 20 21 22 23 24 25 26 27 28 29 30 31 32 33 34 35 36 37 38
Months From Random Assignment
Program Group Control Group Impact
Perc
enta
ge R
ecei
ving
IA B
enef
its

- 52 -
Table 4.2: Impacts on EI and IA Monthly Benefits — IA Sample
Program Control Difference StandardOutcome Group Group (Impact) ErrorAverage monthly IA benefits ($)Quarter 1 470 519 -49 * (26)Quarter 2 125 466 -341 *** (24)Quarter 3 92 416 -324 *** (24)Quarter 4 87 374 -287 *** (24)Quarter 5 95 352 -258 *** (25)Quarter 6 89 327 -238 *** (25)Quarter 7 83 299 -216 *** (25)Quarter 8 81 291 -210 *** (25)Quarter 9 84 294 -210 *** (26)Quarter 10 76 301 -225 *** (25)Quarter 11 82 287 -205 *** (25)Quarter 12 90 296 -207 *** (27)Quarter 13 100 296 -196 *** (27)Average monthly EI benefits ($)Quarter 1 9 14 -5 (8)Quarter 2 3 25 -22 ** (10)Quarter 3 2 31 -29 *** (10)Quarter 4 4 43 -39 *** (13)Quarter 5 0 60 -60 *** (15)Quarter 6 2 59 -57 *** (15)Quarter 7 10 97 -87 *** (20)Quarter 8 26 109 -82 *** (23)Quarter 9 26 125 -99 *** (24)Quarter 10 28 106 -78 *** (22)Quarter 11 24 90 -66 *** (21)Quarter 12 23 86 -63 *** (22)Quarter 13 44 87 -43 * (23)Sample size 210 201
Source: Calculations from 40-month administrative data. Notes: The estimates for the first twelve quarters are calculated by averaging the three months within a quarter. The estimates for quarter 13 are calculated by averaging the two months within the quarter. Sample sizes vary for individual measures because of missing values. Two-tailed t-tests were applied to differences between the outcomes for the program and control groups. Statistical significance levels are indicated as: * = 10 per cent; ** = 5 per cent; *** = 1 per cent. Rounding may cause slight discrepancies in sums and differences.
There are two subgroup differences in CEIP’s impact on total IA benefit payments within the IA sample. CEIP was more effective in reducing total IA benefit payments for people with 5 years or less work experience or people without a high school diploma. For full subgroup impact estimates see Table D.8.
EI Benefits Few IA program group members received EI benefits during the CEIP eligibility
period (0 to 11 per cent of all participants) compared to a significant higher proportion of
- 53 -
the control group (up to 17 per cent). The bottom panel of Table 4.2 shows the amount of EI monthly benefits received by IA sample members. The amounts of monthly EI benefits received by control group members increased over the first 9 quarters and decreased slightly afterwards. As a result, CEIP’s impacts on EI receipt among the IA sample were growing initially, peaked at $99 in the 9th quarter, and declined afterwards.
IMPACTS ON INCOMES AND LOW-INCOME STATUS For program participants, one would expect CEIP benefits to translate into significant
gains in total income along with possible reductions in the extent of poverty. However, total household income can include a wide range of income sources and a potentially complex set of decisions of household members. CEIP may have affected eligibility for other income sources as well as the employment decisions of other household members.
Personal Income and Household Income Table 4.3 presents the estimates of CEIP’s impacts on personal and household income
and household income from other family members by marital status and spouses’ labour force participation in the 12 months prior to the 40-month follow-up interview. Among the EI sample, CEIP had a large and significant positive impact on personal income as it increased program group members’ income by $2,915 (a 15.5 per cent increase). CEIP’s full-time employment earnings provided participants with substantially more income than EI benefits or labour market earnings they would have received. However, CEIP also had a similarly large and significant negative impact (at $2,829) on the amount of income received by other household members.3 This reduction in income of other household members was driven by a decrease in their receipt of transfer income or income from a range of other sources including Canada Pension Plan and Old Age Security, workers compensation or disability insurance, and various tax credits. As a result, the overall household incomes are not significantly different between the program and control groups.
Among the IA sample, CEIP also had a large and significant positive impact on personal income as it increased program group members’ income by $2,283 (an increase of 18.4 per cent). In contrast to the EI sample, CEIP did not reduce other household members’ income (but although it was $1,443 higher than the control group, the difference is not statistically significant). Therefore, the overall household income of program group members is higher than that of the control group by $3,592, or 21.7 per cent. The absence of negative impacts on other household members’ income, in contrast with the EI sample, arises in part due to a small marriage effect and an increased employment rate among spouses of IA program group members.
3 This negative impact on other household member income was lower in magnitude ($1,669) and no longer significant after regression adjustment. Nonetheless, the decrease remains sufficient to counterbalance the positive impact on personal income such that there is no effect of CEIP on overall household income among EI program group members. Results are similar with and without regression adjustment (see Appendix C).

- 54 -
Table 4.3: Impacts on Personal and Household Income in the Year Prior to the 40-Month Interview
EI Sample IA SampleProgram Control Standard Program Control Standard
Outcome Group Group Error Group Group Error
Personal and family income ($)Individual income 21 706 18 790 2 915 *** (892,4) 14 660 12 377 2 283 *** (658,6)Other household income 15 348 18 177 -2 829 ** (1338,5) 5 660 4 217 1 443 (951,3)Total household incomea 36 588 37 175 -587 (1644,6) 20 155 16 563 3 592 *** (1199,5)
Marital status at the 40-month follow-up interviewMarried or living common-law (%) 62,4 63,2 -0,9 (3,3) 24,3 19,4 4,9 (4,1)
Employment of spouse in past 12 monthsHad a spouse who worked (%) 39,0 39,3 -0,3 (3,4) 14,3 6,0 8,3 *** (3,0)Number of months spouse worked 4,1 4,7 -0,6 (0,4) 1,4 0,6 0,8 ** (0,3)Had spouse that worked full-time (%) 32,4 32,4 0,0 (3,2) 13,3 4,5 8,9 *** (2,8)Had spouse that worked part-time (%) 5,9 5,9 0,0 (1,6) 1,0 1,5 -0,5 (1,1)
Sample size 441 410 210 201
Difference(Impact)
Difference(Impact)
Source: Calculations from the 40-month survey data. Notes: Sample sizes vary for individual measures because of missing values. This may cause slight discrepancies in sums and
differences. All analyses were only for those who responded to the 40-month survey. Two-tailed t-tests were applied to differences in outcomes between the program and control groups. Statistical significance
levels are indicated as: * = 10 per cent; ** = 5 per cent; *** = 1 per cent. Rounding may cause slight discrepancies in sums and differences. a Household income is measured as the sum of the sample member's income and the income of all other members in that
person's household.
Marital Status and Employment of Spouse The difference between EI and IA samples highlights the complexity of the joint
decision in household income determination. On the one hand, the incremental income of participants could be a substitute for income of other household members (including the spouses), which, among EI households, might result in other members having less incentive to seek different income sources. On the other hand, the family structure and income of household members might affect the eligibility for transfer programs, like IA, which determines entitlement based on household circumstances. As a result of their involvement in CEIP, IA program group members face fewer disincentives to get married, since they are no longer seeking IA benefits. Furthermore, their spouses may also decide to work more, as they are no longer eligible for IA either. Since marital status and household income do not affect eligibility for EI benefits or CEIP, it is expected that CEIP would not affect marital status directly for EI sample participants. Given the large difference in impacts on the other household members’ income among the EI and IA

- 55 -
samples, it is important to analyze CEIP’s impacts on the labour force participation of participants’ spouses and any possible effects on marital status.
Working Spouse — Marriage Effect and Working Incentive The bottom part of Table 4.3 presents the estimates of CEIP’s impacts on marital
status and spouses’ decision to work and reveals no significant difference between the program and control groups for the EI sample. It is not expected that the small difference in martial status or spouse’s working decision contributed significantly to the lower household income from family members other than the participants.
The results are very different among the IA sample. There is no significant difference in marital status at the time of the 40-month follow-up survey — 24.3 per cent of the program group was married or in a common-law relationship, which is 4.9 percentage points higher than that of the control group, although the difference is not statistically significant.4 However, CEIP significantly increased the proportion of program group members with a spouse who worked compared to that of the control group. Of the program group members, 14.3 per cent had a spouse who worked in the 12 months prior to the 40-month follow-up survey, compared with only 6 per cent of the control group. Furthermore, the impacts on spousal work were largely at the full-time level. Of the program group, 13.3 per cent had a spouse who worked full-time compared to only 4.5 per cent of the control group.
Subgroups — Impact Differences on Other Household Member Income and Working Spouses It is important to note that the effects of CEIP on incomes and working decisions of
other household members are likely to vary based on household composition. For example, the presence of dependents in the household is likely to influence both the work choices of household members and their eligibility for various other income sources. From a policy perspective, if governments are motivated by the anti-poverty effects of community-based work, they will be interested in the varying impacts of the program on different populations.
Further analysis of CEIP’s impacts on income of other household members and the work of spouses were performed across a range of baseline characteristics. Results confirm one important subgroup difference in impacts on other household member income and spousal work, specifically the presence of children in the household. In fact, there are important differences in impacts on households with and without children, in both EI and IA program group households.
Figure 4.3 illustrates the income of other household members, by EI and IA samples, and by households with and without children. The differences in impacts of CEIP on other household member income across EI and IA samples are entirely driven by households without children. Among the EI sample, CEIP has had no effect on other household members’ income when children are present, but significantly decreases incomes when no children are present in the household. This decrease is driven primarily
4 Notice that the insignificant difference in marital status at the 40-month survey does not imply that there is no impact on marriage among the IA sample. It is possible that CEIP had an impact on marriage early in the eligibility period.

- 56 -
by a reduction in the receipt of other income sources and not the work effort of spouses. As such, it likely relates to a loss of eligibility for income-contingent benefits that are more generous for households with children (e.g. IA top-up, various tax credits).
Similarly, among the IA sample, there is no significant effect of CEIP on incomes of other household members when children are present. However, when no children are in the household, there is a large and significant increase in incomes of other household members, driven by the increase in work effort of spouses. Figure 4.4 illustrates the impacts of CEIP on spousal work, which are significant only in the IA sample, and are particularly large among households without children. In fact, no IA control group members who are in households without children have spouses who are working. In contrast, as a result of CEIP, over 12 per cent of IA program group members in households without children have spouses working.
Figure 4.3: Income of Other Household Members by Presence of Children
Source: Calculations from the 40-month survey data. See Appendix D for the detailed estimates.
0
5,000
10,000
15,000
20,000
25,000
1 or more children No Children 1 or more children No ChildrenEI Sample IA Sample
Program Control
Inco
me
($)

- 57 -
Figure 4.4: Percentage of Participants with a Working Spouse by Presence of Children
Source: Calculations from the 40-month survey data. See Appendix D for the detailed estimates.
Low-Income Status Table 4.4 shows CEIP’s impact on household low-income status based on the Low-
Income Cut-Offs (LICOs) provided by Statistics Canada. The table illustrates the disparity in average household income between the two samples, as 72.6 per cent of the EI control group had household incomes above the LICOs compared with only 17.1 per cent of the IA control group. As such, it was expected that CEIP would have larger impacts on the LICO status of IA program group members than that of the EI program group.
Among the EI sample, CEIP had very little effect on the LICO status of the program group member households. However, CEIP reduced the severity of poverty among program group members with the lowest household incomes, who were able to achieve increases that brought them closer to the level of the LICOs. CEIP decreased the proportion of EI program group households with incomes below 75 per cent of LICO by 8.1 percentage points and increased the proportion with incomes between 75 and 100 per cent of LICO by 6.4 percentage points.
Among the IA sample, CEIP significantly reduced the percentage of program group members whose household incomes were below the LICOs (by nearly 10 percentage points). There is also a 16.9 percentage point decrease in program group members with household incomes below 50 per cent of LICO. This is associated with a 15.6 percentage point increase in the proportion of program group members with household incomes
0
10
20
30
40
50
60
1 or more children No Children 1 or more children No Children
EI Sample IA Sample
Perc
enta
ge
Program Control

- 58 -
between 75 and 100 per cent of LICO, reflecting a reduction in the severity of poverty for those in the lowest income category.
Table 4.4: Impacts on Household Low-Income Cut-Off (LICO) Status Prior to the 40-Month Follow-Up Interview
EI Sample IA SampleProgram Control Standard Program Control Standard
Outcome Group Group Error Group Group Error
Household income below LICO (%)a 25.7 27.4 -1.7 (3.5) 73.5 82.9 -9.5 ** (4.6)Below 50% of LICO 2.9 6.0 -3.1 * (1.6) 17.3 34.2 -16.9 *** (4.8)50 to less than 75% of LICO 6.1 11.0 -5.0 ** (2.2) 23.5 31.7 -8.3 * (5.0)75 to less than 100% of LICO 16.8 10.4 6.4 ** (2.7) 32.7 17.1 15.6 *** (4.7)
Household income above LICO (%) 74.3 72.6 1.7 (3.5) 26.5 17.1 9.5 ** (4.6)100 to less than 150 % of LICO 27.5 23.1 4.4 (3.4) 17.3 11.6 5.7 (3.9)150 to less than 175% of LICO 11.3 12.0 -0.8 (2.5) 4.3 1.8 2.5 (1.9)175 to less than 200% of LICO 9.5 10.0 -0.5 (2.4) 2.5 1.8 0.6 (1.6)200% of LICO or more 26.0 27.4 -1.4 (3.5) 2.5 1.8 0.6 (1.6)
Sample size 441 410 210 201
Difference(Impact)
Difference(Impact)
Source: Calculations from the 40-month survey data. Notes: Sample sizes vary for individual measures because of missing values. This may cause slight discrepancies in sums and
differences. All analyses were only for those who responded to the 40-month survey. Two-tailed t-tests were applied to differences in outcomes between the program and control groups. Statistical significance
levels are indicated as: * = 10 per cent; ** = 5 per cent; *** = 1 per cent. Rounding may cause slight discrepancies in sums and differences. a Calculated by comparing annualized family income with the LICO defined by Statistics Canada for the sample member's
location and family size.
Subgroups — Impact Differences on Low-Income Status Subgroup analysis was also performed to estimate differences in impacts on low-
income status. In light of CEIP’s differential effects on other income and spousal work among EI and IA households with and without children, one would expect these subgroups to experience differences in the incidence of low incomes. Figure 4.5 shows the low-income status among EI and IA samples by households with or without children at baseline. Among the EI sample, there is no statistically significant effect of CEIP on low-income status among program group households without children. However, among program group households with children, a 9.1 percentage point lower low-income incidence is observed, a number that is statistically significant at 10 per cent level. This is not unexpected in light of the negative effect of CEIP on other household member income in EI households without children, as described above.
Among IA sample members, CEIP caused a substantial reduction (of 21.9 percentage points) in the incidence of low incomes among households without children. However, no significant reduction in the incidence of low incomes was observed in households with children. This difference in impacts arises in part because, as described above, the
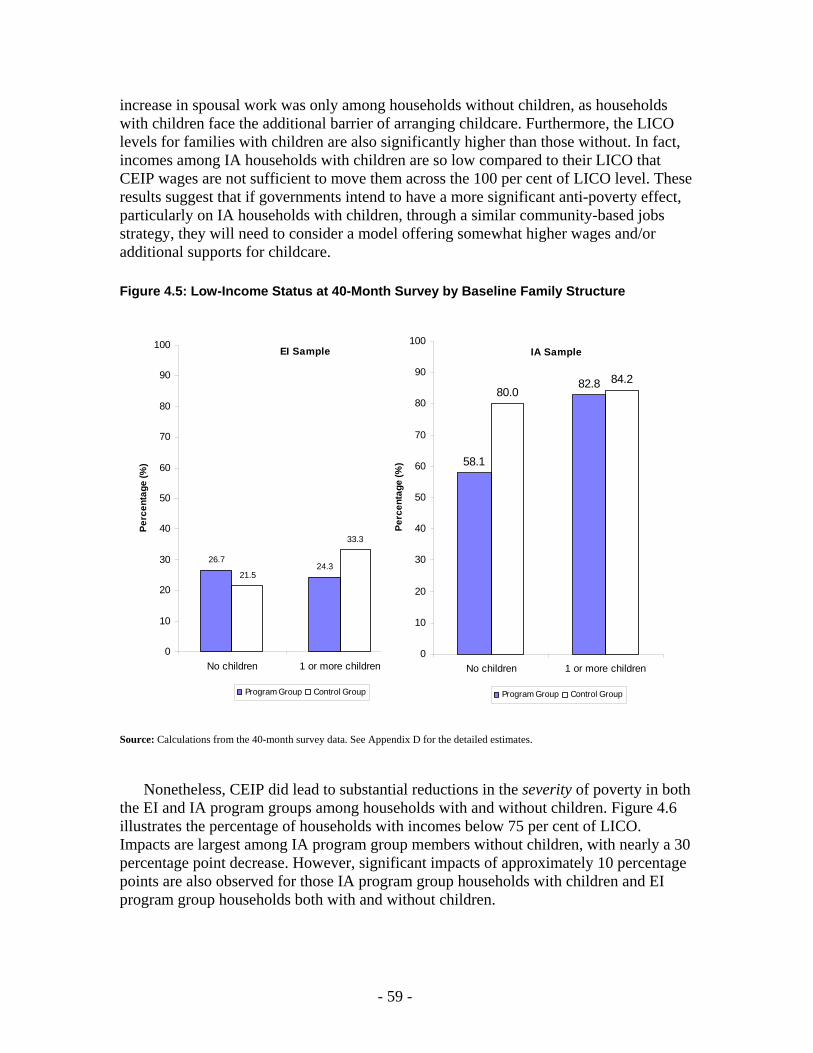
- 59 -
increase in spousal work was only among households without children, as households with children face the additional barrier of arranging childcare. Furthermore, the LICO levels for families with children are also significantly higher than those without. In fact, incomes among IA households with children are so low compared to their LICO that CEIP wages are not sufficient to move them across the 100 per cent of LICO level. These results suggest that if governments intend to have a more significant anti-poverty effect, particularly on IA households with children, through a similar community-based jobs strategy, they will need to consider a model offering somewhat higher wages and/or additional supports for childcare.
Figure 4.5: Low-Income Status at 40-Month Survey by Baseline Family Structure
Source: Calculations from the 40-month survey data. See Appendix D for the detailed estimates.
Nonetheless, CEIP did lead to substantial reductions in the severity of poverty in both the EI and IA program groups among households with and without children. Figure 4.6 illustrates the percentage of households with incomes below 75 per cent of LICO. Impacts are largest among IA program group members without children, with nearly a 30 percentage point decrease. However, significant impacts of approximately 10 percentage points are also observed for those IA program group households with children and EI program group households both with and without children.
26.724.3
21.5
33.3
0
10
20
30
40
50
60
70
80
90
100
No children 1 or more children
Perc
enta
ge (%
)
Program Group Control Group
EI Sample
58.1
82.880.0
84.2
0
10
20
30
40
50
60
70
80
90
100
No children 1 or more children
Perc
enta
ge (%
)
Program Group Control Group
IA Sample

- 60 -
Figure 4.6: Household Income Less than 75% of LICOs at 40-Month Survey
Source: Calculations from the 40-month survey data. See Appendix D for the detail estimates.
IMPACTS ON FINANCIAL STATUS Increases in personal income and income stability from CEIP employment are
expected to improve the financial status of program participants. The 36 months of full-time employment may also help participants access previously unavailable financial services, particularly credit services. Table 4.5 presents estimates of CEIP’s impacts on financial accounts (including savings, chequing, RRSP, stocks, bonds), as well as savings, debts, and expectations of employment and income in the future.
Financial Accounts Among the EI sample, CEIP increased the percentage of program group members
with a financial account by 3.5 percentage points. Financial accounts with less than $1,000 experienced the largest increase, 7.8 percentage points, while the percentage of accounts with more than $25,000 increased by 5.3 percentage points. There is also some evidence that program group members are more likely to have fewer amounts in financial accounts compared to last year, although the difference between the program and control groups is statistically insignificant after adjustment for differences in baseline characteristics.
IA sample members are more likely than the EI sample members to have no financial accounts or accounts with less than $1,000. Only 3.7 per cent of control group members of the IA sample reported having $1,000 or more in their financial accounts in the second follow-up survey. CEIP increased the percentage of program group members with $1,000
22.529.0
35.9 37.9
0
10
20
30
40
50
60
70
80
90
100
No children 1 or more children
Perc
enta
ge (%
)
Program Group Control Group
EI Sample
36.5
61.365.1
72.5
0
10
20
30
40
50
60
70
80
90
100
No children 1 or more children
Perc
enta
ge (%
)
Program Group Control Group
IA Sample

- 61 -
to $25,000 in financial accounts by 5.3 percentage points. Program group members of the IA sample are also more likely to have reported having less in their financial account compared to one year ago, suggesting that some participants have used their saving during the twelve months prior to the 40-month interview.
Debt Table 4.5 shows that CEIP raised the willingness of program group members of the
EI sample to borrow more. Of the program group members, 36.2 per cent had $10,000 or more in debt compared with 29.9 per cent of the control group, a 6.3 percentage point increase. There is no significant difference between program and control groups in terms of the amount of debt compared to one year previous among the EI sample.
Among the IA sample, CEIP appeared to impact the incidence of debt, increasing the proportion of program group members with debt by 9.8 percentage points.5 In particular, 10.1 per cent of the program group had debts totalling less than $1,000, compared with only 3.6 per cent of the control group — a 6.5 percentage point increase. Program group members are also 8.3 percentage points more likely than the control group to report having the same amount of debt as one year ago, suggesting the increase in incidence happened earlier in their CEIP eligibility.
It is unclear how CEIP’s impacts on debts affect participants’ financial status. On the one hand, the increase in debt burden may affect participants’ future credit; on the other hand, the low debt incidence of the control group suggests that IA beneficiaries were less likely to qualify for credit services and that CEIP improved participants’ chance to qualify for such services.
5 After regression adjustment, this impact was reduced to 7.6 percentage points and was no longer statistically significant, although the pattern of differences across the four debt categories was largely the same.

- 62 -
Table 4.5: Impacts on Personal Finance at the 40-Month Follow-Up Interview
EI Sample IA SampleProgram Control Standard Program Control Standard
Outcome Group Group Error Group Group Error
Have any financial accounts (%) 94,1 90,6 3,5 * (1,9) 81,3 83,0 -1,7 (3,9)No financial account 5,9 9,4 -3,5 * (1,9) 18,7 17,0 1,7 (3,9)Amount less than $1,000 56,6 48,8 7,8 ** (3,7) 71,5 79,0 -7,4 * (4,4)$1,000 to less than $25,000 23,8 32,8 -9,0 *** (3,3) 9,0 3,7 5,3 ** (2,5)$25,000 or more 13,4 8,2 5,3 ** (2,3) 0,5 0,0 0,5 (0,5)
Financial accounts compared to last yearMore than one year ago 28,5 32,0 -3,5 (3,4) 16,1 16,6 -0,5 (3,7)Less than one year ago 33,6 27,7 5,9 * (3,4) 42,7 26,4 16,3 *** (4,8)The same as one year ago 31,8 30,3 1,5 (3,4) 22,1 39,9 -17,8 *** (4,6)
Have any debts (%) 69,0 71,0 -2,0 (3,3) 49,8 40,0 9,8 * (5,0)No debt 31,0 29,0 2,0 (3,3) 50,3 60,0 -9,8 * (5,0)Amount less than $1,000 4,9 5,9 -1,0 (1,7) 10,1 3,6 6,5 ** (2,5)$1,000 to less than $10,000 26,9 33,7 -6,9 ** (3,4) 19,2 21,1 -1,9 (4,1)$10,000 or more 36,2 29,9 6,3 * (3,5) 19,7 15,0 4,7 (3,8)
Debts compared to last yearMore than one year ago 25,7 24,4 1,3 (3,2) 17,6 19,5 -1,9 (3,9)Less than one year ago 23,4 27,0 -3,6 (3,2) 9,6 6,7 2,9 (2,8)The same as one year ago 19,3 19,0 0,4 (2,9) 22,1 13,9 8,3 ** (3,9)
Sample size 441 410 210 201
Difference(Impact)
Difference(Impact)
Source: Calculations from the 40-month survey data. Notes: Sample sizes vary for individual measures because of missing values. This may cause slight discrepancies in sums and
differences. All analyses were only for those who responded to the 40-month survey. Two-tailed t-tests were applied to differences in outcomes between the program and control groups. Statistical significance
levels are indicated as: * = 10 per cent; ** = 5 per cent; *** = 1 per cent. Rounding may cause slight discrepancies in sums and differences.
IMPACTS ON HARDSHIP, EXPECTATIONS, AND WELL-BEING Moving beyond CEIP’s impact on income and financial status, this section examines
CEIP’s impact on hardship, expectations of the future, and health and wellbeing. Did the improvements participants experienced in income and financial status leave them in a better position to cope with poverty and hardship? Did CEIP improve participants’ expectations of employment and income in the future? How did the health and well-being of the program group compare with that of the control group?
- 63 -
Hardship Table 4.6 shows the impacts of CEIP on the ability of program group members to pay
for regular expenses and the extent of hardship endured. Among the EI sample, there is no significant difference between the program and control group members in their ability to meet regular expenses and financial needs. It appears that CEIP reduced the percentage of program group members who had difficulty in paying rent by 3 percentage points (statistically significant at 10 per cent level of significance)6 and reduced the percentage who were unable to get groceries or food by 4.2 percentage points. It also significantly reduced the percentage who had difficulty almost every month by 2.6 percentage points. There is some evidence that CEIP lowered the percentage of program group members who had things that were not working at home because they were too costly to fix, but it is not statistically significant after adjusting for differences in baseline characteristics between program and control groups. Even though 13.6 per cent of the control group members have difficulty getting groceries or food, only 1.5 per cent used food banks, and there is no significant difference in food bank usage between program group and control group.
Among the IA sample, CEIP significantly increased the percentage of program group members whose household income met all or most regular expenses and financial needs in the past 6 months by 11.6 percentage points (78.1 per cent of the program group compared with 66.5 of the control group). It also significantly reduced the percentage of program group members who had difficulty paying for electricity and day-to-day expenses by 10.7 percentage points and 14.4 percentage points, respectively. Only 1 per cent of the program group members among the IA sample had things not working at home because their landlord would not fix them, compared with 4 per cent of the control group. A higher proportion of the IA sample had difficulty in getting groceries or food than the EI sample (29.9 per cent of the control group among IA sample), yet there is a relatively small and statistically insignificant difference between IA program and control groups in the percentage who had difficulties in getting groceries or food. The usage of food banks was more common among the IA sample (10.2 per cent) suggesting that food banks was a solution to ease the difficulties in getting groceries and food and that increased income from CEIP was spent on electricity and other day-to-day expenses.
6After regression adjustment, the reductions extended to electricity payments, with the EI program group being 5.1 percentage points less likely to have had difficulty making such payments — the result was significant at the 10 per cent level.

- 64 -
Table 4.6: Impacts on Hardship at the 40-Month Follow-Up Interview
EI Sample IA SampleProgram Control Standard Program Control Standard
Outcome Group Group Error Group Group Error
In the past 6 months, respondentHad household income:
Meet all or most expenses and financial needs 85.6 84.6 1.0 (2.5) 78.0 66.5 11.6 *** (4.4)Meet some 10.5 10.2 0.4 (2.1) 14.1 20.8 -6.7 * (3.8)Meet very little or none of the expenses 3.9 5.2 -1.3 (1.4) 7.8 12.7 -4.9 (3.0)
Had difficulty paying for:Electricity 17.6 21.1 -3.5 (2.8) 27.6 38.3 -10.7 ** (4.7)Heat 20.8 20.1 0.8 (2.8) 31.0 30.6 0.4 (4.6)Telephone 15.0 12.9 2.0 (2.4) 26.1 33.2 -7.1 (4.6)Rent 5.6 8.6 -3.0 * (1.8) 18.7 22.4 -3.7 (4.1)Mortgage 5.9 6.9 -1.0 (1.7) 3.9 1.5 2.4 (1.6)Municipal taxes 11.2 7.9 3.4 (2.1) 5.9 3.6 2.3 (2.1)Day-to-day expenses 21.8 22.1 -0.3 (2.9) 17.2 31.6 -14.4 *** (4.2)
Had things not working at home: 7.3 10.2 -2.9 (2.0) 13.1 12.2 0.9 (3.3)Too costly to fix 5.7 9.0 -3.4 * (1.8) 9.0 6.5 2.5 (2.7)No time to fix 0.9 0.2 0.7 (0.5) 1.4 0.0 1.4 * (0.8)Landlord won't fix 0.2 0.5 -0.3 (0.4) 1.0 4.0 -3.0 ** (1.5)Other reason 0.5 0.2 0.2 (0.4) 1.4 1.0 0.4 (1.1)
Was unable to get groceries or food: 9.4 13.6 -4.2 * (2.2) 25.2 29.9 -4.7 (4.5)Almost every month 1.8 4.4 -2.6 ** (1.2) 7.1 10.0 -2.8 (2.8)Some months but not every 2.3 3.9 -1.6 (1.2) 8.6 10.9 -2.4 (2.9)Only once or twice 5.2 5.1 0.1 (1.5) 9.0 8.5 0.6 (2.8)
Has used food banks in the past six months 1.1 1.5 -0.3 (0.8) 9.7 10.2 -0.5 (3.0)
Sample size 441 410 210 201
Difference(Impact)
Difference(Impact)
Source: Calculations from the 40-month survey data. Notes: Sample sizes vary for individual measures because of missing values. This may cause slight discrepancies in sums and
differences. All analyses were only for those who responded to the 40-month survey. Two-tailed t-tests were applied to differences in outcomes between the program and control groups. Statistical significance
levels are indicated as: * = 10 per cent; ** = 5 per cent; *** = 1 per cent. Rounding may cause slight discrepancies in sums and differences.
Expectations of Future Employment and Income The upper part of Table 4.7 provides estimates of CEIP’s impact on expectations of
employment and income one year after the 40-month follow-up interview. There is strong evidence that CEIP raised expectations of future employment: among the EI sample, 68.1 per cent of the program group expected to work full-time in one year’s time, which is 7.4 percentage points higher than that of the control group. The program group members are

- 65 -
also 4 percentage points less likely than the control group to expect not to be working at all. Furthermore, CEIP increased program group members’ expectations of working more hours by a significant 16.6 percentage points among the EI sample. There is no statistically significant difference between the program and control groups among the EI sample on the expectation of collecting EI or IA, making more money, relying on family friends, or moving to a new home.
Table 4.7: Impacts on Expectation, Health and Well-Being at the 40-Month Follow-Up Interview
EI Sample IA SampleProgram Control Standard Program Control Standard
Outcome Group Group Error Group Group Error
Expectation of work and financeExpectation of work in one year's time
Working full-time 68.1 60.7 7.4 ** (3.5) 72.7 65.5 7.2 (4.9)Working part-time 22.0 25.4 -3.4 (3.1) 19.1 19.3 -0.2 (4.2)Not working at all 9.9 13.8 -4.0 * (2.4) 8.2 15.2 -7.0 ** (3.4)
Expect to collect income assistance 0.7 1.8 -1.1 (0.8) 11.0 20.1 -9.1 ** (3.8)Expect to collect employment insurance 25.5 30.3 -4.8 (3.3) 16.4 7.1 9.3 *** (3.5)Expect to make more money 66.0 60.9 5.2 (3.4) 75.3 78.1 -2.8 (4.6)Expect to work more hours 60.1 43.5 16.6 *** (3.5) 77.5 61.6 15.9 *** (4.9)Expect to rely on family friends 13.3 12.8 0.5 (2.4) 27.9 27.3 0.6 (4.7)Expect to move to a new home 13.0 11.9 1.1 (2.3) 22.7 20.1 2.6 (4.3)
HealthIn general health is: Excellent 29.5 27.7 1.8 (3.1) 24.6 20.6 4.0 (4.2)
Very good 43.6 40.7 2.9 (3.4) 39.1 37.2 1.9 (4.8)Good 20.1 22.3 -2.2 (2.8) 23.7 28.1 -4.5 (4.4)Fair 5.7 6.9 -1.2 (1.7) 9.7 10.6 -0.9 (3.0)Poor 1.1 2.5 -1.3 (0.9) 2.9 3.5 -0.6 (1.8)
Life Satisfaction ScoreExtremely satisfied 12.2 11.2 1.0 (2.2) 14.3 10.0 4.3 (3.2)Satisfied 58.5 54.9 3.6 (3.4) 41.9 42.3 -0.4 (4.9)Equally satisfied/dissatisfied 4.8 4.1 0.6 (1.4) 5.7 4.5 1.2 (2.2)Dissatisfied 20.9 22.0 -1.1 (2.8) 28.1 31.8 -3.7 (4.5)Extremly dissatisfied 1.8 3.7 -1.8 * (1.1) 6.7 6.0 0.7 (2.4)
Average score 17.4 16.9 0.5 ** (0.3) 16.1 15.9 0.2 (0.5)
Sample size 441 410 210 201
Difference Difference(Impact) (Impact)
Source: Calculations from the 40-month survey data. Notes: Sample sizes vary for individual measures because of missing values. This may cause slight discrepancies in sums and
differences. All analyses were only for those who responded to the 40-month survey. Two-tailed t-tests were applied to differences in outcomes between the program and control groups. Statistical significance
levels are indicated as: * = 10 per cent; ** = 5 per cent; *** = 1 per cent. Rounding may cause slight discrepancies in sums and differences.

- 66 -
CEIP had a similarly significant impact on the IA sample group members’ expectations of future employment. A full 72.7 per cent of the program group expected to be working full-time in one year’s time, which is 7.2 percentage points more than the control group (although it is not statistically significant). The program group members are also 7 percentage points less likely than the control group to expect to not work at all. CEIP also significantly increased program group members’ expectations of working more hours by 15.9 percentage points. In addition, only 11 per cent of program group members expect to collect IA benefits, compared with 20.1 per cent of the control group. However, 16.4 per cent of the program group expected to collect EI in one year’s time, compared to only 7.1 per cent of the control group.
Health and Subjective Well-Being The improved incomes and financial status, as well as the decrease in hardship
endured, may also improve the physical and psychological well-being of CEIP participants. There is an extensive volume of research linking health outcomes to income levels (see Feinstein, 1993, for a review of the literature). As well, the relationship between employment and health, over and above the effects of income, is argued to be one of the most important determinants of health (National Forum on Health, 1997). This positive relationship may work through a number of critical outcomes including improvements in social capital (Putnam, 2001; Helliwell, 2001) and social inclusion (Crawford, 2003), which CEIP has also positively influenced.
The CEIP evaluation is measuring “subjective” well-being with the extensively used Satisfaction With Life Scale (SWLS)7 (Pavot and Diener, 1993; Diener, 2000). Although it has been shown to be associated with income, the scale’s intent is to measure life as a whole, using the respondent’s own norms. As a result, individuals may implicitly include stable employment and income from CEIP, as well as any related positive impacts, as factors influencing their happiness.
Although the early impact analysis found that CEIP had no impact on self-assessed physical health and activity limitations of program group members, the program did lead to a decrease in dissatisfaction with life. Since participants’ health and well-being could further evolve, it is important to revisit these impacts after the full three years of CEIP eligibility.
7 The Satisfaction With Life Scale (SWLS) consists of five statements, to which respondents can answer using the five-point scale “strongly disagree,” “disagree,” “neither agree nor disagree,” “agree,” or “strongly agree.” The statements are:
1) In most ways my life is close to ideal. 2) The conditions of my life are excellent. 3) I am satisfied with my life. 4) So far I have gotten the important things in my life; and 5) If I could live my life over, I would change almost nothing. A confirmatory factor analysis was conducted with the five questions that identified a single dimension. A SWLS score was then calculated by summing across the five items. A score of 15 is the neutral point — indicative of an individual that is equally satisfied and dissatisfied, while scores ranging from 5 to 9 indicates a person that is extremely dissatisfied, 10 to 14 dissatisfied, 16 to 20 satisfied, and 21 to 25 are indications of being extremely satisfied with life.
- 67 -
The bottom of Table 4.7 shows estimates of CEIP’s impacts on program group members’ overall health and life satisfaction. Results at the time of the 18-month survey showed that CEIP had a small but statistically insignificant effect in improving program members’ health, among both EI and IA sample, and that remained true for this survey. Since the majority of program and control group members reported excellent or very good health (about 70 per cent), there may have been little room for any improvement.
Among the EI sample, CEIP led to small improvements in program group members’ satisfaction with life. The average Life Satisfaction Scale score (on a scale 5 to 25) of program group members was 0.5 points higher than the control group members and the difference is statistically significant. As well, only 1.8 per cent of the program group members were extremely dissatisfied with their lives, compared to 3.7 per cent of the control group. The reduction of dissatisfaction is slightly smaller than previously found in the 18-month report.
Previously, CEIP appeared to have had a small but favourable impact on IA program participants, who reported satisfaction with life at the time of the18-month survey. At the time of the 40-month survey, however, the average Life Satisfaction Scale score of program group members among the IA sample was 0.2 point higher than the control group and the difference is small and statistically insignificant.
SUMMARY CEIP reduced reliance on EI and IA benefits throughout the three-year eligibility
period, as well as increasing personal income of program group members. Among the IA sample, it also encouraged spouses of program group members to work and improved household income. In turn, it improved the financial status and employment expectations of participants. It also reduced hardship endured by both EI and IA program group members and improved the life satisfaction of the EI program group. In general, CEIP improved the overall welfare of program group members.

- 68 -
Chapter 5: Impacts on Social Capital
The availability of social capital can make all the difference between a successful job search and an unsuccessful one. Unfortunately, social capital may, like human capital, deteriorate rapidly with increasing periods of unemployment. Thus, its availability tends to be lowest among the population that needs it most — the chronically unemployed. Previous chapters have documented the various positive economic impacts of the Community Employment Innovation Project (CEIP) observed during the three years of eligibility. Did the program also enhance participants’ social capital?
The concept of social capital has come under increasing scrutiny by policy-makers, and efforts to define and measure it have multiplied. This chapter will briefly review some of these efforts, focusing on the social network approach, which emphasizes network characteristics that are measurable and possibly influenced by policy. This approach effectively distinguishes social capital from the activities it may generate, such as volunteering and civic participation. Although volunteering activities are important in their own right (and are considered in a subsequent chapter), participation in such activities does not necessarily provide evidence for the types of network dynamics that are thought to be crucial for the development of social capital. This chapter will review the impacts CEIP had on the social networks of program group members. The approach will be slightly different from that of previous chapters, in that the focus will be on longitudinal measures of change charting network development in the 40-month period from enrolment in CEIP to the end of eligibility.
OVERVIEW: SOCIAL CAPITAL
A Network-Based Definition The central concept of social capital — that sociability is linked to individual well-
being, economic and otherwise — may be intuitively obvious, but has proven difficult to put into practice. From a policy perspective, increasing the social capital of populations at risk of social exclusion, such as the chronically unemployed, is a desirable goal, but one that requires an operational framework for the measurement and analysis of social capital. How does one even know when social capital has increased? Some have suggested measures of social capital that utilize attitudinal norms such as trust, or behaviour such as volunteering and civic participation (Putnam, 2000, 2001). Others have cautioned that such attitudes and behaviour are precursors or consequences of social capital and that social capital cannot be quantified by simply measuring one of its possible precursors or outcomes (Woolcock, 2001).
The conceptual quagmire around social capital has led to a widespread proposal that the definition be narrowed to focus on networks and resources — more specifically, that social capital be defined as a resource that arises from social networks, the value of which stems from the fact that it can open up access to other resources, depending upon the
- 69 -
characteristics of the network (Levesque & White, 1999; Woolcock, 2001; Policy Research Initiative, 2003; Gyarmati² & Kyte, 2003). In other words, the value of social capital at an individual level depends upon the resources to which it can be converted, which are in turn a function of network structure. One advantage of this definition is that it distinguishes between social capital itself (which arises from networks) and possible normative and behavioural consequences and determinants of network formation (for example, trust and volunteering).
Network Structure and Access to Resources Certain types of resources require specific types of networks. For example, emotional
support after the loss of a job can best be sought from family and close friends, but reference letters require an employment network, usually made up of less intimate ties. In general, the types of resources provided by closer and more distant ties are quite different, so much so that social capital is often dichotomized accordingly — bonding social capital refers to close or “strong” ties, while bridging social capital refers to more distant or “weak” ties.
Networks based exclusively on bonding social capital differ from those that also include bridging social capital in a number of ways. Because people generally prefer to be with other people who are similar to them, networks based on strong ties form easily and are usually fairly homogeneous and dense, in the sense that most people in the network may know one another. Weak ties, because of the social and physical distances involved, form less easily and are more costly to maintain — however, they may provide access to a wider variety of resources. Close ties are often redundant in the sense that repeated interactions within the same group of individuals bring no new knowledge or information. The introduction of a more distant tie may provide a connection to a new network, and as a result new ideas and opportunities (Woolcock & Narayan, 2000). If weaker ties include “vertical” linkages with persons of higher socioeconomic status or in positions of power and influence — known as linking social capital — they may provide significantly more “leverage”, where new ideas and opportunities can be converted into economic gain.
A classic example of the relative advantages and disadvantages of bonding and bridging social capital is found in Wellman (1979). He found that denser, more interconnected networks had a facilitating effect on exchanges and coordination of effort, but that the resources available from such exchanges were less varied. For less interconnected networks, the inverse was true — less well-coordinated exchanges, but a wider variety of accessible resources. In some cases, then, it may be more beneficial to have ties to a number of networks than many ties within a single network. An example is the classic study by Granovetter (1974) who showed that weak ties were more useful than stronger ties in finding a job.
To assess the effects of CEIP on social capital, several measures of network structure and resource accessibility were used. Survey questions were asked at the point of enrolment to establish a baseline for each respondent, then again at 18, 40, and 54 months after enrolment. Questions on access to resources included resources that would normally be available within bonding networks — such as help with household chores and emotional support — as well as those that may be more readily found within bridging

- 70 -
networks (such as help finding a job and specialized advice). The latter of these indicators — contacts for specialized consultations with lawyers and doctors, for instance — is one possible measure of vertical linkages and the presence of linking social capital. Strong and weak ties were assessed with questions on the number of contacts who were family members, close friends, or acquaintances. Network density was assessed with a question on interconnectedness between contacts. Finally, network heterogeneity was assessed with questions about how similar contacts were along a number of dimensions.
How Might CEIP Enhance the Social Capital of Participants? Unemployed individuals in areas of chronic high unemployment like Cape Breton
tend to have small networks that are predominantly characterized by strong ties and few potential bridges to the labour market. One of the goals of CEIP was to help participants build bridging/linking social capital — in other words, less dense, more heterogeneous networks with a better balance between strong and weak ties, and with access to a wider variety of labour market resources. CEIP set up several mechanisms by which bridging/linking social capital could develop.
First, the simple opportunity of holding a steady job for up to three years ensured that participants could make new contacts in the workplace. Second, because participants were encouraged to work on several different projects during their three-year eligibility period, they could potentially connect with a broad range of people from both within and outside their communities. Third, because the projects were focused in the social economy and aimed at community improvement, they often involved the provision of services to wider community members, allowing participants to meet not just their co-workers and CEIP sponsors, but larger groups of community members.
CEIP may be best at improving bridging social capital, and, in particular, linking social capital. Although participants were randomly selected from communities throughout the Cape Breton Regional Municipality (CBRM), there were only five participating CEIP communities that developed projects and received CEIP workers. As a result, many participants were placed in communities throughout industrial Cape Breton, outside of their hometown, giving them the opportunity to increase more distant contacts and enhance bridging social capital. Furthermore, participants may develop linking social capital by meeting individuals, including project sponsors, who possess extensive social networks and are in positions of influence. Before receiving CEIP participant workers, project sponsors were required to demonstrate that they had adequate resources, both financial and otherwise, for a successful project. In many cases, sponsors were prominent members of the communities and those with greater access to community resources and existing networks. This gave participants the opportunity to expand their networks and gain access to previously unavailable resources, beyond what they would have been in a position to develop without CEIP.

- 71 -
IMPACTS ON SOCIAL CAPITAL DEVELOPMENT OVER 40 MONTHS
Access to Resources Table 5.1 presents CEIP impacts on total network size, as well as specific resources
available from the network, for both EI and IA samples. There was no impact on network size for either sample over the 40-month period, as the mean total number of contacts grew at roughly the same rate for program and control groups. However, the value of social capital lies not only in the number of links one possesses, but rather the resources to which one’s links can provide access.
Among the EI sample, contacts gained by the program group provided a different range of resources than those gained by the control group. More specifically, EI program recipients gained on average one extra contact relative to their control group counterparts that could provide specialized advice and 1.5 extra contacts that could help find a job. There was no concurrent program impact on contacts providing help with household chores or emotional support, suggesting that the additional contacts gained by EI program recipients did not provide broad, all-purpose help, but instead provided help in specialized areas associated with bridging and linking rather than bonding social capital.

- 72 -
Table 5.1: Number of Contacts Able to Provide Various Resources
Program Control Standard Program Control Standard Group Group Error Group Group Error
Total number of contactsMean at baseline 10.3 10.7 -0.3 (0.7) 8.6 8.6 0.0 (0.6)Mean at 18 months 11.8 11.7 0.1 (0.7) 12.1 11.5 0.6 (1.2)Mean at 40 months 13.8 13.4 0.4 (0.9) 13.1 11.2 1.9 (1.3)Mean change from baseline to 40 months 3.3 2.8 0.5 (1.0) 4.5 2.5 2.0 (1.3)
Resources associated with bonding social capitalNumber of contacts who provide help with household choresMean at baseline 5.6 5.7 -0.2 (0.4) 3.9 3.8 0.2 (0.3)Mean at 18 months 7.5 6.9 0.6 (0.4) 5.9 5.9 0.1 (0.6)Mean at 40 months 7.9 7.5 0.3 (0.5) 6.3 6.6 -0.2 (0.9)Mean change from baseline to 40 months 2.2 2.0 0.2 (0.6) 2.4 2.8 -0.4 (0.9)Number of contacts who provide emotional supportMean at baseline 5.5 5.5 0.0 (0.4) 5.1 4.9 0.2 (0.4)Mean at 18 months 7.4 7.1 0.2 (0.5) 7.7 7.1 0.7 (0.9)Mean at 40 months 8.0 8.3 -0.2 (0.6) 7.2 6.4 0.8 (1.0)Mean change from baseline to 40 months 2.5 2.6 -0.1 (0.6) 2.1 1.4 0.7 (1.0)
Resources associated with bridging and linking social capitalNumber of contacts who provide specialized adviceMean at baseline 2.8 3.0 -0.2 (0.2) 2.7 2.6 0.1 (0.3)Mean at 18 months 4.0 4.1 -0.1 (0.3) 4.0 3.9 0.1 (0.4)Mean at 40 months 4.9 4.0 0.9 *** (0.3) 3.7 3.7 0.0 (0.6)Mean change from baseline to 40 months 2.1 1.1 1.0 *** (0.3) 1.0 1.0 0.0 (0.6)Number of contacts who provide help finding a jobMean at baseline 4.1 4.4 -0.4 (0.3) 3.5 2.8 0.7 ** (0.3)Mean at 18 months 6.0 5.8 0.2 (0.4) 5.6 5.8 -0.2 (0.8)Mean at 40 months 7.6 6.4 1.2 * (0.6) 6.8 6.1 0.6 (0.9)Mean change from baseline to 40 months 3.5 2.0 1.5 ** (0.6) 3.2 3.3 0.0 (0.9)
Sample size 410 365 775 196 192 388
Difference(Impact)
EI Sample IA SampleDifference(Impact)
Source: Calculations from 40-month follow-up survey data. Notes: Sample sizes vary for individual measures because of missing values. Mean change is not always the difference between the 40 month mean and the mean at baseline, because changes are only
calculated for those with no missing values. Two-tailed t-tests were applied to differences between the outcomes for the program and control groups. Statistical significance levels are indicated as: * = 10 per cent; ** = 5 per cent; *** = 1 per cent. Rounding may cause slight discrepancies in sums and differences.
Job contacts made up the fastest growing resource in the EI program group, almost doubling over the 40-month period. Subgroup analysis reveals that the impact was restricted to those with especially low annual incomes. Figure 5.1 shows that over the 40-month period, CEIP provided on average three extra job contacts that would have otherwise been unavailable to those with annual incomes below $20,000 at baseline.

- 73 -
There was no program impact on those with incomes of $20,000 and higher. This suggests that CEIP prevents the most vulnerable of the chronically unemployed — those with especially low incomes, who tend to be mostly women with children, including the majority of lone parents in the sample — from lagging behind in the development of links to the labour market.
Figure 5.1: Average Number of Contacts who Can Provide Help Finding a Job by Income Group
0
1
2
3
4
5
6
7
8
9
10
Baseline 18-month 40-month Baseline 18-month 40-month
Baseline Household Income < $20k Baseline Household Income >= $20k
Num
ber o
f Con
tact
s
Program Control Program Control
Source: Calculations from baseline, 18-month and 40-month follow-up survey data. Notes: The sample sizes of the baseline, 18-month and 40-month sample are 848, 797 and 767, respectively.
There were no apparent impacts of CEIP on the average number of contacts for resources available to the IA sample. For example, both the program and control groups registered gains of roughly three job contacts over the 40-month period, doubling their number of job contacts at baseline. However, simply looking at the number of contacts that can provide a certain resource does not reveal whether these contacts are all part of the same network or whether they act as bridges between networks. For example, three job contacts that are all part of the same network are more likely to offer redundant information than three contacts from different networks.

- 74 -
Structural Characteristics of Networks: Tie Strength and Network Density Table 5.2 presents CEIP impacts on network density as well as presence of strong and
weak ties in the network. Few if any impacts on tie strength were present at 18 months.1 However, there were significant impacts at 40 months, particularly among the IA sample.
In the IA sample, both program recipients and control group members started off with networks mainly composed of family members, with minimal presence of acquaintances. Although the composition of control group networks remained at about 50 per cent family throughout the 40-month period, program group networks changed significantly. At baseline, the average program group network was composed of 56 per cent family and only 12 per cent acquaintances — almost a 5 to 1 ratio. By 40 months, the ratio had diminished to 2 to 1 — 41 per cent family versus 20 per cent acquaintances, significantly lower and higher respectively than in the control group. Over the 40-month period, CEIP recipients in the IA sample substantially increased their proportion of acquaintances — that is, weak ties who could act as potential bridges to other networks — while control group networks remained static.
In the EI sample, there was also a significant difference between program and control groups in terms of change in proportion of acquaintances over the 40-month period. However, the impact was smaller than in the IA sample, and involved the relative presence of acquaintances diminishing in the control group rather than rising in the program group.
The bottom panel of Table 5.2 presents impacts of CEIP on network density. Program groups in both the EI and IA samples were more likely than their control group counterparts to show a reduction in network density over the 40-month period. As discussed in the introduction to this chapter, a high degree of interconnectedness implies a high degree of redundancy in the resources network members can offer each other. In the EI sample, despite random assignment, the program group unexpectedly had denser networks on average than the control group at baseline, with a significantly higher proportion reporting that all their contacts knew each other. However, over the 40-month period, one-third of program group members had a reduction in network density compared to only one quarter of the control group. Most reductions in density involved a transition from a network where all or most members knew each other to one where only some knew each other — by 40 months, the proportion reporting that only some of their contacts knew each other was 7 percentage points higher in the program group. Thus, CEIP recipient networks, having started off on average denser than those of their control group counterparts, had by 40 months become less dense.
1 In the EI sample, there was a tendency for CEIP participants to have a lower proportion of friends in their networks at
18 months.
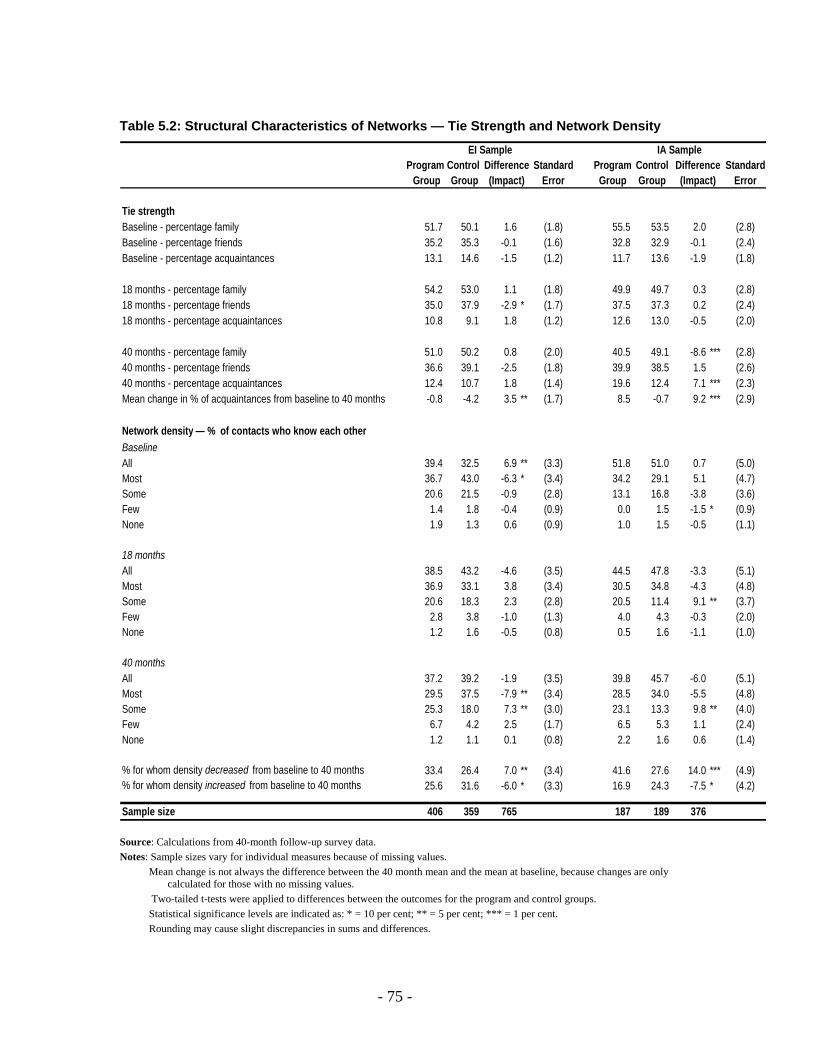
- 75 -
Table 5.2: Structural Characteristics of Networks — Tie Strength and Network Density
Program Control Standard Program Control Standard Group Group Error Group Group Error
Tie strengthBaseline - percentage family 51.7 50.1 1.6 (1.8) 55.5 53.5 2.0 (2.8)Baseline - percentage friends 35.2 35.3 -0.1 (1.6) 32.8 32.9 -0.1 (2.4)Baseline - percentage acquaintances 13.1 14.6 -1.5 (1.2) 11.7 13.6 -1.9 (1.8)
18 months - percentage family 54.2 53.0 1.1 (1.8) 49.9 49.7 0.3 (2.8)18 months - percentage friends 35.0 37.9 -2.9 * (1.7) 37.5 37.3 0.2 (2.4)18 months - percentage acquaintances 10.8 9.1 1.8 (1.2) 12.6 13.0 -0.5 (2.0)
40 months - percentage family 51.0 50.2 0.8 (2.0) 40.5 49.1 -8.6 *** (2.8)40 months - percentage friends 36.6 39.1 -2.5 (1.8) 39.9 38.5 1.5 (2.6)40 months - percentage acquaintances 12.4 10.7 1.8 (1.4) 19.6 12.4 7.1 *** (2.3)Mean change in % of acquaintances from baseline to 40 months -0.8 -4.2 3.5 ** (1.7) 8.5 -0.7 9.2 *** (2.9)
Network density — % of contacts who know each otherBaselineAll 39.4 32.5 6.9 ** (3.3) 51.8 51.0 0.7 (5.0)Most 36.7 43.0 -6.3 * (3.4) 34.2 29.1 5.1 (4.7)Some 20.6 21.5 -0.9 (2.8) 13.1 16.8 -3.8 (3.6)Few 1.4 1.8 -0.4 (0.9) 0.0 1.5 -1.5 * (0.9)None 1.9 1.3 0.6 (0.9) 1.0 1.5 -0.5 (1.1)
18 monthsAll 38.5 43.2 -4.6 (3.5) 44.5 47.8 -3.3 (5.1)Most 36.9 33.1 3.8 (3.4) 30.5 34.8 -4.3 (4.8)Some 20.6 18.3 2.3 (2.8) 20.5 11.4 9.1 ** (3.7)Few 2.8 3.8 -1.0 (1.3) 4.0 4.3 -0.3 (2.0)None 1.2 1.6 -0.5 (0.8) 0.5 1.6 -1.1 (1.0)
40 monthsAll 37.2 39.2 -1.9 (3.5) 39.8 45.7 -6.0 (5.1)Most 29.5 37.5 -7.9 ** (3.4) 28.5 34.0 -5.5 (4.8)Some 25.3 18.0 7.3 ** (3.0) 23.1 13.3 9.8 ** (4.0)Few 6.7 4.2 2.5 (1.7) 6.5 5.3 1.1 (2.4)None 1.2 1.1 0.1 (0.8) 2.2 1.6 0.6 (1.4)
% for whom density decreased from baseline to 40 months 33.4 26.4 7.0 ** (3.4) 41.6 27.6 14.0 *** (4.9)% for whom density increased from baseline to 40 months 25.6 31.6 -6.0 * (3.3) 16.9 24.3 -7.5 * (4.2)
Sample size 406 359 765 187 189 376
Difference(Impact)
EI Sample IA SampleDifference(Impact)
Source: Calculations from 40-month follow-up survey data. Notes: Sample sizes vary for individual measures because of missing values. Mean change is not always the difference between the 40 month mean and the mean at baseline, because changes are only
calculated for those with no missing values. Two-tailed t-tests were applied to differences between the outcomes for the program and control groups. Statistical significance levels are indicated as: * = 10 per cent; ** = 5 per cent; *** = 1 per cent. Rounding may cause slight discrepancies in sums and differences.

- 76 -
CEIP had even larger impacts on network density in the IA sample. Forty-two per cent of program recipients had a reduction in network density over the 40-month period, compared to only 28 per cent of control group members. As in the EI sample, most reductions in density involved transitions from all or most network members knowing each other to only some knowing each other. In terms of the proportion of participants reporting only some interconnectedness within their networks, the 9 percentage point difference between program and control groups at 18 months was maintained at 40 months.
Although CEIP appeared to have little impact on resources available to IA participants, the changes in network structure among program recipients imply that they gained different kinds of contacts than the control group. For example, although Table 5.1 shows that both IA program and control groups gained about three job contacts over the 40-month period, the program group’s increasingly less interconnected networks and more prominent weak ties over the same time period suggest that their new job contacts were more likely to be weak ties bridging several different networks.
Network Heterogeneity Since CEIP brought participants in touch with a range of individuals of different
genders, age groups, education levels and from different communities, one of the possible impacts of the program was to make networks less uniform along these dimensions. As Table 5.3 shows, however, CEIP appeared to have little impact on increasing network heterogeneity. In fact, for several measures, notably age and education level, both program and control networks seemed to become markedly more homogeneous over the 40-month period.2
In the EI sample, the program group had a slightly higher tendency to have network members of the opposite sex, but the impact was no longer significant when adjusted for baseline characteristics. There is some evidence that CEIP may have served to keep members of the EI sample in touch with people from outside their community. Over the 40-month period, the entire EI sample had an increase in proportion of network made up of fellow community residents, but the increase was 5 percentage points smaller for CEIP recipients than it was for the control group.3 Both program and control groups gained contacts within their communities over the 40-month period, but the program group was also able to retain or replace contacts from other communities within Cape Breton, while the control group had a tendency to lose such contacts. By 40 months, CEIP recipients had on average one extra contact from elsewhere in Cape Breton, compared to the control group.4 This result reflects the fact that although CEIP recipients were selected throughout Cape Breton, the program itself was only implemented in five communities, 2 These results are not easy to interpret since questions about fellow network members’ age and education proved difficult for some participants to answer at baseline, and were subsequently simplified. For example, at baseline, participants were asked how many of their contacts had less education, more education and similar levels of education as themselves; however, at 18 and 40 months, due to the response burden, they were only asked how many had similar levels. Thus the apparent increase in proportion of network members with similar levels of education may have resulted from the presence of fewer response options at 18 and 40 months compared to baseline.
3 When adjusted for baseline characteristics, the magnitude of this impact within the EI sample was larger (7 percentage points) and significant at the 5 per cent level.
4 Although the 40-month impact on contacts living somewhere else in Cape Breton is not significant in Table 5.3, it is significant at the 5 per cent level when adjusted for baseline characteristics.

- 77 -
thus offering many participants opportunities to meet people from outside their immediate communities.
Table 5.3: Network Heterogeneity
Program Control Difference Standard Program Control Difference Standard Group Group (Impact) Error Group Group (Impact) Error
Characteristics of ContactsProportion of Contacts that are
Same gender as youBaseline 60.0 59.8 0.2 (1.6) 61.8 63.7 -1.9 (2.4)18 months 60.0 63.3 -3.3 ** (1.6) 64.7 66.3 -1.6 (2.4)40 months 59.7 63.4 -3.8 ** (1.8) 68.8 68.0 0.8 (2.3)Change from baseline to 40 months 0.0 3.8 -3.8 * (2.1) 6.5 4.7 1.8 (2.8)
Within 10 years of your ageBaseline 38.6 39.4 -0.9 (2.0) 35.2 31.3 3.9 (2.8)18 months 62.6 59.1 3.4 * (2.1) 57.6 56.0 1.5 (2.8)40 months 66.8 65.3 1.5 (2.1) 57.1 60.3 -3.3 (3.1)Change from baseline to 40 months 28.5 24.5 3.9 (2.8) 22.6 28.8 -6.2 (4.2)
Same level of education as youBaseline 34.6 37.9 -3.4 (2.1) 34.5 34.3 0.2 (2.9)18 months 45.7 45.0 0.7 (2.4) 43.5 40.5 3.0 (3.4)40 months 50.7 51.7 -1.0 (2.5) 43.5 46.1 -2.6 (3.7)Change from baseline to 40 months 16.3 13.8 2.5 (2.9) 9.2 11.3 -2.1 (4.2)
Living within your communityBaseline 66.6 65.1 1.5 (2.4) 74.2 77.9 -3.6 (3.4)18 months 68.3 68.0 0.3 (2.4) 71.5 75.6 -4.1 (3.3)40 months 69.9 73.5 -3.6 (2.4) 73.9 74.5 -0.6 (3.4)Change from baseline to 40 months 3.1 8.3 -5.2 * (3.0) -1.3 -4.3 3.0 (4.5)
Number of contacts within and outside your communityLive within your communityBaseline 7.3 7.1 0.1 (0.6) 6.8 6.7 0.1 (0.9)18 months 7.7 7.0 0.8 (0.5) 8.5 7.8 0.7 (0.9)40 months 9.2 9.8 -0.5 (0.7) 9.4 7.8 1.5 (1.1)Change from baseline to 40 months 2.0 2.7 -0.8 (0.9) 2.5 1.0 1.6 (1.4)
Live somewhere else in Cape BretonBaseline 3.2 3.7 -0.4 (0.4) 2.2 1.8 0.4 (0.4)18 months 2.8 3.2 -0.4 (0.4) 2.7 2.5 0.3 (0.6)40 months 3.4 2.7 0.7 (0.4) 3.1 2.5 0.5 (0.6)Change from baseline to 40 months 0.0 -0.9 0.9 * (0.6) 1.1 0.7 0.4 (0.7)
Live outside Cape BretonBaseline 0.9 0.9 0.0 (0.2) 0.9 1.0 -0.1 (0.6)18 months 0.8 1.1 -0.2 (0.2) 0.8 1.0 -0.2 (0.5)40 months 1.1 1.0 0.1 (0.2) 0.9 0.9 0.0 (0.4)Change from baseline to 40 months 0.2 0.1 0.1 (0.3) 0.0 -0.1 0.1 (0.7)
Sample size 407 360 767 188 186 374
EI Sample IA Sample
Source: Calculations from 40-month follow-up survey data. Notes: Sample sizes vary for individual measures because of missing values. Mean change is not always the difference between the 40 month mean and the mean at baseline, because changes are only calculated for those with no missing values. Two-tailed t-tests were applied to differences between the outcomes for the program and control groups. Statistical significance levels are indicated as: * = 10 per cent; ** = 5 per cent; *** = 1 per cent. Rounding may cause slight discrepancies in sums and differences.

- 78 -
Composite Measures Based on Multiple Indicators of Improvements in Social Capital
This section has so far focused on individual indicators of enhanced social capital, each associated with the development of bridging or linking social capital. However, the presence of multiple indicators among CEIP recipients would provide stronger evidence of social capital impacts. Accordingly, two composite measures were developed, based on multiple indicators of improved social capital over the 40-month period. The first (composite measure A) combined the following four indicators:
• a gain of two or more contacts who could provide specialized advice; • a gain of two or more contacts who could provide help finding a job; • an increase of more than 5 percentage points in the proportion of contacts who are
acquaintances; and • a decrease in network density.
Smaller gains in the first three indicators (i.e. one contact or 5 or fewer percentage points) were not counted because they could more conceivably be attributed to “noise” from one measurement period to the next.
The second composite measure (composite measure B) added a fifth indicator — an increase of more than 5 percentage points in the proportion of contacts who are not from the participants’ community. This was added as a possible indicator of increased network heterogeneity, although it is not ideal as a standalone indicator of heterogeneity. For example, the majority of new contacts gained were not from outside but from within participants’ immediate communities. Information on how these contacts affected network heterogeneity with respect to age (and especially education) would ideally have been part of a composite measure. However, as mentioned, information on changes in the heterogeneity of age and education was not available due to measurement difficulties and possible response bias.
Both composite measures are presented in Table 5.4, and both reveal a similar pattern of results.
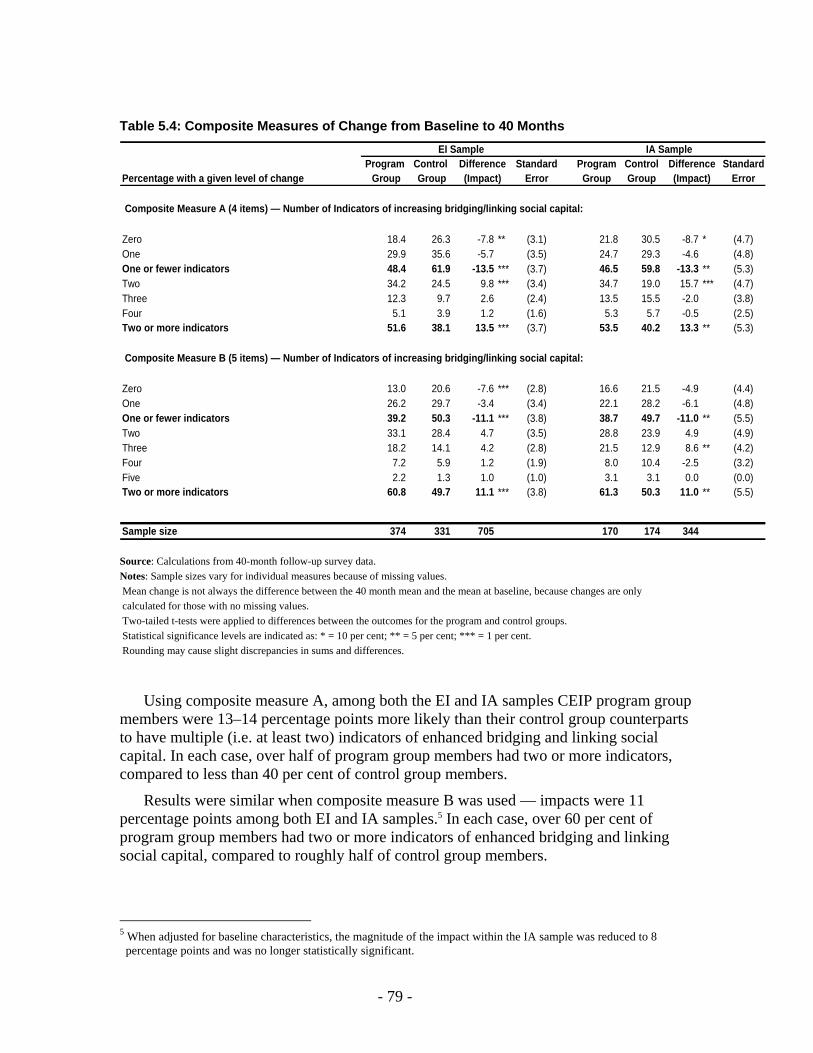
- 79 -
Table 5.4: Composite Measures of Change from Baseline to 40 Months
Program Control Standard Program Control StandardPercentage with a given level of change Group Group Error Group Group Error
Composite Measure A (4 items) — Number of Indicators of increasing bridging/linking social capital:
Zero 18.4 26.3 -7.8 ** (3.1) 21.8 30.5 -8.7 * (4.7)One 29.9 35.6 -5.7 (3.5) 24.7 29.3 -4.6 (4.8)One or fewer indicators 48.4 61.9 -13.5 *** (3.7) 46.5 59.8 -13.3 ** (5.3)Two 34.2 24.5 9.8 *** (3.4) 34.7 19.0 15.7 *** (4.7)Three 12.3 9.7 2.6 (2.4) 13.5 15.5 -2.0 (3.8)Four 5.1 3.9 1.2 (1.6) 5.3 5.7 -0.5 (2.5)Two or more indicators 51.6 38.1 13.5 *** (3.7) 53.5 40.2 13.3 ** (5.3)
Composite Measure B (5 items) — Number of Indicators of increasing bridging/linking social capital:
Zero 13.0 20.6 -7.6 *** (2.8) 16.6 21.5 -4.9 (4.4)One 26.2 29.7 -3.4 (3.4) 22.1 28.2 -6.1 (4.8)One or fewer indicators 39.2 50.3 -11.1 *** (3.8) 38.7 49.7 -11.0 ** (5.5)Two 33.1 28.4 4.7 (3.5) 28.8 23.9 4.9 (4.9)Three 18.2 14.1 4.2 (2.8) 21.5 12.9 8.6 ** (4.2)Four 7.2 5.9 1.2 (1.9) 8.0 10.4 -2.5 (3.2)Five 2.2 1.3 1.0 (1.0) 3.1 3.1 0.0 (0.0)Two or more indicators 60.8 49.7 11.1 *** (3.8) 61.3 50.3 11.0 ** (5.5)
Sample size 374 331 705 170 174 344
Difference(Impact)
EI Sample IA SampleDifference(Impact)
Source: Calculations from 40-month follow-up survey data. Notes: Sample sizes vary for individual measures because of missing values. Mean change is not always the difference between the 40 month mean and the mean at baseline, because changes are only calculated for those with no missing values. Two-tailed t-tests were applied to differences between the outcomes for the program and control groups. Statistical significance levels are indicated as: * = 10 per cent; ** = 5 per cent; *** = 1 per cent. Rounding may cause slight discrepancies in sums and differences.
Using composite measure A, among both the EI and IA samples CEIP program group members were 13–14 percentage points more likely than their control group counterparts to have multiple (i.e. at least two) indicators of enhanced bridging and linking social capital. In each case, over half of program group members had two or more indicators, compared to less than 40 per cent of control group members.
Results were similar when composite measure B was used — impacts were 11 percentage points among both EI and IA samples.5 In each case, over 60 per cent of program group members had two or more indicators of enhanced bridging and linking social capital, compared to roughly half of control group members.
5 When adjusted for baseline characteristics, the magnitude of the impact within the IA sample was reduced to 8 percentage points and was no longer statistically significant.

- 80 -
SUMMARY CEIP had much more pronounced impacts on social capital 40 months after
enrolment than were observed at 18 months. Substantial impacts were observed in those aspects of social capital commonly associated with the development of bridging or linking social capital — namely increased access to specific resources such as specialized advice and help finding a job, growth of weak ties, and reduction in network density. These results demonstrate that social capital can be enhanced through a community-based jobs program like CEIP. Furthermore, the fact that impacts have grown considerably in the second half of the program suggests that the longer duration employment and three-year eligibility period were significant factors in the development of social capital.
Nevertheless, these are only interim impacts, coinciding with the termination of the CEIP eligibility period. Forthcoming results from a 54-month follow-up survey will determine whether the social capital gains resulting from CEIP were maintained over a year after the program’s termination. As well, final surveys have been expanded to include questions on use of social networks in order to assess how participants utilize their social capital and explore its effects on other outcomes of interest including employment, income, and health and well-being.

- 81 -
Chapter 6: Impacts on Employability
There are several factors that determine an individual’s success in finding and keeping a job. For instance, knowledge obtained from formal training, generic or transferable skills, attitudes to work, and a willingness to move are factors that may influence one’s ability to find and maintain employment. During the Community Employment Innovation Project (CEIP) 40-month follow-up interview, information was collected on each of these factors in order to gauge the overall impact of CEIP on program group members. For although economic measures such as employment, income, and receipt of transfer payments were an important focus of the CEIP evaluation, non-economic measures such as social networks, volunteering, subjective well-being, attitudes towards work, and factors that relate to the ability to find and keep a job are all aspects of the participants’ lives that were expected to be influenced by CEIP.
SOFT SKILLS Generic skills are often called “soft” or non-cognitive skills, differentiating them from
more concrete cognitive or academic skills, which are usually measured using aptitude or achievement results such as IQ scores or level of education. Generic skills refer to all-purpose skills that are fundamental to performing a wide range of tasks in a wide range of occupations. They include, but are not limited to, communication skills, teamwork, positive work attitudes, and problem-solving skills. CEIP was expected to support the attainment and/or further development of generic skills as a by-product of participation in the varied and multiple work opportunities offered through the program. Several of the generic skills that CEIP measured, such as adapting to change and system thinking, are more likely to be gained through life experiences than through typical classroom teaching. There is no guarantee, however, that these CEIP-related experiences would produce or enhance participants’ soft skills over and above that which would have occurred without CEIP.
Various employer surveys document the importance of generic skills to labour market success, consistently expressing a preference for workers with adequate generic skills (Bowles, Gintis & Osborne, 2000). Furthermore, in the late 1980s and early 1990s, several research publications by international governments and research organizations acknowledged the need for soft skills, in addition to technical and academic qualifications. The Conference Board of Canada developed the Employability Skills Profile with input from Canadian employers (McLaughlin, 1992), which focuses on skills in communication, lifelong learning, positive attitudes and behaviours, teamwork, problem-solving skills, responsibility and adaptability.
Several other projects commonly list many of the same soft skills as skills required by employers. However, there is no common framework or consensus for assessing such skills. Soft skills are difficult to measure, because they are not known, easily verified factors such as height or weight, but instead are based on subjective judgement.

- 82 -
Moreover, they are often self-reported measures. Despite this, sociologists, psychologists, and, more recently, economists, have used various instruments and methods to examine the effects of soft skills on labour market success. Overwhelmingly, soft skills research indicates that non-cognitive skills have a positive effect on labour market success.
CEIP is evaluating soft skills using a subset of nine questions from Working: Assessing Skills, Habits, and Style,1 which assesses proficiency in nine workplace competencies — responsibility, teamwork, persistence, sense of quality, lifelong learning, adapting to change, problem solving, information processing, and system thinking. Each soft skill measure is described in Text Box 6.1.
Mechanisms by which CEIP Can Develop Generic Skills CEIP provided a range of jobs with a wide array of organizations through which
participants could conceivably acquire or continue to develop generic skills. The vast majority of jobs were in the service industry with voluntary or third-sector organizations, which required participants to be flexible and work at various positions on the job. Employability assessments were used in determining which types of jobs would be most suitable for participants. In some jobs, participants would have had to quickly adapt to working in a new environment, with new rules and new organizational culture. While some positions required independent work, others involved teamwork. Although largely positive among Employment Insurance (EI) sample members, results for the income assistance (IA) sample show mixed effects. Impact results on soft skills are shown in Table 6.1, for both EI and IA sample members.
1 Working: Assessing skills, habits, and style (Miles & Grummon, 1996) is a 50-item questionnaire that measures the
presence of nine competencies — responsibility, teamwork, persistence, sense of quality, lifelong learning, adaptability to change, problem solving, information processing, and systems thinking. The authors report that it is a statistically valid and reliable diagnostic instrument. CEIP program group members completed the 50 questions during assessment week. The Social Research and Demonstration Corporation (SRDC) performed exploratory factor analysis on a subsample of the data collected during assessment week to confirm the nine dimensions and identify one item that best captures each of them. These nine questions were used in subsequent CEIP telephone surveys. This shortened version of the questionnaire was necessary to reduce time constraints on survey respondents and yet capture the nine dimensions in the long version of the questionnaire.

- 83 -
Text Box 6.1: Measures of Soft Skills Each of the nine competencies used to measure soft skills is scored on a scale of 1 (almost always
like me) to 5 (almost never like me).
Responsibility. Responsibility is measured using the statement, “It really bugs me to see a problem that no one is trying to solve.” Persons with a sense of responsibility are able to take ownership of the tasks at hand, identify its components, and set priorities and targets to get it done satisfactorily.
Teamwork. Teamwork is measured using the statement, “I prefer to learn with other people.” This
statement measures the respondent’s comfort level for working with other people. Persistence. Persistence is measured with the statement, “I follow through on things no matter
what it takes.” This statement measures the respondent’s desire to satisfactorily finish a task that has been started but at the same time being able to recognize when an adequate amount of effort has been made.
Sense of Quality. Sense of quality relates to going beyond the mere minimum required to get the
job done. It is spending the extra time and effort to produce work that can be looked upon with pride. It is measured in the survey with the statement, “I can’t quit thinking about something until I’m sure I’ve done it well.”
Lifelong Learning. Lifelong learning encompasses the desire and motivation to continue learning in
order to keep up the ever-changing demands of the workplace. It is measured in the survey with the statement, “I prefer to know what’s in it for me before I spend a lot of effort learning something.”
Adaptability. Adaptability to change is measured in the survey with the statement, “I usually do
something I’ve enjoyed rather than try something different.” Adapting to change requires flexibility and the ability to adjust easily to varied experiences and changes in the workplace.
Problem Solving. Problem solving entails being able to recognize a problem, to dissect it, and
develop solutions for its resolution. This measure is captured with the statement, “I make a detailed plan before I tackle a complex problem.”
Information Processing. Information processing is the ability to amass and synthesize information
from various sources and experiences. It is measured in the survey with the statement, “I understand new things by seeing how they fit with what I already know.”
Systems Thinking. This measure looks at interrelationships and culture within an organization. It is
measured in the survey with the statement, “I know how to get things done in a system or an organization.”

- 84 -
Table 6.1: Impacts on Working Skills at the 40-Month Follow-Up Interview
EI Sample IA SampleProgram Control Standard Program Control Standard
Outcome Group Group Error Group Group Error
It really bugs me to see a problem that nobody is trying to solve
Almost always/quite a bit like me 74,8 78,9 -4,2 (2,9) 81,2 78,5 2,7 (4,0)Moderately like me 14,7 12,7 2,0 (2,4) 10,6 8,2 2,4 (2,9)Occasionally/almost never like me 10,5 8,4 2,1 (2,0) 8,2 13,3 -5,1 * (3,1)
I prefer to learn with other peopleAlmost always/quite a bit like me 64,5 66,4 -1,9 (3,3) 73,4 75,0 -1,6 (4,4)Moderately like me 22,8 21,1 1,7 (2,9) 15,9 15,3 0,6 (3,6)Occasionally/almost never like me 12,7 12,5 0,2 (2,3) 10,6 9,7 0,9 (3,0)
I follow through on things no matter what what it takes
Almost always/quite a bit like me 90,4 86,5 3,8 * (2,2) 89,4 87,7 1,7 (3,2)Moderately like me 7,3 10,2 -2,9 (2,0) 6,7 8,7 -2,0 (2,7)Occasionally/almost never like me 2,3 3,3 -1,0 (1,2) 3,8 3,6 0,3 (1,9)
I can't quit thinking about something untilI am sure they I have done it very well
Almost always/quite a bit like me 88,3 87,8 0,5 (2,3) 85,6 91,3 -5,7 * (3,2)Moderately like me 9,1 9,1 0,0 (2,0) 9,6 7,2 2,4 (2,8)Occasionally/almost never like me 2,6 3,0 -0,5 (1,2) 4,8 1,5 3,3 * (1,8)
I prefer to know what's in it for me beforeI spend a lot of effort learning something
Almost always/quite a bit like me 30,8 36,3 -5,6 * (3,3) 29,9 42,0 -12,1 ** (4,8)Moderately like me 30,0 28,9 1,1 (3,2) 28,4 30,1 -1,6 (4,6)Occasionally/almost never like me 39,2 34,8 4,4 (3,4) 41,7 28,0 13,7 *** (4,8)
I usually do something I enjoy ratherthan try something different
Almost always/quite a bit like me 29,8 38,4 -8,6 *** (3,3) 33,7 42,2 -8,5 * (4,9)Moderately like me 36,4 32,0 4,4 (3,3) 27,3 30,2 -2,9 (4,6)Occasionally/almost never like me 33,8 29,6 4,2 (3,3) 39,0 27,6 11,4 ** (4,7)
I make a detailed plan before I tackle a complex problem
Almost always/quite a bit like me 59,1 60,3 -1,2 (3,4) 60,4 61,7 -1,3 (4,9)Moderately like me 21,5 21,4 0,1 (2,9) 13,5 20,7 -7,2 * (3,8)Occasionally/almost never like me 19,4 18,3 1,1 (2,7) 26,1 17,6 8,5 ** (4,1)
Difference(Impact)
Difference(Impact)
(continued)

- 85 -
Table 6.1: Impacts on Working Skills at the 40-Month Follow-Up Interview (Cont’d)
EI Sample IA SampleProgram Control Standard Program Control Standard
Outcome Group Group Error Group Group ErrorI understand new things by seeing howthey fit with what I already know 78.1 80.1 -1.9 (2.9) 75.9 75.6 0.2 (4.3)
Almost always/quite a bit like me 15.3 13.0 2.3 (2.4) 18.7 17.6 1.1 (3.9)Moderately like me 6.6 6.9 -0.3 (1.8) 5.4 6.7 -1.3 (2.4)Occasionally/almost never like me
I know how to get things done in a system or an organization 86.4 80.9 5.5 ** (2.6) 78.2 83.0 -4.8 (4.0)
Almost always/quite a bit like me 9.6 12.5 -2.9 (2.2) 13.6 11.3 2.3 (3.3)Moderately like me 4.0 6.6 -2.6 * (1.6) 8.3 5.7 2.6 (2.6)Occasionally/almost never like me
Sample size 441 410 210 201
Difference Difference(Impact) (Impact)
Source: Calculations from the 40-month survey data. Notes: Sample sizes vary for individual measures because of missing values. This may cause slight discrepancies in sums and
differences. All analyses were only for those who responded to the 40-month survey. Two-tailed t-tests were applied to differences in outcomes between the program and control groups. Statistical significance
levels are indicated as: * = 10 per cent; ** = 5 per cent; *** = 1 per cent. Rounding may cause slight discrepancies in sums and differences. Sample size for the program group is 470 for the EI group and 237 for the IA group.
EI Sample Table 6.1 reveals that CEIP had a positive impact on four of the soft skills measured:
persistence, lifelong learning, adapting to change, and systems thinking. The results show an increase of 3.8 percentage points in the proportion of program group members that say they follow through on things no matter what (persistence). With respect to lifelong learning, 5.6 percentage points fewer program than control group members said they “prefer to know what’s in it for them before spending a lot of effort learning something new.”2
Program group members also show more willingness to be flexible and adapt to changes — 29.8 per cent of program group members versus 38.4 per cent of control group members said they usually do something they enjoy rather than try something new. The vast majority of program and control group members said they almost always know how to get things done in a system or organization. However, there was a difference of 5.5 percentage points between the two groups, which was statistically significant at the 5 per cent level of significance.
Compared to the early impact results, the 40-month findings are consistently positive and have grown in magnitude. Two of the four measures that yield positive impacts at 40 2 The adjusted impact on lifelong learning among the EI sample is slightly smaller in magnitude (4.8 percentage points) than the unadjusted estimate and it fails to reach statistical significance.

- 86 -
months, lifelong learning and adapting to change, were also positively influenced by CEIP halfway into the project, but were smaller in magnitude. The other two measures that yield positive results, persistence and system thinking, are newly observed impacts at 40 months. At the same time a negative impact observed at 18 months on the skill measure for responsibility was no longer present at 40 months.
IA Sample Among IA sample members, CEIP appears to have both positive and negative effects
on some measures of soft skills. For instance, there is a 5.1 percentage point decrease in the proportion of program group members who say they are occasionally or almost never bothered to see a problem that nobody is trying to fix. This indicates a positive impact on the willingness to take personal responsibility for required tasks.
CEIP also had a positive impact on IA program group members’ receptiveness to continuous learning and the ability to adapt to change. About 42 per cent of program group members versus 28 per cent of control group members said they “occasionally and almost never need to know what’s in it for them before spending a lot of effort learning something new.” At the same time, 30 per cent of program group members and 42 per cent of control group members said that this was almost always or quite a bit like them.
There was a statistically significant decrease in the proportion of program group members that said they almost always do things they enjoy rather than try something different relative to the control group (33.7 per cent of program group; 42.2 per cent of control group). This occurred with a simultaneous statistically significant increase in the proportion that said this was only occasionally or almost never like them — 39 per cent of the program group and 27.6 per cent of the control group. These results suggest that IA program group members are more likely to adapt to changes than their control group counterparts.
However, CEIP had a negative impact on IA program group members’ problem solving ability and a sense of quality. There was an 8.5 percentage point difference between program and control group members who said they only occasionally or almost never make a detailed plan before tackling a complex problem. This is coupled with a statistically significant decrease in the proportion that said this was only moderately like them. A decrease in attention to detail and a sense of quality was also observed among IA program group members when compared to their counterparts in the control group. However, both of these impacts are quite small and statistically insignificant following regression adjustment.
The negative effect on problem solving among IA program group members raises an important caveat about CEIP as it may be indicative of the quality and/or suitability of the assigned jobs for some participants. It is possible that some assigned positions would not have provided many opportunities for participants to engage in finding solutions to complex problems, and this result likely affirms the need for the design to incorporate a range of job placements options and a rigorous assessment and job-matching component to allow for the most suitable job placements.

- 87 -
Additional Subgroup Impacts: Problem Solving, Systems Thinking Differences in impacts on working skills were assessed along a number of additional
subgroups based on demographic characteristics measured at enrolment (see Appendix D). Although a few differences were found, most were small and only significant at the 10 per cent level, and/or were sensitive to regression adjustment of the impacts.
Two differences in subgroup impacts that were large, statistically significant, and of some policy relevance include the effects on problem solving and systems thinking. Among IA program group members, the negative impacts of CEIP on problem solving were experienced solely by women. Among EI program group members, the positive impacts on systems thinking were felt largely by those with less education and lower incomes at enrolment — those who could likely benefit a great deal from improved transferable skills.
ATTITUDES TOWARDS WORK AND TRANSFER PAYMENTS Arguments in favour of work-related interventions include not only the acquisition of
new skills — cognitive and non-cognitive — but also changes in behaviour. As such, it was expected that CEIP would result in changes in skill level and attitudes for those who received the treatment. Among IA sample members, few had prior long job tenure when they signed up for CEIP, and thus their attitude to work might have been influenced by having stable full-time employment. EI sample members had also been away from work for between 10 to 13 weeks when selected for CEIP and thus they too may have altered their attitude towards work by re-entering the workforce. Nonetheless, although CEIP participants were randomly selected, CEIP is a voluntary program, and those who eventually volunteered may have done so because they already had strong positive feelings about work.
The 40-month survey included five questions that might reveal whether CEIP caused changes in attitudes related to work and receipt of transfers. Table 6.2 presents findings on these questions. The results show that there were impacts on some personal beliefs that can be attributed to CEIP.
EI Sample CEIP had a positive impact on EI sample members’ attachment to work. While the
overwhelming majority of both program and control group members said they either agreed or agreed strongly with the statement “I like going to work,” there is a statistically significant increase (7.6 percentage points) in the proportion of program group members who strongly agreed with this statement. At the same time there is a statistically significant decrease (3.3 percentage points) in the proportion that disagreed with this statement.
The vast majority of EI sample members — program and control — said they agreed or agreed strongly with the statement, “It is wrong to stay on welfare if you are offered a

- 88 -
job, even one you don’t like.”3 However, there is a statistically significant increase in the proportion that agreed (6.2 percentage points) and 2.9 percentage point decrease in the proportion that disagreed.
IA Sample CEIP had a positive impact on the strength of IA sample members’ attitudes to work.
This is demonstrated by a large increase in the proportion that said they agreed strongly with the statement “I like going to work.” While 42.9 per cent of program group members mentioned they agreed strongly with the statement, only 29.4 per cent of control group members strongly agreed. CEIP also influenced the strength of IA program group members’ feelings about having a job: while overall the vast majority of program and control group members agreed or agreed strongly that they are happier when they have a job, there is a marked increase in the proportion of program group members who said they agreed strongly with this statement (14.2 percentage points).
Similarly, the vast majority of IA sample members stated that their family supports them taking a job. Although it may seem at first glance that CEIP had little impact on the percentage of program group members who held a positive attitude in this respect (either agree or strongly agree), we note a significant increase (of 16.8 percentage points) in those that “agreed strongly” at the expense of those who simply said they “agreed.” This pattern of shifting program group responses to the highest response category reflects a strengthened conviction of previously held positive attitudes. Although not suggestive of a radical change in attitudes, it is nonetheless a positive development that may be relevant to various outcomes related to employment including the intensity of job search activities.
3 The unadjusted results presented in this chapter do not show statistically significant impacts among IA sample members on attitudes about staying on welfare or taking EI if offered a job. However, after regression adjustment, IA program group members showed an 8.8 percentage point higher likelihood than their control group counterparts of strongly agreeing that it was wrong to stay on welfare if offered a job, and a 10.1 percentage point higher likelihood of strongly agreeing that it was wrong to take EI if offered a job. These impacts are significant at the 10 per cent and 5 per cent levels, respectively.

- 89 -
Table 6.2: Impacts on Attitude to Work and Transfer Payments at the 40-Month Follow-Up Interview
EI Sample IA SampleProgram Control Standard Program Control Standard
Outcome Group Group Error Group Group Error
I like going to workAgree strongly 31.5 23.9 7.6 ** (3.1) 42.9 29.4 13.5 *** (4.8)Agree 66.4 70.2 -3.8 (3.2) 56.7 67.5 -10.9 ** (4.9)Disagree 2.1 5.3 -3.3 ** (1.3) 0.0 3.1 -3.1 ** (1.2)Disagree strongly 0.0 0.5 -0.5 (0.3) 0.5 0.0 0.5 (0.5)
When I have a job I am a happier personAgree strongly 32.3 33.4 -1.1 (3.3) 46.3 32.1 14.2 *** (4.9)Agree 65.1 62.5 2.6 (3.4) 51.7 63.7 -12.0 ** (5.0)Disagree 2.5 4.1 -1.5 (1.2) 1.5 4.2 -2.7 (1.7)Disagree strongly 0.0 0.0 0.0 . 0.5 0.0 0.5 (0.5)
My family supports me taking a jobAgree strongly 34.4 32.0 2.4 (3.3) 43.6 26.8 16.8 *** (4.7)Agree 64.2 65.5 -1.3 (3.3) 53.9 70.1 -16.2 *** (4.8)Disagree 1.4 2.5 -1.2 (1.0) 2.0 3.1 -1.1 (1.6)Disagree strongly 0.0 0.0 0.0 . 0.5 0.0 0.5 (0.5)
It's wrong to stay on welfare if you areoffered a job, even one you don't like
Agree strongly 33.3 35.8 -2.4 (3.4) 40.0 32.8 7.2 (4.9)Agree 61.0 54.8 6.2 * (3.5) 50.5 52.4 -1.9 (5.1)Disagree 5.2 8.1 -2.9 * (1.7) 9.0 13.2 -4.2 (3.2)Disagree strongly 0.5 1.3 -0.8 (0.7) 0.5 1.6 -1.1 (1.0)
It's wrong to take Employment Insurance if you are offered a job, even one you don't like
Agree strongly 21.5 25.9 -4.5 (3.0) 33.8 26.3 7.5 (4.7)Agree 61.6 58.6 2.9 (3.5) 52.0 58.6 -6.6 (5.1)Disagree 16.0 14.4 1.6 (2.5) 13.1 14.0 -0.8 (3.5)Disagree strongly 0.9 1.0 -0.1 (0.7) 1.0 1.1 -0.1 (1.0)
Sample size 441 410 210 201
Difference(Impact)
Difference(Impact)
Source: Calculations from the 40-month survey data. Notes: Sample sizes vary for individual measures because of missing values. This may cause slight discrepancies in sums and
differences. All analyses were only for those who responded to the 40-month survey. Two-tailed t-tests were applied to differences in outcomes between the program and control groups. Statistical significance
levels are indicated as: * = 10 per cent; ** = 5 per cent; *** = 1 per cent. Rounding may cause slight discrepancies in sums and differences.

- 90 -
EDUCATION AND TRAINING Education is an important variable in determining a person’s employability. Besides
there being general consensus among labour economists that education is an important factor in determining labour market success, there is also a plethora of research evidence documenting the widening earnings gap between those with and without post-secondary education. That being said, CEIP was not an education or training program; it was a community employment intervention. CEIP provided only a limited amount of ancillary activities to program group members that could be classified as training. This included basic job-readiness training and some core vocational courses including Occupational Health and Safety (OHS) and Cardiopulmonary Resuscitation (CPR). In order to pursue other education and training options, CEIP program group members would have had to do so on their own time. CEIP rules allowed program group members to take an unpaid leave of absence from the program to pursue education and training without losing their eligibility.
Program group members could also have chosen to combine work with education and training during their three-year eligibility. However, not many were expected to pursue this option because CEIP rules required active participants to be available to work 35 hours per week, leaving little room to pursue any time-intensive training. Thus, one possible effect of CEIP might have been to discourage the enrolment in non-CEIP training among program group members.
Table 6.3 presents the impacts of CEIP on enrolment and completion of non-CEIP-provided training. While participants from both the program and control group were equally likely to be enrolled in non-CEIP-provided education and training (about 30 percentage points), control group members were more likely to enrol in vocational or college classes, which typically require a large investment of time. For example, among EI sample members, there was a negative impact on courses taken towards a trade or vocational diploma or certificate (1.8 per cent of program group members versus 4.4 per cent of control group members), which is statistically significant at the 5 per cent level of significance. There was also a decrease in the proportion of IA program group members that took courses towards a college diploma or certificate (3.3 per cent versus 8 per cent for program and control groups, respectively), which is statistically significant at the 5 per cent level of significance.4 It is worth noting that the courses most often mentioned were those taken to improve job skills and job requirement, followed by personal interest or life skills courses, with no statistically significant difference between program and control group members. These results confirm the expectation that a program offering stable full-time employment with long duration will affect the types of training activities that program group members are engaged in outside of the program. However, in light of the time constraints faced by program group members who were active in the program, it is surprising that the effects were so small. There was no statistically significant effect on enrolment in any training (considered in aggregate) and only small decreases in the
4 Adjusted impacts also show a statistically significant decrease of 11 percentage points in the proportion of IA
program group members who enrolled in any non-CEIP provided training.

- 91 -
percentage enrolled in particular certificate or diploma programs (less than five percentage point reduction).
Table 6.3: Impacts on Non-CEIP-Provided Training at the 40-Month Follow-Up Interview
EI Sample IA SampleProgram Control Standard Program Control Standard
Outcome Group Group Error Group Group Error
Non-CEIP-provided training since enrolment 30.4 30.7 -0.4 (3.2) 24.0 31.3 -7.3 (4.4)
Courses taken towards:Improving job skills/job requirement 22.9 20.0 2.9 (2.8) 12.4 15.4 -3.0 (3.4)
High school diploma 2.3 1.7 0.6 (1.0) 3.3 4.0 -0.6 (1.9)Apprenticeship diploma/certificate 0.9 0.5 0.4 (0.6) 1.0 0.5 0.5 (0.8)Trade/vocational diploma or certificate 1.8 4.4 -2.6 ** (1.2) 3.3 4.5 -1.1 (1.9)College diploma or certificate 6.3 6.8 -0.5 (1.7) 3.3 8.0 -4.6 ** (2.3)University degree 2.0 2.0 0.1 (1.0) 1.0 1.5 -0.5 (1.1)Personal interest or life skills 16.1 15.2 0.9 (2.5) 9.0 7.5 1.6 (2.7)Job requirement 2.3 2.4 -0.2 (1.0) 4.8 7.5 -2.7 (2.4)Other 0.0 0.0 0.0 . 0.5 1.0 -0.5 (0.8)
Completed training 23.8 25.1 -1.3 (3.0) 18.1 23.4 -5.3 (4.0)
Still taking training 5.7 3.9 1.8 (1.5) 3.8 6.0 -2.2 (2.1)Sample size 441 410 210 201
Difference(Impact)
Difference(Impact)
Source: Calculations from the 40-month survey data. Notes: Sample sizes vary for individual measures because of missing values. This may cause slight discrepancies in sums and
differences. All analyses were only for those who responded to the 40-month survey. Two-tailed t-tests were applied to differences in outcomes between the program and control groups. Statistical significance
levels are indicated as: * = 10 per cent; ** = 5 per cent; *** = 1 per cent. Rounding may cause slight discrepancies in sums and differences.
JOB SEARCH Prior to the end of their three-year eligibility period, participants were encouraged to
engage in active job search and were given up to seven hours off each week during the final three months of their CEIP participation to look for work and to attend interviews. Job search activities were expected to continue beyond the CEIP eligibility period, even though program participants were entitled to claim EI benefits after their CEIP employment. CEIP’s impacts on the intensity of job search soon after the eligibility period are early indicators of labour market transitions experienced by the program participants. Table 6.4 presents the estimates of CEIP’s impacts on job search activities.

- 92 -
Table 6.4: Impacts on Job Search at the 40-Month Follow-Up Interview
Program Control Standard Program Control StandardOutcome Group Group Error Group Group Error
Looking for a job at time of interview 55.7 35.6 20.1 *** (3.4) 58.1 37.8 20.3 *** (4.8)
Would look for a different kind of work 77.5 73.3 4.2 (3.0) 79.8 78.6 1.2 (4.0)
Weekly hours usually spent looking for work 4.0 2.8 1.2 ** (0.5) 6.0 3.1 2.9 *** (0.8)
While looking for work, checked with the following:A government agency 43.0 25.4 17.5 *** (3.2) 45.7 29.0 16.7 *** (4.7)A private employment agency 13.4 7.6 5.8 *** (2.1) 9.1 7.0 2.1 (2.7)A union 7.7 5.6 2.1 (1.7) 5.3 5.0 0.3 (2.2)Directly with employers 40.9 25.4 15.5 *** (3.2) 48.1 31.0 17.1 *** (4.8)Friends or relatives 46.8 30.1 16.7 *** (3.3) 48.6 31.5 17.1 *** (4.8)Newspaper and or internet ads 50.2 33.0 17.2 *** (3.3) 53.8 35.5 18.3 *** (4.9)
Sample size 440 410 210 201
EI Sample IA SampleDifference(Impact)
Difference(Impact)
Source: Calculations from the 40-month survey data. Notes: Sample sizes vary for individual measures because of missing values. This may cause slight discrepancies in sums and
differences. All analyses were only for those who responded to the 40-month survey. Two-tailed t-tests were applied to differences in outcomes between the program and control groups. Statistical significance
levels are indicated as: * = 10 per cent; ** = 5 per cent; *** = 1 per cent. Rounding may cause slight discrepancies in sums and differences.
CEIP had large positive impacts on job search activities at the point of the second follow-up interview. Among the EI sample, more than half of program group members were looking for a job, compared with only about one-third of the control group. Program group members also spent more time looking for a job than their control group counterparts — four hours per week among the program group versus 2.8 hours per week for the control group. These large positive impacts are not surprising, given the fact that eligibility for CEIP jobs was coming to an end and job search assistance was provided in the last three months of the project. Nonetheless, it confirms that program group members were actively engaged in seeking out non-CEIP to a much greater extent.
Given that there are significantly more program participants looking for a job, the percentage of program participants using a particular method to look for a job is also expected to be higher; as evidenced by the popularity of checking newspaper or internet ads, friends and relatives, government agencies, and directly with employers. At least 40 per cent of program group members used these methods — or 15 percentage points more than the control group. CEIP also has a 5.8 percentage point impact on the use of private employment agencies, but this option is comparatively less popular. There is no significant difference between the program group and the control group in checking with
- 93 -
a union for a job, and both the program and control group members are overwhelmingly open to different kinds of work.
The job search activities of the IA sample program group members were very similar to those of the EI sample. For instance, CEIP had large positive impacts on the percentage of people looking for a job, the amount of time spent looking for a job, and the places that participants looked for a job. More than half of the program group members were engaged in job search activities when they were interviewed. Program group members also spent more time looking for a job than their control group counterparts — 6 hours per week among the program group versus 3.1 hours per week for the control group. As for the EI sample, job search activities focused on newspaper or internet ads, friends and relatives, government agencies, and employers. No significant impact was observed on the proportion of people who checked with a private employment agency or a union for a job. There is also no difference in the attitude towards finding a different type of work.
MOBILITY Cape Breton has experienced chronic high unemployment rates for several years, in
large part due to the closure of the coal and steel industries in that area, which were the mainstay of the economy. Communities are also plagued with high out-migration of inhabitants in search of stable employment. As a result, for several years now the population of the Cape Breton Regional Municipality (CBRM) has shown a downward trend, continued in 2006 although at a slightly slower rate. Statistics Canada’s (2007b) recent census report on communities shows a decrease in the total population of CBRM by 3.6 per cent from 2001 to 2006 — from 105,968 individuals in 2001 to 102,250 in 2006. This is not surprising since the movement of people from rural areas or small towns with high unemployment to large urban centres is a universal phenomenon. A priori, CEIP evaluators did not expect CEIP program group members to migrate outside of Cape Breton at a higher rate than their control group counterparts during their eligibility period, since a steady job provided an incentive to remain in the CBRM. If anything, we should expect a reduction in out-migration.
There are reasons other than employment for individuals to migrate from place to place. People also move to secure better housing, to be closer to family, to study, or because a partner moved for work-related reasons. In fact, given the job stability of program group members during the 3 years of CEIP, it is more likely that they may move to new residences in their communities or other areas of CBRM for reasons such as better housing and/or closer proximity to CEIP community placements. They may also migrate within or outside Cape Breton for family reasons.5
As shown in Table 6.5 below, the positive impacts that were observed at 18 months on changes in residences in Cape Breton and on reasons for moving are not sustained at
5 A caveat to the migration analysis is that it is based only on respondents to the 40-month survey; however, it is possible that non-respondents are those that moved away from Cape Breton and were untraceable by Statistics Canada.

- 94 -
40 months.6 There are no statistically significant impacts on movement within communities at 40 months, within Cape Breton, or migration elsewhere. This may be because the bulk of residential changes occurred during the first half of the project as soon as participants were able to afford better housing. It is notable, however, that the most often cited reason for moving at the 40-month mark continues to be related to housing quality, with no statistically significant differences between program and control group.
Table 6.5: Impacts on Mobility at the 40-Month Follow-Up Interview
Program Control Standard Program Control StandardOutcome Group Group Error Group Group Error
Percentage of respondents moved: 17.2 17.6 -0.3 (2.6) 31.4 29.4 2.1 (4.5)
Within community 6.8 7.1 -0.3 (1.7) 12.9 12.9 -0.1 (3.3)To another community in Cape Breton 7.1 7.5 -0.4 (1.8) 15.3 12.0 3.4 (3.5)
Outside of Cape Breton 2.8 2.0 0.8 (1.1) 3.0 1.0 1.9 (1.4)
Reasons for movingWork-related (own or partner's) 3.9 4.2 -0.3 (1.3) 4.3 3.0 1.3 (1.9)Family-related 2.9 1.7 1.2 (1.0) 6.7 5.0 1.7 (2.3)Housing 8.2 9.3 -1.2 (1.9) 14.8 14.9 -0.2 (3.5)Other 2.3 2.0 0.3 (1.0) 5.7 6.5 -0.8 (2.4)
Sample size 441 410 210 201
EI Sample IA SampleDifference(Impact)
Difference(Impact)
Source: Calculations from the 40-month survey data. Notes: Sample sizes vary for individual measures because of missing values. This may cause slight discrepancies in sums and
differences. All analyses were only for those who responded to the 40-month survey. Two-tailed t-tests were applied to differences in outcomes between the program and control groups. Statistical significance
levels are indicated as: * = 10 per cent; ** = 5 per cent; *** = 1 per cent. Rounding may cause slight discrepancies in sums and differences.
Additional Subgroup Impacts: Out-Migration Differences in impacts on residential mobility were assessed along a number of
additional subgroups based on demographic characteristics measured at enrolment (see Appendix D). Although a few differences in impacts were found on mobility, both within participants’ own communities and to other communities in Cape Breton, most were small and statistically insignificant in each of the individual subgroups. A few small differences in impacts on out-migration were statistically significant (between and within key groups). Among EI program group members, those who were single (i.e. never married, separated, or divorced) and those with low incomes (less than $20,000) at enrolment were slightly more likely to have moved outside of Cape Breton. Among the IA sample, program group members under the age of 30 moved out of Cape Breton at a 6 Results from adjusted impacts show a small statistically significant increase in IA program group members who moved outside Cape Breton (3 percentage points), which is significant at the 10 per cent level of significance.

- 95 -
slightly higher rate than their control group counterparts. However, each of these impacts is quite small, between 3 and 5 percentage points (see Appendix D).
When interviewed at 40 months, the CEIP eligibility period had just expired for most sample members, and program group members may have had to start looking outside Cape Breton to find steady employment. Proponents and critics of the CEIP project have argued that with newly acquired skills and social networks from CEIP, program group members may have a stronger impetus to seek employment elsewhere. A clearer picture should emerge when the post CEIP effects are examined using data from the 54-month survey.
SUMMARY Although there were only modest expectations that CEIP would yield positive in-
program impacts on non-economic measures of employability, the 40-month results showed that the incremental employment that CEIP provided is associated with small but positive impacts on several of these measures. Although CEIP did not actively promote the acquisition of non-cognitive generic skills to its participants, it appears to be a by-product of stable employment, basic job-readiness training, and the varied work experiences afforded to CEIP program group members. These results demonstrate that a community-based employment program can produce positive effects on skills and attitudes to work that are relevant to employability, even in the context of lower skilled community jobs.
However, the results also lead to a number of caveats. The negative effects observed on problem solving among the IA sample may be indicative of the quality and/or suitability of the assigned jobs for some participants. This likely affirms the need for the design to incorporate a range of job placements options and a rigorous assessment and job-matching component to allow for the most suitable job placements.

- 96 -
Chapter 7: Impacts on Volunteering
This chapter looks at the impact of the Community Employment Innovation Project (CEIP) on the extent of volunteering among program group members. Volunteering is important for both individuals and communities. It clearly serves as a great resource for communities, as most organizations in the voluntary sector rely quite heavily on unpaid volunteers. It is also valuable for the volunteer, as it can provide a link to the community and greater levels of social inclusion, as well as opportunities for the development of social capital and a bridge to employment. However, CEIP distinguishes volunteerism from social capital, even though it can be a mechanism for increasing (or decreasing) said capital.
The question of interest for the CEIP study is whether the extent of volunteering among CEIP program group members is higher (or lower) than what would have occurred without their participation in the program. Expectations regarding the effects of CEIP on volunteering are unclear. CEIP jobs were primarily in the “third sector,” which brought CEIP participants into contact with non-profit organizations, which have community-driven missions that historically depend on volunteers in their day-to-day operation. This presents opportunities for some to not only learn about how they can get involved in volunteering, but it may also trigger the volunteer spirit and a greater commitment to a similar altruistic mission as that of the organization. Nevertheless, CEIP requires active program group members to work 35 hours per week, which may impose time constraints for some participants who could prefer to use their non-CEIP time for pursuits other than volunteering.
IMPACTS ON VOLUNTEERING Volunteering is defined as freely performing a job or providing a service without pay.
Some volunteer through an organization — this is known as formal volunteering — while others may provide help directly to the needy rather than through and organization, which is known as informal volunteering.
Formal Volunteering Although there may be several reasons for volunteering, there is an underlying
assumption that formal volunteering activities are more likely to build human capital because they occur in an organizational setting and are therefore more likely to provide opportunities to develop work-related contacts and work experience than informal volunteering. Indeed, 47 per cent of Canadians cite networking or meeting people as a motivation for formal volunteering, and 22 per cent want to improve their job opportunities (Statistics Canada, 2006).

- 97 -
Table 7.1 presents impacts of CEIP on formal volunteering with groups or organizations for both the Employment Insurance (EI) and income assistance (IA) groups.
EI Sample The first panel in Table 7.1 shows that CEIP had a positive impact on the frequency
of volunteering among EI sample members. There was a smaller proportion of program group members who had never volunteered in the last 12 months (10.2 percentage points) compared to the control group. Also, the percentage of the EI program group who reported volunteering daily was 2.4 percentage points higher, and volunteering less than once a month 4 percentage points higher, relative to the control group.
The second panel of Table 7.1 shows that EI program group members had higher volunteer rates for several activities, including canvassing and fundraising, serving on a board or committee within an organization, organizing or supervising activities, assisting with office or administrative work, proving support or counselling, helping collect, serve or deliver food, and being a volunteer driver for an organization.
The third panel shows that EI program group members were more likely to have increased their hours of volunteering in the past 12 months, and volunteered on average for 3.4 hours more per month than control group members. As shown in the final panel, several sample members volunteered for more than one organization, resulting in a 7.5 percentage point impact on volunteering for two to three organizations.
IA Sample CEIP led to higher rates of volunteering among IA sample members as well. Almost
three-quarters (73.4 per cent) of control group members said they had never volunteered in the last 12 months, compared to about half (51.9 per cent) of program group members. A further subgroup analysis (Appendix D) shows that these results were driven by single (i.e. never married, separated or divorced) IA program group members and those with no children living in the household. The percentage of IA program group members who reported volunteering a few times a week, once a month, and less than once a month was at least 5 percentage points higher (5.6, 5.0 and 7.0 percentage points, respectively) relative to the control group.
There were also higher rates of participation among IA program group members for several activities. When compared to their counterparts in the control group, higher proportions of IA program group members assisted a group or organization with canvassing and fundraising, contributed as a member of a board or committee, organized or supervised activities, coached for an organization, helped with office or administrative work, and collected, served or delivered food. This was accompanied by a higher average number of hours per month of formal volunteering among the IA program group.

- 98 -
Table 7.1: Impacts on Formal Volunteering with Groups or Organizations
EI Sample IA SampleProgram Control Difference Standard Program Control Difference Standard Group Group (Impact) Error Group Group (Impact) Error
Frequency of formal volunteeringHow often did you volunteer in last 12 months
Every day 3.9 1.5 2.4 ** (1.1) 2.4 1.0 1.4 (1.3)A few times a week 9.4 7.3 2.0 (1.9) 9.6 4.0 5.6 ** (2.5)About once a week 11.6 9.8 1.9 (2.1) 10.6 8.0 2.5 (2.9)About once a month 9.4 9.5 -0.2 (2.0) 12.5 7.5 5.0 * (3.0)Less than once a month 12.6 8.5 4.0 * (2.1) 13.0 6.0 7.0 ** (2.9)Never 53.2 63.4 -10.2 *** (3.4) 51.9 73.4 -21.4 *** (4.7)
Types of unpaid formal volunteeringAssisted a group or organization by
Canvassing, campaigning, fundraising 22.0 15.7 6.4 ** (2.7) 22.9 13.4 9.4 ** (3.8)Acting as member of board or committee 15.2 11.0 4.2 * (2.3) 11.4 4.5 7.0 *** (2.7)Providing info or helping educate public 12.5 9.3 3.2 (2.1) 13.8 10.0 3.9 (3.2)Organizing or supervising actvities 29.3 19.4 10.0 *** (2.9) 29.0 12.9 16.1 *** (4.0)Teaching or coaching 10.7 7.8 2.8 (2.0) 14.3 7.0 7.3 ** (3.0)Providing office or administrative work 13.6 7.4 6.3 *** (2.1) 12.4 5.5 6.9 ** (2.8)Providing care, support, or counseling 14.1 7.1 7.0 *** (2.1) 13.3 9.5 3.9 (3.1)Collecting, serving, or delivering food 13.2 9.6 3.6 * (2.2) 17.6 11.4 6.2 * (3.5)Volunteering as driver 10.2 5.9 4.3 ** (1.9) 8.1 5.5 2.6 (2.5)Other 12.3 7.1 5.2 ** (2.0) 13.3 9.5 3.9 (3.1)
Hours of formal volunteeringAverage hours per month 8.2 4.7 3.4 *** (1.0) 7.1 4.5 2.6 * (1.4)% of sample that volunteered
>0 to 5 hours per month 12.9 13.0 -0.1 (2.3) 14.1 7.7 6.4 ** (3.2)>5 to 15 hours per month 16.1 12.5 3.7 (2.4) 13.6 6.2 7.5 ** (3.0)>15 hours per month 15.9 9.2 6.7 *** (2.3) 13.6 10.3 3.4 (3.3)Did not volunteer 55.1 65.3 -10.3 *** (3.4) 58.6 75.9 -17.3 *** (4.7)
Change hours volunteered in last 12 monthsIncreased 14.1 8.1 6.0 *** (2.2) 14.9 7.5 7.4 ** (3.1)Stayed the same 77.6 86.8 -9.2 *** (2.6) 77.4 85.9 -8.5 ** (3.8)Decreased 8.4 5.1 3.2 * (1.7) 7.7 6.5 1.2 (2.6)
Number of organizationsAverage # of organizations volunteeered for 0.9 0.6 0.3 *** (0.1) 0.9 0.5 0.4 *** (0.1)Percentage of sample that volunteered for
1 organization 21.4 20.3 1.1 (2.8) 26.8 14.4 12.4 *** (4.0)2-3 organizations 20.5 13.0 7.5 *** (2.6) 15.8 9.5 6.3 * (3.3)4 or more organizations 4.1 2.4 1.7 (1.2) 4.8 2.0 2.8 (1.8)Did not volunteer 54.0 64.3 -10.3 *** (3.4) 52.6 74.1 -21.5 *** (4.7)
Sample size 441 410 210 201
Source: Calculations from 40-month follow-up survey data. Notes: Sample sizes vary for individual measures because of missing values. Two-tailed t-tests were applied to differences between the outcomes for the program and control groups. Statistical significance levels are indicated as: * = 10 per cent; ** = 5 per cent; *** = 1 per cent. Rounding may cause slight discrepancies in sums and differences.

- 99 -
Informal Volunteering Table 7.2 presents the impacts of CEIP on the scope of informal volunteering
performed by program group members. Looking at results for the EI sample, a relatively small impact of 5.9 percentage points is observed in program group members who reported that they volunteered about once a month.1 There is also an increase in two types of informal volunteering: yardwork and care for the elderly, with an impact of 11 and 4.6 percentage points, respectively.
Although there are no significant impacts among EI sample as a whole on never volunteering, there are significant differences for two subgroups of EI program group members that experience a reduction in never volunteering, when compared to their control group counterparts. In particular, EI program group members who had a high school diploma or equivalent at baseline and those with an annual baseline income of less than $20,000 both reported lower incidence of having never volunteered.
A full 10 percentage points fewer program group members than control group members reported that they had never volunteered during the last 12 months. The results from subgroup analyses (Appendix D) show that only IA program group members who were employed for six years or more had a statistically significant reduction in the proportion that said they never volunteered. The results on frequency of volunteering also show that a larger proportion of IA program group members relative to control group members reported volunteering less than once a month.
1 The results from adjusted impacts yield slightly different results. For instance, when adjusted for selected baseline characteristics, the percentage of those reporting participation in informal volunteering about once a month is not statistically significant, while a few times a week is 4.9 percentage points higher among EI program group members and statistically significant at the 10 per cent level of significance. Also, fewer program than control group members said they extended help to others less than once a month or never, which is statistically significant at the 10 per cent level of significance.

- 100 -
Table 7.2: Impacts on Informal Volunteering
EI Sample IA SampleProgram Control Difference Standard Program Control Difference Standard Group Group (Impact) Error Group Group (Impact) Error
Frequency of informal volunteeringHow often did you volunteer in last 12 months
Every day 1.8 3.5 -1.6 (1.1) 3.5 5.6 -2.1 (2.1)A few times a week 16.1 12.4 3.7 (2.4) 19.4 20.2 -0.8 (4.0)About once a week 15.4 14.7 0.7 (2.5) 15.4 14.1 1.3 (3.6)About once a month 22.3 16.4 5.9 ** (2.7) 17.9 12.1 5.8 (3.6)Less than once a month 10.3 13.7 -3.3 (2.2) 14.9 9.1 5.8 * (3.3)Never 34.0 39.3 -5.3 (3.3) 28.9 38.9 -10.0 ** (4.7)
Types of unpaid informal volunteeringProvided informal help to someone with
Housework such as cooking or cleaning 24.8 24.0 0.8 (3.0) 36.1 37.7 -1.6 (4.8)Yardwork such as gardening or painting 48.2 37.2 11.0 *** (3.4) 45.7 43.7 2.0 (4.9)Shopping or driving 35.1 32.5 2.6 (3.3) 38.9 33.7 5.3 (4.8)Unpaid childcare/babysitting 20.6 19.8 0.8 (2.8) 34.1 37.7 -3.6 (4.8)Care or support for sick or elderly 19.3 14.7 4.6 * (2.6) 31.7 26.1 5.6 (4.5)Writing letters or filling out forms 18.8 18.1 0.7 (2.7) 27.9 25.1 2.8 (4.4)Unpaid teaching or coaching 8.7 7.6 1.1 (1.9) 12.0 6.5 5.5 * (2.9)A farm or business 3.0 2.4 0.5 (1.1) 2.9 4.0 -1.1 (1.8)Other 1.4 0.5 0.9 (0.7) 0.5 0.0 0.5 (0.5)
Sample size 441 410 851 210 201 411 Source: Calculations from 40-month follow-up survey data. Notes: Sample sizes vary for individual measures because of missing values. Two-tailed t-tests were applied to differences between the outcomes for the program and control groups. Statistical significance levels are indicated as: * = 10 per cent; ** = 5 per cent; *** = 1 per cent. Rounding may cause slight discrepancies in sums and differences.
Volunteering and Working Volunteering takes time. Therefore, it is plausible that persons working full-time, in
year-round jobs would have lower rates of volunteering, or less time spent volunteering, than those not working, working at part-time jobs, or working for only part of the year. This section looks at how CEIP jointly affected volunteering and full-time work of more (or less) than 10 of 12 months preceding the 40-month interview.2 Table 7.3 shows CEIP impacts on working and volunteering (formal and informal). Hence, the incremental full-time employment arising from CEIP does not in fact discourage formal volunteering. The pattern of results for informal volunteering also suggests that employment does not discourage participants from engaging in the activity.
2 The 12-month period preceding the 40th month since enrolment does not always align with the 12-month period preceding the 40-month interview, as interviews may have occurred a few months after the 40-month mark. Nonetheless, this is not expected to substantively alter these findings.
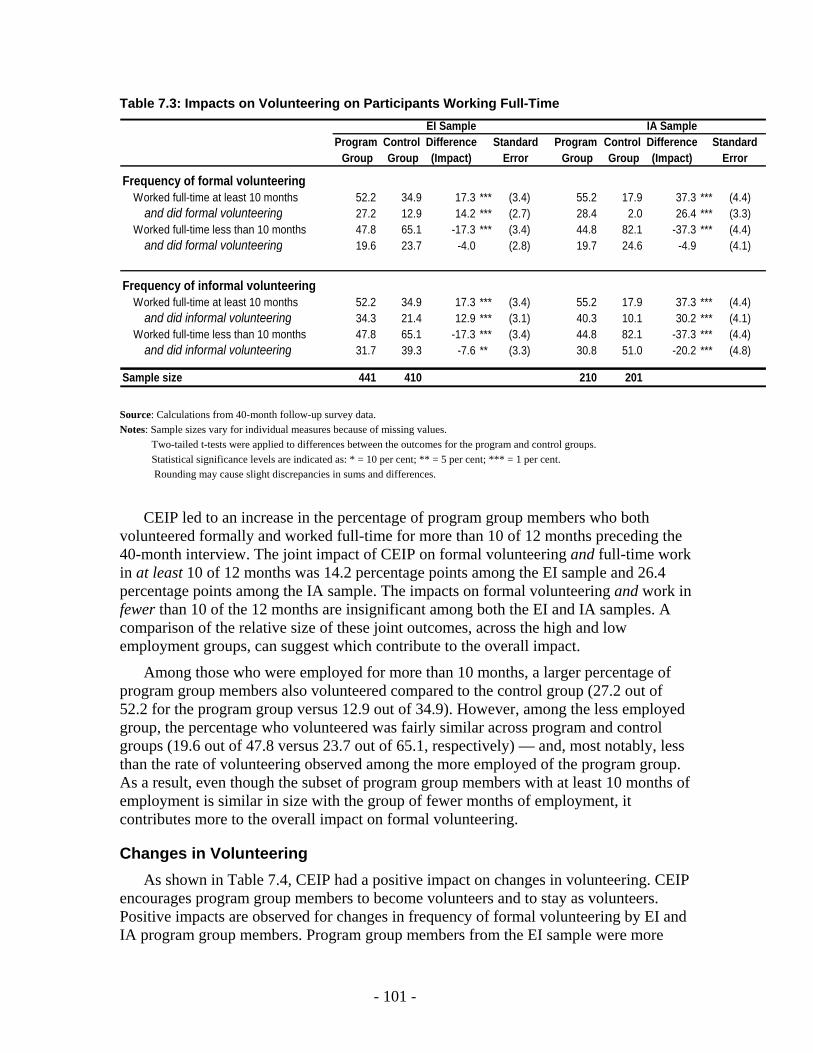
- 101 -
Table 7.3: Impacts on Volunteering on Participants Working Full-Time EI Sample IA Sample
Program Control Difference Standard Program Control Difference Standard Group Group (Impact) Error Group Group (Impact) Error
Frequency of formal volunteeringWorked full-time at least 10 months 52.2 34.9 17.3 *** (3.4) 55.2 17.9 37.3 *** (4.4)
and did formal volunteering 27.2 12.9 14.2 *** (2.7) 28.4 2.0 26.4 *** (3.3)Worked full-time less than 10 months 47.8 65.1 -17.3 *** (3.4) 44.8 82.1 -37.3 *** (4.4)
and did formal volunteering 19.6 23.7 -4.0 (2.8) 19.7 24.6 -4.9 (4.1)
Frequency of informal volunteeringWorked full-time at least 10 months 52.2 34.9 17.3 *** (3.4) 55.2 17.9 37.3 *** (4.4)
and did informal volunteering 34.3 21.4 12.9 *** (3.1) 40.3 10.1 30.2 *** (4.1)Worked full-time less than 10 months 47.8 65.1 -17.3 *** (3.4) 44.8 82.1 -37.3 *** (4.4)
and did informal volunteering 31.7 39.3 -7.6 ** (3.3) 30.8 51.0 -20.2 *** (4.8)
Sample size 441 410 210 201 Source: Calculations from 40-month follow-up survey data. Notes: Sample sizes vary for individual measures because of missing values. Two-tailed t-tests were applied to differences between the outcomes for the program and control groups. Statistical significance levels are indicated as: * = 10 per cent; ** = 5 per cent; *** = 1 per cent. Rounding may cause slight discrepancies in sums and differences.
CEIP led to an increase in the percentage of program group members who both volunteered formally and worked full-time for more than 10 of 12 months preceding the 40-month interview. The joint impact of CEIP on formal volunteering and full-time work in at least 10 of 12 months was 14.2 percentage points among the EI sample and 26.4 percentage points among the IA sample. The impacts on formal volunteering and work in fewer than 10 of the 12 months are insignificant among both the EI and IA samples. A comparison of the relative size of these joint outcomes, across the high and low employment groups, can suggest which contribute to the overall impact.
Among those who were employed for more than 10 months, a larger percentage of program group members also volunteered compared to the control group (27.2 out of 52.2 for the program group versus 12.9 out of 34.9). However, among the less employed group, the percentage who volunteered was fairly similar across program and control groups (19.6 out of 47.8 versus 23.7 out of 65.1, respectively) — and, most notably, less than the rate of volunteering observed among the more employed of the program group. As a result, even though the subset of program group members with at least 10 months of employment is similar in size with the group of fewer months of employment, it contributes more to the overall impact on formal volunteering.
Changes in Volunteering As shown in Table 7.4, CEIP had a positive impact on changes in volunteering. CEIP
encourages program group members to become volunteers and to stay as volunteers. Positive impacts are observed for changes in frequency of formal volunteering by EI and IA program group members. Program group members from the EI sample were more

- 102 -
likely to make the transition from non-volunteer to volunteer and less likely to make the reverse transition compared to the EI control group members. Among EI program group members there is an increase of 6 percentage points of baseline non-volunteers who become volunteers at 40 months. This is accompanied by 8.5 percentage points fewer baseline volunteers in the program group reporting that they had never engaged in formal volunteering activities at 40 months.3
Similarly, among those who did not engage in formal volunteering at baseline, IA program group members reported higher rates of volunteering at 40 months and fewer were still non-volunteers at 40 months. While about 18 per cent of IA program group members who started as non-volunteers also reported volunteering at the 40-month mark, only 6 per cent of control group members reported doing so. Among IA program group members who started CEIP as volunteers, CEIP led to an increase in those who continued to volunteer at 40 months (9.8 percentage points), and at the same level as before (5.6 percentage points). Thirteen per cent fewer program group members who started CEIP as volunteers reported no formal volunteer activities at 40 months.
There were no impacts for IA program group members for measures of changes in informal volunteering, however, impacts were observed for EI program group members among those who started as volunteers. A higher proportion of EI program group members, who started CEIP as volunteers, reported still volunteering at the 40-month mark, which yields an impact of 7 percentage points.
SUMMARY CEIP had substantial positive effects on volunteering among program group
members, in particular among IA program group members for whom such results were not observed midway through CEIP. The percentage of both EI and IA program group members engaged in formal volunteer activities increased as a result of CEIP. Furthermore, the average hours of volunteering per month by program group members increased. The results are especially interesting since they occurred even while many program group members were working full-time hours, suggesting that full-time employment did not discourage volunteering.
3 Adjusted impacts for these measures also revealed a statistically significant difference between EI program and control group members who were non-volunteers at baseline and 40 months — 6 percentage points fewer EI program group members are still non-volunteers at 40 months. EI program group members who started as volunteers are also more likely to be still volunteers at 40 months, and more likely to volunteer at the same or at an increased level.

- 103 -
Table 7.4: Changes in Informal and Formal Volunteering from Baseline to 40 Months
Program Control Standard Program Control Standard Group Group Error Group Group Error
Changes in frequency of formal volunteering
Started as non-volunteers at baselineStill non-volunteers at 40 months 35.1 36.9 -1.8 (3.3) 36.7 45.2 -8.5 * (4.9)Volunteers at 40 months 12.8 6.8 6.0 *** (2.1) 17.9 6.0 11.8 *** (3.2)
Started as volunteers at baselineStill volunteers at 40 months 33.9 29.6 4.4 (3.2) 30.4 20.6 9.8 ** (4.3) …at same level 11.9 9.3 2.6 (2.1) 11.6 6.0 5.6 ** (2.8) …at an increased level 12.2 9.0 3.1 (2.1) 9.7 7.0 2.6 (2.8) …at an decreased level 9.9 11.2 -1.4 (2.1) 9.2 7.5 1.6 (2.8)Non-volunteers at 40 months 18.1 26.7 -8.5 *** (2.9) 15.0 28.1 -13.2 *** (4.0)
Changes in frequency of informal volunteering
Started as non-volunteers at baselineStill non-volunteers at 40 months 7.8 8.7 -0.9 (1.9) 8.0 11.6 -3.6 (3.0)Volunteers at 40 months 3.9 5.5 -1.6 (1.5) 6.0 4.0 2.0 (2.2)
Started as volunteers at baselineStill volunteers at 40 months 62.1 55.1 7.0 ** (3.4) 65.0 57.1 7.9 (4.9) …at same level 16.1 16.5 -0.4 (2.6) 13.5 15.2 -1.7 (3.5) …at an increased level 16.1 12.5 3.6 (2.4) 20.5 17.7 2.8 (3.9) …at an decreased level 29.9 26.2 3.7 (3.1) 31.0 24.2 6.8 (4.5)Non-volunteers at 40 months 26.2 30.7 -4.5 (3.1) 21.0 27.3 -6.3 (4.3)
Sample size 441 410 210 201
Difference(Impact)
EI Sample IA SampleDifference(Impact)
Source: Calculations from 40-month follow-up survey data. Notes: Sample sizes vary for individual measures because of missing values. Mean change is not always the difference between the 40 month mean and the mean at baseline, because changes are only
calculated for those with no missing values. Two-tailed t-tests were applied to differences between the outcomes for the program and control groups. Statistical significance levels are indicated as: * = 10 per cent; ** = 5 per cent; *** = 1 per cent. Rounding may cause slight discrepancies in sums and differences.
- 104 -
Chapter 8: Summary of Findings
This report has reviewed the interim effects of the Community Employment Innovation Project (CEIP) on participants over a period that covers the full three years of program eligibility. Although these results do not include any significant post-program period, they provide important evidence regarding the full in-program effects of a community-based jobs program with long-term eligibility. Previous community employment initiatives have generally involved short duration work of no more than a year. CEIP is arguably unique, not only because it focuses on the social economy, but because its long-term design provides a wider range of work placements to participants. This potentially offers a wider array of opportunities for social capital and skill development that may improve employability.
The 40-month interim impact study has sought to address several questions regarding the sustainability and possible growth of effects that were observed in the early impact study. Results from this second impact analysis demonstrate that not only are large employment and earnings gains sustainable over three years of program eligibility, but also the quality of jobs were improved, including the skill levels of positions held, the varied nature of work experiences they offered, and the extent of job stability. Furthermore, the longer period of program eligibility may be an important factor in many of the other positive non-economic effects on participants that were observed including improvements in social capital, transferable skills, attitudes to work, and volunteering. Although these results do not incorporate any significant post-program period, they provide important evidence regarding the full in-program effects.
CEIP led to substantially higher rates of full-time employment, increased earnings, and reduced receipt of Employment Insurance (EI) and income assistance (IA) benefits, all of which were sustained for the three years of eligibility.
Monthly full-time employment rates among EI program group members were at least 30 percentage points higher than for the control group for most of the eligibility period. Among the IA sample, impacts on full-time employment were even more dramatic, sustained at nearly 50 per cent over the full period of eligibility.
As a result of the impacts on employment, CEIP had a large cumulative effect on earnings over the course of the three-year period of eligibility. Total earnings of EI program group members were $14,000 higher (36 per cent) than those of the control group after 38 months. Impacts were even larger among program group members in the IA sample, where earnings increased by more than $25,000, or 151 per cent, over the same period.
High rates of ongoing participation in CEIP and significant program satisfaction tend to confirm the hypothesis that the program was in fact of continued interest to the eligible group of volunteers. A very low percentage of program group members left CEIP during

- 105 -
their eligibility to return to EI or welfare and, consequently, large and sustained reductions in the receipt of such benefits were observed during the life of the program.
While CEIP had a major incremental impact in the creation of full-time employment, one important question remains: what will happen when CEIP’s three-year community placements are over? Among EI program group members, a little over one-third of those employed full-time were working in non-CEIP jobs near the end of their eligibility, while the same was true for only 10 per cent of the IA program group members. This indicates that a significant proportion of both samples relied on CEIP positions until the end of the eligibility period, which is likely to result in a marked decline in employment levels for these participants when the program ends. The severity and duration of this decline remains to be seen and will be a major focus of the final impact study.
CEIP’s most heavily felt effects were on particular disadvantaged groups, including those experiencing employment barriers, lower incomes, and those with fewer social supports. Although large employment gains were observed throughout both EI and IA program
groups, impacts were somewhat larger among those with lower initial incomes, those with employment barriers arising from health or activity restrictions, and those with smaller social networks. Given that these groups are more disadvantaged, an offer of stable long-term community jobs could have been expected to lead to larger incremental employment impacts. However, there were some doubts as to whether individuals facing one or several employment barriers could maintain these jobs. Results suggest that these groups can maintain long-duration employment through a community-based jobs program like CEIP.
CEIP enhanced not only the duration of employment and number of jobs held but also improved the quality of jobs for many participants. Not only did CEIP successfully improve employment rates among participants, it also
helped some program group members gain access to higher-skilled occupations than would otherwise have been available to them. For example, the rate of program group members whose main job was in a high-skilled or management position was a full 11 and 13 percentage points higher among the EI and IA samples, respectively, compared to the control groups.
CEIP also appears to have achieved a balance between diversity and stability by providing varied and multiple job opportunities, while also improving the duration of jobs held. This afforded many program group members potentially more inclusive work experiences and more significant job stability. These results confirm that communities can mobilize local resources and create projects, which provide a range of meaningful job opportunities.
However, results also indicate that a small percentage of EI program group members worked in lower-skilled jobs than they would otherwise have done, and for lower wages. This finding underscores the need to ensure that community employment programs offer

- 106 -
a good range of job options, include a careful selection of project sponsors, and provide a rigorous assessment of participants if suitable job placements are to be achieved.
CEIP also led to improvements in generic transferable skills and attitudes to work. Did the work experience generated by CEIP provide for the maintenance and
acquisition of skills? Although the effects of CEIP on generic skills were unclear at the mid-point of eligibility, after three years in the program, significant positive effects were observed. Among the EI program group, CEIP produced positive effects on measures of persistence, lifelong learning, adaptability, and systems thinking. Among IA program group members, mixed effects were shown, positive for responsibility and receptiveness to continuous lifelong learning, but negative for problem solving and participants’ sense of quality accomplishment. Among both samples, CEIP continued to strengthen positive attitudes towards work and reinforced negative opinions about reliance on government transfers.
CEIP improved the well-being of program group members, with reductions in the extent and severity of poverty and hardship, and improved life satisfaction. CEIP’s impact on the extent of poverty was noteworthy as it reduced by 10
percentage points the percentage of IA program group households with incomes below Low-Income Cut-Offs (LICOs). The largest reduction in poverty occurred at the lowest income range, where program group members were 17 percentage points less likely to have household incomes below 50 per cent of LICOs. An 8 percentage point reduction was also observed in the number of EI program group members from the lower income categories.
As a result of increased incomes, program group members were more likely to report being able to meet most regular expenses and financial needs. CEIP also led to improvements, particularly among the EI program group, in reported satisfaction with life
The overall impact of CEIP on household incomes varied between EI and IA populations, and among households with and without children Despite clear improvements in the lowest income categories, increased levels of
employment and earnings for CEIP participants did not always translate directly into income gains for households. The increased earnings of EI program group members were counterbalanced by a reduction in the total incomes of other household members, driven by reduced rates of receipt of a range of other income sources (including IA benefits, disability insurance, and various tax credits). This reduction was observed only in EI households without children, and may relate to a loss of eligibility for income-contingent benefits that are more generous for households with children.
In contrast, among the IA program group, there was no significant reduction in total incomes of other household members. In fact, CEIP led to increased incomes arising from significantly higher employment rates and working hours of the participants’ spouses among households without children. In these cases, CEIP creates a work
- 107 -
incentive effect that likely arises due to the fact that eligibility rules for IA are based on household income: if other household members are no longer eligible for IA, given the participant’s involvement in CEIP, this may encourage them to re-enter the labour market. The need for childcare may in turn offset this additional work incentive on participants’ spouses, which would explain the absence of household income increases in IA families with children.
These results suggest that employment policies may not always have the intended effect on the overall work effort and income of participating households. Employment policies must pay attention not only to participants’ needs, but also to the needs and incentives faced by the other members of their families.
CEIP produced significant improvements in social capital among program group members in ways that may provide a bridge to future employment. CEIP substantially improved the structure of social networks for both EI and IA
program group members. Substantial impacts were observed in those aspects of social capital commonly associated with the development of bridging or linking social capital – namely increased access to specific resources such as specialized advice and help finding a job, growth of weak ties, and reduction in network density. CEIP’s three-year eligibility period may be an important factor in the development of social capital, as effects arose largely in the last 18 months.
These results demonstrate that governments can encourage the development of social capital of the unemployed, in partnership with communities, through a jobs strategy like CEIP.
CEIP led to a substantial increase in volunteering among program group members, particularly in formal activities through community organizations. CEIP jobs were primarily in the voluntary sector, which brought participants into
contact with non-profit organizations, many of whom rely on volunteer work to function. This may have produced a greater awareness of volunteerism among participants and substantial increases in volunteering activity. This is important for both individuals and communities as it provides a significant resource for local organizations, and a link to the community and greater levels of social inclusion for the volunteer. Similar to the effects on social capital, impacts on volunteering arose largely in the second half of the project, particularly for the IA program group, suggesting that the longer CEIP eligibility period is an important factor in encouraging volunteering.
Impacts on the percentage of sample members who engaged in formal volunteering were substantial among the IA sample, where the rate of formal volunteering among program group members was 21 percentage points higher than in the control group. This was accompanied by a positive impact on the average number of hours volunteered, which increased by 2.6 hours per month. Similar results were observed for EI program group members, who were 10 percentage points more likely to volunteer formally and increased their average hours of volunteering by 3.6 hours per month compared to the control group.

- 108 -
POST-PROGRAM FOLLOW-UP Results from the CEIP interim impact study provide important evidence regarding the
full in-program effects of a community-based jobs program over a long duration of eligibility. However, these results do not include any significant post-program period, and, as a result, provide little evidence about the effects of the program long after eligibility has ended and funding for jobs has ceased.
Post-program effects of CEIP are being evaluated through a 54-month follow-up survey, which was administered over a year after the end of program eligibility. This final follow-up survey, along with administrative data on government transfer receipt, will be used to assess the longer-term effects of CEIP on participants. Textbox 8.1 outlines several of the critical long-term outcomes that will be assessed. In addition to participant impacts, the final report will also integrate results of CEIP’s study of community effects, and will present a comprehensive cost–benefit analysis, to determine the program’s cost-effectiveness for governments.
Text Box 8.1: Questions of Interest for the 54-Month Follow-Up Survey Employment, Earnings, and Wages Will program group members move into market employment quickly following the end of their
CEIP eligibility? If not, employment impacts may appear negative for a period, given that control group employment rates continue to improve. How long will it take program group members to transition into market employment? Will their employment rates be higher than the control group, in the longer run, at the final follow-up? Will the added work experience they received through CEIP translate into higher long-term earnings or wages?
Income, Poverty, and Hardship Many program group members, particularly in the IA sample, have come to rely heavily on CEIP
as their primary source of income. With the end of eligibility, what will this mean in terms of the experience of hardship among program group members and their families? Will many be forced to return to welfare in the longer run?
Social Capital and Well-Being Will positive impacts on social capital of participants be maintained after their eligibility for the
program has ended? If so, how do participants actually make use of social capital in a tangible way to better their lives? Questions on the use of social networks have been added to the final participant follow-up survey in order to assess whether and how social capital is actively used once it is acquired. Does social capital support long-term employment as well as personal well-being and life satisfaction as have been theorized?
Cost–Benefit Analysis After accounting for all changes in earnings, transfers, and income over the full follow-up period,
how much better off are CEIP participants? How much did communities gain from their participation in the program? From the perspective of governments, is CEIP a cost-effective alternative to EI or IA benefits? How does the cost per dollar in benefit compare to other government transfer programs?

- 109 -
Appendix A: Analysis of Non-Response Bias in the
40-Month Report Sample
The focus of this report is on research sample members who completed the 40-month follow-up survey — referred to as the 40-month report sample. As is expected with any longitudinal survey, not all of the enrolees who completed a baseline survey responded to the 40-month follow-up survey. In this report, the analysis is limited to the 1,262 enrolees in the Community Employment Innovation Project (CEIP) who completed the 40-month survey, which includes 851 Employment Insurance (EI) sample members (441 program group; 410 control group) and 411 income assistance (IA) sample members (210 program group; 201 control group). This represents an 83 per cent survey response rate from the original baseline sample of 1,522 enrolees.1
The 17 per cent of the original baseline sample who did not respond to the 40-month follow-up survey may affect the reliability of the estimates in this report if their characteristics vary substantially from those of the original baseline sample. Non-response bias is more likely to be a problem if non-response affects program and control groups differently. When sample attrition affects program and control groups equally, a systematic bias in impact estimates is unlikely. This appendix examines the extent to which estimates may have been affected by potential non-response bias, by comparing the baseline characteristics of the original sample with those of the 40-month report sample.
BASELINE CHARACTERISTICS OF THE REPORT SAMPLE Tables A.1 and A.2 present a comparison of baseline characteristics of EI and IA
sample members, respectively, who responded to the original survey at enrolment with those who responded to the 40-month follow-up survey. In either case, EI respondents are more likely to be male and are older with an average age of over 40 compared to their IA counterparts whose average age was 36. Most EI sample members have a high school diploma and significant prior work experience. A higher proportion of IA respondents do not have a high school diploma and had significantly less prior work experience along with more reliance on transfers in the year prior to CEIP enrolment. Most EI and IA respondents have lived in Cape Breton all their life and have a strong attachment to their
1 Eight persons were dropped from the research analysis. Seven of these were volunteers who resided on the Eskasoni reserve. This reserve is surrounded by the Cape Breton Regional Municipality (CBRM) but is not officially part of the CBRM. The individuals met the eligibility requirements for selection from the EI caseload and were permitted to enrol in CEIP. However, the decision was made to remove them from the research sample because the nature of the transfer payments and supports for which they otherwise qualify are significantly different from those available to other sample members. The other individual was dropped because data integrity checks by Statistics Canada confirmed that the individual had not been selected to join CEIP. This individual had the same name and lived at the same address as the person invited to join CEIP and as such was able to bypass initial integrity checks. Once the error was discovered, more stringent data integrity checks were immediately implemented to prevent similar situations.
- 110 -
communities, and most have small, dense social networks consisting of fewer than 10 contacts, all or most of whom know each other.
RANDOM ASSIGNMENT AND SURVEY NON-RESPONSE As illustrated in the initial CEIP implementation report (Gyarmati et al., 2006),
random assignment was implemented successfully without any systematic differences between program and control groups. Some differences did arise due to sampling variation — i.e. differences due to chance at the time of random assignment — but these should not result in biased estimates of impacts. However, survey non-response might exacerbate some of the differences present in the baseline sample and therefore need to be reassessed in the 40-month report sample. In Tables A.1 and A.2, differences between program and control group members that were present in the baseline research sample are reflective of sampling variation arising from random assignment, while differences in the 40-month report sample reflect both the original baseline differences and any new effects of survey non-response. The final column in each table tests whether discrepancies between program and control groups are different for respondents and non-respondents.
Table A.1 reveals that there are a few significant differences between EI program and control group members in the 40-month report sample that were not statistically significant in the original baseline sample. For example, at 40 months the EI program group has fewer women than men compared to the control group (40.4 versus 49.3 per cent female in the EI program and control groups respectively). This difference was not statistically significant in the baseline sample — it became significant at 40 months because a significantly higher percentage of non-respondents are women in the program group compared to the control group. Other differences between EI program and control groups that may have been exacerbated by non-response include: 1) the likelihood of living in households without children (58.5 EI program group versus 51.7 in the control group), as opposed to 1–2 children (35.8 per cent program versus 41.5 per cent control); and 2) the presence of those with activity limitations (31.7 per cent program versus 26.1 per cent control). A couple of other EI program/control differences appear in the 40-month sample, but they are not reflective of significant differences between respondents and non-respondents. In a few other cases, there are significant differences between respondents and non-respondents, but they do not appear to be sufficient to create a significant program/control difference in the 40-month sample.
Most of the few differences between EI program and control group members that arose as a result of sampling variation in random assignment of the baseline sample are still present in the 40 month sample. For example, fewer EI program group respondents to the 40-month survey had a household income of $30,000 or more at baseline (32.6 EI program group versus 40.0 EI control group). This 7 percentage point difference was also present in the baseline survey, and was therefore not affected by differential non-response among program and control group members. Other differences that were products of sampling variation, but not affected by non-response include: 1) size of social networks at baseline (37.0 versus 43.7 per cent with ten or more contacts at baseline for EI program and control group respectively); 2) likelihood of having children 3 to 5 years of age (13.2 EI program group versus 22.7 in the control group). In one case, differential non-

- 111 -
responding between program and control groups actually helped to reduce a difference that had arisen as a result of sampling variation — the likelihood of having children between 6 and 12, which had been significantly different between EI program and control groups in the original baseline sample, was no longer significantly different in the 40-month sample.
Table A.2 reveals that there are also a few significant differences between IA program and control group members in the 40-month report sample that were not statistically significant in the original baseline sample. For example, IA program group respondents to the 40-month survey lived in larger households than the control group (58.4 per cent in 2–3-person households, 30.6 per cent in four-person or more households for the program group versus 68.7 per cent and 22.4 per cent, respectively, for the control group). These differences were not statistically significant in the baseline sample — they became significant at 40 months because of a significantly higher rate of non-respondents in smaller (2–3 person) households in the program group as compared to the control group. Another difference between IA program and control groups that may have been exacerbated by non-response is time lived at current address, which tends to be shorter in the program group (in the program group, 41 per cent had lived 1 to 4 years at their current address and 11 per cent 5 to 9 years versus 32.3 per cent and 18.4 per cent, respectively, in the control group). IA program group respondents to the 40-month survey also tended to be less likely to have children (40.7 per cent without children in the program group versus 31.3 per cent in the control group) and less likely to have a high school diploma (58.2 per cent in the program group versus 67.2 per cent in the control group).
Two of the differences between IA program and control group members in the 40-month sample arose as a result of sampling variation in random assignment, and were not altered by non-response. Program group members appear more attached to Cape Breton, with a larger percentage having lived there all their lives (77.0 versus 69.7 per cent for IA program and control group, respectively) but at the same time, more open to moving in order to get a job (22.3 versus 14.4 per cent for IA program and control group, respectively). In one case, differential non-responding between program and control groups actually helped to reduce a difference that had arisen as a result of sampling variation — the likelihood of volunteering on behalf of an organization, which had been significantly different between IA program and control groups in the original baseline sample, was no longer significantly different in the 40-month sample.
In general, the relatively few differences discussed above are not reflective of systematic problems with random assignment or non-response bias2. Nevertheless, regression-adjusted impacts that include a range of these baseline covariates were checked as part of the analysis, particularly when the variable in which there is a potential baseline difference is also a measured follow-up outcome of interest (e.g. impacts on income, social capital and volunteering). Adjusted impacts are presented and discussed in Appendix C; however, they are only discussed within chapters if they diverged significantly from the unadjusted findings.
2 A similar analysis for non-response bias will be conducted for the final impact report, when non-response is more likely to be a concern.

- 112 -
ANALYSIS OF NON-RESPONSE FROM ADMINISTRATIVE RECORDS Administrative records are particularly useful to assess possible non-response bias in
CEIP impacts on transfer payments, because they continue to provide information about survey non-respondents even after the baseline survey. Tables A.3 and A.4 show the proportion of program and control group members receiving EI and IA payments respectively, as well as the average amounts received in each quarter, for both 40-month respondents and non-respondents. If CEIP impacts on receipt of transfer payments are significantly and systematically different for respondents and non-respondents, then non-response bias may be an important factor.
Table A.3 shows that CEIP impacts on EI receipt were largely the same for respondents and non-respondents. Impacts on average EI payment tended to be larger among non-respondents, although this trend was only significant in quarter 1.
Table A.4 shows that CEIP impacts on IA receipt tended to be larger for respondents, although only significantly so in quarters 8, 10 and 11. Impacts on average IA payment also tended to be larger among respondents, but this trend was only significant in quarter 11.
Though there is no evidence that systematic non-response bias affected the impact estimates for transfer payments, regression-adjusted impacts were calculated and reported when they diverged from unadjusted impacts.

- 113 -
Table A.1: Comparison of Characteristics of Original Baseline and 40-Month Survey Samples — EI Sample
Baseline Research Sample 40-Month Survey Sample 40-Month Non-RespondentsProgram Control Difference Program Control Difference Program Control Difference Difference from
Group Group (Impact) Group Group (Impact) Group Group (Impact) RespondentsBaseline Characteristic (1) (2) (3) (4) (5) (6) (7) (8) (9) (9-6)EI historyAverage number of months of EI
in last 12 months 6.1 6.1 0.0 6.1 6.2 -0.1 6.0 5.7 0.3 0.3 n.s.Average monthly EI payment in month of
random assignment ($) 849 866 -17 850 842 8 841 977 -137 * -144.8 n.s.Work historyYears worked at paid job since 16 yrs of age 18.3 17.8 0.4 19.1 17.9 1.2 11.9 17.5 -5.6 *** -6.8 †††
In paid work at baseline (%) 19.6 17.0 2.6 19.9 17.7 2.1 17.2 13.5 3.8 1.6 n.s.Personal characteristicsFemale (%) 39.5 43.7 -4.2 40.4 49.3 -8.9 *** 32.8 18.0 14.8 ** 23.7 †††
Age when selected 40.3 40.4 -0.1 41.1 40.6 0.4 34.5 39.3 -4.8 **Single/separated/divorced/widowed at baseline (%) 42.5 41.2 1.3 39.7 37.4 2.3 63.8 58.4 5.4 3.1 n.s.
Activity limitations or fair/poor health at baseline (%) 29.9 26.1 3.8 31.7 26.1 5.6 * 15.5 25.8 -10.3 -16.0 ††
Less than high school education (%) 31.5 30.5 1.0 31.4 29.2 2.1 32.8 36.4 -3.6 -5.7 n.s.
10 or more contacts at baseline (%) 37.0 43.7 -6.7 ** 37.4 44.9 -7.5 ** 34.5 38.2 -3.7 3.8 n.s.
Time lived in Cape Breton (%)Less than 10 years 4.4 4.8 -0.4 4.3 4.4 -0.1 5.3 6.8 -1.6 -1.5 n.s.
More than 10 years 95.6 95.2 0.4 95.7 95.6 0.1 94.7 93.2 1.6 1.5 n.s.
All my life 75.2 76.4 -1.3 76.5 76.5 0.0 64.9 76.1 -11.2 -11.2 n.s.
Time lived at current address (%)Less than 1 year 11.8 13.4 -1.6 10.7 11.7 -1.0 20.7 21.3 -0.7 0.4 n.s.
1 to 4 years 19.7 19.8 -0.2 19.3 19.5 -0.2 22.4 21.3 1.1 1.3 n.s.
5 to 9 years 9.8 13.0 -3.2 9.3 13.9 -4.6 ** 13.8 9.0 4.8 9.4 n.s.
10 or more years 58.6 53.7 4.9 60.7 54.9 5.8 * 43.1 48.3 -5.2 -11.0 n.s.
All my life 14.9 13.2 1.6 14.1 13.7 0.4 20.7 11.2 9.5 9.0 n.s.Household characteristics (%)Children in houshold
No children 57.5 53.1 4.4 58.5 51.7 6.8 ** 50.0 59.6 -9.6 -16.3 †
1-2 children 37.1 39.7 -2.6 35.8 41.5 -5.6 * 46.6 31.5 15.1 * 20.7 ††
3 or more children 5.4 7.2 -1.8 5.7 6.8 -1.2 3.4 9.0 -5.5 -4.4 n.s.
Age of youngest child in householdUnder 3 years 16.1 16.7 -0.6 17.0 13.6 3.4 10.3 33.3 -23.0 ** -26.4 ††
3 to 5 years 14.2 22.2 -8.0 ** 13.2 22.7 -9.5 ** 20.7 19.4 1.2 10.8 n.s.
6 to 12 years 35.1 24.8 10.3 ** 33.0 26.8 6.2 48.3 13.9 34.4 *** 28.2 ††
13 to 17 years 32.7 35.0 -2.3 35.2 35.9 -0.7 17.2 30.6 -13.3 -12.6 n.s.
Number of people in household1 person 8.0 6.6 1.4 7.9 5.1 2.8 * 8.6 13.5 -4.9 -7.7 n.s.
2-3 people 56.3 59.9 -3.6 57.6 62.4 -4.8 46.6 48.3 -1.8 3.1 n.s.
4 or more people 35.7 33.5 2.2 34.5 32.4 2.0 44.8 38.2 6.6 4.6 n.s.
Household incomeLess than $10,000 11.7 9.9 1.8 10.5 9.5 1.0 20.7 11.6 9.1 8.1 n.s.
$10,000 to $20,000 32.4 30.4 2.0 31.4 30.0 1.4 39.7 32.6 7.1 5.7 n.s.
$20,000 to $30,000 24.5 21.2 3.4 25.5 20.5 5.0 * 17.2 24.4 -7.2 -12.2 n.s.
$30,000 or more 31.4 38.5 -7.1 ** 32.6 40.0 -7.4 ** 22.4 31.4 -9.0 -1.6 n.s.
(continued)

- 114 -
Table A.1: Comparison of Characteristics of Original Baseline and 40-Month Survey Samples — EI Sample (Cont’d)
Baseline Research Sample 40-Month Survey Sample 40-Month Non-RespondentsProgram Control Difference Program Control Difference Program Control Difference Difference from
Group Group (Impact) Group Group (Impact) Group Group (Impact) RespondentsBaseline Characteristic (1) (2) (3) (4) (5) (6) (7) (8) (9) (9-6)Attitudes towards work (%)To get a job/improve job prospects, respondent will:Take additional training 97.2 98.0 -0.8 96.8 97.8 -1.0 100.0 98.9 1.1 2.1 n.s.
Move permanently outside Cape Breton 17.5 17.4 0.1 15.2 17.3 -2.1 35.1 17.9 17.2 ** 19.4 ††
Move part of each year 29.8 27.4 2.4 27.7 25.6 2.0 45.6 35.7 9.9 7.9 n.s.
Work for a lower wage 50.9 51.3 -0.4 53.3 51.6 1.7 33.3 50.0 -16.7 ** -18.3 ††
Work in a different occupation or industry 91.9 90.4 1.5 92.2 91.3 0.9 89.5 86.0 3.4 2.6 n.s.Volunteer activitiesVolunteered on behalf of group/organization 50.9 54.4 -3.5 52.2 56.2 -4.1 41.4 46.1 -4.7 -0.6 n.s.
Volunteered informally 88.6 85.9 2.6 88.2 86.1 2.1 91.4 85.4 6.0 3.8 n.s.
Sample size 499 499 441 410 58 89
Source: Calculations based on baseline and 40-month survey data and Employment Insurance administrative records. Notes: Sample sizes vary for individual measures because of missing values. Two-tailed t-tests were applied to differences between the program and control groups, and to the differences between the 40-
month report sample and the baseline research sample. Statistical significance levels are indicated as: * = 10 per cent; ** = 5 per cent; *** = 1 per cent.

- 115 -
Table A.2: Comparison of Characteristics of Original Baseline and 40-Month Survey Samples — IA Sample
Baseline Research Sample 40-Month Survey Sample 40-Month Non-RespondentsProgram Control Difference Program Control Difference Program Control Difference Difference from
Group Group (Impact) Group Group (Impact) Group Group (Impact) RespondentsBaseline Characteristic (1) (2) (3) (4) (5) (6) (7) (8) (9) (9-6)IA historyAverage number of months of IA
in last 12 months 10.4 10.5 -0.1 10.5 10.6 -0.1 10.1 9.9 0.2 0.3 n.s.
Average monthly IA payment in month ofrandom assignment ($) 525 506 19 526 510 16 518 491 28 11.4 n.s.
Work historyYears worked at paid job since 16 yrs of age 7.6 8.4 -0.9 7.7 8.1 -0.4 6.9 9.5 -2.5 -2.1 n.s.
In paid work at baseline (%) 15.7 17.6 -1.9 15.6 17.6 -2.0 16.3 17.6 -1.4 0.7 n.s.Personal characteristicsFemale (%) 60.1 63.6 -3.5 63.3 69.2 -5.8 45.8 43.9 2.0 7.8 n.s.
Age when selected 35.6 35.9 -0.3 36.0 35.8 0.2 34.0 36.1 -2.1Single/separated/divorced/widowed at baseline (%) 78.8 84.0 -5.2 78.3 84.0 -5.7 81.3 84.2 -3.0 2.8 n.s.
Activity limitations or fair/poor health at baseline (%) 36.8 32.6 4.3 36.7 33.8 2.8 37.5 28.1 9.4 6.6 n.s.
Less than high school education (%) 42.1 36.6 5.6 41.8 32.8 9.0 * 43.5 50.0 -6.5 -15.5 n.s.
10 or more contacts at baseline (%) 32.7 31.9 0.8 33.8 32.0 1.8 27.7 31.6 -3.9 -5.7 n.s.
Time lived in Cape Breton (%)Less than 10 years 4.3 5.4 -1.1 4.3 5.0 -0.7 4.2 7.0 -2.9 -2.2 n.s.
More than 10 years 95.7 94.6 1.1 95.7 95.0 0.7 95.8 93.0 2.9 2.2 n.s.
All my life 75.1 67.8 7.3 * 77.0 69.7 7.4 * 66.7 61.4 5.3 -2.1 n.s.
Time lived at current address (%)Less than 1 year 24.4 24.4 0.0 22.9 20.4 2.5 31.3 38.6 -7.3 -9.8 n.s.
1 to 4 years 37.6 32.2 5.4 41.0 32.3 8.6 * 22.9 31.6 -8.7 -17.3 †
5 to 9 years 12.0 16.3 -4.3 11.0 18.4 -7.5 ** 16.7 8.8 7.9 15.4 ††
10 or more years 26.0 27.1 -1.2 25.2 28.9 -3.6 29.2 21.1 8.1 11.7 n.s.
All my life 10.9 10.5 0.4 11.4 11.4 0.0 8.3 7.0 1.3 1.3 n.s.Household characteristics (%)Children in houshold
No children 41.2 34.9 6.4 40.7 31.3 9.3 ** 43.8 47.4 -3.6 -12.9 n.s.
1-2 children 47.5 51.2 -3.7 48.3 55.2 -6.9 43.8 36.8 6.9 13.8 n.s.
3 or more children 11.3 14.0 -2.7 11.0 13.4 -2.4 12.5 15.8 -3.3 -0.9 n.s.
Age of youngest child in householdUnder 3 years 25.0 21.4 3.6 24.8 18.8 6.0 25.9 33.3 -7.4 -13.4 n.s.
3 to 5 years 21.1 24.4 -3.4 20.8 26.1 -5.3 22.2 16.7 5.6 10.8 n.s.
6 to 12 years 32.2 32.1 0.1 32.0 32.6 -0.6 33.3 30.0 3.3 3.9 n.s.
13 to 17 years 19.1 20.2 -1.2 19.2 20.3 -1.1 18.5 20.0 -1.5 -0.4 n.s.
Number of people in household1 person 11.3 12.0 -0.7 11.0 9.0 2.1 12.5 22.8 -10.3 -12.4 n.s.
2-3 people 58.4 61.6 -3.3 58.4 68.7 -10.3 ** 58.3 36.8 21.5 ** 31.8 †††
4 or more people 30.4 26.4 4.0 30.6 22.4 8.2 * 29.2 40.4 -11.2 -19.4 †
Household IncomeLess than $10,000 56.6 60.7 -4.1 55.7 59.2 -3.5 60.4 66.1 -5.7 -2.2 n.s.
$10,000 to $20,000 36.0 35.8 0.2 36.2 36.8 -0.6 35.4 32.1 3.3 3.9 n.s.
$20,000 to $30,000 4.3 2.7 1.5 5.2 3.0 2.3 0.0 1.8 -1.8 -4.0 n.s.$30,000 or more 3.1 0.8 2.3 * 2.9 1.0 1.9 4.2 0.0 4.2 2.3 n.s.
(continued)

- 116 -
Table A.2: Comparison of Characteristics of Original Baseline and 40-Month Survey Samples — IA Sample (Cont’d)
Baseline Research Sample 40-Month Survey Sample 40-Month Non-RespondentsProgram Control Difference Program Control Difference Program Control Difference Difference from
Group Group (Impact) Group Group (Impact) Group Group (Impact) RespondentsBaseline Characteristic (1) (2) (3) (4) (5) (6) (7) (8) (9) (9-6)Attitudes towards work (%)To get job/improve job prospects, respondent will:Take additional training 95.7 98.4 -2.8 * 96.1 98.5 -2.4 93.8 98.2 -4.5 -2.1 n.s.
Move permanently outside Cape Breton 23.2 16.7 6.5 * 22.3 14.4 7.9 ** 27.1 24.6 2.5 -5.4 n.s.
Move part of each year 25.6 23.8 1.8 24.3 22.1 2.2 31.3 29.8 1.4 -0.8 n.s.
Work for a lower wage 41.9 40.9 1.0 42.3 36.9 5.4 40.0 53.7 -13.7 -19.1 †
Work in a different occupation or industry 89.9 87.3 2.5 90.1 86.4 3.7 88.9 90.6 -1.7 -5.4 n.s.Volunteer activitiesVolunteered on behalf of group/organization 44.7 52.9 -8.2 * 45.5 48.8 -3.3 41.7 67.9 -26.2 *** -22.9 ††Volunteered informally 86.4 84.1 2.3 86.1 84.1 2.0 87.5 84.2 3.3 1.2 n.s.
Sample size 258 258 210 201 48 57
Source: Calculations based on baseline and 40-month survey data and Income Assistance administrative records. Notes: Sample sizes vary for individual measures because of missing values. Two-tailed t-tests were applied to differences between the program and control groups, and to the differences between the 40-
month report sample and the baseline research sample. Statistical significance levels are indicated as: * = 10 per cent; ** = 5 per cent; *** = 1 per cent.
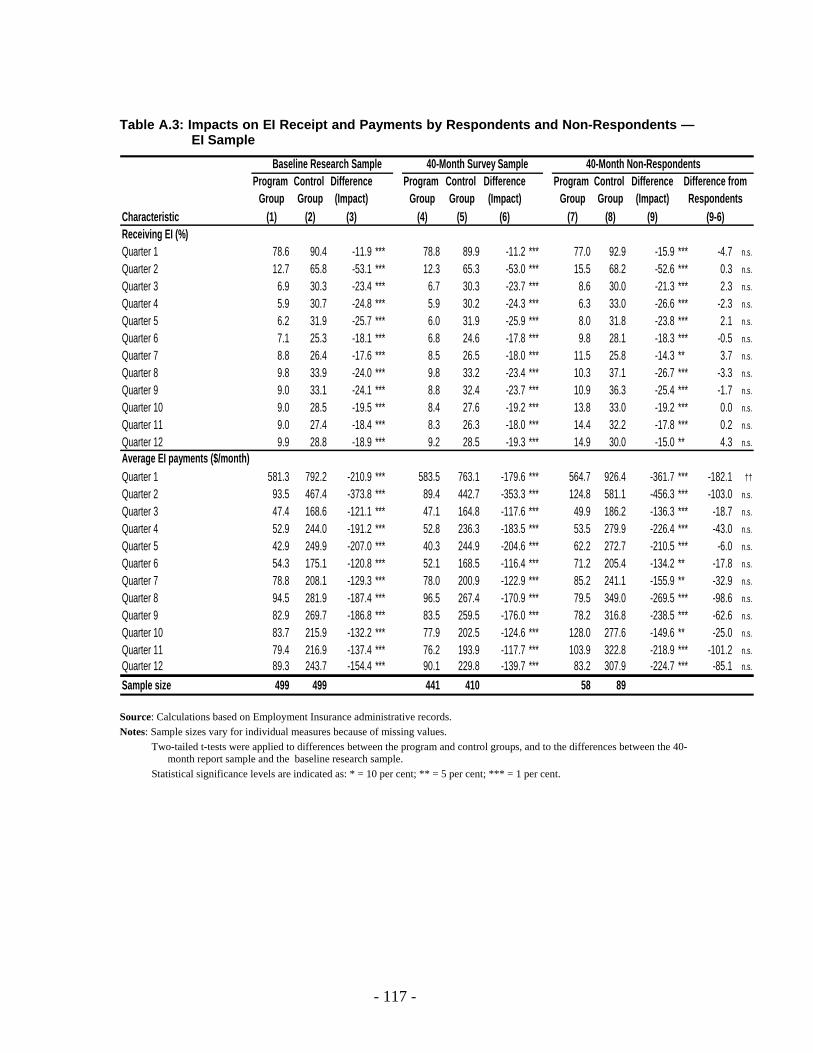
- 117 -
Table A.3: Impacts on EI Receipt and Payments by Respondents and Non-Respondents — EI Sample
Baseline Research Sample 40-Month Survey Sample 40-Month Non-RespondentsProgram Control Difference Program Control Difference Program Control Difference Difference from
Group Group (Impact) Group Group (Impact) Group Group (Impact) RespondentsCharacteristic (1) (2) (3) (4) (5) (6) (7) (8) (9) (9-6)Receiving EI (%)Quarter 1 78.6 90.4 -11.9 *** 78.8 89.9 -11.2 *** 77.0 92.9 -15.9 *** -4.7 n.s.
Quarter 2 12.7 65.8 -53.1 *** 12.3 65.3 -53.0 *** 15.5 68.2 -52.6 *** 0.3 n.s.
Quarter 3 6.9 30.3 -23.4 *** 6.7 30.3 -23.7 *** 8.6 30.0 -21.3 *** 2.3 n.s.
Quarter 4 5.9 30.7 -24.8 *** 5.9 30.2 -24.3 *** 6.3 33.0 -26.6 *** -2.3 n.s.
Quarter 5 6.2 31.9 -25.7 *** 6.0 31.9 -25.9 *** 8.0 31.8 -23.8 *** 2.1 n.s.
Quarter 6 7.1 25.3 -18.1 *** 6.8 24.6 -17.8 *** 9.8 28.1 -18.3 *** -0.5 n.s.
Quarter 7 8.8 26.4 -17.6 *** 8.5 26.5 -18.0 *** 11.5 25.8 -14.3 ** 3.7 n.s.
Quarter 8 9.8 33.9 -24.0 *** 9.8 33.2 -23.4 *** 10.3 37.1 -26.7 *** -3.3 n.s.
Quarter 9 9.0 33.1 -24.1 *** 8.8 32.4 -23.7 *** 10.9 36.3 -25.4 *** -1.7 n.s.
Quarter 10 9.0 28.5 -19.5 *** 8.4 27.6 -19.2 *** 13.8 33.0 -19.2 *** 0.0 n.s.
Quarter 11 9.0 27.4 -18.4 *** 8.3 26.3 -18.0 *** 14.4 32.2 -17.8 *** 0.2 n.s.
Quarter 12 9.9 28.8 -18.9 *** 9.2 28.5 -19.3 *** 14.9 30.0 -15.0 ** 4.3 n.s.Average EI payments ($/month)Quarter 1 581.3 792.2 -210.9 *** 583.5 763.1 -179.6 *** 564.7 926.4 -361.7 *** -182.1 ††
Quarter 2 93.5 467.4 -373.8 *** 89.4 442.7 -353.3 *** 124.8 581.1 -456.3 *** -103.0 n.s.
Quarter 3 47.4 168.6 -121.1 *** 47.1 164.8 -117.6 *** 49.9 186.2 -136.3 *** -18.7 n.s.
Quarter 4 52.9 244.0 -191.2 *** 52.8 236.3 -183.5 *** 53.5 279.9 -226.4 *** -43.0 n.s.
Quarter 5 42.9 249.9 -207.0 *** 40.3 244.9 -204.6 *** 62.2 272.7 -210.5 *** -6.0 n.s.
Quarter 6 54.3 175.1 -120.8 *** 52.1 168.5 -116.4 *** 71.2 205.4 -134.2 ** -17.8 n.s.
Quarter 7 78.8 208.1 -129.3 *** 78.0 200.9 -122.9 *** 85.2 241.1 -155.9 ** -32.9 n.s.
Quarter 8 94.5 281.9 -187.4 *** 96.5 267.4 -170.9 *** 79.5 349.0 -269.5 *** -98.6 n.s.
Quarter 9 82.9 269.7 -186.8 *** 83.5 259.5 -176.0 *** 78.2 316.8 -238.5 *** -62.6 n.s.
Quarter 10 83.7 215.9 -132.2 *** 77.9 202.5 -124.6 *** 128.0 277.6 -149.6 ** -25.0 n.s.
Quarter 11 79.4 216.9 -137.4 *** 76.2 193.9 -117.7 *** 103.9 322.8 -218.9 *** -101.2 n.s.Quarter 12 89.3 243.7 -154.4 *** 90.1 229.8 -139.7 *** 83.2 307.9 -224.7 *** -85.1 n.s.
Sample size 499 499 441 410 58 89
Source: Calculations based on Employment Insurance administrative records. Notes: Sample sizes vary for individual measures because of missing values. Two-tailed t-tests were applied to differences between the program and control groups, and to the differences between the 40-
month report sample and the baseline research sample. Statistical significance levels are indicated as: * = 10 per cent; ** = 5 per cent; *** = 1 per cent.

- 118 -
Table A.4: Impacts on IA Receipt and Payments by Respondents and Non-Respondents — IA Sample
Baseline Research Sample 40-Month Survey Sample 40-Month Non-RespondentsProgram Control Difference Program Control Difference Program Control Difference Difference from
Group Group (Impact) Group Group (Impact) Group Group (Impact) RespondentsCharacteristic (1) (2) (3) (4) (5) (6) (7) (8) (9) (9-6)Receiving IA (%)Quarter 1 87.1 90.8 -3.7 * 86.5 91.0 -4.5 * 89.6 90.1 -0.5 4.1 n.s.
Quarter 2 47.7 82.6 -34.9 *** 46.0 82.8 -36.7 *** 54.9 81.9 -27.0 *** 9.7 n.s.
Quarter 3 37.3 77.1 -39.8 *** 35.6 77.6 -42.1 *** 45.1 75.4 -30.3 *** 11.8 n.s.
Quarter 4 33.3 72.0 -38.6 *** 31.3 71.5 -40.2 *** 42.4 73.7 -31.3 *** 8.9 n.s.
Quarter 5 32.0 67.1 -35.0 *** 30.0 66.0 -36.0 *** 41.0 70.8 -29.8 *** 6.2 n.s.
Quarter 6 30.0 62.7 -32.7 *** 27.6 62.4 -34.7 *** 40.3 63.7 -23.5 *** 11.3 n.s.
Quarter 7 26.7 58.5 -31.8 *** 24.9 59.0 -34.1 *** 34.7 56.7 -22.0 ** 12.1 n.s.
Quarter 8 28.3 57.1 -28.8 *** 25.4 57.7 -32.3 *** 41.0 55.0 -14.0 18.3 †
Quarter 9 26.4 56.5 -30.1 *** 23.3 56.1 -32.7 *** 39.6 57.9 -18.3 ** 14.4 n.s.
Quarter 10 26.1 56.6 -30.5 *** 22.2 56.4 -34.2 *** 43.1 57.3 -14.3 19.9 ††
Quarter 11 26.2 52.8 -26.6 *** 23.0 52.7 -29.7 *** 40.3 53.2 -12.9 16.8 †
Quarter 12 23.9 54.8 -30.9 *** 20.8 54.1 -33.3 *** 37.5 57.3 -19.8 ** 13.5 n.s.Average IA payments ($/month)Quarter 1 464.3 513.5 -49.1 ** 470.1 519.4 -49.3 * 439.1 492.3 -53.3 -3.9 n.s.
Quarter 2 131.7 465.6 -333.9 *** 124.7 465.9 -341.2 *** 162.6 464.7 -302.1 *** 39.1 n.s.
Quarter 3 102.1 416.7 -314.6 *** 92.1 415.9 -323.8 *** 145.9 419.3 -273.5 *** 50.3 n.s.
Quarter 4 94.5 385.3 -290.8 *** 87.1 374.1 -287.0 *** 126.9 424.9 -298.0 *** -11.0 n.s.
Quarter 5 108.8 364.5 -255.7 *** 94.5 352.3 -257.8 *** 171.2 407.3 -236.2 *** 21.6 n.s.
Quarter 6 101.3 335.4 -234.1 *** 89.0 326.6 -237.6 *** 155.3 366.7 -211.4 *** 26.3 n.s.
Quarter 7 97.2 311.2 -213.9 *** 82.8 299.0 -216.2 *** 160.4 353.9 -193.5 *** 22.8 n.s.
Quarter 8 99.2 296.9 -197.8 *** 81.1 291.4 -210.2 *** 178.1 316.6 -138.5 ** 71.8 n.s.
Quarter 9 102.1 305.8 -203.8 *** 84.0 294.5 -210.4 *** 181.0 345.9 -164.9 *** 45.6 n.s.
Quarter 10 108.4 314.0 -205.5 *** 76.4 301.3 -224.9 *** 248.7 358.7 -110.0 114.8 n.s.
Quarter 11 108.0 293.1 -185.0 *** 82.4 287.2 -204.8 *** 220.1 313.8 -93.7 111.1 †Quarter 12 106.1 305.0 -198.9 *** 89.6 296.2 -206.6 *** 177.8 335.8 -158.0 *** 48.6 n.s.
Sample size 258 258 210 201 48 57
Source: Calculations based on Income Assistance administrative records. Notes: Sample sizes vary for individual measures because of missing values. Two-tailed t-tests were applied to differences between the program and control groups, and to the differences between the 40-
month report sample and the baseline research sample. Statistical significance levels are indicated as: * = 10 per cent; ** = 5 per cent; *** = 1 per cent.
- 119 -
Appendix B: Program Satisfaction
This appendix presents results from the program satisfaction module of the 40-month follow-up survey. This module asked participants about their level of satisfaction with the Community Employment Innovation Project (CEIP), including what particular aspects of the program they liked and disliked, and how they felt the program could be improved. In addition, participants were asked to rate their level of satisfaction with their CEIP work placements and the skills and contacts gained through these experiences. Results are presented separately for Employment Insurance (EI) and income assistance (IA) recipients.
Table B.1 illustrates that, as was revealed in the 18-month early impact analysis, the overwhelming majority of respondents were satisfied, very satisfied, or completely satisfied with CEIP (93 per cent of EI respondents; 86.2 per cent of IA respondents). When asked, “What do you like about CEIP,” the most common response was having a paid job — 55.4 per cent of EI respondents and 60.6 per cent of IA respondents. Sizable proportions of individuals also mentioned meeting people at work (37 per cent of EI respondents and 43.6 per cent of IA respondents), gaining new skills (40.1 per cent of EI respondents; 28.2 per cent of IA respondents), and gaining work experience (24.6 per cent of EI respondents; 28.2 per cent of IA respondents) as things they liked about CEIP.
With respect to CEIP work placements, the large majority of respondents again stated they were satisfied, very satisfied or completely satisfied with their experiences (91.2 per cent of EI respondents; 88.3 per cent of IA respondents). Favoured aspects of CEIP were reinforced in responses regarding CEIP placements, with respondents citing as very or extremely useful the skills and experience gained from CEIP (49 per cent of EI respondents and 56.4 per cent of IA respondents), as well as the contacts made through CEIP (45.9 per cent of EI respondents and 55.2 per cent of IA respondents).
Responses to the question “What do you dislike the most about CEIP” showed that there was no single facet of CEIP that stood out as being universally disliked by a large proportion of participants. Among EI respondents, the features that were most often mentioned were the low CEIP wage (12 per cent) and fact of not learning new skills (13.4 per cent). IA respondents most frequently mentioned not learning new skills in response to this question (8.6 per cent).
When asked “What would you like to see in CEIP that is not there now,” the most frequent response among EI and IA respondents was more training (29.5 and 25.5 per cent, respectively). Approximately 24.1 per cent of EI respondents and 25.5 per cent of IA respondents would have also liked for CEIP to provide more permanent work.

- 120 -
Table B.1: Program Satisfaction at 40 Months After Enrolment Among Program Group
40-month 18-monthEI IA EI IA
Level of satisfaction with participation in CEIP (%)Completely satisfied 34,9 37,0 25,9 33,0Very satisfied 29,6 28,6 39,6 27,8Satisfied 28,5 20,6 27,8 30,7Not very satisfied 3,9 9,5 3,2 4,3Unsatisfied 3,1 4,2 3,5 4,3
What respondents liked about CEIP (%)Having a paid job 55,4 60,6 47,0 53,1Contributing to the community 12,4 5,9 13,4 7,1Meeting people at work 37,0 43,6 37,6 30,8Doing interesting work 18,9 20,7 17,7 15,6Making new friends 13,6 14,4 22,3 13,7Gaining new skills 40,1 28,2 41,1 37,4Gaining work experience 24,6 28,2 34,1 35,1Other 23,2 22,3 32,3 26,1Does not like any part of CEIP 3,4 3,2 2,7 5,2
What respondents liked most about CEIP (%)Having a paid job 35,5 40,6 27,4 40,5Contributing to the community 5,3 +++ 4,2 +++Meeting people at work 15,0 16,1 13,0 11,0Doing interesting work 7,0 7,8 5,0 3,5Making new friends +++ 2,8 4,4 +++Gaining new skills 13,2 8,3 10,5 11,0Gaining work experience 8,2 8,3 8,0 8,5Other 14,7 13,9 27,4 21,5
What respondents disliked about CEIP (%)Low wage job 11,1 2,7 13,7 5,7Not contributing to the community +++ +++ 1,6 0,0Not gaining work experience 7,4 8,5 4,0 6,2Not learning new skills 12,8 10,1 8,1 8,5Not doing interesting work 4,5 5,3 4,3 6,6Not meeting new people +++ +++Not making new friends 1,7 +++New and not permanent 12,8 14,8 7,5 9,0Rules and procedures 8,2 9,0 10,8 10,9Likes everything 34,3 30,7 39,3 38,4Other 26,6 31,8 26,9 27,0
(continued)
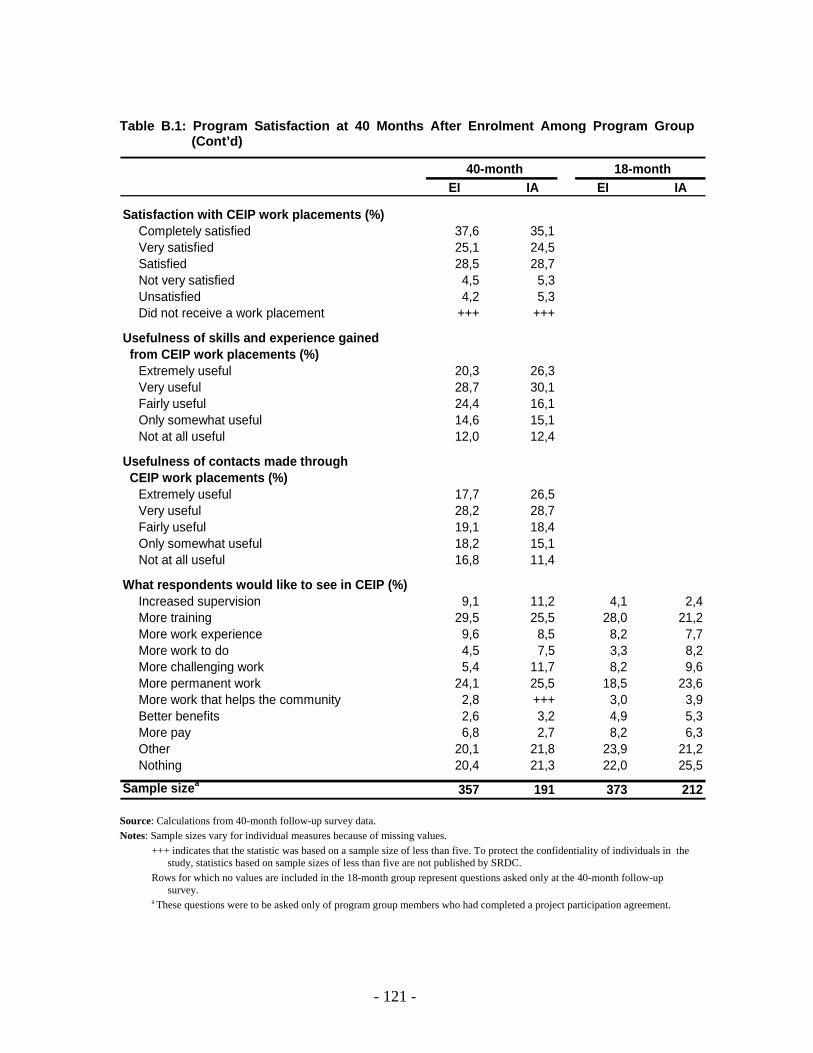
- 121 -
Table B.1: Program Satisfaction at 40 Months After Enrolment Among Program Group (Cont’d)
40-month 18-monthEI IA EI IA
Satisfaction with CEIP work placements (%)Completely satisfied 37,6 35,1Very satisfied 25,1 24,5Satisfied 28,5 28,7Not very satisfied 4,5 5,3Unsatisfied 4,2 5,3Did not receive a work placement +++ +++
Usefulness of skills and experience gained from CEIP work placements (%)
Extremely useful 20,3 26,3Very useful 28,7 30,1Fairly useful 24,4 16,1Only somewhat useful 14,6 15,1Not at all useful 12,0 12,4
Usefulness of contacts made through CEIP work placements (%)
Extremely useful 17,7 26,5Very useful 28,2 28,7Fairly useful 19,1 18,4Only somewhat useful 18,2 15,1Not at all useful 16,8 11,4
What respondents would like to see in CEIP (%)Increased supervision 9,1 11,2 4,1 2,4More training 29,5 25,5 28,0 21,2More work experience 9,6 8,5 8,2 7,7More work to do 4,5 7,5 3,3 8,2More challenging work 5,4 11,7 8,2 9,6More permanent work 24,1 25,5 18,5 23,6More work that helps the community 2,8 +++ 3,0 3,9Better benefits 2,6 3,2 4,9 5,3More pay 6,8 2,7 8,2 6,3Other 20,1 21,8 23,9 21,2Nothing 20,4 21,3 22,0 25,5
Sample sizea 357 191 373 212
Source: Calculations from 40-month follow-up survey data. Notes: Sample sizes vary for individual measures because of missing values. +++ indicates that the statistic was based on a sample size of less than five. To protect the confidentiality of individuals in the
study, statistics based on sample sizes of less than five are not published by SRDC. Rows for which no values are included in the 18-month group represent questions asked only at the 40-month follow-up
survey. a These questions were to be asked only of program group members who had completed a project participation agreement.

- 122 -
Appendix C: Regression-Adjusted Impact Estimates
This appendix presents regression-adjusted impact estimates for a range of outcomes discussed in this report. The first section reviews the basic approach and rationale for using regression-adjusted impacts and compares their value to unadjusted impacts. The second section summarizes some of the key differences between the two estimates.
UNADJUSTED VERSUS ADJUSTED IMPACT ESTIMATES This report presents “unadjusted” impacts of the Community Employment Innovation
Project (CEIP) that were estimated by calculating the difference between the mean outcome levels of the program and control group. However, an alternative method is to estimate a regression in which the outcome is modeled as a linear function of the respondents’ research group and a range of socioeconomic and demographic characteristics measured before random assignment. Although random assignment ensures that there are no systematic differences between program and control groups at baseline, small differences can arise, by chance, particularly in smaller samples. In addition, if sample attrition over the 40-month period affects program and control groups differently, it can exacerbate pre-existing random differences in their baseline characteristics, resulting in biased impact estimates (non-response bias). The regression “adjusts” the impact estimate to account for these baseline differences between program and control group members — whether they arose by chance during random assignment or developed later as a result of non-response bias.
In a random assignment study, both unadjusted and adjusted approaches yield valid estimates of the impacts. Nonetheless, there are advantages to using regression-adjusted estimates: given that any observed baseline differences between program and control group members can be accounted for, the regression-adjusted impact estimates are, potentially, more accurate than the unadjusted mean differences in outcomes. Even in the absence of statistically significant program–control group differences at baseline, regression adjustment can improve the statistical precision of impact estimates. Standard errors of the regression-adjusted impact estimates of the treatment may be lower (when correlation between the characteristics and the outcome is accounted for in the regression), which results in improved statistical power.

- 123 -
However, there are also some disadvantages to using regression adjustment, which make the unadjusted impact estimates preferable:
• Unadjusted impact estimates are more widely understood. • Adjusted impact estimates may be dependent on the functional form and
regression method that is chosen. Generally, the outcome is modeled as a linear function of the treatment group status and baseline characteristics using Ordinary Least Squares (OLS). However, for “dummy” dependent variables, a Logit or Probit specification may be preferred, particularly when the outcome variable is highly skewed.1 This makes the interpretation of adjusted-impacts more difficult, compared to the straightforward unadjusted estimates, which are simply differences in mean outcomes between the program and control group.
• For many outcomes, the improvement in statistical precision that is achieved
through regression-adjustment is typically quite small in large-scale studies (Meyer, 1995), and precision may in fact decrease in smaller sample studies if there are significant numbers of missing values among the regression covariates.
ADJUSTED IMPACT ESTIMATES OF CEIP As discussed in Appendix A, random assignment ensured that systematic differences
between program and control groups were not present at baseline, nor did systematic differences in baseline characteristics develop over the 40-month period as a result of non-response bias. However, some small differences did arise, due to chance, which justify the consideration of regression-adjusted impacts. Tables A.1 and A.2 of Appendix A presented baseline characteristics of Employment Insurance (EI) and income assistance (IA) sample members, respectively, who responded to the 40-month follow-up survey. This analysis revealed that the EI program group has a smaller proportion of women, is more likely to live in households without children, and are less likely to have a household income of $30,000 or more compared to the control group. EI program group members also appear to have smaller social networks, are more likely to have activity or health limitations, and a longer period of residence at their current address than their control group counterparts. Among IA sample members, the program group is more likely to have lived in Cape Breton their whole lives, but is also somewhat more open to moving in order to get a job compared to the control group. IA program group members are also 1 For example, if a very large (or very small) proportion of the sample has a dependent variable equal to one, the predicted probabilities from OLS can be greater than one (or negative) resulting in biased estimates, which is not the case with the Probit or Logit models. However, for the purpose of calculating regression-adjusted impacts in the context of a large scale random assignment design, OLS is a reasonable approximation for most adjusted impacts. Given the large sample and fact that the covariates in the adjusted regression have very limited explanatory power, over and above the treatment group variable (due to random assignment) there is little bias with a linear specification for most outcomes. Nonetheless, the adjusted impacts of CEIP were also estimated with Logit and Probit models, for selected outcomes having dummy dependent variables, in order to confirm that the linear estimates were reasonable. In most cases, there is little difference between adjusted impact estimates using OLS, Probit, or Logit models. Furthermore, when they do differ, the Probit and Logit models result in impacts that are often closer to the unadjusted impact estimates. Only the linear regression-adjusted impact estimates are presented in this Appendix.

- 124 -
more likely to live in households without children and less likely to have a high school diploma than their control group counterparts.
To account for these differences, adjusted impacts were estimated by regressing each outcome of interest on a treatment group variable and a range of socioeconomic and demographic characteristics that were measured before random assignment. In addition to those characteristics where differences were observed, a range of other baseline variables were included in the regressions. In total, 18 characteristics (the independent variables) were regressed on each outcome observed at 40 months (the dependent variable), with both continuous and binary variables included, all of which were measured through the baseline survey, administered before random assignment:
• Treatment group • Gender • Age
• Marital status
• No children in household
• Youngest child in the household is under 5 years of age
• Total size of the household
• Respondent has less than high school diploma
• Activity limitations or fair/poor health were reported
• In paid work at baseline
• Number of years worked at a paid job since 16 years of age
• Has 10 or more contacts (social networks)
• Engaged in some formal volunteering
• Engaged in some informal volunteering
• Lived in Cape Breton all of life
• Lived at current residence more than five years
• Will move for work

- 125 -
• Will accept lower wage or work in different occupation or industry
• Household income less than $30,000 (EI), or less than $10,000 (IA)
Tables C.1 through C.12 present the resulting adjusted impact estimates for selected outcomes, with each corresponding to an earlier table of unadjusted impacts presented in Chapters 3 through 7. For the most part, there are relatively few differences between the adjusted and unadjusted impact estimates. The sign of the adjusted impacts always corresponds to the unadjusted estimates. Their magnitude occasionally differs as do the standard errors. In most cases, the difference is small and the level of statistical significance is the same. However, for a few outcomes, which have been footnoted throughout the text, the magnitude of the difference in impact between the adjusted and unadjusted estimates is nontrivial. Similarly, there are some differences in the level of significance of the impact estimate, with some impacts gaining significance and others losing it following regression adjustment.
Employment, Earnings, Job Characteristics With respect to employment-related outcomes reported in Chapter 3, there are few
differences between adjusted and unadjusted impact estimates. Impacts on employment rates, earnings, hourly wages and hours worked are similar, regardless of which method is used to estimate them. Impacts on job skill level, number of jobs and job duration also remain largely unchanged after regression adjustment. There is a small difference in unadjusted and adjusted impact estimates on the second-most common occupation type among EI program group members — Business, Finance and Administrative positions. The impact increased in magnitude from 3.7 to 5.8 percentage points and was statistically significant after regression adjustment, although the key findings remain unchanged.
Income, Transfer Receipt, Well-Being There are a few differences to report with respect to the impacts on income, hardship,
and well-being reported in Chapter 4. Adjusted impacts on both EI and IA transfer receipt among both samples are similar to the unadjusted estimates. However, the negative impact on other household income in the EI sample decreased in magnitude from $2,829 to $1,669, and was no longer significant after regression adjustment. Nonetheless, the decrease remains sufficient to counterbalance the positive impact on personal income such that there is no significant effect of CEIP on average household income among the EI program. Results are similar with and without regression adjustment.
With respect to low-income status, the adjusted impact on the proportion of EI program group members with incomes between 75 and 100 per cent of Statistics Canada’s Low-Income Cut-Off (LICO) is smaller in magnitude than the unadjusted estimate (4.1 versus 6.4 percentage points) and no longer statistically significant. However, there is still a significant reduction in the severity of poverty for some EI program group members, as fewer were in the lower ends of the income distribution. This result is the same with and without regression adjustment (8.1 percentage points fewer EI program group members with incomes less than 75 per cent of LICO).
- 126 -
With respect to financial accounts and debts, a few impacts were weakened by regression adjustment. The small positive impact in the EI sample on the proportion holding accounts of $25,000 or more decreased to 3 percentage points and was no longer statistically significant after regression adjustment. Also, in the EI sample the positive impact on the proportion that had smaller amounts in financial accounts compared to last year decreased to 4 percentage points and was no longer significant after adjustment. In the IA sample, the 10 percentage point greater likelihood of program group members being in debt compared to the control group, was slightly reduced to 8 percentage points after adjustment and was no longer significant.
With respect to hardship outcomes, however, higher and more significant impacts were observed after adjustment, particularly for the IA sample. After adjustment, IA program group members were 7 percentage points less likely to have met little or none of their expenses in the past 6 months, 9 percentage points less likely to have had difficulty paying for rent, and 6 percentage points less likely to have been unable to get groceries almost every month than their control group counterparts — the corresponding unadjusted results were not statistically significant. Also, after adjustment, EI program group members were less likely than their control group counterparts to have met little or none of their expenses in the past six months and less likely to have had difficulty paying for electricity, results that had not been statistically significant prior to adjustment. In addition, the significant negative impact on inability to get groceries among the EI sample shifted from almost every month to some months.
Social Capital With respect to social networks discussed in Chapter 5, the negative impact observed
among the EI sample at 40 months on proportion of contacts living within one’s own community was larger at 6 percentage points and became statistically significant following regression adjustment. Also, at 40 months after adjustment EI program group members had on average one extra contact from somewhere else in Cape Breton compared to their control group counterparts — the result had not been statistically significant prior to adjustment. With respect to composite measure B, after adjustment, the 11 percentage point higher likelihood of IA program group members having multiple indicators of bridging/linking social capital was reduced to 8 percentage points and was no longer statistically significant.
Employability Regarding the employability outcomes discussed in Chapter 6, there are also a few
differences in the magnitude of adjusted and unadjusted impacts and their level of statistical significance. Although the adjusted impacts on lifelong learning among the EI sample and sense of quality among the IA sample are similar in magnitude to the unadjusted estimates, they fail to reach the level of statistical significance. Also, with respect to attitudes on transfer payments, after adjustment the tendency among IA program group members to agree strongly with the statements, “It’s wrong to stay on welfare if you are offered a job, even one you don’t like,” and, “It’s wrong to take Employment Insurance if you are offered a job, even one you don’t like” increased, so that it was significantly higher than that of the control group. However, the higher

- 127 -
likelihood of EI program group members to agree with the statement “It’s wrong to stay on welfare if you are offered a job, even one you don’t like” lost statistical significance after adjustment. With regards to education and training, after adjustment the negative impact on enrolling in non-CEIP provided training among the IA sample increased in magnitude (from 7 to 11 percentage points) and became statistically significant. Finally, with respect to mobility, after adjustment the likelihood of moving out of Cape Breton was significantly higher among IA program group members compared to their control group counterparts (3 percentage points).
Volunteering Volunteering outcomes reported in Chapter 7 were largely unaffected by regression
adjustment. Among the IA sample, the positive impact on formal volunteering a few times a week decreased in magnitude and lost statistical significance after adjustment, but positive impacts on volunteering about once a month and less than once a month were unaffected. Also, although the positive impact on the IA sample’s average hours of formal volunteering lost statistical significance after adjustment, the positive distributional impacts on volunteering up to 5 hours a month, and between 5 and 15 hours a month remain similar in magnitude and statistically significant.
For the following tables, data was calculated from the 40-month follow-up survey. All analyses were only for those who responded to that survey. A two-tailed t-test was applied to differences between the outcomes for the program and control groups. Sample sizes vary for individual measures because of missing values. This may cause slight discrepancies in sums and differences.
Statistical significance levels are indicated as: * = 10 per cent; ** = 5 per cent; and *** = 1 per cent, or † = 10 per cent; †† = 5 per cent; and ††† = 1 per cent. Q-tests were applied to differences among subgroups in estimated impacts. The abbreviation “n.s.” indicates that the variation in impacts among the subgroups is not statistically significant.
Rounding may cause slight discrepancies in sums and differences.

- 128 -
Table C.1: Impacts on Occupation Type of Main Job during Months 1 to 40
EI Sample IA SampleProgram Control Standard Program Control Standard
Outcome Group Group Error Group Group Error
Ever employedDid not work 3.5 10.3 -6.8 *** (1.8) 4.8 24.9 -20.1 *** (3.7)Worked 96.5 89.7 6.8 *** (1.8) 95.2 75.1 20.1 *** (3.7)
Occupation typeBusiness, finance and administration 19.8 14.0 5.8 ** (2.6) 11.4 12.4 -1.0 (3.5)Natural and applied sciences and related 5.4 4.8 0.6 (1.6) 2.9 0.9 2.0 (1.5)Health 2.4 4.7 -2.3 * (1.4) 1.1 3.2 -2.1 (1.6)Social science, education, government service and religion 8.1 2.1 6.0 *** (1.6) 13.0 2.2 10.8 *** (2.8)Art, culture, recreation and sport 4.8 1.2 3.6 *** (1.3) 2.3 0.9 1.4 (1.4)Sales and service 34.8 33.3 1.5 (3.5) 39.4 40.2 -0.8 (5.3)Trades, transport and equipment operators and related 15.6 17.3 -1.7 (2.6) 17.4 6.5 11.0 *** (3.4)Unique to primary industry 2.0 4.9 -2.9 ** (1.3) 7.8 1.4 6.4 *** (2.2)Unique to processing, manufacturing and utilities 3.6 7.3 -3.7 ** (1.7) -0.3 7.3 -7.5 *** (1.9)
Sample size 441 410 210 201
Impact Impact
Note: See page 127 for notes and source.
Table C.2: Impacts on Personal and Household Income Prior to the 40-Month Follow-Up Interview
EI Sample IA SampleProgram Control Standard Program Control Standard
Outcome Group Group Error Group Group Error
Personal and family income ($/year)Individual income 21 794 19 270 2 524 *** (902,9) 14 582 12 526 2 055 *** (713,3)Other household income 16 075 17 744 -1 669 (1353,3) 5 566 4 584 982 (1029,2)Total household incomea 37 506 37 050 456 (1587,0) 19 868 17 095 2 774 ** (1312,2)
Marital status at the 40-month follow-up interviewMarried or living common-law (%) 64,5 62,6 1,9 (2,4) 24,1 22,0 2,2 (3,7)
Employment of spouse in past 12 monthsHad a spouse who worked (%) 40,4 38,8 1,5 (3,2) 13,6 7,0 6,7 ** (3,1)Number of months spouse worked 4,4 4,7 -0,3 (0,4) 1,3 0,7 0,6 ** (0,3)Had spouse that worked full-time (%) 34,9 31,9 3,1 (3,2) 13,7 5,3 8,5 *** (3,0)Had spouse that worked part-time (%) 5,1 6,2 -1,1 (1,7) -0,1 1,7 -1,8 * (1,0)
Sample size 441 410 210 201
Difference(Impact)
Difference(Impact)
Notes: a Household income is measured as the sum of the sample member's income and the income of all other members in that
person's household. See page 127 for more notes and source.
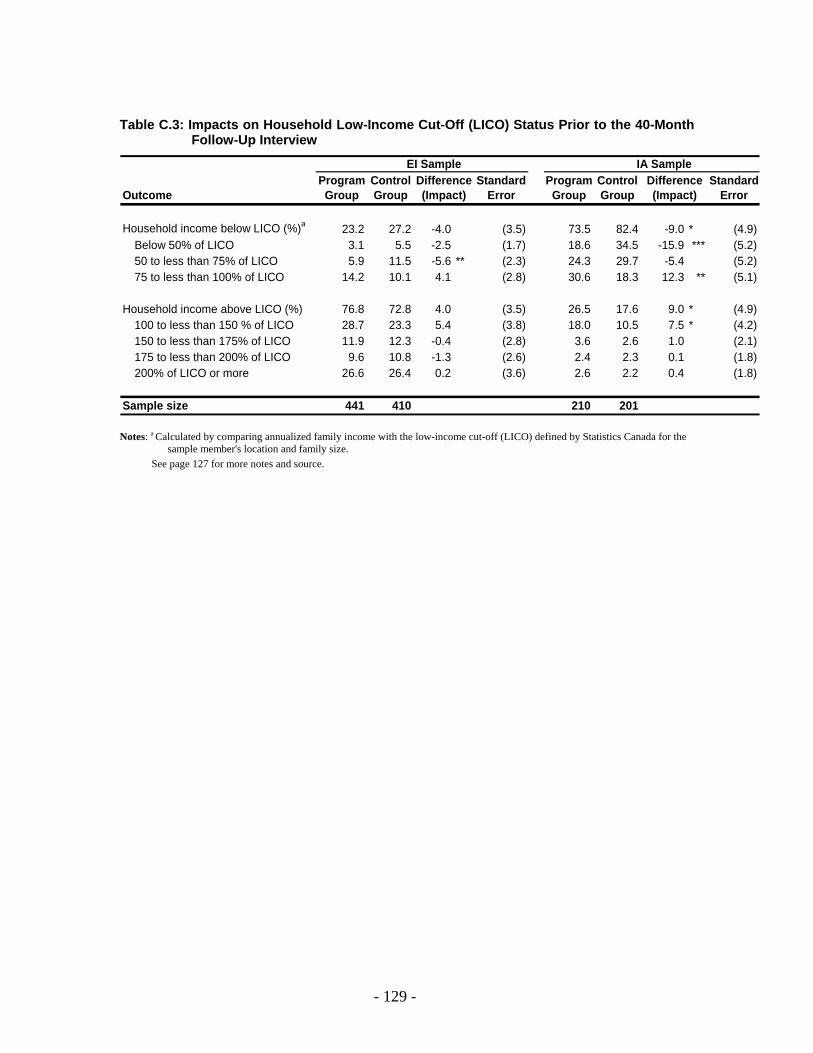
- 129 -
Table C.3: Impacts on Household Low-Income Cut-Off (LICO) Status Prior to the 40-Month Follow-Up Interview
EI Sample IA SampleProgram Control Standard Program Control Standard
Outcome Group Group Error Group Group Error
Household income below LICO (%)a 23.2 27.2 -4.0 (3.5) 73.5 82.4 -9.0 * (4.9)Below 50% of LICO 3.1 5.5 -2.5 (1.7) 18.6 34.5 -15.9 *** (5.2)50 to less than 75% of LICO 5.9 11.5 -5.6 ** (2.3) 24.3 29.7 -5.4 (5.2)75 to less than 100% of LICO 14.2 10.1 4.1 (2.8) 30.6 18.3 12.3 ** (5.1)
Household income above LICO (%) 76.8 72.8 4.0 (3.5) 26.5 17.6 9.0 * (4.9)100 to less than 150 % of LICO 28.7 23.3 5.4 (3.8) 18.0 10.5 7.5 * (4.2)150 to less than 175% of LICO 11.9 12.3 -0.4 (2.8) 3.6 2.6 1.0 (2.1)175 to less than 200% of LICO 9.6 10.8 -1.3 (2.6) 2.4 2.3 0.1 (1.8)200% of LICO or more 26.6 26.4 0.2 (3.6) 2.6 2.2 0.4 (1.8)
Sample size 441 410 210 201
Difference(Impact)
Difference(Impact)
Notes: a Calculated by comparing annualized family income with the low-income cut-off (LICO) defined by Statistics Canada for the
sample member's location and family size. See page 127 for more notes and source.

- 130 -
Table C.4: Impacts on Personal Finance at the 40-Month Follow-Up Interview
EI Sample IA SampleProgram Control Standard Program Control Standard
Outcome Group Group Error Group Group Error
Have any financial accounts (%) 95.5 90.9 4.7 ** (1.9) 81.8 83.9 -2.1 (4.2)No financial account 4.5 9.1 -4.7 ** (1.9) 18.2 16.1 2.1 (4.2)Amount less than $1,000 57.1 47.8 9.3 ** (3.7) 70.8 79.5 -8.8 * (4.8)$1,000 to less than $25,000 25.5 33.1 -7.6 ** (3.5) 10.3 4.0 6.2 ** (2.8)$25,000 or more 12.7 9.3 3.4 (2.4) 0.6 0.0 0.5 (0.6)
Financial accounts compared to last yearMore than one year ago 32.1 31.6 0.5 (3.6) 18.0 15.1 2.9 (4.1)Less than one year ago 31.6 27.8 3.8 (3.6) 40.3 28.7 11.6 ** (5.2)The same as one year ago 31.8 31.0 0.8 (3.7) 23.2 39.9 -16.7 *** (5.1)
Have any debts (%) 71.8 70.1 1.7 (3.6) 48.6 41.0 7.6 (5.5)No debt 28.3 30.0 -1.7 (3.6) 51.4 59.0 -7.6 (5.5)Amount less than $1,000 4.8 5.7 -0.9 (1.8) 9.1 3.0 6.1 ** (2.6)$1,000 to less than $10,000 28.7 34.4 -5.7 (3.8) 20.0 21.5 -1.5 (4.5)$10,000 or more 37.5 28.8 8.7 ** (3.7) 18.8 16.5 2.4 (4.2)
Debts compared to last yearMore than one year ago 26.5 24.1 2.5 (3.5) 16.2 20.6 -4.4 (4.3)Less than one year ago 24.4 26.6 -2.3 (3.5) 8.0 6.7 1.3 (2.9)The same as one year ago 20.5 18.9 1.7 (3.2) 23.8 13.7 10.1 ** (4.3)
Sample size 441 410 210 201
Difference(Impact)
Difference(Impact)
Note: See page 127 for notes and source.
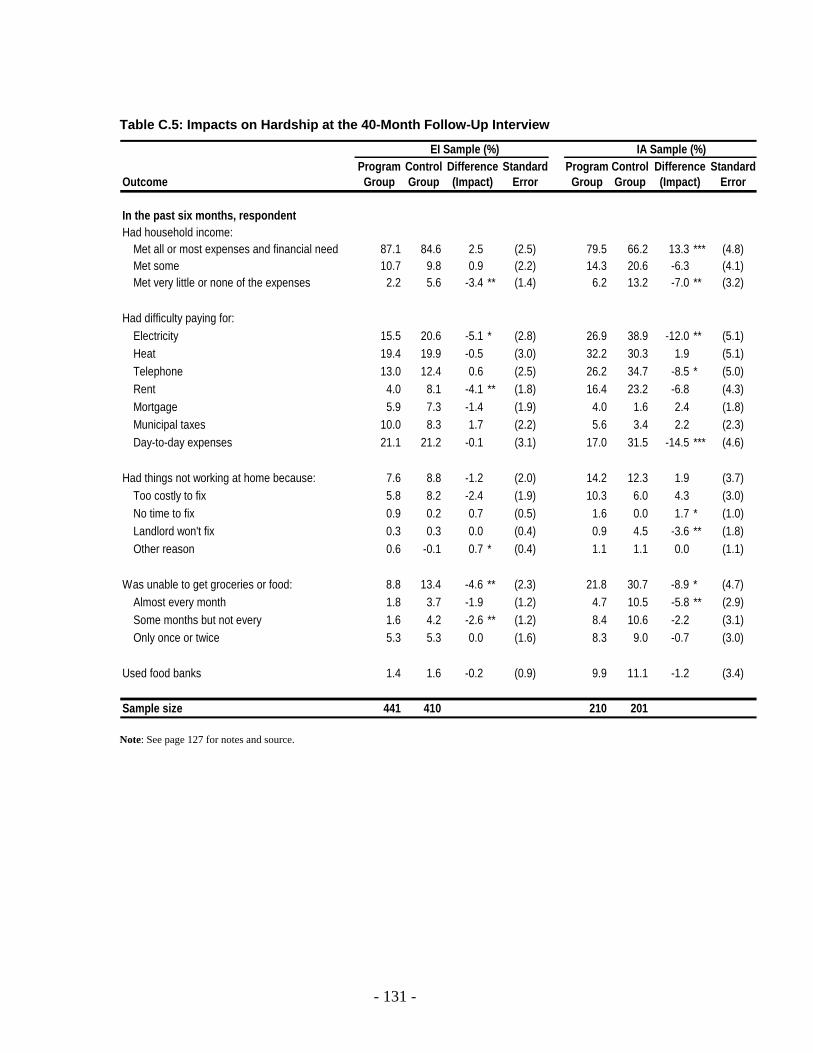
- 131 -
Table C.5: Impacts on Hardship at the 40-Month Follow-Up Interview
EI Sample (%) IA Sample (%)Program Control Standard Program Control Standard
Outcome Group Group Error Group Group Error
In the past six months, respondentHad household income:
Met all or most expenses and financial need 87.1 84.6 2.5 (2.5) 79.5 66.2 13.3 *** (4.8)Met some 10.7 9.8 0.9 (2.2) 14.3 20.6 -6.3 (4.1)Met very little or none of the expenses 2.2 5.6 -3.4 ** (1.4) 6.2 13.2 -7.0 ** (3.2)
Had difficulty paying for:Electricity 15.5 20.6 -5.1 * (2.8) 26.9 38.9 -12.0 ** (5.1)Heat 19.4 19.9 -0.5 (3.0) 32.2 30.3 1.9 (5.1)Telephone 13.0 12.4 0.6 (2.5) 26.2 34.7 -8.5 * (5.0)Rent 4.0 8.1 -4.1 ** (1.8) 16.4 23.2 -6.8 (4.3)Mortgage 5.9 7.3 -1.4 (1.9) 4.0 1.6 2.4 (1.8)Municipal taxes 10.0 8.3 1.7 (2.2) 5.6 3.4 2.2 (2.3)Day-to-day expenses 21.1 21.2 -0.1 (3.1) 17.0 31.5 -14.5 *** (4.6)
Had things not working at home because: 7.6 8.8 -1.2 (2.0) 14.2 12.3 1.9 (3.7)Too costly to fix 5.8 8.2 -2.4 (1.9) 10.3 6.0 4.3 (3.0)No time to fix 0.9 0.2 0.7 (0.5) 1.6 0.0 1.7 * (1.0)Landlord won't fix 0.3 0.3 0.0 (0.4) 0.9 4.5 -3.6 ** (1.8)Other reason 0.6 -0.1 0.7 * (0.4) 1.1 1.1 0.0 (1.1)
Was unable to get groceries or food: 8.8 13.4 -4.6 ** (2.3) 21.8 30.7 -8.9 * (4.7)Almost every month 1.8 3.7 -1.9 (1.2) 4.7 10.5 -5.8 ** (2.9)Some months but not every 1.6 4.2 -2.6 ** (1.2) 8.4 10.6 -2.2 (3.1)Only once or twice 5.3 5.3 0.0 (1.6) 8.3 9.0 -0.7 (3.0)
Used food banks 1.4 1.6 -0.2 (0.9) 9.9 11.1 -1.2 (3.4)
Sample size 441 410 210 201
Difference(Impact)
Difference(Impact)
Note: See page 127 for notes and source.

- 132 -
Table C.6: Network Heterogeneity
Program Control Difference Standard Program Control Difference Standard Group Group (Impact) Error Group Group (Impact) Error
Characteristics of ContactsProportion of Contacts that are
Same gender as youBaseline 60.2 59.8 0.5 (1.7) 63.0 63.5 -0.5 (2.4)18 months 60.9 62.3 -1.5 (1.6) 64.8 65.5 -0.7 (2.4)40 months 60.3 63.1 -2.8 (1.8) 68.8 69.2 -0.3 (2.3)Change from baseline to 40 months 0.5 3.7 -3.2 (2.2) 6.4 5.9 0.5 (2.9)
Within 10 years of your ageBaseline 39.1 39.8 -0.7 (2.1) 34.7 30.2 4.4 (2.9)18 months 62.8 59.1 3.7 * (2.2) 59.0 55.4 3.6 (3.1)40 months 66.2 64.9 1.3 (2.2) 57.7 59.9 -2.2 (3.4)Change from baseline to 40 months 27.2 23.8 3.3 (3.0) 24.8 29.0 -4.1 (4.4)
Same level of education as youBaseline 35.3 38.3 -3.0 (2.2) 35.0 33.1 1.9 (3.0)18 months 45.9 45.9 0.0 (2.5) 45.5 40.8 4.6 (3.7)40 months 51.4 51.9 -0.5 (2.6) 43.3 46.4 -3.1 (4.0)Change from baseline to 40 months 16.1 14.0 2.1 (3.2) 8.9 12.7 -3.8 (4.7)
Live within your communityBaseline 65.7 65.1 0.6 (2.6) 73.1 78.5 -5.4 (3.7)18 months 68.8 67.4 1.4 (2.6) 70.8 75.7 -4.9 (3.6)40 months 67.6 73.7 -6.2 ** (2.6) 73.2 74.3 -1.2 (3.8)Change from baseline to 40 months 1.9 8.7 -6.8 ** (3.2) -0.3 -5.6 5.3 (4.8)
Number of contacts within and outside your communityLive within your communityBaseline 7.6 6.7 0.9 (0.6) 6.3 6.7 -0.4 (0.6)18 months 7.9 6.9 1.0 * (0.6) 8.3 8.4 -0.1 (0.9)40 months 9.0 9.7 -0.7 (0.8) 9.1 8.1 1.0 (1.2)Change from baseline to 40 months 1.5 3.0 -1.6 * (0.9) 2.9 1.2 1.7 (1.3)
Live somewhere else in Cape BretonBaseline 3.4 3.4 0.0 (0.4) 2.4 1.8 0.6 (0.4)18 months 2.9 3.1 -0.2 (0.4) 2.6 2.8 -0.1 (0.6)40 months 3.6 2.6 1.0 ** (0.5) 3.1 2.5 0.6 (0.6)Change from baseline to 40 months 0.2 -0.9 1.1 * (0.6) 0.8 0.8 0.0 (0.7)
Live outside Cape BretonBaseline 1.1 0.9 0.2 (0.3) 0.9 0.4 0.5 (0.4)18 months 0.9 1.1 -0.2 (0.2) 0.8 1.0 -0.3 (0.6)40 months 1.2 1.1 0.1 (0.3) 1.0 0.9 0.1 (0.4)Change from baseline to 40 months 0.2 0.2 0.0 (0.3) 0.0 0.5 -0.5 (0.5)
Sample size 407 360 767 188 186 374
EI Sample IA Sample
Notes: Mean change is not always the difference between the 40-month mean and the mean at baseline, because changes are only
calculated for those with no missing values. See page 127 for more notes and source.

- 133 -
Table C.7: Composite Measures of Change from Baseline to 40 Months
Program Control Standard Program Control StandardPercentage with a given level of change Group Group Error Group Group Error
Composite Measure A (4 items)Number of Indicators of increasing bridging/linking social capital:Zero 17.8 25.8 -8.0 ** (3.3) 24.3 29.4 -5.1 (5.1)One 30.0 36.3 -6.3 * (3.8) 23.1 28.7 -5.6 (5.1)One or fewer indicators 47.8 62.1 -14.3 *** (4.0) 47.4 58.1 -10.7 * (5.8)Two 34.9 23.9 11.0 *** (3.7) 36.4 19.1 17.3 *** (5.1)Three 12.3 10.3 2.0 (2.6) 12.7 16.3 -3.6 (4.2)Four 5.0 3.7 1.3 (1.7) 3.5 6.5 -3.0 (2.6)Two or more indicators 52.2 37.9 14.3 *** (4.0) 52.6 41.9 10.7 * (5.8)
Composite Measure B (5 items)Number of Indicators of increasing bridging/linking social capital:Zero 12.7 20.4 -7.7 ** (3.1) 18.5 21.3 -2.8 (4.6)One 25.5 30.0 -4.5 (3.7) 21.5 26.3 -4.8 (5.1)One or fewer indicators 38.1 50.4 -12.3 *** (4.1) 40.0 47.6 -7.6 (5.9)Two 32.9 28.0 4.9 (3.9) 31.0 24.9 6.1 (5.4)Three 19.4 14.2 5.2 * (3.1) 19.6 13.1 6.4 (4.4)Four 7.3 6.0 1.3 (2.0) 6.9 11.0 -4.1 (3.4)Five 2.2 1.4 0.8 (1.1) 2.5 3.4 -0.9 (2.0)Two or more indicators 61.9 49.6 12.3 *** (4.1) 60.0 52.4 7.6 (5.9)
Sample size 374 331 705 170 174 344
Difference(Impact)
EI Sample IA SampleDifference(Impact)
Note: See page 127 for notes and source.

- 134 -
Table C.8: Impacts on Working Skills at the 40-Month Follow-Up Interview
EI Sample IA SampleProgram Control Standard Program Control Standard
Outcome Group Group Error Group Group Error
It really bugs me to see a problem that nobody is trying to solve
Almost always/quite a bit like me 76.0 78.2 -2.1 (3.2) 82.5 78.3 4.2 (4.3)Moderately like me 14.0 13.3 0.7 (2.6) 9.5 8.1 1.4 (3.1)Occasionally/almost never like me 10.0 8.6 1.4 (2.2) 8.0 13.6 -5.6 * (3.4)
I prefer to learn with other peopleAlmost always/quite a bit like me 65.3 65.1 0.3 (3.6) 73.3 74.8 -1.4 (4.8)Moderately like me 22.6 21.2 1.5 (3.1) 15.0 15.3 -0.3 (3.9)Occasionally/almost never like me 12.0 13.8 -1.7 (2.5) 11.7 9.9 1.8 (3.4)
I follow through on things no matter what what it takes
Almost always/quite a bit like me 91.1 87.0 4.1 * (2.3) 90.7 87.3 3.4 (3.4)Moderately like me 6.8 10.1 -3.3 (2.1) 4.9 8.9 -4.1 (2.7)Occasionally/almost never like me 2.1 2.9 -0.8 (1.2) 4.5 3.8 0.6 (2.2)
I can't quit thinking about something untilI am sure they I have done it very well
Almost always/quite a bit like me 88.8 87.7 1.1 (2.4) 87.3 91.8 -4.5 (3.3)Moderately like me 9.2 9.0 0.2 (2.2) 8.0 6.4 1.6 (2.8)Occasionally/almost never like me 2.0 3.2 -1.2 (1.2) 4.8 1.8 2.9 (1.9)
I prefer to know what's in it for me beforeI spend a lot of effort learning something
Almost always/quite a bit like me 30.1 34.9 -4.8 (3.5) 30.0 42.0 -12.0 ** (5.2)Moderately like me 30.6 30.5 0.2 (3.5) 27.6 30.0 -2.4 (4.9)Occasionally/almost never like me 39.3 34.6 4.7 (3.6) 42.4 28.1 14.3 *** (5.1)
I usually do something I enjoy ratherthan try something different
Almost always/quite a bit like me 27.0 39.1 -12.0 *** (3.5) 34.5 42.0 -7.5 (5.3)Moderately like me 37.5 32.7 4.8 (3.6) 25.4 30.5 -5.1 (4.9)Occasionally/almost never like me 35.5 28.3 7.3 ** (3.5) 40.1 27.5 12.7 ** (5.2)
Difference(Impact)
Difference(Impact)
Note: See page 127 for notes and source.
(continued)

- 135 -
Table C.8: Impacts on Working Skills at the 40-Month Follow-Up Interview (Cont’d)
EI Sample IA SampleProgram Control Standard Program Control Standard
Outcome Group Group Error Group Group Error
I understand new things by seeing howthey fit with what I already know 79,8 79,5 0,3 (3,0) 75,2 74,8 0,5 (4,8)
Almost always/quite a bit like me 13,6 13,6 0,1 (2,6) 19,5 18,2 1,3 (4,3)Moderately like me 6,6 6,9 -0,3 (1,9) 5,3 7,0 -1,7 (2,7)Occasionally/almost never like me
I know how to get things done in a system or an organization
Almost always/quite a bit like me 86,6 79,6 7,0 ** (2,8) 78,7 81,3 -2,6 (4,4)Moderately like me 9,8 12,7 -2,9 (2,4) 13,9 12,2 1,7 (3,7)Occasionally/almost never like me 3,6 7,7 -4,1 ** (1,7) 7,4 6,5 0,9 (2,7)
Sample size 441 410 210 201
Difference Difference(Impact) (Impact)
Notes: Sample size for the program group is 470 for the EI group and 237 for the IA group. See page 127 for notes and source.

- 136 -
Table C.9: Impacts on Attitude to Work and Transfer Payments at the 40-Month Follow-Up Interview
EI Sample IA SampleProgram Control Standard Program Control Standard
Outcome Group Group Error Group Group Error
I like going to workAgree strongly 31.1 23.8 7.4 ** (3.3) 43.2 29.7 13.5 *** (5.2)Agree 66.4 70.0 -3.7 (3.5) 56.1 67.1 -10.9 ** (5.2)Disagree 2.4 5.8 -3.3 ** (1.5) 0.1 3.3 -3.2 ** (1.4)Disagree strongly 0.1 0.5 -0.4 (0.4) 0.6 -0.1 0.7 (0.6)
When I have a job I am a happier personAgree strongly 32.1 33.7 -1.6 (3.5) 47.6 32.2 15.4 *** (5.4)Agree 65.0 62.2 2.8 (3.6) 50.6 64.0 -13.4 ** (5.4)Disagree 2.9 4.1 -1.2 (1.4) 1.2 3.9 -2.7 (1.7)Disagree strongly 0.0 0.0 0.0 . 0.6 -0.1 0.7 (0.6)
My family supports me taking a jobAgree strongly 35.1 31.9 3.1 (3.5) 45.4 27.8 17.6 *** (5.1)Agree 64.2 65.3 -1.1 (3.6) 52.1 69.7 -17.7 *** (5.2)Disagree 0.8 2.8 -2.0 ** (1.0) 2.5 2.5 0.0 (1.7)Disagree strongly 0.0 0.0 0.0 . 0.0 0.0 0.0 .
It's wrong to stay on welfare if you areoffered a job, even one you don't like
Agree strongly 34.8 35.1 -0.3 (3.6) 42.2 33.4 8.8 * (5.3)Agree 60.2 55.7 4.4 (3.7) 49.1 52.4 -3.3 (5.5)Disagree 4.5 7.8 -3.3 * (1.8) 8.6 13.2 -4.6 (3.5)Disagree strongly 0.6 1.4 -0.8 (0.7) 0.1 1.0 -0.9 (0.8)
It's wrong to take Employment Insurance if you are offered a job, even one you don't like
Agree strongly 23.2 26.1 -2.9 (3.2) 36.3 26.3 10.1 ** (5.0)Agree 59.9 59.3 0.6 (3.7) 51.0 58.6 -7.6 (5.4)Disagree 15.8 13.4 2.4 (2.7) 12.2 14.5 -2.3 (3.8)Disagree strongly 1.1 1.1 -0.1 (0.8) 0.5 0.6 -0.1 (0.8)
Sample size 441 410 210 201
Difference(Impact)
Difference(Impact)
Note: See page 127 for notes and source.

- 137 -
Table C.10: Impacts on Non-CEIP-Provided Training at the 40-Month Follow-Up Interview
EI Sample IA SampleProgram Control Standard Program Control Standard
Outcome Group Group Error Group Group Error
Non-CEIP-provided training since enrolment 31.7 29.6 2.0 (3.3) 22.3 33.1 -10.8 ** (4.7)
Courses taken towards:Improvement of job skills/job requirement 24.4 19.2 5.1 * (3.0) 12.5 16.2 -3.6 (3.7)
High school diploma 2.5 2.0 0.5 (1.1) 2.9 4.7 -1.9 (2.0)Apprenticeship diploma/certificate 0.8 0.5 0.2 (0.6) 1.0 0.6 0.4 (1.0)Trade/vocational diploma or certificate 1.3 4.6 -3.3 *** (1.2) 3.2 4.4 -1.2 (2.1)College diploma or certificate 7.3 6.4 0.9 (1.9) 3.5 8.4 -4.9 * (2.5)University degree 2.2 2.1 0.1 (1.1) 0.7 1.5 -0.8 (1.1)Personal interest or life skills 16.8 13.9 2.9 (2.7) 7.8 8.4 -0.6 (2.9)Job requirement 2.4 2.6 -0.3 (1.2) 4.6 7.3 -2.7 (2.5)Other 0.0 0.0 0.0 . 0.4 1.2 -0.8 (1.0)
Completed training 24.3 24.4 -0.1 (3.1) 17.4 25.4 -8.0 * (4.4)
Still taking training 6.3 3.7 2.6 (1.6) 3.3 5.3 -2.0 (2.2)Sample size 441 410 210 201
Difference(Impact)
Difference(Impact)
Notes: Sample size for the program group is 470 for the EI group and 237 for the IA group. See page 127 for notes and source.

- 138 -
Table C.11: Impacts on Mobility at the 40-Month Follow-Up Interview
Program Control Standard Program Control StandardOutcome Group Group Error Group Group Error
Percentage of respondents moved: 17.02 16.9 0.1 (2.6) 33.0 29.3 3.7 (4.8)
Within community 6.54 6.9 -0.3 (1.8) 13.3 12.1 1.2 (3.6)To another community in Cape Breton 6.95 6.8 0.2 (1.8) 16.6 12.2 4.4 (3.8)
Outside of Cape Breton 3.03 2.1 1.0 (1.2) 3.7 0.8 3.0 * (1.6)
Reasons for movingWork-related (own or partner's) 4.03 3.9 0.2 (1.4) 4.6 3.0 1.7 (2.0)Family-related 2.21 2.0 0.2 (1.1) 6.4 5.5 1.0 (2.5)Housing 8.82 8.6 0.3 (2.0) 16.4 13.4 3.0 (3.8)Other 1.95 2.3 -0.3 (1.1) 5.5 7.5 -2.0 (2.6)
Sample size 441 410 210 201
EI Sample IA SampleDifference(Impact)
Difference(Impact)
Note: See page 127 for notes and source.

- 139 -
Table C.12: Impacts on Formal Volunteering with Groups or Organizations
EI Sample IA SampleProgram Control Difference Standard Program Control Difference Standard Group Group (Impact) Error Group Group (Impact) Error
Frequency of formal volunteeringHow often did you volunteer in last 12 months
Every day 3.6 1.4 2.1 * (1.1) 2.8 1.1 1.7 (1.5)A few times a week 9.8 7.1 2.7 (2.1) 8.4 4.7 3.7 (2.6)About once a week 12.2 9.2 3.0 (2.2) 11.7 7.5 4.2 (3.1)About once a month 9.6 9.4 0.3 (2.1) 12.9 7.3 5.7 * (3.2)Less than once a month 12.5 7.5 5.1 ** (2.2) 13.7 5.4 8.4 *** (3.2)Never 52.3 65.4 -13.1 *** (3.3) 50.5 74.1 -23.6 *** (4.8)
Types of unpaid formal volunteeringAssisted a group or organization with
Canvassing, campaigning, fund-raising 22.3 14.0 8.2 *** (2.7) 25.1 12.9 12.2 *** (4.0)Member of board or committee 15.8 10.5 5.3 ** (2.4) 12.0 4.8 7.2 ** (2.9)Provide info or help educate public 12.9 9.5 3.3 (2.3) 15.1 9.3 5.9 * (3.4)Organize or supervise actvities 29.7 19.0 10.6 *** (3.0) 30.2 12.1 18.0 *** (4.1)Teach or coach for an organization 11.3 7.6 3.7 * (2.1) 15.6 6.6 9.0 *** (3.3)Office or administrative work 13.9 7.2 6.7 *** (2.2) 12.6 4.3 8.3 *** (2.9)Provide care, support, or counselling 13.7 6.8 7.0 *** (2.2) 14.6 8.7 5.9 * (3.3)Collect, serve, or delivery food 13.4 9.0 4.4 * (2.3) 18.2 10.6 7.6 ** (3.6)Volunteer driver for organization 10.7 5.9 4.7 ** (2.0) 8.3 6.3 2.0 (2.7)Other 12.9 7.1 5.7 *** (2.2) 12.9 9.3 3.6 (3.3)
Hours of formal volunteeringAverage hours per month 8.1 4.6 3.5 *** (1.0) 7.2 4.7 2.4 (1.6)% of sample that volunteered
>0 to 5 hours per month 13.0 12.6 0.3 (2.5) 14.8 6.8 7.9 ** (3.4)>5 to 15 hours per month 16.7 11.8 4.9 * (2.5) 15.0 5.5 9.5 *** (3.3)>15 hours per month 16.1 8.6 7.6 *** (2.4) 13.1 11.2 1.9 (3.6)Did not volunteer 54.2 67.0 -12.8 *** (3.3) 57.1 76.4 -19.3 *** (4.8)
Change in hours volunteered in last 12 monthsIncreased 13.8 8.0 5.9 *** (2.3) 14.9 8.1 6.8 ** (3.4)Stayed the same 77.6 87.2 -9.7 *** (2.7) 76.5 85.2 -8.7 ** (4.1)Decreased 8.6 4.8 3.8 ** (1.8) 8.6 6.7 1.9 (2.9)
Number of OrganizationsAverage # of organizations volunteeered for 1.0 0.6 0.4 *** (0.1) 0.9 0.5 0.4 *** (0.1)% of sample that volunteered for
1 organization 21.9 19.3 2.6 (2.9) 27.9 14.6 13.3 *** (4.3)2-3 organizations 20.4 12.2 8.2 *** (2.6) 16.8 8.2 8.6 ** (3.4)4 or more organizations 4.4 2.2 2.2 * (1.3) 4.2 2.4 1.8 (1.9)Did not volunteer 53.3 66.3 -13.0 *** (3.3) 51.1 74.8 -23.7 *** (4.7)
Sample size 441 410 210 201
Note: See page 127 for notes and source.

- 140 -
Appendix D: Subgroup Impacts
The 40-month impact results presented in this report show that the Community Employment Innovation Project (CEIP) led to substantially higher rates of full-time employment, earnings, and reduced receipt of Employment Insurance (EI) and income assistance (IA) benefits over the three-year course of program operations. As a result of increased earnings, CEIP also improved the well-being of program group members with reductions in the extent and severity of poverty and hardship as well as improved life satisfaction. CEIP also led to improvements in social networks, generic transferable skills and attitudes to work, as well as a substantial increase in volunteering among program group members, particularly in formal activities through community organizations.
These impacts demonstrate the average effects of CEIP on EI and IA sample members. The question naturally arises whether or not these impacts were distributed evenly across the program group or whether they tended to be concentrated among certain subgroups. A related question is whether any lack of significant impacts on other outcomes is characteristic of all individuals within each sample or whether certain subgroups were affected even when, on average, most program group members were not. In order to answer these questions, differences in impacts across a series of subgroups have been evaluated.
SUBGROUP ANALYSIS In order to maintain the experimental nature of the analysis, subgroups must be
defined based on characteristics that were measured before random assignment. Several categories of subgroups have been defined based on measures from the baseline survey including demographic characteristics (gender and age), family structure (marital status, children in the household), education (high school diploma or equivalent), employment and income (work experience since the age of 16, annual income at baseline), barriers to employment (physical or emotional problems restricting activity), and social networks (size and density of baseline networks). Two subgroups were created within each of the above categories (with the exception of the age of respondents, which has three subgroups). The choice and number of subgroups within each category was constrained by the size of the 40-month research sample particularly among IA respondents. With the smaller IA sample size, the analysis was limited in its ability to define subgroups in order to ensure that no one group would have too few sample members, which would lead to higher standard errors and very little statistical power. Among the IA research sample, the smallest subgroup results from the category based on marital status, where 71 respondents of the 40-month survey were married or common-law at the time of enrolment in the study.
Tables D.1 through D.14 present differences in the impacts of CEIP on selected outcomes across the subgroups described above. The impact on each subgroup is calculated as the difference in mean outcome between program and control group members who have that characteristic at the time of enrolment. For brevity, the program
- 141 -
group member mean outcomes are not presented in the tables. The control group mean is presented in the second column along with the impact (program–control group difference) in the third column. As for the full sample results, two-tailed t-tests were applied to differences between the outcomes for the program and control groups.
However, in order to determine whether these impacts were larger for certain subgroups than for others, an additional statistical test is required as random differences could occur. Q-tests were applied to differences among subgroups in the estimated impacts. For each outcome, the results of the test are shown in the columns next to the standard errors. The abbreviation “n.s.” (not significant) indicates that the variation in estimated impacts across the subgroups is not statistically significant (i.e. the observed subgroup differences could easily be due to chance and should not be regarded as evidence that impacts actually differed between the subgroups). Daggers indicate that the variation is statistically significant, meaning that the conclusion that there was a real difference between subgroups in the impact of CEIP can be made with reasonable confidence. Statistical significance levels are indicated as: † = 10 per cent; †† = 5 per cent; ††† = 1 per cent, or * = 10 per cent; ** = 5 per cent; and *** = 1 per cent.
DIFFERENCES IN THE IMPACTS OF CEIP ACROSS SUBGROUPS
Employment Overall, there continues to be little differentiation in the effectiveness of CEIP on the
employment and earnings across subgroups identified through a variety of baseline characteristics. Some of the differences in employment impacts observed between subgroups remain in the latter half of the eligibility period, including a higher incidence of full-time employment on EI sample members who are single and low-income. However, a new set of subgroup differences have emerged in the second half of program operations which suggest that CEIP is having a greater effect on individuals who would otherwise be at a disadvantage in finding and maintaining full-time employment. For EI sample members, these subgroups include individuals who reported having at least one health limitation or who had fewer contacts in their social networks. Among the IA sample, CEIP had a greater impact on individuals with denser social networks and those who had a longer history of IA receipt.
Household Income and Spousal Employment While CEIP increased individual income significantly for both EI and IA program
group members, it had differing effects on other household members’ income, which in turn lead to differing effects on total household income between the two samples. In the case of the EI sample, the increase in personal income of EI program group members is counterbalanced by a corresponding reduction in income from members of their household. For IA sample members, the income of other household members increased over the 40-month period, in large part due to an increase in employment of their spouses, which lead to a corresponding increase in total household income for program group members.

- 142 -
According to subgroup analysis, the differences in impacts of CEIP on other household member income across EI and IA samples are driven entirely by the presence of children in the household. Among the EI sample, CEIP had no effect on other household members’ income when children are present, while it significantly decreased incomes when no children are present in the household. For the IA sample, there is no significant effect on the incomes of other household members when children are present. However, when no children are in the household, CEIP had a large and significant increase on the income of other household members, due in large measure to the increase in spousal employment of program group members in childless households.
Low Income and Severity of Poverty Examining CEIP’s impacts on low-income status, CEIP substantially reduced the
severity of poverty, for both EI and IA program groups, by lowering the percentage in the lowest ends of the income distribution. However, its impact on the incidence of low income (the percentage who move above 100 per cent of Low-Income Cut-Off [LICO]) depended on the presence of children in the household. For EI sample members, there is no statistically significant effect of CEIP on low-income status among program group households without children, while households with children were less likely to be below the LICO threshold as a consequence of participating in CEIP. Among IA sample members, CEIP did not affect low-income status among participants with children in their household, while it substantially reduced the incidence of low income status among households without children.
Transfer Receipt While CEIP reduced reliance on EI and IA benefits throughout the course of the
project, it was more effective in reducing benefit receipt among select subgroups of the sample population. Consistent with the 18-month findings, CEIP was more effective in reducing EI amounts for program group members who were older, male, and had 10 or more years of labour market experience. In addition, the 40-month findings show that less educated sample members also saw their EI amounts reduced over the course of the entire eligibility period. The reductions in total EI payments were at least one-and-a-half times as large for men than women ($8,319 versus $4,542), and similarly larger for those with 10 or more years of work experience than those with less than 10 years ($6,833 versus $4,270) and for those with high school diploma than without ($8,528 versus $5,343).
While no IA subgroup differences were observed in CEIP’s impact on IA receipt at 18 months, individuals without a high school diploma or who had five or less years of work experience received less in total IA benefits over the three-year eligibility period.
Social Capital With respect to social networks, CEIP continues to have little impact on total network
size at 40 months for both the EI and IA sample. However, the number of job contacts increased the most for the EI sample, nearly doubling in size over the course of the project. The subgroup within the EI sample that saw the largest increase in job contacts were female sample members who lived in low income, single parent households. Among

- 143 -
those with annual incomes below $20,000, CEIP provided on average an additional three extra job contacts by the 40-month interview.
Transferable Working Skills Differences in impacts on working skills were assessed along a number of additional
subgroups based on demographic characteristics measured at enrolment. Although a few differences were found, most were small and only significant at the 10 per cent level, and/or were sensitive to regression adjustment of the impacts. However, two differences in subgroup impacts that were large, statistically significant, and of some policy relevance include the effects on problem solving and systems thinking. Among IA program group members, the negative impacts of CEIP on problem-solving skills were experienced solely by women (no impacts on problem solving were observed among men). Among the EI program group, positive impacts on systems thinking were felt largely by those with less education and lower incomes at enrolment.
Mobility Although a few differences in impacts were found on residential mobility, both within
and to other communities in Cape Breton, most were statistically insignificant in each of the individual subgroups. However, a few small differences in impacts on out-migration from Cape Breton were statistically significant (between and within key groups). Among EI program group members, those who were single (i.e. never married, separated, or divorced) and those with low incomes at enrolment (less than $20,000) were slightly more likely to have moved outside of Cape Breton (3 percentage points). Among the IA sample, program group members under the age of 30 moved out of Cape Breton at a slightly higher rate than their control group counterparts (5 percentage points).
Volunteering While CEIP had little impact in the full EI sample on informal volunteering, there
were significant differences for two key subgroups. In particular, EI program group members who were low-income or had a high school diploma (or equivalent) at baseline were less likely to report that they had never volunteered in an informal capacity (9 and 12 percentage points, respectively). Among the IA sample, only individuals who were employed for six or more years at baseline were less likely to report that they never volunteered informally (at nearly 20 percentage points).
For the tables below, data was calculated from the baseline survey and 40-month follow-up surveys. The subgroups are defined according to characteristics at the time of enrolment in the study. Persons answering “don’t know” to a particular question that contributed to defining a subgroup are excluded from the analysis of that subgroup. A two-tailed t-test was applied to differences between the outcomes for the program and control groups.

- 144 -
Statistical significance levels are indicated as: * = 10 per cent; ** = 5 per cent; and *** = 1 per cent, or † = 10 per cent; †† = 5 per cent; and ††† = 1 per cent. Q-tests were applied to differences among subgroups in estimated impacts. The abbreviation “n.s.” indicates that the variation in impacts among the subgroups is not statistically significant.
Rounding may cause slight discrepancies in sums and differences.
Table D.1: Impacts on Full-Time Employment by Subgroup — Percentage Employed Full-Time Between Months 19 and 38
Sample Control Difference Standard Sample Control Difference StandardSubgroup Size Group (Impact) Error Size Group (Impact) ErrorGender and ageGender of respondent n.s. n.s.
Male 470 79.2 15.8 *** (2.9) 137 58.3 33.9 *** (6.7)Female 380 83.7 11.8 *** (3.1) 272 51.8 38.4 *** (5.0)
Age of respondent at baseline n.s. n.s.Less than 30 155 87.3 11.3 *** (4.1) 124 50.9 35.3 *** (7.7)30-39 205 86.3 10.1 *** (3.8) 136 61.4 32.5 *** (6.7)40 and over 490 77.5 16.3 *** (3.1) 149 48.6 43.8 *** (6.5)
Family structureMarital status at baseline †† n.s.
Married or common-law 521 82.8 10.1 *** (2.8) 77 59.4 34.0 *** (8.7)Single, separated, or divorced 328 79.1 19.8 *** (3.2) 328 53.0 37.1 *** (4.6)
Children in the household at baseline n.s. n.s.1 or more children 381 84.9 10.2 *** (3.1) 261 56.2 34.9 *** (5.1)No Children 469 78.2 17.2 *** (3.0) 147 48.4 42.2 *** (6.6)
EducationHad high school diploma or equivalent n.s. n.s.
Yes 587 81.5 14.5 *** (2.5) 255 56.0 33.3 *** (5.3)No 256 80.7 12.8 *** (4.1) 152 49.2 43.9 *** (6.3)
Employment and incomeWork experience since the age of 16 n.s. n.s.
Employed 0-9 years (0-5 years for IA) 167 76.8 20.8 *** (4.9) 135 47.5 39.4 *** (7.3)Employed 10 or more years (6+ for IA) 655 82.4 12.3 *** (2.4) 261 58.7 34.3 *** (4.9)
Annual income at baseline † n.s.Less than $20,000 (<$10,000 for IA) 346 81.5 18.0 *** (2.9) 234 53.0 36.8 *** (5.4)$20,000 or more ($10,000+ for IA) 502 81.4 10.8 *** (3.0) 175 54.9 37.6 *** (6.0)
Barriers to employmentReported at least one health limitation †† n.s.that restricts activity
Yes 246 71.7 22.6 *** (4.4) 145 54.4 35.2 *** (6.8)No 604 84.8 10.9 *** (2.4) 264 53.4 38.3 *** (5.0)
Social networksNumber of contacts † n.s.
Less than 10 contacts at baseline 501 78.3 17.0 *** (2.9) 274 50.4 39.6 *** (5.0)10 or more contacts at baseline 347 85.3 9.9 *** (3.2) 134 61.9 31.1 *** (6.7)
Network density n.s. ††All contacts know each other 300 79.2 17.8 *** (3.5) 202 47.5 45.7 *** (5.6)Some contacts do not know each other 545 83.0 11.1 *** (2.7) 202 61.2 27.2 *** (5.8)
Previous EI/IA experienceFrequent user of EI/IA n.s. †
Yes (12+ months for EI, 417 81.7 12.5 *** (3.1) 193 48.0 44.3 *** (5.9)20+ months for IA)
No 433 81.1 15.0 *** (2.9) 216 59.8 30.1 *** (5.5)
EI Sample IA Sample
Note: See page 143 for source and notes.

- 145 -
Table D.2: Impacts on Household Income by Subgroup — Average Household Income at the 40-Month Survey ($)
Sample Control Difference Standard Sample Control Difference StandardSubgroup Size Group (Impact) Error Size Group (Impact) ErrorGender and ageGender of respondent n.s. n.s.
Male 374 38217.7 -712.6 (2309.1) 108 16070.6 5683.8 ** (2216.6)Female 295 35715.6 -939.3 (2348.2) 230 16272.8 2523.6 * (1426.7)
Age of respondent at baseline n.s. n.s.Less than 30 127 40609.5 -4390.8 (4400.6) 105 15253.2 6626.8 *** (1904.5)30-39 167 33259.7 1351.4 (2976.9) 112 17904.4 1715.2 (2366.8)40 and over 375 37339.8 -66.1 (2156.9) 121 15291.7 2800.1 (1929.0)
Family structureMarital status at baseline n.s. n.s.
Married or common-law 404 41216.0 831.4 (2111.1) 63 18837.0 4424.1 (3059.9)Single, separated, or divorced 265 30209.2 -2003.8 (2350.5) 271 15725.4 3143.3 ** (1313.2)
Children in the household at baseline n.s. †††1 or more children 300 38009.7 2630.7 (2517.3) 221 17386.4 942.3 (1446.6)No children 369 35985.0 -2461.1 (2165.2) 116 13450.2 8642.1 *** (2126.8)
Lone parent status n.s. ††Lone parent 86 28156.9 4328.9 (4416.9) 171 16742.6 506.8 (1634.8)No children or married 583 38730.4 -1887.5 (1769.3) 162 15507.8 6414.4 *** (1814.4)
EducationHad high school diploma or equivalent n.s. n.s.
Yes 457 39044.1 -354.6 (2091.5) 213 15915.5 3797.6 *** (1414.3)No 205 32096.6 -592.3 (2450.5) 123 16806.3 3284.6 (2238.1)
Employment and incomeWork experience since the age of 16 n.s. n.s.
Employed 0-9 years (0-5 years for IA) 136 36392.3 -4723.3 (3710.0) 113 13874.7 4801.5 *** (1660.5)Employed 10 or more years (6+ for IA) 509 37429.0 661.5 (1889.9) 216 17379.1 3155.5 * (1654.4)
Annual income at baseline n.s. n.s.Less than $20,000 (<$10,000 for IA) 281 27584.7 -129.3 (2262.2) 194 13871.3 5065.5 *** (1395.8)$20,000 or more ($10,000+ for IA) 386 43261.6 126.4 (2088.6) 144 19431.6 1521.2 (2045.8)
Barriers to employmentReported at least one health limitation n.s. n.s.that restricts activity
Yes 196 37475.9 -3816.6 (3035.8) 113 16225.7 2784.3 (1882.3)No 473 36813.5 871.9 (1963.2) 225 16206.5 4045.8 *** (1544.6)
Social networksNumber of contacts n.s. n.s.
Less than 10 contacts at baseline 405 35558.1 -16.9 (2190.1) 228 15628.2 4220.0 *** (1459.8)10 or more contacts at baseline 262 38776.6 -647.5 (2520.8) 110 17444.8 2275.2 (2125.3)
Network density n.s. n.s.All contacts know each other 237 37015.5 -833.3 (2894.2) 167 15252.6 5503.5 *** (1511.6)Some contacts do not know each other 427 37250.8 -589.0 (2030.6) 168 17186.6 1917.0 (1883.5)
Previous EI/IA experienceFrequent user of EI/IA n.s. ††
Yes (12+ months for EI, 328 37137.7 135.4 (2384.3) 162 16799.7 740.9 (1552.8)20+ months for IA)
No 341 36832.2 -1157.7 (2289.0) 176 15589.9 6018.7 *** (1800.2)
EI Sample IA Sample
Note: See page 143 for source and notes.
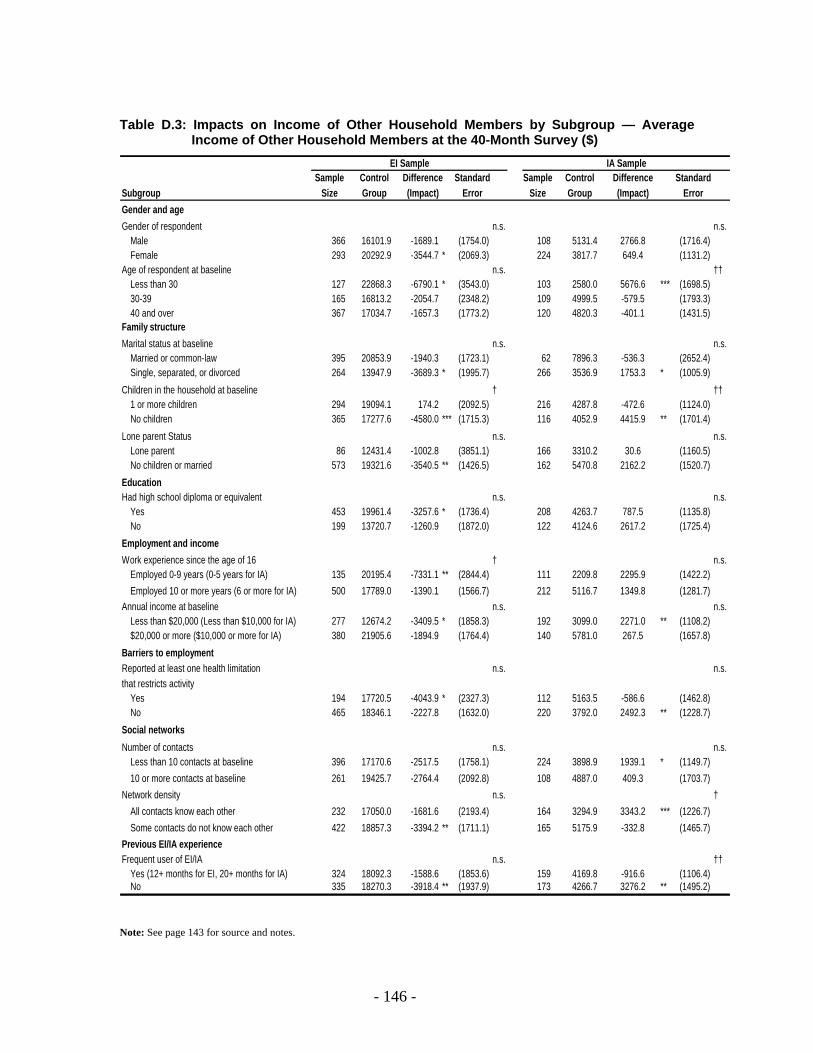
- 146 -
Table D.3: Impacts on Income of Other Household Members by Subgroup — Average Income of Other Household Members at the 40-Month Survey ($)
Sample Control Difference Standard Sample Control Difference StandardSubgroup Size Group (Impact) Error Size Group (Impact) ErrorGender and ageGender of respondent n.s. n.s.
Male 366 16101.9 -1689.1 (1754.0) 108 5131.4 2766.8 (1716.4)Female 293 20292.9 -3544.7 * (2069.3) 224 3817.7 649.4 (1131.2)
Age of respondent at baseline n.s. ††Less than 30 127 22868.3 -6790.1 * (3543.0) 103 2580.0 5676.6 *** (1698.5)30-39 165 16813.2 -2054.7 (2348.2) 109 4999.5 -579.5 (1793.3)40 and over 367 17034.7 -1657.3 (1773.2) 120 4820.3 -401.1 (1431.5)
Family structureMarital status at baseline n.s. n.s.
Married or common-law 395 20853.9 -1940.3 (1723.1) 62 7896.3 -536.3 (2652.4)Single, separated, or divorced 264 13947.9 -3689.3 * (1995.7) 266 3536.9 1753.3 * (1005.9)
Children in the household at baseline † ††1 or more children 294 19094.1 174.2 (2092.5) 216 4287.8 -472.6 (1124.0)No children 365 17277.6 -4580.0 *** (1715.3) 116 4052.9 4415.9 ** (1701.4)
Lone parent Status n.s. n.s.Lone parent 86 12431.4 -1002.8 (3851.1) 166 3310.2 30.6 (1160.5)No children or married 573 19321.6 -3540.5 ** (1426.5) 162 5470.8 2162.2 (1520.7)
EducationHad high school diploma or equivalent n.s. n.s.
Yes 453 19961.4 -3257.6 * (1736.4) 208 4263.7 787.5 (1135.8)No 199 13720.7 -1260.9 (1872.0) 122 4124.6 2617.2 (1725.4)
Employment and incomeWork experience since the age of 16 † n.s.
Employed 0-9 years (0-5 years for IA) 135 20195.4 -7331.1 ** (2844.4) 111 2209.8 2295.9 (1422.2)Employed 10 or more years (6 or more for IA) 500 17789.0 -1390.1 (1566.7) 212 5116.7 1349.8 (1281.7)
Annual income at baseline n.s. n.s.Less than $20,000 (Less than $10,000 for IA) 277 12674.2 -3409.5 * (1858.3) 192 3099.0 2271.0 ** (1108.2)$20,000 or more ($10,000 or more for IA) 380 21905.6 -1894.9 (1764.4) 140 5781.0 267.5 (1657.8)
Barriers to employmentReported at least one health limitation n.s. n.s.that restricts activity
Yes 194 17720.5 -4043.9 * (2327.3) 112 5163.5 -586.6 (1462.8)No 465 18346.1 -2227.8 (1632.0) 220 3792.0 2492.3 ** (1228.7)
Social networksNumber of contacts n.s. n.s.
Less than 10 contacts at baseline 396 17170.6 -2517.5 (1758.1) 224 3898.9 1939.1 * (1149.7)10 or more contacts at baseline 261 19425.7 -2764.4 (2092.8) 108 4887.0 409.3 (1703.7)
Network density n.s. †All contacts know each other 232 17050.0 -1681.6 (2193.4) 164 3294.9 3343.2 *** (1226.7)Some contacts do not know each other 422 18857.3 -3394.2 ** (1711.1) 165 5175.9 -332.8 (1465.7)
Previous EI/IA experienceFrequent user of EI/IA n.s. ††
Yes (12+ months for EI, 20+ months for IA) 324 18092.3 -1588.6 (1853.6) 159 4169.8 -916.6 (1106.4)No 335 18270.3 -3918.4 ** (1937.9) 173 4266.7 3276.2 ** (1495.2)
EI Sample IA Sample
Note: See page 143 for source and notes.

- 147 -
Table D.4: Impacts on Spousal Employment by Subgroup — Participants with a Working Spouse (%)
Sample Control Difference Standard Sample Control Difference StandardSubgroup Size Group (Impact) Error Size Group (Impact) ErrorGender and ageGender of respondent n.s. n.s.
Male 471 40.4 1.8 (4.6) 139 4.8 10.8 ** (5.3)Female 380 38.1 -3.9 (5.0) 272 6.5 7.1 * (3.6)
Age of respondent at baseline n.s. n.s.Less than 30 155 30.4 -2.8 (7.3) 124 3.4 16.6 *** (5.7)30-39 205 39.0 7.4 (7.0) 136 4.3 6.3 (4.5)40 and over 491 42.4 -3.2 (4.4) 151 9.7 2.9 (5.2)
Family structureMarital status at baseline n.s. n.s.
Married or common-law 522 55.5 2.1 (4.4) 77 21.9 20.4 * (10.8)Single, separated, or divorced 328 12.4 -1.6 (3.6) 330 3.0 3.8 (2.4)
Children in the household at baseline †† n.s.1 or more children 381 44.4 8.6 * (5.1) 262 8.7 6.6 * (4.0)No children 470 34.4 -5.4 (4.3) 148 0.0 11.8 *** (4.1)
Lone parent status n.s. ††Lone parent 104 14.8 -3.1 (6.9) 203 4.4 3.4 (3.3)No children or married 746 43.7 -1.7 (3.6) 203 8.1 10.9 ** (4.9)
EducationHad high school diploma or equivalent n.s. n.s.
Yes 588 41.3 -2.7 (4.1) 256 5.2 6.4 * (3.4)No 256 35.3 4.9 (6.1) 153 7.6 10.8 * (5.6)
Employment and incomeWork experience since the age of 16 n.s. n.s.
Employed 0-9 years (0-5 years for IA) 167 30.5 -3.4 (7.0) 135 3.4 9.8 ** (4.9)Employed 10 or more years (6 or more for IA) 656 40.8 2.0 (3.9) 263 7.4 8.2 ** (3.9)
Annual income at baseline n.s. †Less than $20,000 (Less than $10,000 for IA) 346 21.6 1.8 (4.5) 236 3.4 12.9 *** (3.8)$20,000 or more ($10,000 or more for IA) 503 50.8 -1.0 (4.5) 175 9.8 2.1 (4.7)
Barriers to employmentReported at least one health limitation n.s. n.s. that restricts activity
Yes 247 40.2 -3.0 (6.3) 145 10.3 4.0 (5.5)No 604 38.9 0.9 (4.0) 266 3.8 10.5 *** (3.5)
Social networksNumber of contacts n.s. n.s.
Less than 10 contacts at baseline 501 39.4 -1.6 (4.4) 275 5.9 9.2 ** (3.7)10 or more contacts at baseline 348 39.1 1.7 (5.3) 135 6.3 6.4 (5.1)
Network density n.s. n.s.All contacts know each other 300 36.9 4.3 (5.7) 203 5.0 11.5 *** (4.3)Some contacts do not know each other 546 40.4 -2.5 (4.2) 203 7.1 5.4 (4.2)
Previous EI/IA experienceFrequent user of EI/IA n.s. n.s.
Yes (12+ months for EI, 20+ months for IA) 418 44.5 -3.4 (4.9) 194 3.9 9.3 ** (3.9)No 433 33.8 3.2 (4.6) 217 8.2 7.0 (4.4)
EI Sample IA Sample
Note: See page 143 for source and notes.

- 148 -
Table D.5: Impacts on Incidence of Low Income by Subgroup —Participants with Household Income Less than LICO (%)
Sample Control Difference Standard Sample Control Difference StandardSubgroup Size Group (Impact) Error Size Group (Impact) ErrorGender and ageGender of respondent n.s. n.s.
Male 359 23.8 1.2 (4.6) 104 76.0 -16.7 * (9.2)Female 286 31.1 -4.3 (5.4) 222 86.0 -5.4 (5.0)
Age of respondent at baseline n.s. †Less than 30 119 36.7 -9.6 (8.6) 102 85.7 -21.6 ** (8.5)30-39 160 35.6 -10.3 (7.3) 106 78.6 3.4 (7.8)40 and over 366 20.5 5.0 (4.4) 118 84.8 -10.2 (7.4)
Family structureMarital status at baseline n.s. n.s.
Married or common-law 393 18.9 0.3 (4.0) 63 85.2 -18.5 * (11.0)Single, separated, or divorced 252 41.2 -5.7 (6.2) 259 82.4 -7.6 (5.1)
Children in the household at baseline †† ††1 or more children 290 33.3 -9.1 * (5.3) 213 84.2 -1.4 (5.1)No children 355 21.5 5.2 (4.6) 112 80.0 -21.9 ** (8.7)
Lone parent status † †Lone parent 82 54.0 -19.6 * (11.2) 163 84.8 -0.3 (5.7)No children or married 563 22.1 2.8 (3.6) 158 80.3 -17.1 ** (7.2)
EducationHad high school diploma or equivalent n.s. n.s.
Yes 445 25.5 -4.4 (4.0) 203 82.4 -9.8 * (5.8)No 193 32.1 2.7 (6.9) 121 83.9 -10.1 (7.5)
Employment and incomeWork experience since the age of 16 n.s. n.s.
Employed 0-9 years (0-5 years for IA) 128 41.3 -10.5 (8.5) 110 95.8 -18.4 *** (6.6)Employed 10 or more years (6 or more for IA) 494 23.7 0.4 (3.9) 207 77.3 -7.2 (6.1)
Annual income at baseline n.s. n.s.Less than $20,000 (Less than $10,000 for IA) 268 47.1 -2.1 (6.2) 186 84.2 -8.4 (5.9)$20,000 or more ($10,000 or more for IA) 375 14.4 -3.2 (3.5) 140 81.2 -10.7 (7.2)
Barriers to employmentReported at least one health limitation †† n.s. that restricts activity
Yes 191 23.5 9.3 (6.6) 108 80.4 -5.0 (8.1)No 454 28.9 -6.4 (4.1) 218 84.1 -11.7 ** (5.5)
Social networksNumber of contacts n.s. n.s.
Less than 10 contacts at baseline 392 33.9 -4.9 (4.7) 221 84.8 -12.3 ** (5.5)10 or more contacts at baseline 251 19.1 0.1 (5.0) 105 78.9 -3.4 (8.3)
Network density n.s. n.s.All contacts know each other 231 30.9 -5.3 (6.0) 162 86.9 -15.1 ** (6.3)Some contacts do not know each other 411 25.1 0.8 (4.3) 161 78.5 -4.1 (6.7)
Previous EI/IA experienceFrequent user of EI/IA n.s. †††
Yes (12+ months for EI, 20+ months for IA) 321 24.4 1.7 (4.9) 156 78.8 5.7 (6.3)No 324 30.8 -5.4 (5.0) 170 87.3 -22.5 *** (6.4)
EI Sample IA Sample
Note: See page 143 for source and notes.
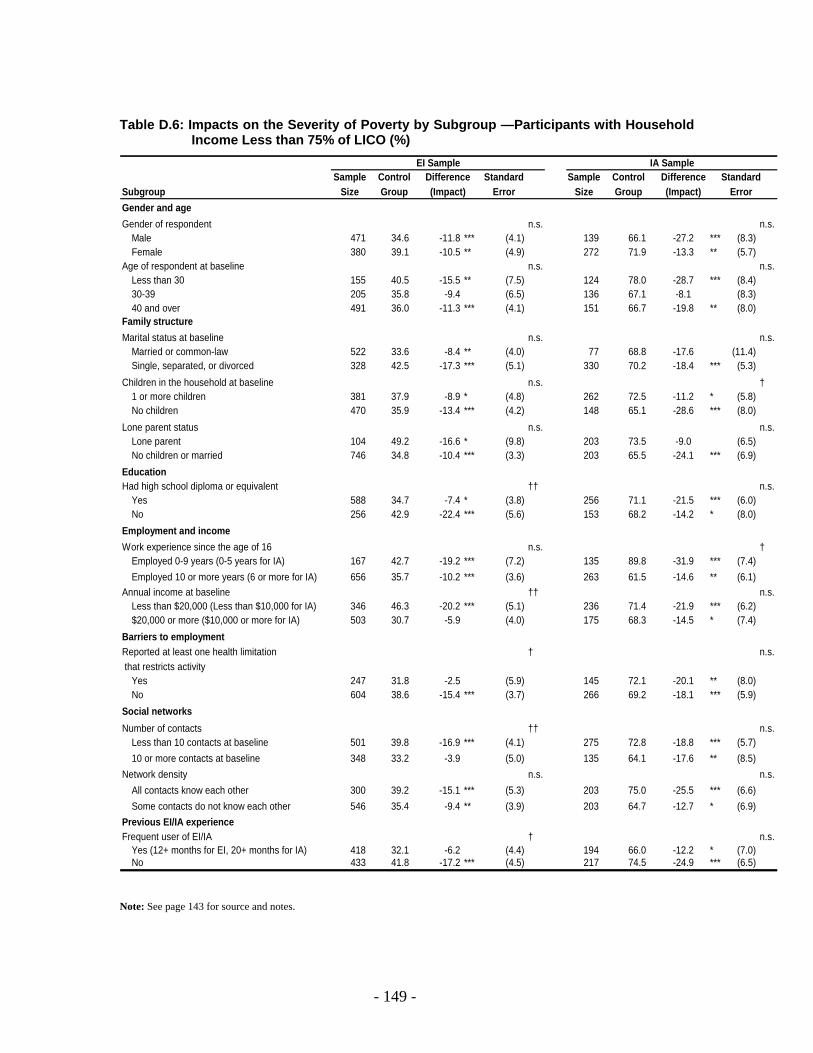
- 149 -
Table D.6: Impacts on the Severity of Poverty by Subgroup —Participants with Household Income Less than 75% of LICO (%)
Sample Control Difference Standard Sample Control Difference StandardSubgroup Size Group (Impact) Error Size Group (Impact) ErrorGender and ageGender of respondent n.s. n.s.
Male 471 34.6 -11.8 *** (4.1) 139 66.1 -27.2 *** (8.3)Female 380 39.1 -10.5 ** (4.9) 272 71.9 -13.3 ** (5.7)
Age of respondent at baseline n.s. n.s.Less than 30 155 40.5 -15.5 ** (7.5) 124 78.0 -28.7 *** (8.4)30-39 205 35.8 -9.4 (6.5) 136 67.1 -8.1 (8.3)40 and over 491 36.0 -11.3 *** (4.1) 151 66.7 -19.8 ** (8.0)
Family structureMarital status at baseline n.s. n.s.
Married or common-law 522 33.6 -8.4 ** (4.0) 77 68.8 -17.6 (11.4)Single, separated, or divorced 328 42.5 -17.3 *** (5.1) 330 70.2 -18.4 *** (5.3)
Children in the household at baseline n.s. †1 or more children 381 37.9 -8.9 * (4.8) 262 72.5 -11.2 * (5.8)No children 470 35.9 -13.4 *** (4.2) 148 65.1 -28.6 *** (8.0)
Lone parent status n.s. n.s.Lone parent 104 49.2 -16.6 * (9.8) 203 73.5 -9.0 (6.5)No children or married 746 34.8 -10.4 *** (3.3) 203 65.5 -24.1 *** (6.9)
EducationHad high school diploma or equivalent †† n.s.
Yes 588 34.7 -7.4 * (3.8) 256 71.1 -21.5 *** (6.0)No 256 42.9 -22.4 *** (5.6) 153 68.2 -14.2 * (8.0)
Employment and incomeWork experience since the age of 16 n.s. †
Employed 0-9 years (0-5 years for IA) 167 42.7 -19.2 *** (7.2) 135 89.8 -31.9 *** (7.4)Employed 10 or more years (6 or more for IA) 656 35.7 -10.2 *** (3.6) 263 61.5 -14.6 ** (6.1)
Annual income at baseline †† n.s.Less than $20,000 (Less than $10,000 for IA) 346 46.3 -20.2 *** (5.1) 236 71.4 -21.9 *** (6.2)$20,000 or more ($10,000 or more for IA) 503 30.7 -5.9 (4.0) 175 68.3 -14.5 * (7.4)
Barriers to employmentReported at least one health limitation † n.s. that restricts activity
Yes 247 31.8 -2.5 (5.9) 145 72.1 -20.1 ** (8.0)No 604 38.6 -15.4 *** (3.7) 266 69.2 -18.1 *** (5.9)
Social networksNumber of contacts †† n.s.
Less than 10 contacts at baseline 501 39.8 -16.9 *** (4.1) 275 72.8 -18.8 *** (5.7)10 or more contacts at baseline 348 33.2 -3.9 (5.0) 135 64.1 -17.6 ** (8.5)
Network density n.s. n.s.All contacts know each other 300 39.2 -15.1 *** (5.3) 203 75.0 -25.5 *** (6.6)Some contacts do not know each other 546 35.4 -9.4 ** (3.9) 203 64.7 -12.7 * (6.9)
Previous EI/IA experienceFrequent user of EI/IA † n.s.
Yes (12+ months for EI, 20+ months for IA) 418 32.1 -6.2 (4.4) 194 66.0 -12.2 * (7.0)No 433 41.8 -17.2 *** (4.5) 217 74.5 -24.9 *** (6.5)
EI Sample IA Sample
Note: See page 143 for source and notes.

- 150 -
Table D.7: Impacts on Total EI Payments by Subgroup — Total EI Payments from Months 1 to 38 ($)
Sample Control Difference Standard Sample Control Difference StandardSubgroup Size Group (Impact) Error Size Group (Impact) ErrorGender and ageGender of respondent ††† n.s.
Male 471 13375.9 -8318.81 *** (835.0) 139 2465.8 -2048.32 *** (628.7)Female 380 7712.4 -4541.58 *** (606.1) 272 2822.3 -2175.68 *** (479.7)
Age of respondent at baseline ††† n.s.Less than 30 155 7441.4 -3726.84 *** (1100.2) 124 1992.6 -1311.71 ** (613.1)30-39 205 8495.9 -3218.73 *** (1139.7) 136 3176.9 -2416.38 *** (712.2)40 and over 491 12479.2 -8433.69 *** (730.5) 151 2850.4 -2550.51 *** (641.2)
Family structureMarital status at baseline n.s. n.s.
Married or common-law 522 10713.8 -5813.33 *** (726.9) 77 2324.4 -1840.34 ** (829.3)Single, separated, or divorced 328 10360.4 -6983.91 *** (838.0) 330 2802.4 -2212.24 *** (434.7)
Children in the household at baseline † n.s.1 or more children 381 9657.4 -5256.09 *** (802.0) 262 3167.8 -2418.28 *** (524.4)No children 470 11452.5 -7231.63 *** (757.8) 148 1714.6 -1418.09 *** (499.7)
Lone parent status n.s. †Lone parent 104 9160.2 -6179.4 *** (1339.9) 203 3458.6 -2671.2 *** (644.1)No children or married 746 10830.8 -6393.0 *** (601.3) 203 1774.2 -1373.2 *** (419.4)
EducationHad high school diploma or equivalent †† n.s.
Yes 588 9609.6 -5342.60 *** (632.2) 256 3037.3 -2379.49 *** (535.3)No 256 12845.5 -8527.97 *** (1086.8) 153 2047.7 -1613.28 *** (497.0)
Employment and incomeWork experience since the age of 16 †† n.s.
Employed 0-9 years (0-5 years for IA) 167 7288.7 -4270.46 *** (925.1) 135 1875.0 -1362.13 ** (538.8)Employed 10 or more years (6 or more for IA) 656 11407.6 -6832.87 *** (653.6) 263 3015.2 -2521.45 *** (494.4)
Annual income at baseline n.s. n.s.Less than $20,000 (Less than $10,000 for IA) 346 9140.6 -6142.79 *** (708.8) 236 2289.1 -1816.43 *** (456.8)$20,000 or more ($10,000 or more for IA) 503 11529.5 -6313.84 *** (784.6) 175 3326.6 -2650.80 *** (647.0)
Barriers to employmentReported at least one health limitation n.s. n.s. that restricts activity
Yes 247 10942.4 -6804.18 *** (1089.7) 145 2932.0 -2868.73 *** (607.7)No 604 10459.5 -6090.59 *** (639.0) 266 2600.0 -1748.33 *** (486.1)
Social networksNumber of contacts n.s. n.s.
Less than 10 contacts at baseline 501 11123.1 -6858.33 *** (719.3) 275 2609.1 -2114.69 *** (457.6)10 or more contacts at baseline 348 9925.4 -5531.70 *** (867.7) 135 2974.1 -2277.98 *** (692.2)
Network density n.s. n.s.All contacts know each other 300 11661.4 -7463.70 *** (919.3) 203 2491.6 -1739.18 *** (525.6)Some contacts do not know each other 546 10083.3 -5715.31 *** (693.9) 203 2990.1 -2669.35 *** (560.3)
Previous EI/IA experienceFrequent user of EI/IA † n.s.
Yes (12+ months for EI, 20+ months for IA) 418 11893.7 -7180.44 *** (844.5) 194 2074.3 -1788.42 *** (509.1)No 433 9225.4 -5305.81 *** (703.7) 217 3383.0 -2608.72 *** (557.2)
EI Sample IA Sample
Note: See page 143 for source and notes.

- 151 -
Table D.8: Impacts on Total IA Payments by Subgroup — Total IA Payments from Months 1 to 38 ($)
Sample Control Difference Standard Sample Control Difference StandardSubgroup Size Group (Impact) Error Size Group (Impact) ErrorGender and ageGender of respondent n.s. n.s.
Male 471 797.2 -638.08 *** (193.6) 139 12213.0 -9087.32 *** (1184.6)Female 380 1066.3 -860.75 *** (284.1) 272 13731.6 -8338.46 *** (987.0)
Age of respondent at baseline †† n.s.Less than 30 155 1509.4 -1309.65 *** (469.3) 124 15360.8 -10490.84 *** (1262.4)30-39 205 1946.5 -1444.52 *** (505.7) 136 13197.1 -7993.51 *** (1413.3)40 and over 491 326.5 -294.96 *** (112.4) 151 11608.5 -7836.61 *** (1279.2)
Family structureMarital status at baseline ††† n.s.
Married or common-law 522 292.2 -132.50 (143.7) 77 15867.4 -10654.70 *** (2121.3)Single, separated, or divorced 328 2002.7 -1797.20 *** (349.7) 330 12691.4 -8314.16 *** (816.3)
Children in the household at baseline n.s. n.s.1 or more children 381 1256.4 -1026.02 *** (289.5) 262 14249.1 -8581.05 *** (1030.3)No children 470 624.7 -484.11 *** (185.5) 148 11103.5 -8138.04 *** (1066.1)
Lone parent status †† n.s.Lone parent 104 3040.5 -2471.1 *** (859.8) 203 13364.1 -7432.5 *** (1133.9)No children or married 746 562.5 -426.9 *** (140.0) 203 12985.9 -9479.1 *** (1067.1)
EducationHad high school diploma or equivalent n.s. †
Yes 588 739.9 -638.90 *** (173.3) 256 12368.7 -7622.18 *** (971.5)No 256 1412.7 -1061.38 *** (377.4) 153 15092.7 -10752.94 *** (1273.4)
Employment and incomeWork experience since the age of 16 n.s. †††
Employed 0-9 years (0-5 years for IA) 167 1247.5 -1090.05 *** (393.9) 135 18548.4 -12431.45 *** (1367.3)Employed 10 or more years (6 or more for IA) 656 851.7 -670.89 *** (188.6) 263 10960.8 -7239.60 *** (879.0)
Annual income at baseline ††† n.s.Less than $20,000 (Less than $10,000 for IA) 346 1776.0 -1587.56 *** (319.6) 236 13199.2 -8659.51 *** (998.8)$20,000 or more ($10,000 or more for IA) 503 377.0 -205.38 (165.1) 175 13356.0 -8766.55 *** (1210.9)
Barriers to employmentReported at least one health limitation n.s. n.s. that restricts activity
Yes 247 700.8 -561.81 ** (268.4) 145 12513.4 -9157.14 *** (1135.1)No 604 1010.7 -814.70 *** (206.0) 266 13646.5 -8386.88 *** (1010.9)
Social networksNumber of contacts †† n.s.
Less than 10 contacts at baseline 501 1267.6 -1052.22 *** (250.3) 275 13354.9 -8381.65 *** (962.4)10 or more contacts at baseline 348 514.9 -397.72 ** (182.4) 135 13035.8 -9279.80 *** (1282.9)
Network density n.s. n.s.All contacts know each other 300 1296.2 -1027.46 *** (313.8) 203 14350.5 -9690.19 *** (1108.5)Some contacts do not know each other 546 717.2 -595.41 *** (186.0) 203 11986.4 -7521.49 *** (1074.1)
Previous EI/IA experienceFrequent user of EI/IA † †
Yes (12+ months for EI, 20+ months for IA) 418 567.2 -443.70 ** (175.3) 194 14745.9 -10025.73 *** (1144.0)No 433 1306.8 -1079.96 *** (276.3) 217 11704.8 -7264.23 *** (1028.4)
EI Sample IA Sample
Note: See page 143 for source and notes.

- 152 -
Table D.9: Impacts on Total Contacts who Can Help Find a Job by Subgroup — Average Number of Contacts
Sample Control Difference Standard Sample Control Difference StandardSubgroup Size Group (Impact) Error Size Group (Impact) ErrorGender and ageGender of respondent †† n.s.
Male 429 7.0 0.0 (0.8) 123 7.8 -0.1 (2.2)Female 340 5.9 2.6 *** (0.9) 260 5.5 0.8 (0.8)
Age of respondent at baseline n.s. n.s.Less than 30 141 8.1 2.5 (2.1) 116 5.5 0.7 (2.0)30-39 188 6.4 2.5 * (1.4) 130 6.7 0.1 (1.4)40 and over 440 5.9 0.3 (0.6) 137 6.1 1.1 (1.4)
Family structureMarital status at baseline n.s. n.s.
Married or common-law 469 6.4 0.7 (0.8) 71 8.7 -2.7 (2.7)Single, separated, or divorced 300 6.5 1.9 * (1.0) 308 5.7 1.1 (0.9)
Children in the household at baseline †† n.s.1 or more children 350 6.3 2.8 *** (1.1) 250 6.3 -0.1 (1.1)No children 419 6.5 0.0 (0.7) 132 5.9 1.8 (1.6)
Lone parent status ††† n.s.Lone parent 98 5.4 5.9 *** (1.9) 194 5.7 0.3 (1.1)No children or married 671 6.6 0.6 (0.7) 184 6.9 0.3 (1.5)
EducationHad high school diploma or equivalent † n.s.
Yes 540 6.4 1.8 ** (0.8) 236 6.1 1.2 (1.0)No 224 6.6 -0.4 (1.0) 145 6.2 -0.1 (1.7)
Employment and incomeWork experience since the age of 16 n.s. n.s.
Employed 0-9 years (0-5 years for IA) 154 7.1 3.3 * (1.9) 124 6.7 0.8 (2.1)Employed 10 or more years (6 or more for IA) 591 6.3 0.6 (0.6) 247 5.8 0.5 (0.8)
Annual income at baseline †† n.s.Less than $20,000 (Less than $10,000 for IA) 316 5.3 2.9 *** (0.9) 218 6.3 0.1 (1.3)$20,000 or more ($10,000 or more for IA) 451 7.2 -0.1 (0.9) 165 5.9 1.3 (1.2)
Barriers to employmentReported at least one health limitation n.s. n.s. that restricts activity
Yes 219 6.3 0.4 (0.9) 130 5.4 2.1 (1.3)No 550 6.5 1.6 ** (0.8) 253 6.5 -0.1 (1.2)
Social networksNumber of contacts n.s. n.s.
Less than 10 contacts at baseline 450 5.3 0.7 (0.7) 254 5.5 -0.3 (1.1)10 or more contacts at baseline 317 7.9 2.3 ** (1.1) 129 7.4 2.3 (1.6)
Network density †† ††All contacts know each other 279 6.9 -0.6 (1.1) 189 7.0 -1.5 (1.4)Some contacts do not know each other 486 6.3 2.3 *** (0.8) 191 5.3 2.7 ** (1.1)
Previous EI/IA experienceFrequent user of EI/IA n.s. n.s.
Yes (12+ months for EI, 20+ months for IA) 370 6.2 0.6 (0.7) 185 5.6 2.1 (1.4)No 399 6.7 1.6 (1.0) 198 6.7 -0.7 (1.1)
EI Sample IA Sample
Note: See page 143 for source and notes.

- 153 -
Table D.10: Impacts on Working Skills by Subgroup — Problem-Solving Skills
Percentage that do not make a detailed plan before tackling a complex problem (%)
Sample Control Difference Standard Sample Control Difference StandardSubgroup Size Group (Impact) Error Size Group (Impact) ErrorGender and ageGender of respondent n.s. ††
Male 453 14.6 0.4 (3.4) 133 25.9 -4.5 (7.4)Female 368 22.2 3.7 (4.5) 267 14.1 14.7 *** (5.0)
Age of respondent at baseline n.s. n.s.Less than 30 150 18.4 -2.2 (6.2) 121 19.3 10.4 (7.9)30-39 195 25.3 -0.3 (6.3) 135 15.9 9.8 (7.0)40 and over 476 15.5 2.5 (3.4) 144 17.9 5.5 (6.8)
Family structureMarital status at baseline n.s. n.s.
Married or common-law 504 18.6 1.0 (3.5) 74 20.0 0.5 (9.7)Single, separated, or divorced 317 17.9 1.3 (4.4) 322 17.3 10.8 ** (4.6)
Children in the household at baseline † n.s.1 or more children 369 21.2 -4.2 (4.1) 255 15.9 7.7 (5.0)No children 452 15.5 5.5 (3.7) 144 21.3 7.6 (7.4)
Lone parent status †† n.s.Lone parent 102 18.3 -13.6 ** (6.6) 197 14.8 13.3 ** (5.8)No children or married 719 18.3 2.7 (3.0) 198 21.4 3.1 (6.1)
EducationHad high school diploma or equivalent n.s. n.s.
Yes 569 18.5 1.0 (3.3) 247 14.8 8.7 * (5.0)No 245 18.4 1.4 (5.1) 151 23.1 7.2 (7.3)
Employment and incomeWork experience since the age of 16 † n.s.
Employed 0-9 years (0-5 years for IA) 164 23.8 -8.3 (6.2) 131 17.5 6.8 (7.3)Employed 10 or more years (6 or more for IA) 629 16.8 4.2 (3.1) 256 17.1 8.9 * (5.1)
Annual income at baseline n.s. n.s.Less than $20,000 (Less than $10,000 for IA) 336 22.4 -3.6 (4.4) 228 21.2 4.0 (5.6)$20,000 or more ($10,000 or more for IA) 483 15.6 3.9 (3.5) 172 12.5 14.7 ** (6.1)
Barriers to employmentReported at least one health limitation n.s. n.s. that restricts activity
Yes 237 19.4 4.5 (5.4) 137 22.2 3.5 (7.4)No 584 17.9 -0.6 (3.2) 263 15.4 10.9 ** (5.0)
Social networksNumber of contacts n.s. n.s.
Less than 10 contacts at baseline 483 17.6 2.6 (3.6) 266 18.6 8.4 (5.2)10 or more contacts at baseline 336 19.2 -1.0 (4.3) 134 15.6 8.7 (7.0)
Network density n.s. †††All contacts know each other 292 19.5 -4.1 (4.5) 199 18.6 -2.9 (5.4)Some contacts do not know each other 524 17.6 4.6 (3.5) 198 16.8 20.1 *** (6.2)
Previous EI/IA experienceFrequent user of EI/IA n.s. n.s.
Yes (12+ months for EI, 20+ months for IA) 397 18.1 4.6 (4.1) 189 13.3 13.1 ** (5.7)No 424 18.6 -2.0 (3.7) 211 22.1 3.8 (6.0)
EI Sample IA Sample
Note: See page 143 for source and notes.

- 154 -
Table D.11: Impacts on Working Skills by Subgroup — Systems Thinking
Percentage that always know how to get things done in a system (%)
Sample Control Difference Standard Sample Control Difference StandardSubgroup Size Group (Impact) Error Size Group (Impact) ErrorGender and ageGender of respondent n.s. n.s.
Male 450 76.4 7.3 * (3.8) 132 77.2 0.1 (7.4)Female 367 85.5 4.7 (3.4) 268 85.4 -6.8 (4.7)
Age of respondent at baseline n.s. n.s.Less than 30 151 83.1 4.7 (5.8) 122 86.2 -3.4 (6.6)30-39 195 80.2 5.4 (5.4) 134 78.3 0.2 (7.2)40 and over 471 80.4 5.9 * (3.4) 144 85.1 -11.1 (6.8)
Family structureMarital status at baseline n.s. n.s.
Married or common-law 499 84.6 3.2 (3.1) 74 83.3 -1.5 (9.1)Single, separated, or divorced 318 74.7 9.6 ** (4.5) 322 82.8 -6.1 (4.5)
Children in the household at baseline n.s. n.s.1 or more children 369 83.0 5.6 (3.7) 256 85.1 -3.1 (4.7)No Children 448 78.8 6.0 * (3.6) 143 78.3 -6.0 (7.4)
Lone parent status n.s. n.s.Lone parent 103 82.0 13.3 ** (6.6) 198 84.6 -3.9 (5.4)No children or married 714 80.7 4.7 * (2.8) 197 80.7 -5.3 (6.0)
EducationHad high school diploma or equivalent ††† n.s.
Yes 567 84.7 0.0 (3.0) 248 85.3 -4.6 (4.8)No 243 73.0 16.8 *** (4.9) 150 78.5 -4.3 (7.1)
Employment and incomeWork experience since the age of 16 †† n.s.
Employed 0-9 years (0-5 years for IA) 164 73.8 16.7 *** (5.9) 132 81.4 -0.5 (6.9)Employed 10 or more years (6 or more for IA) 627 82.2 2.6 (3.0) 256 83.0 -5.8 (5.0)
Annual income at baseline n.s. n.s.Less than $20,000 (Less than $10,000 for IA) 336 77.1 8.4 ** (4.2) 228 81.6 -1.8 (5.3)$20,000 or more ($10,000 or more for IA) 479 83.4 3.5 (3.3) 172 85.0 -8.9 (6.1)
Barriers to employmentReported at least one health limitation n.s. n.s. that restricts activity
Yes 236 73.8 6.7 (5.5) 139 87.7 -12.0 * (6.6)No 581 83.4 5.7 ** (2.9) 261 80.6 -1.1 (5.0)
Social networksNumber of contacts n.s. n.s.
Less than 10 contacts at baseline 481 78.6 5.6 (3.5) 266 82.3 -5.8 (5.0)10 or more contacts at baseline 334 83.6 6.2 * (3.7) 134 84.4 -3.0 (6.6)
Network density n.s. ††All contacts know each other 290 78.9 9.2 ** (4.3) 199 78.4 5.0 (5.6)Some contacts do not know each other 522 82.0 3.2 (3.3) 198 87.5 -14.0 ** (5.6)
Previous EI/IA experienceFrequent user of EI/IA †† n.s.
Yes (12+ months for EI, 20+ months for IA) 392 81.7 -0.7 (3.9) 190 81.8 -1.6 (5.7)No 425 80.0 10.9 *** (3.4) 210 84.2 -7.7 (5.6)
EI Sample IA Sample
Note: See page 143 for source and notes.

- 155 -
Table D.12: Impacts on Mobility by Subgroup — Participants who Moved Outside Cape Breton (%)
Sample Control Difference Standard Sample Control Difference StandardSubgroup Size Group (Impact) Error Size Group (Impact) ErrorGender and ageGender of respondent n.s.
Male 461 1.5 0.1 (1.2) 133 0.0 0.0 .Female 373 2.5 2.1 (1.9) 261 1.5 3.1 (2.1)
Age of respondent at baseline n.s. †Less than 30 147 2.7 5.5 (3.7) 112 0.0 5.1 * (3.0)30-39 200 2.2 0.6 (2.2) 132 1.5 3.1 (3.0)40 and over 487 1.7 -0.5 (1.1) 150 1.4 -1.4 (1.3)
Family structureMarital status at baseline †
Married or commonlaw 516 2.8 -0.9 (1.3) 74 0.0 0.0 .Single, separated, or divorced 318 0.7 3.4 * (1.8) 316 1.2 2.6 (1.8)
Children in the household at baseline n.s. n.s.1 or more children 378 2.6 0.2 (1.7) 251 1.5 2.6 (2.1)No children 456 1.5 1.3 (1.4) 142 0.0 1.2 (1.4)
Lone parent status n.s. n.s.Lone parent 103 0.0 2.3 (2.0) 194 1.9 4.0 (2.7)No children or married 731 2.4 0.5 (1.2) 195 0.0 0.9 (1.0)
EducationHad high school diploma or equivalent n.s. n.s.
Yes 578 2.5 0.9 (1.4) 249 1.5 2.8 (2.1)No 249 0.9 0.6 (1.4) 143 0.0 1.2 (1.4)
Employment and incomeWork experience since the age of 16 n.s. n.s.
Employed 0-9 years (0-5 years for IA) 160 1.3 4.8 (3.0) 130 0.0 5.5 * (3.0)Employed 10 or more years (6 or more for IA) 646 2.2 -0.1 (1.2) 252 1.6 0.1 (1.6)
Annual income at baseline †† n.s.Less than $20,000 (Less than $10,000 for IA) 339 0.0 3.3 ** (1.4) 223 0.9 1.8 (1.8)$20,000 or more ($10,000 or more for IA) 493 3.3 -0.9 (1.5) 171 1.3 2.1 (2.3)
Barriers to employmentReported at least one health limitation n.s. that restricts activity
Yes 242 1.0 2.7 (2.0) 139 3.1 -0.4 (2.9)No 592 2.4 0.0 (0.0) 255 0.0 3.1 ** (1.6)
Social networksNumber of contacts n.s.
Less than 10 contacts at baseline 491 2.3 0.7 (1.5) 263 1.5 3.0 (2.1)10 or more contacts at baseline 341 1.7 0.8 (1.5) 130 0.0 0.0 .
Network density n.s. n.s.All contacts know each other 295 0.8 2.2 (1.7) 195 1.0 3.1 (2.3)Some contacts do not know each other 535 2.6 0.1 (1.4) 194 1.1 0.9 (1.8)
Previous EI/IA experienceFrequent user of EI/IA n.s. n.s.
Yes (12+ months for EI, 20+ months for IA) 408 1.0 -0.5 (0.9) 187 1.0 0.1 (1.5)No 426 3.0 1.8 (1.9) 207 1.1 3.4 (2.3)
EI Sample IA Sample
Note: See page 143 for source and notes.

- 156 -
Table D.13: Impacts on Volunteering by Subgroup — Participants Not Having Formally Volunteered in 22 Months (%)
Sample Control Difference Standard Sample Control Difference StandardSubgroup Size Group (Impact) Error Size Group (Impact) ErrorGender and ageGender of respondent n.s. n.s.
Male 470 72.6 -11.5 *** (4.4) 137 85.3 -23.4 *** (7.5)Female 378 54.0 -12.5 ** (5.1) 270 68.1 -21.9 *** (5.9)
Age of respondent at baseline n.s. n.s.Less than 30 153 63.3 -13.3 * (8.0) 124 72.9 -8.3 (8.4)30-39 205 65.3 -7.1 (6.8) 134 71.0 -31.0 *** (8.2)40 and over 490 62.7 -10.7 ** (4.5) 149 76.1 -24.8 *** (7.7)
Family structureMarital status at baseline n.s. †
Married or common-law 522 60.6 -9.0 ** (4.3) 76 64.5 -2.3 (11.4)Single, separated, or divorced 325 68.0 -12.2 ** (5.4) 327 74.9 -26.1 *** (5.2)
Children in the household at baseline n.s. †1 or more children 380 60.6 -12.3 ** (5.1) 260 66.4 -16.8 *** (6.1)No children 468 66.0 -9.4 ** (4.5) 146 88.7 -34.0 *** (7.3)
Lone parent status n.s. n.s.Yes 103 60.7 -22.6 ** (9.9) 201 67.9 -21.8 *** (6.9)No 744 63.8 -9.0 ** (3.6) 201 80.2 -24.6 *** (6.6)
EducationHad high school diploma or equivalent n.s. n.s.
Yes 586 59.4 -8.0 * (4.1) 253 71.4 -23.9 *** (6.0)No 255 73.1 -15.0 ** (5.9) 152 77.3 -20.3 *** (7.6)
Employment and incomeWork experience since the age of 16 n.s. n.s.
Employed 0-9 years (0-5 years for IA) 166 73.2 -17.2 ** (7.4) 134 69.5 -14.8 * (8.5)Employed 10 or more years (6 or more for IA) 654 61.1 -9.2 ** (3.9) 261 74.4 -23.7 *** (5.8)
Annual income at baseline n.s. n.s.Less than $20,000 (Less than $10,000 for IA) 345 65.4 -7.5 (5.3) 233 73.7 -20.7 *** (6.2)$20,000 or more ($10,000 or more for IA) 501 62.1 -12.3 *** (4.4) 174 72.8 -22.3 *** (7.3)
Barriers to employmentReported at least one health limitation n.s. n.s. that restricts activity
Yes 247 65.4 -16.9 *** (6.3) 144 77.6 -27.0 *** (7.8)No 601 62.7 -7.3 * (4.0) 263 71.2 -18.5 *** (5.9)
Social networksNumber of contacts n.s. n.s.
Less than 10 contacts at baseline 499 67.7 -7.3 * (4.3) 272 74.6 -17.4 *** (5.7)10 or more contacts at baseline 347 58.2 -17.1 *** (5.3) 134 70.3 -28.9 *** (8.3)
Network density n.s. n.s.All contacts know each other 300 71.5 -8.0 (5.5) 201 73.7 -16.9 ** (6.7)Some contacts do not know each other 543 59.6 -13.3 *** (4.3) 201 72.5 -25.9 *** (6.7)
Previous EI/IA experienceFrequent user of EI/IA n.s. n.s.
Yes (12+ months for EI, 20+ months for IA) 416 66.0 -9.0 * (4.8) 193 72.6 -26.4 *** (6.8)No 432 60.7 -10.9 ** (4.8) 214 74.2 -17.8 *** (6.5)
EI Sample IA Sample
Note: See page 143 for source and notes.

- 157 -
Table D.14: Impacts on Volunteering by Subgroup — Participants Not Having Informally Volunteered in 22 Months (%)
Sample Control Difference Standard Sample Control Difference StandardSubgroup Size Group (Impact) Error Size Group (Impact) ErrorGender and ageGender of respondent n.s. n.s.
Male 462 36.6 -5.1 (4.4) 133 38.3 -5.5 (8.4)Female 375 42.0 -4.3 (5.1) 266 39.1 -12.6 ** (5.7)
Age of respondent at baseline n.s. n.s.Less than 30 153 34.2 1.0 (7.8) 122 37.3 -7.1 (8.6)30-39 203 37.2 -4.2 (6.7) 130 42.0 -17.4 ** (8.2)40 and over 481 41.9 -7.8 * (4.4) 147 37.1 -6.0 (7.9)
Family structureMarital status at baseline n.s. n.s.
Married or common-law 516 39.9 -4.6 (4.3) 76 22.6 1.9 (10.1)Single, separated, or divorced 320 37.8 -5.9 (5.3) 319 42.2 -12.1 ** (5.4)
Children in the household at baseline n.s. n.s.1 or more children 377 41.0 -4.2 (5.0) 254 34.3 -6.1 (5.9)No children 460 37.7 -5.7 (4.5) 144 49.2 -19.1 ** (8.1)
Lone parent status n.s. n.s.Yes 101 42.4 -16.2 * (9.6) 195 36.6 -7.7 (6.8)No 735 38.6 -3.7 (3.6) 199 42.4 -13.4 ** (6.8)
EducationHad high school diploma or equivalent † n.s.
Yes 579 39.9 -8.5 ** (4.0) 250 40.2 -16.4 *** (5.9)No 251 37.1 3.7 (6.2) 147 36.4 -0.6 (8.0)
Employment and incomeWork experience since the age of 16 n.s. †
Employed 0-9 years (0-5 years for IA) 166 45.1 -16.6 ** (7.4) 132 33.9 0.4 (8.4)Employed 10 or more years (6 or more for IA) 643 37.6 -3.0 (3.8) 255 43.2 -18.8 *** (5.9)
Annual income at baseline † n.s.Less than $20,000 (Less than $10,000 for IA) 339 40.9 -12.0 ** (5.2) 229 44.4 -11.4 * (6.4)$20,000 or more ($10,000 or more for IA) 496 38.3 -0.7 (4.4) 170 30.9 -7.3 (6.8)
Barriers to employmentReported at least one health limitation n.s. n.s. that restricts activity
Yes 242 40.0 -6.4 (6.3) 142 43.3 -15.3 * (8.0)No 595 39.1 -4.8 (4.0) 257 36.6 -7.3 (5.9)
Social networksNumber of contacts n.s. n.s.
Less than 10 contacts at baseline 492 41.0 -4.3 (4.4) 267 41.0 -8.7 (5.9)10 or more contacts at baseline 343 37.2 -7.8 (5.1) 131 33.3 -11.3 (7.8)
Network density n.s. n.s.All contacts know each other 294 48.0 -10.1 * (5.8) 197 40.4 -10.8 (6.8)Some contacts do not know each other 538 35.8 -4.3 (4.1) 198 37.1 -10.4 (6.6)
Previous EI/IA experienceFrequent user of EI/IA n.s. n.s.
Yes (12+ months for EI, 20+ months for IA) 407 41.4 -10.5 ** (4.8) 192 39.2 -11.4 * (6.8)No 430 37.2 -0.4 (4.7) 207 38.5 -8.8 (6.6)
EI Sample IA Sample
Note: See page 143 for source and notes.
- 158 -
References
Bowles, S., Gintis, H., & Osborne, M. (2000). The determinants of earnings: Skills,
preferences and schooling. University of Massachusetts: Townson University. Brock, T., Doolittle, F., Fellerath, V., & Wiseman, M. (1997). Creating New Hope:
Implementation of a program to reduce poverty and reform welfare. New York: Manpower Research and Demonstration Corporation.
Canada Economic Development. (2007). Socioeconomic profile of the Gaspésie-Iles-de-
la-Madeleine region. Retrieved August 31, 2007, from http://www.dec-ced.gc.ca/complements/ProgrammesServices/profilsEN/profil-gaspe-madeleine-En/profil-gaspe-madeleine-En.htm
Connell, J. P. & Kubisch, A. C. (1998). Applying a theory of change approach to the
evaluation of comprehensive community initiatives: Progress, prospects and problems. In K. Fulbright-Anderson, A. C. Kubisch, & J. P. Connell (Eds.), New approaches to evaluating community initiatives: Theory, measurement and analysis. Washington, D.C.: The Aspen Institute.
Crawford, C. (2003). Towards a common approach to thinking about and measuring
social inclusion. Toronto: Roeher Institute. Diener, E. (2000). Subjective well-being: The science of happiness and a proposal for a
national index. American Psychologist, 55(1), 34–43. Feinstein, J. S. (1993). The relationship between socioeconomic status and health: A
review of the literature. The Milbank Quarterly, 71(2), 279–322. Granovetter, M. (1973). The strength of weak ties. American Journal of Sociology, 78(6). Greenwood, J., Nicholson, C., Gyarmati, D., Kyte, D., MacInnis, M., & Ford, R.. (2003).
The Community Employment Innovation Project: Design and implementation. Ottawa: Social Research and Demonstration Corporation.
Gyarmati, D., de Raaf, S,. Nicholson, C., Kyte, D., & MacInnis, M. (2006). Testing a
community-based jobs strategy for the unemployed: Early impacts of the Community Employment Innovation Project. Ottawa: Social Research and Demonstration Corporation.
Gyarmati, D., & Kyte, D. (2003). Social capital, network formation and the Community
Employment Innovation Project. Horizons, 6(3). Ottawa: Policy Research Initiative.

- 159 -
Helliwell, J. F. (2001). Social capital, the economy and well-being. The Review of Economic Performance and Social Progress, 1. Centre for the Study of Living Standards and the Institute for Research on Public Policy, McGill-Queen’s University Press. Retrieved May 31, 2001, from http://www.csls.ca/repsp/1/03-helliwell.pdf
Holzer, H. (2002). Can work experience programs work for welfare recipients?
Washington, D.C: The Brookings Institution. Human Resources and Social Development Canada. (2005). Labour market review 2004
— Cape Breton. Retrieved May 31, 2006, from http://www.hrsdc.gc.ca/asp/gateway.asp?hr=/en/ns/lmi/Reviews2003/cb2003.shtml&hs=ns0
Johnson, C. (1997). Toward a new generation of community jobs programs. In 1997
entrepreneurial economy review. Washington, D.C.: Corporation for Enterprise Development.
Levesque, M. & White, D. (1999). “Le concept de capital social et ses usages.” Lien
social et politique 41, 23-33. McLaughlin, M. (1992). Employability skills profile: What are employers looking for?
(Report 81-92-E). Ottawa: Conference Board of Canada. Meyer, B. (1995). Policy lessons from the U.S. Unemployment Insurance Experiments.
Journal of Economic Literature 33, 91-131. Miles C., & Grummon, P. (1996). Working: Assessing skills, habits, and style inventory.
Landing, MI: H & H Publishing Co., Inc. Mohr, L. B. (1995). Impact analysis for program evaluation (2nd ed.). Thousand Oaks,
CA: Sage Publications. National Forum on Health. (1997).Canada Health Action: Building on the Legacy —
Volume II. Determinants of Health Working Group Synthesis Report. Ninacs, W. A. (2002). A review of the theory and practice of social economy / économie
sociale in Canada (SRDC Working Paper 02-02). Ottawa: Social Research and Demonstration Corporation.
Organization for Economic Cooperation and Development. (1989). Employment outlook.
Paris: Author. Organization for Economic Cooperation and Development. (1990). Labour market
policies for the 1990s. Paris: Author.

- 160 -
Orr, L. L. (1999). Social experiments: Evaluating public programs with experimental methods. Thousand Oaks, CA: Sage Publications.
Pavot, W., & Diener, E. (1993). Review of the Satisfaction With Life Scale.
Psychological Assessment, 5(2), 164-172. Policy Research Initiative. (2003). Social capital: Building on a network-based
approach. Ottawa: Author. Policy Research Initiative. (2005). What we need to know about the social economy: A
guide for policy research. Ottawa: Author. Putnam, R. D. (2000). Bowling alone: The collapse and revival of American community.
New York: Simon and Schuster. Putnam, R. D. (2001). Social capital: Measurement and consequences. Isuma, 2(1). Roy, A., & Wong, G. (1998). Direct job creation programs: Evaluation lessons. Ottawa:
Human Resources Development Canada. Sherwood, K. (1999). Designing and administering a wage-paying community service
employment program under TANF. New York: Manpower Research and Demonstration Corporation.
Sperber, L., & Bloom, D. (2002). An analysis of Vermont’s Community Service
Employment Program. New York: Manpower Research and Demonstration Corporation.
Statistics Canada. (2006). 2001 community profiles. Retrieved April 5, 2006, from
www12.statcan.ca/english/profil01/CP01/index.cfm?lang=E Statistics Canada. (2007a). Labour Force Survey. Retrieved September 6, 2007, from
http://www40.statcan.ca/l01/cst01/lfss05f.htm Statistics Canada. (2007b). Cape Breton, Nova Scotia (table). 2006 Community Profiles.
2006 Census. Statistics Canada Catalogue no. 92-591-XWE. Ottawa. Released March 13, 2007. Retrieved March 19, 2007, from http://www12.statcan.ca/english/census06/data/profiles/community/Index.cfm?Lang=E
Wellman, B. (1979). The community question: The intimate networks of East Yorkers.
American Journal of Sociology, 84, 1201–31. Woolcock, M. (2001). The place of social capital in understanding social and economic
outcomes. Isuma 2(1).

- 161 -
Woolcock, M., & Narayan, D. (2000). Social capital: Implications for development theory, research and policy. World Bank Research Observer, 15, 225–249.


Publications on SRDC Projects
SRDC reports are published in both official languages. SRDC working papers are published in the language of the author(s) only.
Self-Sufficiency Project (SSP)
Making Work Pay Symposium (March 2006).
Human Capital and Search Behaviour (working paper 06-10 published in English only), by Audra Bowlus, Lance Lochner, Christopher Robinson, and Yahong Zhang (March 2006).
The Effect of the Self-Sufficiency Project on Children (working paper 06-09 published in English only), by Piotr Wilk, Michael H. Boyle, Martin D. Dooley, and Ellen Lipman (March 2006).
Educational Upgrading and its Consequences Among Welfare Recipients: Empirical Evidence From the Self-Sufficiency Project (working paper 06-08 published in English only), by Chris Riddell and W. Craig Riddell (March 2006).
An Analysis of the Impact of SSP on Wages (working paper 06-07 published in English only), by Jeffrey Zabel, Saul Schwartz, and Stephen Donald (March 2006).
An Econometric Analysis of the Incremental Impact of SSP Plus (working paper 06-06 published in English only), by Jeffrey Zabel, Saul Schwartz, and Stephen Donald (March 2006).
The Effects of Human Capital and Earnings Supplements on Income Assistance Dependence in Canada (working paper 06-05 published in English only), by Jorgen Hansen (March 2006).
Evaluating Search and Matching Models Using Experimental Data (working paper 06-04 published in English only), by Jeremy Lise, Shannon Seitz, and Jeffrey Smith (March 2006).
Understanding the Dynamic Effects of the Self-Sufficiency Project Applicant Study (working paper 06-03 published in English only), by David Card and Dean R. Hyslop (February 2006).
The Value of Non-market Time Lost During the Self-Sufficiency Project (working paper 06-02 published in English only), by David H. Greenberg and Philip K. Robins (February 2006).
Distributional Impacts of the Self-Sufficiency Project (working paper 06-01 published in English only), by Marianne P. Bitler, Jonah B. Gelbach, and Hilary W. Hoynes (February 2006).
Estimating the Effects of a Time-Limited Earnings Subsidy for Welfare-Leavers (working paper 05-02 published in English only), by David Card and Dean R. Hyslop (February 2005).
Can Work Alter Welfare Recipients’ Beliefs? (working paper 05-01 published in English only), by Peter Gottschalk (February 2005).
Out-of-School Time-Use During Middle Childhood in a Low-Income Sample: Do Combinations of Activities Affect Achievement and Behaviour? (working paper 04-06 published in English only), by Pamela Morris and Ariel Kalil (July 2004).
An Econometric Analysis of the Impact of the Self-Sufficiency Project on Unemployment and Employment Durations (working paper 04-05 published in English only), by Jeffrey Zabel, Saul Schwartz, and Stephen Donald (July 2004).

Sustaining: Making the Transition From Welfare to Work (working paper 04-03 published in English only), by Wendy Bancroft (July 2004).
New Evidence From the Self-Sufficiency Project on the Potential of Earnings Supplements to Increase Labour Force Attachment Among Welfare Recipients (working paper 04-02 published in English only), by Kelly Foley (February 2004).
Employment, Earnings Supplements, and Mental Health: A Controlled Experiment (working paper 04-01 published in English only), by Pierre Cremieux, Paul Greenberg, Ronald Kessler, Philip Merrigan, and Marc Van Audenrode (February 2004).
Equilibrium Policy Experiments and the Evaluation of Social Programs (working paper 03-06 published in English only), by Jeremy Lise, Shannon Seitz, and Jeffrey Smith (October 2003).
Assessing the Impact of Non-response on the Treatment Effect in the Canadian Self-Sufficiency Project (working paper 03-05 published in English only), by Thierry Kamionka and Guy Lacroix (October 2003).
Can Work Incentives Pay for Themselves? Final Report on the Self-Sufficiency Project for Welfare Applicants, by Reuben Ford, David Gyarmati, Kelly Foley, and Doug Tattrie, with Liza Jimenez (October 2003).
Do Earnings Subsidies Affect Job Choice? The Impact of SSP Supplement Payments on Wage Growth (working paper 03-02 published in English only), by Helen Connolly and Peter Gottschalk (January 2003).
Leaving Welfare for a Job: How Did SSP Affect the Kinds of Jobs Welfare Recipients Were Willing to Accept? (working paper 02-03 published in English only), by Kelly Foley and Saul Schwartz (August 2002).
Making Work Pay: Final Report on the Self-Sufficiency Project for Long-Term Welfare Recipients, by Charles Michalopoulos, Doug Tattrie, Cynthia Miller, Philip K. Robins, Pamela Morris, David Gyarmati, Cindy Redcross, Kelly Foley, and Reuben Ford (July 2002).
When Financial Incentives Pay For Themselves: Interim Findings From the Self-Sufficiency Project’s Applicant Study, by Charles Michalopoulos and Tracey Hoy (November 2001).
SSP Plus at 36 Months: Effects of Adding Employment Services to Financial Work Incentives, by Ying Lei and Charles Michalopoulos (July 2001).
Measuring Wage Growth Among Former Welfare Recipients (working paper 01-02 published in English only), by David Card, Charles Michalopoulos, and Philip K. Robins (July 2001).
How an Earnings Supplement Can Affect the Marital Behaviour of Welfare Recipients: Evidence from the Self-Sufficiency Project (working paper 01-01 published in English only), by Kristen Harknett and Lisa A. Gennetian (May 2001).
The Self-Sufficiency Project at 36 Months: Effects of a Financial Work Incentive on Employment and Income, by Charles Michalopoulos, David Card, Lisa A. Gennetian, Kristen Harknett, and Philip K. Robins (June 2000).
The Self-Sufficiency Project at 36 Months: Effects on Children of a Program that Increased Parental Employment and Income, by Pamela Morris and Charles Michalopoulos (June 2000).
Does SSP Plus Increase Employment? The Effect of Adding Services to the Self-Sufficiency Project’s Financial Incentives, by Gail Quets, Philip K. Robins, Elsie C. Pan, Charles Michalopoulos, and David Card (May 1999).
When Financial Work Incentives Pay for Themselves: Early Findings from the Self-Sufficiency Project’s Applicant Study, by Charles Michalopoulos, Philip K. Robins, and David Card (May 1999).
When Financial Incentives Encourage Work: Complete 18-Month Findings from the Self-Sufficiency Project, by Winston Lin, Philip K. Robins, David Card, Kristen Harknett, and Susanna Lui-Gurr, with Elsie C. Pan, Tod Mijanovich, Gail Quets, and Patrick Villeneuve (September 1998).
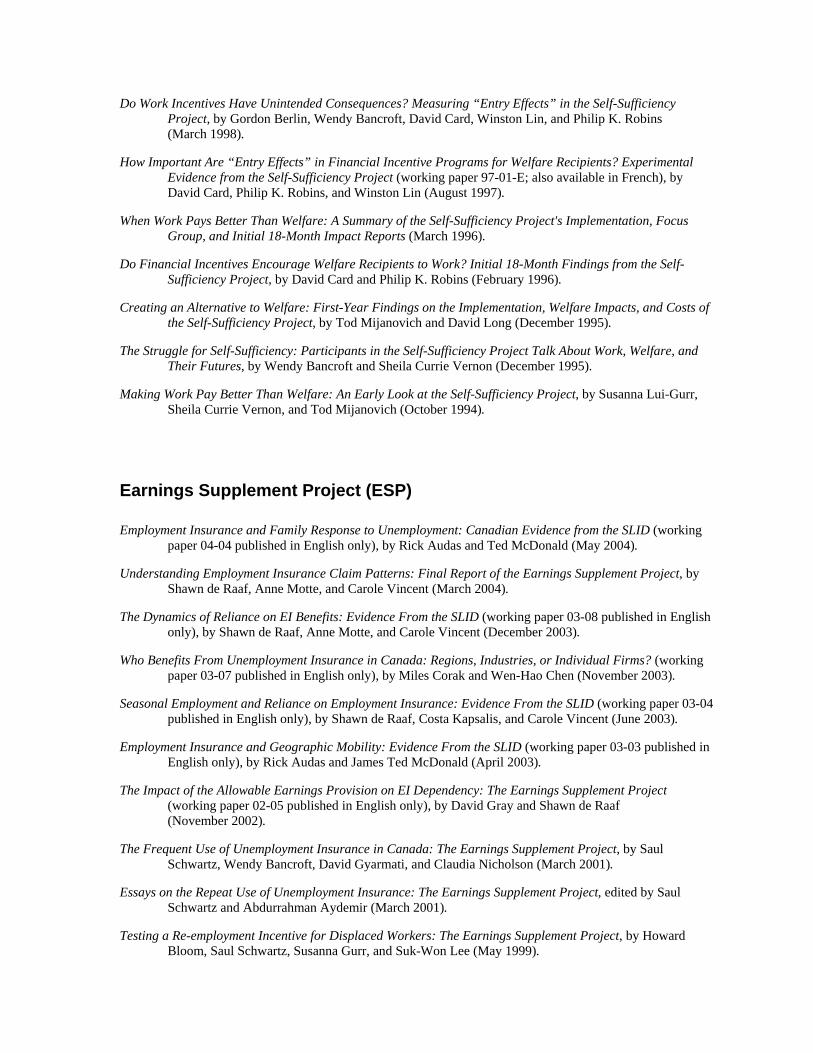
Do Work Incentives Have Unintended Consequences? Measuring “Entry Effects” in the Self-Sufficiency Project, by Gordon Berlin, Wendy Bancroft, David Card, Winston Lin, and Philip K. Robins (March 1998).
How Important Are “Entry Effects” in Financial Incentive Programs for Welfare Recipients? Experimental Evidence from the Self-Sufficiency Project (working paper 97-01-E; also available in French), by David Card, Philip K. Robins, and Winston Lin (August 1997).
When Work Pays Better Than Welfare: A Summary of the Self-Sufficiency Project's Implementation, Focus Group, and Initial 18-Month Impact Reports (March 1996).
Do Financial Incentives Encourage Welfare Recipients to Work? Initial 18-Month Findings from the Self-Sufficiency Project, by David Card and Philip K. Robins (February 1996).
Creating an Alternative to Welfare: First-Year Findings on the Implementation, Welfare Impacts, and Costs of the Self-Sufficiency Project, by Tod Mijanovich and David Long (December 1995).
The Struggle for Self-Sufficiency: Participants in the Self-Sufficiency Project Talk About Work, Welfare, and Their Futures, by Wendy Bancroft and Sheila Currie Vernon (December 1995).
Making Work Pay Better Than Welfare: An Early Look at the Self-Sufficiency Project, by Susanna Lui-Gurr, Sheila Currie Vernon, and Tod Mijanovich (October 1994).
Earnings Supplement Project (ESP) Employment Insurance and Family Response to Unemployment: Canadian Evidence from the SLID (working
paper 04-04 published in English only), by Rick Audas and Ted McDonald (May 2004).
Understanding Employment Insurance Claim Patterns: Final Report of the Earnings Supplement Project, by Shawn de Raaf, Anne Motte, and Carole Vincent (March 2004).
The Dynamics of Reliance on EI Benefits: Evidence From the SLID (working paper 03-08 published in English only), by Shawn de Raaf, Anne Motte, and Carole Vincent (December 2003).
Who Benefits From Unemployment Insurance in Canada: Regions, Industries, or Individual Firms? (working paper 03-07 published in English only), by Miles Corak and Wen-Hao Chen (November 2003).
Seasonal Employment and Reliance on Employment Insurance: Evidence From the SLID (working paper 03-04 published in English only), by Shawn de Raaf, Costa Kapsalis, and Carole Vincent (June 2003).
Employment Insurance and Geographic Mobility: Evidence From the SLID (working paper 03-03 published in English only), by Rick Audas and James Ted McDonald (April 2003).
The Impact of the Allowable Earnings Provision on EI Dependency: The Earnings Supplement Project (working paper 02-05 published in English only), by David Gray and Shawn de Raaf (November 2002).
The Frequent Use of Unemployment Insurance in Canada: The Earnings Supplement Project, by Saul Schwartz, Wendy Bancroft, David Gyarmati, and Claudia Nicholson (March 2001).
Essays on the Repeat Use of Unemployment Insurance: The Earnings Supplement Project, edited by Saul Schwartz and Abdurrahman Aydemir (March 2001).
Testing a Re-employment Incentive for Displaced Workers: The Earnings Supplement Project, by Howard Bloom, Saul Schwartz, Susanna Gurr, and Suk-Won Lee (May 1999).

A Financial Incentive to Encourage Employment among Repeat Users of Employment Insurance: The Earnings Supplement Project, by Doug Tattrie (May 1999).
Implementing the Earnings Supplement Project: A Test of a Re-employment Incentive, by Howard Bloom, Barbara Fink, Susanna Lui-Gurr, Wendy Bancroft, and Doug Tattrie (October 1997).
Community Employment Innovation Project (CEIP) Testing a Community-Based Jobs Strategy for the Unemployed: Early Impacts of the Community Employment
Innovation Project, by David Gyarmati, Shawn de Raaf, Claudia Nicholson, Darrell Kyte, and Melanie MacInnis (November 2006).
The Community Employment Innovation Project: Design and Implementation, by John Greenwood, Claudia Nicholson, David Gyarmati, Darrell Kyte, Melanie MacInnis, and Reuben Ford (December 2003).
A Model of Social Capital Formation (working paper 03-01 published in English only), by Cathleen Johnson (January 2003).
A Review of the Theory and Practice of Social Economy/Économie Sociale in Canada (working paper 02-02 published in English only), by William A. Ninacs with assistance from Michael Toye (August 2002).
learn$ave
Design and Implementation of a Program to Help the Poor Save: The learn$ave Project, by Paul Kingwell, Michael Dowie, Barbara Holler, Carole Vincent, David Gyarmati, and Hongmei Cao (August 2005).
Helping People Help Themselves: An Early Look at learn$ave, by Paul Kingwell, Michael Dowie, and Barbara Holler, with Liza Jimenez (May 2004).
Economic experiments Fostering Adult Education: A Laboratory Experiment on the Efficient Use of Loans, Grants, and Saving
Incentives (working paper 03-09 published in English only), by Cathleen Johnson, Claude Montmarquette, and Catherine Eckel (December 2003).
Will the Working Poor Invest in Human Capital? A Laboratory Experiment (working paper 02-01 published in English only), by Catherine Eckel, Cathleen Johnson, and Claude Montmarquette (February 2002).
Other studies A Literature Review of Experience-Rating Employment Insurance in Canada (working paper 05-03 published in
English only), by Shawn de Raaf, Anne Motte, and Carole Vincent (May 2005).
The Disability Supports Feasibility Study: Final Report, by Doug Tattrie, Colin Stuart, Roy Hanes, Reuben Ford, and David Gyarmati (June 2003).

How Random Must Random Assignment Be in Random Assignment Experiments? (technical paper 03-01 published in English only), by Paul Gustafson (February 2003).
Preparing for Tomorrow’s Social Policy Agenda: New Priorities for Policy Research and Development That Emerge From an Examination of the Economic Well-Being of the Working-Age Population (working paper 02-04 published in English only), by Peter Hicks (November 2002).
The Jobs Partnership Program Pilot: Pathways, Pitfalls, and Progress in the First Year (process research report published in English only), by Wendy Bancroft, Susanna Gurr, and David Gyarmati (October 2001).
BladeRunners and Picasso Café: A Case Study Evaluation of Two Work-Based Training Programs for Disadvantaged Youth, by Sheila Currie, Kelly Foley, Saul Schwartz, and Musu Taylor-Lewis (March 2001).
Transitions: Programs to Encourage British Columbia Students to Stay in School (working paper 99-01 published in English only), by Reuben Ford, Susanna Gurr, Robert J. Ivry, and Musu Taylor-Lewis (June 1999).
