celltrion healthcare healthcar… · sales breakdown 0% 4% 8% 12% 16% 0 50 100 150 200 '19.1q...
TRANSCRIPT

May 2020
Celltrion Healthcare1Q20 Earnings Presentation

Section 01. 1Q20 Business Results
Section 02. Key Business Performance
Appendix
Contents

Section 011Q20 Business Results

Investor Relations 2020 4
(KRW bn) ′19.1Q ′19.4Q ′20.1Q %YoY %QoQ
Revenue 220.5 313.6 356.9 61.9% 13.8%
Gross Profit 33.9 90.1 94.5 178.8% 4.9%
(%) 15.4% 28.7% 26.5% 11.1%p -2.3%p
SG&A 24.5 47.2 38.7 58.0% -18.0%
(%) 11.1% 15.1% 10.8% -0.3%p -4.2%p
Personnel expenses 5.0 8.4 6.8 36.0% -19.0%
Research expenses 3.0 6.6 6.4 113.3% -3.0%
Advertising expenses 0.7 2.5 2.5 257.1% -
Commissions 8.8 17.8 9.4 6.8% -47.2%
Operating Profit 9.4 42.8 55.8 493.6% 30.4%
(%) 4.3% 13.6% 15.6% 11.4%p 2.0%p
EBIT 8.6 22.4 98.2 1,041.9% 338.4%
Net Profit 5.8 40.6 76.2 1,213.8% 87.7%
1Q20 Business Results Income Statement
▶ Revenue : Improved on both quarterly & yearly basis thanks to sales growth of US Inflectra®, Truxima® and diversified product portfolio
▶ OP : Achieved moderate operating profit with high-margin US Inflectra® and Truxima® accounting for greater portion of the portfolio
▶ NP : Substantial increase year on year due to the foreign currency translation gains resulted from depreciation in Won as well as
gains on valuation of financial assets designated at fair vale through profit

Investor Relations 2020 5
1Q20 Business Results Sales Breakdown
By Product (Unit: KRW bn)
Remsima® / Inflectra® Truxima® Herzuma® Remsima® SC
60% 40%42%
31%
42%
46%
9%
18%
10%2%
'19.1Q '19.4Q '20.1Q
220.5
313.6
356.9
By Region (Unit: KRW bn)
Europe N. America Others
86%52% 45%
10%
40%48%
4%
8%
7%
'19.1Q '19.4Q '20.1Q
220.5
313.6
356.9

Investor Relations 2020 6
Sales Breakdown
0%
4%
8%
12%
16%
0
50
100
150
200
'19.1Q '19.2Q '19.3Q '19.4Q '20.1Q
N.America Sales (LHS) OP Margin (RHS)
10%
(KRW bn)
8%
35%
40%
48%
N.America sales rise and additional launches of Remsima® SC in EU will drive
earnings growth
N.America Sales & OP Margin Trend
Note: the percentage above each graph represents the share of N. America sales out of total sales
Investor Relations 2020 7
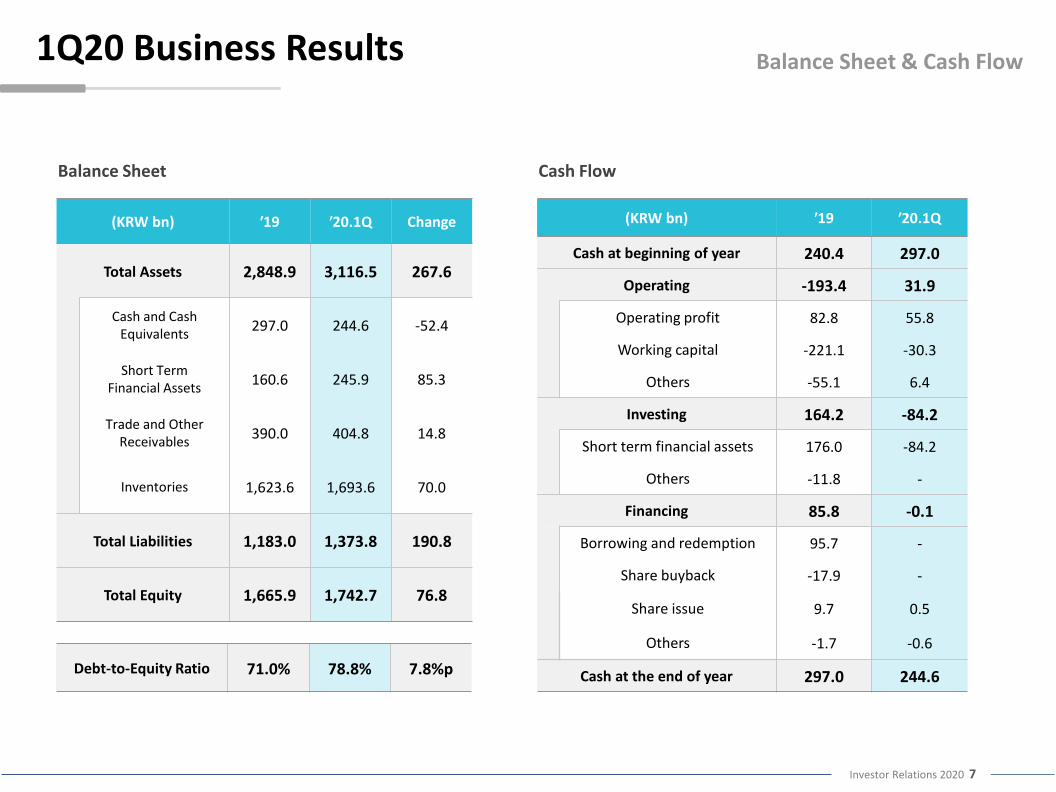
Debt-to-Equity Ratio 71.0% 78.8% 7.8%p
(KRW bn) ′19 ′20.1Q Change
Total Assets 2,848.9 3,116.5 267.6
Cash and Cash Equivalents
297.0 244.6 -52.4
Short Term Financial Assets
160.6 245.9 85.3
Trade and Other Receivables
390.0 404.8 14.8
Inventories 1,623.6 1,693.6 70.0
Total Liabilities 1,183.0 1,373.8 190.8
Total Equity 1,665.9 1,742.7 76.8
Balance Sheet Cash Flow
(KRW bn) ′19 ′20.1Q
Cash at beginning of year 240.4 297.0
Operating -193.4 31.9
Operating profit 82.8 55.8
Working capital -221.1 -30.3
Others -55.1 6.4
Investing 164.2 -84.2
Short term financial assets 176.0 -84.2
Others -11.8 -
Financing 85.8 -0.1
Borrowing and redemption 95.7 -
Share buyback -17.9 -
Share issue 9.7 0.5
Others -1.7 -0.6
Cash at the end of year 297.0 244.6
Balance Sheet & Cash Flow1Q20 Business Results

Section 02Key Business Performance

Key Business Performance
Investor Relations 2020 9
Remsima® & Inflectra®
Remsima®/Inflectra® Market Share in Europe Inflectra® Prescription Sales in the US
Note: market share is based on volume
Source : IQVIA
Note: prescription sales is based on WAC
Source : Symphony Health
Achieved 60% of market share of total EU Infliximab market, maintaining a leading position
as the most prescribed Infliximab product
Acceleration of prescription in the US led to US sales increase
Remsima® / Inflectra® Remicade®
9%
18%
28%
37%
46%
52%54%
57%59% 60%
0%
10%
20%
30%
40%
50%
60%
70%
80%
90%
100%
15.2Q 15.4Q 16.2Q 16.4Q 17.2Q 17.4Q 18.2Q 18.4Q 19.2Q 19.4Q
7
21
34
46
62
79
92 101
108
129
143
163
178
0
20
40
60
80
100
120
140
160
180
200
17.1Q 17.3Q 18.1Q 18.3Q 19.1Q 19.3Q 20.1Q
($mn)

0.4%
1.7%
4.9%
5.4%
7.9%
0%
2%
4%
6%
8%
10%
M1 M2 M3 M4 M5
Investor Relations 2020 10
Truxima® Market Share in Europe
Key Business Performance Truxima®
Truxima® Market Share in the US
Truxima ® B BiosimilarTruxima® Mabthera® A Biosimilar
Note: market share is based on volume
Source : IQVIA
Note: market share is based on unit
Source : Symphony Health
2%
9%
18%
25%
31%35% 36% 37% 38%
39% 39%
0%
10%
20%
30%
40%
50%
60%
70%
80%
90%
100%
17.2Q 17.3Q 17.4Q 18.1Q 18.2Q 18.3Q 18.4Q 19.1Q 19.2Q 19.3Q 19.4Q
Surpassed Rituxan®’s market share & Became the most prescribed Rituximab product in EU
Got off to a good start achieving 7.9% of market share only in 5 months of its launch in the US
Investor Relations 2020 11
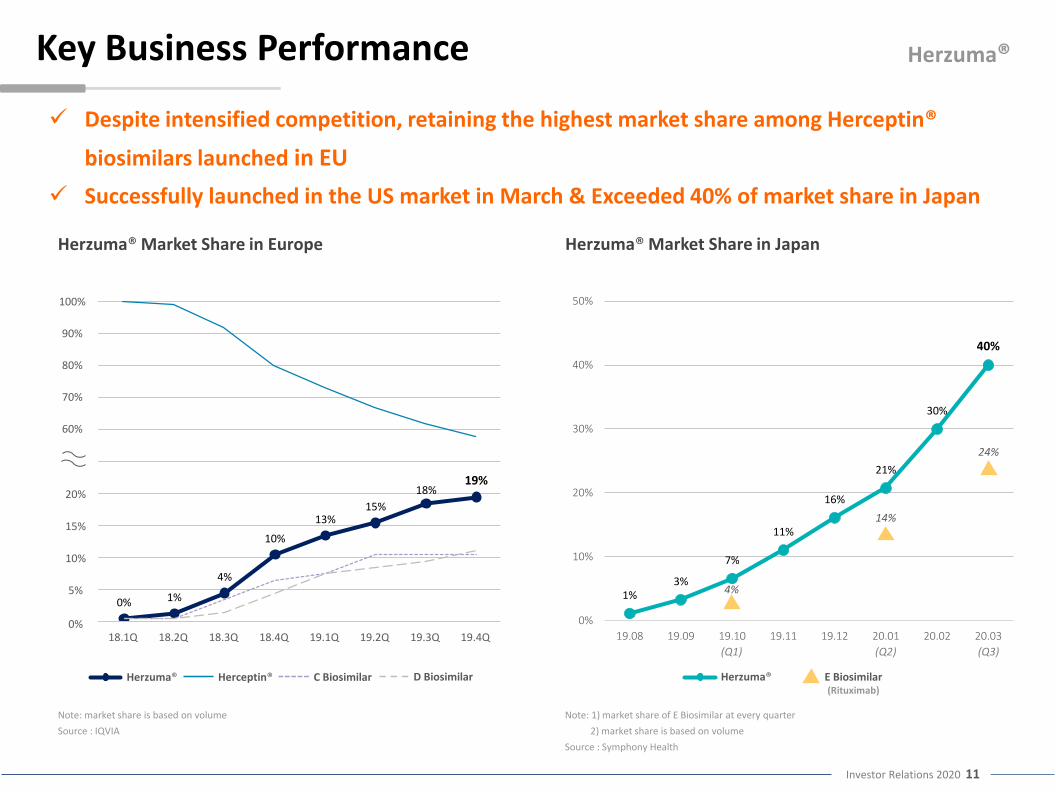
Key Business Performance Herzuma®
Herzuma® Market Share in Europe
1%3%
7%
11%
16%
21%
30%
40%
0%
10%
20%
30%
40%
50%
19.08 19.09 19.10 19.11 19.12 20.01 20.02 20.03
Herzuma® Herceptin® C Biosimilar D Biosimilar Herzuma® E Biosimilar(Rituximab)
4%
24%
(Q1) (Q2)
Herzuma® Market Share in Japan
Note: market share is based on volume
Source : IQVIA
Note: 1) market share of E Biosimilar at every quarter
2) market share is based on volume
Source : Symphony Health
18.1Q 18.2Q 18.3Q 18.4Q 19.1Q 19.2Q 19.3Q 19.4Q
0% 1%
4%
10%
13%15%
18%19%
100%
20%
5%
10%
15%
0%
90%
80%
70%
60%
14%
(Q3)
Despite intensified competition, retaining the highest market share among Herceptin®
biosimilars launched in EU
Successfully launched in the US market in March & Exceeded 40% of market share in Japan
Appendix

Investor Relations 2020 13
(KRW bn) 1Q18 2Q18 3Q18 4Q18 1Q19 2Q19 3Q19 4Q19 1Q20 '17 '18 '19
Revenue 128.4 183.8 212.7 188.7 220.5 284.8 282.0 313.6 356.9 920.9 713.5 1,100.9
Cost of Sales 102.8 144.9 168.8 228.1 186.6 248.3 233.1 223.5 262.4 696.8 644.6 891.6
Gross Profit 25.6 38.8 43.9 (39.4) 33.9 36.4 48.9 90.1 94.5 224.1 68.9 209.3
SG&A 17.1 23.6 23.8 29.5 24.5 27.2 27.6 47.2 38.7 70.5 94.1 126.5
Operating Income 8.4 15.2 20.0 (68.9) 9.4 9.3 21.3 42.8 55.8 153.7 (25.2) 82.8
Non-operating Income 74.1 0.7 (11.0) (14.2) (0.8) 8.7 5.1 (19.8) 42.4 52.5 49.6 (6.7)
Financial Income 74.2 10.5 (6.3) (6.2) 4.9 6.8 7.3 1.0 22.8 114.6 70.5 20.0
Financial Expenses 6.4 4.7 3.4 0.6 5.1 13.6 5.9 4.9 7.4 47.1 13.3 29.5
Other Income 11.0 0.9 4.0 0.9 2.1 16.3 10.2 (7.8) 32.5 16.8 14.2 20.8
Other Expenses 4.7 6.0 5.3 8.4 2.6 0.8 6.5 8.1 5.5 31.8 21.7 18.0
Profit (Loss) before Taxes 82.5 16.0 9.1 (83.1) 8.6 18.0 26.4 22.4 98.2 206.1 24.4 75.4
Tax Expense (Benefit) 22.0 5.0 2.7 (16.5) 2.8 9.5 16.3 (18.2) 22.0 48.7 13.0 10.4
Net Profit (Loss) 60.5 11.0 6.4 (66.6) 5.8 8.5 10.1 40.6 76.2 157.4 11.4 65.0
Summary Income Statement

Thank You