central east chron cond rep v
TRANSCRIPT
Information Management
A System We Can Count On
Chronic Conditionsin the Central East LHIN
Health System Intelligence Project – October 2007
About HSIP . . . . . . . . . . . . . . . . . . . . . . . . . . . . . . . . . .ii
Introduction . . . . . . . . . . . . . . . . . . . . . . . . . . . . . . . . .1
Overview of Chronic Conditions . . . . . . . . . . . . . . .2
Prevalence of Selected Chronic Conditions . . . . .4
Multiple Chronic Conditions . . . . . . . . . . . . . . . . . .5
Commonly Occurring Co-morbidities . . . . . . . . . . . . . .5
Physician Use . . . . . . . . . . . . . . . . . . . . . . . . . . . . . . . .6
A Closer Look at Selected ChronicConditions . . . . . . . . . . . . . . . . . . . . . . . . . . . . . . .7
Cancer . . . . . . . . . . . . . . . . . . . . . . . . . . . . . . . . . . . . . .8
Diabetes . . . . . . . . . . . . . . . . . . . . . . . . . . . . . . . . . . . .10
Depression . . . . . . . . . . . . . . . . . . . . . . . . . . . . . . . . . .12
Heart Disease . . . . . . . . . . . . . . . . . . . . . . . . . . . . . . .14
Hypertension . . . . . . . . . . . . . . . . . . . . . . . . . . . . . . .16
Stroke . . . . . . . . . . . . . . . . . . . . . . . . . . . . . . . . . . . . . .18
Asthma . . . . . . . . . . . . . . . . . . . . . . . . . . . . . . . . . . . . .20
Chronic Obstructive Pulmonary Disease . . . . . . .22
Arthritis and Related Conditions . . . . . . . . . . . . .24
Comparative Burden of Chronic Conditions . . .26
Risk Factors . . . . . . . . . . . . . . . . . . . . . . . . . . . . . . . .27
Population Attributable Fraction . . . . . . . . . . . . . . . .29
Interpretation of Population Attributable Fractions .30
Conclusion . . . . . . . . . . . . . . . . . . . . . . . . . . . . . . . . . .34
References . . . . . . . . . . . . . . . . . . . . . . . . . . . . . . . . . .36
Appendix A
Examples of Chronic Disease Definitions . . . . . . . . .41
Appendix B
Technical Notes . . . . . . . . . . . . . . . . . . . . . . . . . . . . . .43
Appendix C
Prevalence of Chronic Conditions . . . . . . . . . . . . . . .46
Chronic Conditions in the Central East LHIN Page i
Table of Contents
The Health System Intelligence Project
This report is produced by the Health SystemIntelligence Project (HSIP). HSIP consists of a team ofhealth system experts retained by the Ministry ofHealth and Long-Term Care’s Health Results Team forInformation Management (HRT-IM) to provide theLocal Health Integration Networks (LHINs) with:
• Sophisticated data analysis;
• Interpretation of results;
• Orientation of new staff to health system dataanalysis issues;
• Training on new techniques and technologiespertaining to health system analysis and planning.
The Health Results Team for Information Managementcreated the Health System Intelligence Project tocomplement and augment the existing analytical andplanning capacity within the Ministry of Health andLong-Term Care. The project team is working inconcert with Ministry analysts to ensure that theLHINs are provided with the analytic supports theyneed for their local health system planning activities.
Report Authors:
Namrata Bains, HSIP (Project Lead)Kristin Dall, HSIP Jane Hohenadel, HSIP
For further information, please contact:
Acknowledgements
We would like to thank the Population Health Policyand Planning & Women’s Health Branch of the OntarioMinistry of Health and Long-Term Care for advice andsupport in development of this project. We gratefullyacknowledge Ngoc-Thy Dinh, Dr. Doug Manuel(Institute for Clinical Evaluative Sciences) and LeeSieswerda (Thunder Bay District Health Unit) for theirguidance on the calculation of Population AttributableFractions.
Page ii Chronic Conditions in the Central East LHIN
About HSIP
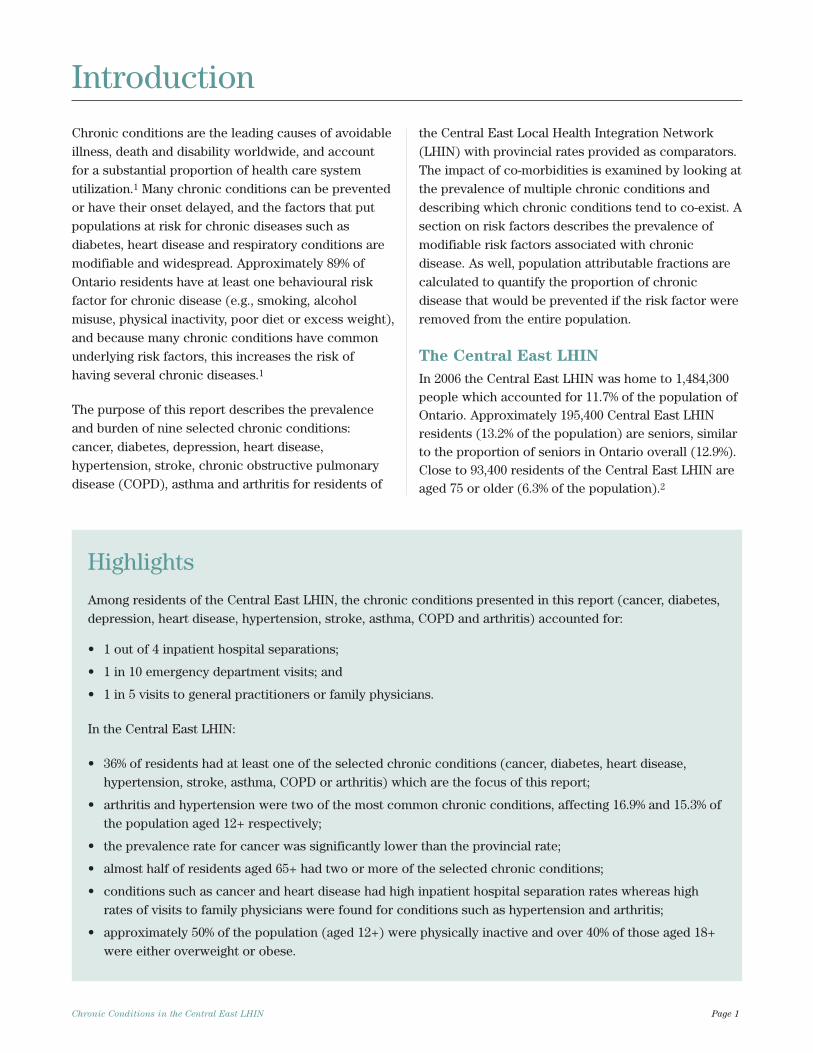
Chronic conditions are the leading causes of avoidableillness, death and disability worldwide, and accountfor a substantial proportion of health care systemutilization.1 Many chronic conditions can be preventedor have their onset delayed, and the factors that putpopulations at risk for chronic diseases such asdiabetes, heart disease and respiratory conditions aremodifiable and widespread. Approximately 89% ofOntario residents have at least one behavioural riskfactor for chronic disease (e.g., smoking, alcoholmisuse, physical inactivity, poor diet or excess weight),and because many chronic conditions have commonunderlying risk factors, this increases the risk ofhaving several chronic diseases.1
The purpose of this report describes the prevalenceand burden of nine selected chronic conditions:cancer, diabetes, depression, heart disease,hypertension, stroke, chronic obstructive pulmonarydisease (COPD), asthma and arthritis for residents of
the Central East Local Health Integration Network(LHIN) with provincial rates provided as comparators.The impact of co-morbidities is examined by looking atthe prevalence of multiple chronic conditions anddescribing which chronic conditions tend to co-exist. Asection on risk factors describes the prevalence ofmodifiable risk factors associated with chronicdisease. As well, population attributable fractions arecalculated to quantify the proportion of chronicdisease that would be prevented if the risk factor wereremoved from the entire population.
The Central East LHIN
In 2006 the Central East LHIN was home to 1,484,300people which accounted for 11.7% of the population ofOntario. Approximately 195,400 Central East LHINresidents (13.2% of the population) are seniors, similarto the proportion of seniors in Ontario overall (12.9%).Close to 93,400 residents of the Central East LHIN areaged 75 or older (6.3% of the population).2
Chronic Conditions in the Central East LHIN Page 1
Introduction
Highlights
Among residents of the Central East LHIN, the chronic conditions presented in this report (cancer, diabetes,depression, heart disease, hypertension, stroke, asthma, COPD and arthritis) accounted for:
• 1 out of 4 inpatient hospital separations;
• 1 in 10 emergency department visits; and
• 1 in 5 visits to general practitioners or family physicians.
In the Central East LHIN:
• 36% of residents had at least one of the selected chronic conditions (cancer, diabetes, heart disease,hypertension, stroke, asthma, COPD or arthritis) which are the focus of this report;
• arthritis and hypertension were two of the most common chronic conditions, affecting 16.9% and 15.3% ofthe population aged 12+ respectively;
• the prevalence rate for cancer was significantly lower than the provincial rate;
• almost half of residents aged 65+ had two or more of the selected chronic conditions;
• conditions such as cancer and heart disease had high inpatient hospital separation rates whereas highrates of visits to family physicians were found for conditions such as hypertension and arthritis;
• approximately 50% of the population (aged 12+) were physically inactive and over 40% of those aged 18+were either overweight or obese.
Unlike acute conditions which have a sudden, sharponset and relatively short duration, chronic conditionsdevelop slowly over time, are long lasting and oftenprogress in severity. While chronic conditions canoften be controlled or managed, they usually cannot becured. Although there is no single standard definitionof chronic disease, definitions typically make referenceto factors such as the duration, prognosis, pattern andsequelae of the disease and may specify the existenceof functional limitations or need for care as part of thecriteria.3 Both Health Canada and the Centers forDisease Control and Prevention have describedchronic diseases as those that have a prolonged
course, do not resolve spontaneously and for which a
complete cure is rarely achieved.4 This definition isfairly broad and inclusive. Conditions that causerelatively few problems, such as acne or seasonalallergies would, under this definition, be consideredchronic diseases.i The Public Health Agency of Canadaalso suggests this alternative definition: “chronic (ornon-communicable) diseases are typicallycharacterized as having an uncertain etiology, multiplerisk factors, long latency, prolonged affliction, a non-infectious origin, and can be associated withimpairments or functional disability.”6
Another more restrictive definition describes chronicdiseases as “diseases which have one or more of thefollowing characteristics: they are permanent, leaveresidual disability, are caused by nonreversiblepathological alteration, require special training of thepatient for rehabilitation, or may be expected torequire a long period of supervision, observation, orcare.”7 Most researchers agree that chronic conditionshave prolonged duration (i.e., of several months), butdifferent studies may use different time intervals suchas three, six or twelve months as the criterion. Someadditional examples of definitions of chronicdisease/conditions are provided in Appendix A.
Not all chronic conditions have the same burden ofillness and many of those who have a chroniccondition have at least one other condition.5,8 Peoplewith multiple chronic conditions (i.e., co-morbidities)
are more likely to have activity limitations, and requiresubstantially more health care compared to peoplewith a single chronic condition.5,9 A detailed analysisof chronic conditions in British Columbia concludedthat chronic conditions tend to cluster in individualsand that there was a consistent trend of increasedhealth care utilization with increasing co-morbidity.The researchers recommend that, in addition tounderstanding the prevalence and impact of individualchronic diseases, health care providers must take intoaccount the broader, complex needs of those who haveco-morbidities.9
A wide range of factors influence the onset andprognosis of chronic conditions. These factors may bebiological, social, environmental, or related to personalhealth practices. Age is a major risk factor for mostchronic conditions10 and one of the main reasons forthe increasing prevalence of chronic conditions is theageing population. With age, people are not only morelikely to acquire a chronic condition but to havemultiple chronic conditions.5 Socio-economic factorsare thought to contribute to the development ofchronic disease on multiple levels (i.e., acting at boththe individual and population level). Those who aresocio-economically disadvantaged are often found tobe at higher risk for many chronic conditions.11-13
Although this may be partly explained by the higherprevalence of modifiable risk factors among those withlow income or low educational attainment, socio-economic status itself has also been established as anindependent risk factor for chronic disease.13
Behavioural risk factors—those related to healthpractices—are particularly important because they aremodifiable. These risk factors also give rise tointermediate risk factors such as obesity, high bloodpressure and high serum cholesterol.14 Changes in theprevalence of risk factors such as smoking, alcoholmisuse, obesity, physical inactivity and poor diet canlead to substantial reductions in the burden of chronicdisease. Many behavioural risk factors are linked tomore than one chronic condition, and moreover, manyrisk factors co-exist and interact with one another.15
Page 2 Chronic Conditions in the Central East LHIN
Overview of Chronic Conditions
i The terms ‘chronic disease’ and ‘chronic conditions’ are often used interchangeably and this may account for some of the variations in definitions. One reportsuggests that chronic conditions is a general term that includes both chronic illnesses (disease) and impairments.5
This report focuses on selected chronic conditions forwhich prevalence data were available namely cancer,diabetes, depression, heart disease, hypertension,stroke, COPD, asthma and arthritis. These have beenidentified by others as having high prevalence and/orbeing high impact conditions that are not only leadingcauses of illness, death, and disability but also place asignificant burden on individuals, families and thehealth care system.5,16,17 Furthermore, many of theseconditions have common underlying modifiable riskfactors which, if mitigated, might prevent or delay theonset of disease. Some conditions such as renaldisease and osteoporosis are important chronicconditions but could not be examined becauseprevalence data were not available. On the other hand,conditions such as migraine headaches or allergies arehighly prevalent but were not considered for detailedanalysis because of their lack of correspondence tospecific diagnosis codes in hospitalization andmortality datasets. We also examine the prevalence ofmodifiable risk factors and their contribution to theselected chronic conditions presented in this report,including smoking, alcohol misuse, physical inactivity,poor diet and overweight/obesity.
With the exception of depression, data from the 2005Canadian Community Health Survey (CCHS) cycle3.118 were used to describe the prevalence of chronic
conditions and their risk factors. These are based onself-reports. Depression related questions were notcollected across all Ontario regions in either cycles 2.1or 3.1 of the CCHS but were available from the CCHS1.2 (Mental Health and Well-being; 2002).19 By usingdata from the CCHS 1.2 we were able to examine theoverall prevalence of depression for the Central EastLHIN, but only able to provide age and sex specificprevalence estimates at the provincial level. Also, wewere unable to examine the co-morbidity ofdepression along with the other selected conditions.Confidence intervals (95%) were calculated for allsurvey based prevalence estimates and are shown aserror bars in figures. Age-specific mortality, acuteinpatient hospital separation, emergency department(ED) and general practitioner/family physician(GP/FP) utilization rates were calculated using themost recent data available from the Ontario Ministry ofHealth and Long-Term Care’s Provincial HealthPlanning Database (PHPDB).2 These provide anindication of the impact of the disease on the healthcare system as well as a sense of the burden ofdisease. Rates are provided for Central East LHINresidents with provincial numbers provided ascomparators. Detailed technical notes on methods canbe found in Appendix B.
Chronic Conditions in the Central East LHIN Page 3
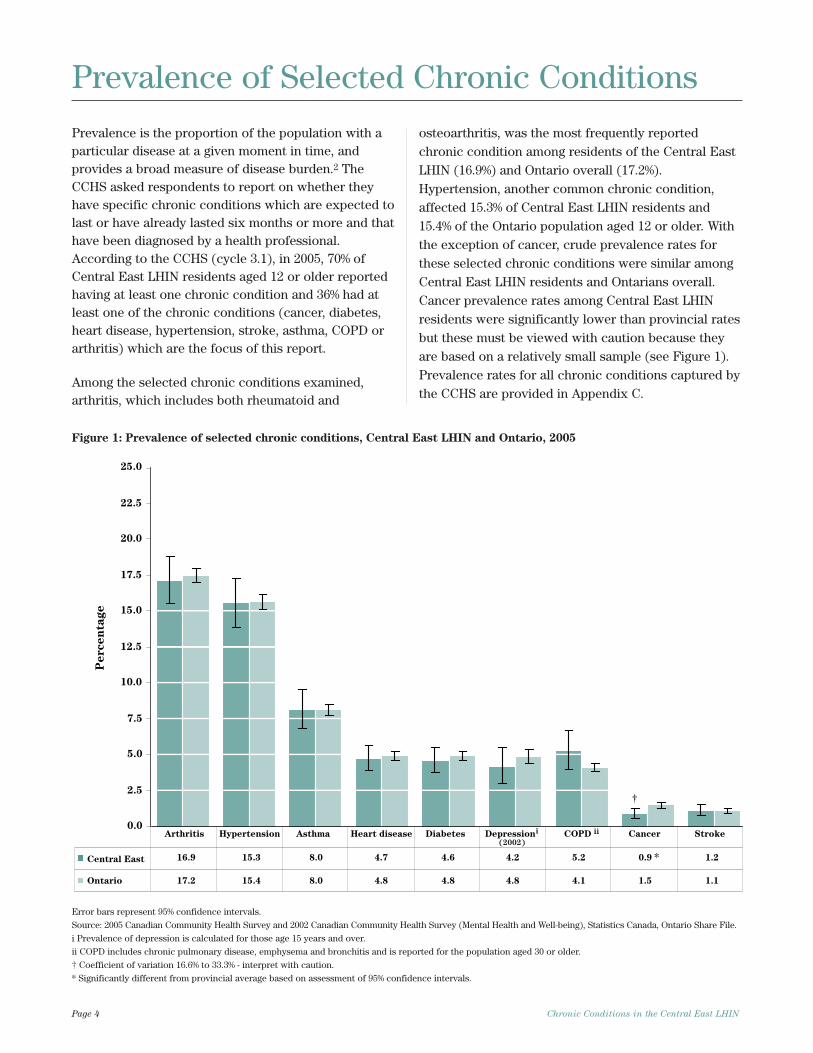
Prevalence is the proportion of the population with aparticular disease at a given moment in time, andprovides a broad measure of disease burden.2 TheCCHS asked respondents to report on whether theyhave specific chronic conditions which are expected tolast or have already lasted six months or more and thathave been diagnosed by a health professional.According to the CCHS (cycle 3.1), in 2005, 70% ofCentral East LHIN residents aged 12 or older reportedhaving at least one chronic condition and 36% had atleast one of the chronic conditions (cancer, diabetes,heart disease, hypertension, stroke, asthma, COPD orarthritis) which are the focus of this report.
Among the selected chronic conditions examined,arthritis, which includes both rheumatoid and
osteoarthritis, was the most frequently reportedchronic condition among residents of the Central EastLHIN (16.9%) and Ontario overall (17.2%).Hypertension, another common chronic condition,affected 15.3% of Central East LHIN residents and15.4% of the Ontario population aged 12 or older. Withthe exception of cancer, crude prevalence rates forthese selected chronic conditions were similar amongCentral East LHIN residents and Ontarians overall.Cancer prevalence rates among Central East LHINresidents were significantly lower than provincial ratesbut these must be viewed with caution because theyare based on a relatively small sample (see Figure 1).Prevalence rates for all chronic conditions captured bythe CCHS are provided in Appendix C.
Page 4 Chronic Conditions in the Central East LHIN
Prevalence of Selected Chronic Conditions e
gat
ne
cr
eP
Central East
Ontario
Arthritis Hypertension Asthma Heart disease Diabetes Depression COPD Cancer Strokeii
(2002)
i
17.2 15.4 8.0 4.8 4.8 4.8 4.1 1.5 1.1
16.9 15.3 8.0 4.7 4.6 4.2 5.2 0.9 1.2
†
0.0
2.5
5.0
7.5
10.0
12.5
15.0
17.5
20.0
22.5
25.0
*
Figure 1: Prevalence of selected chronic conditions, Central East LHIN and Ontario, 2005
Error bars represent 95% confidence intervals.
Source: 2005 Canadian Community Health Survey and 2002 Canadian Community Health Survey (Mental Health and Well-being), Statistics Canada, Ontario Share File.
i Prevalence of depression is calculated for those age 15 years and over.
ii COPD includes chronic pulmonary disease, emphysema and bronchitis and is reported for the population aged 30 or older.
† Coefficient of variation 16.6% to 33.3% - interpret with caution.
* Significantly different from provincial average based on assessment of 95% confidence intervals.
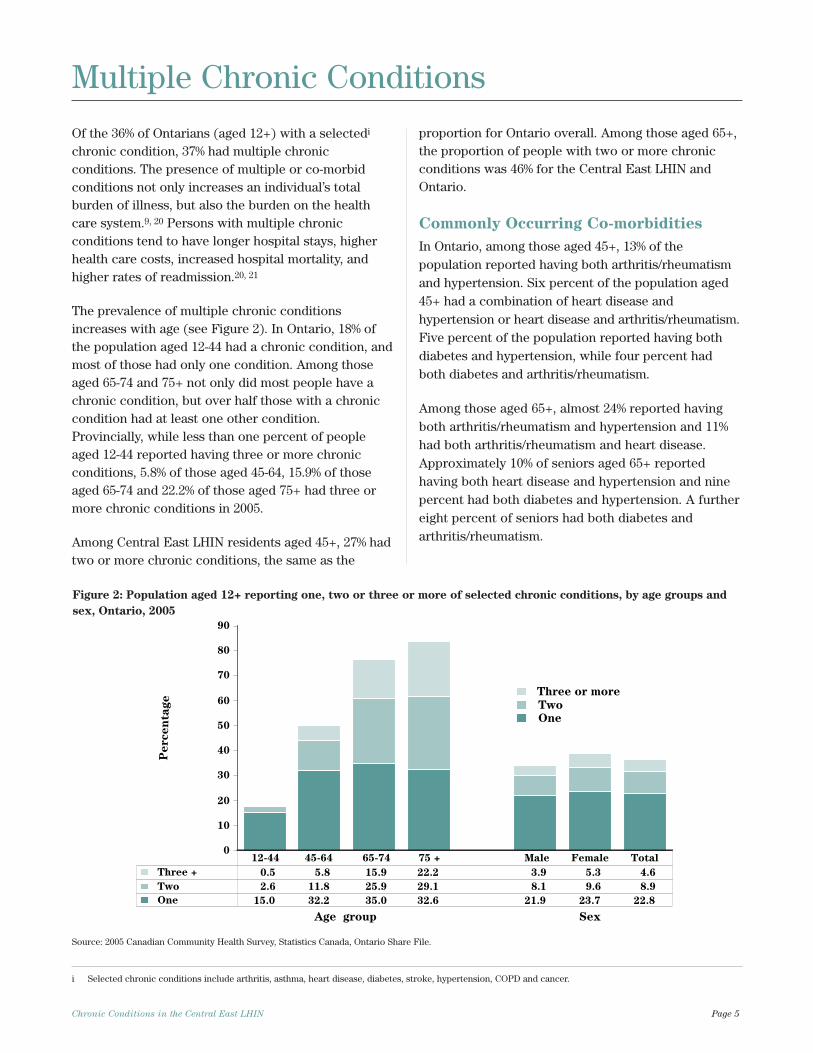
Of the 36% of Ontarians (aged 12+) with a selectedi
chronic condition, 37% had multiple chronicconditions. The presence of multiple or co-morbidconditions not only increases an individual’s totalburden of illness, but also the burden on the healthcare system.9, 20 Persons with multiple chronicconditions tend to have longer hospital stays, higherhealth care costs, increased hospital mortality, andhigher rates of readmission.20, 21
The prevalence of multiple chronic conditionsincreases with age (see Figure 2). In Ontario, 18% ofthe population aged 12-44 had a chronic condition, andmost of those had only one condition. Among thoseaged 65-74 and 75+ not only did most people have achronic condition, but over half those with a chroniccondition had at least one other condition.Provincially, while less than one percent of peopleaged 12-44 reported having three or more chronicconditions, 5.8% of those aged 45-64, 15.9% of thoseaged 65-74 and 22.2% of those aged 75+ had three ormore chronic conditions in 2005.
Among Central East LHIN residents aged 45+, 27% hadtwo or more chronic conditions, the same as the
proportion for Ontario overall. Among those aged 65+,the proportion of people with two or more chronicconditions was 46% for the Central East LHIN andOntario.
Commonly Occurring Co-morbidities
In Ontario, among those aged 45+, 13% of thepopulation reported having both arthritis/rheumatismand hypertension. Six percent of the population aged45+ had a combination of heart disease andhypertension or heart disease and arthritis/rheumatism.Five percent of the population reported having bothdiabetes and hypertension, while four percent hadboth diabetes and arthritis/rheumatism.
Among those aged 65+, almost 24% reported havingboth arthritis/rheumatism and hypertension and 11%had both arthritis/rheumatism and heart disease.Approximately 10% of seniors aged 65+ reportedhaving both heart disease and hypertension and ninepercent had both diabetes and hypertension. A furthereight percent of seniors had both diabetes andarthritis/rheumatism.
Chronic Conditions in the Central East LHIN Page 5
Figure 2: Population aged 12+ reporting one, two or three or more of selected chronic conditions, by age groups and
sex, Ontario, 2005
Multiple Chronic Conditions
i Selected chronic conditions include arthritis, asthma, heart disease, diabetes, stroke, hypertension, COPD and cancer.
0
10
20
30
40
50
60
70
80
90
Age group Sex
Three or more
Two
One
Three + 0.5 5.8 15.9 22.2 3.9 5.3 4.6
Two 2.6 11.8 25.9 29.1 8.1 9.6 8.9
One 15.0 32.2 35.0 32.6 21.9 23.7 22.8
12-44 45-64 65-74 75 + Male Female Total
eg
atn
ec
re
P
Source: 2005 Canadian Community Health Survey, Statistics Canada, Ontario Share File.
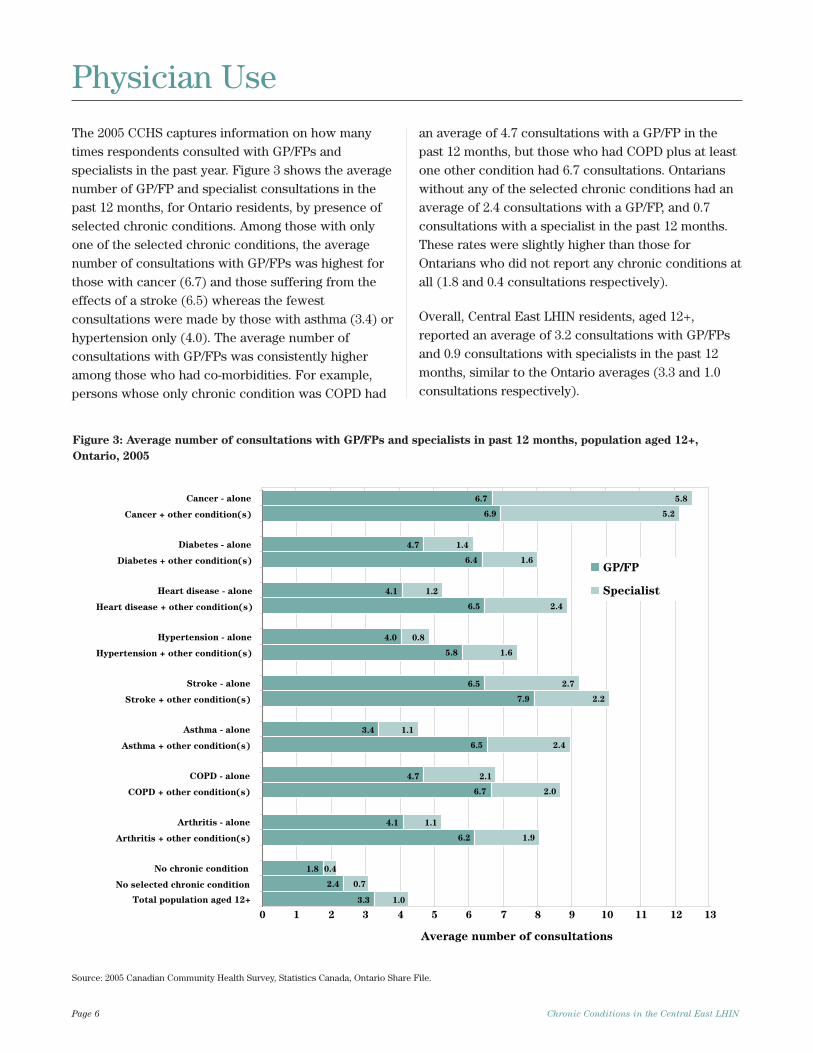
The 2005 CCHS captures information on how manytimes respondents consulted with GP/FPs andspecialists in the past year. Figure 3 shows the averagenumber of GP/FP and specialist consultations in thepast 12 months, for Ontario residents, by presence ofselected chronic conditions. Among those with onlyone of the selected chronic conditions, the averagenumber of consultations with GP/FPs was highest forthose with cancer (6.7) and those suffering from theeffects of a stroke (6.5) whereas the fewestconsultations were made by those with asthma (3.4) orhypertension only (4.0). The average number ofconsultations with GP/FPs was consistently higheramong those who had co-morbidities. For example,persons whose only chronic condition was COPD had
an average of 4.7 consultations with a GP/FP in thepast 12 months, but those who had COPD plus at leastone other condition had 6.7 consultations. Ontarianswithout any of the selected chronic conditions had anaverage of 2.4 consultations with a GP/FP, and 0.7consultations with a specialist in the past 12 months.These rates were slightly higher than those forOntarians who did not report any chronic conditions atall (1.8 and 0.4 consultations respectively).
Overall, Central East LHIN residents, aged 12+,reported an average of 3.2 consultations with GP/FPsand 0.9 consultations with specialists in the past 12months, similar to the Ontario averages (3.3 and 1.0consultations respectively).
Page 6 Chronic Conditions in the Central East LHIN
Physician Use
Average number of consultations
0 1 2 3 4 5 6 7 8 9 10 11 12 13
Cancer - alone
Cancer + other condition(s)
Diabetes - alone
Diabetes + other condition(s)
Heart disease - alone
Heart disease + other condition(s)
Hypertension - alone
Hypertension + other condition(s)
Stroke - alone
Stroke + other condition(s)
Asthma - alone
Asthma + other condition(s)
COPD - alone
COPD + other condition(s)
Arthritis - alone
Arthritis + other condition(s)
No chronic condition
No selected chronic condition
Total population aged 12+
GP/FP
Specialist
6.7
6.9
4.7
6.4
4.1
6.5
4.0
5.8
6.5
7.9
3.4
6.5
4.7
4.1
6.2
1.8
2.4
3.3
5.8
5.2
1.4
1.6
1.2
2.4
0.8
1.6
2.7
2.2
1.1
2.4
2.1
2.0
1.1
1.9
0.4
0.7
1.0
6.7
Figure 3: Average number of consultations with GP/FPs and specialists in past 12 months, population aged 12+,
Ontario, 2005
Source: 2005 Canadian Community Health Survey, Statistics Canada, Ontario Share File.
This section examines the burden of illness associated with each selected chroniccondition in greater detail. Prevalence rates, based on 2005 CCHS data (cycle 3.1),are shown in figures with 95% confidence intervals (indicated by error bars in thefigures). The estimated prevalence of cancer, diabetes, depression, heart disease,hypertension, stroke, asthma, COPD and arthritis is based on self-reports to CCHSquestions that asked respondents about long-term conditions, diagnosed by ahealth professional, which are expected to last or have already lasted six or moremonths. Mortalityi, inpatient hospital separation, ED visit, and GP/FP visit datawere obtained from the PHPDB.2 Mortality and health service utilization cruderates, stratified by age and sex, were calculated per 100,000 population forresidents of the Central East LHIN and are provided in tables. Ontario values areprovided as comparators.
The presence of co-morbid conditions was examined for each chronic condition.Note that this analysis only includes the ‘selected conditions’ considered in thisreport. Therefore the percentage of people with cancer and another chroniccondition refers specifically to those that have hypertension, heart disease, stroke,diabetes, asthma, COPD or arthritis/rheumatism in addition to cancer. Depressionwas not included in the examination of co-morbidity, as it was not asked in the 3.1cycle of the CCHS.
Chronic Conditions in the Central East LHIN Page 7
A Closer Look atSelected ChronicConditions
i Mortality rates for the Central East LHIN area are not provided because the data are incomplete (see Appendix B).
Cancer (i.e., malignant neoplasms excluding skincancers and benign tumors) is a leading cause of deathin Ontario: it accounted for 29% of deaths in 2003.2
Among Ontario males, prostate, colorectal and lungcancers accounted for 54% of new cases and 48% ofcancer deaths in 2003. Among females, breast, lungand colorectal cancers accounted for 51% of new casesand 48% of cancer deaths.2,22 The burden of cancer canbe substantially decreased through reducingbehavioural risk factors, early detection of somecancers through screening, and through treatment.According to the World Health Organization, 40% ofcancers can be prevented by a healthy diet, physicalactivity and not using tobacco. In fact, tobacco use isthe single largest preventable cause of cancer in theworld. An additional third of the cancer burden couldbe reduced through early detection and treatment.23
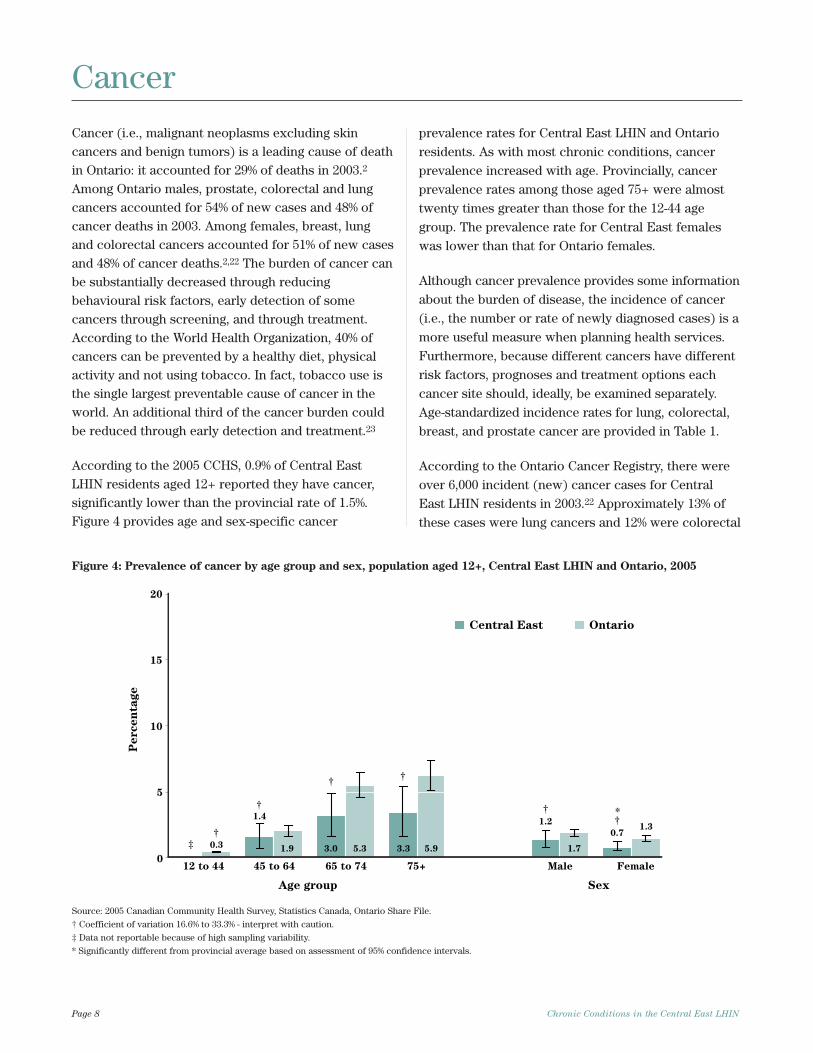
According to the 2005 CCHS, 0.9% of Central EastLHIN residents aged 12+ reported they have cancer,significantly lower than the provincial rate of 1.5%.Figure 4 provides age and sex-specific cancer
prevalence rates for Central East LHIN and Ontarioresidents. As with most chronic conditions, cancerprevalence increased with age. Provincially, cancerprevalence rates among those aged 75+ were almosttwenty times greater than those for the 12-44 agegroup. The prevalence rate for Central East femaleswas lower than that for Ontario females.
Although cancer prevalence provides some informationabout the burden of disease, the incidence of cancer(i.e., the number or rate of newly diagnosed cases) is amore useful measure when planning health services.Furthermore, because different cancers have differentrisk factors, prognoses and treatment options eachcancer site should, ideally, be examined separately.Age-standardized incidence rates for lung, colorectal,breast, and prostate cancer are provided in Table 1.
According to the Ontario Cancer Registry, there wereover 6,000 incident (new) cancer cases for CentralEast LHIN residents in 2003.22 Approximately 13% ofthese cases were lung cancers and 12% were colorectal
Page 8 Chronic Conditions in the Central East LHIN
Cancer
12 to 44 45 to 64 65 to 74 75+ Male Female
Age group Sex
eg
atn
ec
re
P
0
5
10
15
20
Central East Ontario
†
‡
†
†
††
†
0.3 1.9 5.3 5.9 1.7
1.3
1.4
3.0 3.3
1.2
0.7
*
Figure 4: Prevalence of cancer by age group and sex, population aged 12+, Central East LHIN and Ontario, 2005
Source: 2005 Canadian Community Health Survey, Statistics Canada, Ontario Share File.
† Coefficient of variation 16.6% to 33.3% - interpret with caution.
‡ Data not reportable because of high sampling variability.
* Significantly different from provincial average based on assessment of 95% confidence intervals.
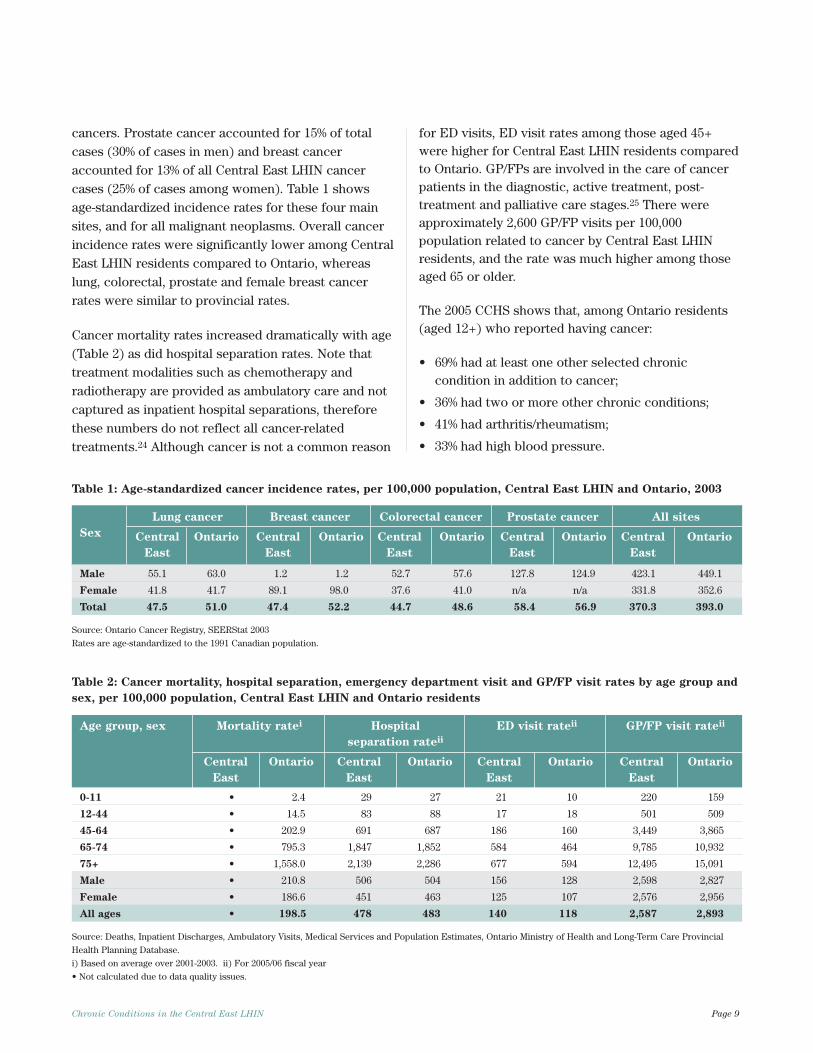
cancers. Prostate cancer accounted for 15% of totalcases (30% of cases in men) and breast canceraccounted for 13% of all Central East LHIN cancercases (25% of cases among women). Table 1 showsage-standardized incidence rates for these four mainsites, and for all malignant neoplasms. Overall cancerincidence rates were significantly lower among CentralEast LHIN residents compared to Ontario, whereaslung, colorectal, prostate and female breast cancerrates were similar to provincial rates.
Cancer mortality rates increased dramatically with age(Table 2) as did hospital separation rates. Note thattreatment modalities such as chemotherapy andradiotherapy are provided as ambulatory care and notcaptured as inpatient hospital separations, thereforethese numbers do not reflect all cancer-relatedtreatments.24 Although cancer is not a common reason
for ED visits, ED visit rates among those aged 45+were higher for Central East LHIN residents comparedto Ontario. GP/FPs are involved in the care of cancerpatients in the diagnostic, active treatment, post-treatment and palliative care stages.25 There wereapproximately 2,600 GP/FP visits per 100,000population related to cancer by Central East LHINresidents, and the rate was much higher among thoseaged 65 or older.
The 2005 CCHS shows that, among Ontario residents(aged 12+) who reported having cancer:
• 69% had at least one other selected chroniccondition in addition to cancer;
• 36% had two or more other chronic conditions;
• 41% had arthritis/rheumatism;
• 33% had high blood pressure.
Chronic Conditions in the Central East LHIN Page 9
Table 1: Age-standardized cancer incidence rates, per 100,000 population, Central East LHIN and Ontario, 2003
Lung cancer Breast cancer Colorectal cancer Prostate cancer All sites
Sex Central Ontario Central Ontario Central Ontario Central Ontario Central Ontario
East East East East East
Male 55.1 63.0 1.2 1.2 52.7 57.6 127.8 124.9 423.1 449.1
Female 41.8 41.7 89.1 98.0 37.6 41.0 n/a n/a 331.8 352.6
Total 47.5 51.0 47.4 52.2 44.7 48.6 58.4 56.9 370.3 393.0
Source: Ontario Cancer Registry, SEERStat 2003
Rates are age-standardized to the 1991 Canadian population.
Table 2: Cancer mortality, hospital separation, emergency department visit and GP/FP visit rates by age group and
sex, per 100,000 population, Central East LHIN and Ontario residents
Age group, sex Mortality ratei Hospital ED visit rateii GP/FP visit rateii
separation rateii
Central Ontario Central Ontario Central Ontario Central Ontario
East East East East
0-11 • 2.4 29 27 21 10 220 159
12-44 • 14.5 83 88 17 18 501 509
45-64 • 202.9 691 687 186 160 3,449 3,865
65-74 • 795.3 1,847 1,852 584 464 9,785 10,932
75+ • 1,558.0 2,139 2,286 677 594 12,495 15,091
Male • 210.8 506 504 156 128 2,598 2,827
Female • 186.6 451 463 125 107 2,576 2,956
All ages • 198.5 478 483 140 118 2,587 2,893
Source: Deaths, Inpatient Discharges, Ambulatory Visits, Medical Services and Population Estimates, Ontario Ministry of Health and Long-Term Care Provincial
Health Planning Database.
i) Based on average over 2001-2003. ii) For 2005/06 fiscal year
• Not calculated due to data quality issues.
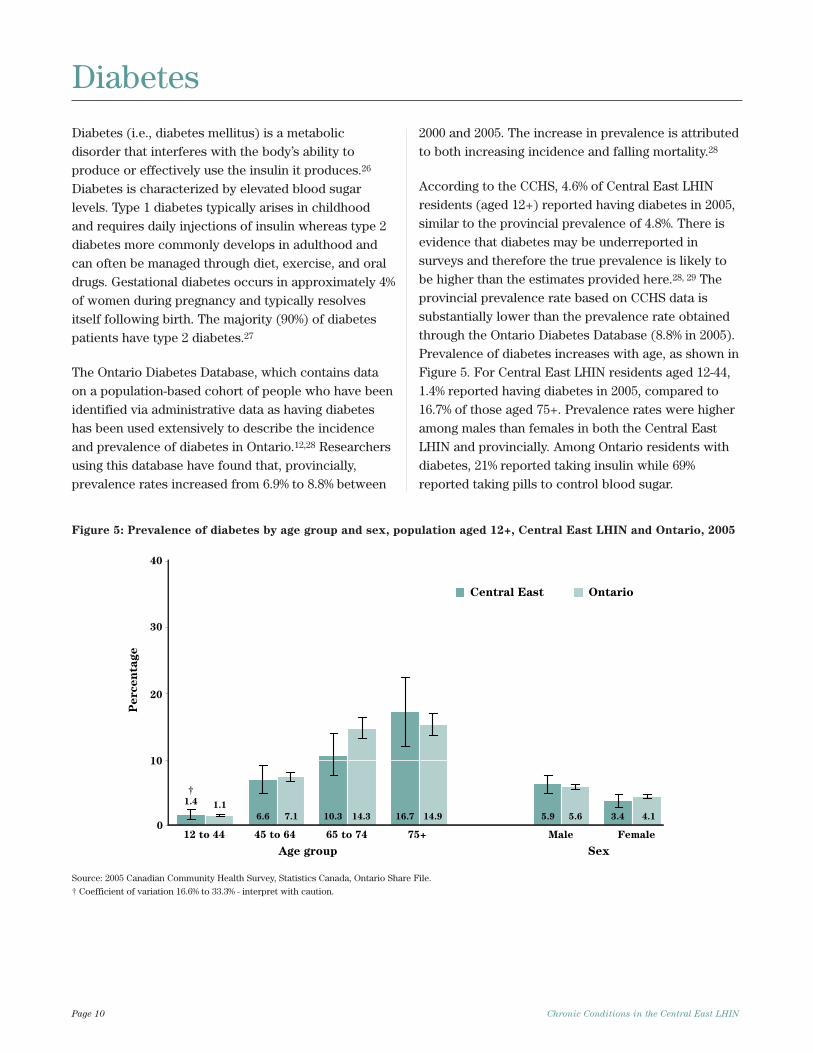
Diabetes (i.e., diabetes mellitus) is a metabolicdisorder that interferes with the body’s ability toproduce or effectively use the insulin it produces.26
Diabetes is characterized by elevated blood sugarlevels. Type 1 diabetes typically arises in childhoodand requires daily injections of insulin whereas type 2diabetes more commonly develops in adulthood andcan often be managed through diet, exercise, and oraldrugs. Gestational diabetes occurs in approximately 4%of women during pregnancy and typically resolvesitself following birth. The majority (90%) of diabetespatients have type 2 diabetes.27
The Ontario Diabetes Database, which contains dataon a population-based cohort of people who have beenidentified via administrative data as having diabeteshas been used extensively to describe the incidenceand prevalence of diabetes in Ontario.12,28 Researchersusing this database have found that, provincially,prevalence rates increased from 6.9% to 8.8% between
2000 and 2005. The increase in prevalence is attributedto both increasing incidence and falling mortality.28
According to the CCHS, 4.6% of Central East LHINresidents (aged 12+) reported having diabetes in 2005,similar to the provincial prevalence of 4.8%. There isevidence that diabetes may be underreported insurveys and therefore the true prevalence is likely tobe higher than the estimates provided here.28, 29 Theprovincial prevalence rate based on CCHS data issubstantially lower than the prevalence rate obtainedthrough the Ontario Diabetes Database (8.8% in 2005).Prevalence of diabetes increases with age, as shown inFigure 5. For Central East LHIN residents aged 12-44,1.4% reported having diabetes in 2005, compared to16.7% of those aged 75+. Prevalence rates were higheramong males than females in both the Central EastLHIN and provincially. Among Ontario residents withdiabetes, 21% reported taking insulin while 69%reported taking pills to control blood sugar.
Page 10 Chronic Conditions in the Central East LHIN
0
10
20
30
40
12 to 44 45 to 64 65 to 74 75+ Male Female
Age group Sex
eg
atn
ec
re
P
Central East Ontario
†
1.1
7.1 14.3 14.9 5.6 4.1
1.4
6.6 10.3 16.7 5.9 3.4
Figure 5: Prevalence of diabetes by age group and sex, population aged 12+, Central East LHIN and Ontario, 2005
Source: 2005 Canadian Community Health Survey, Statistics Canada, Ontario Share File.
† Coefficient of variation 16.6% to 33.3% - interpret with caution.
Diabetes
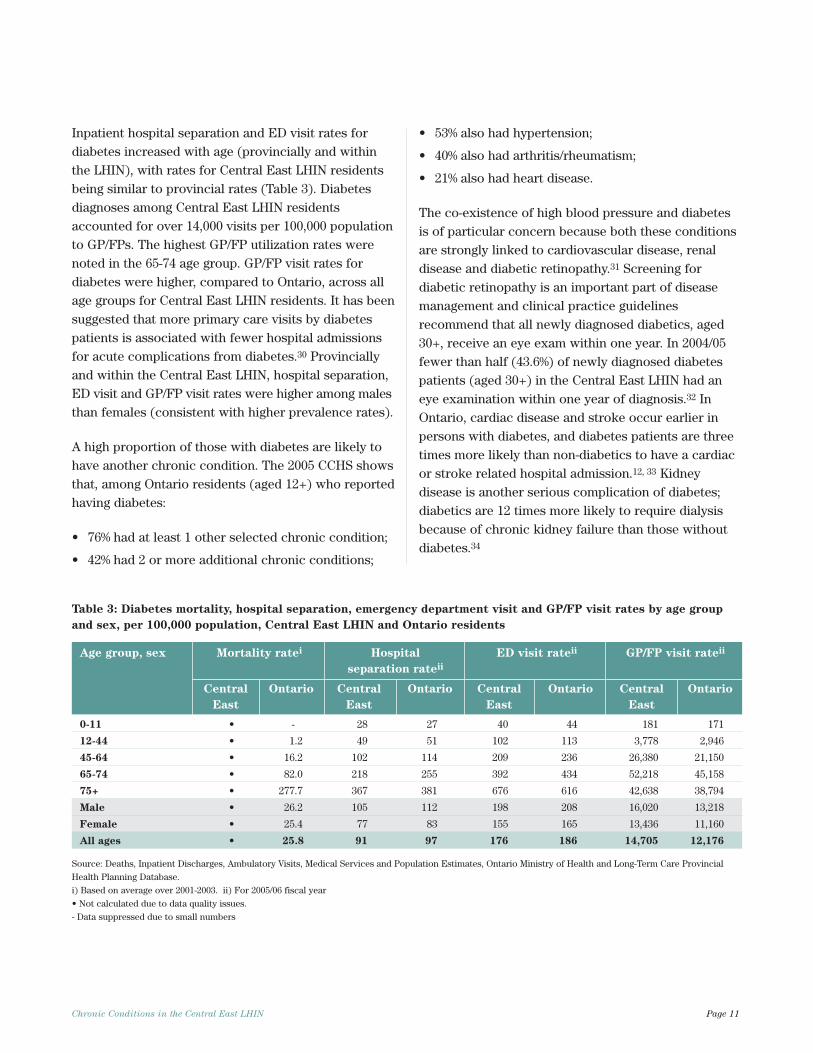
Inpatient hospital separation and ED visit rates fordiabetes increased with age (provincially and withinthe LHIN), with rates for Central East LHIN residentsbeing similar to provincial rates (Table 3). Diabetesdiagnoses among Central East LHIN residentsaccounted for over 14,000 visits per 100,000 populationto GP/FPs. The highest GP/FP utilization rates werenoted in the 65-74 age group. GP/FP visit rates fordiabetes were higher, compared to Ontario, across allage groups for Central East LHIN residents. It has beensuggested that more primary care visits by diabetespatients is associated with fewer hospital admissionsfor acute complications from diabetes.30 Provinciallyand within the Central East LHIN, hospital separation,ED visit and GP/FP visit rates were higher among malesthan females (consistent with higher prevalence rates).
A high proportion of those with diabetes are likely tohave another chronic condition. The 2005 CCHS showsthat, among Ontario residents (aged 12+) who reportedhaving diabetes:
• 76% had at least 1 other selected chronic condition;
• 42% had 2 or more additional chronic conditions;
• 53% also had hypertension;
• 40% also had arthritis/rheumatism;
• 21% also had heart disease.
The co-existence of high blood pressure and diabetesis of particular concern because both these conditionsare strongly linked to cardiovascular disease, renaldisease and diabetic retinopathy.31 Screening fordiabetic retinopathy is an important part of diseasemanagement and clinical practice guidelinesrecommend that all newly diagnosed diabetics, aged30+, receive an eye exam within one year. In 2004/05fewer than half (43.6%) of newly diagnosed diabetespatients (aged 30+) in the Central East LHIN had aneye examination within one year of diagnosis.32 InOntario, cardiac disease and stroke occur earlier inpersons with diabetes, and diabetes patients are threetimes more likely than non-diabetics to have a cardiacor stroke related hospital admission.12, 33 Kidneydisease is another serious complication of diabetes;diabetics are 12 times more likely to require dialysisbecause of chronic kidney failure than those withoutdiabetes.34
Chronic Conditions in the Central East LHIN Page 11
Table 3: Diabetes mortality, hospital separation, emergency department visit and GP/FP visit rates by age group
and sex, per 100,000 population, Central East LHIN and Ontario residents
Age group, sex Mortality ratei Hospital ED visit rateii GP/FP visit rateii
separation rateii
Central Ontario Central Ontario Central Ontario Central Ontario
East East East East
0-11 • - 28 27 40 44 181 171
12-44 • 1.2 49 51 102 113 3,778 2,946
45-64 • 16.2 102 114 209 236 26,380 21,150
65-74 • 82.0 218 255 392 434 52,218 45,158
75+ • 277.7 367 381 676 616 42,638 38,794
Male • 26.2 105 112 198 208 16,020 13,218
Female • 25.4 77 83 155 165 13,436 11,160
All ages • 25.8 91 97 176 186 14,705 12,176
Source: Deaths, Inpatient Discharges, Ambulatory Visits, Medical Services and Population Estimates, Ontario Ministry of Health and Long-Term Care Provincial
Health Planning Database.
i) Based on average over 2001-2003. ii) For 2005/06 fiscal year
• Not calculated due to data quality issues.
- Data suppressed due to small numbers

Depression is a complex chronic mental disorder. Itcan have a variety of symptoms that interfere with theability to work, sleep, study or enjoy activities.Genetics, psychological, biological or social factorsmay increase susceptibility to depression. Thepresence of other chronic conditions may actuallycontribute to the onset or worsening of depression.35
Cycle 1.2 of the CCHS (Mental Health and Well-being)contains data on the prevalence of selected mentaldisorders among Ontarians aged 15 or older. In 2002,4.2% of Central East LHIN residents (aged 15+)reported they had experienced feelings or symptoms
associated with a major depressive episode within thepast 12 months, similar to the Ontario prevalence of4.8%. A major depressive episode is defined as “aperiod of two weeks or more with persistentdepressed mood and loss of interest or pleasure innormal activities, accompanied by symptoms such asdecreased energy, changes in sleep and appetite,impaired concentration, and feelings of guilt,hopelessness or suicidal thought”.19
Unlike many other chronic conditions, prevalencerates for depression were higher in the younger agegroups (see Figure 6). Among Ontarians aged 15-44
Page 12 Chronic Conditions in the Central East LHIN
15 to 44 45 to 64 65 to 74 75+ Male Female
Age group Sex
eg
atn
ec
re
P
0
5
10
15
20
† †
5.7 4.6
1.8 1.7
3.5 6.1
Figure 6: Prevalence of depression by age group and sex, population aged 15+, Ontario, 2002
Source: 2002 Canadian Community Health Survey (Mental Health and Well-being), Statistics Canada, Ontario Share File.
† Coefficient of variation 16.6% to 33.3% - interpret with caution.
Depression
years, 5.7% had a major depressive episode in the past12 months, compared to 1.8% of those aged 65+. Theprevalence of depression was also significantly higheramong Ontario females (6.1%) compared to males(3.5%).
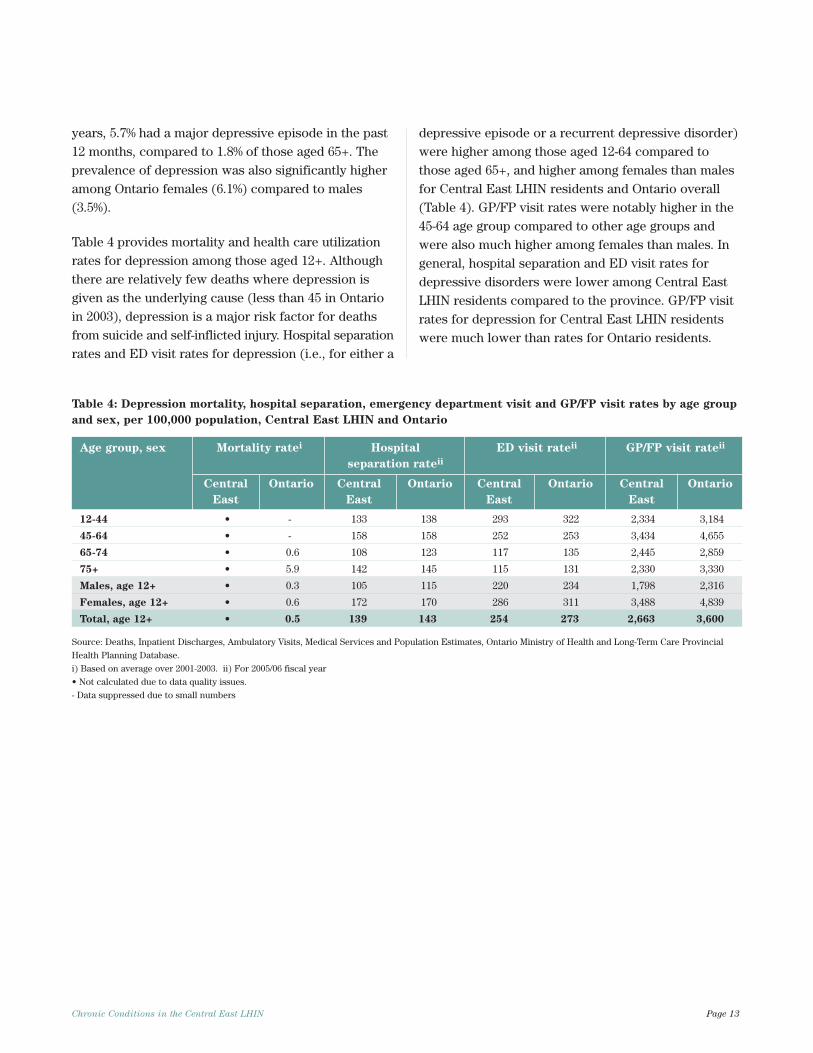
Table 4 provides mortality and health care utilizationrates for depression among those aged 12+. Althoughthere are relatively few deaths where depression isgiven as the underlying cause (less than 45 in Ontarioin 2003), depression is a major risk factor for deathsfrom suicide and self-inflicted injury. Hospital separationrates and ED visit rates for depression (i.e., for either a
depressive episode or a recurrent depressive disorder)were higher among those aged 12-64 compared tothose aged 65+, and higher among females than malesfor Central East LHIN residents and Ontario overall(Table 4). GP/FP visit rates were notably higher in the45-64 age group compared to other age groups andwere also much higher among females than males. Ingeneral, hospital separation and ED visit rates fordepressive disorders were lower among Central EastLHIN residents compared to the province. GP/FP visitrates for depression for Central East LHIN residentswere much lower than rates for Ontario residents.
Chronic Conditions in the Central East LHIN Page 13
Table 4: Depression mortality, hospital separation, emergency department visit and GP/FP visit rates by age group
and sex, per 100,000 population, Central East LHIN and Ontario
Age group, sex Mortality ratei Hospital ED visit rateii GP/FP visit rateii
separation rateii
Central Ontario Central Ontario Central Ontario Central Ontario
East East East East
12-44 • - 133 138 293 322 2,334 3,184
45-64 • - 158 158 252 253 3,434 4,655
65-74 • 0.6 108 123 117 135 2,445 2,859
75+ • 5.9 142 145 115 131 2,330 3,330
Males, age 12+ • 0.3 105 115 220 234 1,798 2,316
Females, age 12+ • 0.6 172 170 286 311 3,488 4,839
Total, age 12+ • 0.5 139 143 254 273 2,663 3,600
Source: Deaths, Inpatient Discharges, Ambulatory Visits, Medical Services and Population Estimates, Ontario Ministry of Health and Long-Term Care Provincial
Health Planning Database.
i) Based on average over 2001-2003. ii) For 2005/06 fiscal year
• Not calculated due to data quality issues.
- Data suppressed due to small numbers
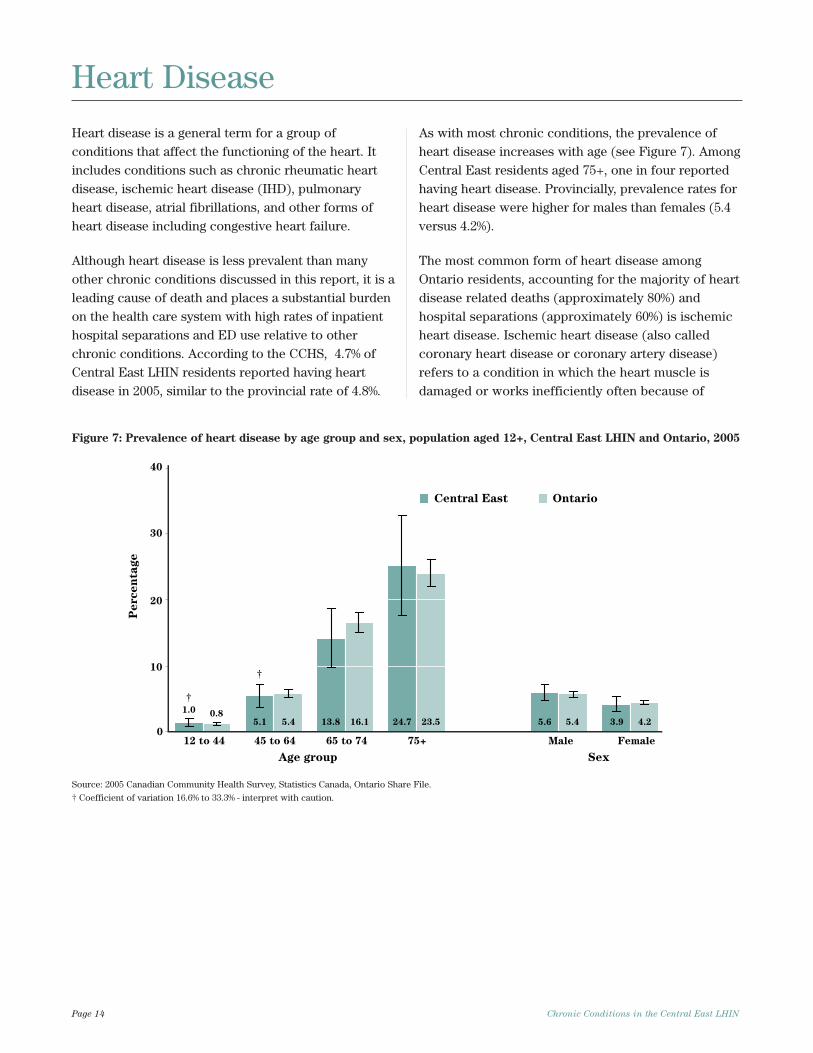
Heart disease is a general term for a group ofconditions that affect the functioning of the heart. Itincludes conditions such as chronic rheumatic heartdisease, ischemic heart disease (IHD), pulmonaryheart disease, atrial fibrillations, and other forms ofheart disease including congestive heart failure.
Although heart disease is less prevalent than manyother chronic conditions discussed in this report, it is aleading cause of death and places a substantial burdenon the health care system with high rates of inpatienthospital separations and ED use relative to otherchronic conditions. According to the CCHS, 4.7% ofCentral East LHIN residents reported having heartdisease in 2005, similar to the provincial rate of 4.8%.
As with most chronic conditions, the prevalence ofheart disease increases with age (see Figure 7). AmongCentral East residents aged 75+, one in four reportedhaving heart disease. Provincially, prevalence rates forheart disease were higher for males than females (5.4versus 4.2%).
The most common form of heart disease amongOntario residents, accounting for the majority of heartdisease related deaths (approximately 80%) andhospital separations (approximately 60%) is ischemicheart disease. Ischemic heart disease (also calledcoronary heart disease or coronary artery disease)refers to a condition in which the heart muscle isdamaged or works inefficiently often because of
Page 14 Chronic Conditions in the Central East LHIN
0
10
20
30
40
12 to 44 45 to 64 65 to 74 75+ Male Female
Age group Sex
eg
atn
ec
re
P
Central East Ontario
†
†
0.85.4 16.1 23.5 5.4 4.2
1.0
5.1 13.8 24.7 5.6 3.9
Figure 7: Prevalence of heart disease by age group and sex, population aged 12+, Central East LHIN and Ontario, 2005
Source: 2005 Canadian Community Health Survey, Statistics Canada, Ontario Share File.
† Coefficient of variation 16.6% to 33.3% - interpret with caution.
Heart Disease
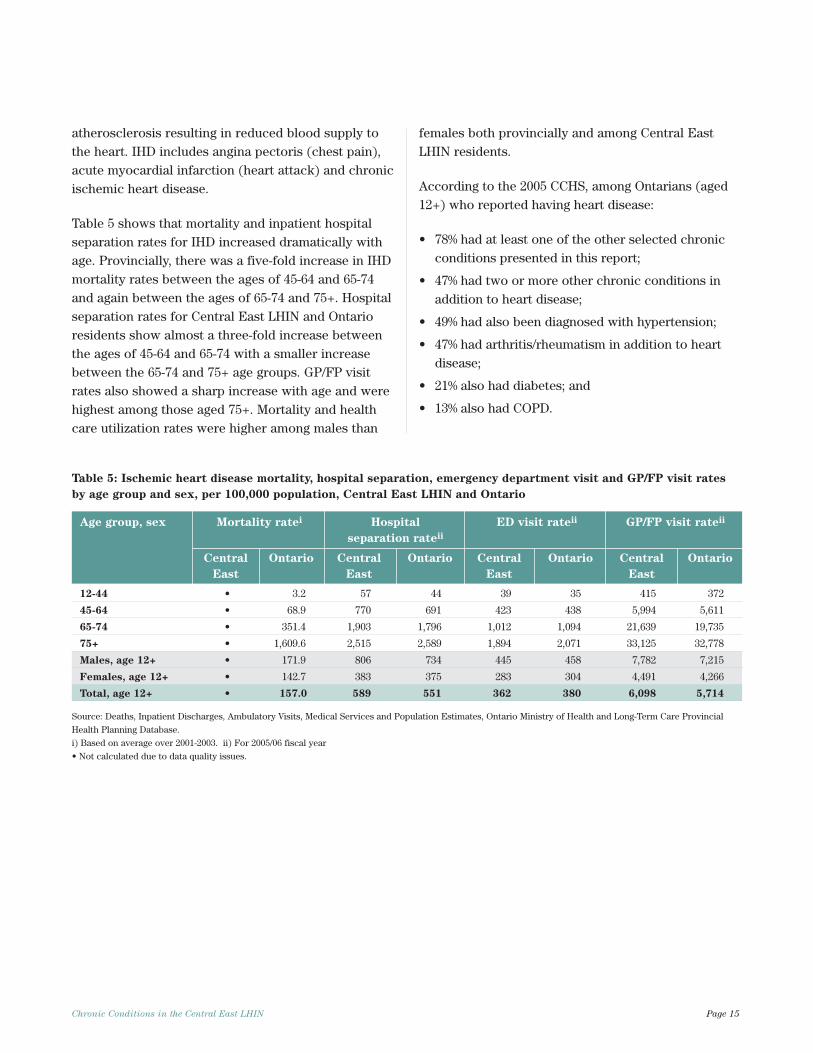
atherosclerosis resulting in reduced blood supply tothe heart. IHD includes angina pectoris (chest pain),acute myocardial infarction (heart attack) and chronicischemic heart disease.
Table 5 shows that mortality and inpatient hospitalseparation rates for IHD increased dramatically withage. Provincially, there was a five-fold increase in IHDmortality rates between the ages of 45-64 and 65-74and again between the ages of 65-74 and 75+. Hospitalseparation rates for Central East LHIN and Ontarioresidents show almost a three-fold increase betweenthe ages of 45-64 and 65-74 with a smaller increasebetween the 65-74 and 75+ age groups. GP/FP visitrates also showed a sharp increase with age and werehighest among those aged 75+. Mortality and healthcare utilization rates were higher among males than
females both provincially and among Central EastLHIN residents.
According to the 2005 CCHS, among Ontarians (aged12+) who reported having heart disease:
• 78% had at least one of the other selected chronicconditions presented in this report;
• 47% had two or more other chronic conditions inaddition to heart disease;
• 49% had also been diagnosed with hypertension;
• 47% had arthritis/rheumatism in addition to heartdisease;
• 21% also had diabetes; and
• 13% also had COPD.
Chronic Conditions in the Central East LHIN Page 15
Table 5: Ischemic heart disease mortality, hospital separation, emergency department visit and GP/FP visit rates
by age group and sex, per 100,000 population, Central East LHIN and Ontario
Age group, sex Mortality ratei Hospital ED visit rateii GP/FP visit rateii
separation rateii
Central Ontario Central Ontario Central Ontario Central Ontario
East East East East
12-44 • 3.2 57 44 39 35 415 372
45-64 • 68.9 770 691 423 438 5,994 5,611
65-74 • 351.4 1,903 1,796 1,012 1,094 21,639 19,735
75+ • 1,609.6 2,515 2,589 1,894 2,071 33,125 32,778
Males, age 12+ • 171.9 806 734 445 458 7,782 7,215
Females, age 12+ • 142.7 383 375 283 304 4,491 4,266
Total, age 12+ • 157.0 589 551 362 380 6,098 5,714
Source: Deaths, Inpatient Discharges, Ambulatory Visits, Medical Services and Population Estimates, Ontario Ministry of Health and Long-Term Care Provincial
Health Planning Database.
i) Based on average over 2001-2003. ii) For 2005/06 fiscal year
• Not calculated due to data quality issues.
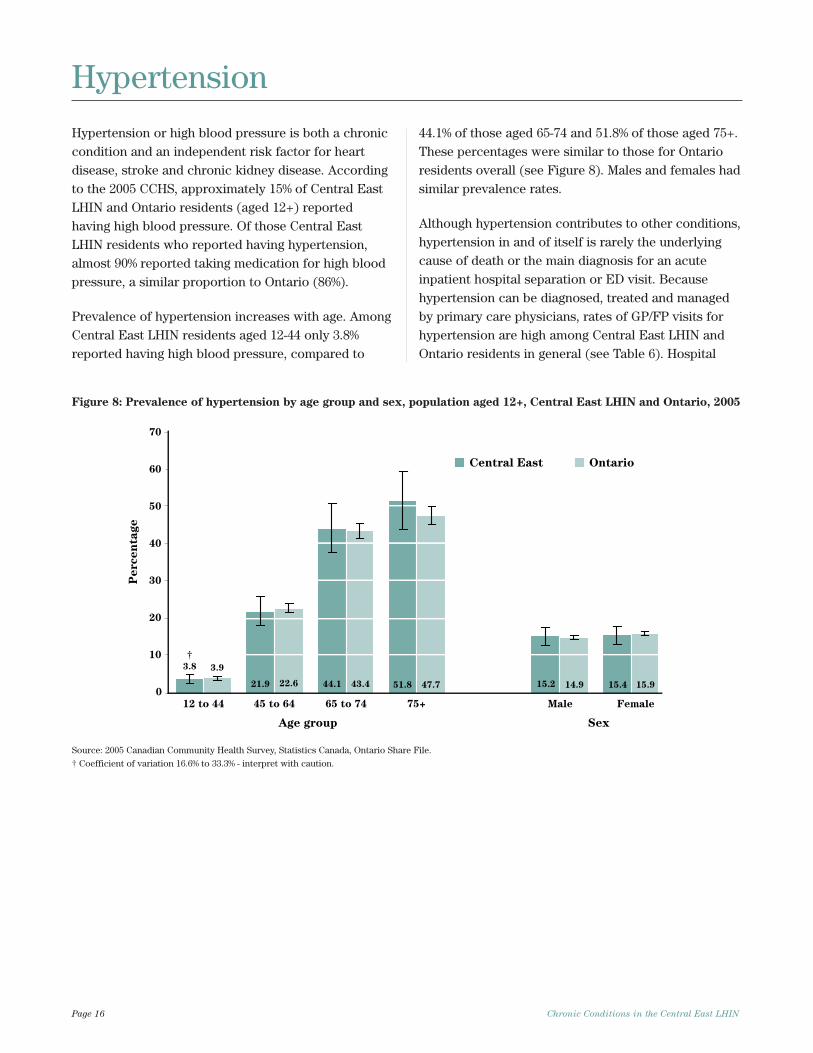
Hypertension or high blood pressure is both a chroniccondition and an independent risk factor for heartdisease, stroke and chronic kidney disease. Accordingto the 2005 CCHS, approximately 15% of Central EastLHIN and Ontario residents (aged 12+) reportedhaving high blood pressure. Of those Central EastLHIN residents who reported having hypertension,almost 90% reported taking medication for high bloodpressure, a similar proportion to Ontario (86%).
Prevalence of hypertension increases with age. AmongCentral East LHIN residents aged 12-44 only 3.8%reported having high blood pressure, compared to
44.1% of those aged 65-74 and 51.8% of those aged 75+.These percentages were similar to those for Ontarioresidents overall (see Figure 8). Males and females hadsimilar prevalence rates.
Although hypertension contributes to other conditions,hypertension in and of itself is rarely the underlyingcause of death or the main diagnosis for an acuteinpatient hospital separation or ED visit. Becausehypertension can be diagnosed, treated and managedby primary care physicians, rates of GP/FP visits forhypertension are high among Central East LHIN andOntario residents in general (see Table 6). Hospital
Page 16 Chronic Conditions in the Central East LHIN
Hypertension
0
10
20
30
40
50
60
70
12 to 44 45 to 64 65 to 74 75+ Male Female
Age group Sex
eg
atn
ec
re
P
Central East Ontario
3.8
21.9 44.1 51.8 15.2 15.4
3.9
22.6 43.4 47.7 14.9 15.9
†
Figure 8: Prevalence of hypertension by age group and sex, population aged 12+, Central East LHIN and Ontario, 2005
Source: 2005 Canadian Community Health Survey, Statistics Canada, Ontario Share File.
† Coefficient of variation 16.6% to 33.3% - interpret with caution.
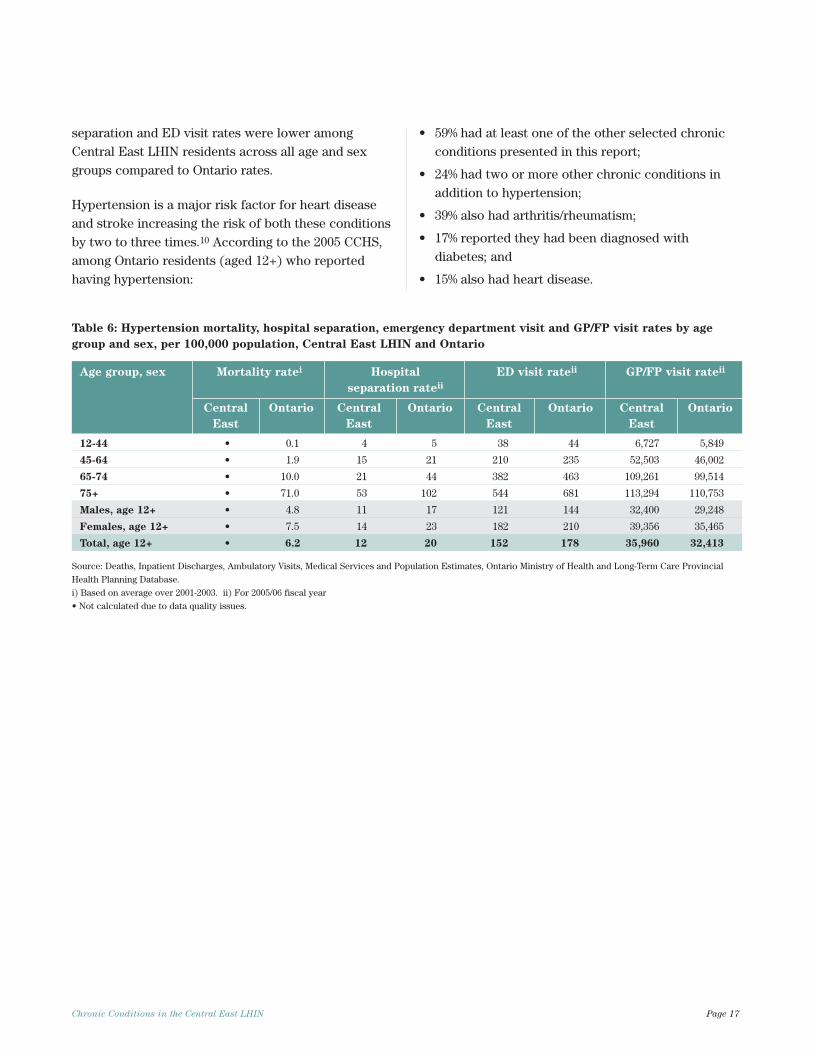
separation and ED visit rates were lower amongCentral East LHIN residents across all age and sexgroups compared to Ontario rates.
Hypertension is a major risk factor for heart diseaseand stroke increasing the risk of both these conditionsby two to three times.10 According to the 2005 CCHS,among Ontario residents (aged 12+) who reportedhaving hypertension:
• 59% had at least one of the other selected chronicconditions presented in this report;
• 24% had two or more other chronic conditions inaddition to hypertension;
• 39% also had arthritis/rheumatism;
• 17% reported they had been diagnosed withdiabetes; and
• 15% also had heart disease.
Chronic Conditions in the Central East LHIN Page 17
Table 6: Hypertension mortality, hospital separation, emergency department visit and GP/FP visit rates by age
group and sex, per 100,000 population, Central East LHIN and Ontario
Age group, sex Mortality ratei Hospital ED visit rateii GP/FP visit rateii
separation rateii
Central Ontario Central Ontario Central Ontario Central Ontario
East East East East
12-44 • 0.1 4 5 38 44 6,727 5,849
45-64 • 1.9 15 21 210 235 52,503 46,002
65-74 • 10.0 21 44 382 463 109,261 99,514
75+ • 71.0 53 102 544 681 113,294 110,753
Males, age 12+ • 4.8 11 17 121 144 32,400 29,248
Females, age 12+ • 7.5 14 23 182 210 39,356 35,465
Total, age 12+ • 6.2 12 20 152 178 35,960 32,413
Source: Deaths, Inpatient Discharges, Ambulatory Visits, Medical Services and Population Estimates, Ontario Ministry of Health and Long-Term Care Provincial
Health Planning Database.
i) Based on average over 2001-2003. ii) For 2005/06 fiscal year
• Not calculated due to data quality issues.
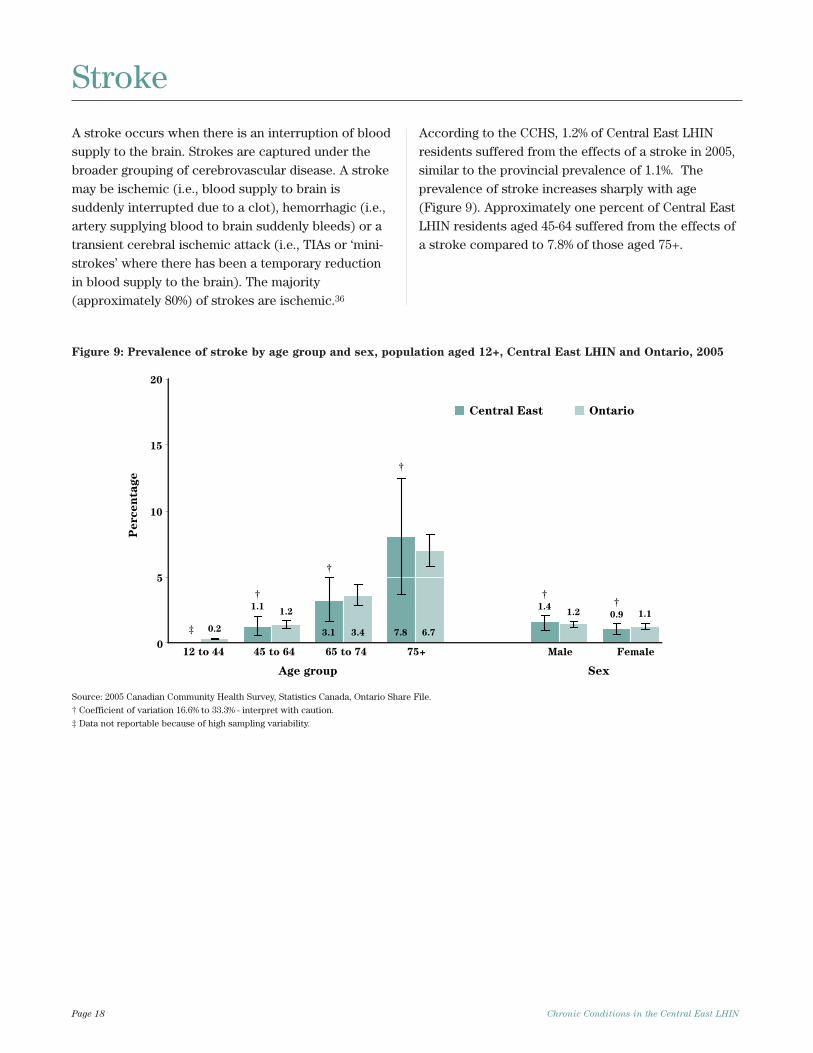
A stroke occurs when there is an interruption of bloodsupply to the brain. Strokes are captured under thebroader grouping of cerebrovascular disease. A strokemay be ischemic (i.e., blood supply to brain issuddenly interrupted due to a clot), hemorrhagic (i.e.,artery supplying blood to brain suddenly bleeds) or atransient cerebral ischemic attack (i.e., TIAs or ‘mini-strokes’ where there has been a temporary reductionin blood supply to the brain). The majority(approximately 80%) of strokes are ischemic.36
According to the CCHS, 1.2% of Central East LHINresidents suffered from the effects of a stroke in 2005,similar to the provincial prevalence of 1.1%. Theprevalence of stroke increases sharply with age(Figure 9). Approximately one percent of Central EastLHIN residents aged 45-64 suffered from the effects ofa stroke compared to 7.8% of those aged 75+.
Page 18 Chronic Conditions in the Central East LHIN
Stroke
12 to 44 45 to 64 65 to 74 75+ Male Female
Age group Sex
eg
atn
ec
re
P
0
5
10
15
20
Central East Ontario
†
‡
†
†
†
†1.2
3.4 6.7
1.2 1.1
0.2
1.1
3.1 7.8
1.40.9
Figure 9: Prevalence of stroke by age group and sex, population aged 12+, Central East LHIN and Ontario, 2005
Source: 2005 Canadian Community Health Survey, Statistics Canada, Ontario Share File.
† Coefficient of variation 16.6% to 33.3% - interpret with caution.
‡ Data not reportable because of high sampling variability.
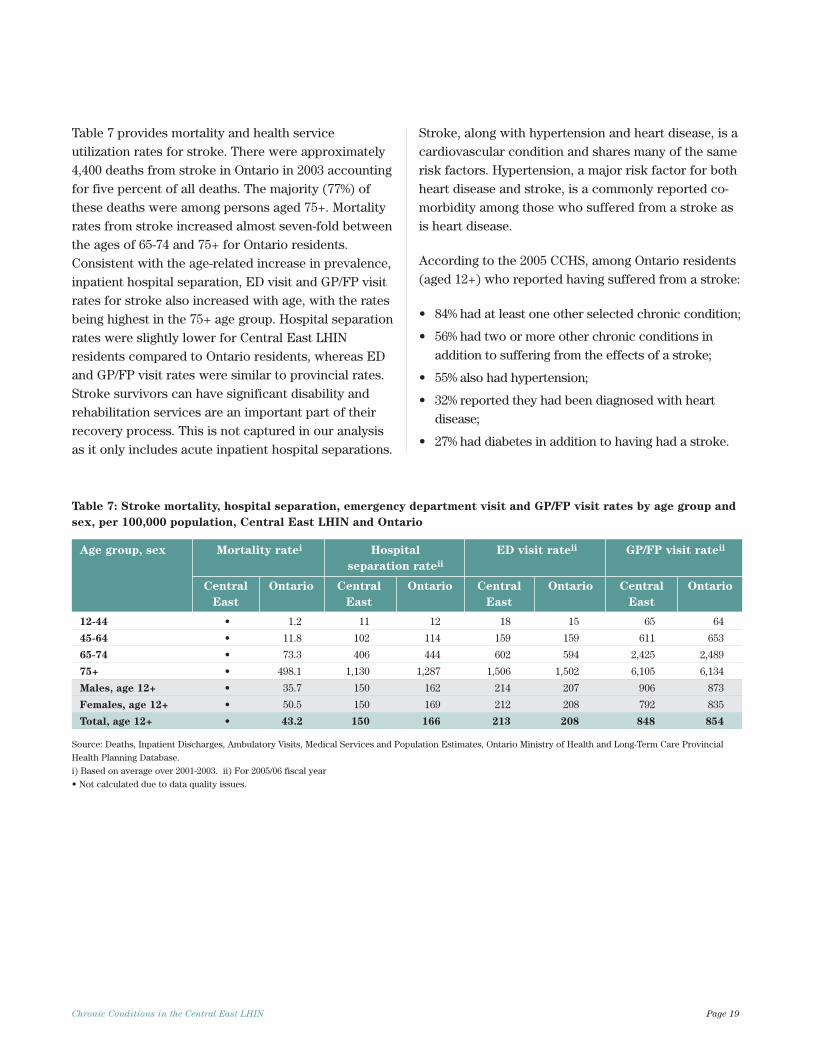
Table 7 provides mortality and health serviceutilization rates for stroke. There were approximately4,400 deaths from stroke in Ontario in 2003 accountingfor five percent of all deaths. The majority (77%) ofthese deaths were among persons aged 75+. Mortalityrates from stroke increased almost seven-fold betweenthe ages of 65-74 and 75+ for Ontario residents.Consistent with the age-related increase in prevalence,inpatient hospital separation, ED visit and GP/FP visitrates for stroke also increased with age, with the ratesbeing highest in the 75+ age group. Hospital separationrates were slightly lower for Central East LHINresidents compared to Ontario residents, whereas EDand GP/FP visit rates were similar to provincial rates.Stroke survivors can have significant disability andrehabilitation services are an important part of theirrecovery process. This is not captured in our analysisas it only includes acute inpatient hospital separations.
Stroke, along with hypertension and heart disease, is acardiovascular condition and shares many of the samerisk factors. Hypertension, a major risk factor for bothheart disease and stroke, is a commonly reported co-morbidity among those who suffered from a stroke asis heart disease.
According to the 2005 CCHS, among Ontario residents(aged 12+) who reported having suffered from a stroke:
• 84% had at least one other selected chronic condition;
• 56% had two or more other chronic conditions inaddition to suffering from the effects of a stroke;
• 55% also had hypertension;
• 32% reported they had been diagnosed with heartdisease;
• 27% had diabetes in addition to having had a stroke.
Chronic Conditions in the Central East LHIN Page 19
Table 7: Stroke mortality, hospital separation, emergency department visit and GP/FP visit rates by age group and
sex, per 100,000 population, Central East LHIN and Ontario
Age group, sex Mortality ratei Hospital ED visit rateii GP/FP visit rateii
separation rateii
Central Ontario Central Ontario Central Ontario Central Ontario
East East East East
12-44 • 1.2 11 12 18 15 65 64
45-64 • 11.8 102 114 159 159 611 653
65-74 • 73.3 406 444 602 594 2,425 2,489
75+ • 498.1 1,130 1,287 1,506 1,502 6,105 6,134
Males, age 12+ • 35.7 150 162 214 207 906 873
Females, age 12+ • 50.5 150 169 212 208 792 835
Total, age 12+ • 43.2 150 166 213 208 848 854
Source: Deaths, Inpatient Discharges, Ambulatory Visits, Medical Services and Population Estimates, Ontario Ministry of Health and Long-Term Care Provincial
Health Planning Database.
i) Based on average over 2001-2003. ii) For 2005/06 fiscal year
• Not calculated due to data quality issues.
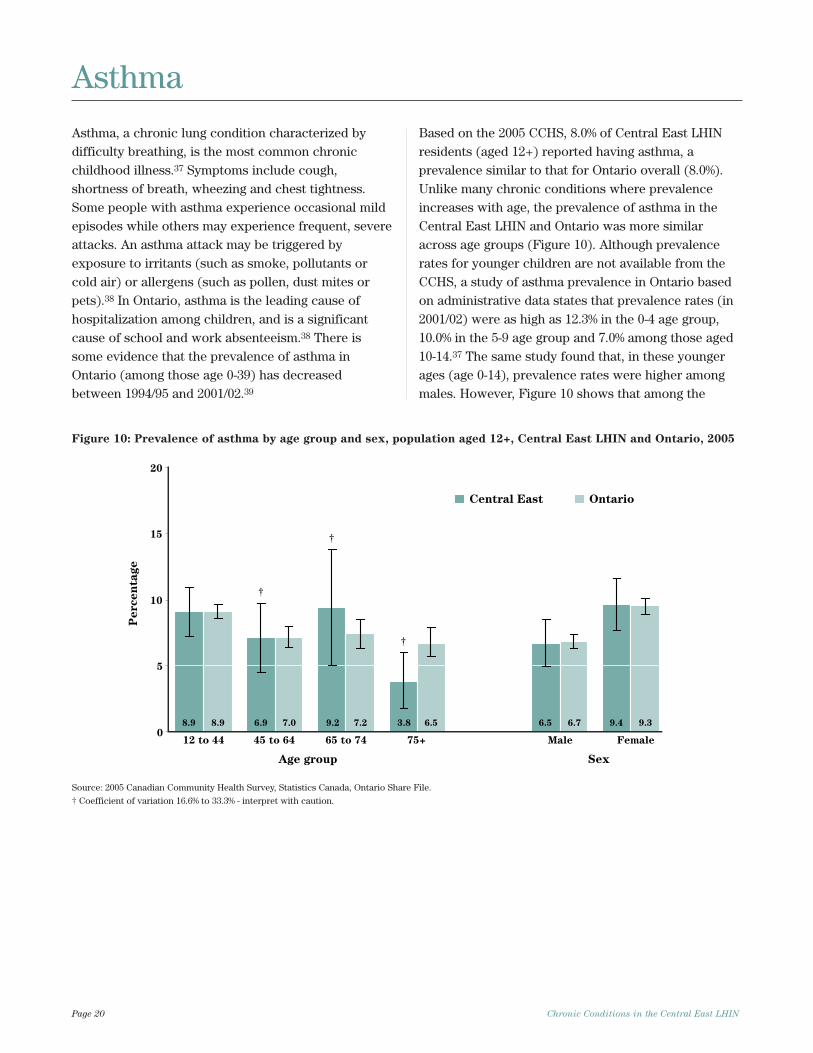
Asthma, a chronic lung condition characterized bydifficulty breathing, is the most common chronicchildhood illness.37 Symptoms include cough,shortness of breath, wheezing and chest tightness.Some people with asthma experience occasional mildepisodes while others may experience frequent, severeattacks. An asthma attack may be triggered byexposure to irritants (such as smoke, pollutants orcold air) or allergens (such as pollen, dust mites orpets).38 In Ontario, asthma is the leading cause ofhospitalization among children, and is a significantcause of school and work absenteeism.38 There issome evidence that the prevalence of asthma inOntario (among those age 0-39) has decreasedbetween 1994/95 and 2001/02.39
Based on the 2005 CCHS, 8.0% of Central East LHINresidents (aged 12+) reported having asthma, aprevalence similar to that for Ontario overall (8.0%).Unlike many chronic conditions where prevalenceincreases with age, the prevalence of asthma in theCentral East LHIN and Ontario was more similaracross age groups (Figure 10). Although prevalencerates for younger children are not available from theCCHS, a study of asthma prevalence in Ontario basedon administrative data states that prevalence rates (in2001/02) were as high as 12.3% in the 0-4 age group,10.0% in the 5-9 age group and 7.0% among those aged10-14.37 The same study found that, in these youngerages (age 0-14), prevalence rates were higher amongmales. However, Figure 10 shows that among the
Page 20 Chronic Conditions in the Central East LHIN
Asthma
12 to 44 45 to 64 65 to 74 75+ Male Female
Age group Sex
eg
atn
ec
re
P
0
5
10
15
20
Central East Ontario
†
†
8.9 6.9 9.2 3.8 6.5 9.48.9 7.0 7.2 6.5 6.7 9.3
†
Figure 10: Prevalence of asthma by age group and sex, population aged 12+, Central East LHIN and Ontario, 2005
Source: 2005 Canadian Community Health Survey, Statistics Canada, Ontario Share File.
† Coefficient of variation 16.6% to 33.3% - interpret with caution.
population aged 12+ overall prevalence rates in boththe Central East LHIN and Ontario were higher amongfemales.
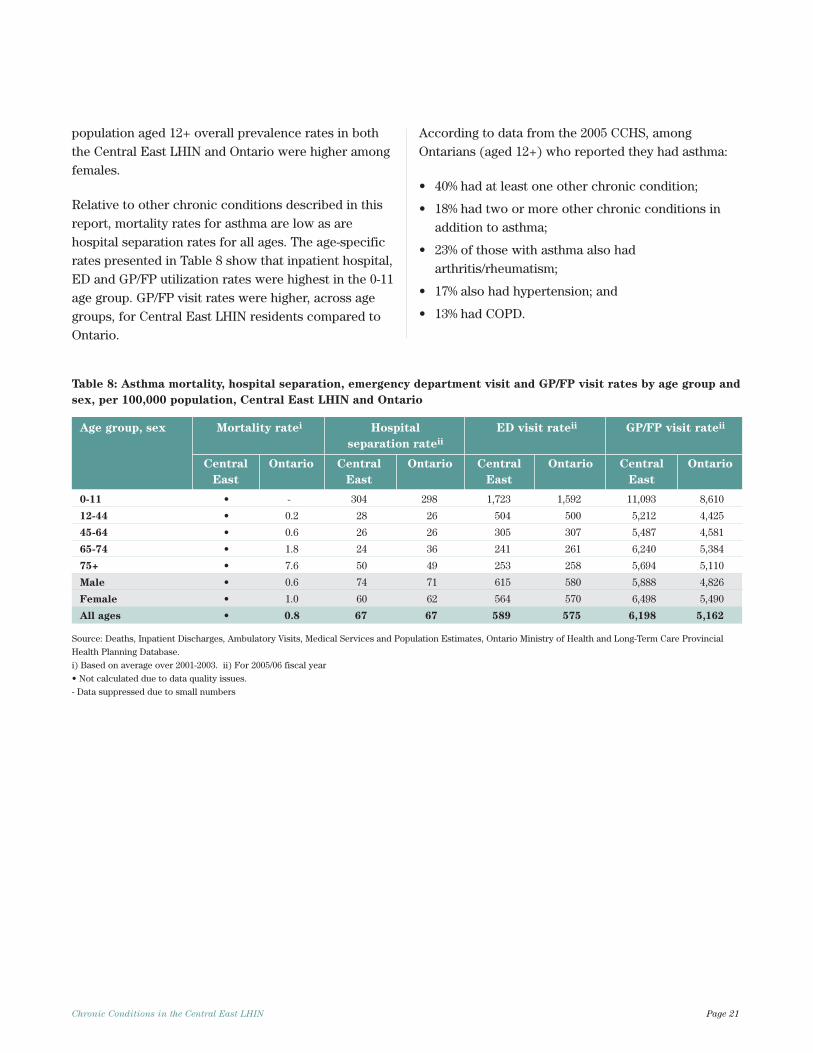
Relative to other chronic conditions described in thisreport, mortality rates for asthma are low as arehospital separation rates for all ages. The age-specificrates presented in Table 8 show that inpatient hospital,ED and GP/FP utilization rates were highest in the 0-11age group. GP/FP visit rates were higher, across agegroups, for Central East LHIN residents compared toOntario.
According to data from the 2005 CCHS, amongOntarians (aged 12+) who reported they had asthma:
• 40% had at least one other chronic condition;
• 18% had two or more other chronic conditions inaddition to asthma;
• 23% of those with asthma also hadarthritis/rheumatism;
• 17% also had hypertension; and
• 13% had COPD.
Chronic Conditions in the Central East LHIN Page 21
Table 8: Asthma mortality, hospital separation, emergency department visit and GP/FP visit rates by age group and
sex, per 100,000 population, Central East LHIN and Ontario
Age group, sex Mortality ratei Hospital ED visit rateii GP/FP visit rateii
separation rateii
Central Ontario Central Ontario Central Ontario Central Ontario
East East East East
0-11 • - 304 298 1,723 1,592 11,093 8,610
12-44 • 0.2 28 26 504 500 5,212 4,425
45-64 • 0.6 26 26 305 307 5,487 4,581
65-74 • 1.8 24 36 241 261 6,240 5,384
75+ • 7.6 50 49 253 258 5,694 5,110
Male • 0.6 74 71 615 580 5,888 4,826
Female • 1.0 60 62 564 570 6,498 5,490
All ages • 0.8 67 67 589 575 6,198 5,162
Source: Deaths, Inpatient Discharges, Ambulatory Visits, Medical Services and Population Estimates, Ontario Ministry of Health and Long-Term Care Provincial
Health Planning Database.
i) Based on average over 2001-2003. ii) For 2005/06 fiscal year
• Not calculated due to data quality issues.
- Data suppressed due to small numbers
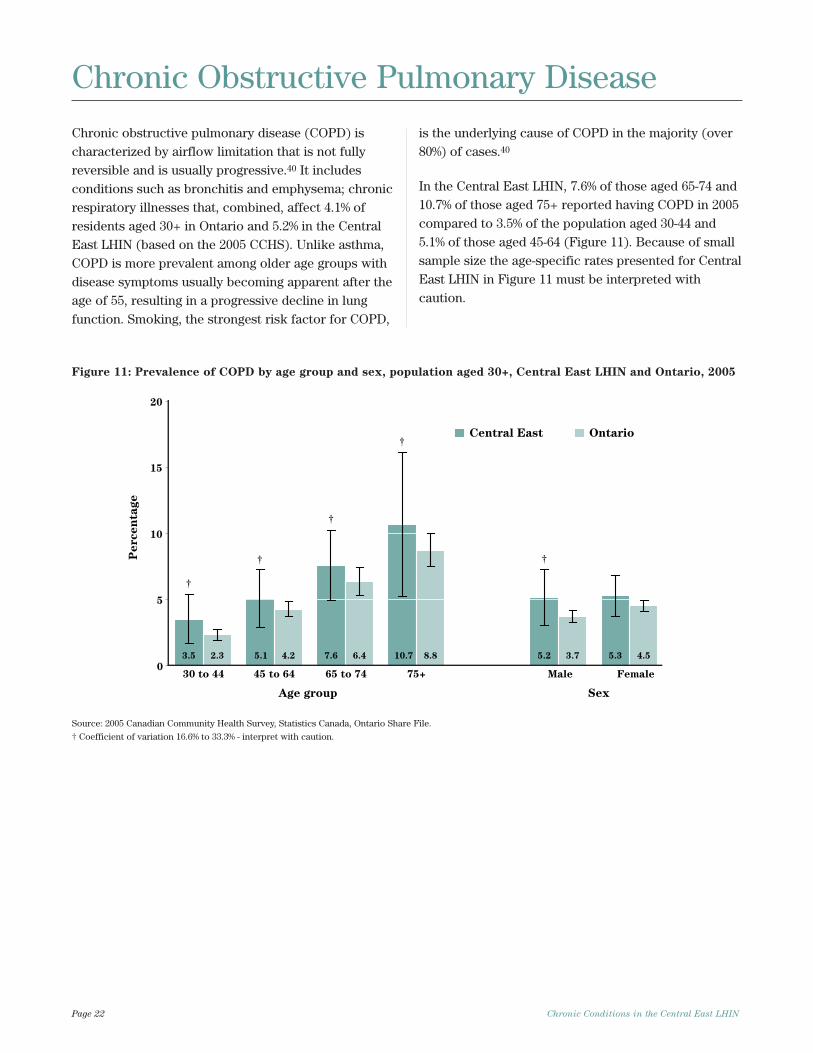
Chronic obstructive pulmonary disease (COPD) ischaracterized by airflow limitation that is not fullyreversible and is usually progressive.40 It includesconditions such as bronchitis and emphysema; chronicrespiratory illnesses that, combined, affect 4.1% ofresidents aged 30+ in Ontario and 5.2% in the CentralEast LHIN (based on the 2005 CCHS). Unlike asthma,COPD is more prevalent among older age groups withdisease symptoms usually becoming apparent after theage of 55, resulting in a progressive decline in lungfunction. Smoking, the strongest risk factor for COPD,
is the underlying cause of COPD in the majority (over80%) of cases.40
In the Central East LHIN, 7.6% of those aged 65-74 and10.7% of those aged 75+ reported having COPD in 2005compared to 3.5% of the population aged 30-44 and5.1% of those aged 45-64 (Figure 11). Because of smallsample size the age-specific rates presented for CentralEast LHIN in Figure 11 must be interpreted withcaution.
Page 22 Chronic Conditions in the Central East LHIN
Chronic Obstructive Pulmonary Disease
30 to 44 45 to 64 65 to 74 75+ Male Female
Age group Sex
eg
atn
ec
re
P
0
5
10
15
20
Central East Ontario
3.5 5.1 7.6 10.7 5.2 5.32.3 4.2 6.4 8.8 3.7 4.5
†
†
†
†
†
Figure 11: Prevalence of COPD by age group and sex, population aged 30+, Central East LHIN and Ontario, 2005
Source: 2005 Canadian Community Health Survey, Statistics Canada, Ontario Share File.
† Coefficient of variation 16.6% to 33.3% - interpret with caution.
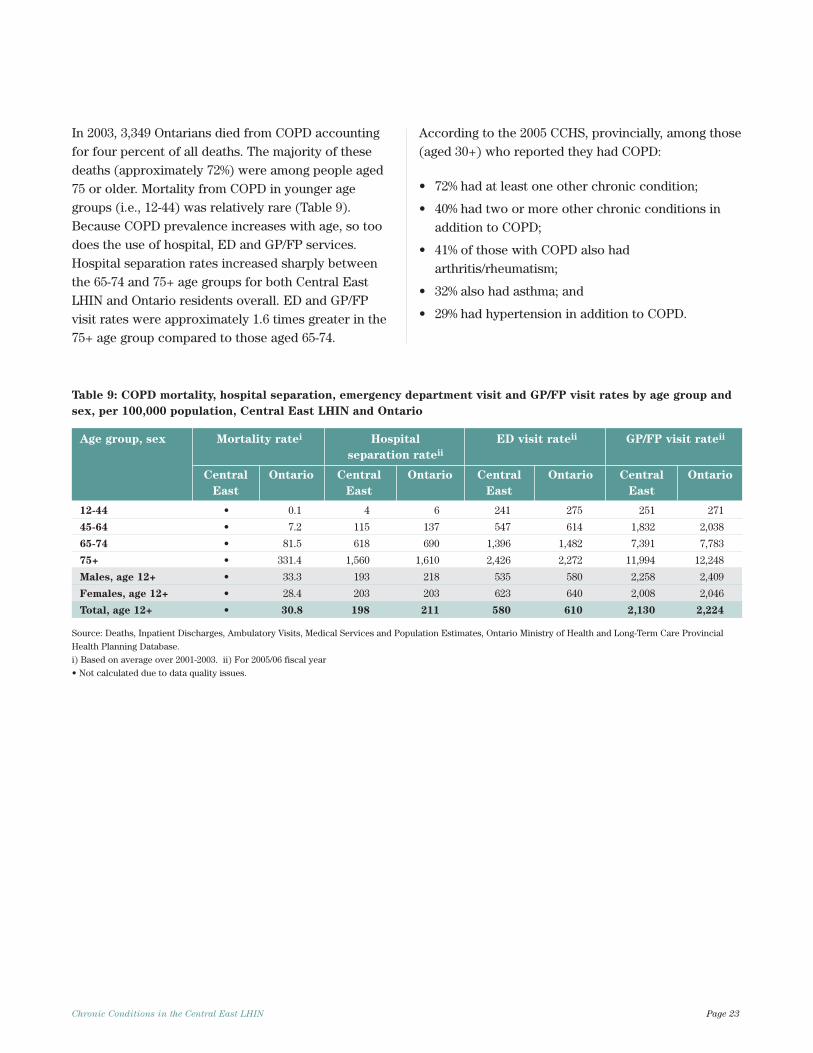
In 2003, 3,349 Ontarians died from COPD accountingfor four percent of all deaths. The majority of thesedeaths (approximately 72%) were among people aged75 or older. Mortality from COPD in younger agegroups (i.e., 12-44) was relatively rare (Table 9).Because COPD prevalence increases with age, so toodoes the use of hospital, ED and GP/FP services.Hospital separation rates increased sharply betweenthe 65-74 and 75+ age groups for both Central EastLHIN and Ontario residents overall. ED and GP/FPvisit rates were approximately 1.6 times greater in the75+ age group compared to those aged 65-74.
According to the 2005 CCHS, provincially, among those(aged 30+) who reported they had COPD:
• 72% had at least one other chronic condition;
• 40% had two or more other chronic conditions inaddition to COPD;
• 41% of those with COPD also hadarthritis/rheumatism;
• 32% also had asthma; and
• 29% had hypertension in addition to COPD.
Chronic Conditions in the Central East LHIN Page 23
Table 9: COPD mortality, hospital separation, emergency department visit and GP/FP visit rates by age group and
sex, per 100,000 population, Central East LHIN and Ontario
Age group, sex Mortality ratei Hospital ED visit rateii GP/FP visit rateii
separation rateii
Central Ontario Central Ontario Central Ontario Central Ontario
East East East East
12-44 • 0.1 4 6 241 275 251 271
45-64 • 7.2 115 137 547 614 1,832 2,038
65-74 • 81.5 618 690 1,396 1,482 7,391 7,783
75+ • 331.4 1,560 1,610 2,426 2,272 11,994 12,248
Males, age 12+ • 33.3 193 218 535 580 2,258 2,409
Females, age 12+ • 28.4 203 203 623 640 2,008 2,046
Total, age 12+ • 30.8 198 211 580 610 2,130 2,224
Source: Deaths, Inpatient Discharges, Ambulatory Visits, Medical Services and Population Estimates, Ontario Ministry of Health and Long-Term Care Provincial
Health Planning Database.
i) Based on average over 2001-2003. ii) For 2005/06 fiscal year
• Not calculated due to data quality issues.
Arthritis, a musculoskeletal condition characterized byinflammation of the joints, includes more than ahundred diseases and related disorders which affectjoints, the surrounding tissue and connective tissue.Osteoarthritis and rheumatoid arthritis are the mostcommon forms of arthritis.11,41
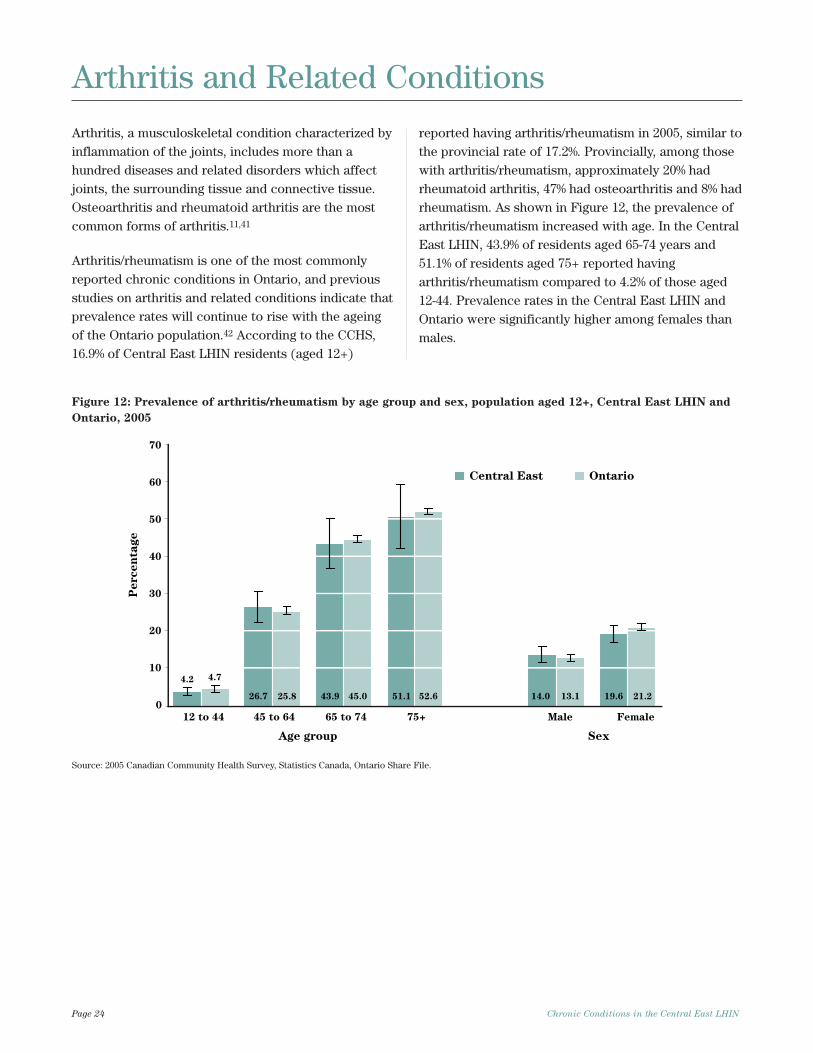
Arthritis/rheumatism is one of the most commonlyreported chronic conditions in Ontario, and previousstudies on arthritis and related conditions indicate thatprevalence rates will continue to rise with the ageingof the Ontario population.42 According to the CCHS,16.9% of Central East LHIN residents (aged 12+)
reported having arthritis/rheumatism in 2005, similar tothe provincial rate of 17.2%. Provincially, among thosewith arthritis/rheumatism, approximately 20% hadrheumatoid arthritis, 47% had osteoarthritis and 8% hadrheumatism. As shown in Figure 12, the prevalence ofarthritis/rheumatism increased with age. In the CentralEast LHIN, 43.9% of residents aged 65-74 years and51.1% of residents aged 75+ reported havingarthritis/rheumatism compared to 4.2% of those aged12-44. Prevalence rates in the Central East LHIN andOntario were significantly higher among females thanmales.
Page 24 Chronic Conditions in the Central East LHIN
Arthritis and Related Conditions
0
10
20
30
40
50
60
70
12 to 44 45 to 64 65 to 74 75+ Male Female
Age group Sex
eg
atn
ec
re
P
Central East Ontario
4.2
26.7 43.9 51.1 14.0 19.6
4.7
25.8 45.0 52.6 13.1 21.2
Figure 12: Prevalence of arthritis/rheumatism by age group and sex, population aged 12+, Central East LHIN and
Ontario, 2005
Source: 2005 Canadian Community Health Survey, Statistics Canada, Ontario Share File.
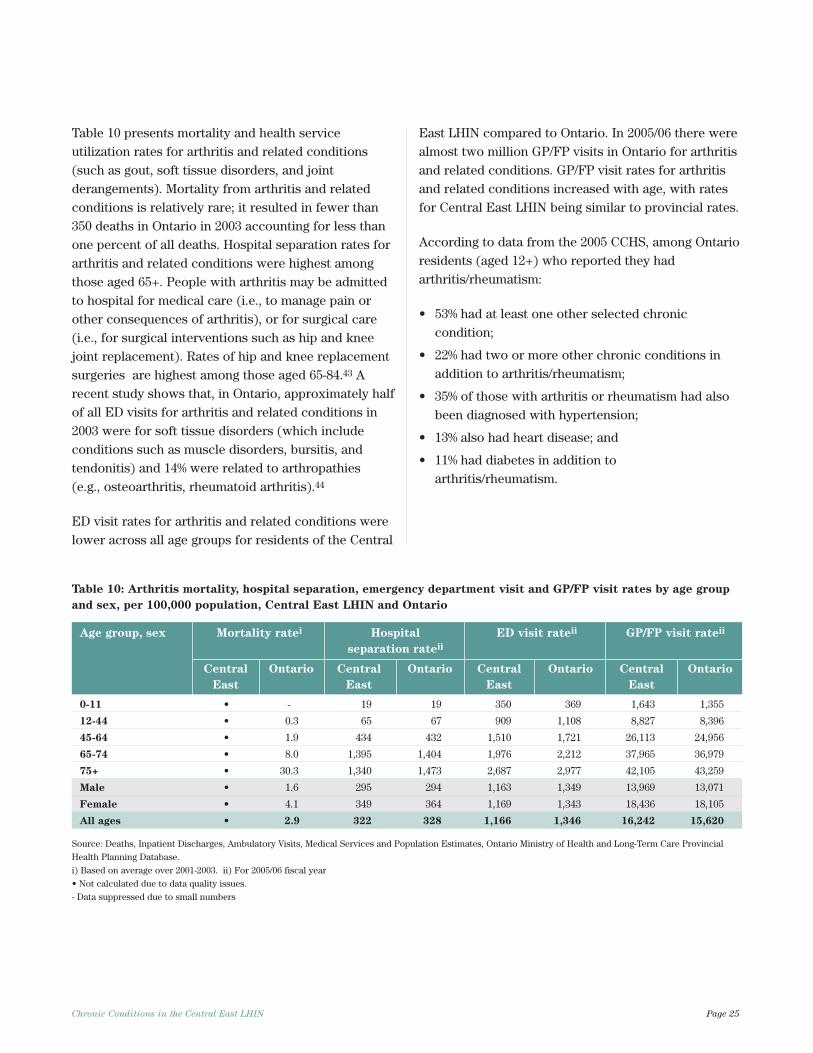
Table 10 presents mortality and health serviceutilization rates for arthritis and related conditions(such as gout, soft tissue disorders, and jointderangements). Mortality from arthritis and relatedconditions is relatively rare; it resulted in fewer than350 deaths in Ontario in 2003 accounting for less thanone percent of all deaths. Hospital separation rates forarthritis and related conditions were highest amongthose aged 65+. People with arthritis may be admittedto hospital for medical care (i.e., to manage pain orother consequences of arthritis), or for surgical care(i.e., for surgical interventions such as hip and kneejoint replacement). Rates of hip and knee replacementsurgeries are highest among those aged 65-84.43 Arecent study shows that, in Ontario, approximately halfof all ED visits for arthritis and related conditions in2003 were for soft tissue disorders (which includeconditions such as muscle disorders, bursitis, andtendonitis) and 14% were related to arthropathies (e.g., osteoarthritis, rheumatoid arthritis).44
ED visit rates for arthritis and related conditions werelower across all age groups for residents of the Central
East LHIN compared to Ontario. In 2005/06 there werealmost two million GP/FP visits in Ontario for arthritisand related conditions. GP/FP visit rates for arthritisand related conditions increased with age, with ratesfor Central East LHIN being similar to provincial rates.
According to data from the 2005 CCHS, among Ontarioresidents (aged 12+) who reported they hadarthritis/rheumatism:
• 53% had at least one other selected chroniccondition;
• 22% had two or more other chronic conditions inaddition to arthritis/rheumatism;
• 35% of those with arthritis or rheumatism had alsobeen diagnosed with hypertension;
• 13% also had heart disease; and
• 11% had diabetes in addition toarthritis/rheumatism.
Chronic Conditions in the Central East LHIN Page 25
Table 10: Arthritis mortality, hospital separation, emergency department visit and GP/FP visit rates by age group
and sex, per 100,000 population, Central East LHIN and Ontario
Age group, sex Mortality ratei Hospital ED visit rateii GP/FP visit rateii
separation rateii
Central Ontario Central Ontario Central Ontario Central Ontario
East East East East
0-11 • - 19 19 350 369 1,643 1,355
12-44 • 0.3 65 67 909 1,108 8,827 8,396
45-64 • 1.9 434 432 1,510 1,721 26,113 24,956
65-74 • 8.0 1,395 1,404 1,976 2,212 37,965 36,979
75+ • 30.3 1,340 1,473 2,687 2,977 42,105 43,259
Male • 1.6 295 294 1,163 1,349 13,969 13,071
Female • 4.1 349 364 1,169 1,343 18,436 18,105
All ages • 2.9 322 328 1,166 1,346 16,242 15,620
Source: Deaths, Inpatient Discharges, Ambulatory Visits, Medical Services and Population Estimates, Ontario Ministry of Health and Long-Term Care Provincial
Health Planning Database.
i) Based on average over 2001-2003. ii) For 2005/06 fiscal year
• Not calculated due to data quality issues.
- Data suppressed due to small numbers
Cancer
Diabete
s
Depress
ion
Heart d
isease
Hypertensio
n
Stroke
Asthm
a
COPD
Arthrit
is & re
late
d
Mortality
per 100,000
Hospital separations
per 100,000
ED visits
per 100,000
GP/FP visits
per 10,000
Prevalence
per 10,000
480
480
110
800
410
1720
334
1415
85460
222
1797
135209 273
989
178208 408 610
1506
558
109143
987
987
20 166
29 211 379
233
300.5 193
643
131
3
0
500
1000
1500
2000
2500
3000
3500
150
3241
1540
360
i
480
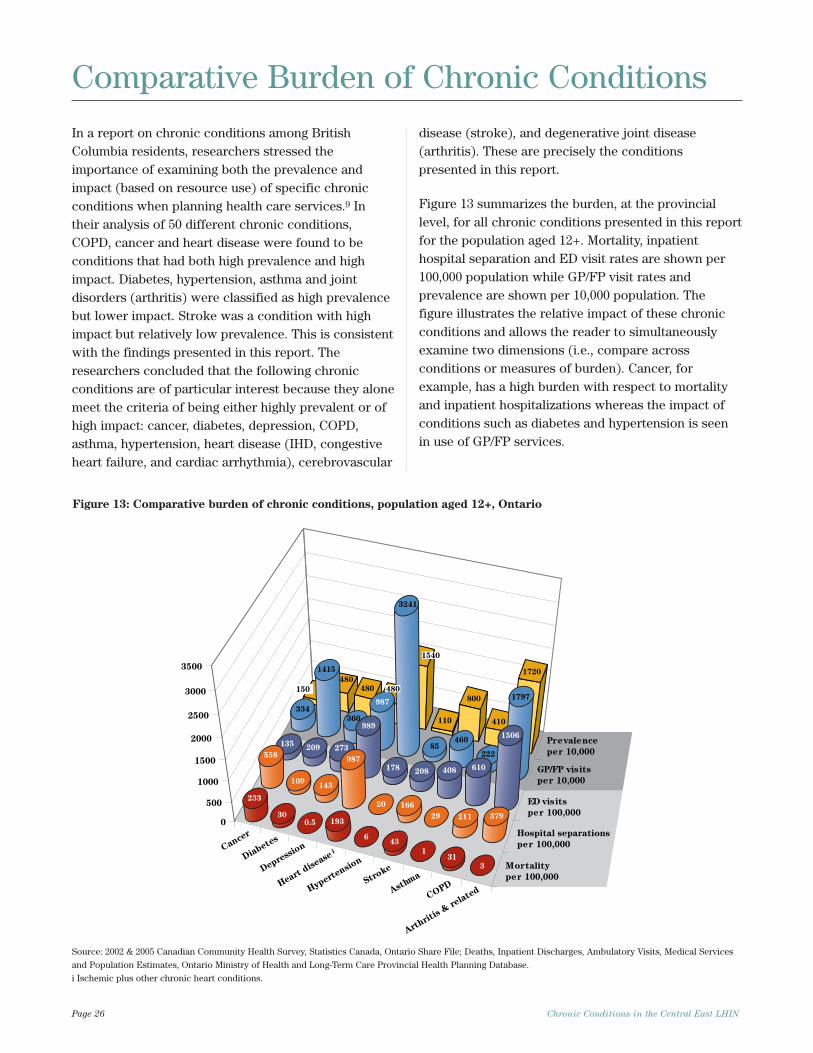
In a report on chronic conditions among BritishColumbia residents, researchers stressed theimportance of examining both the prevalence andimpact (based on resource use) of specific chronicconditions when planning health care services.9 Intheir analysis of 50 different chronic conditions,COPD, cancer and heart disease were found to beconditions that had both high prevalence and highimpact. Diabetes, hypertension, asthma and jointdisorders (arthritis) were classified as high prevalencebut lower impact. Stroke was a condition with highimpact but relatively low prevalence. This is consistentwith the findings presented in this report. Theresearchers concluded that the following chronicconditions are of particular interest because they alonemeet the criteria of being either highly prevalent or ofhigh impact: cancer, diabetes, depression, COPD,asthma, hypertension, heart disease (IHD, congestiveheart failure, and cardiac arrhythmia), cerebrovascular
disease (stroke), and degenerative joint disease(arthritis). These are precisely the conditionspresented in this report.
Figure 13 summarizes the burden, at the provinciallevel, for all chronic conditions presented in this reportfor the population aged 12+. Mortality, inpatienthospital separation and ED visit rates are shown per100,000 population while GP/FP visit rates andprevalence are shown per 10,000 population. Thefigure illustrates the relative impact of these chronicconditions and allows the reader to simultaneouslyexamine two dimensions (i.e., compare acrossconditions or measures of burden). Cancer, forexample, has a high burden with respect to mortalityand inpatient hospitalizations whereas the impact ofconditions such as diabetes and hypertension is seenin use of GP/FP services.
Page 26 Chronic Conditions in the Central East LHIN
Comparative Burden of Chronic Conditions
Figure 13: Comparative burden of chronic conditions, population aged 12+, Ontario
Source: 2002 & 2005 Canadian Community Health Survey, Statistics Canada, Ontario Share File; Deaths, Inpatient Discharges, Ambulatory Visits, Medical Services
and Population Estimates, Ontario Ministry of Health and Long-Term Care Provincial Health Planning Database.
i Ischemic plus other chronic heart conditions.
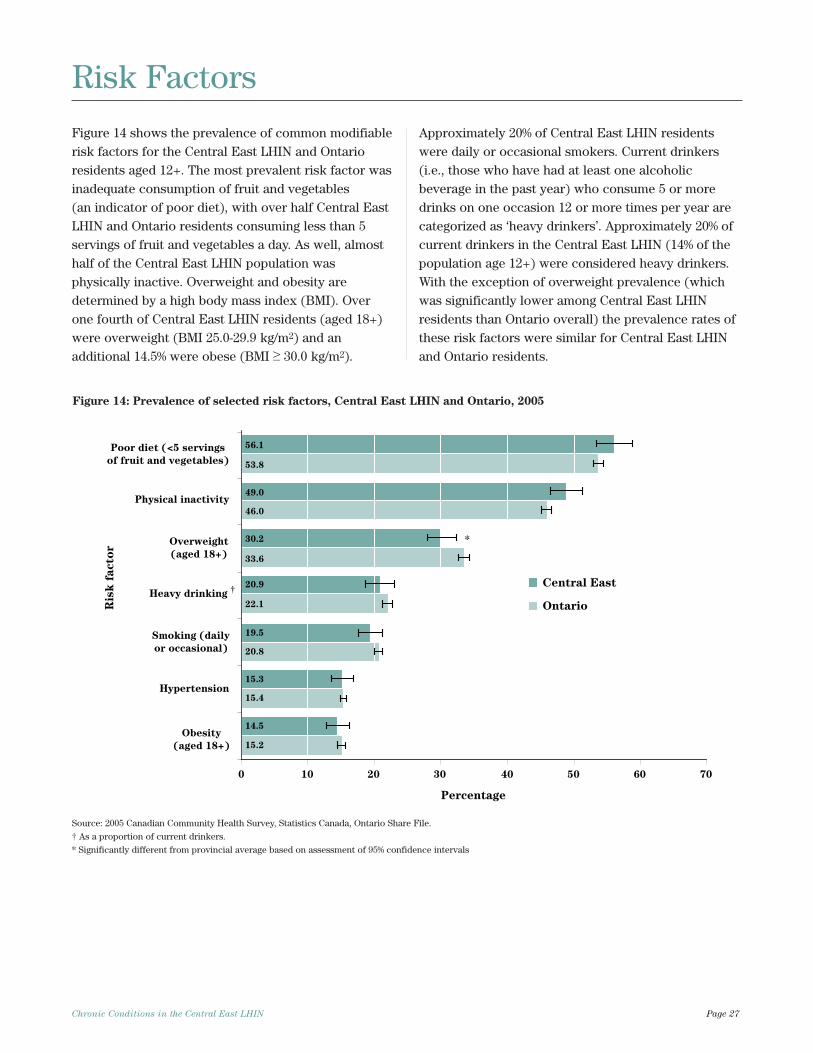
Figure 14 shows the prevalence of common modifiablerisk factors for the Central East LHIN and Ontarioresidents aged 12+. The most prevalent risk factor wasinadequate consumption of fruit and vegetables (an indicator of poor diet), with over half Central EastLHIN and Ontario residents consuming less than 5servings of fruit and vegetables a day. As well, almosthalf of the Central East LHIN population wasphysically inactive. Overweight and obesity aredetermined by a high body mass index (BMI). Overone fourth of Central East LHIN residents (aged 18+)were overweight (BMI 25.0-29.9 kg/m2) and anadditional 14.5% were obese (BMI ≥ 30.0 kg/m2).
Approximately 20% of Central East LHIN residentswere daily or occasional smokers. Current drinkers(i.e., those who have had at least one alcoholicbeverage in the past year) who consume 5 or moredrinks on one occasion 12 or more times per year arecategorized as ‘heavy drinkers’. Approximately 20% ofcurrent drinkers in the Central East LHIN (14% of thepopulation age 12+) were considered heavy drinkers.With the exception of overweight prevalence (whichwas significantly lower among Central East LHINresidents than Ontario overall) the prevalence rates ofthese risk factors were similar for Central East LHINand Ontario residents.
Chronic Conditions in the Central East LHIN Page 27
Figure 14: Prevalence of selected risk factors, Central East LHIN and Ontario, 2005
Risk Factors
Hypertension
Obesity
(aged 18+)
Overweight
(aged 18+)
Smoking (daily
or occasional)
Heavy drinking
Physical inactivity
Poor diet (<5 servings
of fruit and vegetables)
rot
caf
ksi
R
Percentage
0 10 20 30 40 50 60 70
†
15.2
15.4
20.8
22.1
33.6
46.0
53.8
14.5
15.3
19.5
20.9
30.2
49.0
56.1
*
Central East
Ontario
Source: 2005 Canadian Community Health Survey, Statistics Canada, Ontario Share File.
† As a proportion of current drinkers.
* Significantly different from provincial average based on assessment of 95% confidence intervals
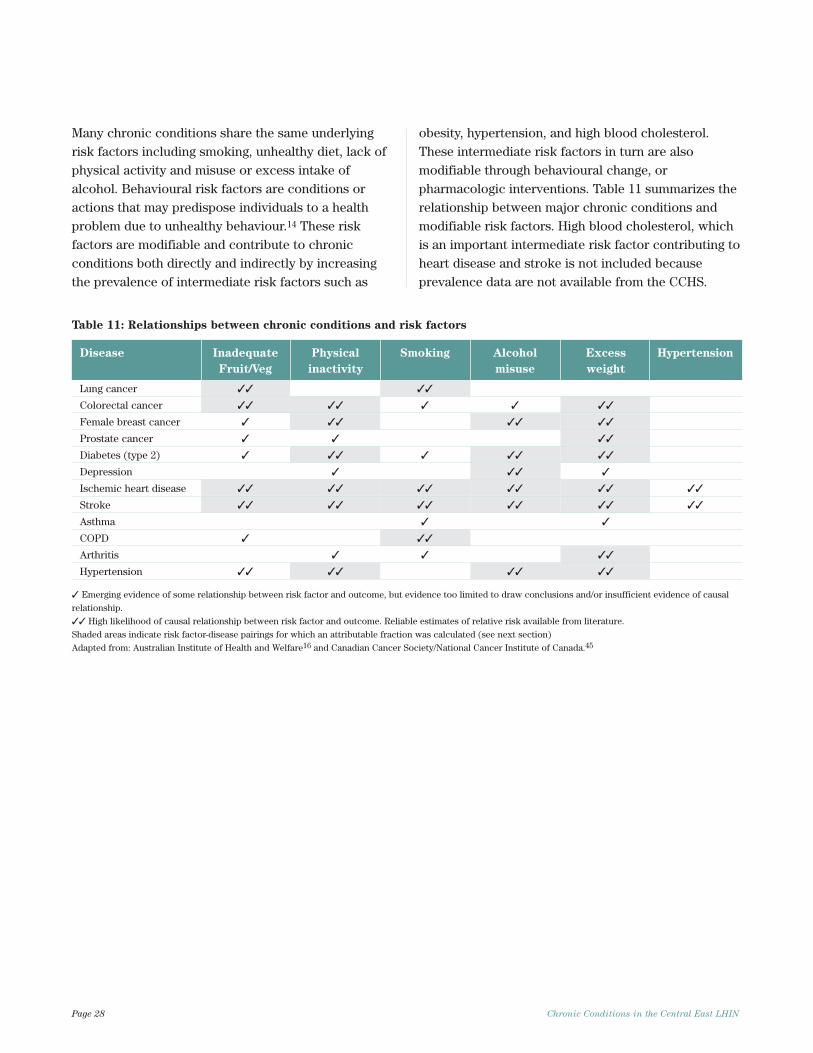
Many chronic conditions share the same underlyingrisk factors including smoking, unhealthy diet, lack ofphysical activity and misuse or excess intake ofalcohol. Behavioural risk factors are conditions oractions that may predispose individuals to a healthproblem due to unhealthy behaviour.14 These riskfactors are modifiable and contribute to chronicconditions both directly and indirectly by increasingthe prevalence of intermediate risk factors such as
obesity, hypertension, and high blood cholesterol.These intermediate risk factors in turn are alsomodifiable through behavioural change, orpharmacologic interventions. Table 11 summarizes therelationship between major chronic conditions andmodifiable risk factors. High blood cholesterol, whichis an important intermediate risk factor contributing toheart disease and stroke is not included becauseprevalence data are not available from the CCHS.
Page 28 Chronic Conditions in the Central East LHIN
Table 11: Relationships between chronic conditions and risk factors
Disease Inadequate Physical Smoking Alcohol Excess Hypertension
Fruit/Veg inactivity misuse weight
Lung cancer ✓✓ ✓✓
Colorectal cancer ✓✓ ✓✓ ✓ ✓ ✓✓
Female breast cancer ✓ ✓✓ ✓✓ ✓✓
Prostate cancer ✓ ✓ ✓✓
Diabetes (type 2) ✓ ✓✓ ✓ ✓✓ ✓✓
Depression ✓ ✓✓ ✓
Ischemic heart disease ✓✓ ✓✓ ✓✓ ✓✓ ✓✓ ✓✓
Stroke ✓✓ ✓✓ ✓✓ ✓✓ ✓✓ ✓✓
Asthma ✓ ✓
COPD ✓ ✓✓
Arthritis ✓ ✓ ✓✓
Hypertension ✓✓ ✓✓ ✓✓ ✓✓
✓ Emerging evidence of some relationship between risk factor and outcome, but evidence too limited to draw conclusions and/or insufficient evidence of causal
relationship.
✓✓ High likelihood of causal relationship between risk factor and outcome. Reliable estimates of relative risk available from literature.
Shaded areas indicate risk factor-disease pairings for which an attributable fraction was calculated (see next section)
Adapted from: Australian Institute of Health and Welfare16 and Canadian Cancer Society/National Cancer Institute of Canada.45
Population Attributable Fraction
Population attributable fraction (PAF) is a statistic thatprovides an estimate of the proportion of disease casesin a population associated with an exposure (i.e., a riskfactor such as smoking).46 PAFs can be useful in tryingto quantify the ‘amount’ of disease that could bereduced in a population if exposure to the risk factorwas reduced or eliminated. In this section we calculatePAFs, at the provincial level, to provide an estimate,albeit theoretical, that eliminations or reductions inbehavioural risk factors could have on chronicconditions at the population level. Additional notes onthe calculation of attributable risks are provided inAppendix B.
We calculated PAFs for only those risk factors thathave been shown to be clearly linked to the chronicconditions examined in this report, and for which areliable pooled estimate of relative risk and estimatesof exposure to the risk factor in the Ontario populationwere available. PAFs for each risk factor/diseasepairing were calculated for the adult population (aged30+, unless otherwise stated) to facilitate comparisons
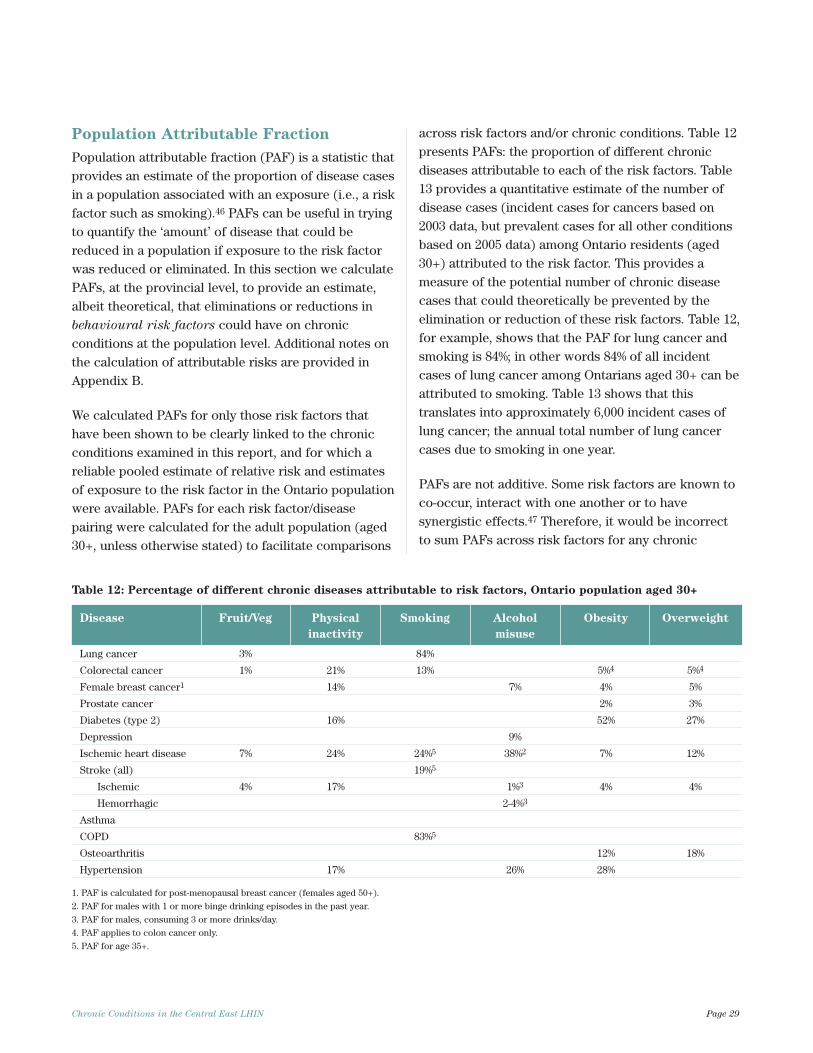
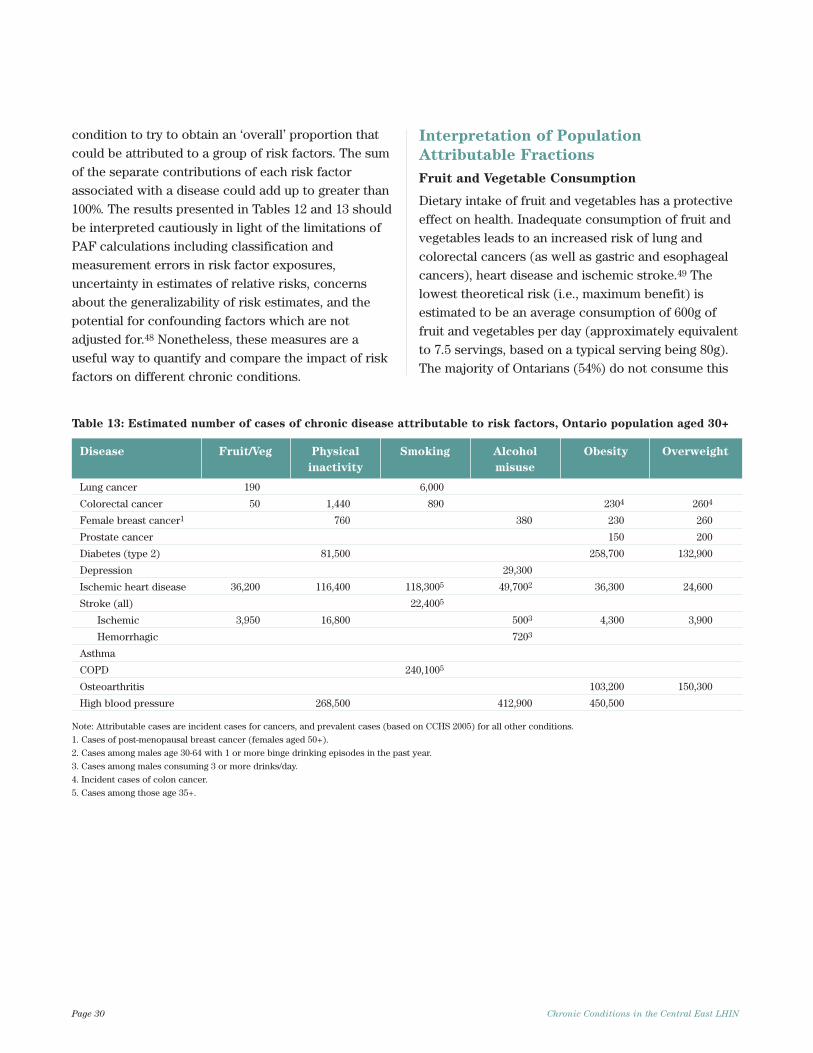
across risk factors and/or chronic conditions. Table 12presents PAFs: the proportion of different chronicdiseases attributable to each of the risk factors. Table13 provides a quantitative estimate of the number ofdisease cases (incident cases for cancers based on2003 data, but prevalent cases for all other conditionsbased on 2005 data) among Ontario residents (aged30+) attributed to the risk factor. This provides ameasure of the potential number of chronic diseasecases that could theoretically be prevented by theelimination or reduction of these risk factors. Table 12,for example, shows that the PAF for lung cancer andsmoking is 84%; in other words 84% of all incidentcases of lung cancer among Ontarians aged 30+ can beattributed to smoking. Table 13 shows that thistranslates into approximately 6,000 incident cases oflung cancer; the annual total number of lung cancercases due to smoking in one year.
PAFs are not additive. Some risk factors are known toco-occur, interact with one another or to havesynergistic effects.47 Therefore, it would be incorrectto sum PAFs across risk factors for any chronic
Chronic Conditions in the Central East LHIN Page 29
Table 12: Percentage of different chronic diseases attributable to risk factors, Ontario population aged 30+
Disease Fruit/Veg Physical Smoking Alcohol Obesity Overweight
inactivity misuse
Lung cancer 3% 84%
Colorectal cancer 1% 21% 13% 5%4 5%4
Female breast cancer1 14% 7% 4% 5%
Prostate cancer 2% 3%
Diabetes (type 2) 16% 52% 27%
Depression 9%
Ischemic heart disease 7% 24% 24%5 38%2 7% 12%
Stroke (all) 19%5
Ischemic 4% 17% 1%3 4% 4%
Hemorrhagic 2-4%3
Asthma
COPD 83%5
Osteoarthritis 12% 18%
Hypertension 17% 26% 28%
1. PAF is calculated for post-menopausal breast cancer (females aged 50+).
2. PAF for males with 1 or more binge drinking episodes in the past year.
3. PAF for males, consuming 3 or more drinks/day.
4. PAF applies to colon cancer only.
5. PAF for age 35+.
condition to try to obtain an ‘overall’ proportion thatcould be attributed to a group of risk factors. The sumof the separate contributions of each risk factorassociated with a disease could add up to greater than100%. The results presented in Tables 12 and 13 shouldbe interpreted cautiously in light of the limitations ofPAF calculations including classification andmeasurement errors in risk factor exposures,uncertainty in estimates of relative risks, concernsabout the generalizability of risk estimates, and thepotential for confounding factors which are notadjusted for.48 Nonetheless, these measures are auseful way to quantify and compare the impact of riskfactors on different chronic conditions.
Interpretation of Population
Attributable Fractions
Fruit and Vegetable Consumption
Dietary intake of fruit and vegetables has a protectiveeffect on health. Inadequate consumption of fruit andvegetables leads to an increased risk of lung andcolorectal cancers (as well as gastric and esophagealcancers), heart disease and ischemic stroke.49 Thelowest theoretical risk (i.e., maximum benefit) isestimated to be an average consumption of 600g offruit and vegetables per day (approximately equivalentto 7.5 servings, based on a typical serving being 80g).The majority of Ontarians (54%) do not consume this
Page 30 Chronic Conditions in the Central East LHIN
Table 13: Estimated number of cases of chronic disease attributable to risk factors, Ontario population aged 30+
Disease Fruit/Veg Physical Smoking Alcohol Obesity Overweight
inactivity misuse
Lung cancer 190 6,000
Colorectal cancer 50 1,440 890 2304 2604
Female breast cancer1 760 380 230 260
Prostate cancer 150 200
Diabetes (type 2) 81,500 258,700 132,900
Depression 29,300
Ischemic heart disease 36,200 116,400 118,3005 49,7002 36,300 24,600
Stroke (all) 22,4005
Ischemic 3,950 16,800 5003 4,300 3,900
Hemorrhagic 7203
Asthma
COPD 240,1005
Osteoarthritis 103,200 150,300
High blood pressure 268,500 412,900 450,500
Note: Attributable cases are incident cases for cancers, and prevalent cases (based on CCHS 2005) for all other conditions.
1. Cases of post-menopausal breast cancer (females aged 50+).
2. Cases among males age 30-64 with 1 or more binge drinking episodes in the past year.
3. Cases among males consuming 3 or more drinks/day.
4. Incident cases of colon cancer.
5. Cases among those age 35+.
amount of fruit and vegetables. The PAF for fruit andvegetable consumption shown in Table 12 reflects thepercentage of chronic disease cases that theoreticallycould be prevented if all Ontarians (aged 30+) whocurrently consume fewer than 7.5 servings of fruit andvegetables per day increased their intake by just 1serving. Approximately 3% of lung cancer, 1% ofcolorectal cancer, 7% of IHD and 4% of ischemic strokewere attributed to inadequate fruit/vegetableconsumption. Table 13 shows that increasing fruit andvegetable consumption by 1 serving, in Ontario, couldlead to a reduction of approximately 240 incidents ofcancer, 36,200 cases of heart disease, and 3,950 casesof ischemic stroke. These benefits are conservativebecause additional benefits would be realized if allOntarians who do not consume 7.5 servings of fruitand vegetables daily increased their intake to thislevel. In fact, it is estimated that increasing population-wide fruit and vegetable consumption to the‘minimum-risk’ level of 600g per person per day couldreduce the burden of IHD by 31%, stroke by 19%, lungand colorectal cancers by 12% and 2% respectively.49
Physical Inactivity
Approximately half of Ontarians (aged 30+) areinactive. Physical inactivity is an independent riskfactor for colorectal and female breast cancers,diabetes, IHD, stroke and hypertension.50 There isreasonable evidence to suggest that it also contributesto obesity (an outcome considered to be an intermediaterisk factor as opposed to an end point).50 The amountof chronic disease attributable to physical inactivity isconsiderable. Physical inactivity contributed to anestimated 21% of colorectal cancer and 14% of femalebreast cancer cases, as well as 16% of type 2 diabetes,24% of IHD, 17% of ischemic stroke and 17% ofhypertension (see Table 12). Table 13 shows thatphysical inactivity contributes substantially to theburden of chronic disease. Approximately 2,200incident cases of colorectal and female breast cancer
in 2003 were attributed to physical inactivity. Over81,000 cases of diabetes, 116,400 cases of heart disease,16,800 cases of stroke and 268,500 cases of hypertensionin 2005 were attributable to physical inactivity. Thedisease burden attributable to physical inactivity couldbe further reduced if, in addition to those who areinactive, those who were insufficiently active alsobecame sufficiently active (i.e., engaged in 150 minutesof moderate intensity physical activity or 60 minutes ofvigorous intensity physical activity each week).
Smoking
Smoking is a well established health hazard and hasbeen causally linked to many cancers (lung cancerbeing the most prominent but it also leads to stomach,liver, bladder, and pancreatic cancers), IHD, COPD andstroke. Because both current and former smokers areat higher risk of disease compared to those who havenever smoked, the theoretical minimum risk is attainedwhen there is no smoking. Provincially, the eliminationof smoking (i.e., if all current and former smokerswere non-smokers) would result in substantialreductions in lung cancer and COPD, diseases whereover 80% of morbidity and mortality (among thoseaged 30+) were attributable to smoking (Table 12).Additionally, 13% of colorectal cancer cases, 24% ofIHD and 19% of stroke were attributable to smoking.Table 13 shows that 6,000 incident cases of lung cancerand almost 900 cases of colorectal cancer, amongOntarians aged 30+, were attributable to smoking.Over 140,000 cases of heart disease and stroke wereattributable to smoking, as well as 240,000 cases ofCOPD. Note that these estimates do not take intoaccount important factors such as the lag time betweenexposure to smoking and development of disease(which can be 20 years or more for conditions such aslung cancer and COPD), and patterns of smoking (ageat initiation, duration, frequency and intensity ofsmoking) which affect the risk of disease outcome.51
Chronic Conditions in the Central East LHIN Page 31
Misuse of Alcohol
The relationship between alcohol consumption andchronic disease depends on the pattern ofconsumption and volume of alcohol consumed. Highervolumes of consumption increase the risk of stroke,hypertensive disease, depression and female breastcancer.52, 53 Binge drinking (i.e., episodes of heavydrinking where 5 or more drinks are consumed on oneoccasion) increases the risk of IHD, but more so formales than females.54 Among males aged 30-64, anybinge drinking is associated with a greater risk of IHDand 38% of IHD in males (30-64) was attributable tobinge drinking (Table 12). Compared to abstainers,females consuming any amount of alcohol have ahigher risk of breast cancer with increased risk athigher levels of consumption. Approximately 7% offemale post-menopausal breast cancer cases wereattributed to alcohol use (Table 12). For ischemicstroke however, moderate alcohol consumption isprotective for both men and women but higher levelsof consumption (i.e., 40g or more of dailyconsumption, equivalent to approximately 3 drinks)are detrimental. Among those aged 30+, approximately1% of ischemic stroke cases were related to excessconsumption of alcohol. For hemorrhagic stroke aswell, 2-4% of cases were attributed to excess alcoholintake (3 or more drinks per day). Among maleshowever, even low levels of consumption carry anincreased risk of hemorrhagic stroke. The attributablefraction for hemorrhagic stroke among males (aged30+) who consume less than 40g of alcohol daily was18% (data not shown in Table 12). Compared toabstaining, any level of alcohol consumption has anadverse affect on hypertension. The estimatedpercentage of hypertension attributable to alcohol in2005 was 26%. Although depression can contribute toalcohol use or abuse, there is good evidence that useof alcohol precedes depressive episodes and is relatedto increased risk of depression.52 Researchers estimatethat 9% of depression is attributable to alcohol use ordependence.52 The number of chronic disease casesattributable to excess or inappropriate alcohol use(among Ontario adults aged 30+) is summarized inTable 13. Over 1,200 strokes are attributable to
consuming 3 or more drinks per day on average.Almost 400 cases of female breast cancer, 29,300 casesof depression and 412,900 cases of hypertension maybe attributed to alcohol use. Light to moderatedrinking has a protective effect on IHD, but almost50,000 cases of IHD among males (aged 30-64) wereattributed to binge drinking.
Overweight and Obesity
Excess weight (as determined by measures of elevatedBMI) is related to increased risk of type 2 diabetes,IHD, hypertension, osteoarthritis, and several cancersincluding female breast, prostate and colon.55
Ontarians aged 30+ with a BMI of 25.0-29.9 kg/m2 wereconsidered overweight and those with a BMI of 30.0kg/m2 or more were categorized as obese. The PAFsfor overweight and obesity in Table 12 show thepercentage of disease that could be prevented if adults(age 30+) were in the ‘normal’ BMI range (20.0-24.9kg/m2) as opposed to overweight or obese. Thenumber of incident cases of cancers, and prevalentcases of other chronic conditions attributed to excessweight are shown in Table 13. Five percent ofcolorectal cancer, 4% of female post-menopausalbreast cancer, and 2% of prostate cancer areattributable to obesity. An additional 5% of colorectal,5% of female breast and 3% of prostate cancers areattributable to overweight. Over 50% of type 2 diabeteswas attributable to obesity and an additional 27% tooverweight. Excess weight contributes tocardiovascular conditions (such as heart disease andstroke) and has an adverse effect on the intermediaterisk factors (hypertension, high cholesterol) whichlead to cardiovascular conditions. Twenty-eightpercent of hypertension, 7% of IHD and 4% of ischemicstroke cases in 2005 were attributed to obesity.Additionally, 12% of IHD and 4% of ischemic strokecases were attributed to overweight. Excess weightplaces greater load on weight bearing joints (such asthe hip and knee) leading to increased risk of thedevelopment and progression of osteoarthritis.55 Eachunit gain in BMI leads to a 4% increased risk ofdisease. Approximately 12% of osteoarthritis isattributable to obesity and 18% to overweight. Table 13
Page 32 Chronic Conditions in the Central East LHIN
shows that approximately 490 cases of female post-menopausal breast cancer, 490 cases of colon cancer,and 350 cases of prostate cancer in 2003 wereattributed to excess weight. Over 390,000 prevalentcases of type 2 diabetes, almost 61,000 IHD and 8,200stroke cases were attributed to excess weight amongthe population of Ontario (aged 30+). Over 250,000cases of osteoarthritis in 2005 were attributable toexcess weight. Overall the estimated attributablefractions for overweight and obesity are conservativebecause the theoretical minimum risk of disease isestimated to occur at a BMI of 21.0 meaning that evena proportion of those within the ‘normal’ BMI rangeare at increased risk for many chronic conditions.55
Furthermore, the true prevalence of overweight andobesity in Ontario (based on direct measurement) ismuch higher than prevalence rates (based on self-reported height and weight) obtained from the 2005CCHS. Estimates, based on measured height andweight, suggest that 23% of Ontarians (aged 18+) areobese and 36% are overweight.56 The burden of chronicdisease attributable to excess BMI in adults is likely tobe higher than that reported here.
Multiple Risk Factors
Risk factors are not always independent. There isevidence of risk factor clusters and the coexistence ofrisk factors has led to interesting work on the jointcontribution of risk factors on disease. For example,the World Health Organization estimates that in highincome countries such as Canada approximately 80%of IHD deaths and 54% of stroke deaths can beattributed to the joint effects of high blood pressure,high cholesterol, overweight/obesity, low fruit andvegetable intake, physical inactivity, smoking andalcohol use. For diabetes, approximately 74% of deathswere attributed to the joint effects of overweight/obesity, physical inactivity, smoking and alcohol use.The joint PAF for breast cancer mortality attributableto alcohol use, overweight/obesity and physicalinactivity is estimated to be 27%. The quantification ofthe effects of multiple risk factors is an area ofongoing study.57
Chronic Conditions in the Central East LHIN Page 33
This report provides an overview of the burden ofmajor chronic conditions for Central East LHIN andOntario residents. The chronic conditions presented inthis report (cancer, diabetes, depression, heart disease,hypertension, stroke, asthma, COPD and arthritis)accounted for seven out of every ten deaths in Ontario.Among Central East LHIN residents they accounted forone out of four inpatient hospital separations, one inten ED visits, and one in five GP/FP visits. In theCentral East LHIN and Ontario, most chronicconditions increased in prevalence with age. Theexceptions to this were asthma and depression. Co-morbidities were common in most people with achronic condition; 46% of Central East LHIN residentsaged 65 or older had two or more chronic conditions.Central East LHIN residents with chronic conditionsmade extensive use of the health care system. Thepattern of use varied by age and sex, but overallhospital separation and ED visit rates for Central EastLHIN residents were similar to provincial rates foralmost all conditions except cancer, hypertension andarthritis. Hospital separations, ED visits and GP/FPvisits capture only a portion of the health servicesused. Those with chronic conditions will also makeuse of additional health care services such asambulatory care clinics, rehabilitation, specialistphysicians, medications etc. which have beendescribed in other documents.11,12,58,59 Although theinformation presented on use of health care servicesdoes not capture the complete spectrum of servicesaccessed by persons with chronic conditions, it does,along with data on mortality, provide a sense of theburden of disease for each condition.
The calculation of PAFs provides a measure of theamount of disease that can be attributed to modifiablerisk factors, and therefore may be preventable throughchanges in risk behaviours. Our analysis of behaviouralrisk factors examined only some of the risk exposuresthat are known to be harmful but shows that aconsiderable proportion of chronic disease isavoidable. In Ontario, tens of thousands of cases ofdiabetes, heart disease, stroke, COPD, cancer and
osteoarthritis could be prevented through reductionsin smoking and alcohol misuse, increased physicalactivity and consumption of fruits and vegetables andattainment of healthy weights. The prevalence rate foroverweight was significantly lower among Central EastLHIN residents compared to Ontario overall. Socio-economic conditions are also known to be related toboth behavioural risk factor prevalence and manychronic disease outcomes but examining the role ofsocio-economic status was beyond the scope of thisreport.
Chronic disease and risk factor prevalence estimatespresented in this report are based on survey data. Theuse of self-report data from surveys has been criticizedbecause they rely on the ability of respondents toaccurately recall and willingly report on their healthconditions.60,61 Validation studies comparing survey toadministrative data suggest that there is moderateagreement between the two sources for someconditions (such as diabetes and hypertension) butonly fair agreement for others.12, 60, 62 In general,survey data are likely to underestimate the trueprevalence of disease, but the extent of this likelyvaries by condition.60,63-65 Conditions that result incontacts with a health professional are thought to bemore accurately recalled and reported in surveys.62
Self-reports of risk factors are also subject to bias.Although prevalence estimates of smoking based onself-reports have high validity, alcohol use,fruit/vegetable consumption, and physical activityestimates have moderate validity.66,67 A comparison ofprevalence estimates for overweight/obesity fromdirect versus self-reported measures suggests that BMIin Ontario is underreported.56 Because the CCHS is ahousehold survey, residents in institutions such aslong-term care facilities are not included. Thisexcluded population will tend to have healthcharacteristics different than the general population. A national survey of respondents from selected healthinstitutions in Canada reveals that almost all residents(96%) reported having a chronic condition.68
Page 34 Chronic Conditions in the Central East LHIN
Conclusion
The data in this report are presented for the CentralEast LHIN as a whole, with provincial numbers orrates provided as comparators. There are, however,likely to be variations even within the Central EastLHIN area with respect to demographiccharacteristics, health status, and use of or access tohealth care services.69 Therefore the prevalence ofchronic conditions and risk factors may vary withinthe Central East LHIN.
The prevalence of most chronic conditions willcontinue to increase as the population ages. Thisreport serves as a useful starting point tounderstanding the burden of chronic disease forCentral East LHIN residents. As such, this informationcan aid in the development of local chronic diseaseprevention and management strategies and facilitatepriority setting.
Chronic Conditions in the Central East LHIN Page 35
(1) Chronic Disease Prevention Alliance of Canada(CDPAC). Chronic Disease Prevention Alliance ofCanada: A Case for Change. CDPAC2006;Available at: URL:http://www.cdpac.ca/content/case_for_change/case_for_change.asp.
(2) Ontario Ministry of Health and Long-Term Care.Provincial Health Planning Database: Deaths DataTable 2001, 2002, 2003; Ambulatory Visits DataTable 2005/06; Medical Services Data Table2005/06 and Population Estimates Table 2005/06.Ver 16 09 2006;Extracted Nov. 2006.
(3) O'Halloran J, Miller GC, Britt H. Defining chronicconditions for primary care with ICPC-2. FamilyPractice 2004;21(4):381-6.
(4) Choi BCK, Wright E, Auguste U. Situationalanalysis of chronic disease surveillance inCanada: Results of a stakeholder interview.Chronic Diseases in Canada 2005;26(4):127-9.
(5) John Hopkins University. Chronic Conditions:Making the Care for Ongoing Care. Baltimore:Partnership for Solutions; 2002.
(6) Public Health Agency of Canada, Centre forChronic Disease Prevention and Control. ChronicDisease: What are Chronic and Non-Communicable Diseases? CCDPC 2006;Availableat: URL: http://www.phac-aspc.gc.ca/ccdpc-cpcmc/topics/chronic-disease_e.html.
(7) Mills O (M.D). Dictionary of Health ServicesManagement. 2nd ed. National Health Pub.; 1987.
(8) Schultz K. Impact of Chronic Conditions. HealthReports 2003;14(4).
(9) Broemeling AM, Watson D, Black C. Chronicconditions and co-morbidity among residents ofBritish Columbia. Centre for Health Services andPolicy Research; University of British Columbia;2005.
(10) Heart and Stroke Foundation of Canada. TheGrowing Burden of Heart Disease and Stroke inCanada. Ottawa, Canada: Heart and StrokeFoundation of Canada; 2003.
(11) Perruccio AV, Badley EM, Guan J. Burden ofDisease. In: Badley EM, Boyle E, Corrigan L,DeBoer D, Glazier RH, Guan J et al., editors.Arthritis and related conditions in Ontario: ICESResearch Atlas 2nd Edition.Toronto: Institute forClinical and Evaluative Sciences; 2004.
(12) Manuel DG, Schultz SE. Diabetes, Health Statusand Risk Factors. In: Hux JE, Booth GL, SlaughterPM, Laupacis A, editors. Diabetes in Ontario: AnICES Practice Atlas. Toronto: Institute for Clinicaland Evaluative Sciences; 2003.
(13) Jaglal S, Bondy SJ, Slaughter PM. Risk Factors forCardiovascular Disease. In: Naylor CD, SlaughterPM, editors. Cardiovascular Health and Servicesin Ontario: An ICES Atlas. Toronto: Institute forClinical and Evaluative Sciences; 1999. p. 63-82.
(14) Murray CJL, Ezzati M, Lopez AD, Rodgers A,Vander Hoorn S. Conceptual framework andmethodological issues. In: Ezzati M, Lopez AD,Rodgers A, Murray CJL, editors. ComparativeQuantification of Health Risks: Global andRegional Burden of Disease Attributable toSelected Major Risk Factors. Volume 1 ed.Geneva: World Health Organization; 2004. p. 1-38.
(15) Haydon E, Roerecke M, Giesbrecht N, Rehm J,Kobus-Matthews M. Chronic Disease in Ontarioand Canada: Determinants, Risk Factors andPrevention Priorities. Ontario Chronic DiseasePrevention Alliance and the Ontario Public HealthAssociation; 2006.
(16) Australian Institute of Health and Welfare.Chronic diseases and associated risk factors inAustralia (AIHW) 2002. Canberra: AIHW; 2001.
Page 36 Chronic Conditions in the Central East LHIN
References
(17) Jain M. Evidence-Based Planning: The ChronicDisease Priority Setting Decision Toolkit. HealthSystem Strategy Division, Ontario Ministry ofHealth and Long-Term Care; 2006.
(18) Statistics Canada. Canadian Community HealthSurvey (CCHS), Cycle 3.1 - Ontario Share File.2005.
(19) Statistics Canada. Canadian Community HealthSurvey (CCHS), Cycle 1.2 - Ontario Share File.2002.
(20) Anderson G, Horvath J. The Growing Burden ofChronic Disease in America. Public HealthReports 2004;119:263-70.
(21) Klabunde CN, Warren JL, Legler JM. AssessingComorbidity Using Claims Data: An Overview.Medical Care 2002 August;40(8 Suppl):IV-35.
(22) Cancer Care Ontario, SEER*Stat Release 5 -OCRIS (August 2006). Ontario Cancer Incidencewith LHIN, 2001-2003. Population Data Sources:Statistics Canada (1986-2000); Ontario Ministry ofFinance (2001-2003); 2006.
(23) World Health Organization. Cancer Fact Sheet.World Health Organization 2006;Available at: URL:http://www.who.int/mediacentre/factsheets/fs297/en/.
(24) Health System Intelligence Project. Utilization ofHospital-Based Ambulatory Care in OntarioLHINs. Toronto: Health Results Team forInformation Management, Ministry of Health andLong-Term Care; 2007.
(25) Giudice LD, Bondy SJ, Chen Z, Maaten S.Physician Care of Cancer Patients. In:Jaakkimainen L, Upshur R, Klein-Geltink JE,Leong A, Maaten S, Schultz SE, Wang L, editors.Primary Care in Ontario: ICES Atlas. Toronto:Institute for Clinical and Evaluative Sciences;2006. p. 161-174.
(26) Public Health Agency of Canada. What isDiabetes? Public Health Agency of Canada2006;Available at: URL: http://www.phac-aspc.gc.ca/ccdpc-cpcmc/diabetes-diabete/english/whatis/index.html.
(27) Ontario Ministry of Health and Long-Term Care.Diabetes mellitus: An Overview. Healthy Ontario2006;Available at: URL:http://www.healthyontario.com/Conditions/D/Diabetes_mellitus.htm.
(28) Hux JE, Ivis F, Flintoft V, Bica A. Diabetes inOntario: determination of prevalence andincidence using a validated administrative dataalgorithm. Diabetes Care 2002;25(3):512-6.
(29) Lipscombe L, Hux J. Trends in diabetesprevalence, incidence and mortality in Ontario,Canada 1995-2005: a population-based study.Lancet 2007;369(9563):750-6.
(30) Booth GL, Fang J. Acute Complications ofDiabetes. In: Hux JE, Booth GL, Slaughter PM,Laupacis A, editors. Diabetes in Ontario: An ICESPractice Atlas. Toronto: Institute for Clinical andEvaluative Sciences; 2003. p. 2.19-2.50.
(31) National High Blood Pressure Education Program.Prevention, Detection, Evaluation, and Treatmentof High Blood Pressure. U.S. Department ofHealth and Human Services; National Institutes ofHealth; National Heart, Lung and Blood Institute;National High Blood Pressure Education Program;2004.
(32) Ontario Ministry of Health and Long-Term Care.Ontario Health System Scorecard 2006/07(http://hip.moh.gov.on.ca:81/scorecard/general/welcome.htm). Indicator developed and calculated bythe Institute for Clinical and Evaluative Sciences.Toronto: MOHLTC; 2006.
Chronic Conditions in the Central East LHIN Page 37
(33) Booth GL, Rothwell DM, Fung K, Tu JV. Diabetesand Cardiac Disease. In: Hux JE, Booth GL,Slaughter PM, Laupacis A, editors. Diabetes inOntario: An ICES Practice Atlas. Toronto: Institutefor Clinical and Evaluative Sciences; 2003. p. 5.95-5.128.
(34) Oliver MJ, Lok CE, Shi J, Rothwell DM. DialysisTherapy for Persons with Diabetes. In: Hux JE,Booth GL, Slaughter PM, Laupacis A, editors.Diabetes in Ontario: An ICES Practice Atlas.Toronto: Institute for Clinical and EvaluativeSciences; 2003. p. 8.165-8.180.
(35) Public Health Agency of Canada. A Report onMental Illness in Canada. Ottawa, Canada: PublicHealth Agency of Canada; 2006.
(36) Heart and Stroke Foundation of Canada. Ischemicstroke & TIA (mini-stroke). Heart and StrokeFoundation of Canada 2006;Available at: URL:http://ww2.heartandstroke.ca/Page.asp?PageID=1965&ArticleID=5068&Src=stroke&From=SubCategory. Accessed January 11, 2007.
(37) To T, Dell S, Dick P et al. Burden of ChildhoodAsthma. Toronto: Institute for Clinical andEvaluative Sciences; 2004.
(38) Ontario Ministry of Health and Long-Term Care.Taking Action on Asthma: Report of the ChiefMedical Officer of Health. Toronto: OntarioMinistry of Health and Long-Term Care; 2000.
(39) Upshur REG, Wang L, Klein-Geltink JE,Thiruchelvam D, Kopp A. Patterns of Primary andSecondary Prevention. In: Jaakkimainen L,Upshur REG, Klein-Geltink JE, Leong A, MaatenS, Schultz SE et al., editors. Primary Care inOntario: An ICES Atlas. Toronto: Institute forClinical and Evaluative Sciences; 2006. p. 77-90.
(40) McFarlane A, COPD Working Group, Cdn LungAssociation, Goldstein R, Cdn COPD Alliance.COPD. In: Brayanton V, Chen Y, Johansen H, LeebK, McRae L, Michaelson P et al., editors.Respiratory Disease in Canada. Canadian Institutefor Health Information; Canadian LungAssociation; Health Canada; Statistics Canada;2001.
(41) Washington State Department of Health. Arthritis:The Health of Washington State. Washington:Center for Disease Control and Prevention; 2002.
(42) Badley EM. Emerging Issues. In: Badley, GlazierRH, editors. Arthritis and related conditions inOntario: ICES Research Atlas. 2nd ed. Toronto:Institute for Clinical and Evaluative Sciences;2004. p. 1-14.
(43) Paterson JM, DeBoer D, Williams J et al. Total Hipand Knee Replacement. In: Tu JV, Pinfold SP,McColgan P, Laupacis A, editors. Access to HealthServices in Ontario: ICES Atlas. 2nd ed. Toronto:Institute for Clinical and Evaluative Sciences;2006. p. 117-48.
(44) Tyas J, MacKay C, Badley EM. Arthritis andrelated conditions within Ontario EmergencyDepartments. Arthritis and Community Researchand Evaluation Unit (ACREU): University HealthNetwork; 2006.
(45) Canadian Cancer Society, National CancerInstitute of Canada. Canadian Cancer Statistics.Toronto: CCS; 2005.
(46) Spasoff RA. Epidemiologic Methods for HealthPolicy. New York; Oxford: Oxford UniversityPress; 1999.
(47) World Health Organization. The World HealthReport 2002: Reducing Risks, Promoting HealthyLife. Geneva: World Health Organization; 2002.
Page 38 Chronic Conditions in the Central East LHIN
(48) Mathers CD, Solomon JA, Ezzati M, Begg S,Vander Hoorn S, Lopez AD. Sensitivity anduncertainty analyses for burden of disease andrisk factor estimates. In: Lopez AD, Mathers CD,Ezzati M, Jamison DT, Murray CJL, editors. GlobalBurden of Disease and Risk Factors. The WorldBank; Oxford University Press; 2006. p. 399-426.
(49) Lock K, Pomerleau J, Causer L, McKee M. LowFruit and Vegetable Consumption. In: Ezzati M,Lopez AD, Rodgers A, Murray CJL, editors.Comparative Quantification of Health Risks:Global and Regional Burden of DiseaseAttributable to Selected Major Risk Factors.Volume 1 ed. Geneva: World Health Organization;2004. p. 597-728.
(50) Bull FC, Armstrong TP, Dixon T, Ham S, NeimanA, Pratt M. Physical Inactivity. In: Ezzati M, LopezAD, Rodgers A, Murray CJL, editors. ComparativeQuantification of Health Risks: Global andRegional Burden of Disease Attributable toSelected Major Risk Factors. Volume 1 ed.Geneva: World Health Organization; 2004. p. 728-881.
(51) Tanuseputro P, Manuel DG, Schultz SE, JohansenH, Mustard CA. Improving Population AttributableFraction Methods: Examining Smoking-attributable Mortality for 87 Geographic Regionsin Canada. American Journal of Epidemiology2005;161(8):787-99.
(52) Rehm J, Room R, Monteiro M et al. Alcohol Use.In: Ezzati M, Lopez AD, Rodgers A, Murray CJL,editors. Comparative Quantification of HealthRisks: Global and Regional Burden of DiseaseAttributable to Selected Major Risk Factors.Volume 1 ed. Geneva: World Health Organization;2004. p. 595-1108.
(53) Rehm J, Room R, Graham K, Monteiro M, Gmel G,Sempos CT. The relationship of average volume ofalcohol consumption and patterns of drinking toburden of disease: an overview. Addiction2003;98:1209-28.
(54) Murray RP, Connett JE, Tyas SL et al. AlcoholVolume, Drinking Pattern, and CardiovascularDisease Morbidity and Mortality: Is There a U-shaped Function? American Journal ofEpidemiology 2002;155(3):242-8.
(55) James WPT, Jackson-Leach R, Mhurchu CN et al.Overweight and Obesity (High Body Mass Index).In: Ezzati M, Lopez AD, Rodgers A, Murray CJL,editors. Comparative Quantification of HealthRisks: Global and Regional Burden of DiseaseAttributable to Selected Major Risk Factors.Volume 1 ed. Geneva: World Health Organization;2004. p. 497-596.
(56) Tjepkema M. Measured Obesity - Adult obesity inCanada: Measured height and weight. StatisticsCanada; 2006.
(57) Ezzati M, Vander Hoorn S, Lopez AD et al.Comparative quantification of mortality andburden of disease attributable to selected riskfactors. In: Ezzati M, Lopez AD, Rodgers A,Murray CJL, editors. Comparative Quantificationof Health Risks: Global and Regional Burden ofDisease Attributable to Selected Major RiskFactors. Volume 1 ed. Geneva: World HealthOrganization; 2004. p. 241-96.
(58) Health System Intelligence Project. EmergencyDepartment Utilization Report: Central East LHIN.Toronto: Health Results Team for InformationManagement, Ministry of Health and Long-TermCare; 2006.
(59) Health System Intelligence Project. Utilization ofGeneral and Family Physicians: Central EastLHIN. Toronto: Health Results Team forInformation Management, Ministry of Health andLong-Term Care; 2007.
(60) Beckett M, Weinstein M, Goldman N, Yu-Hsuan L.Do Health Interview Surveys Yield Reliable Dataon Chronic Illness among Older Respondents?American Journal of Epidemiology2000;151(3):315-23.
Chronic Conditions in the Central East LHIN Page 39
(61) Martin LM, Leff M, Calonge N, Garrett C, NelsonDE. Validation of self-reported chronic conditionsand health services in a managed care population.Am J Prev Med 2000;18(3):215-8.
(62) Lix L, Yogendran M, Burchill C et al. Defining andValidating Chronic Diseases: An AdministrativeData Approach. Winnipeg: Manitoba Centre forHealth Policy; 2006.
(63) Chow CM, Donovan L, Manuel DG, Johansen H,Tu JV, Canadian Cardiovascular OutcomesResearch Team. Regional variation in self-reported heart disease prevalence in Canada.Canadian Journal of Cardiology 2005;21(14):1265-71.
(64) Rector TS, Wickstrom SL, Shah M et al. Specificityand sensitivity of claims-based algorithms foridentifying members of Medicare & Choice healthplans that have chronic medical conditions.Health Services Research 2004;39(6 Pt.1):1839-57.
(65) Robinson JR, Young TK, Roos LL, Gelskey DE.Estimating the Burden of Disease: ComparingAdministrative Data and Self-Reports. MedicalCare 1997;35(9):932-47.
(66) Nelson DE, Holtzman D, Bolen J, Stanwyck CA,Mack KA. Reliability and validity of measuresfrom the Behavioral Risk Factor SurveillanceSystem (BRFSS). Social and Preventive Medicine2001;46(Suppl.):S3-S42.
(67) Patrick DL, Cheadle A, Thompson DC, Diehr P,Koepsell T, Kinne S. The validity of self-reportedsmoking: a review and meta-analysis. Am J PublicHealth 1994;84(7):1086-93.
(68) Statistics Canada. National Population HealthSurvey: Health Institutions Component,Longitudinal (NPHS) Cycle 5. 2003.
(69) Health System Intelligence Project. Socio-Economic Indicators Atlas: Central East LHIN.Toronto: Health Results Team for InformationManagement, Ministry of Health and Long-TermCare; 2006.
(70) Health System Intelligence Project. MortalityGeographic Data Quality, 2000-2001: HSIPResearch Note. Kingston: Health SystemIntelligence Project; 2005.
(71) Surveillance Research Program. National CancerInstitute SEER*Stat software.(seer.cancer.gov/seerstat) version 6.2.4.; 2003.
(72) Statistics Canada. Canadian Community HealthSurvey Mental Health and Well-being Cycle 1.2Master File Documentation. 2003.
(73) Murray CJL, Ezzati M, Lopez AD, Rodgers A,Vander Hoorn S. Comparative quantification ofhealth risks: Conceptual framework andmethodological issues. Population Health Metrics2003;1(1):1186-206.
(74) World Health Organization. ComparativeQuantification of Health Risks: Global andRegional Burden of Disease Attributable toSelected Major Risk Factors. Geneva: WorldHealth Organization; 2004.
Page 40 Chronic Conditions in the Central East LHIN
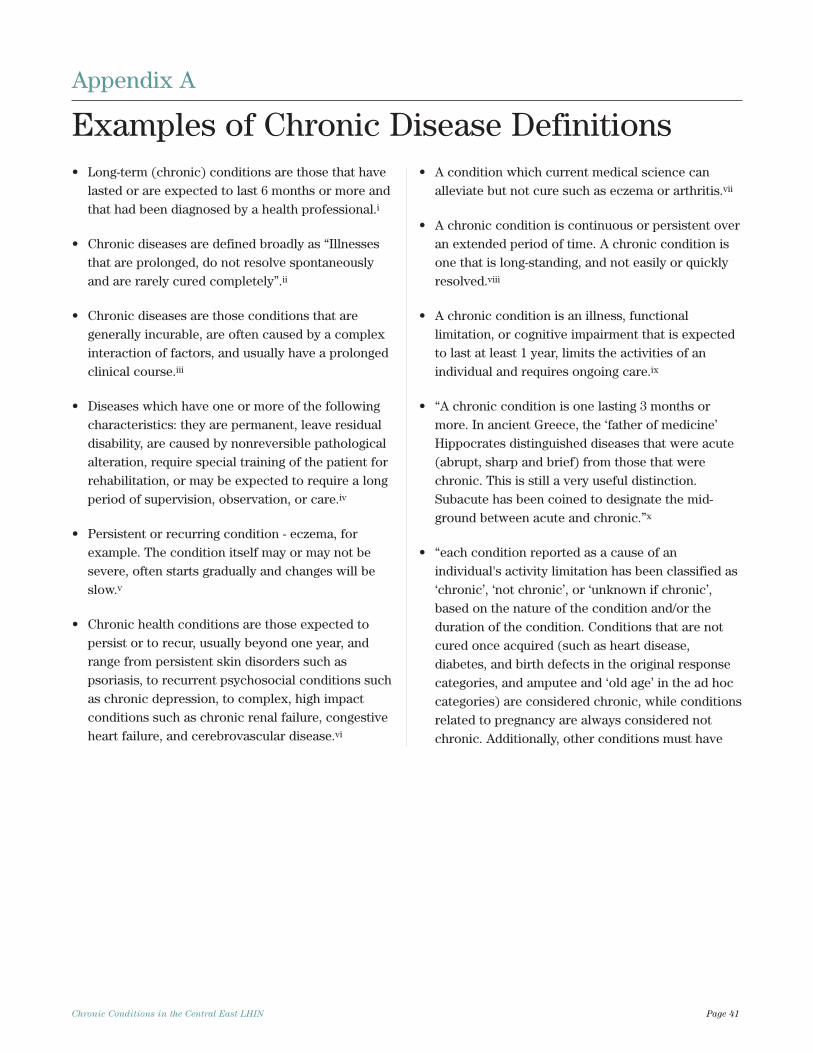
Chronic Conditions in the Central East LHIN Page 41
• Long-term (chronic) conditions are those that havelasted or are expected to last 6 months or more andthat had been diagnosed by a health professional.i
• Chronic diseases are defined broadly as “Illnessesthat are prolonged, do not resolve spontaneouslyand are rarely cured completely”.ii
• Chronic diseases are those conditions that aregenerally incurable, are often caused by a complexinteraction of factors, and usually have a prolongedclinical course.iii
• Diseases which have one or more of the followingcharacteristics: they are permanent, leave residualdisability, are caused by nonreversible pathologicalalteration, require special training of the patient forrehabilitation, or may be expected to require a longperiod of supervision, observation, or care.iv
• Persistent or recurring condition - eczema, forexample. The condition itself may or may not besevere, often starts gradually and changes will beslow.v
• Chronic health conditions are those expected topersist or to recur, usually beyond one year, andrange from persistent skin disorders such aspsoriasis, to recurrent psychosocial conditions suchas chronic depression, to complex, high impactconditions such as chronic renal failure, congestiveheart failure, and cerebrovascular disease.vi
• A condition which current medical science canalleviate but not cure such as eczema or arthritis.vii
• A chronic condition is continuous or persistent overan extended period of time. A chronic condition isone that is long-standing, and not easily or quicklyresolved.viii
• A chronic condition is an illness, functionallimitation, or cognitive impairment that is expectedto last at least 1 year, limits the activities of anindividual and requires ongoing care.ix
• “A chronic condition is one lasting 3 months ormore. In ancient Greece, the ‘father of medicine’Hippocrates distinguished diseases that were acute(abrupt, sharp and brief) from those that werechronic. This is still a very useful distinction.Subacute has been coined to designate the mid-ground between acute and chronic.”x
• “each condition reported as a cause of anindividual's activity limitation has been classified as‘chronic’, ‘not chronic’, or ‘unknown if chronic’,based on the nature of the condition and/or theduration of the condition. Conditions that are notcured once acquired (such as heart disease,diabetes, and birth defects in the original responsecategories, and amputee and ‘old age’ in the ad hoccategories) are considered chronic, while conditionsrelated to pregnancy are always considered notchronic. Additionally, other conditions must have
Appendix A
Examples of Chronic Disease Definitions
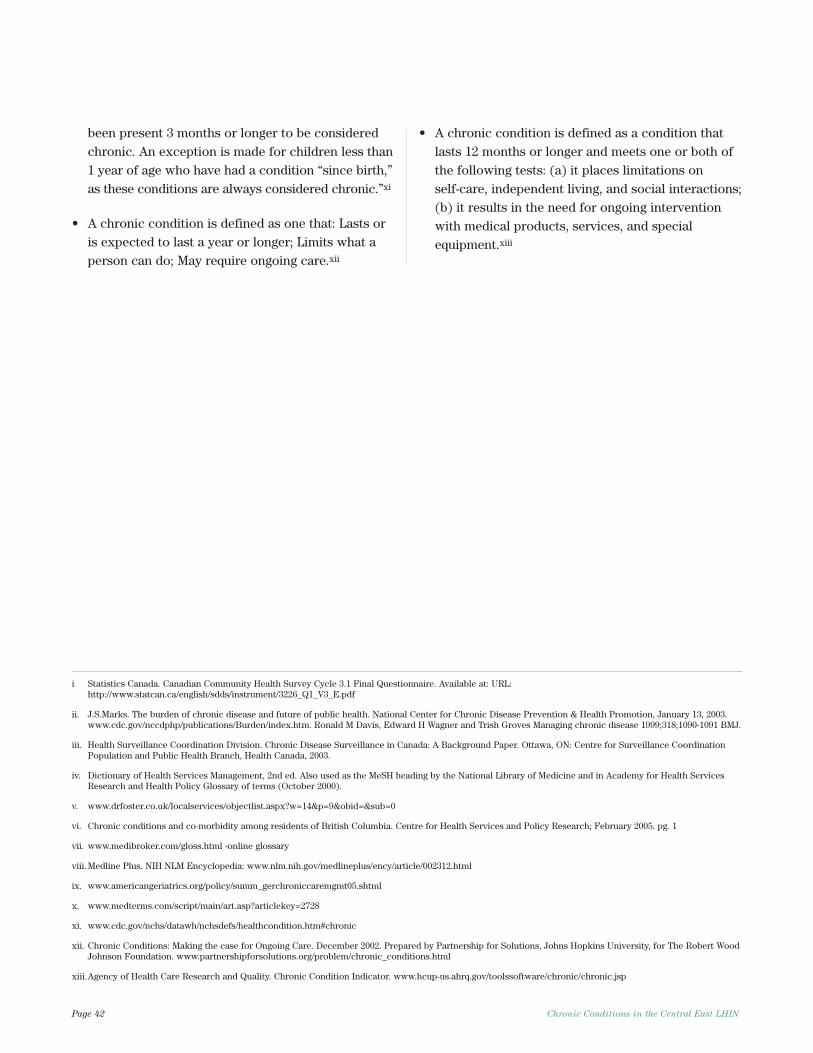
Page 42 Chronic Conditions in the Central East LHIN
been present 3 months or longer to be consideredchronic. An exception is made for children less than1 year of age who have had a condition “since birth,”as these conditions are always considered chronic.”xi
• A chronic condition is defined as one that: Lasts oris expected to last a year or longer; Limits what aperson can do; May require ongoing care.xii
• A chronic condition is defined as a condition thatlasts 12 months or longer and meets one or both ofthe following tests: (a) it places limitations on self-care, independent living, and social interactions;(b) it results in the need for ongoing interventionwith medical products, services, and specialequipment.xiii
i Statistics Canada. Canadian Community Health Survey Cycle 3.1 Final Questionnaire. Available at: URL:http://www.statcan.ca/english/sdds/instrument/3226_Q1_V3_E.pdf
ii. J.S.Marks. The burden of chronic disease and future of public health. National Center for Chronic Disease Prevention & Health Promotion, January 13, 2003.www.cdc.gov/nccdphp/publications/Burden/index.htm. Ronald M Davis, Edward H Wagner and Trish Groves Managing chronic disease 1999;318;1090-1091 BMJ.
iii. Health Surveillance Coordination Division. Chronic Disease Surveillance in Canada: A Background Paper. Ottawa, ON: Centre for Surveillance CoordinationPopulation and Public Health Branch, Health Canada, 2003.
iv. Dictionary of Health Services Management, 2nd ed. Also used as the MeSH heading by the National Library of Medicine and in Academy for Health ServicesResearch and Health Policy Glossary of terms (October 2000).
v. www.drfoster.co.uk/localservices/objectlist.aspx?w=14&p=9&obid=&sub=0
vi. Chronic conditions and co-morbidity among residents of British Columbia. Centre for Health Services and Policy Research; February 2005. pg. 1
vii. www.medibroker.com/gloss.html -online glossary
viii. Medline Plus. NIH NLM Encyclopedia: www.nlm.nih.gov/medlineplus/ency/article/002312.html
ix. www.americangeriatrics.org/policy/summ_gerchroniccaremgmt05.shtml
x. www.medterms.com/script/main/art.asp?articlekey=2728
xi. www.cdc.gov/nchs/datawh/nchsdefs/healthcondition.htm#chronic
xii. Chronic Conditions: Making the case for Ongoing Care. December 2002. Prepared by Partnership for Solutions, Johns Hopkins University, for The Robert WoodJohnson Foundation. www.partnershipforsolutions.org/problem/chronic_conditions.html
xiii.Agency of Health Care Research and Quality. Chronic Condition Indicator. www.hcup-us.ahrq.gov/toolssoftware/chronic/chronic.jsp
Chronic Conditions in the Central East LHIN Page 43
Mortality, acute inpatient hospital separations, EDvisits, and GP/FP visits data, and population estimateswere obtained from the Ontario Ministry of Health andLong-Term Care PHPDB.2
Mortality rates were calculated as a three-year averageusing data, analysed by LHIN residence of thedeceased, from 2001 through 2003. These data appearin the Death table of the PHPDB. Population estimatesfor 2002 were used as the denominator to calculaterates. Analyses of specific chronic conditions werebased on the underlying cause of death which is codedusing the International Statistical Classification ofDiseases and Related Health Problems, 10th revision(ICD-10). Mortality rates for the Central East LHINarea could not be calculated because the data areincomplete (i.e., a high proportion of deaths from theCity of Toronto cannot be assigned to a LHIN areaaffecting the completeness of data for the CentralWest, Mississauga Halton, Toronto Central, Central andCentral East LHINs).70
Acute inpatient hospital separations, ED visits andGP/FP visits were analyzed for the 2005/06 fiscal yearwith 2005 population estimates as the denominator forcalculating rates. LHIN assignment was based onresidence of patient regardless of where they receivedcare. Analysis of acute inpatient separations wasrestricted to separations from institution types AP andAT (acute care treatment hospital with or withoutpsychiatric unit) for all conditions except depressionwhich also included hospital separations fromspecialty mental health sites (institution type MP). TheMost Responsible Diagnosis (ICD-10-CA code) wasused to identify the main reason for the separation.Hospital separations data were obtained from theInpatient Discharges table of the PHPDB. Data on EDvisits were obtained from the Ambulatory Visits tablein the PHPDB. We examined all unscheduled visits toEDs including visits to urgent care centres in 2005/06.The Main Problem diagnosis code (ICD-10-CA) wasused to identify the most clinically significant problemresponsible for the patient’s visit. Visits to GP/FPs
were obtained via the Medical Services data table inthe PHPDB. These data are derived from the OntarioHealth Insurance Plan (OHIP) Profiles SystemsDetailed Claims files which contain information onvisits to Ontario physicians where the physiciansubmitted a fee-for-service or shadow billing. Analysiswas restricted to a sub-set of fee service codes thatcapture office or clinic visits to a GP/FP.59
Incidence refers to new cases of a disease during agiven time interval (i.e., one year). Cancer incidencerates were extracted from 2003 Ontario CancerRegistry data, from the Surveillance, Epidemiology andEnd Results database (i.e., the SEER*Stat CD),provided by Cancer Care Ontario.22, 71 The rates areage-standardized to the 1991 population of Canadausing the direct method. Age-standardization adjustsfor variations in population age distributions over timeand place.
Prevalence rates describe the total number ofindividuals who have a disease or risk factor attributeat a particular point in time, divided by the totalpopulation at risk of having the disease or attribute.Chronic disease and risk factor prevalence rates werederived from the Canadian Community Health Survey(CCHS). The CCHS is a cross-sectional survey ofhousehold residents aged 12 or older, excludingpopulations on Indian Reserves, Canadian ForcesBases, residents of institutions and remote locations.Cycle 2.1 of the survey was conducted in 2003 and datafor cycle 3.1 were collected in 2005. The CCHS asksrespondents to report on the presence or absence ofapproximately 30 specific chronic conditions includingcancer, diabetes, heart disease, hypertension, stroke,asthma, COPD and asthma. Specifically, theinterviewer asks: “I’d like to ask you about certain
chronic health conditions which you may have. We
are interested in “long-term conditions” which are
expected to last or have already lasted 6 months or
more and that have been diagnosed by a health
professional.”
Appendix B
Technical Notes
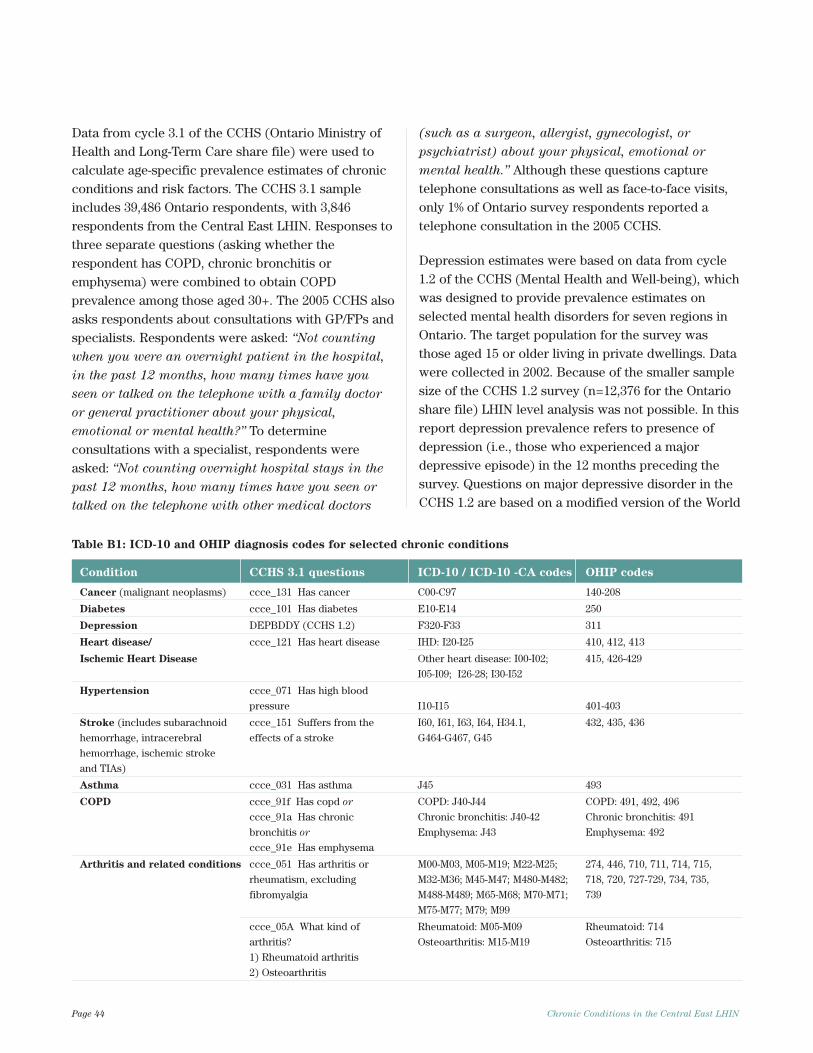
Page 44 Chronic Conditions in the Central East LHIN
Data from cycle 3.1 of the CCHS (Ontario Ministry ofHealth and Long-Term Care share file) were used tocalculate age-specific prevalence estimates of chronicconditions and risk factors. The CCHS 3.1 sampleincludes 39,486 Ontario respondents, with 3,846respondents from the Central East LHIN. Responses tothree separate questions (asking whether therespondent has COPD, chronic bronchitis oremphysema) were combined to obtain COPDprevalence among those aged 30+. The 2005 CCHS alsoasks respondents about consultations with GP/FPs andspecialists. Respondents were asked: “Not counting
when you were an overnight patient in the hospital,
in the past 12 months, how many times have you
seen or talked on the telephone with a family doctor
or general practitioner about your physical,
emotional or mental health?” To determineconsultations with a specialist, respondents wereasked: “Not counting overnight hospital stays in the
past 12 months, how many times have you seen or
talked on the telephone with other medical doctors
(such as a surgeon, allergist, gynecologist, or
psychiatrist) about your physical, emotional or
mental health.” Although these questions capturetelephone consultations as well as face-to-face visits,only 1% of Ontario survey respondents reported atelephone consultation in the 2005 CCHS.
Depression estimates were based on data from cycle1.2 of the CCHS (Mental Health and Well-being), whichwas designed to provide prevalence estimates onselected mental health disorders for seven regions inOntario. The target population for the survey wasthose aged 15 or older living in private dwellings. Datawere collected in 2002. Because of the smaller samplesize of the CCHS 1.2 survey (n=12,376 for the Ontarioshare file) LHIN level analysis was not possible. In thisreport depression prevalence refers to presence ofdepression (i.e., those who experienced a majordepressive episode) in the 12 months preceding thesurvey. Questions on major depressive disorder in theCCHS 1.2 are based on a modified version of the World
Table B1: ICD-10 and OHIP diagnosis codes for selected chronic conditions
Condition CCHS 3.1 questions ICD-10 / ICD-10 -CA codes OHIP codes
Cancer (malignant neoplasms) ccce_131 Has cancer C00-C97 140-208
Diabetes ccce_101 Has diabetes E10-E14 250
Depression DEPBDDY (CCHS 1.2) F320-F33 311
Heart disease/ ccce_121 Has heart disease IHD: I20-I25 410, 412, 413
Ischemic Heart Disease Other heart disease: I00-I02; 415, 426-429
I05-I09; I26-28; I30-I52
Hypertension ccce_071 Has high blood
pressure I10-I15 401-403
Stroke (includes subarachnoid ccce_151 Suffers from the I60, I61, I63, I64, H34.1, 432, 435, 436
hemorrhage, intracerebral effects of a stroke G464-G467, G45
hemorrhage, ischemic stroke
and TIAs)
Asthma ccce_031 Has asthma J45 493
COPD ccce_91f Has copd or COPD: J40-J44 COPD: 491, 492, 496
ccce_91a Has chronic Chronic bronchitis: J40-42 Chronic bronchitis: 491
bronchitis or Emphysema: J43 Emphysema: 492
ccce_91e Has emphysema
Arthritis and related conditions ccce_051 Has arthritis or M00-M03, M05-M19; M22-M25; 274, 446, 710, 711, 714, 715,
rheumatism, excluding M32-M36; M45-M47; M480-M482; 718, 720, 727-729, 734, 735,
fibromyalgia M488-M489; M65-M68; M70-M71; 739
M75-M77; M79; M99
ccce_05A What kind of Rheumatoid: M05-M09 Rheumatoid: 714
arthritis? Osteoarthritis: M15-M19 Osteoarthritis: 715
1) Rheumatoid arthritis
2) Osteoarthritis
Chronic Conditions in the Central East LHIN Page 45
Mental Health version of the Composite InternationalDiagnostic Interview.72
Disease and risk factor prevalence estimates derivedfrom CCHS 3.1 and CCHS 1.2 were based on weighteddata using the population weights supplied byStatistics Canada. Confidence intervals (95%) werecalculated using the Bootvar program which usesweights and the bootstrap method to calculate exactconfidence intervals. The Bootvar program andweights were provided by Statistics Canada.Confidence intervals indicate the degree of variabilityassociated with an estimate. A 95% confidence intervalindicates that a true estimate lies within the upper andlower bounds of the interval 19 times out of 20.Additionally, the coefficient of variation (whichmeasures the degree of sampling variability) wasexamined for all estimates derived from survey data.Data with a coefficient of variation (CV) from 16.6% to33.3% are to be used with caution and data with a CVgreater than 33.3% are too unreliable to be publishedand were suppressed due to extreme samplingvariability.
The ICD-10 and ICD-10-CA codes, OHIP codes andCCHS questions used to examine the selected chronicconditions presented in this report are given in TableB1. In some cases, the prevalence data (based onCCHS questions) may not correspond exactly to thediagnosis codes available in administrative data. Forexample, the CCHS asks respondents whether theyhave “arthritis or rheumatism excluding fibromyalgia”but the mortality, hospital separation, and ED visitrates are presented for a group of diagnoses for“arthritis and related conditions”.
Population attributable fraction (PAF) is a statistic thatprovides an estimate of the proportion of disease casesassociated with an exposure. The formula for PAFtakes into account the prevalence of exposure to therisk factor, and the strength of the association betweenthe exposure and disease as described by the relativerisk of disease (i.e., the ratio of probability of diseasein the population exposed versus unexposed to therisk factor). The following formula was used tocalculate PAFs:
A variation of the PAF formula was used when relativerisk estimates were available by age and/or sexstratification or when multiple exposure categorieswere taken into consideration.51, 73
Estimates of relative risk for each risk factor/chronicdisease pairing were obtained from published studieswith preference given to recent studies that providedpooled adjusted estimates of relative risk. For the mostpart, relative risks were obtained from theComparative Risk Assessment project undertaken bythe World Health Organization.74 Additionalinformation on the relative risk estimates used in ourcalculations is available upon request.
Where Pexp is the prevalence of exposure to a risk factor in the population of interest
And RR is Relative Risk= Probability (disease in population exposed to risk factor)
Probability (disease in population unexposed to risk factor)
PAF = Pexp (RR – 1) x 100
Pexp (RR – 1) + 1
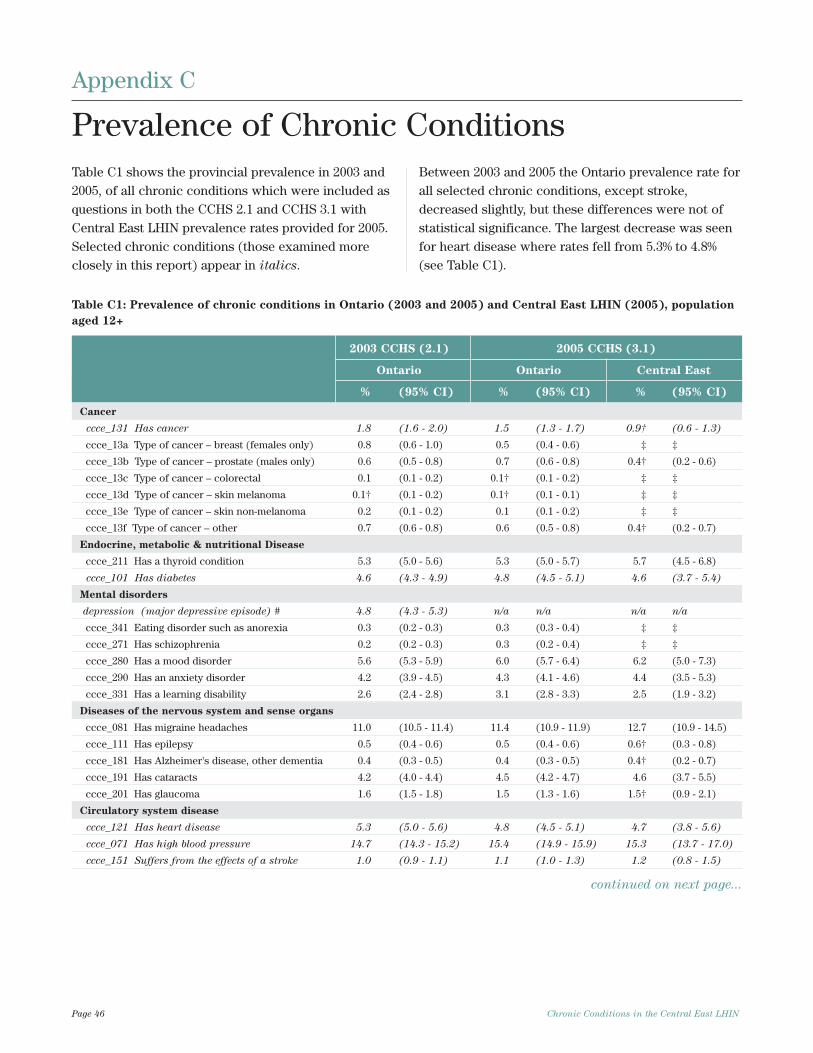
Page 46 Chronic Conditions in the Central East LHIN
Table C1 shows the provincial prevalence in 2003 and2005, of all chronic conditions which were included asquestions in both the CCHS 2.1 and CCHS 3.1 withCentral East LHIN prevalence rates provided for 2005.Selected chronic conditions (those examined moreclosely in this report) appear in italics.
Between 2003 and 2005 the Ontario prevalence rate forall selected chronic conditions, except stroke,decreased slightly, but these differences were not ofstatistical significance. The largest decrease was seenfor heart disease where rates fell from 5.3% to 4.8%(see Table C1).
Table C1: Prevalence of chronic conditions in Ontario (2003 and 2005) and Central East LHIN (2005), population
aged 12+
2003 CCHS (2.1) 2005 CCHS (3.1)
Ontario Ontario Central East
% (95% CI) % (95% CI) % (95% CI)
Cancer
ccce_131 Has cancer 1.8 (1.6 - 2.0) 1.5 (1.3 - 1.7) 0.9† (0.6 - 1.3)
ccce_13a Type of cancer – breast (females only) 0.8 (0.6 - 1.0) 0.5 (0.4 - 0.6) ‡ ‡
ccce_13b Type of cancer – prostate (males only) 0.6 (0.5 - 0.8) 0.7 (0.6 - 0.8) 0.4† (0.2 - 0.6)
ccce_13c Type of cancer – colorectal 0.1 (0.1 - 0.2) 0.1† (0.1 - 0.2) ‡ ‡
ccce_13d Type of cancer – skin melanoma 0.1† (0.1 - 0.2) 0.1† (0.1 - 0.1) ‡ ‡
ccce_13e Type of cancer – skin non-melanoma 0.2 (0.1 - 0.2) 0.1 (0.1 - 0.2) ‡ ‡
ccce_13f Type of cancer – other 0.7 (0.6 - 0.8) 0.6 (0.5 - 0.8) 0.4† (0.2 - 0.7)
Endocrine, metabolic & nutritional Disease
ccce_211 Has a thyroid condition 5.3 (5.0 - 5.6) 5.3 (5.0 - 5.7) 5.7 (4.5 - 6.8)
ccce_101 Has diabetes 4.6 (4.3 - 4.9) 4.8 (4.5 - 5.1) 4.6 (3.7 - 5.4)
Mental disorders
depression (major depressive episode) # 4.8 (4.3 - 5.3) n/a n/a n/a n/a
ccce_341 Eating disorder such as anorexia 0.3 (0.2 - 0.3) 0.3 (0.3 - 0.4) ‡ ‡
ccce_271 Has schizophrenia 0.2 (0.2 - 0.3) 0.3 (0.2 - 0.4) ‡ ‡
ccce_280 Has a mood disorder 5.6 (5.3 - 5.9) 6.0 (5.7 - 6.4) 6.2 (5.0 - 7.3)
ccce_290 Has an anxiety disorder 4.2 (3.9 - 4.5) 4.3 (4.1 - 4.6) 4.4 (3.5 - 5.3)
ccce_331 Has a learning disability 2.6 (2.4 - 2.8) 3.1 (2.8 - 3.3) 2.5 (1.9 - 3.2)
Diseases of the nervous system and sense organs
ccce_081 Has migraine headaches 11.0 (10.5 - 11.4) 11.4 (10.9 - 11.9) 12.7 (10.9 - 14.5)
ccce_111 Has epilepsy 0.5 (0.4 - 0.6) 0.5 (0.4 - 0.6) 0.6† (0.3 - 0.8)
ccce_181 Has Alzheimer's disease, other dementia 0.4 (0.3 - 0.5) 0.4 (0.3 - 0.5) 0.4† (0.2 - 0.7)
ccce_191 Has cataracts 4.2 (4.0 - 4.4) 4.5 (4.2 - 4.7) 4.6 (3.7 - 5.5)
ccce_201 Has glaucoma 1.6 (1.5 - 1.8) 1.5 (1.3 - 1.6) 1.5† (0.9 - 2.1)
Circulatory system disease
ccce_121 Has heart disease 5.3 (5.0 - 5.6) 4.8 (4.5 - 5.1) 4.7 (3.8 - 5.6)
ccce_071 Has high blood pressure 14.7 (14.3 - 15.2) 15.4 (14.9 - 15.9) 15.3 (13.7 - 17.0)
ccce_151 Suffers from the effects of a stroke 1.0 (0.9 - 1.1) 1.1 (1.0 - 1.3) 1.2 (0.8 - 1.5)
continued on next page...
Appendix C
Prevalence of Chronic Conditions
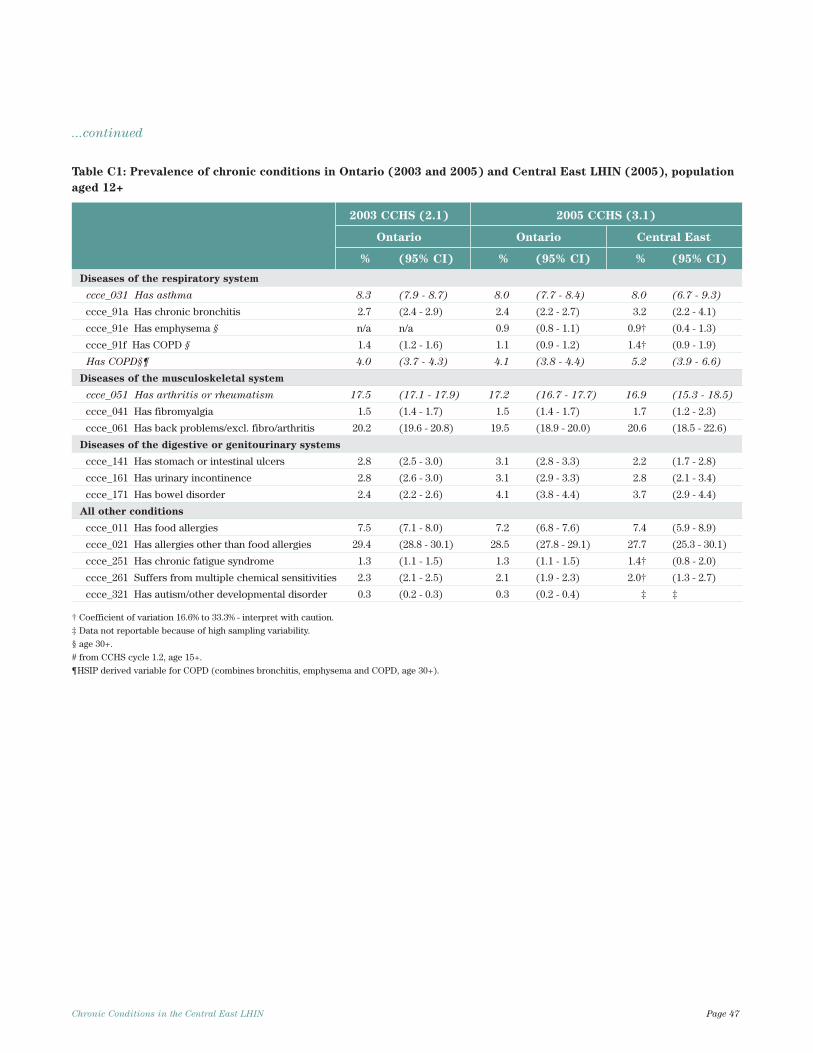
Chronic Conditions in the Central East LHIN Page 47
...continued
Table C1: Prevalence of chronic conditions in Ontario (2003 and 2005) and Central East LHIN (2005), population
aged 12+
2003 CCHS (2.1) 2005 CCHS (3.1)
Ontario Ontario Central East
% (95% CI) % (95% CI) % (95% CI)
Diseases of the respiratory system
ccce_031 Has asthma 8.3 (7.9 - 8.7) 8.0 (7.7 - 8.4) 8.0 (6.7 - 9.3)
ccce_91a Has chronic bronchitis 2.7 (2.4 - 2.9) 2.4 (2.2 - 2.7) 3.2 (2.2 - 4.1)
ccce_91e Has emphysema § n/a n/a 0.9 (0.8 - 1.1) 0.9† (0.4 - 1.3)
ccce_91f Has COPD § 1.4 (1.2 - 1.6) 1.1 (0.9 - 1.2) 1.4† (0.9 - 1.9)
Has COPD§¶ 4.0 (3.7 - 4.3) 4.1 (3.8 - 4.4) 5.2 (3.9 - 6.6)
Diseases of the musculoskeletal system
ccce_051 Has arthritis or rheumatism 17.5 (17.1 - 17.9) 17.2 (16.7 - 17.7) 16.9 (15.3 - 18.5)
ccce_041 Has fibromyalgia 1.5 (1.4 - 1.7) 1.5 (1.4 - 1.7) 1.7 (1.2 - 2.3)
ccce_061 Has back problems/excl. fibro/arthritis 20.2 (19.6 - 20.8) 19.5 (18.9 - 20.0) 20.6 (18.5 - 22.6)
Diseases of the digestive or genitourinary systems
ccce_141 Has stomach or intestinal ulcers 2.8 (2.5 - 3.0) 3.1 (2.8 - 3.3) 2.2 (1.7 - 2.8)
ccce_161 Has urinary incontinence 2.8 (2.6 - 3.0) 3.1 (2.9 - 3.3) 2.8 (2.1 - 3.4)
ccce_171 Has bowel disorder 2.4 (2.2 - 2.6) 4.1 (3.8 - 4.4) 3.7 (2.9 - 4.4)
All other conditions
ccce_011 Has food allergies 7.5 (7.1 - 8.0) 7.2 (6.8 - 7.6) 7.4 (5.9 - 8.9)
ccce_021 Has allergies other than food allergies 29.4 (28.8 - 30.1) 28.5 (27.8 - 29.1) 27.7 (25.3 - 30.1)
ccce_251 Has chronic fatigue syndrome 1.3 (1.1 - 1.5) 1.3 (1.1 - 1.5) 1.4† (0.8 - 2.0)
ccce_261 Suffers from multiple chemical sensitivities 2.3 (2.1 - 2.5) 2.1 (1.9 - 2.3) 2.0† (1.3 - 2.7)
ccce_321 Has autism/other developmental disorder 0.3 (0.2 - 0.3) 0.3 (0.2 - 0.4) ‡ ‡
† Coefficient of variation 16.6% to 33.3% - interpret with caution.
‡ Data not reportable because of high sampling variability.
§ age 30+.
# from CCHS cycle 1.2, age 15+.
¶HSIP derived variable for COPD (combines bronchitis, emphysema and COPD, age 30+).
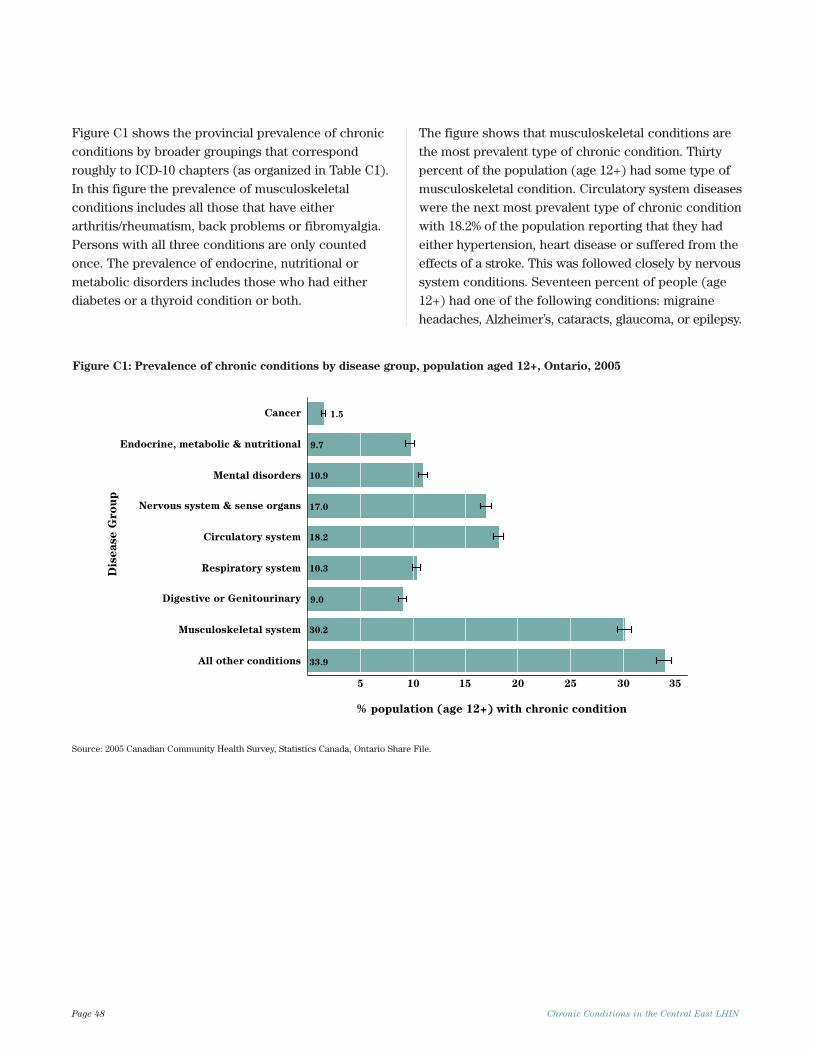
Page 48 Chronic Conditions in the Central East LHIN
Figure C1 shows the provincial prevalence of chronicconditions by broader groupings that correspondroughly to ICD-10 chapters (as organized in Table C1).In this figure the prevalence of musculoskeletalconditions includes all those that have eitherarthritis/rheumatism, back problems or fibromyalgia.Persons with all three conditions are only countedonce. The prevalence of endocrine, nutritional ormetabolic disorders includes those who had eitherdiabetes or a thyroid condition or both.
The figure shows that musculoskeletal conditions arethe most prevalent type of chronic condition. Thirtypercent of the population (age 12+) had some type ofmusculoskeletal condition. Circulatory system diseaseswere the next most prevalent type of chronic conditionwith 18.2% of the population reporting that they hadeither hypertension, heart disease or suffered from theeffects of a stroke. This was followed closely by nervoussystem conditions. Seventeen percent of people (age12+) had one of the following conditions: migraineheadaches, Alzheimer’s, cataracts, glaucoma, or epilepsy.
pu
or
G e
sa
esi
D
1.5
10.9
17.0
18.2
33.9
30.2
9.0
10.3
9.7
5 10 15 20 25 30 35
All other conditions
Musculoskeletal system
Digestive or Genitourinary
Respiratory system
Circulatory system
Nervous system & sense organs
Mental disorders
Endocrine, metabolic & nutritional
Cancer
% population (age 12+) with chronic condition
Figure C1: Prevalence of chronic conditions by disease group, population aged 12+, Ontario, 2005
Source: 2005 Canadian Community Health Survey, Statistics Canada, Ontario Share File.

Notes


© 2
007,
Que
en’s
Pri
nter
for
Ont
ario